


Abstract
Psychosocial stress has been shown to affect EMG activity in the upper body; however, no known studies have attempted similar research on the lower body. Accordingly, this study aimed to analyze the effects of psychosocial stress on surface EMG amplitude and frequency in the lower leg. The tibialis anterior (TA) and gastrocnemius medialis (GM) were tested on 13 healthy subjects. Two sets of isometric fatigue trials were performed by each muscle, separated by the Trier Social Stress Test. Wilcoxon signed-rank tests were performed (confidence interval (CI) of 95%), and no significant difference was found in mean amplitude (p ≈ 0.30), mean frequency (p ≈ 0.20), or rate of change before and after psychosocial stress. All pre- to post-stress comparisons were determined to be statistically equivalent using the two one-sided t-tests method at 5% significance using a 90% CI. The results imply that the effects of psychosocial stress observed in upper-body muscles may not generalize directly to the lower leg for the conditions of this study and should be evaluated in a muscle-specific and task-specific manner. While limited by a small cohort, these exploratory findings challenge the generalizability of upper-body stress models and establish critical baseline parameters for larger, muscle-specific lower-limb neuromusculoskeletal investigations.
1. Introduction
Ergonomics and many other fields commonly utilize muscle activity provided by surface electromyography (sEMG) sensors for research, diagnosis, and treatment of muscle-related issues. It is used for prevention, detection, diagnosis, and tracking of musculoskeletal disorders (MSDs); evaluation of the effectiveness of treatments for neuromuscular disorders; identification of muscular imbalances in athletes; and human–machine interfacing and improvement of performance and control of wearables and assistive robotic devices (WARDs) [1,2]. A review on wearable mechatronic devices for the upper limbs by Desplenter et al. stated that sEMG is the most used physiological sensor for assistive wearable devices, with around one-third of devices utilizing the signal [3]. Because of the multitude and range of use cases for sEMG, it is important for researchers, engineers, and clinical movement specialists to understand all factors affecting muscle function and sEMG signals.
Psychosocial stress is a pervasive workplace issue that has been shown to affect muscle activation by increasing muscle tension [4], posture [5], and motor unit recruitment [6], and studies have suggested it may play a role in the development of work-related MSDs [4,7]. Healthcare professions, especially nursing, have high rates of psychosocial stress [8,9] and MSD development [8,9,10,11]. A study on public hospital nurses in Malaysia found that all psychosocial risk factors evaluated were significantly associated with work-related MSDs [9]. A systematic review and meta-analysis of Nigerian healthcare workers found that about 62% experienced psychosocial stress, and about 73% reported headaches accompanied by neck and back pain [8]. Additionally, psychosocial risk factors have been connected to overuse injuries in athletes [12] and correlated with the occurrence of MSDs in military personnel [13]. If not understood and accounted for, variability in sEMG signals caused by psychosocial stress could meaningfully affect interpretation and downstream applications, such as misdiagnosis of musculoskeletal disorders, degrading WARD performance, misleading results during ergonomic testing, and continuation of insufficient therapy or rehabilitative activities.
Past research analyzing the effects of psychosocial stress on muscle activity has largely focused on the upper body and sEMG amplitude. This focus is likely due to higher reported rates of MSDs in the upper body [11] and the prevalence of sEMG amplitude usage for ergonomic analysis relative to sEMG frequency. These studies have shown increased sEMG activity in the trapezius and increased differential muscle activity in several back muscles under a stressed condition [4,14]. Despite these findings, there are no known studies that have tested the effects of psychosocial stress on sEMG signals of the lower body. Three studies were found that evaluated how psychosocial stress affects muscle spindle activity in the lower body [15,16,17]. Two of the three found a significant difference in muscle spindle activity during a psychosocial stressor [15,16]. Although changes in sEMG may not necessarily reflect changes seen in muscle spindle activity, these findings in combination with the upper-body findings provided preliminary physiological motivation to investigate whether psychosocial stress may result in detectable changes in lower-limb sEMG. Due to the lack of an established lower-limb stress response mechanism, the present hypothesis was considered exploratory.
The Trier Social Stress Test (TSST) is commonly used in laboratory settings to induce psychosocial stress. Typically, it requires participants to make an interview-style presentation followed by mental arithmetic in front of a panel of observers who provide no verbal or visual feedback [18]. Studies using the procedure in the past have found changes in heart rate, systolic and diastolic blood pressure, salivary cortisol levels, and self-reported stress levels [4,19,20,21], confirming the induction of stress. Changes in heart rate due to the TSST were found to have a large effect size in children (0.89) and adults (0.85) [22,23]. Moreover, a review by Engert et al. found the TSST to be so effective at inducing stress that it caused similar physiological reactions in the observers as well as the participants [24]. Although the test is an acute laboratory stressor and cannot replicate long-term stress exposure and job strain, this test may be useful in analyzing the effect of psychosocial stress on sEMG signal parameters.
Thus, the purpose of this study was to preliminarily investigate how psychosocial stress affects muscle signals in the lower body by utilizing the TSST to induce stress in participants and observing changes in sEMG signals during isometric fatiguing contractions before and after stress induction. It was hypothesized that psychosocial stress would have a measurable effect on the sEMG signal amplitude, frequency, and change over time of each signal characteristic for the tibialis anterior (TA) and gastrocnemius medialis (GM) during fatigue testing.
2. Materials and Methods
2.1. Ethical Approval
Prior to recruitment, the study protocol followed the ethical guidelines set forth in the Declaration of Helsinki and was approved by the Auburn University Institutional Review Board (23-619 MR 2312). Participants provided written informed consent for all portions of the study.
2.2. Participants
Thirteen healthy participants consisting of 3 men and 10 women who had not experienced a lower limb injury in the past 6 months were recruited (age: 22.4 ± 2.9 y; weight: 65.2 ± 14.2 kg; height: 164.8 ± 9.5 cm). Due to the unavailability of relevant pilot data for a power analysis to be performed, the number of participants recruited for this study was determined by an analysis of similar studies in the literature. For example, studies looking at the effect of psychosocial stress on lower leg muscle spindles recruited 9–10 participants [15,16,17]. Studies analyzing sEMG amplitude and frequency in the lower leg recruited 10–15 participants [25,26,27]. A study analyzing sympathetic nerve outflow during mental stress recruited 13 participants [28].
2.3. Preparation and Equipment
The participant’s dominant leg was determined by requesting that they step from the floor onto a 17.8 cm tall box. The leg used to lead the motion was established as the dominant leg [29]. The TA and GM of the participant’s dominant leg were prepared by shaving and abrading the area of skin over the muscle belly as defined by the SENIAM guidelines [30]. The guidelines specify that the sensor should be placed “at 1/3 on the line between the tip of the fibula and the tip of the medial malleolus” for the TA and “on the most prominent bulge of the muscle” for the GM. The TA and GM were chosen because of their role in activities of daily living and their relative isolation from other muscles to minimize crosstalk. Delsys Trigno Avanti EMG sensors (Delsys Inc., Natick, MA, USA) were oriented longitudinally along each muscle and attached using double-sided adhesive. An additional EMG sensor was placed over the lower left abdomen. Delsys EMG sensors have a fixed interelectrode distance of 10 mm and built-in reference electrodes. The data were sampled at 1260 Hz and band-pass-filtered at 20–450 Hz.
2.4. Test Setup
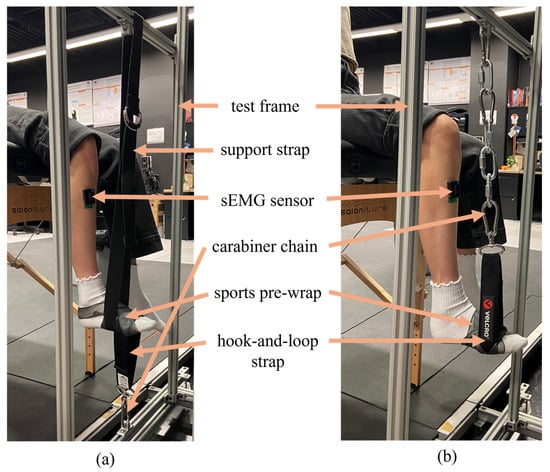
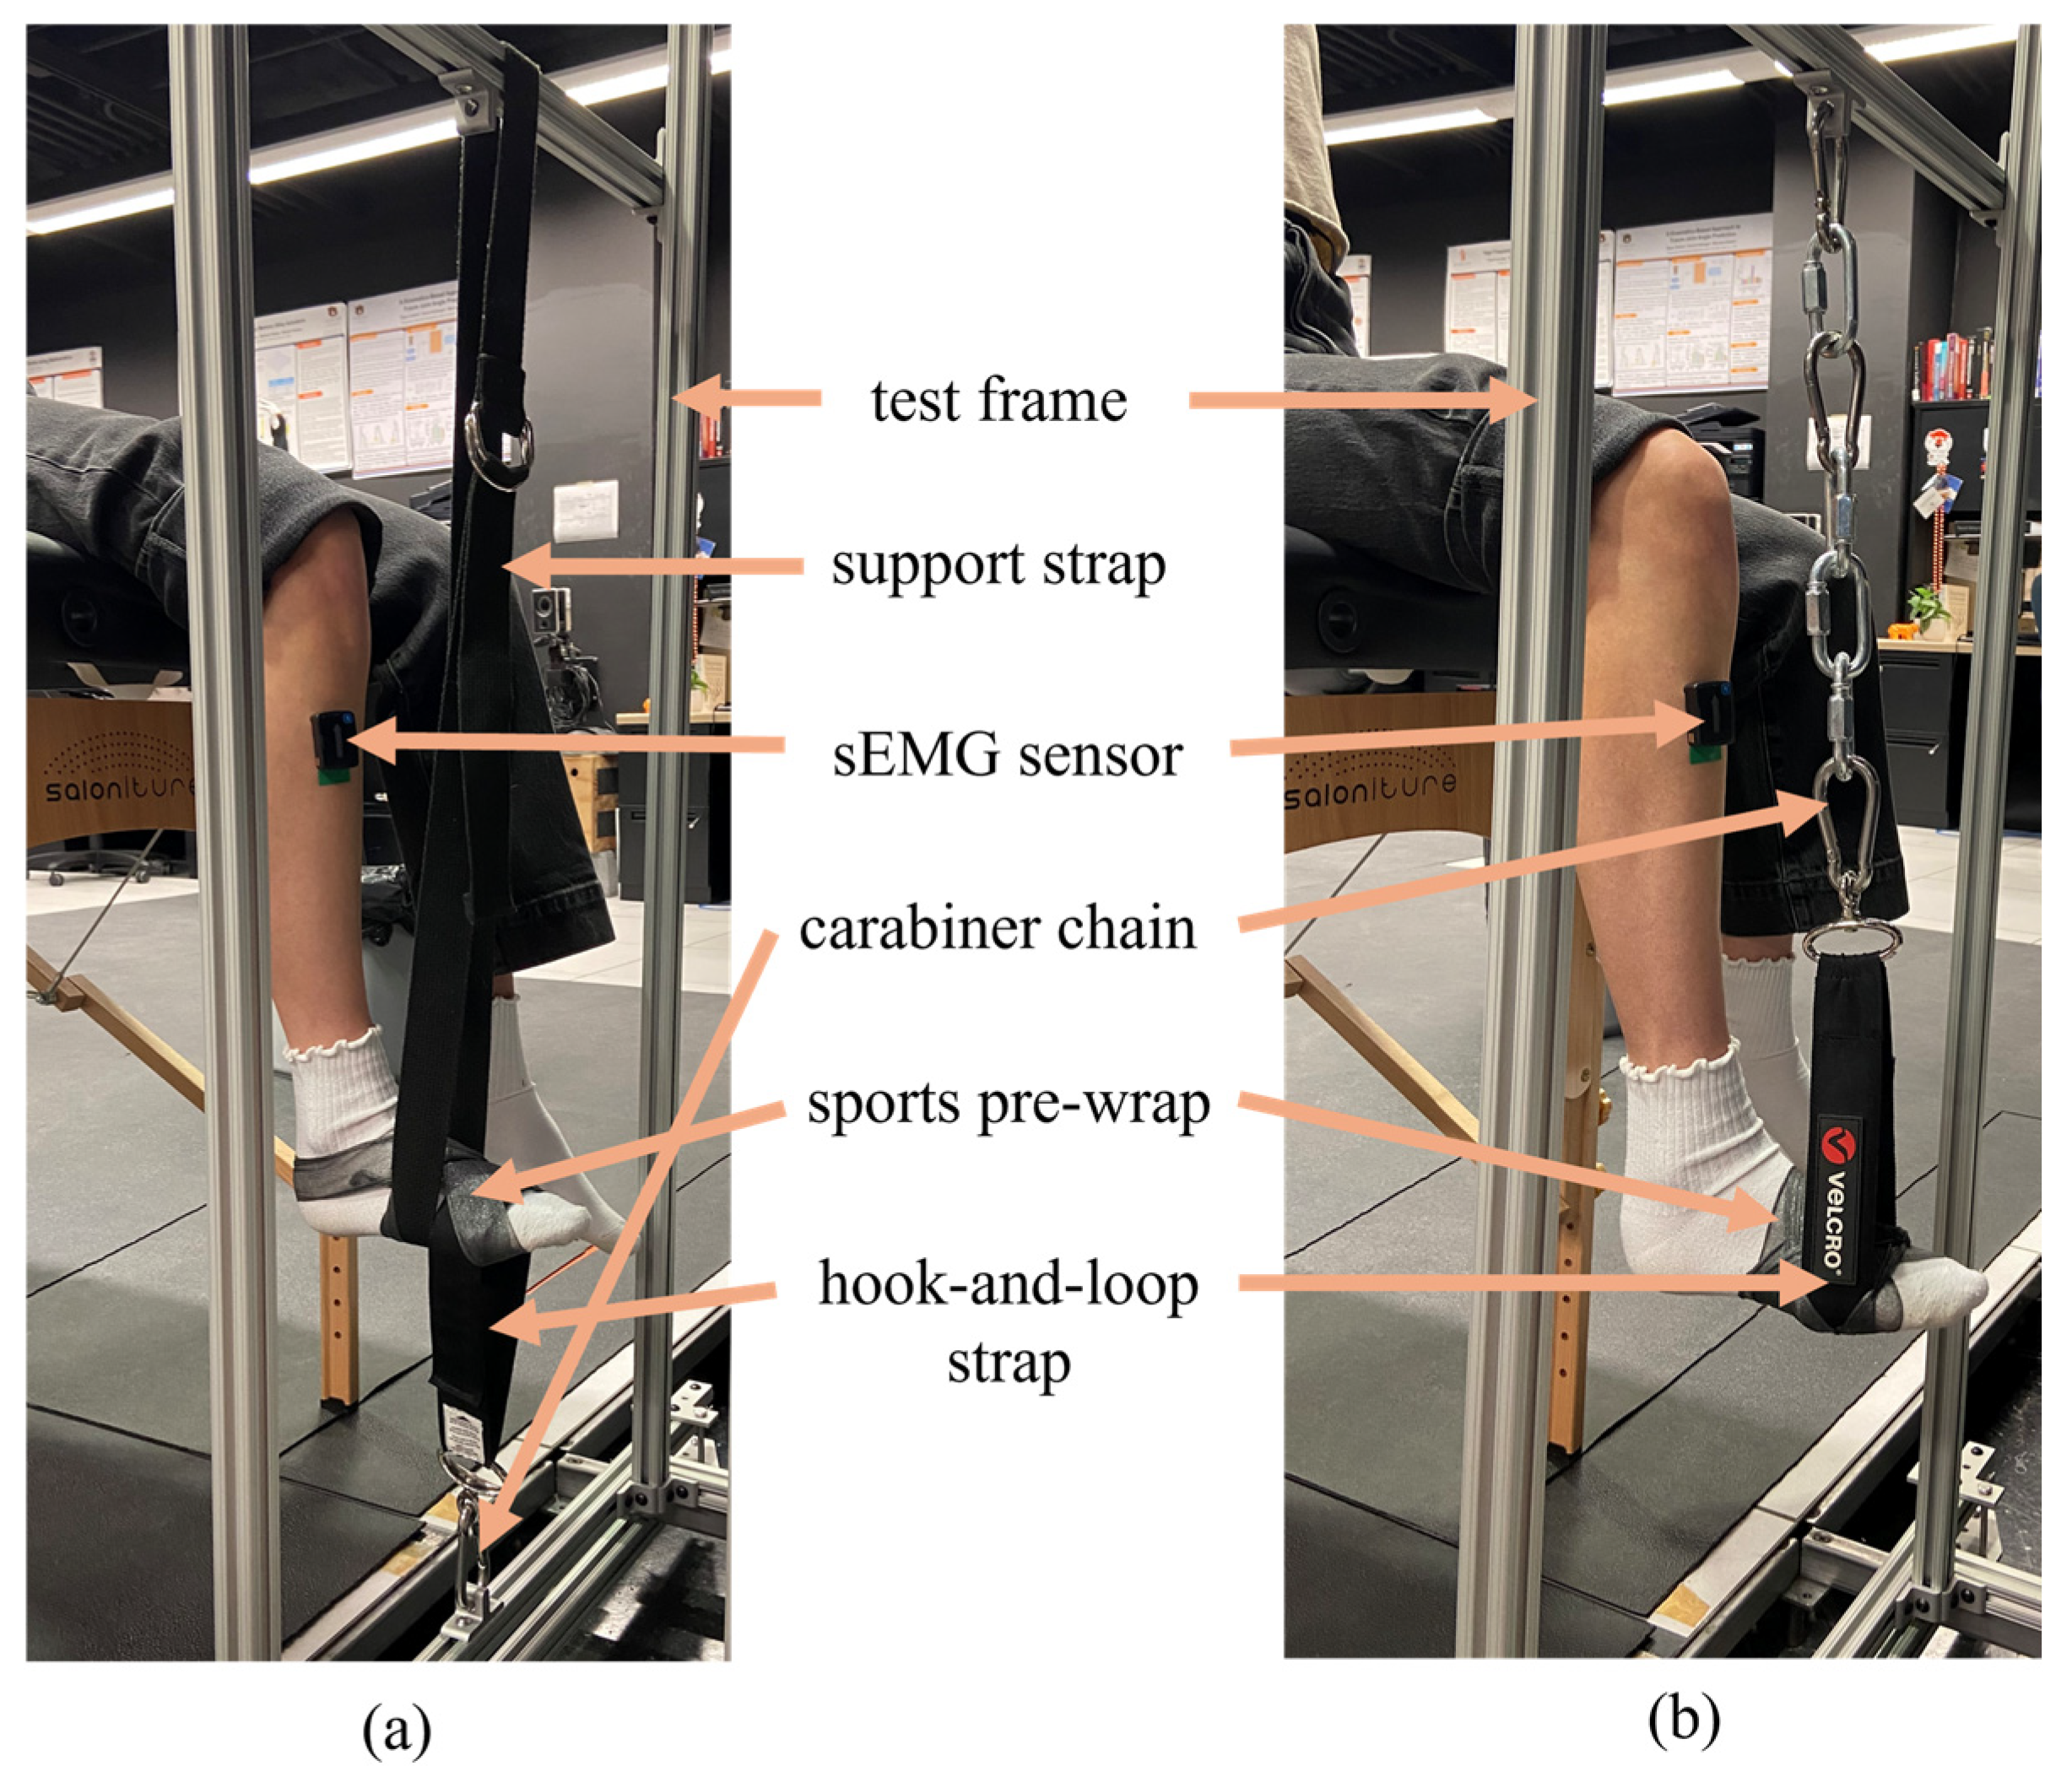
The participants were instructed to sit on the edge of a cushioned table with their dominant leg centered in the test frame, which was bolted to the subframe of the floor (Figure 1). Participants were asked to sit up straight during testing and held onto the sides of the cushioned table for bracing during contractions. Metal carabiners were used in series to attach a hook-and-loop strap to the metal frame. This ensured no elasticity in the connection and allowed for height adjustment between participants. The hook-and-loop strap was attached to the test frame below the foot for dorsiflexion and above the foot for plantarflexion, testing the TA and GM, respectively. The distance from the cushioned table to the test frame and the height of the hook-and-loop strap were adjusted for each participant so that the shank was approximately perpendicular to the floor. A stiff strap was used to support the foot during rest periods between dorsiflexion trials, ensuring it started parallel to the floor. The strap was placed around the distal metatarsal region of the foot and secured with sports pre-wrap to prevent sliding. The setup was maintained as described throughout the study.
Figure 1.
A participant prepared to perform (a) isometric dorsiflexion and (b) isometric plantarflexion.
2.5. Test Protocol
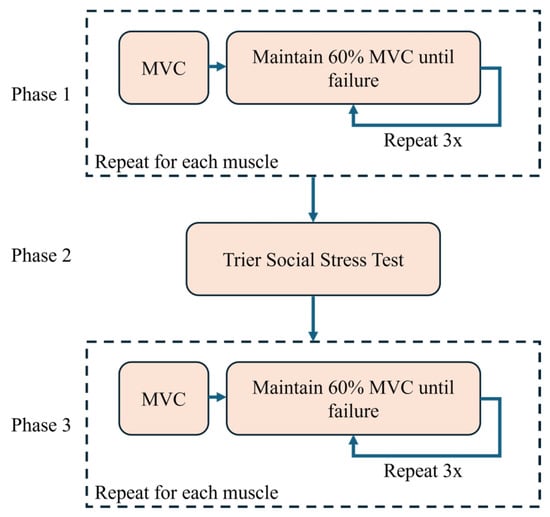
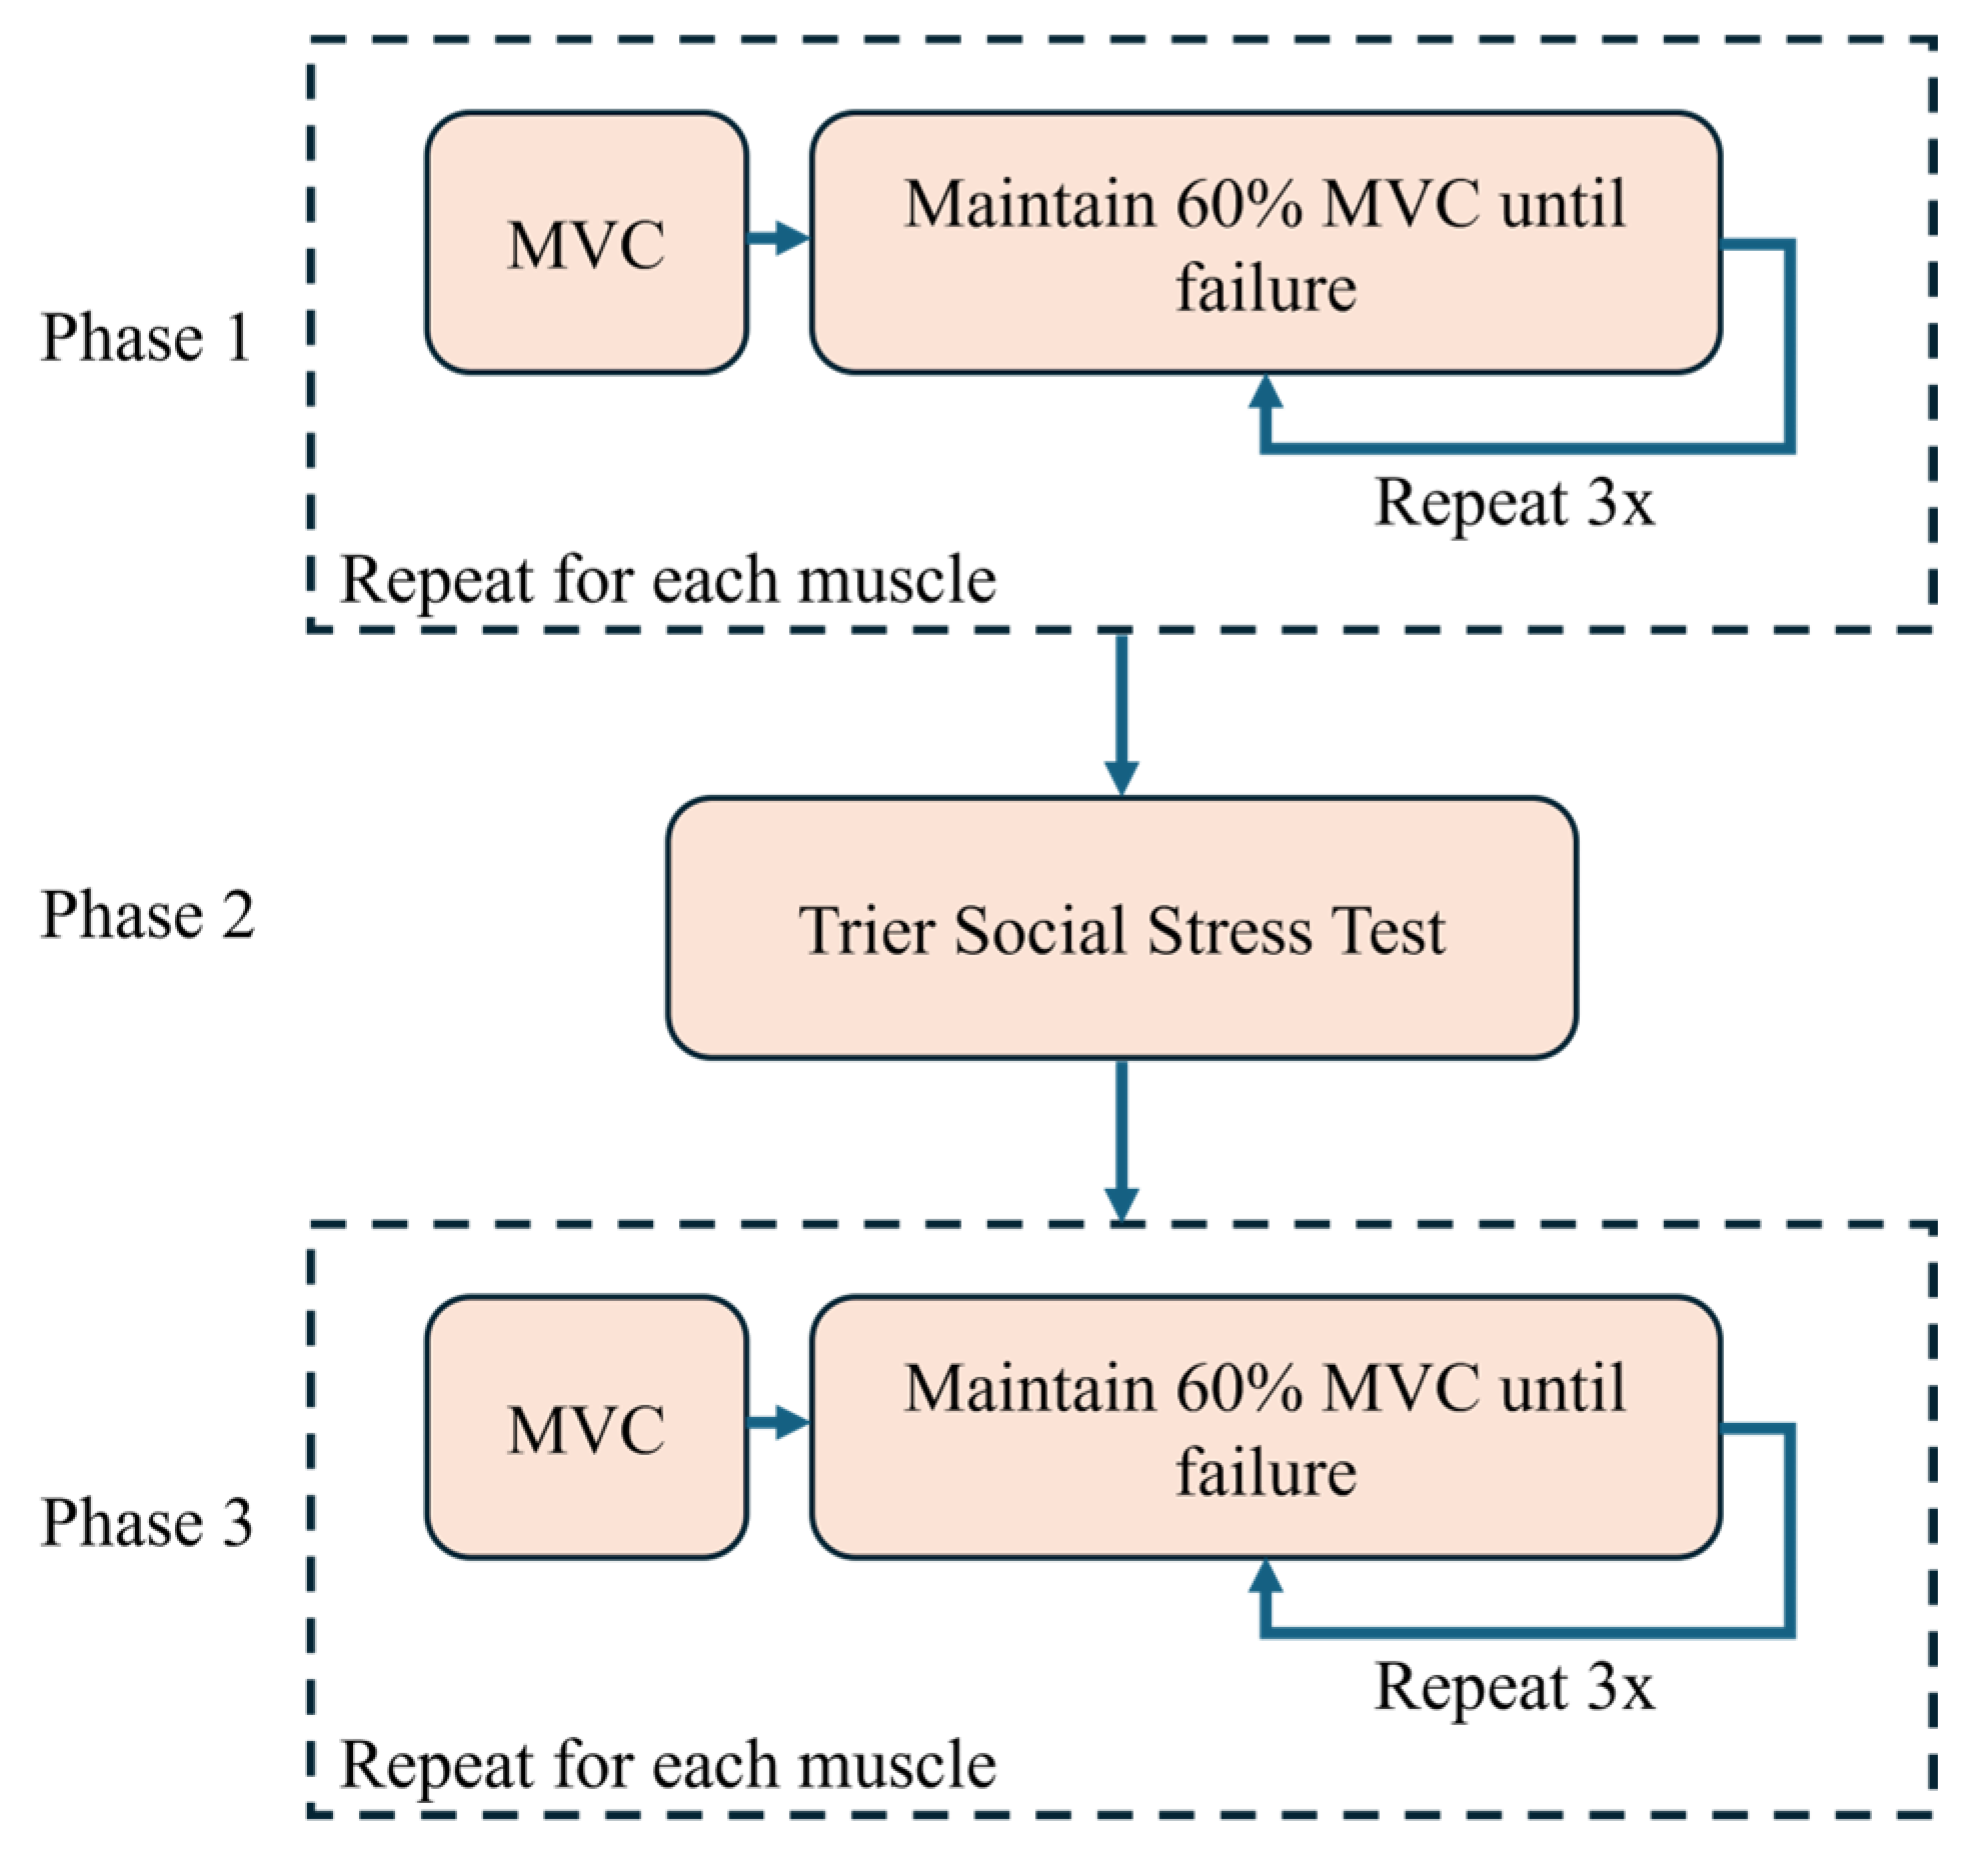
A workflow was created in Delsys EMGworks Acquisition™ (v4.7.7) to standardize testing between participants. The test was divided into three phases (Figure 2), where Phase 1 was a pre-stress fatigue test, Phase 2 was a psychosocial stress-inducing protocol, and Phase 3 was a post-stress fatigue test.
Figure 2.
A flow diagram depicting the methodology performed during testing.
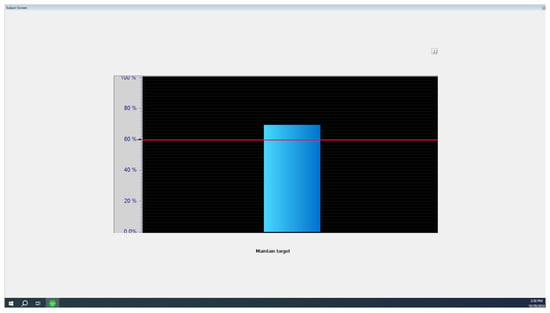
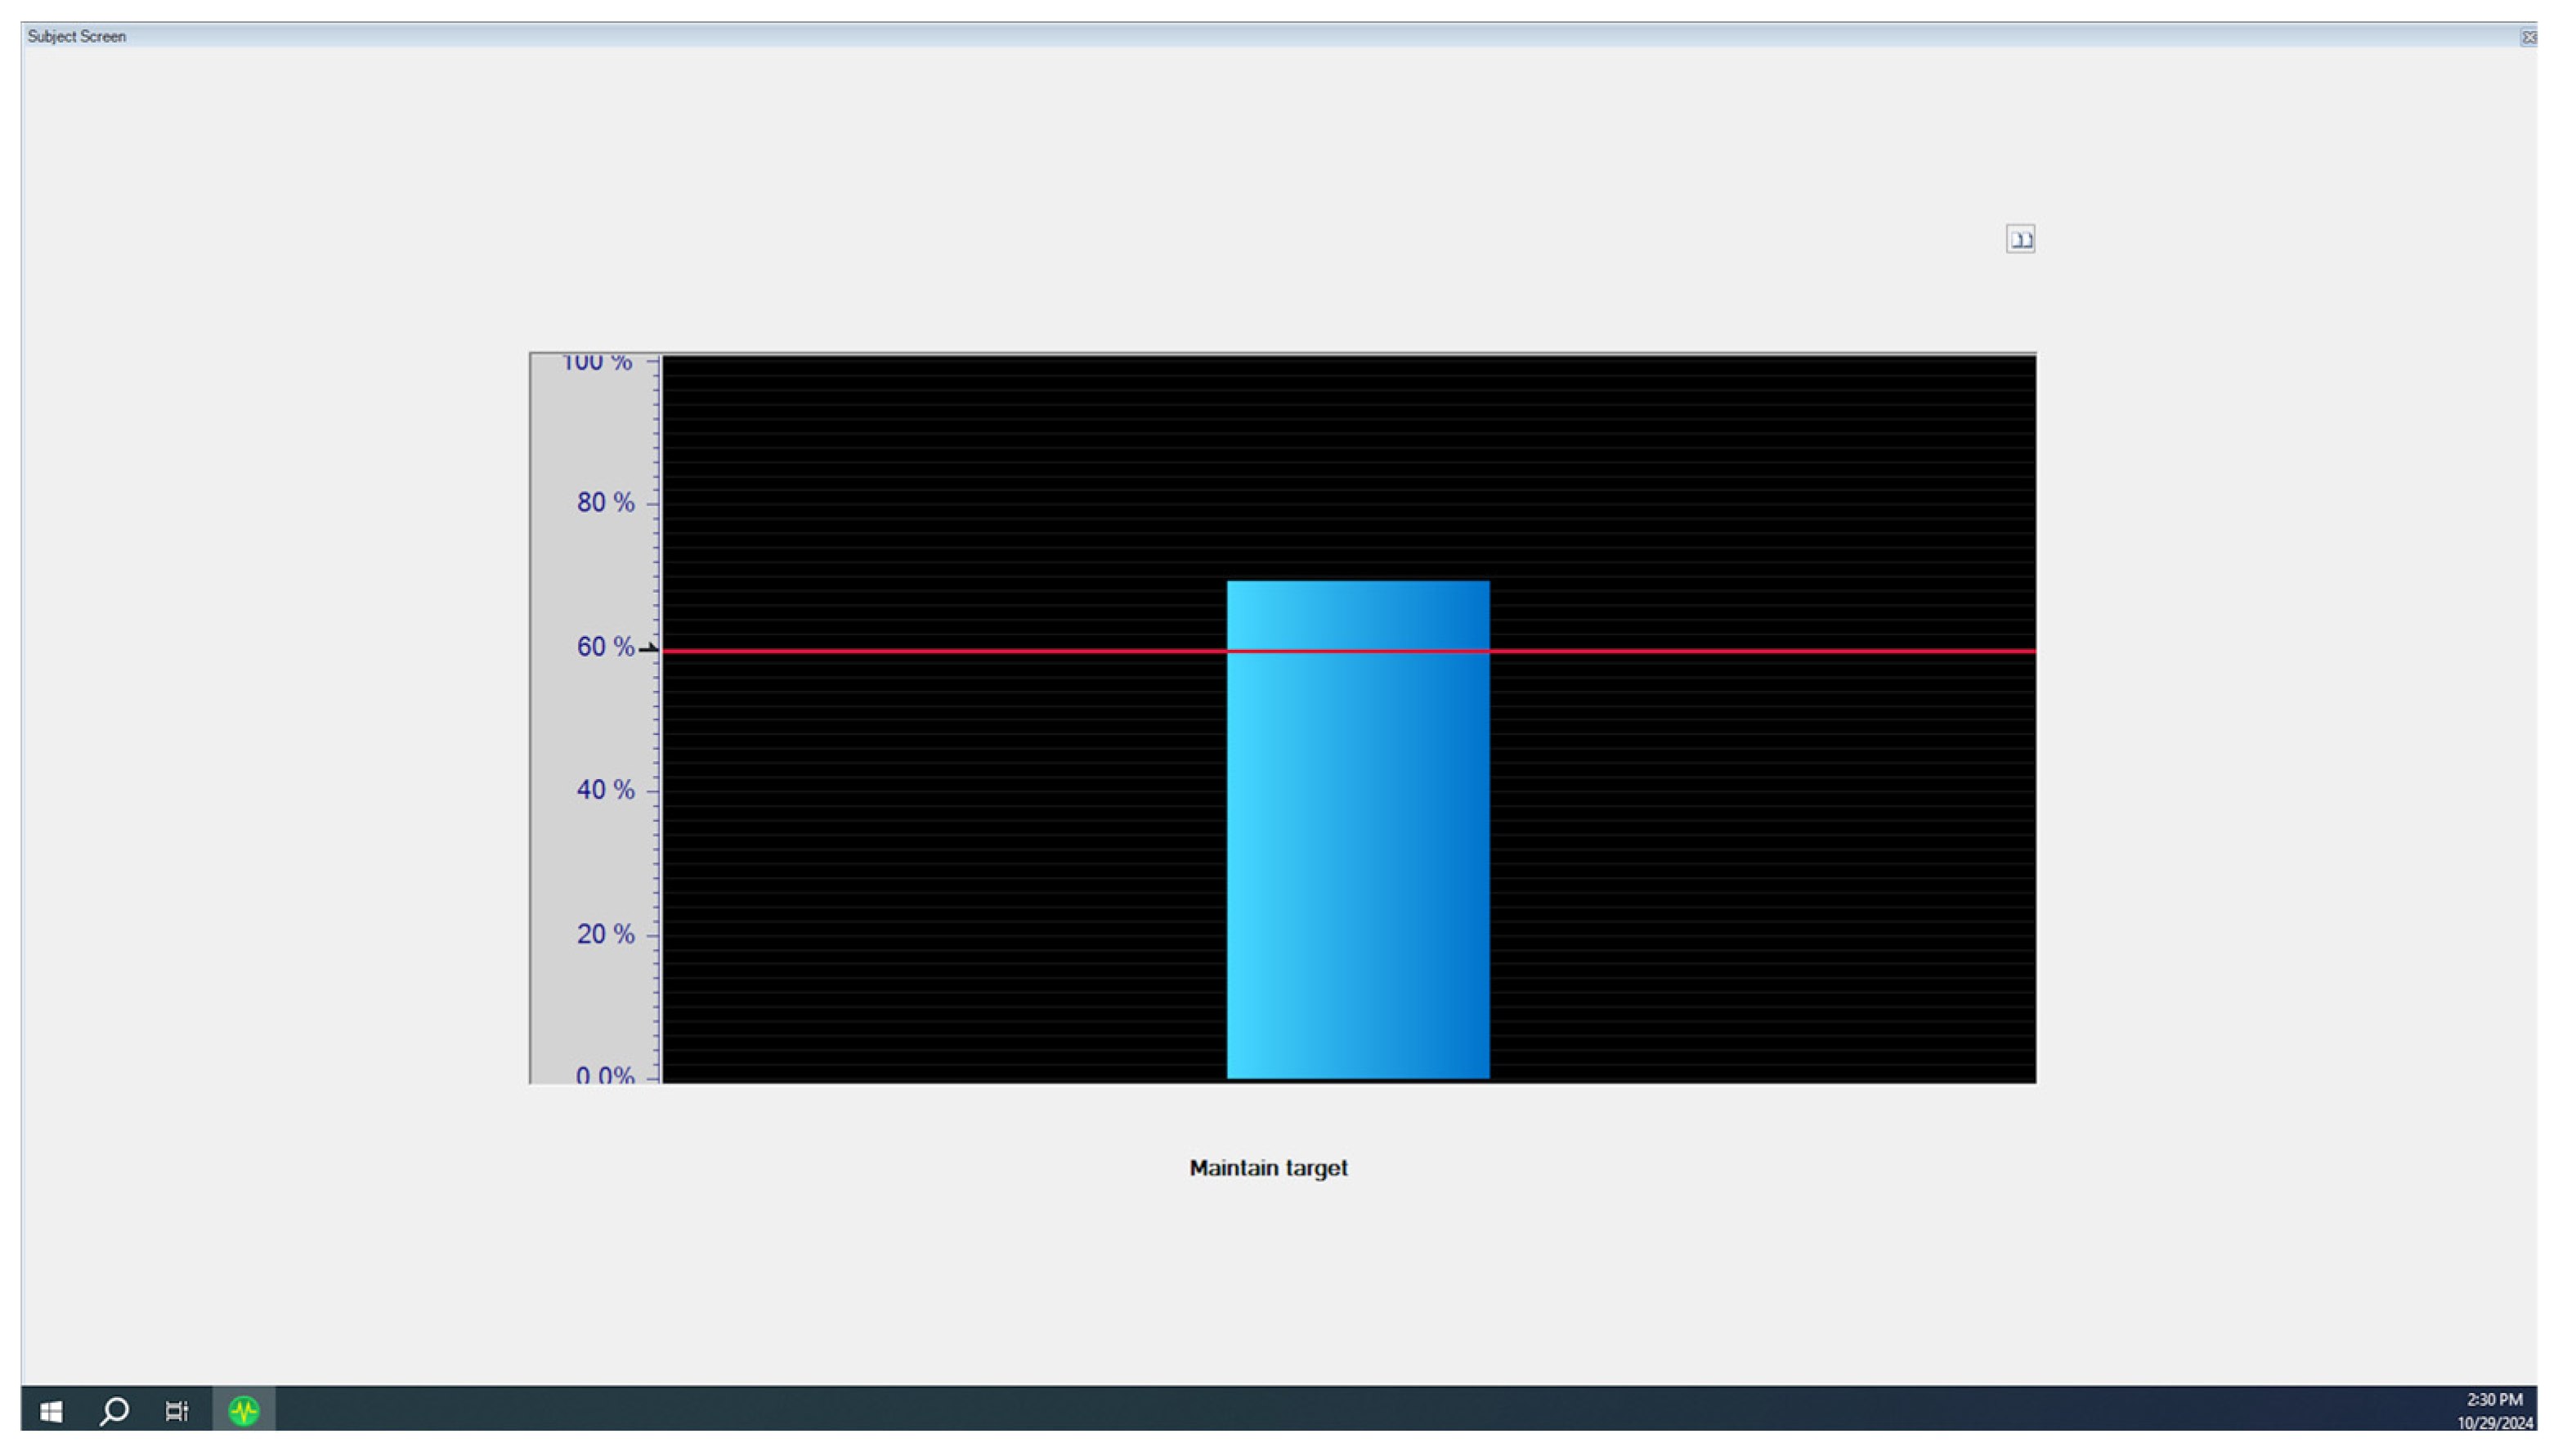
Within Phase 1 and Phase 3, both the TA and the GM were tested through isometric dorsiflexion and plantarflexion, respectively. Maximum voluntary contractions (MVCs) were executed following Delsys EMGworks Acquisition™ guidelines for each muscle, and the maximum amplitude was established as the participant’s MVC. For both phases, the sequence of events was as follows: the TA MVC was tested, fatigue testing was performed by the TA, the GM MVC was tested, and fatigue testing was performed by the GM. A visual aid was provided to the subject, consisting of a graph with a horizontal line marking the desired MVC percentage during fatigue testing (Figure 3). A bar was raised and lowered on the graph in correspondence with the participant’s real-time contraction level, allowing the participant and researcher to ensure the participant remained at or near the desired MVC level. During fatigue testing, participants were instructed to “hover the bar as close to the line as possible.” Participants performed three trials “hovering” at 60% MVC until failure, which was defined as the inability to achieve 60% MVC for more than three consecutive seconds.
Figure 3.
Participant view in Delsys EMGworks Acquisition™ during fatigue trials. The red horizontal line represents the target % MVC and the vertical blue bar represents the participant’s current % MVC.
In Phase 2, the TSST was used to induce psychosocial stress in participants [18]. To prevent stress caused by anticipation of the TSST in Phase 1, the initial consent form did not provide any information on the stress test, so a second consent form was provided after Phase 1 detailing the requirements of the TSST. All participants willingly consented to continuing their participation. Each participant was given the following prompt: “Imagine you have applied for your ideal job for which you must convince the committee members why you are the perfect candidate.” They were allowed three minutes to prepare mentally, without resources such as paper or pen, and told they would be required to speak on the topic for the entirety of five minutes immediately following the conclusion of the preparation time. Participants were verbally notified when their preparation time and speaking time began and ended. The task was performed in front of one to three people, and no visual or verbal feedback was provided during the test. Following this task, participants were instructed to count down aloud by increments of 13, beginning at 1300 until they reached zero or until five minutes had passed. If they reported an incorrect number, they were interrupted and required to begin again at 1300. No resources were provided.
2.6. Data Processing and Statistics
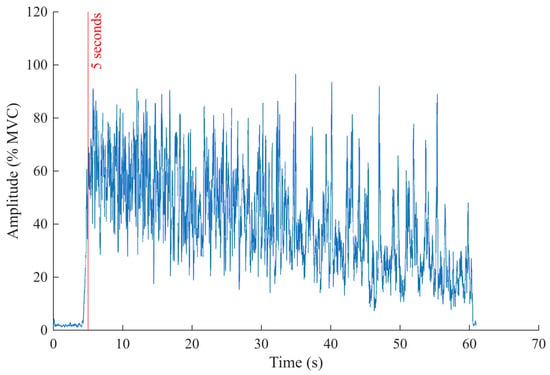
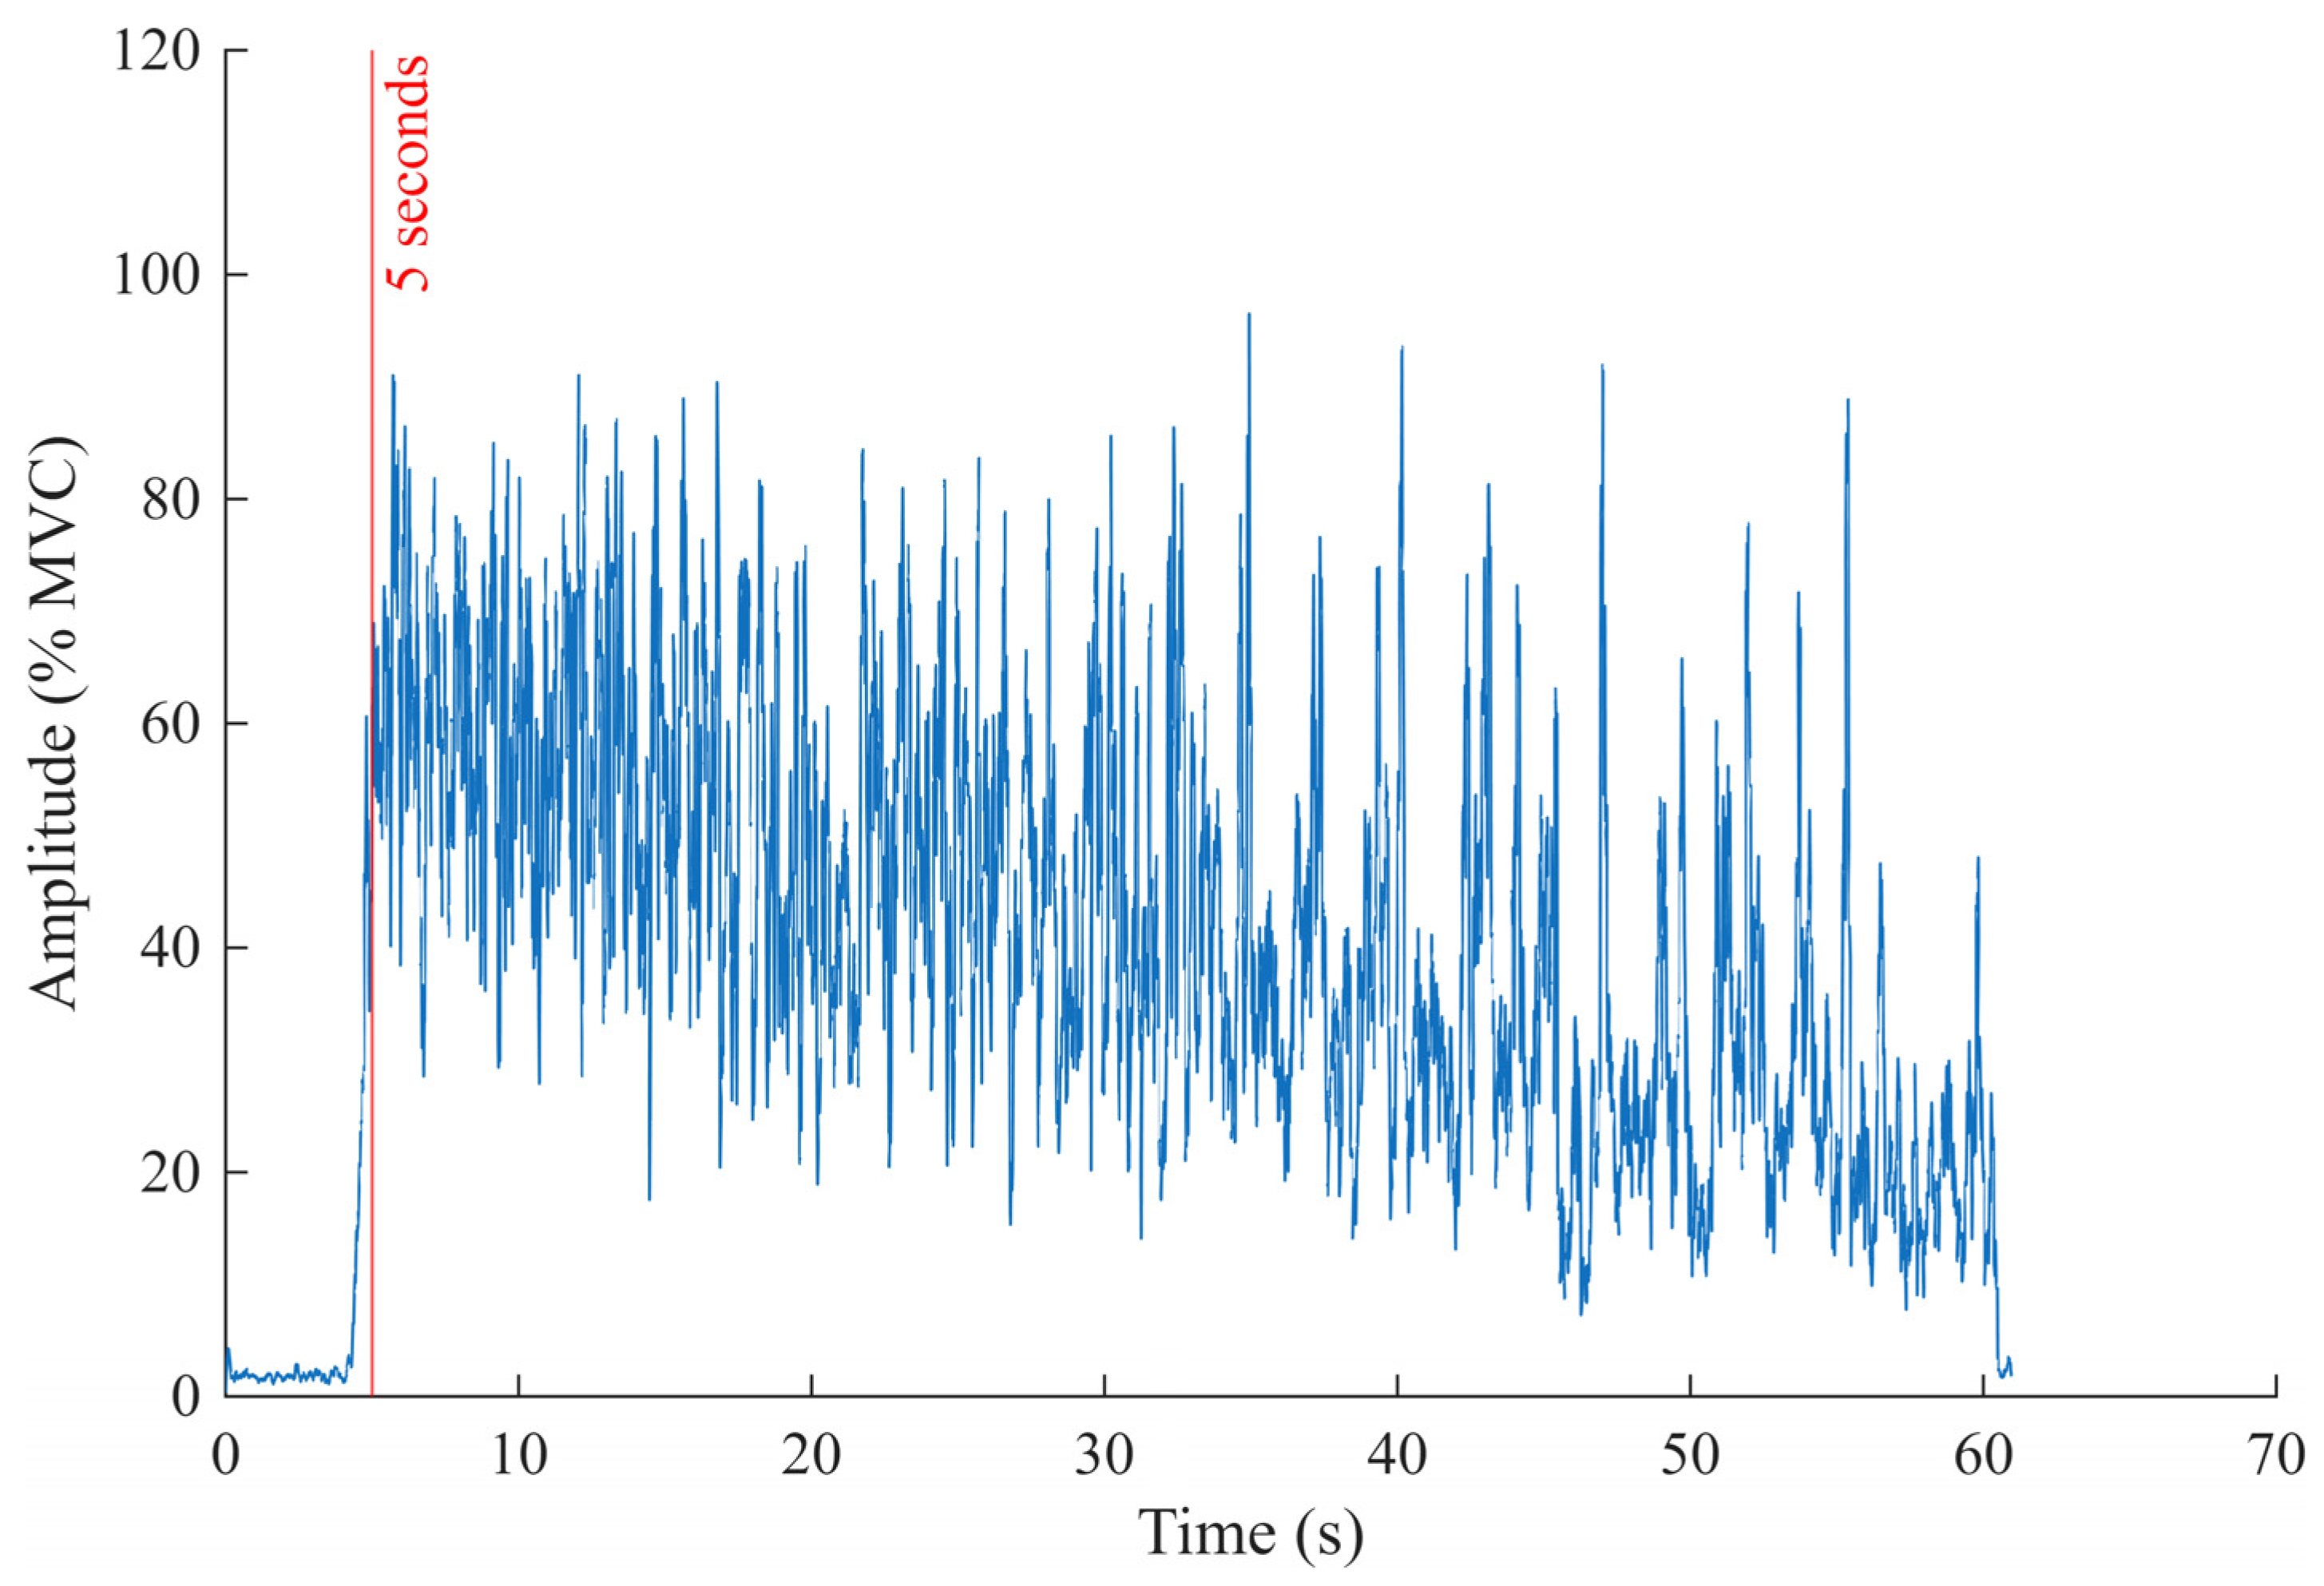
Data processing was automated in MATLAB R2023b (The MathWorks Inc., Natick, MA, USA) to ensure all data was processed uniformly. All 13 participants were used for analysis of the TA sEMG signals, and 12 were used for analysis of the GM sEMG signal. One participant’s data were excluded for analysis of the GM due to sensor malfunction resulting in a missing trial. Analysis began at the fifth second of each trial. Seconds one through three were a countdown for the participant to start, and the fourth second was omitted from analysis to allow the participant time to achieve the desired MVC percentage. All data recorded from the fifth second to the end of the trial were considered the “active period” of the trial (Figure 4).
Figure 4.
A fatigue trial was plotted to depict the resting and active periods of the trial. The red line denotes the start of the fifth second. The data to the left of the line are considered resting, and the data to the right are considered the active period.
Each participant’s heart rate was extracted from the sEMG sensor on their lower left abdomen. The data were zeroed and full-wave-rectified. The “findpeaks” function in MATLAB was used with a minimum peak distance of 1000 samples to extract the heart rate from the signal. The heart rate of the last three seconds before the TSST and the first three seconds after the TSST were compared as a surrogate measure of stress using a one-tailed Wilcoxon signed-rank test with a confidence interval (CI) of 95% and a type I error rate of 0.05.
The sEMG data were zeroed for frequency and amplitude analysis. For amplitude analysis, it was also full-wave-rectified, smoothed using a sliding root mean square filter (window size of 200), and normalized to each participant’s MVC. The mean amplitude of a trial was found by taking the mean of the active period of that trial. The mean frequency of a trial was found from the power spectrum of the active period of that trial. To analyze the rate of change (ROC), the active period of the trial was discretized into 10 equal sections. The mean amplitude and mean frequency of each section were calculated, and the slope of the linear best-fit line was compared between trials. The first three tenths were excluded from the best-fit analysis because participants occasionally took longer to achieve the desired MVC than the allocated resting period. The last tenth was excluded to account for the reaction time of the researcher to end the trial after participants ceased muscle contraction.
The normality of the data was then tested using the Shapiro–Wilk test, and some data were determined to be non-Gaussian. Since a difference was expected but no direction was predicted, and pre- and post-stress trials were compared for the same set of participants, two-tailed paired Wilcoxon signed-rank tests were performed to assess statistical differences in the mean amplitude, mean frequency, and rate of change of each between pre-stress and post-stress trials. A 95% CI and a type I error rate of 0.05 were used for the tests. Rather than averaging the three trials together for each condition, the trials were compared across conditions so that differences between trials could be observed. For example, Trial 1 pre-stress was compared statistically with Trial 1 post-stress.
Following traditional statistical testing, equivalence testing was performed using the two one-sided t-test (TOST) procedure, which evaluates whether the CI of the target parameter lies entirely within pre-specified equivalence limits [31]. This study followed the 80–120% rule commonly used in equivalence testing, where the equivalence margin is defined as δ = log(1.25) ≈ 0.22 [32]. A more stringent equivalence margin of δ = log(1.10) ≈ 0.10 was also tested. These bioequivalence limits correspond to the recommendations of regulatory agencies such as the Food and Drug Administration and the European Medicines Agency [33,34]. Accordingly, the following hypotheses were tested:
where d represents the log-difference:
H0: d ∉ (−δ, δ) vs. H0: d ∈ (−δ, δ),
log(post-stress) − log(pre-stress).
Under this equivalence framework, a CI of 100(1 − 2α)% for d was constructed. If this CI lies entirely within the equivalence bounds (−δ, δ), we reject the null hypothesis and conclude that the post- and pre-stress conditions are statistically equivalent at the significance level α. Confidence intervals of 90% and 95% were both tested. The TOST procedure was conducted using the “tost” function from the “cTOST” package in R 4.5.1 (R Core Team, Vienna, Austria) [35]. The results found using the TOST method are considered preliminary due to the small sample size of the study.
3. Results
3.1. Heart Rate
The average heart rate significantly increased from 98.93 ± 6.58 bpm before the stress test to 114.94 ± 17.22 bpm after the stress test (p value < 0.02), confirming the induction of stress.
3.2. Mean Amplitude and Frequency of the sEMG Signals
No significant differences were found when comparing the mean amplitude or mean frequency before and after the stress test for the TA or GM using the Wilcoxon signed-rank test (Table 1).
Table 1.
Mean amplitude and frequency pre-stress and post-stress for the TA and GM.
For the TA, the mean pre-stress amplitude across all three trials was 49.28% MVC, and the mean post-stress amplitude across all three trials was 48.71% MVC. The mean pre-stress frequency across all three trials was 77.48 Hz, and the mean post-stress frequency across all three trials was 78.31 Hz. For the GM, the mean pre-stress amplitude across all three trials was 44.83% MVC, and the mean post-stress amplitude across all three trials was 43.98% MVC. The mean pre-stress frequency across all three trials was 151.20 Hz, and the mean post-stress frequency across all three trials was 153.99 Hz.
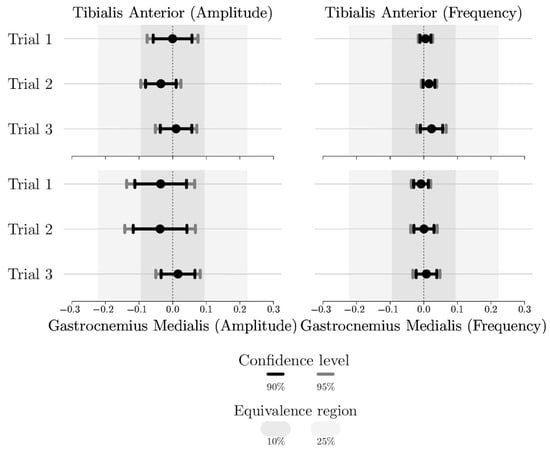
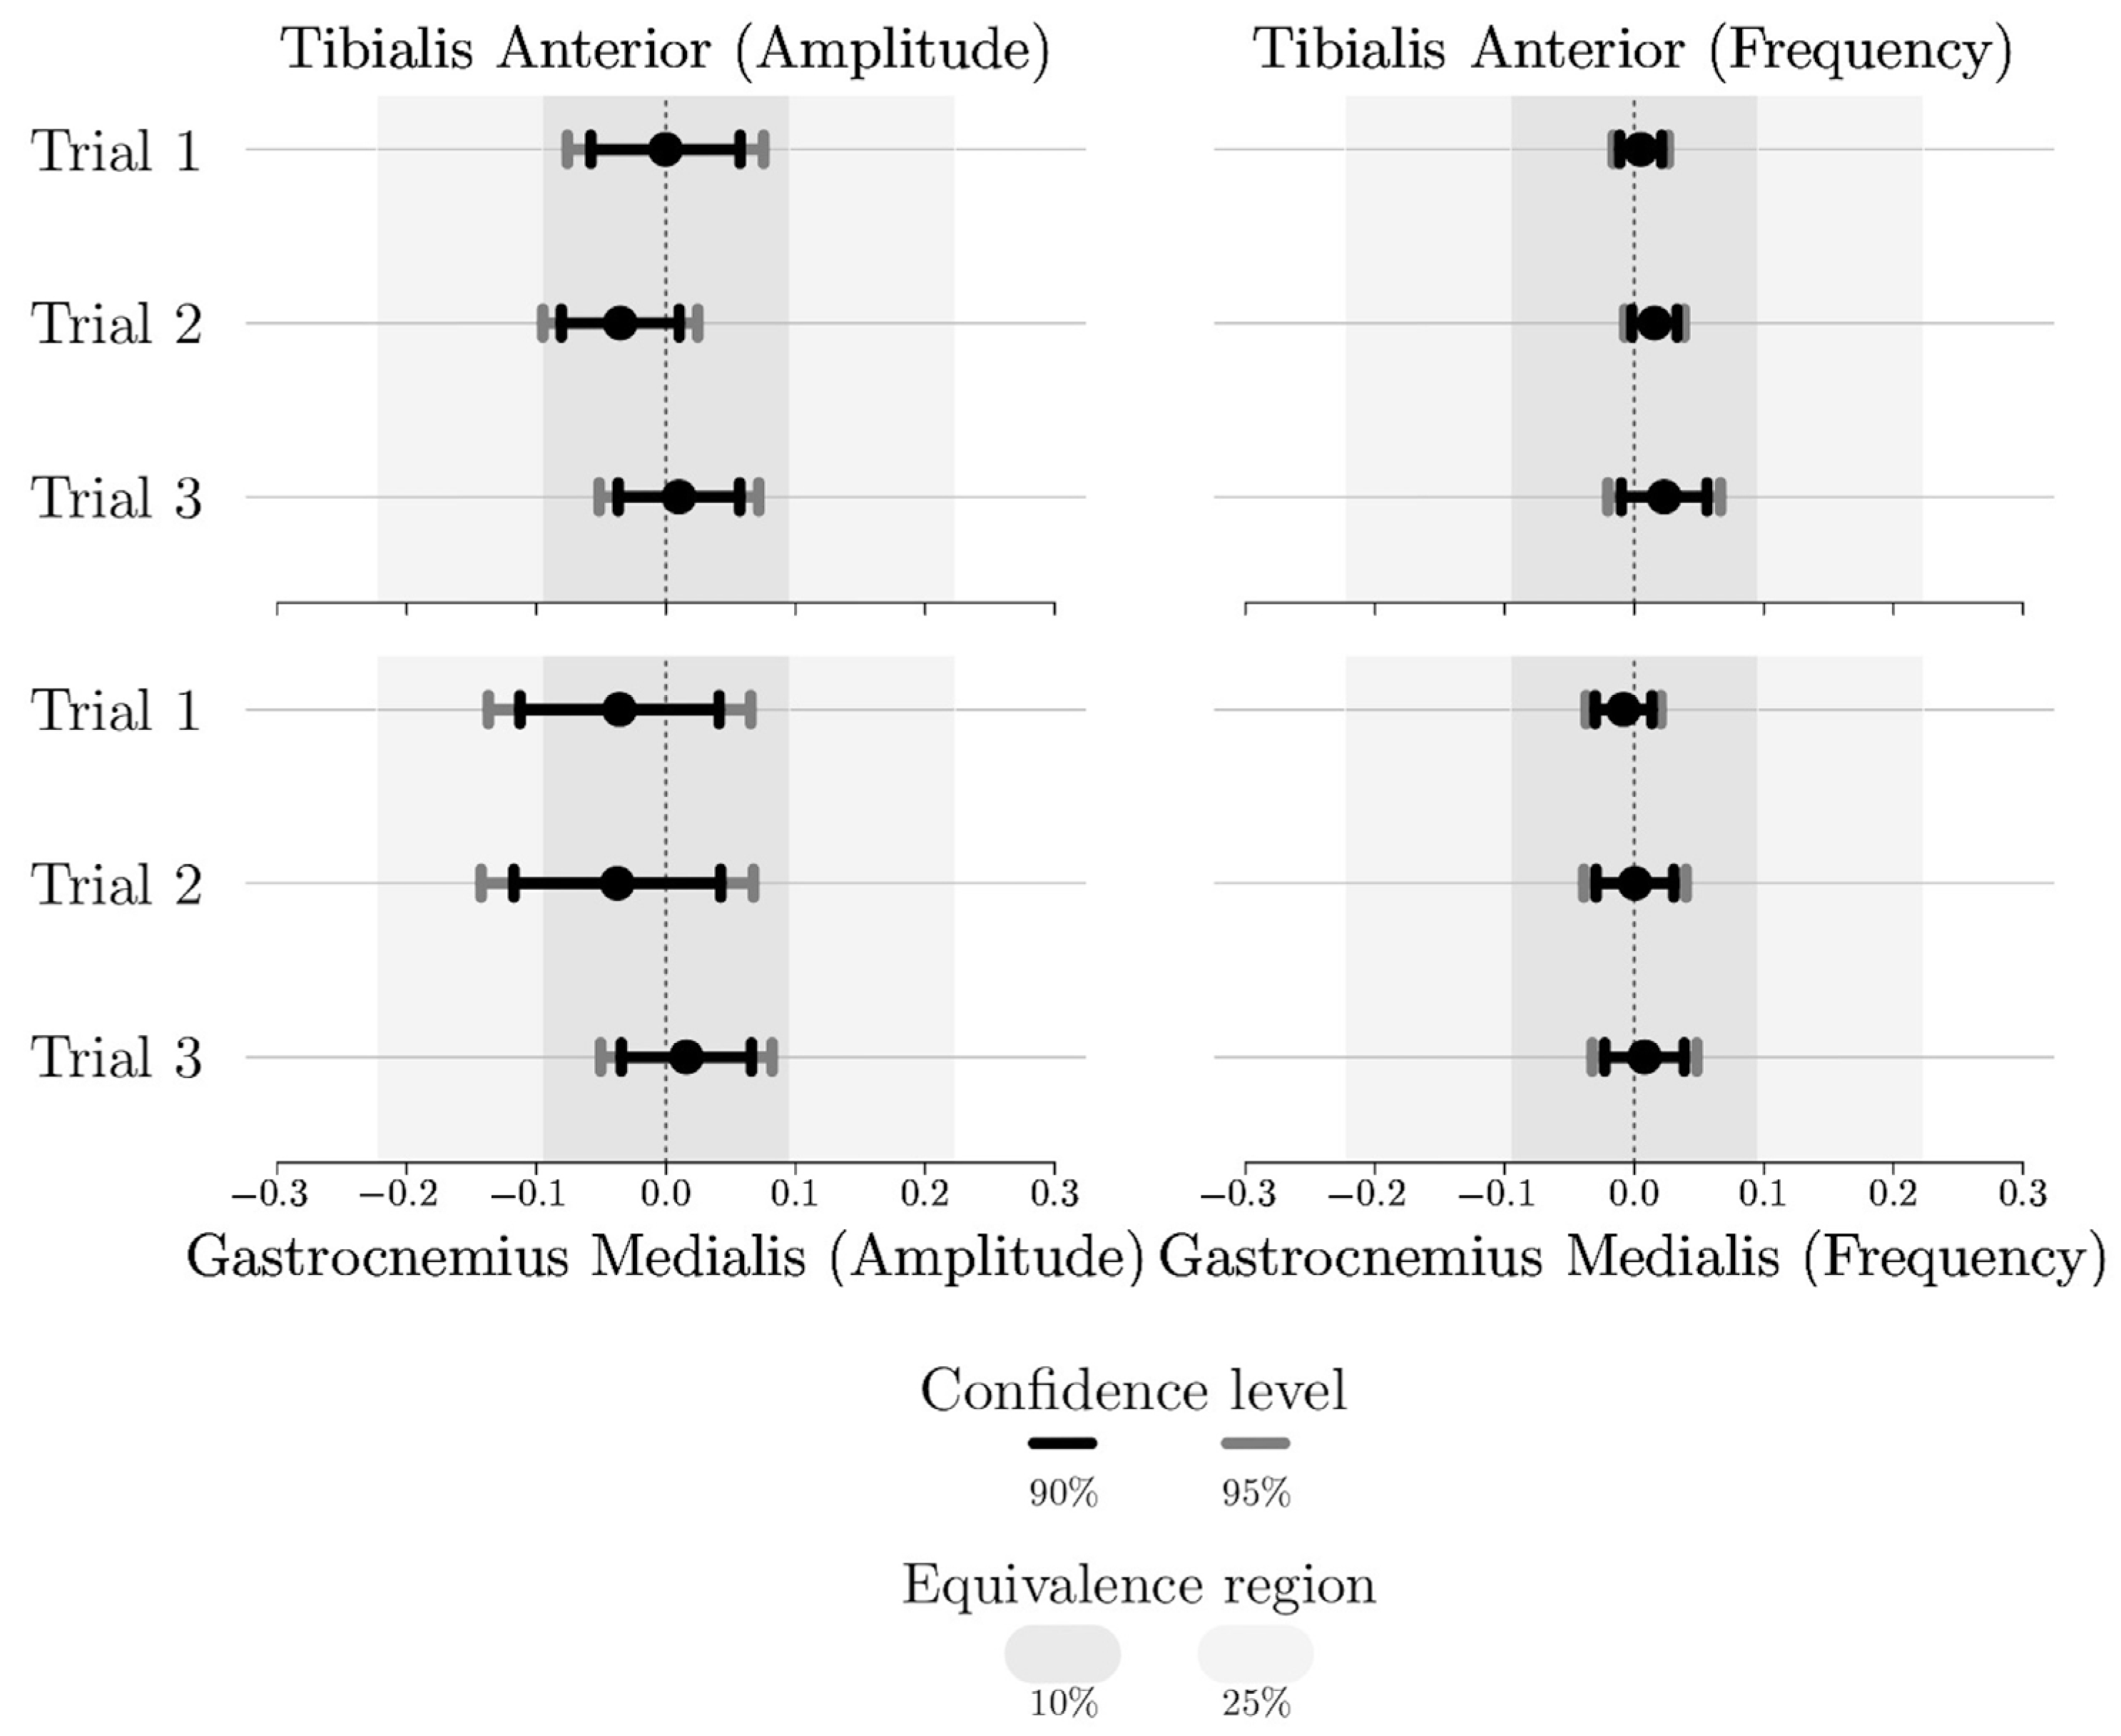
Using the TOST method with 90% and 95% CIs, statistical equivalence was established for all comparisons of mean amplitude and mean frequency when the equivalence margin was set to log(1.25). When the equivalence margin was reduced to log(1.10), statistical equivalence was maintained for all TA comparisons. Under the same condition, in the first and second trials, the mean amplitudes for the GM were no longer statistically equivalent; however, the third trial’s mean amplitude and all trials’ mean frequency maintained statistical equivalence (Figure 5).
Figure 5.
Equivalence testing results using the TOST method. If the confidence interval is located entirely within the equivalence region, the data are considered statistically equivalent.
3.3. Rate of Change of the sEMG Signals
No significant differences were found when comparing the slope of the mean amplitude or mean frequency before and after the stress test for the TA or GM using the Wilcoxon signed-rank test (Table 2).
Table 2.
Rate of change of the mean amplitude and frequency per percent of the trial pre-stress and post-stress for the TA and GM.
For the TA, the mean ROC for the amplitude across all three trials was −1.15% MVC% of trial−1 during the pre-stress condition and −0.92% MVC% of trial−1 during the post-stress condition. The mean ROC for the frequency across all three trials was −1.75 Hz% of trial−1 during the pre-stress condition and −1.88 Hz% of trial−1 during the post-stress condition.
For the GM, the mean ROC for the amplitude across all three trials was 0.49% MVC% of trial−1 during the pre-stress condition and 0.05% MVC% of trial−1 during the post-stress condition. The mean ROC for the frequency across all three trials was −0.88 Hz% of trial−1 during the pre-stress condition and −0.62 Hz% of trial−1 during the post-stress condition.
4. Discussion
The purpose of this study was to investigate how psychosocial stress affects muscle signals in the lower body by utilizing the TSST to induce stress in healthy young adults and observing changes in sEMG signals during isometric fatiguing contractions before and after stress induction. It was hypothesized that psychosocial stress would have a measurable effect on the sEMG signal amplitude, frequency, and change over time of each signal characteristic for the TA and GM during fatigue testing. The average heart rate increased to 16 bpm (13.93%) from the pre-stress to post-stress measurements, indicating that stress was successfully induced. Past studies using the TSST show a typical increase of 10–40% [36]. Due to the lack of significant differences, all hypotheses were rejected.
4.1. Equivalence Determined for Mean Amplitude and Frequency
Bioequivalence was established for all comparisons of mean amplitude and mean frequency before and after stress testing for both muscles. This contrasts with similar studies performed on the upper body, which found significant changes in muscle activity. One study induced negative emotions by exposing participants to negative visual and acoustic stimuli and found a significant increase in differential muscle activity in several back muscles while at rest [14]. A study on the effects of psychophysiological stress on the trapezius muscle at rest determined that sEMG amplitude increased with psychosocial stress by 19.7% during a mental arithmetic task [4]. The same study also tested isometric contractions in combination with a different stressor, the Stroop color–word test, and found that sEMG amplitude increased by 21.6%. The authors suggested this change may be a result of continued low-threshold motor unit recruitment and also noted a significant positive correlation between sEMG activity, blood pressure, and norepinephrine, which plays an important role in blood pressure regulation. The current study tested isometric contractions before and after the TSST, which includes mental arithmetic, and found statistical equivalence between the sEMG amplitude and frequency. One possible cause for the difference in reaction in the upper and lower body is that some upper-body muscles, such as the trapezius, are innervated by the reticular formation, which plays a role in arousal [37]. Additionally, a study by Anderson et al. found that mental stress causes a dissociation of sympathetic nerve activity and inhibits blood pressure regulation in leg muscles but not in arm muscles [28]. Therefore, during psychosocial stressors, the upper body may be able to regulate blood pressure (shown to correlate with increased muscle tension [4]) while the lower body may not. It should be noted that, due to the small sample size of the current study, the TOST results are considered preliminary, as adequate statistical power is required to confidently conclude there is no difference in the data.
While no studies were found analyzing the effects of psychosocial stress on sEMG signals in the lower body, three were found analyzing its effect on muscle spindle activity in the lower body. Muscle spindles are sensory receptors responsible for informing and regulating muscle movement. Ribot-Ciscar et al. and Macefield et al. placed tungsten microelectrodes into the peroneal nerve to record muscle spindle afferent activity [15,17], and Hjortskov et al. performed reflex tests on the Achilles tendon with a sensor to detect the tap time and an EMG sensor on the soleus to determine latency between the reflexive tap and muscular response [16]. Similar to the current study, which utilized the TSST, two of these studies utilized mental arithmetic (a component of the TSST) as a stressor and found increases in muscle spindle activity of 111% and 26% in muscles at rest during the stress-inducing activity [15,16]. The other study used electrical stimulation as the stressor and found no significant difference between rest and the stress-inducing activity [17]. While the current study analyzed sEMG characteristics rather than muscle spindle activity, it was thought that increased muscle spindle activity due to mental stress may be reflected in the sEMG signals as a result of their relative relationships to muscle contraction and relaxation; however, the lack of significant differences and, further, the preliminary statistical equivalence found in this study suggest this is not the case for healthy young adults performing isometric contractions.
4.2. Differences in TA and GM Results
The two muscles being tested produced different results. The mean amplitude of the GM was always lower than that of the TA (averaging 11.92% lower and 11.36% lower for pre- and post-stress conditions, respectively), and the mean frequency of the GM was always higher than that of the TA (averaging 101.90% higher and 102.39% higher for pre- and post-stress conditions, respectively). Participants were able to achieve and hold the desired MVC percentage longer with the TA, whereas they had trouble achieving the desired MVC percentage with the GM. Participants’ TA trials lasted an average of 10 s longer than their GM trials. The GM contraction level was below the desired level for a much higher portion of trials than the TA, which typically only fell below when fatigued. Additionally, the GM had higher standard deviations than the TA for the mean amplitude and mean frequency analyses, and the GM had much lower R2 values compared to those of the TA for the ROC analysis. This aligns with the closer relationship of muscle spindle activity to extensor muscles and the research done by Hjortskov et al. stating that fine motor control may be impaired during stressful situations [16]. Because the GM is a biarticular muscle, knee angle may have affected its EMG signals. The amplitude was normalized to each participant’s MVC and should therefore not be affected by this; however, it is possible that the frequency may have been affected since the knee angle was not truly standardized between participants. This could also have contributed to the higher standard deviations and lower R2 values of the GM. A study by Rahman et al. analyzing muscle activity of the TA and GM during balancing on a hoverboard found that the TA and GM muscles show similar trends in activity, but the TA shows significant differences while the GM does not [38]. This may signify that the GM provides less reliable data than the TA during activities requiring the muscle to create stability, such as this study, where the leg was not fixed in place.
4.3. Implications for Ergonomics Science
From an ergonomics science perspective, these findings help clarify whether acute psychosocial stress should be considered a potential confounding factor in lower-limb sEMG-based assessment. This question is relevant because ergonomic researchers use sEMG to evaluate muscular demand, fatigue development, intervention effectiveness, wearable assistive technologies, and human–machine interfaces [3,39,40,41,42,43]. If psychosocial stress meaningfully altered lower-limb sEMG amplitude or frequency, then stress state could influence the interpretation of biomechanical workload, fatigue, or device-control studies. However, under the conditions tested here, acute psychosocial stress did not produce statistically meaningful changes in TA or GM mean amplitude, mean frequency, or ROC outcomes during isometric fatiguing contractions in young healthy adults.
This contribution is important because psychosocial stress is a recognized occupational exposure that has been associated with work-related musculoskeletal symptoms and disorders [44,45]. Prior research has also shown that acute psychological or psychosocial stress can alter muscle activity, particularly in upper-body muscles such as the trapezius [4]. The present findings suggest that these upper-body responses should not be assumed to generalize uniformly to lower-limb muscles, especially when sEMG is collected during controlled isometric contractions. Therefore, rather than treating psychosocial stress as either universally relevant or universally negligible for sEMG analysis, ergonomic researchers should evaluate its influence in a muscle-specific and task-specific manner.
The practical implication is that TA and GM sEMG signals collected during controlled lower-leg isometric tasks may be relatively robust to acute psychosocial stress, at least in populations and protocols similar to those tested here. This supports the use of lower-leg sEMG in ergonomic studies where the primary objective is to assess localized lower-limb muscular demand or fatigue under controlled testing conditions. It may also inform the interpretation of sEMG-based evaluations of lower-limb assistive technologies, rehabilitation devices, balance-related tasks, and data-driven ergonomic assessment systems when acute psychosocial stress is present but not the primary exposure of interest.
However, these implications should be interpreted conservatively. The present results should not be extended without further evidence to dynamic occupational tasks [46], prolonged standing or walking, complex balance demands, older workers, clinical populations, chronic psychosocial stress exposure, or work systems involving simultaneous high physical and psychosocial demands [7]. Future ergonomic studies should examine whether these findings persist under more ecologically valid work conditions, especially in lower-limb tasks involving gait, balance, load carriage, fatigue accumulation, and interaction with wearable assistive devices. Additionally, future studies may consider more in-depth frequency analysis, such as spectral decomposition and motor unit behavior analysis. These and other more sensitive neuromuscular measures could reveal stress-related effects that are not revealed in the mean amplitude and mean frequency analyses performed in this study.
4.4. Limitations
One limitation was that some participants struggled to achieve and maintain the desired contraction level of the GM, which can be seen in the lower mean amplitudes, higher mean frequencies, and lower R2 values compared to the TA. Two possibilities for this are the lack of lateral support around the ankle joint and the biarticular nature of the GM. The angle of the knee joint was not standardized and may have introduced additional variation to the GM data. Therefore, future studies may benefit from utilizing a setup that minimizes lateral motion at the ankle to increase stability and GM engagement and standardizing the knee joint angle throughout the study. Though the heart rate increased as expected from pre- to post-stress and the stressed state was considered confirmed, the study would have been strengthened by additional methods of confirming stress induction, such as a simple survey, blood pressure, or a hormonal marker. Future studies should consider the inclusion of multiple stress confirmation metrics. The inability to control life factors, such as caffeine intake, meal timing, and sleep deprivation, was also a limitation because these have been shown to sometimes affect muscle activity [47,48]. The primary limitation of this study was the sample size; however, the sample size was consistent with numerous studies analyzing sEMG or psychosocial stress effects on the lower leg [15,16,17,25,26,27]. The sample was skewed heavily toward females (76.9%), which may make the results less representative of the general working population. Future studies should consider increased sample sizes to further support the findings of the current study. It is also considered a limitation that the GM and TA were not engaged in their postural roles for this study. The seated tasks may have reduced the likelihood of detecting stress-based muscular responses associated with postural control. Future studies should consider evaluating the muscles during activities such as standing, balance, gait, or other tasks where they are more active in postural control.
5. Conclusions
To the best of the authors’ knowledge, this is the first study analyzing the effects of psychosocial stress on sEMG signals in the lower body and, specifically, the lower leg. Additionally, it is believed this is the first study to analyze changes in sEMG signal frequency composition during psychosocial stress testing. In this study, the effects of psychosocial stress on sEMG signal amplitude and frequency of lower leg muscles were investigated. Because of the small sample size, the results of this study should be considered preliminary. Under the conditions tested, acute psychosocial stress induced by the TSST did not produce measurable or statistically meaningful changes in TA or GM sEMG amplitude or frequency during isometric fatiguing contractions. The TOST procedure was used to establish bioequivalence between all comparisons of mean amplitude and mean frequency before and after stress testing for both muscles. The results imply that the effects of psychosocial stress observed in upper-body muscles may not generalize directly to the lower leg. This research provides initial insights into how sEMG signals of the lower body of healthy young adults during isometric contractions are impacted by psychosocial stress as compared to the upper body and may serve as a foundation for future studies that set out to analyze the effects of psychosocial stress on the lower body.
Author Contributions
Conceptualization, S.J.E. and M.E.Z.; methodology, S.J.E. and M.E.Z.; software, S.J.E. and S.P.; validation, S.J.E., I.E.N.-U. and M.E.Z.; formal analysis, S.J.E. and S.P.; investigation, S.J.E.; resources, M.E.Z.; data curation, S.J.E.; writing—original draft preparation, S.J.E., I.E.N.-U. and M.E.Z.; writing—review and editing, S.J.E., S.P., I.E.N.-U. and M.E.Z.; visualization, S.J.E. and S.P.; supervision, M.E.Z.; project administration, I.E.N.-U. and M.E.Z. All authors have read and agreed to the published version of the manuscript.
Funding
This research received no external funding.
Institutional Review Board Statement
The study was conducted in accordance with the Declaration of Helsinki and approved by the Auburn University Institutional Review Board (protocol code: 23-619 MR 2312).
Informed Consent Statement
Informed consent was obtained from all subjects involved in the study.
Data Availability Statement
The datasets presented in this article are not readily available due to IRB restrictions. Requests to access the datasets should be directed to the corresponding author.
Acknowledgments
The authors kindly acknowledge Luca Insolia for his insights during the equivalence analysis process and guidance in the development of corresponding visualizations.
Conflicts of Interest
The authors declare no conflicts of interest.
Abbreviations
The following abbreviations are used in this manuscript:
| CI | Confidence interval |
| EMG | Electromyography |
| GM | Gastrocnemius medialis |
| MSD | Musculoskeletal disorder |
| MVC | Maximum voluntary contraction |
| ROC | Rate of change |
| sEMG | Surface electromyography |
| TA | Tibialis anterior |
| TOSTs | Two one-sided t-tests |
| TSST | Trier Social Stress Test |
| WARD | Wearable assistive robotic device |
References
- Alcan, V.; Zinnuroğlu, M. Current developments in surface electromyography. Turk. J. Med. Sci. Turk. Klin. 2023, 53, 1019–1031. [Google Scholar] [CrossRef] [Scilit] [PubMed]
- Haab, T.; Leinen, P.; Burkey, P. Role and effectiveness of surface EMG feedback in sports and orthopedic rehabilitation: A systematic review. Explor. Musculoskelet. Dis. 2024, 2, 391–407. [Google Scholar] [CrossRef] [Scilit]
- Desplenter, T.; Zhou, Y.; Edmonds, B.P.R.; Lidka, M.; Goldman, A.; Trejos, A.L. Rehabilitative and assistive wearable mechatronic upper-limb devices: A review. J. Rehabil. Assist. Technol. Eng. 2020, 7, 2055668320917870. [Google Scholar] [CrossRef] [Scilit] [PubMed]
- Lundberg, U.; Kadefors, R.; Melin, B.; Palmerud, G.; Hassmén, P.; Engström, M.; Elfsberg Dohns, I. Psychophysiological stress and EMG activity of the trapezius muscle. Int. J. Behav. Med. 1994, 1, 354–370. [Google Scholar] [CrossRef] [Scilit] [PubMed]
- Adams, R.; Nino, V. Work-Related Psychosocial Factors and Their Effects on Mental Workload Perception and Body Postures. Int. J. Environ. Res. Public Health 2024, 21, 876. [Google Scholar] [CrossRef] [Scilit] [PubMed]
- Hagg, G. Static work load and occupational myalgia—A new explanation model. In Electromyographical Kinesiology; Elsevier: Amsterdam, The Netherlands, 1991; pp. 141–144. [Google Scholar]
- Gallagher, S.; Barbe, M.F. The impaired healing hypothesis: A mechanism by which psychosocial stress and personal characteristics increase MSD risk? Ergonomics 2022, 65, 573–586. [Google Scholar] [CrossRef] [Scilit] [PubMed]
- Onigbogi, C.; Banerjee, S. Prevalence of psychosocial stress and its risk factors among health-care workers in Nigeria: A systematic review and meta-analysis. Niger. Med. J. 2019, 60, 238–244. [Google Scholar] [CrossRef] [Scilit] [PubMed]
- Azma Amin, N.; Nordin, R.; Kia Fatt, Q.; Noah, R.M.; Oxley, J. Relationship between Psychosocial Risk Factors and Work-Related Musculoskeletal Disorders among Public Hospital Nurses in Malaysia. Ann. Occup. Environ. Med. 2014, 26, 23. [Google Scholar] [CrossRef] [Scilit] [PubMed]
- Jacquier-Bret, J.; Gorce, P. Worldwide work-related musculoskeletal disorder prevalence among nurses: Systematic review and meta-analysis. Saf. Sci. 2025, 191, 106970. [Google Scholar] [CrossRef] [Scilit]
- Jacquier-Bret, J.; Gorce, P. Prevalence of Body Area Work-Related Musculoskeletal Disorders among Healthcare Professionals: A Systematic Review. Int. J. Environ. Res. Public Health 2023, 20, 841. [Google Scholar] [CrossRef] [Scilit] [PubMed]
- Tranaeus, U.; Martin, S.; Ivarsson, A. Psychosocial Risk Factors for Overuse Injuries in Competitive Athletes: A Mixed-Studies Systematic Review. Sports Med. 2022, 52, 773–788. [Google Scholar] [CrossRef] [Scilit] [PubMed]
- Ramlee, S.N.S.; Tamil Selvan, H.K.; Megat Mokhtar, M.A.; Rafiudin, N.M.; Nizam, K. Systematic review of risk factors contributing to musculoskeletal disorders (MSDs) and injuries in military personnel. Int. J. Educ. Psychol. Couns. 2025, 10, 868–885. [Google Scholar] [CrossRef] [Scilit]
- Scheer, C.; Kubowitsch, S.; Dendorfer, S.; Jansen, P. Happy Enough to Relax? How Positive and Negative Emotions Activate Different Muscular Regions in the Back—An Explorative Study. Front. Psychol. 2021, 12, 511746. [Google Scholar] [CrossRef] [Scilit] [PubMed]
- Ribot-Ciscar, E.; Rossi-Durand, C.; Roll, J. Increased muscle spindle sensitivity to movement during reinforcement manoeuvres in relaxed human subjects. J. Physiol. 2000, 523, 271–282. [Google Scholar] [CrossRef] [Scilit] [PubMed]
- Hjortskov, N.; Skotte, J.; Hye-Knudsen, C.; Fallentin, N. Sympathetic outflow enhances the stretch reflex response in the relaxed soleus muscle in humans. J. Appl. Physiol. 2005, 98, 1366–1370. [Google Scholar] [CrossRef] [Scilit] [PubMed]
- Macefield, V.G.; Sverrisdottir, Y.B.; Wallin, B.G. Resting discharge of human muscle spindles is not modulated by increases in sympathetic drive. J. Physiol. 2003, 551, 1005–1011. [Google Scholar] [CrossRef] [PubMed]
- Allen, A.P.; Kennedy, P.J.; Dockray, S.; Cryan, J.F.; Dinan, T.G.; Clarke, G. The Trier Social Stress Test: Principles and practice. Neurobiol. Stress 2017, 6, 113–126. [Google Scholar] [CrossRef] [Scilit] [PubMed]
- Waters, S.F.; West, T.V.; Mendes, W.B. Stress Contagion: Physiological Covariation Between Mothers and Infants. Psychol. Sci. 2014, 25, 934–942. [Google Scholar] [CrossRef] [Scilit] [PubMed]
- Engert, V.; Plessow, F.; Miller, R.; Kirschbaum, C.; Singer, T. Cortisol increase in empathic stress is modulated by emotional closeness and observation modality. Psychoneuroendocrinology 2014, 45, 192–201. [Google Scholar] [CrossRef] [Scilit] [PubMed]
- Buchanan, T.W.; Bagley, S.L.; Stansfield, R.B.; Preston, S.D. The empathic, physiological resonance of stress. Soc. Neurosci. 2012, 7, 191–201. [Google Scholar] [CrossRef] [Scilit] [PubMed]
- Seddon, J.A.; Rodriguez, V.J.; Provencher, Y.; Raftery-Helmer, J.; Hersh, J.; Labelle, P.R.; Thomassin, K. Meta-analysis of the effectiveness of the Trier Social Stress Test in eliciting physiological stress responses in children and adolescents. Psychoneuroendocrinology 2020, 116, 104582. [Google Scholar] [CrossRef] [Scilit] [PubMed]
- Helminen, E.C.; Morton, M.L.; Wang, Q.; Felver, J.C. Stress Reactivity to the Trier Social Stress Test in Traditional and Virtual Environments: A Meta-Analytic Comparison. Psychosom. Med. 2021, 83, 200–211. [Google Scholar] [CrossRef] [Scilit] [PubMed]
- Engert, V.; Linz, R.; Grant, J.A. Embodied stress: The physiological resonance of psychosocial stress. Psychoneuroendocrinology 2019, 105, 138–146. [Google Scholar] [CrossRef] [Scilit] [PubMed]
- Di Nardo, F.; Ghetti, G.; Fioretti, S. Assessment of the activation modalities of gastrocnemius lateralis and tibialis anterior during gait: A statistical analysis. J. Electromyogr. Kinesiol. 2013, 23, 1428–1433. [Google Scholar] [CrossRef] [Scilit] [PubMed]
- Suzuki, R.; Kanehisa, H.; Washino, S.; Watanabe, H.; Shinohara, M.; Yoshitake, Y. Reconstruction of net force fluctuations from surface EMGs of multiple muscles in steady isometric plantarflexion. Exp. Brain Res. 2021, 239, 601–612. [Google Scholar] [CrossRef] [Scilit] [PubMed]
- Hollville, E.; Rabita, G.; Guilhem, G.; Lecompte, J.; Nordez, A. Effects of surface properties on gastrocnemius medialis and vastus lateralis fascicle mechanics during maximal countermovement Jumping. Front. Physiol. 2020, 11, 917. [Google Scholar] [CrossRef] [Scilit] [PubMed]
- Anderson, E.A.; Gunnar Wallin, B.; Mark, A.L. Dissociation of Sympathetic Nerve Activity in Arm and Leg Muscle During Mental Stress. Hypertension 1987, 9, 114–119. [Google Scholar] [CrossRef] [Scilit] [PubMed]
- Peters, M. Footedness: Asymmetries in foot preference and skill and neuropsychological assessment of foot movement. Psychol. Bull. 1988, 103, 179–192. [Google Scholar] [CrossRef] [Scilit] [PubMed]
- Hermens, H.J.; Freriks, B.; Disselhorst-Klug, C.; Rau, G. Development of Recommendations for SEMG Sensors and Sensor Placement Procedures. J. Electromyogr. Kinesiol. 2000, 10, 361–374. [Google Scholar] [CrossRef] [Scilit] [PubMed]
- Lakens, D. Equivalence Tests: A Practical Primer for t Tests, Correlations, and Meta-Analyses. Soc. Psychol. Pers. Sci. 2017, 8, 355–362. [Google Scholar] [CrossRef] [Scilit] [PubMed]
- Phillips, K.F. Power of the two one-sided tests procedure in bioequivalence. J. Pharmacokinet. Biopharm. 1990, 18, 137–144. [Google Scholar] [CrossRef] [Scilit] [PubMed]
- Food and Drug Administration. Guidance for Industry: Statistical Approaches to Establishing Bioequivalence. 2001. Available online: https://www.fda.gov/media/163638/download (accessed on 18 August 2026).
- European Medicines Agency. Guideline on the Investigation of Bioequivalence; Technical Report CPMP/EWP/QWP/1401/98 Rev. 1/Corr.; European Medicines Agency: Amsterdam, The Netherlands, 2010.
- Boulaguiem, Y.; Insolia, L.; Couturier, D.L.; Guerrier, S. cTOST: Finite Sample Correction of the TOST in the Univariate Framework, version 1.1.0; The R Foundation for Statistical Computing: Vienna, Austria, 2024.
- Jönsson, P.; Wallergård, M.; Österberg, K.; Hansen, Å.M.; Johansson, G.; Karlson, B. Cardiovascular and cortisol reactivity and habituation to a virtual reality version of the Trier Social Stress Test: A pilot study. Psychoneuroendocrinology 2010, 35, 1397–1403. [Google Scholar] [CrossRef] [Scilit] [PubMed]
- Marker, R.J.; Campeau, S.; Maluf, K.S. Psychosocial stress alters the strength of reticulospinal input to the human upper trapezius. J. Neurophysiol. 2017, 117, 457–466. [Google Scholar] [CrossRef] [Scilit] [PubMed]
- Rahman, K.A.; Azaman, A.; Latip, H.F.M.; Dzahir, M.A.M.; Balakrishnan, M. Comparison of tibialis anterior and gastrocnemius muscles activation on balance training devices and hoverboard. Malays. J. Fundam. Appl. Sci. Spec. Issue Med. Device Technol. 2017, 13, 495–500. [Google Scholar] [CrossRef] [Scilit]
- Granata, K.P.; Marras, W.S. An EMG-Assisted Model of Trunk Loading during Free-Dynamic Lifting. J. Biomech. 1995, 28, 1309–1317. [Google Scholar] [CrossRef] [Scilit] [PubMed]
- Fleischer, C.; Hommel, G. A human-exoskeleton interface utilizing electromyography. IEEE Trans. Robot. 2008, 24, 872–882. [Google Scholar] [CrossRef] [Scilit]
- Hunter, H.H.; Sorbie, G.G.; Grace, F.M.; Gu, Y.; Lam, W.K.; Baker, J.S.; Dutheil, F.; Dias, T.; Ugbolue, U.C. An electromyographic assessment pilot study on the reliability of the forearm muscles during multi-planar maximum voluntary contraction grip and wrist articulation in young males. Technol. Health Care 2022, 30, 713–724. [Google Scholar] [CrossRef] [Scilit] [PubMed]
- Marras, W.S.; Lavender, S.A.; Ferguson, S.A.; Splittstoesser, R.E.; Yang, G.; Schabo, P. Instrumentation for measuring dynamic spinal load moment exposures in the workplace. J. Electromyogr. Kinesiol. 2010, 20, 1–9. [Google Scholar] [CrossRef] [Scilit] [PubMed]
- Zheng, M.; Crouch, M.S.; Eggleston, M.S. Surface Electromyography as a Natural Human–Machine Interface: A Review. IEEE Sens. J. 2022, 22, 9198–9214. [Google Scholar] [CrossRef] [Scilit]
- Bongers, P.M.; Kremer, A.M.; Laak, J.t. Are psychosocial factors, risk factors for symptoms and signs of the shoulder, elbow, or hand/wrist?: A review of the epidemiological literature. Am. J. Ind. Med. 2002, 41, 315–342. [Google Scholar] [CrossRef] [Scilit] [PubMed]
- da Costa, B.R.; Vieira, E.R. Risk factors for work-related musculoskeletal disorders: A systematic review of recent longitudinal studies. Am. J. Ind. Med. 2010, 53, 285–323. [Google Scholar] [CrossRef] [Scilit] [PubMed]
- Nail-Ulloa, I.; Zabala, M.; Pool, N.; Sesek, R.; Thiese, M.; Sesek, R.; Schall, M.C., Jr.; Gallagher, S. A fatigue failure framework for the assessment of highly variable low back loading using inertial motion capture—A case study. Ergonomics 2025, 69, 292–308. [Google Scholar] [CrossRef] [Scilit] [PubMed]
- Hellara, H.; Barioul, R.; Sahnoun, S.; Fakhfakh, A.; Kanoun, O. Feasibility study of detecting the impact of caffeine and diet on hand gestures classification by sEMG signals. In 2023 International Workshop on Impedance Spectroscopy; IEEE: New York, NY, USA, 2023; pp. 36–41. [Google Scholar] [CrossRef] [Scilit]
- Goncalves, A.D.; Teodosio, C.; Pezarat-Correia, P.; Vila-Chã, C.; Mendonca, G.V. Effects of acute sleep deprivation on H reflex and V wave. J. Sleep Res. 2021, 30, e13118. [Google Scholar] [CrossRef] [Scilit] [PubMed]

Disclaimer/Publisher’s Note: The statements, opinions and data contained in all publications are solely those of the individual author(s) and contributor(s) and not of MDPI and/or the editor(s). MDPI and/or the editor(s) disclaim responsibility for any injury to people or property resulting from any ideas, methods, instructions or products referred to in the content. |
© 2026 by the authors. Licensee MDPI, Basel, Switzerland. This article is an open access article distributed under the terms and conditions of the Creative Commons Attribution (CC BY) license.