Perspective

Human Mobility and Social Inequality: Limitations of Mobility Data and Future Directions

1
School of Traffic and Transportation, Beijing Jiaotong University, Beijing 100044, China
2
School of Systems Science, Beijing Jiaotong University, Beijing 100044, China
3
Faculty of Geography, Lomonosov Moscow State University, Moscow 119991, Russia
4
School of Traffic and Transportation, Lanzhou Jiaotong University, Lanzhou 730070, China
5
Hebei Key Laboratory of Future Urban Intelligent Traffic Management, Beijing Jiaotong University, Beijing 100044, China
6
Key Laboratory of Transport Industry of Big Data Application Technologies for Comprehensive Transport, Beijing Jiaotong University, Beijing 100044, China
*
Authors to whom correspondence should be addressed.
Complexities 2026, 2(2), 11; https://doi.org/10.3390/complexities2020011
Submission received: 19 January 2026 / Revised: 24 March 2026 / Accepted: 10 April 2026 / Published: 13 April 2026

Abstract

Human mobility is a fundamental determinant of urban spatial and social organization, profoundly influencing patterns of social interaction, integration, and inequality. However, prevailing research is constrained by mobility datasets that are often non-representative, reliant on static spatial proxies, and incapable of distinguishing physical co-presence from meaningful social interaction. These limitations impede a mechanistic understanding of how mobility drives core urban social phenomena such as segregation, disparity, and inequity. This perspective critically examines these empirical and theoretical blind spots, framing them around the interconnected dynamics of social mixing, segregation, disparity, inequality, and inequity. We then delineate a research agenda to transcend these limitations, focused on (1) leveraging AI and data fusion to overcome representativeness and validation bottlenecks; (2) incorporating longitudinal dynamics through deep learning models; (3) developing contextualized models of social interactions that move beyond simple co-presence; and (4) harnessing generative models to synthesize realistic mobility flows in data-scarce contexts. We argue that advancements in computational social science are essential to forge a more accurate, dynamic, and equitable understanding of human mobility’s role in shaping social inequality.

1. Introduction

Human mobility provides a fundamental lens for understanding the spatial dynamics of urban life, serving as a critical conduit connecting individuals to urban opportunities and a constitutive force shaping patterns of access, social encounters and, ultimately, equity. As individuals navigate the city, their trajectories are both an agent and an outcome of the built environment and underlying social structures. It is through this recursive relationship that mobility studies have become indispensable for interrogating core urban challenges, from spatial justice and opportunity distribution to social cohesion.
A growing body of research leverages large-scale mobility data to probe critical dimensions of urban social life. Analyses of segregation and social mixing through mobility networks have revealed, for instance, that larger urban areas can exhibit heightened mobility-based segregation even in the absence of strong residential divides [1]. Beyond spatial separation, mobility patterns are increasingly employed to quantify disparities in access to essential resources, including employment, healthcare, and green space, thereby exposing the highly uneven urban experiences of different socioeconomic groups [2,3]. Further studies have linked movement trajectories to socioeconomic attributes, elucidating how mobility constraints both reflect and reinforce broader structural disadvantages [4]. Collectively, this work underscores the power of mobility data for unpacking the subtle mechanisms through which social stratification is manifested and perpetuated spatially.
Despite these advances, the field contends with persistent empirical and methodological challenges. Widely used data sources, such as mobile phone records, social media check-ins, and app-based geolocation traces, are often hampered by biased population representativeness, a heavy reliance on proxy measures for socioeconomic attributes, and a general lack of ground-truth validation [5]. Furthermore, many studies adopt a static, cross-sectional view, failing to capture the temporally extended dynamics of mobility trajectories [6,7]. This limitation obstructs our understanding of how daily movements help build a picture of long-term behavioral patterns, life-course transitions, and cumulative exposure to spatial disadvantage. A particularly significant gap lies in the conflation of spatial co-presence with meaningful social interaction [8]. Mobility traces typically record proximity in space and time without the contextual data needed to distinguish, for example, between the passive co-location of strangers on a street and the engaged collaboration of colleagues in a workplace [4]. Consequently, studies risk overestimating the extent of genuine social mixing and integration.
To propel the field forward, this perspective outlines key conceptual and methodological frontiers. We first argue for a renewed focus on overcoming data representativeness and validation bottlenecks. We then advocate for the integration of temporal dynamics to capture the evolution of mobility behavior and its social implications. A third priority is to bridge the critical gap between observed co-presence and actual social interaction. Finally, we highlight the transformative potential of deep learning approaches, such as generative models, which can synthesize realistic mobility flows from geo-spatial features like land use and transport infrastructure [9]. These frameworks offer a powerful pathway to model segregation and inequality in data-scarce contexts, ultimately strengthening the field’s capacity to address fundamental questions of urban social justice.

2. Socio-Spatial Structures and Inequalities in Human Mobility

2.1. Social Mixing in Urban Mobility

Social mixing, the routine interaction among individuals from different socioeconomic or demographic groups, is widely considered essential for fostering social cohesion and inclusive urban life. Yet, opportunities for such interactions are far from evenly distributed. As illustrated in Figure 1, even within a single interaction network, individuals can experience vastly different levels of diversity in their daily contacts. While some interact predominantly within a homogeneous demographic circle, others engage with a more heterogeneous set of individuals. These disparities highlight that social mixing is not merely a function of population composition, but is fundamentally shaped by the spatial and temporal structures that govern encounter patterns in urban space.
Empirical evidence from major U.S. cities reveals a pronounced tendency for individuals to frequent places aligned with their own socioeconomic status, with occasional upward-oriented visits occurring more frequently than downward ones [10]. These asymmetric contact patterns, particularly evident in cities with marked residential and racial segregation, indicate that everyday mobility often reinforces existing social boundaries rather than bridging them. The COVID-19 pandemic further attenuated cross-group contact; even after aggregate mobility volumes recovered, the diversity of encounters, particularly across income lines, remained significantly depressed [11,12]. This sustained decline resulted not only from public health restrictions but also from enduring behavioral shifts, including reduced spatial exploration and heightened preference for familiar locales. Notably, public amenities such as parks, libraries, and healthcare facilities continued to function as crucial sites for diverse encounters, attracting visitors across the income spectrum and highlighting their role as shared urban spaces, though their efficacy in fostering meaningful interactions remains contingent on activity type and accessibility [13].
In summary, social mixing does not automatically arise from mere co-presence. Its emergence depends on where people go, who is present in those spaces, and how those environments are designed. Without deliberate intervention, cities risk reinforcing separation in daily life, thereby entrenching the foundations of broader segregation and inequality.

2.2. Segregation and Disparity in Urban Mobility

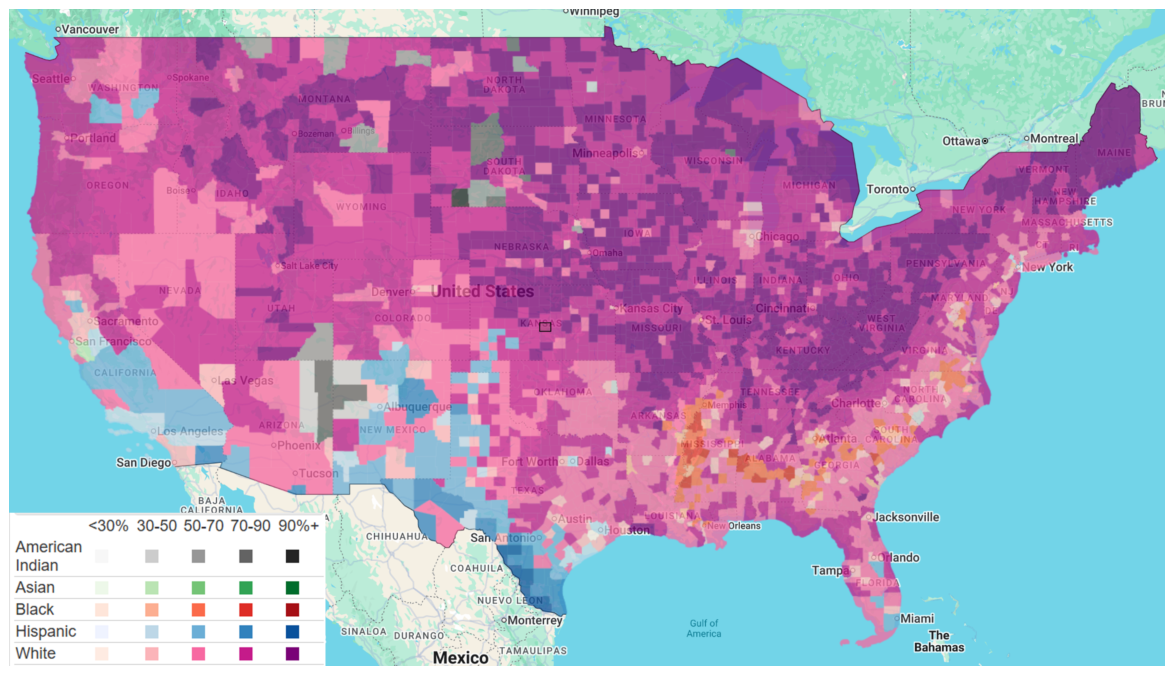
Human mobility exhibits systematic variation across urban populations, shaped by structural inequalities, social stratification, and the spatial configuration of cities. A key mechanism underlying these patterns is socio-spatial segregation: the tendency for social, economic, or demographic groups to become geographically separated in ways that constrain shared access to places, services, and opportunities [14]. This separation not only partitions residential space but also configures the everyday environments through which individuals move, influencing both the diversity of encounters and the range of destinations accessible to different communities. Figure 2 illustrates this spatial imprint across U.S. counties; areas where a single racial group dominates (indicated by the darkest shades) reflect highly concentrated demographic patterns, while lighter or more varied shading signifies greater mixing. These uneven demographic landscapes demonstrate how segregation structures the very contexts of mobility, reinforcing unequal exposure to resources and circumscribing opportunity horizons.
An expanding body of research demonstrates that urban segregation extends beyond residential patterns and into the fabric of daily life. Analyses of fine-grained mobile phone data reveal that individuals from different socioeconomic or racial groups tend to visit distinct set of places, even when residing in close proximity. This produces temporal and spatial separation in urban routines, reinforcing social distance in subtle yet persistent ways. A spatiotemporal framework further shows that individuals experience segregation not only where they live, but throughout their daily travel, particularly across activity spaces such as workplaces, leisure venues, and service sites [15]. This dynamic segregation generates fragmented mobility ecologies in which cross-group exposure is systematically constrained.
Evidence from large-scale mobility networks corroborates these findings. An analysis of U.S. cities found that as urban population size increases, mobility networks become more segregated, with individuals increasingly confined within socioeconomically homogeneous clusters, thereby reducing the potential for inter-group encounters [1]. This positive scaling of mobility segregation with city size suggests that urban growth does not inherently promote social integration and may, in fact, exacerbate separation. Importantly, segregation is shaped not only by behavioral preferences but also by contextual constraints. A study linking movement trajectories to income segregation shows that residents of disadvantaged neighborhoods often remain within low-income activity spaces due to limited destination choice and inadequate transport infrastructure [4]. This form of mobility confinement amplifies spatial inequality by systematically excluding low-income populations from spaces where economic and social opportunities are concentrated.
Disparity, by contrast, refers to unequal conditions experienced by different groups, particularly when such differences are perceived as unjust. In human mobility, disparities manifest as group-level variations in the capacity to access opportunities, respond to disruptions, or adapt to external shocks. These uneven adaptive capacities became especially evident during the COVID-19 pandemic. Multiple studies demonstrated that marginalized populations faced disproportionately severe mobility restrictions, often due to occupational exposure, limited transportation options, and heightened health vulnerabilities [16,17,18]. In the U.S., racial and ethnic minorities exhibited significantly lower mobility flexibility, leading to more constrained activity spaces and elevated health risks [16]. Similarly, neighborhood-level inequalities in transit access reinforced these patterns, as disadvantaged communities lacked viable alternatives for adapting their routines [17]. Such socioeconomic disparities in mobility adaptation emerged as a key mechanism through which the pandemic exacerbated pre-existing inequalities, and this was observed across contexts ranging from North Carolina, where low-income groups contracted their activity spaces more than affluent counterparts [19], to cities across Latin America and Africa, where informal laborers and low-income residents experienced reduced access to urban amenities [18]. Collectively, these studies reveal a multi-layered geography of inequality: segregation shapes the structure of urban movement, while disparities determine how shocks are unevenly absorbed across the urban fabric.

2.3. Inequality and Inequity in Urban Mobility

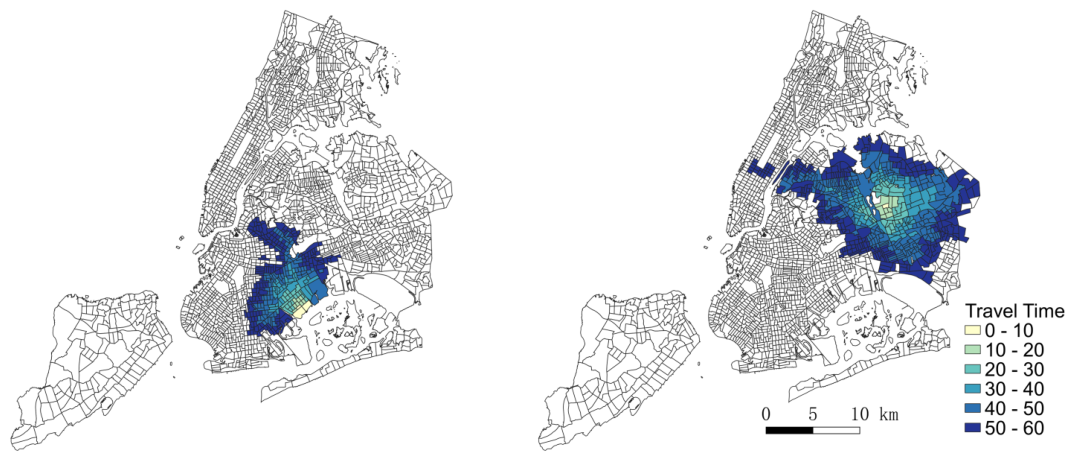
While segregation and disparity capture structural fragmentation and differential adaptive capacity, a complete understanding requires us to examine how mobility variations produce unequal experiences and outcomes. Inequality is evident in the uneven accessibility of opportunities across neighborhoods, as illustrated in Figure 3. The Figure contrasts census tracts where residents can reach a wide range of destinations within 60 min with those where access is highly restricted, revealing stark differences in the practical reach of urban resources. Inequity, conversely, introduces a normative dimension: these differences constitute inequity when they arise from systemic disadvantages or historical barriers that unfairly limit certain populations’ access to mobility and opportunity.
Recent studies leveraging fine-grained mobility data have developed frameworks to quantify experienced inequality: the unequal urban experience embedded in individual daily trajectories. One approach conceptualizes mobility as a temporal bipartite network linking people and places, with social mixing, place access, and spontaneous adaptability serving as measurable axes of inequality [20]. This perspective reframes mobility not only as a channel for resources but as a reflection of embedded structural asymmetries. Empirical findings across urban systems reveal pervasive spatial and modal inequalities in mobility access. In U.S. cities, race-based accessibility gaps persist in transit-oriented access to jobs, housing, and essential services [21], systematically constraining the activity spaces of minority communities and increasing unemployment risk. Similar patterns are observed in Chinese cities, where vehicle users access larger and more efficient activity spaces than public transit users, revealing modal hierarchies that encode social exclusion [22]. Even access to urban green space, a key proxy for well-being, exhibits stark inequality: over two-thirds of Chinese cities report a Gini coefficient above 0.6 for daily exposure, with variation driven by supply constraints and urban form [23].
However, inequality metrics alone are insufficient. When mobility limitations stem from constrained choice, misaligned infrastructure, or systemic vulnerability rather than mere preference, they reflect inequity. During Hurricane Harvey, for instance, high-resolution mobility data showed that lower-income and minority communities were significantly less likely to evacuate despite facing comparable physical threats [7]. Their constrained responses, shaped by differential access, risk perception, and embedded vulnerability, highlight structural inequity rather than individual failure. Similarly, the “neighborhood effect averaging problem” (NEAP) in green-space exposure demonstrates how aggregate-level assessments mask the lived disparities experienced by specific groups, such as women, older adults, and low-mobility individuals [24]. Inequity also manifests along horizontal (spatial) and vertical (interpersonal) dimensions. In Shenzhen, mobility data reveal that while travel behavior partially mitigates spatial (horizontal) inequality, profound interpersonal (vertical) inequities persist, particularly among residents of underserved areas [25]. These findings challenge conventional planning metrics and emphasize the need for individualized measures that account for both physical mobility and structural constraints.

3. Future Directions

3.1. Addressing Data Representativeness and Sampling Bias

The proliferation of geolocation data has revolutionized human mobility research, yet its utility is constrained by fundamental limitations in population coverage and demographic resolution. Common datasets, such as mobile phone records, app-based check-ins, and GPS traces, are often passively collected, resulting in substantial sampling biases that systematically overrepresent younger, wealthier, and more technologically connected demographics while underrepresenting vulnerable groups, such as children, the elderly, low-income households, and unsheltered populations [1,4,10,13,26]. Consequently, observed mobility patterns may reflect a selective subset of population, skewing our understanding of urban social dynamics. This is not merely a statistical limitation, but also an equity concern, because populations missing from digital traces may also become less visible in the empirical basis used to inform urban analysis, transport planning, and policy intervention.
A related challenge is the heavy reliance on spatial proxies for inferring socioeconomic attributes, such as imputing income from home location at the census block level. While a practical necessity under data anonymization protocols, this approach risks ecological fallacies and obscures significant intra-group heterogeneity [8,16,18,19,27]. Assuming uniformity within geographic units can lead to biased assessments of segregation and access inequality. Furthermore, these data often fail to capture the roles individuals play at visited locations (e.g., service worker versus customer) or the distinct mobility patterns of transient or informally employed populations, such as migrants and gig-economy workers [20,28,29]. The absence of ground-truth validation for inferred attributes remains a critical bottleneck, preventing robust assessment of methodological accuracy and limiting the policy relevance of findings, particularly for interventions targeting marginalized communities [6,23,25]. As a result, data-driven analyses may underestimate the mobility constraints, service dependence, and accessibility barriers faced by disadvantaged groups, thereby unintentionally reproducing existing inequalities.
Future research should move beyond simply increasing data volume or improving predictive accuracy and instead directly confront the structural underrepresentation of vulnerable populations in mobility datasets. One important direction is to integrate diverse data sources, such as mobile phone records, travel surveys, and census microdata, through data fusion techniques, thereby mitigating sampling bias and enhancing demographic representativeness. More critically, the application of advanced imputation and representation learning models offers a pathway to move beyond crude spatial proxies. Deep learning architectures can infer individual-level attributes from rich, multi-modal behavioral traces while accounting for uncertainty, thereby capturing the heterogeneity that aggregate proxies miss. Finally, fostering transparent collaborations between data providers, researchers, and communities is essential to create benchmark datasets with known socioeconomic ground-truths, which are indispensable for training and validating these next-generation models.

3.2. Incorporating Temporality and Longitudinal Dynamics

Research on the social implications of human mobility remains dominated by cross-sectional analyses, capturing brief temporal windows that obscure the dynamic nature of segregation, disparity, and access. While these snapshots reveal average behavioral patterns, they fail to capture how mobility evolves across days, weeks, seasons, or years, variations that critically shape urban experience, especially during disruptions [22,30,31].
Many studies focus on short-term, static representations of movement. Pandemic research, for instance, frequently analyzed initial mobility shocks without tracking the long-term evolution of neighborhood isolation or adaptive strategies [30,31]. Similarly, disaster displacement studies often neglect the long-term social sorting and recovery trajectories that unfold over years [7,26]. Furthermore, disparities in access are often temporally specific; constraints faced by marginalized groups during late-night or early-morning hours are masked by daily-averaged metrics [8,17]. Capturing these intra-day and seasonal rhythms requires data with finer temporal granularity and analytical models capable of decoding complex time-series patterns [22].
To overcome these limitations, the field must embrace longitudinal data analytics. This involves leveraging long-term mobile phone records linked with administrative data and panel surveys to uncover the life-course dynamics of segregation [24,32]. The application of sophisticated time-series analysis, recurrent neural networks (RNNs), and transformer models can disentangle transient shocks from persistent structural inequalities, revealing how disadvantage accumulates over time [22]. While longitudinal data introduces ethical concerns and practical challenges related to privacy and attrition, mastering temporality is crucial to understand how inequality is not only distributed across space, but dynamically reproduced through time [6].

3.3. Advancing from Co-Presence Metrics to Contextualized Models of Social Interaction

Current research on human mobility and social encounters largely relies on spatiotemporal co-presence—typically defined as individuals being within a certain distance (e.g., 50 m) for a minimal duration (e.g., 5 min)—as a proxy for social interaction [1,11,13,15]. While convenient, this approach captures only the potential for contact and neglects the actual occurrence, purpose, and qualitative nature of interactions. Most studies operationalize encounters purely as proximity events, without considering the social or functional context in which they occur. Consequently, silent co-location in a café is treated as equivalent to a purposeful conversation between colleagues, potentially overestimating meaningful social mixing and obscuring micro-segregation patterns within shared spaces [8,11,13,15].
Future research should explore context in both temporal and spatial dimensions. Temporally, the timing, duration, and frequency of encounters can help distinguish transient co-presence from sustained engagement. Spatially, the semantic meaning of locations—such as workplaces, leisure venues, or caregiving spaces—can help differentiate socially purposeful interactions from incidental co-location. Moreover, social relationships can be inferred from spatiotemporal mobility patterns [27]. Integrating such relationship-aware insights with auxiliary data streams, including social media activity, communication logs, bluetooth sensing, and points of interest (POI) semantics, can enrich the understanding of interaction intent and heterogeneity [1,8].
Finally, conventional thresholds for defining encounters (e.g., 5 min within 50 m) may be insufficiently precise across contexts. Future studies could investigate dynamic, context-aware criteria that account for location type, relationship strength, and interaction modality, potentially improving the accuracy of social mixing and segregation assessments. For example, brief proximity in a crowded transit hub may have different social implications than the same duration in a private office. By explicitly modeling such variations, researchers can move toward a nuanced, semantically informed framework that captures not only who meets whom, but also under what conditions and with what social significance.

3.4. Generating Realistic Mobility Flows for Data-Scarce Regions Using Deep Learning

Recent advances in deep generative and representation learning are pioneering new paradigms for simulating realistic human mobility, particularly in data-scarce contexts. Models like Deep Gravity exemplify this shift, integrating multisource geo-spatial features, land use, transport networks, accessibility metrics, within a neural framework capable of learning complex, nonlinear drivers of interregional flow. Demonstrating strong geographical generalization, such models can generate credible mobility flow estimates even in the absence of historical flow data, offering a scalable solution for global mobility modeling [9].
Building on this, graph-based architectures like Graph Convolutional Networks (GCNs) and Graph Attention Networks (GATs) now capture both spatial proximity and functional connectivity, significantly enhancing the prediction of commuting and intercity flows [33,34]. These models not only boost accuracy but also, through attention mechanisms, improve interpretability by revealing the differential impact of economic, infrastructural, and cyber-relational factors on movement [35].
The frontier is being pushed further by generative deep learning. Generative Adversarial Networks (GANs) and hybrid attention frameworks enable the synthesis of privacy-preserving, yet behaviorally realistic, trajectory datasets [36,37]. Emerging approaches embed fairness constraints directly into model objectives, as seen in FairMobi-Net, ensuring generated flows reflect social inclusivity across diverse regions [38]. Meanwhile, physics-informed neural network (PINNs) incorporate mechanistic priors (e.g., diffusion principles), striking a balance between data-driven performance and theoretical interpretability [39].
As these generative approaches mature, recent work on synthetic trajectory and mobility network generation has increasingly emphasized the importance of systematic evaluation and governance frameworks. The comprehensive survey on privacy-preserving trajectory synthesis underscores that synthetic data require multi-level validation beyond aggregate similarity, particularly when used for substantive inference [40]. Building on this, we highlight three complementary controls. First, fidelity validation should assess realism across spatial and temporal scales by comparing synthetic outputs against held-out regions or time periods and benchmarking OD, route, and temporal distributions against established baselines, as suggested in generative mobility network research [41]. Second, failure-mode monitoring is necessary to detect insufficient diversity or structural distortion; trajectory-generation models such as ST-TrajGAN and TRC-TrajGAIL demonstrate strong realism but also illustrate the dependence of outputs on training data and objective design, implying the need for coverage diagnostics and robustness checks in alternative conditioning settings [42,43]. Third, privacy and misuse safeguards remain essential, since synthetic data do not automatically eliminate disclosure risks; memorization and linkage-style auditing procedures are, therefore, recommended prior to release or policy use [40]. Under such controls, synthetic mobility data should be interpreted as model-based approximations rather than empirical substitutes, particularly in studies of segregation and spatial inequality.
Looking ahead, the integration of large generative and foundation models, including multi-modal graph transformers and large language models with spatial reasoning capabilities, heralds the potential for zero-shot mobility generation. Such models could simulate realistic population movements conditioned solely on textual or contextual descriptions of a region, potentially reducing reliance on direct data collection in data-scarce settings. Collectively, these advances are forging a new generation of generalizable, equitable, and interpretable mobility models, capable of bridging the empirical data divide and deepening our understanding of segregation and spatial inequality on a global scale.

4. Conclusions

This perspective has articulated a critical research agenda for understanding human mobility-induced social inequality, focusing on the interconnected phenomena of social mixing, segregation, disparity, inequality, and inequity. We have highlighted how persistent challenges, including non-representative data, static analytical frameworks, and the conflation of spatial proximity with social interaction, have constrained the field’s explanatory power.
The path forward is inextricably linked to computational and methodological innovation. The integration of diverse data streams, powered by AI-driven fusion techniques, is essential for correct sampling bias and to represent the full spectrum of urban populations. The application of deep learning models for longitudinal analysis will unlock a dynamic understanding of how inequalities form and persist over time. Furthermore, moving beyond simple co-presence metrics requires rich, contextualized models of social interaction, achievable through graph neural networks and semantic analysis.
Perhaps most transformative is the potential of deep generative models to synthesize realistic mobility flows in data-scarce environments. By learning from geo-spatial features rather than relying on historical traces, these models can illuminate segregation and inequality in contexts previously invisible to research. Embracing this new toolkit—centered on AI, deep learning, and big data—will not only expand the scope of human mobility research but also sharpen its capacity to inform policies that foster more equitable and just cities.

Author Contributions

X.L. and P.Z. Data curation, Formal analysis, Investigation, Methodology, Visualization, Writing—original draft, Writing—review and editing. P.L.K., A.G.M. and C.Z. Writing—review and editing. W.N. and L.G. Conceptualization, Data curation, Formal analysis, Funding acquisition, Investigation, Methodology, Project administration, Supervision, Validation, Writing—original draft, Writing—review and editing. All authors have read and agreed to the published version of the manuscript.

Funding

This research was funded by the National Natural Science Foundation of China (72242102 and 72288101). W.N. acknowledges support from the Scientific Research Foundation of Beijing Jiaotong University (Grant No. 2025XKBH003).

Data Availability Statement

No new data were created or analyzed in this study. Data sharing is not applicable to this article.

Conflicts of Interest

The authors declare no conflicts of interest.

References

  1. Nilforoshan, H.; Looi, W.; Pierson, E.; Villanueva, B.; Fishman, N.; Chen, Y.; Sholar, J.; Redbird, B.; Grusky, D.; Leskovec, J. Human mobility networks reveal increased segregation in large cities. Nature 2023, 624, 586–592. [Google Scholar] [CrossRef] [Scilit] [PubMed]
  2. Bundervoet, T.; Dávalos, M.E.; Garcia, N. The short-term impacts of COVID-19 on households in developing countries: An overview based on a harmonized dataset of high-frequency surveys. World Dev. 2022, 153, 105844. [Google Scholar] [CrossRef] [Scilit]
  3. Bassolas, A.; Sousa, S.; Nicosia, V. Diffusion segregation and the disproportionate incidence of COVID-19 in African American communities. J. R. Soc. Interface 2021, 18, 20200961. [Google Scholar] [CrossRef] [Scilit]
  4. Moro, E.; Calacci, D.; Dong, X.; Pentland, A. Mobility patterns are associated with experienced income segregation in large US cities. Nat. Commun. 2021, 12, 4633. [Google Scholar] [CrossRef] [Scilit]
  5. Liao, Y.; Gil, J.; Yeh, S.; Pereira, R.H.; Alessandretti, L. Socio-spatial segregation and human mobility: A review of empirical evidence. Comput. Environ. Urban Syst. 2025, 117, 102250. [Google Scholar] [CrossRef] [Scilit]
  6. Liu, Z.; Zhao, P.; Liu, Q.; He, Z.; Kang, T. Uncovering spatial and social gaps in rural mobility via mobile phone big data. Sci. Rep. 2023, 13, 6469. [Google Scholar] [CrossRef] [Scilit]
  7. Deng, H.; Aldrich, D.P.; Danziger, M.M.; Gao, J.; Phillips, N.E.; Cornelius, S.P.; Wang, Q.R. High-resolution human mobility data reveal race and wealth disparities in disaster evacuation patterns. Humanit. Soc. Sci. Commun. 2021, 8, 144. [Google Scholar] [CrossRef] [Scilit]
  8. Zhang, Y.; Cheng, S.; Li, Z.; Jiang, W. Human mobility patterns are associated with experienced partisan segregation in US metropolitan areas. Sci. Rep. 2023, 13, 9768. [Google Scholar] [CrossRef] [Scilit]
  9. Simini, F.; Barlacchi, G.; Luca, M.; Pappalardo, L. A Deep Gravity model for mobility flows generation. Nat. Commun. 2021, 12, 6576. [Google Scholar] [CrossRef] [Scilit] [PubMed]
  10. Hilman, R.M.; Iñiguez, G.; Karsai, M. Socioeconomic biases in urban mixing patterns of US metropolitan areas. EPJ Data Sci. 2022, 11, 32. [Google Scholar] [CrossRef] [Scilit]
  11. Yabe, T.; Bueno, B.G.B.; Dong, X.; Pentland, A.; Moro, E. Behavioral changes during the COVID-19 pandemic decreased income diversity of urban encounters. Nat. Commun. 2023, 14, 2310. [Google Scholar] [CrossRef] [Scilit]
  12. Roy, S.; Biswas, P.; Ghosh, P. Quantifying mobility and mixing propensity in the spatiotemporal context of a pandemic spread. IEEE Trans. Emerg. Top. Comput. Intell. 2021, 5, 321–331. [Google Scholar] [CrossRef] [Scilit]
  13. Heine, C.; Abbiasov, T.; Santi, P.; Ratti, C. The role of urban amenities in facilitating social mixing: Evidence from Stockholm. Landsc. Urban Plan. 2025, 254, 105250. [Google Scholar] [CrossRef] [Scilit]
  14. Nie, W.P.; Ding, T.R.; Yan, X.Y.; Zhou, T.; Gao, Z.Y. Deconstructing Mobility Segregation: A Network Analysis of Racialized Flows in Pandemic-Era NYC. arXiv 2025, arXiv:2508.17072. [Google Scholar] [CrossRef] [Scilit]
  15. Park, Y.M.; Kwan, M.P. Beyond residential segregation: A spatiotemporal approach to examining multi-contextual segregation. Comput. Environ. Urban Syst. 2018, 71, 98–108. [Google Scholar] [CrossRef] [Scilit]
  16. Hu, S.; Xiong, C.; Younes, H.; Yang, M.; Darzi, A.; Jin, Z.C. Examining spatiotemporal evolution of racial/ethnic disparities in human mobility and COVID-19 health outcomes: Evidence from the contiguous United States. Sustain. Cities Soc. 2022, 76, 103506. [Google Scholar] [CrossRef] [Scilit] [PubMed]
  17. Cai, J.; Kwan, M.P. Revealing the complex dynamics of social disparities in personal transit availability considering human mobility and neighborhood effect averaging. Ann. Am. Assoc. Geogr. 2025, 115, 620–639. [Google Scholar] [CrossRef] [Scilit]
  18. Lucchini, L.; Langle-Chimal, O.D.; Candeago, L.; Melito, L.; Chunet, A.; Montfort, A.; Lepri, B.; Lozano-Gracia, N.; Fraiberger, S.P. Socioeconomic disparities in mobility behavior during the COVID-19 pandemic in developing countries. EPJ Data Sci. 2025, 14, 25. [Google Scholar] [CrossRef] [Scilit] [PubMed]
  19. Wang, J.; Kaza, N.; McDonald, N.C.; Khanal, K. Socio-economic disparities in activity-travel behavior adaptation during the COVID-19 pandemic in North Carolina. Transp. Policy 2022, 125, 70–78. [Google Scholar] [CrossRef] [Scilit]
  20. Xu, F.; Wang, Q.; Moro, E.; Chen, L.; Salazar Miranda, A.; González, M.C.; Tizzoni, M.; Song, C.; Ratti, C.; Bettencourt, L.; et al. Using human mobility data to quantify experienced urban inequalities. Nat. Hum. Behav. 2025, 9, 654–664. [Google Scholar] [CrossRef] [Scilit]
  21. Li, Y.; Zhang, Y.; Xu, F.; González, M.C. Quantifying systemic racial accessibility inequality in urban transit network. Preprint 2023. [Google Scholar] [CrossRef] [Scilit]
  22. Gao, Q.L.; Yue, Y.; Zhong, C.; Cao, J.; Tu, W.; Li, Q.Q. Revealing transport inequality from an activity space perspective: A study based on human mobility data. Cities 2022, 131, 104036. [Google Scholar] [CrossRef] [Scilit]
  23. Song, Y.; Chen, B.; Ho, H.C.; Kwan, M.P.; Liu, D.; Wang, F.; Wang, J.; Cai, J.; Li, X.; Xu, Y.; et al. Observed inequality in urban greenspace exposure in China. Environ. Int. 2021, 156, 106778. [Google Scholar] [CrossRef] [Scilit]
  24. Wang, J.; Kwan, M.P.; Xiu, G.; Peng, X.; Liu, Y. Investigating the neighborhood effect averaging problem (NEAP) in greenspace exposure: A study in Beijing. Landsc. Urban Plan. 2024, 243, 104970. [Google Scholar] [CrossRef] [Scilit]
  25. Zhang, J.; Chen, B.Y.; Fu, C.; Yuan, Z.; Wang, D. Uncovering horizontal and vertical inequities of individual accessibility using mobile phone data. Transp. Res. Part D Transp. Environ. 2025, 143, 104755. [Google Scholar] [CrossRef] [Scilit]
  26. Wei, Z.; Mukherjee, S. Examining income segregation within activity spaces under natural disaster using dynamic mobility network. Sustain. Cities Soc. 2023, 91, 104408. [Google Scholar] [CrossRef] [Scilit]
  27. Wang, X.; Pei, T.; Song, C.; Chen, J.; Shu, H.; Liu, Y.; Guo, S.; Chen, X. How does socioeconomic status influence social relations? A perspective from mobile phone data. Phys. A Stat. Mech. Its Appl. 2023, 615, 128612. [Google Scholar] [CrossRef] [Scilit]
  28. Gao, Q.L.; Yue, Y.; Tu, W.; Cao, J.; Li, Q.Q. Segregation or integration? Exploring activity disparities between migrants and settled urban residents using human mobility data. Trans. GIS 2021, 25, 2791–2820. [Google Scholar] [CrossRef] [Scilit]
  29. Huang, X.; Li, Z.; Jiang, Y.; Ye, X.; Deng, C.; Zhang, J.; Li, X. The characteristics of multi-source mobility datasets and how they reveal the luxury nature of social distancing in the US during the COVID-19 pandemic. Int. J. Digit. Earth 2021, 14, 424–442. [Google Scholar] [CrossRef] [Scilit]
  30. Zhai, W.; Liu, M.; Han, Y. Dynamic neighborhood isolation and resilience during the pandemic in America’s 50 largest cities. Cities 2024, 153, 105260. [Google Scholar] [CrossRef] [Scilit]
  31. Hu, S.; Luo, W.; Darzi, A.; Pan, Y.; Zhao, G.; Liu, Y.; Xiong, C. Do racial and ethnic disparities in following stay-at-home orders influence COVID-19 health outcomes? A mediation analysis approach. PLoS ONE 2021, 16, e0259803. [Google Scholar] [CrossRef] [Scilit] [PubMed]
  32. Ubarevičienė, R.u.; van Ham, M.; Tammaru, T. Fifty years after the Schelling’s Models of Segregation: Bibliometric analysis of the legacy of Schelling and the future directions of segregation research. Cities 2024, 147, 104838. [Google Scholar] [CrossRef] [Scilit]
  33. Nejadshamsi, S.; Bentahar, J.; Eicker, U.; Wang, C.; Jamshidi, F. A geographic-semantic context-aware urban commuting flow prediction model using graph neural network. Expert Syst. Appl. 2025, 261, 125534. [Google Scholar] [CrossRef] [Scilit]
  34. Shan, Z.; Yang, F.; Shi, X.; Cui, Y. Hybrid Learning Model of Global–Local Graph Attention Network and XGBoost for Inferring Origin–Destination Flows. ISPRS Int. J. Geo-Inf. 2025, 14, 182. [Google Scholar] [CrossRef] [Scilit]
  35. Shi, Q.; Zhuo, L.; Li, Q.; Tao, H. Estimating intercity human mobility flow from city attributes and intercity relations in physical space and cyberspace via graph attention network. Int. J. Digit. Earth 2025, 18, 2523491. [Google Scholar] [CrossRef] [Scilit]
  36. Crivellari, A.; Shi, Y. Generative adversarial deep learning model for producing location-based synthetic trajectory data. Connect. Sci. 2025, 37, 2458502. [Google Scholar] [CrossRef] [Scilit]
  37. Chen, X.; Huang, C.; Wang, C.; Chen, L. Trajectory generation: A survey on methods and techniques. GeoInformatica 2025, 29, 351–376. [Google Scholar] [CrossRef] [Scilit]
  38. Liu, Z.; Huang, L.; Fan, C.; Mostafavi, A. Generating equitable urban human flows with a fairness-aware deep learning model. Cities 2025, 167, 106296. [Google Scholar] [CrossRef] [Scilit]
  39. Wu, X.; Pan, T.; He, Z. Physics-Informed Mobility Perception Networks for Origin-Destination Flow Prediction. IEEE Trans. Intell. Transp. Syst. 2025, 26, 15134–15149. [Google Scholar] [CrossRef] [Scilit]
  40. Kim, J.W.; Jang, B. Privacy-preserving generation and publication of synthetic trajectory microdata: A comprehensive survey. J. Netw. Comput. Appl. 2024, 230, 103951. [Google Scholar] [CrossRef] [Scilit]
  41. Mauro, G.; Luca, M.; Longa, A.; Lepri, B.; Pappalardo, L. Generating mobility networks with generative adversarial networks. EPJ Data Sci. 2022, 11, 58. [Google Scholar] [CrossRef] [Scilit] [PubMed]
  42. Ma, X.; Ding, Z.; Zhang, X. St-trajgan: A synthetic trajectory generation algorithm for privacy preservation. Future Gener. Comput. Syst. 2024, 161, 226–238. [Google Scholar] [CrossRef] [Scilit]
  43. Choi, S.; Kim, J.; Yeo, H. TrajGAIL: Generating urban vehicle trajectories using generative adversarial imitation learning. Transp. Res. Part C Emerg. Technol. 2021, 128, 103091. [Google Scholar] [CrossRef] [Scilit]
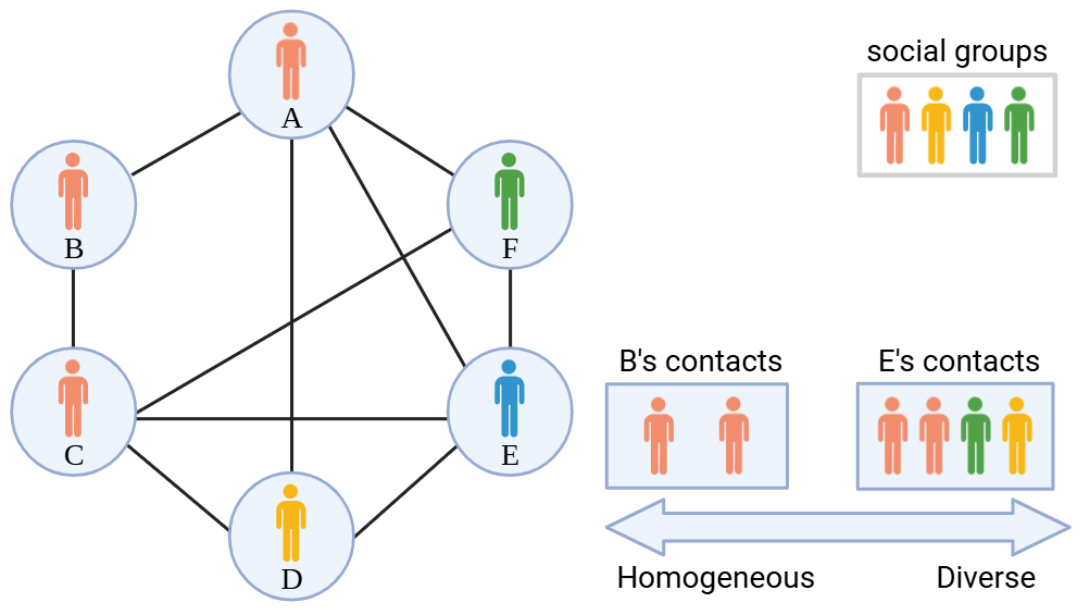
Figure 1. Social mixing captures heterogeneity in individuals interaction networks. In this network snapshot at time t, individual B interacts exclusively with others from the same demographic group (orange), whereas individual E of the blue group engages with people from three different groups (orange, green, and yellow). This contrast illustrates how opportunities for cross-group contact vary substantially across individuals, reflecting divergent mobility patterns and social contexts.
Complexities 02 00011 g001
Figure 2. Racial composition at the U.S. county level. Distinct colors represent major racial groups (American Indian, Asian, Black, Hispanic, and White), with shading intensity corresponding to population share (five levels: <30%, 30–50%, 50–70%, 70–90%, and 90%). Darker shades indicate counties where a single group constitutes a large majority, revealing pronounced racial concentration, while lighter shades reflect more mixed demographic distributions. Data is sourced from and Figure is drawn via justice map, available at http://www.justicemap.org (accessed on 9 March 2026).
Complexities 02 00011 g002
Figure 3. Spatial inequality in accessibility across New York city census tracts. Using 60-min travel–sheds from NYC Planning, the left panel depicts a tract with severely limited accessibility, where residents can reach only a small, fragmented set of destinations. The right panel shows a tract with a broad, expansive reachable area. This stark contrast underscores the substantial spatial inequality in terms of access to urban opportunities and services.
Complexities 02 00011 g003
Disclaimer/Publisher’s Note: The statements, opinions and data contained in all publications are solely those of the individual author(s) and contributor(s) and not of MDPI and/or the editor(s). MDPI and/or the editor(s) disclaim responsibility for any injury to people or property resulting from any ideas, methods, instructions or products referred to in the content.