


Abstract
Small towns in coastal Ecuador flood repeatedly, yet they rarely have the hydrometric and topographic data needed for detailed flood studies. This study tested whether a low-cost workflow—a one-dimensional (1D) steady-flow HEC-RAS model built on a freely available 12.5 m terrain product, evaluated against a reconstructed flood event, and combined with the hazard–vulnerability scoring of Ecuador’s national risk management authority—can support neighborhood-scale flood risk assessment in two neighborhoods of Quinsaloma on the Umbe River. The flood of 23 May 2023, whose extent (26 ha) was reconstructed from photographs, flood marks, and residents’ accounts, was used as a reference. For the estimated event discharge (60 m3/s), the simulated flow remained within the river corridor (5 ha flooded) and did not reproduce any of the observed flooded points. Agreement remained low even for discharges up to 1500 m3/s (Cohen’s κ ≤ 0.40), while a ±20% change in Manning’s n had a minor effect. The mismatch is explained mainly by the terrain product, which cannot represent the river channel and raises built-up areas several meters above it. The risk assessment, based on the observed flood footprint and institutional records, classified Las Palmitas as high risk and 12 de Octubre as medium risk, and these classes were robust to most changes in the criterion scores. Open global terrain data are therefore insufficient for neighborhood-scale hydraulic delineation, and local risk planning should rely on observed flood footprints until higher-resolution topography becomes available.
1. Introduction
Natural disasters have become more frequent because of the unsustainable use of natural resources and the intensification of climate change [1]. Among them, floods are one of the most damaging hazards because of their recurrence and their impacts on infrastructure, agriculture, transport, and people [2], and the number of people affected by floods worldwide is projected to double between 2010 and 2030 [3]. Flood risk has therefore been studied from multiple perspectives to support the sustainable development of communities and infrastructure [4].
In Ecuador, flood impacts have become increasingly evident in recent years. Between 14 and 17 June 2024, national situation reports recorded 70 hazardous events in 13 provinces, mainly landslides (40%), floods (22.9%), and debris flows (18.6%) [5]; a rainfall episode in January 2024 affected 710 people and damaged 176 homes in Los Ríos province [6]. In addition, three flood events occurred in Quinsaloma canton during the first five months of 2022, affecting 591 people and damaging 107 homes [7], and the Umbe River flooded the riverside neighborhoods of the town again on 23 May 2023 [8].
Hydraulic models coupled with geographic information systems (GIS) are the standard tool to delineate flood-prone areas [9]. In Ecuador and neighboring countries, one-dimensional (1D) HEC-RAS models have been used to map flood zones along the Pescadillo River in Manabí [10], the Cunduana stream in Riobamba [11], the Chicamocha River in Colombia [12], and Andean micro-catchments in Peru [13]. These applications typically present the simulated extent as a hazard map but seldom compare it quantitatively with observed floods, largely because hydrometric records and post-event surveys are scarce; observations collected from affected residents have been proposed as an alternative validation source in urban catchments [14]. Moreover, the hydraulic output is rarely linked to the vulnerability indicators that Ecuadorian municipalities must use in their development and land-use plans [15,16].
A further, often implicit, assumption is that freely available global or regional digital elevation models (DEMs) are adequate for neighborhood-scale studies. Inundation maps are, however, highly sensitive to the resolution and vertical accuracy of the terrain data and to the way the channel geometry is represented [17,18], and open global DEMs contain vegetation and building artifacts and vertical errors of several meters that can exceed typical flood depths [19,20,21]. Small Latin American towns, where only such products are available, are exactly the settings in which this assumption needs to be tested.
This study addresses these gaps for Quinsaloma, a small town in Los Ríos province without gauging stations or high-resolution topography. Its objectives were to (1) simulate the 23 May 2023 Umbe River flood with a 1D steady-flow HEC-RAS model built from the freely available 12.5-m ALOS PALSAR terrain product; (2) quantify the sensitivity of the results to Manning’s roughness and discharge and evaluate the simulated extent against the reconstructed extent of that flood; and (3) assess flood hazard, vulnerability and risk in the Las Palmitas and 12 de Octubre neighborhoods with the national framework of the Secretaría Nacional de Gestión de Riesgos (SNGR) [15], including a robustness test of the qualitative scores. The contribution is an explicit, reproducible test of what such a low-cost workflow can and cannot deliver in a data-scarce small town, together with a risk classification for municipal planning.
2. Materials and Methods
2.1. Study Area
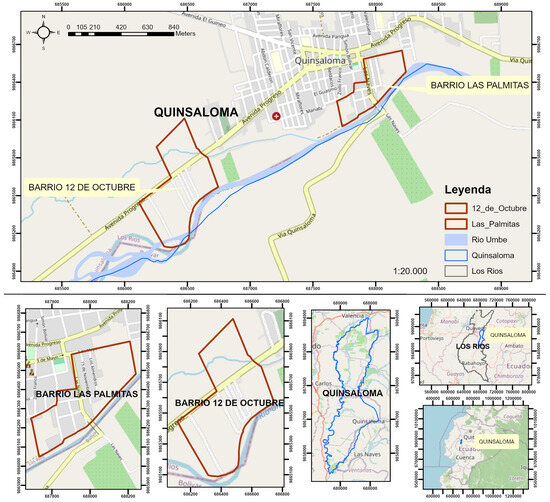
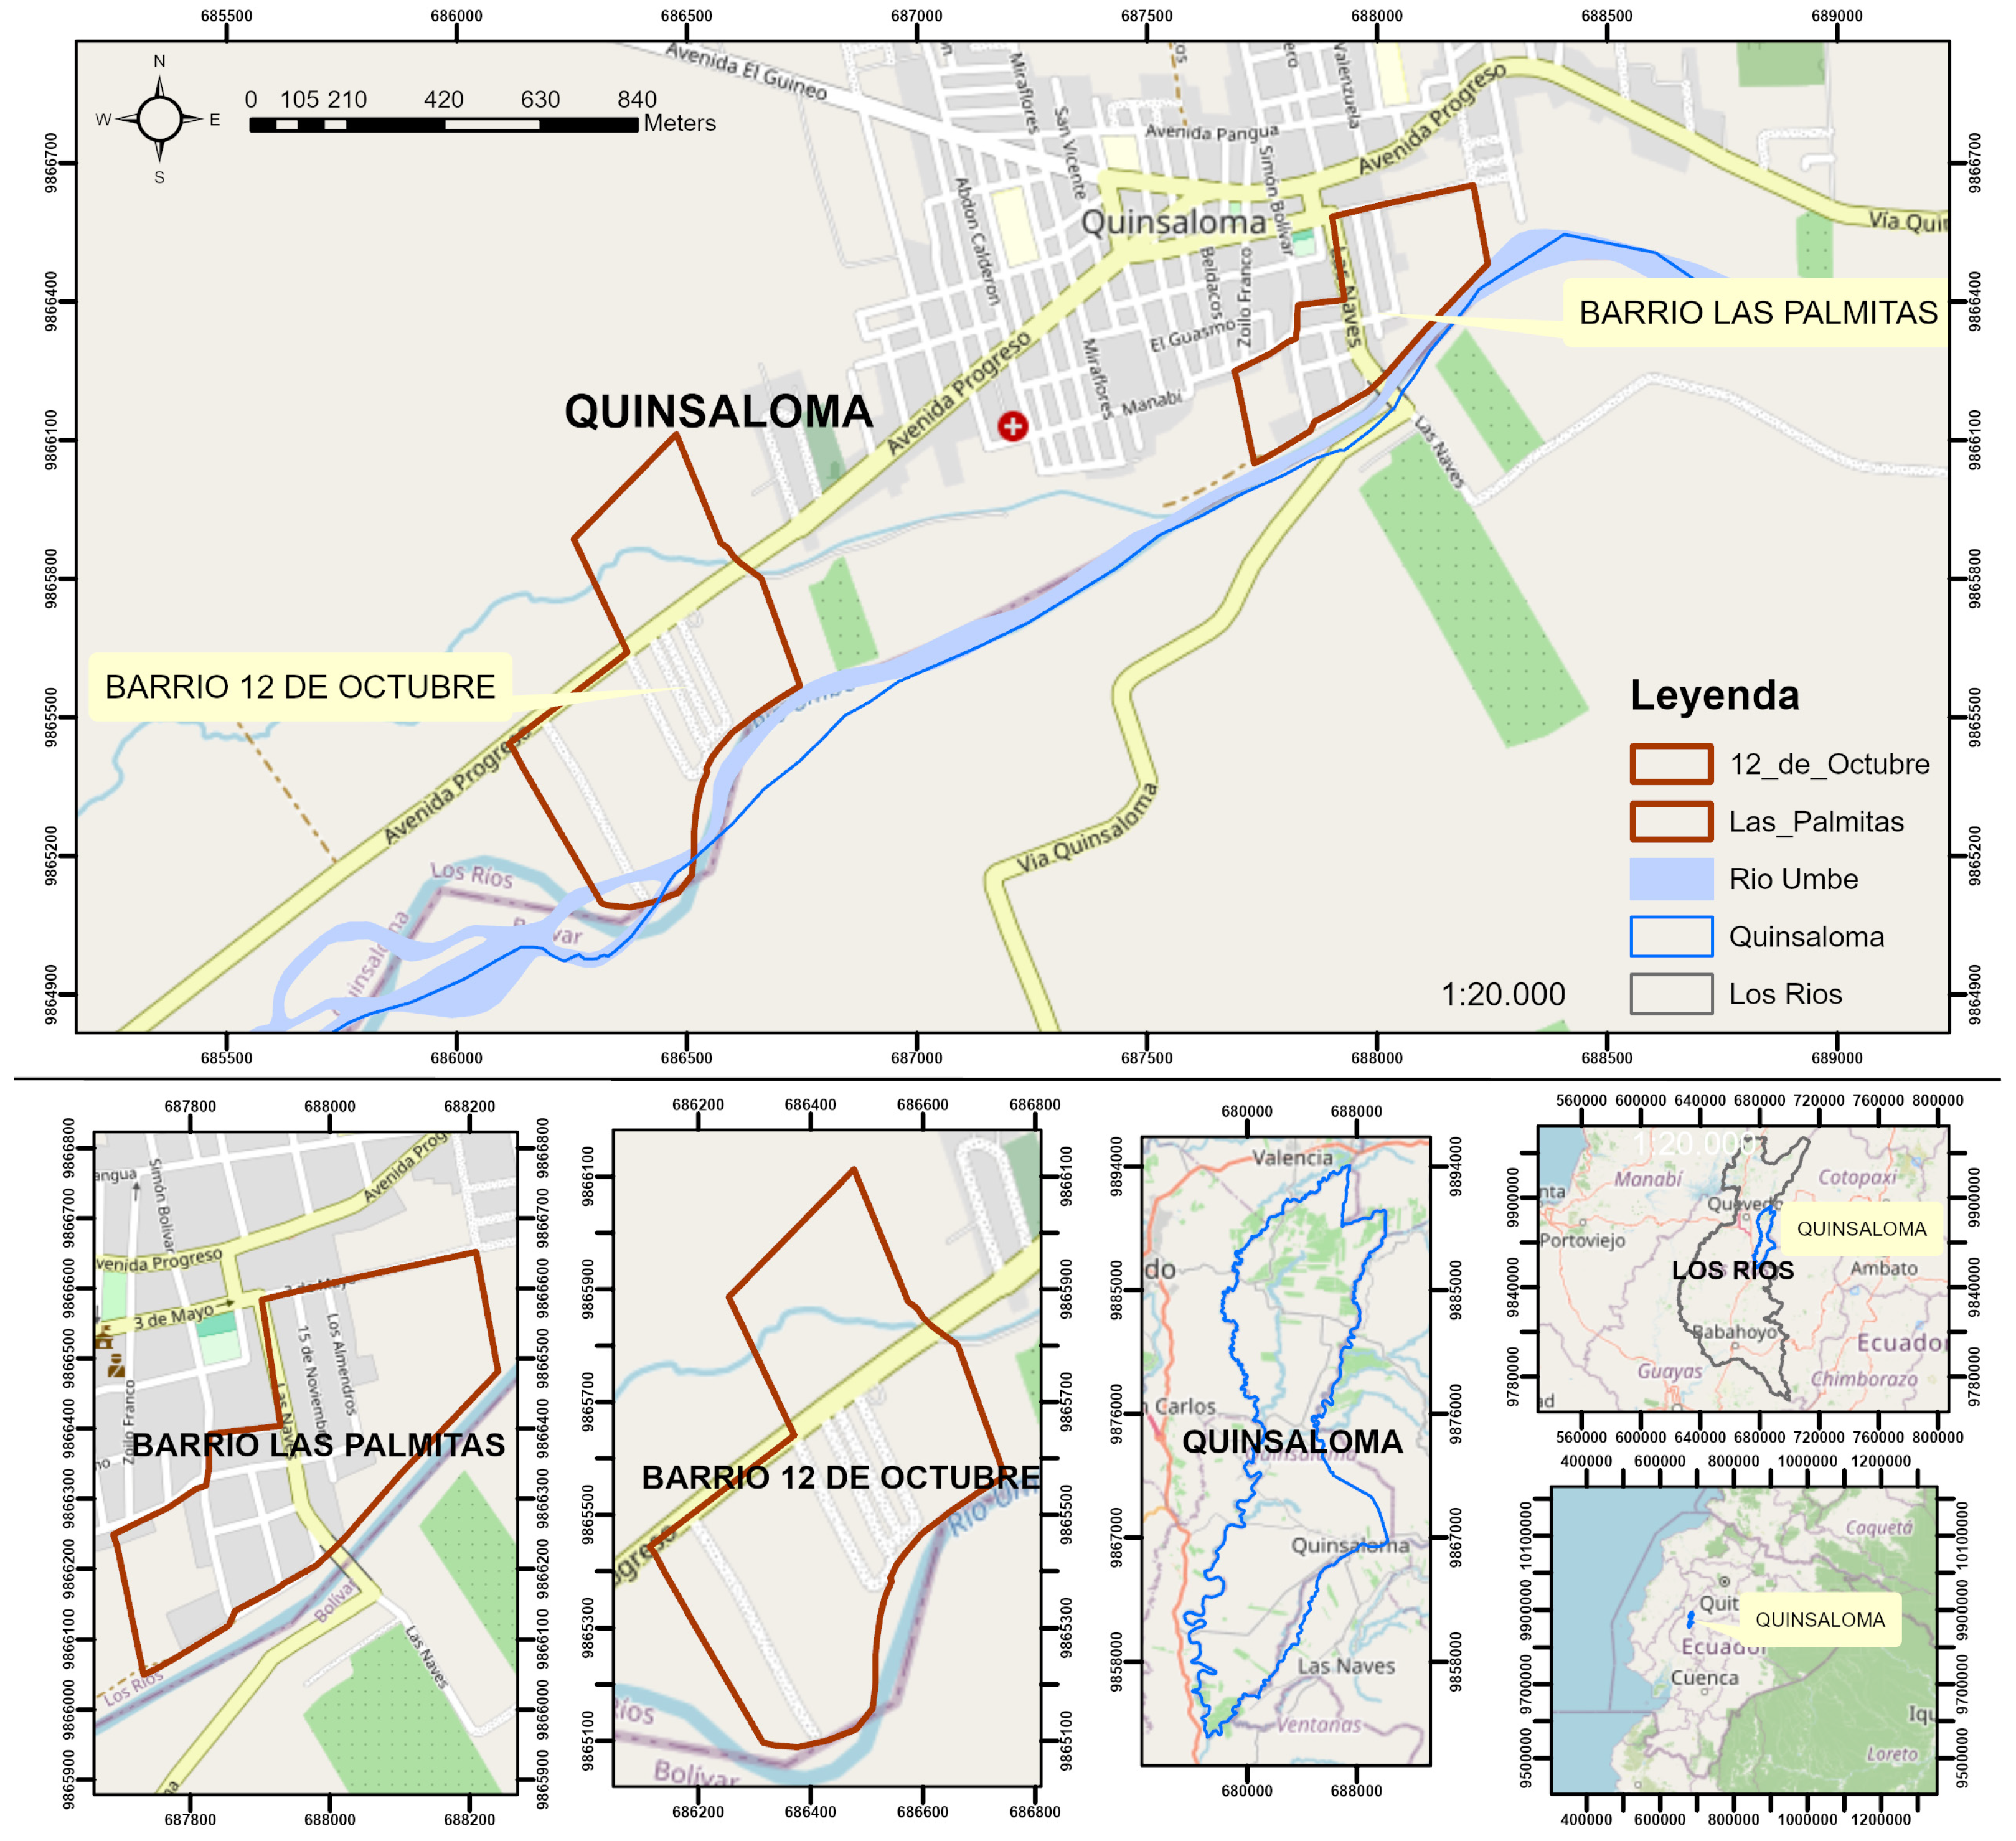
The study was carried out in Quinsaloma canton, in the northeast of Los Ríos province, Ecuador, bordering the provinces of Bolívar and Cotopaxi (Figure 1, Table 1). The canton lies in the transition between the coastal plain and the Andean foothills; its relief is mostly flat in the south and rolling in the north and east, where wetland areas retain water during the rainy season [8]. The drainage network includes the Umbe, Suquibí, Calabí, Quevedo, and Lavatorio rivers, tributaries of the Zapotal–Babahoyo system. The Umbe River, which flows from the Andean foothills towards the southwest and borders the town and caused the floods recorded in the cantonal contingency plan [8], is the river analyzed in the present study.
Figure 1.
Location of Quinsaloma canton in Los Ríos province, Ecuador (insets), and of the Las Palmitas and 12 de Octubre neighborhoods on the Umbe River (main map and lower panels). Coordinates: WGS 84/UTM zone 17S; base map: OpenStreetMap.
Table 1.
General characteristics of Quinsaloma canton and of the study neighborhoods.
The two study sites are the Las Palmitas (X: 687,908; Y: 9,866,269) and 12 de Octubre (X: 686,571; Y: 9,865,528) neighborhoods, delimited according to the official boundaries of the Cuerpo de Bomberos de Quinsaloma (Table 1). Las Palmitas (14.7 ha) is a consolidated urban neighborhood adjacent to the town center on the right (northwest) bank of the river, with a dense street grid and continuous housing. Accordingly, 12 de Octubre (31.5 ha) lies about 1.5 km downstream at the western edge of the town, where the river bends to the south; it is a lower-density, partly peri-urban area crossed by Avenida Progreso and by a small tributary stream.
2.2. Data
Topography was taken from the ALOS PALSAR radiometric-terrain-corrected high-resolution product distributed by the Alaska Satellite Facility (scene ALPSRP272497160, acquired on 7 March 2011; 12.5 m pixel) [22]. The DEM included in this product is not derived from the radar scene itself: it is a resampled version of the SRTM-based elevation data used for terrain correction, stored as integer meters. Its nominal 12.5 m resolution therefore overstates its effective detail, a limitation that is analyzed in Section 4.
The Umbe River has no gauging station in the study reach, so neither an observed hydrograph nor a flood-frequency analysis was available, and a return period could not be assigned to the 23 May 2023 event. A steady discharge of 60 m3/s was estimated for the event during the fieldwork of the study, from observations of the channel and the accounts of residents and local institutions, and the uncertainty of this value was addressed through a discharge sensitivity analysis (Section 2.4). The observed flood extent of 23 May 2023 was reconstructed in the field from geotagged photographs, flood marks, and residents’ accounts, complemented with the records of the municipal risk management department and the fire department, and digitized in ArcMap 10.8 [14]. Hazard and vulnerability information (event recurrence, affected territory, damaged homes, exposed population, early-warning coverage and evacuation conditions) was obtained from the cantonal contingency plan [8], the development and land-use plan [23] and interviews with local officials.
2.3. Hydraulic Model
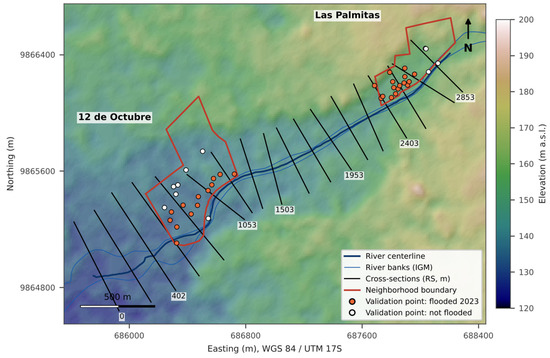
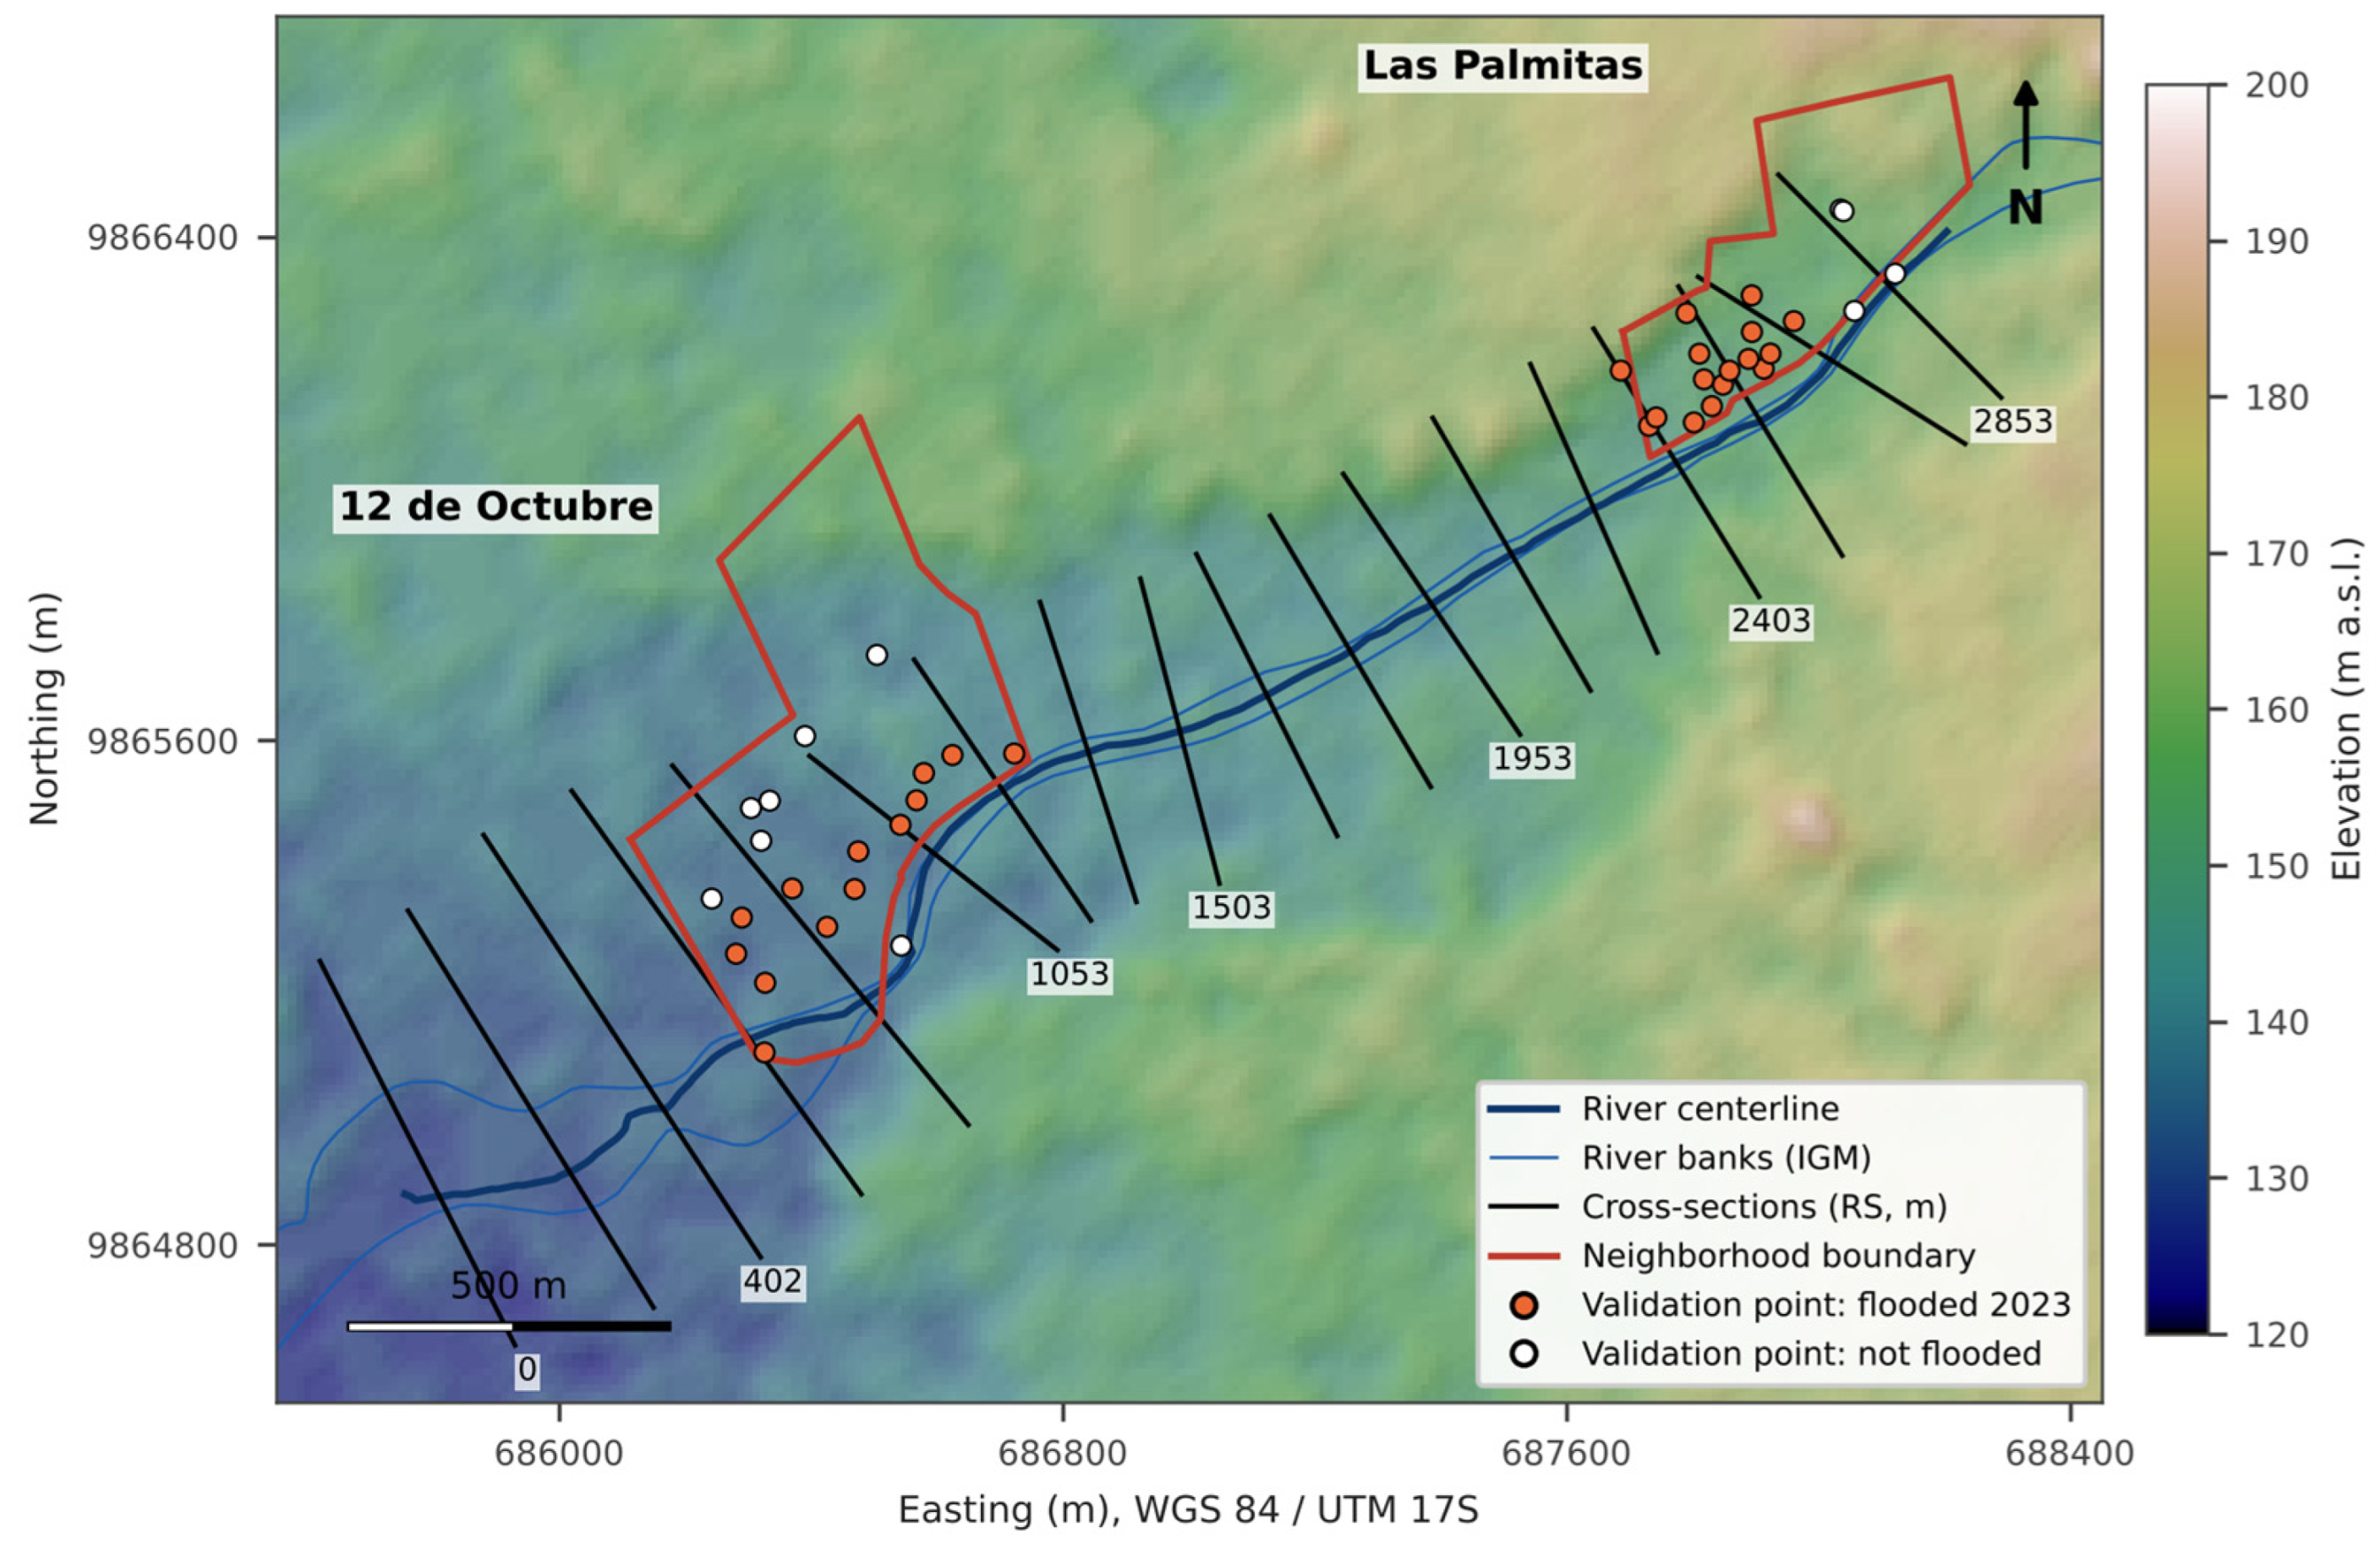
A 1D steady-flow model was built in HEC-RAS 6.6, which solves the energy equation between consecutive cross-sections with the standard-step method, using Manning’s equation for friction losses, contraction and expansion coefficients of 0.1 and 0.3, and critical depth wherever a subcritical solution does not exist [24]. Because the model is 1D, no computational mesh was used: the geometry consists of 18 cross-sections drawn perpendicular to the flow along a 2.9 km reach of the Umbe River (Figure 2). Thirteen cross-sections, 500 m wide and spaced about 150 m apart [25], cover the reach upstream of the river bend; five additional cross-sections, 680–800 m wide and spaced 180–270 m apart, were added downstream so that the whole of 12 de Octubre lies inside the model domain. Station–elevation data were sampled every 6.25 m directly from the DEM by bilinear interpolation, and bank stations were placed at the edges of the lowest part of each section (within 1 m of its minimum elevation).
Figure 2.
Hydraulic model layout of the 23 May 2023 flood, over the 12.5-m ALOS PALSAR terrain product: river centerline, cross-sections (labeled with their river station, in meters upstream of the downstream boundary), neighborhood boundaries, and validation points.
Manning’s roughness coefficients were assigned per cross-section from field observation of the bed material and land cover and from tabulated values for natural channels and floodplains [26]: 0.040–0.055 for the gravel-bed main channel, 0.028–0.035 for the left floodplain and 0.042–0.052 for the right floodplain. Buildings were not represented explicitly; as is usual in 1D models, their effect was lumped into the floodplain roughness [24]. A steady discharge was imposed at the upstream boundary, and normal depth was used as the downstream boundary condition, with an energy slope of 0.011 m/m equal to the mean thalweg slope of the reach. The flow regime was subcritical, with critical depth adopted automatically at sections where no subcritical solution existed.
Cross-sections were extracted directly from the DEM rather than from a triangulated irregular network interpolated from contour lines, because a contour-based surface (10 m interval) flattens the channel and floodplain into terraces and can distort the flooded extent. The scenario runs were computed with an open Python 3.11 implementation of the HEC-RAS standard-step formulation (subcritical regime, average-conveyance friction slope), which reproduced the water-surface elevations computed by HEC-RAS 6.6 for the same geometry within 0.03 m at all cross-sections. Flood depth was mapped by interpolating the water surface linearly between cross-sections, subtracting the DEM and keeping only wet cells hydraulically connected to the channel, which is equivalent to the floodplain delineation of HEC-GeoRAS and RAS Mapper.
2.4. Sensitivity Analysis
Because no stage records were available to calibrate the model [27], two sources of uncertainty were explored for every scenario. First, all Manning’s coefficients were scaled by ±20%, a range commonly used to bracket roughness uncertainty in uncalibrated models [28]. Second, because the event discharge was estimated rather than measured, the model was run for discharges of 30, 60, 120, 250, 500, 750, 1000 and 1500 m3/s. The lower value (half of the estimate) represents the possibility that the event discharge was overestimated, while the higher values test whether the observed extent could be explained by a much larger peak discharge than the estimate; the range was extended to 1500 m3/s (25 times the estimate), at which the simulated flooded area is more than twice the observed footprint. Every discharge was combined with the three roughness levels (24 runs). For each run, we recorded the water-surface profile, the flooded area, and the agreement with the observed flood (Section 2.5).
2.5. Validation Against the 23 May 2023 Flood
In each neighborhood, 20 points were generated at random (Create Random Points, ArcMap) within a sampling rectangle covering the area exposed to river flooding. Each point was coded as observed flooded (1) or not flooded (0) according to the reconstructed 2023 flood extent, and as simulated flooded (1) or not flooded (0) according to the simulated depth map. Because both codes are assigned independently, all four outcomes of the confusion matrix (Table 2) are possible, including false negatives (observed flooded points that lie outside the simulated extent).
Table 2.
Structure of the confusion matrix used for validation.
From each matrix, we computed overall accuracy, sensitivity (TP/(TP + FN)), specificity (TN/(TN + FP)), the critical success index (CSI = TP/(TP + FP + FN)), which is widely used in flood model evaluation, and Cohen’s kappa (κ), which corrects the observed agreement for the agreement expected by chance [29]. Kappa ranges from −1 to +1: 1 indicates perfect agreement, 0 indicates agreement equal to chance, and negative values indicate agreement worse than chance; it was interpreted with the scale of Landis and Koch [30] (Table 3). Kappa is less common in hydraulic modeling than the CSI, but it was retained because the validation data are binary point observations; both statistics are known to depend on the size of the domain and on the proportion of flooded points [31], so they are interpreted together with sensitivity and specificity. Because 20 points per neighborhood is a small sample, the validation was repeated with two larger samples drawn from the same reconstructed flood extent: 100 random points per neighborhood (fixed random seed) and all 12.5-m cells of each sampling area (580 cells in Las Palmitas and 1696 in 12 de Octubre). For every sample, 95% confidence intervals of κ were computed from its asymptotic standard error.
Table 3.
Interpretation of Cohen’s kappa coefficient (after Landis and Koch [30]).
2.6. Hazard, Vulnerability and Risk Assessment
Hazard (A) was computed as the sum of three criteria—frequency (F), affected territory (T), and intensity (I)—each scored from 1 to 3 according to the SNGR guidelines (Table 4) [15], and classified as low (3), medium (4–6), or high (7–9). This scheme weighs both the recurrence and the magnitude of the phenomenon rather than frequency alone. In the intensity criterion, a home is considered destroyed when it suffered structural collapse or damage that made it uninhabitable, and affected when it suffered damage that did not prevent its use, following the damage categories of the national situation reports [6].
Table 4.
Hazard assessment criteria (SNGR [15]); the time periods refer to the historical record of hazardous events.
Vulnerability (V) was assessed with three criteria [15] (Table 5): the share of the population exposed (living in the area of direct impact); the coverage of evacuation alert systems; and the degree of dependence on external assistance to evacuate to a safe area, judged from distance, evacuation time, and available resources. The evacuation criterion uses an asymmetric scale (0, 1, 3) taken from the SNGR guidelines, which gives greater weight to populations that cannot evacuate without help. The vulnerability score therefore ranges from 2 to 9 and was classified as low (≤3), medium (4–5), or high (≥6).
Table 5.
Vulnerability assessment criteria (SNGR [15]).
The disaster risk level was obtained by combining the hazard and vulnerability classes defined in the SNGR guidelines [15] with the risk matrix of the SIGR-E risk diagnosis guide (Table 6) [16]. Assigning ordinal values of 1, 2, and 3 to the low, medium, and high classes, the matrix is equivalent to the product R = Ac × Vc, with low risk for R ≤ 2, medium risk for R = 3–4, and high risk for R ≥ 6. The multiplicative form reflects that an area with high hazard but low vulnerability does not carry the same risk as one in which both are high. Because several scores rely on expert judgment and institutional records, the robustness of the risk class was tested by changing each of the six criterion scores, one at a time, by one admissible level up and down and recomputing the risk class.
Table 6.
Disaster risk matrix of the SIGR-E guide [16], applied to the hazard and vulnerability classes of the SNGR guidelines [15].
3. Results
3.1. Simulated Hydraulics for the Estimated Event Discharge
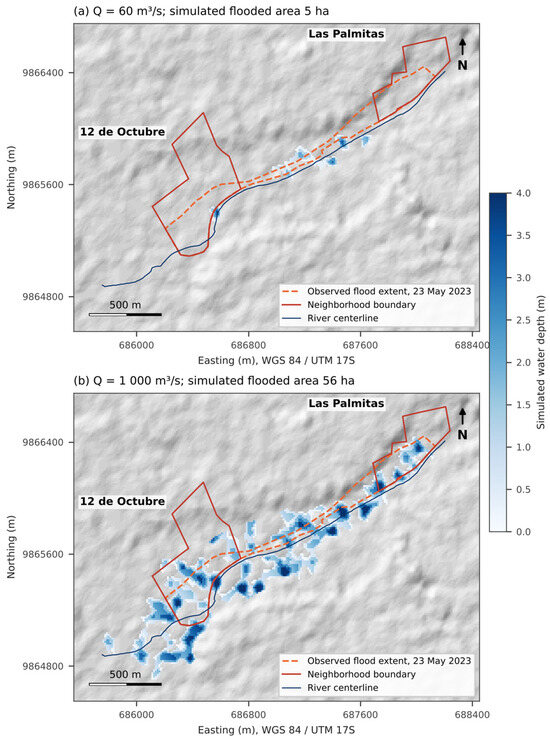
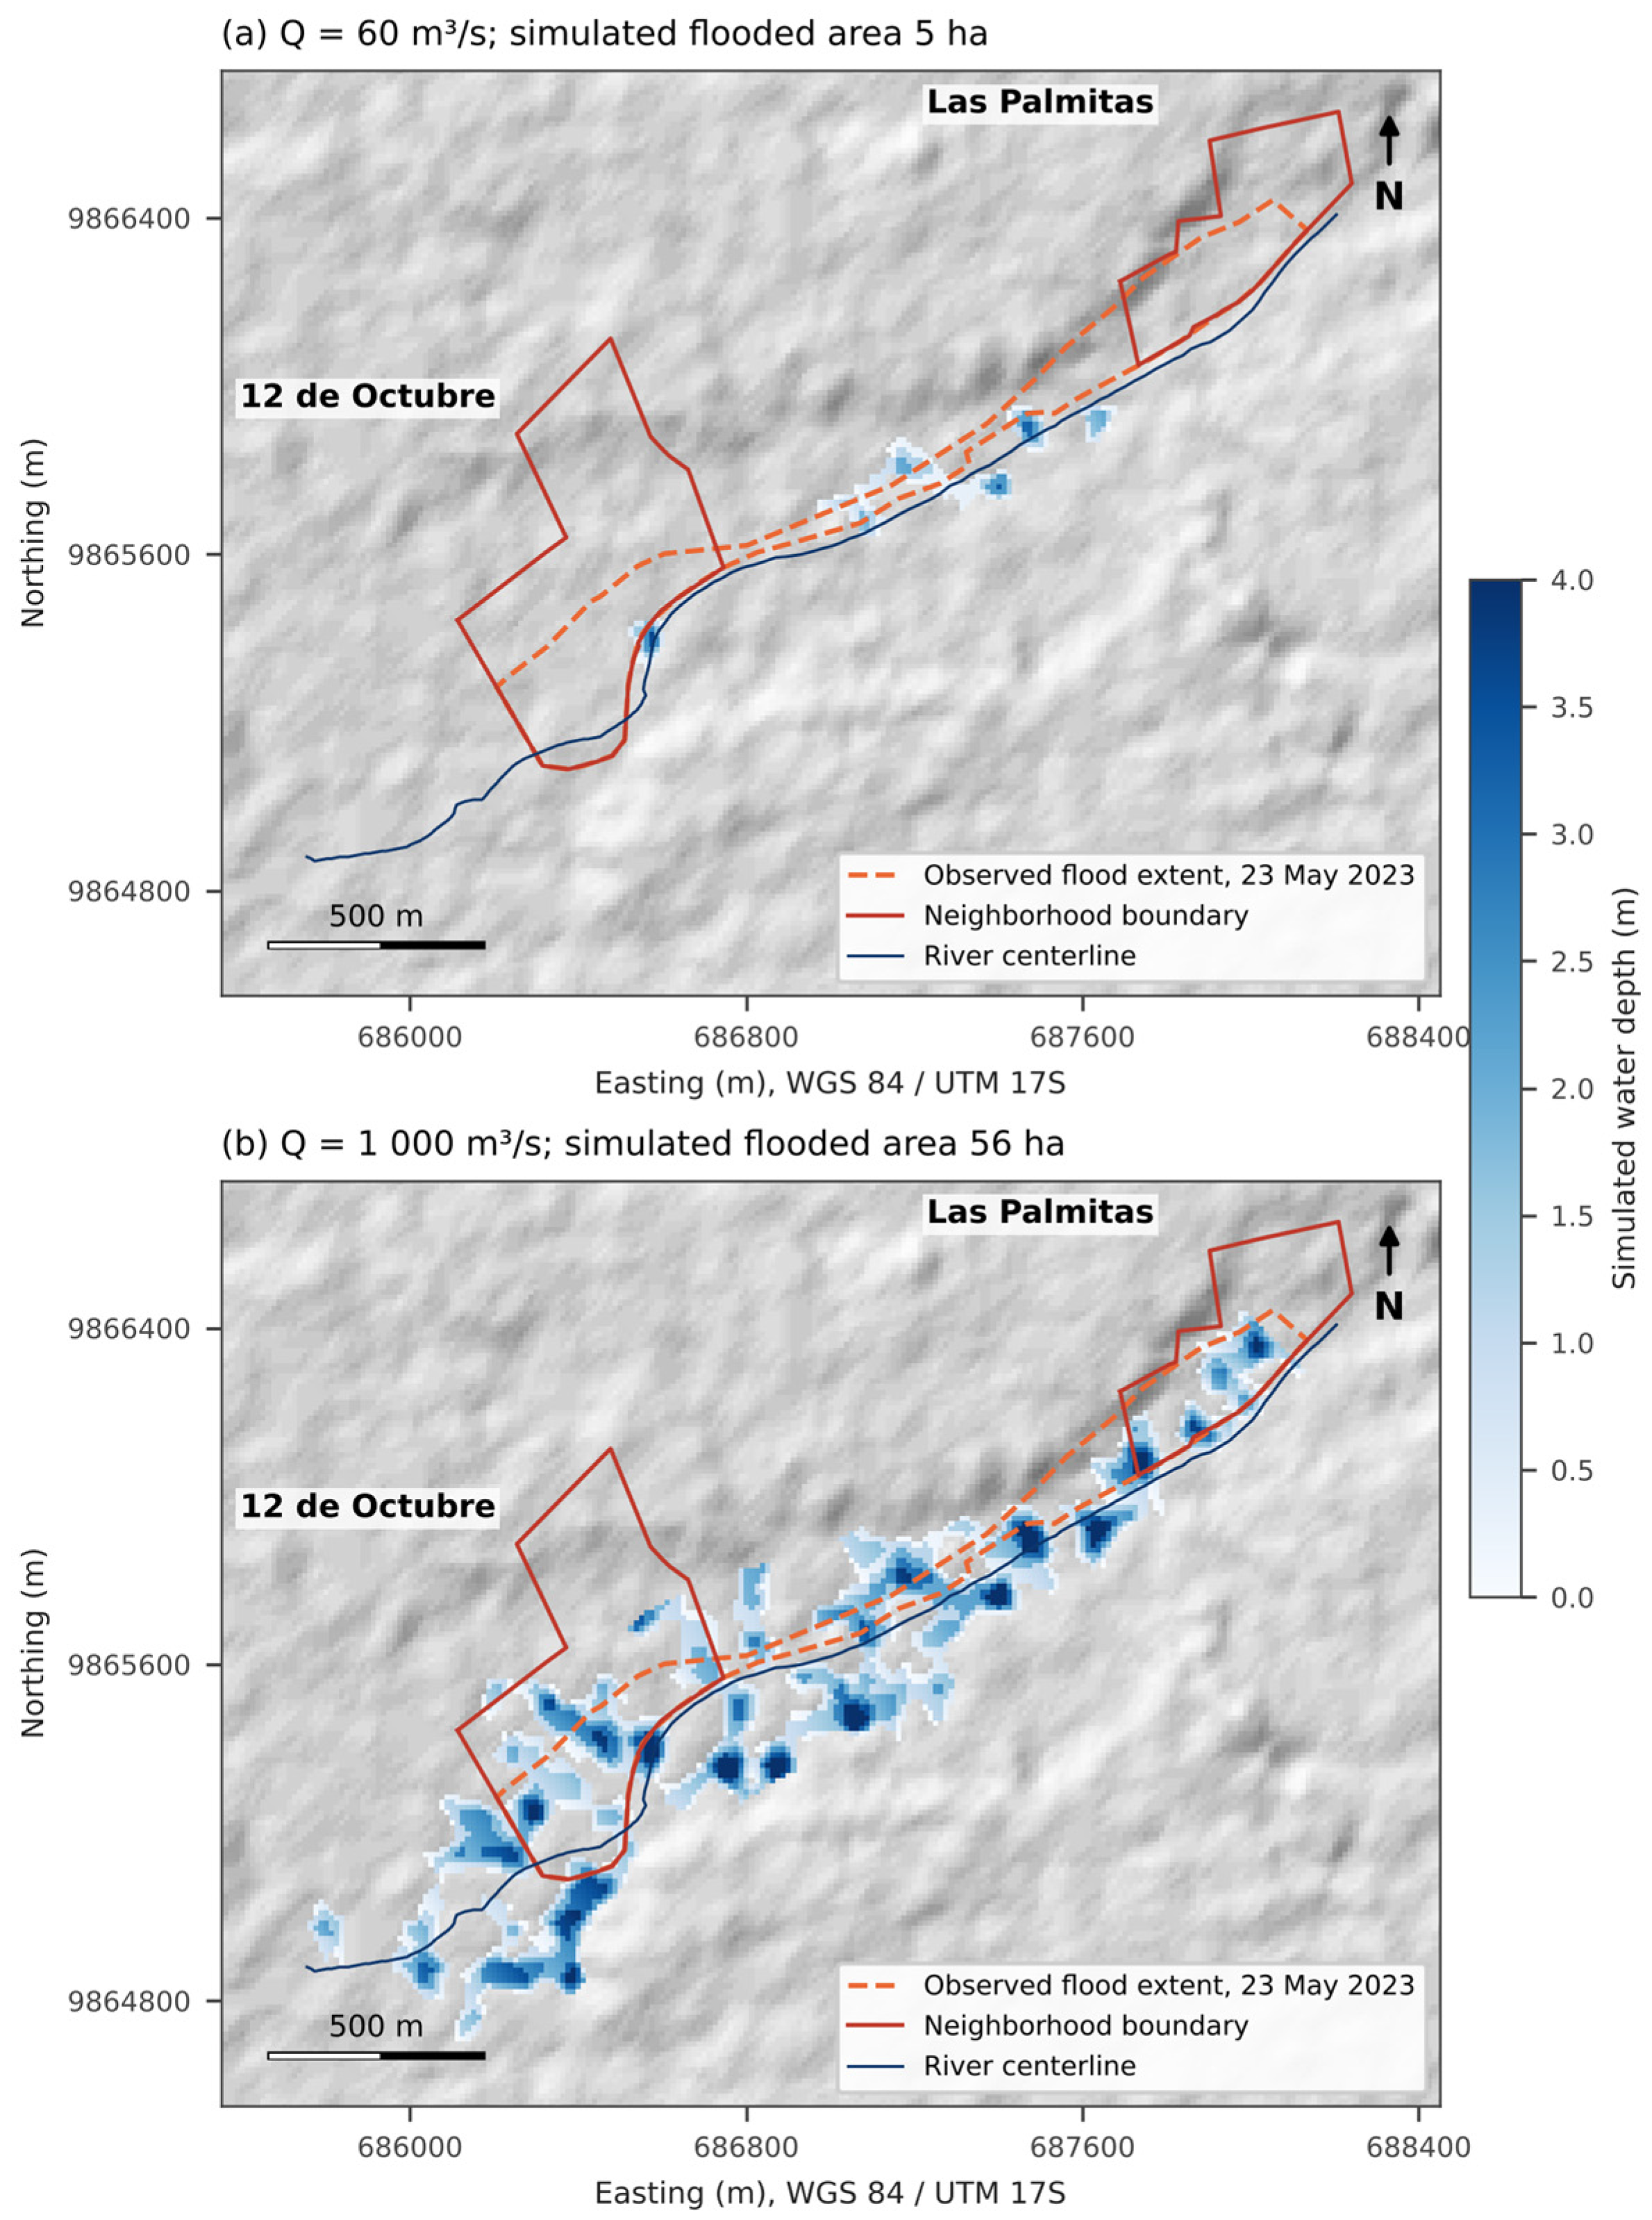
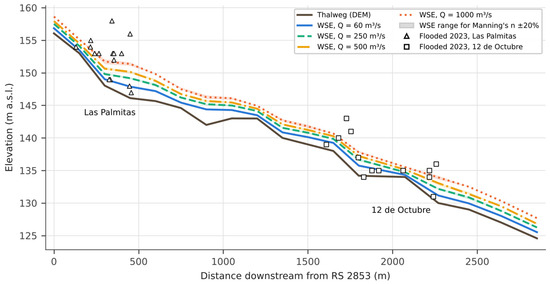
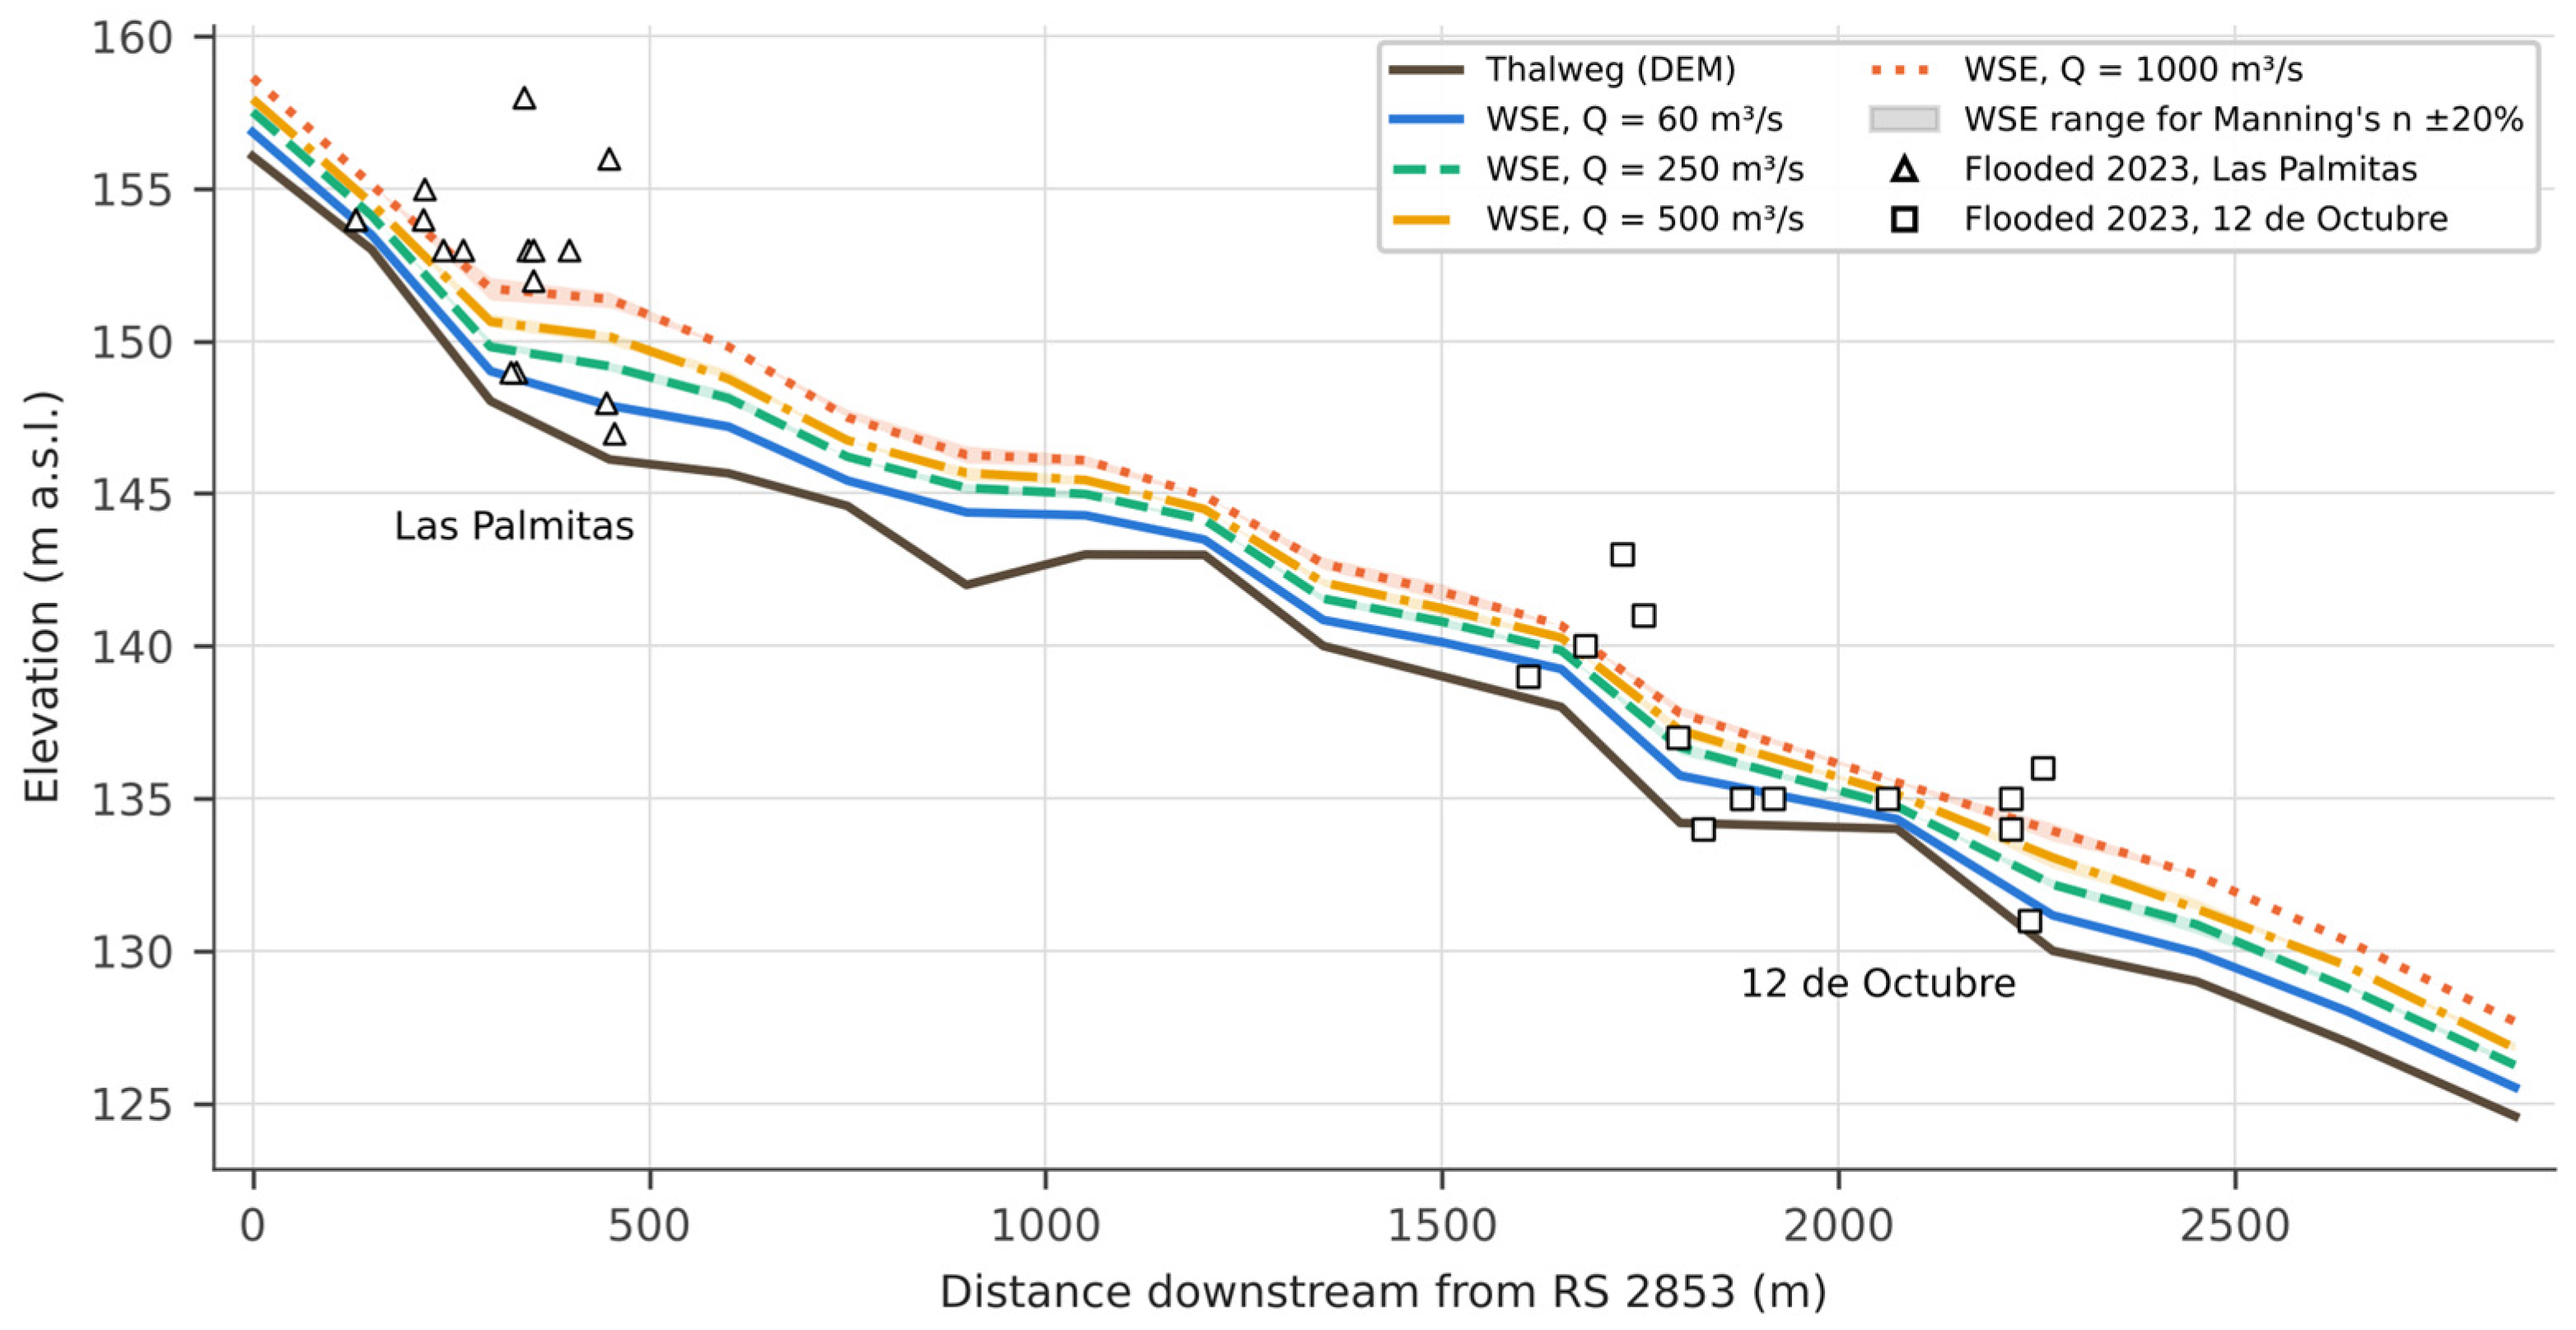
For the estimated discharge of 60 m3/s, the simulated flow remained within the river corridor (Figure 3a). Maximum depths at the cross-sections ranged from 0.3 to 2.4 m, mean channel velocities from 0.6 to 2.2 m/s, and top widths from 40 to 168 m. Flow was subcritical in most sections, with critical depth at six sections located at the steps of the longitudinal profile, where the thalweg drops by 2–5 m over 150 m (Figure 4). The total simulated flooded area was 5.2 ha, of which 0.0 ha were in Las Palmitas and 0.2 ha in 12 de Octubre, compared with 7.3 ha and 11.4 ha observed in 2023. The remaining area lies outside the two neighborhoods: 2.5 ha within the river channel and a 25 m strip along its banks, and 2.5 ha in low-lying floodplain pockets (mostly agricultural land) along the reach (Figure 3a).
Figure 3.
Simulated water depth for (a) the estimated event discharge of 60 m3/s and (b) an extreme discharge of 1000 m3/s, compared with the observed flood extent of 23 May 2023.
Figure 4.
Longitudinal profile of the Umbe River in the study reach: DEM thalweg, simulated water-surface elevation (WSE) for four discharges with the range obtained for Manning’s n ± 20% (shaded), and DEM elevation of the validation points that were flooded on 23 May 2023, projected onto the centerline.
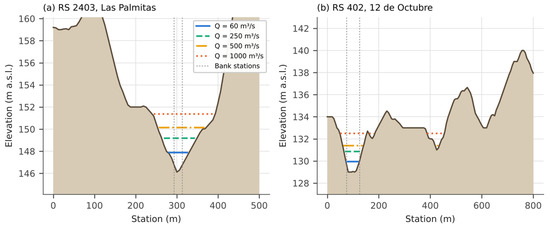
The longitudinal profile (Figure 4) shows why: most observed flooded points in Las Palmitas lie above the simulated water surface, and the points of 12 de Octubre that lie below it are separated from the channel by higher ground in the DEM, so the simulated flow does not reach them. Relative to the 60 m3/s profile, the DEM elevation of the observed flooded points exceeds the simulated water level by a median of 2.3 m in Las Palmitas and 0.9 m in 12 de Octubre (maximum 9.1 m). The critical cross-sections (Figure 5) confirm that the DEM represents the river as a 40–170 m wide valley floor with no incised channel, and that in Las Palmitas the built-up terrace rises up to 10 m above it, so that even the 1000 m3/s water surface remains below a large part of the neighborhood.
Figure 5.
Critical cross-sections (a) RS 2403 in Las Palmitas and (b) RS 402 in 12 de Octubre, with simulated water surfaces for four discharges. Stationing increases from the left (southeast) to the right (northwest) end of each section.
3.2. Sensitivity to Roughness and Discharge
Changing Manning’s n by ±20% changed water-surface elevations by at most 0.17 m at 60 m3/s and 0.35 m at 500 m3/s, and the flooded area by up to 32% across all discharges (Table 7); roughness uncertainty is therefore secondary to discharge and topography. Reducing the discharge to 30 m3/s confined the flow further (4.7 ha) and, for 60 m3/s, no observed flooded point was reproduced. The simulated flooded area increased from 5 ha at 60 m3/s to 56 ha at 1000 m3/s, but the additional flooding occurred mostly in low-lying fields and terraces outside the neighborhoods (Figure 3b).
Table 7.
Sensitivity of the simulated flood to discharge (Q) and Manning’s n, and agreement with the 23 May 2023 flood (Cohen’s κ; 20 validation points per neighborhood). Values are given for 0.8 n/n/1.2 n.
3.3. Agreement with the Observed 2023 Flood
For the estimated event discharge, none of the 29 validation points flooded in 2023 (16 in Las Palmitas and 13 in 12 de Octubre) were inside the simulated extent: sensitivity was 0, specificity 1, and κ = 0 in both neighborhoods (Table 8). Agreement improved only for unrealistically large discharges and never exceeded κ = 0.40 (fair agreement), with sensitivity of at most 0.77 (Table 7). All errors at 60 m3/s were false negatives—i.e., the model systematically underestimated the observed flood. The larger samples confirmed these results with much narrower confidence intervals (Table 8): at 60 m3/s κ was 0.00 in Las Palmitas and −0.02 to −0.03 in 12 de Octubre with 100 random points and with all cells, and for any discharge κ did not exceed 0.33 with 100 points or 0.17 with all cells.
Table 8.
Confusion matrices and validation metrics for the estimated event discharge (60 m3/s) and the largest discharge tested (1500 m3/s), using the 20 original validation points, 100 random points, and all 12.5-m cells of each sampling area. Acc.: overall accuracy; Sens.: sensitivity; Spec.: specificity.
3.4. Hazard, Vulnerability and Risk
Las Palmitas obtained a high hazard level (A = 8): floods recur more than once every 1–3 years, affect more than 30% of its territory, and destroy 5–10% of its homes in the historical record (Table 9). In comparison, 12 de Octubre obtained a medium hazard level (A = 5), with events every 3–5 years, 15–30% of its territory affected, and less than 5% of homes destroyed. The higher hazard in Las Palmitas agrees with the cantonal contingency plan, which identifies it as a low-lying sector prone to ponding [8]. Vulnerability was high in Las Palmitas (V = 8) because more than half of its population lives in the area of direct impact, early-warning coverage reaches only 21–50% of residents, and evacuation depends on assistance. In contrast, 12 de Octubre had medium vulnerability (V = 4), with 21–50% of the population exposed, alerts reaching more than half of the residents, and low evacuation dependence. The role of early-warning coverage and evacuation conditions in differentiating the two neighborhoods is consistent with hydrological vulnerability assessments of small Ecuadorian towns [32].
Table 9.
Hazard, vulnerability, and risk scores in the study neighborhoods (sources: [8,23] and interviews with local officials).
Combining both components, Las Palmitas was classified as high risk and 12 de Octubre as medium risk. The robustness test (Table 10) showed that the high-risk class of Las Palmitas was unchanged in all eight one-level perturbations of its criterion scores, because both its hazard and vulnerability scores lie well inside the high class. The medium class of 12 de Octubre was retained in 7 of 10 perturbations; it became low if the exposed population or the evacuation dependence were scored one level lower, and high if evacuation dependence were scored as high. Using the observed 2023 footprint instead of the institutional record, the affected territory of 12 de Octubre (36%) would score 3 instead of 2, raising its hazard to 6, which is still medium. The risk classes therefore depend mainly on the vulnerability information of 12 de Octubre, which should be verified first in future updates.
Table 10.
Robustness of the risk class to one-level changes in each criterion score.
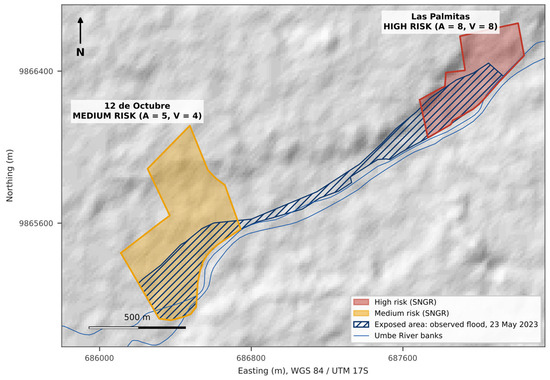
The spatial distribution of the most exposed areas is shown in Figure 6. Because the hydraulic model did not reproduce the event, the exposed area of each neighborhood was delineated with the observed 2023 flood footprint: 7.3 ha (49%) of Las Palmitas, concentrated in the blocks between the river and the El Guasmo and 10 de Agosto streets, and 11.4 ha (36%) of 12 de Octubre, along the river bend and the low-lying land south of Avenida Progreso. These are the sectors where mitigation and early-warning measures should be prioritized.
Figure 6.
Flood risk classes of the study neighborhoods and areas exposed to river flooding according to the observed flood of 23 May 2023.
4. Discussion
The main finding is negative but useful: with the freely available 12.5 m terrain product, a carefully built 1D model could not reproduce a well-documented flood in either neighborhood, whatever the roughness and discharge assumed. Three factors explain this. First, the DEM is resampled from SRTM-based elevations, stores integer meters, and does not resolve the incised channel, so the conveyance of the river corridor is misrepresented [18,21]. Second, the C-band radar surface includes part of the height of buildings and trees, which raises the consolidated blocks of Las Palmitas several meters above the valley floor; similar biases have been reported for SRTM-based flood models in urban areas [19,20]. Third, part of the flooding in 2023 may have been caused by processes that a 1D steady model of the main river cannot represent, such as backwater from the tributary stream that crosses 12 de Octubre, ponding of local runoff and the obstruction of urban drainage. Roughness, in contrast, was a secondary source of uncertainty, in line with previous sensitivity studies [27,28]. A 1D approach was chosen because 1D models predict flood extent with comparable skill to 2D models in many valley settings while requiring far less topographic detail [33]; with the available terrain data, a 2D model would not have overcome the elevation errors described above, which are the main limitation identified here.
These results qualify the conclusions of earlier HEC-RAS applications in the region. Studies in Manabí [10], Riobamba [11], Boyacá [12] and the Peruvian Andes [13] used the same HEC-GeoRAS workflow and found, as we did, that flooding concentrates in low-lying sectors adjacent to the channel; however, they did not report a quantitative comparison with an observed flood, which is precisely where the limitations of the terrain data become visible. Applications that delineated floods successfully with this type of workflow, such as those on the Mejerda River in Tunisia [34] and the Harangi basin in India [35], dealt with wide floodplains at the basin scale, where DEM errors of a few meters are small relative to the flooded area. At the neighborhood scale, in contrast, the same errors are of the order of the flood depth itself [17]. Model geometry also deserves independent checking: cross-sections extracted from surfaces interpolated from coarse contour lines flatten the floodplain into terraces over which very small water depths spread laterally, which can produce a spurious agreement with observed extents; transparent validation statistics and checks of the geometry against the original elevation data are therefore essential [31].
Several lessons are transferable to other small towns with similar data limitations. (i) Freely available global terrain products should not be used to delineate flood boundaries at the neighborhood scale without a field check of channel and floodplain elevations; a few surveyed cross-sections or an unmanned-aerial-vehicle survey would greatly reduce uncertainty. (ii) Observed flood footprints reconstructed from residents’ accounts and photographs are a valuable, low-cost source both for validation and, when models fail, for risk delineation [14]. (iii) The SNGR scoring can be applied consistently with such data, and a simple one-at-a-time robustness test identifies which criteria deserve verification. The specific discharge, roughness, and risk scores, in contrast, are particular to Quinsaloma.
The study has limitations that should be addressed in future work: the event discharge was estimated and no return period could be assigned; validation relied on a single reconstructed event; the observed flood extent and several hazard and vulnerability criteria depend on residents’ accounts and institutional records; and the 1D steady approach ignores flood dynamics and local drainage. Future research should combine higher-resolution topography (UAV photogrammetry or LiDAR), water-level monitoring on the Umbe River, a hydrological estimate of design discharges for several return periods, and a two-dimensional model of the river and urban floodplain (e.g., HEC-RAS 2D), which represents lateral flow paths, ponding, and the effect of buildings and streets more realistically than a 1D model once adequate topography is available.
5. Conclusions
This study tested a low-cost flood risk workflow in two neighborhoods of Quinsaloma, Ecuador. A 1D steady HEC-RAS model built on the 12.5-m ALOS PALSAR terrain product did not reproduce the observed flood of 23 May 2023: for the estimated discharge of 60 m3/s the flow remained in the river corridor, and agreement with the observed extent stayed at most fair even for discharges up to 1500 m3/s, while roughness had a minor effect. The main cause is the terrain product, whose resampled, integer, surface-biased elevations cannot represent the channel and the urban floodplain at this scale. In contrast, the SNGR assessment based on the observed flood footprint and institutional records classified Las Palmitas as high risk and 12 de Octubre as medium risk, and these classes were robust to most one-level changes in the criterion scores.
For local flood risk management, the results support prioritizing early warning, evacuation planning, and drainage improvements in Las Palmitas and verifying the vulnerability information of 12 de Octubre. The simulated hazard maps should not be used as flood boundaries; until surveyed topography and discharge data become available, municipal planning should rely on observed flood footprints such as the one reconstructed here, which should be updated after each event.
Author Contributions
Conceptualization, J.V.-R.; methodology, J.V.-R. and L.V.; software, J.V.-R. and L.V.; validation, J.V.-R.; formal analysis, L.V.; investigation, J.V.-R.; resources, L.V.; data curation, L.V.; writing—original draft preparation, J.V.-R.; writing—review and editing, J.V.-R. and L.V.; supervision, L.V.; project administration, L.V. All authors have read and agreed to the published version of the manuscript.
Funding
This research received no external funding.
Data Availability Statement
The corrected HEC-RAS 6.6 project (SI units), the cross-section geometry, the scripts used for the scenario runs, the validation points, and the observed flood extents supporting the findings of this study are available from the corresponding author upon reasonable request.
Acknowledgments
The authors thank the Cuerpo de Bomberos and the Risk Management Department of the GAD Municipal de Quinsaloma for providing neighborhood boundaries and flood records, as well as the residents of Las Palmitas and 12 de Octubre for sharing their accounts of the 2023 flood.
Conflicts of Interest
The authors declare no conflicts of interest.
References
- Malakeel, G.S.; Abdu Rahiman, K.U.; Vishnudas, S. Flood Risk Assessment Methods—A Review. In Current Trends in Civil Engineering; Lecture Notes in Civil Engineering; Springer: Singapore, 2021; Volume 104, pp. 197–208. [Google Scholar] [CrossRef] [Scilit]
- Razavi Termeh, S.V.; Kornejady, A.; Pourghasemi, H.R.; Keesstra, S. Flood Susceptibility Mapping Using Novel Ensembles of Adaptive Neuro Fuzzy Inference System and Metaheuristic Algorithms. Sci. Total Environ. 2018, 615, 438–451. [Google Scholar] [CrossRef] [Scilit] [PubMed]
- Kuzma, S.; Luo, T. The Number of People Affected by Floods Will Double between 2010 and 2030. World Resources Institute, 2020. Available online: https://www.wri.org/insights/number-people-affected-floods-will-double-between-2010-and-2030 (accessed on 26 June 2024).
- Albano, R.; Mancusi, L.; Sole, A.; Adamowski, J. FloodRisk: A Collaborative, Free and Open-Source Software for Flood Risk Analysis. Geomat. Nat. Hazards Risk 2017, 8, 1812–1832. [Google Scholar] [CrossRef] [Scilit]
- SNGRE. SitRep No. 02—Lluvias, del 14 de Junio de 2024 a la Fecha; Secretaría Nacional de Gestión de Riesgos: Samborondón, Ecuador, 2024. Available online: https://www.gestionderiesgos.gob.ec/wp-content/uploads/2024/06/SitRep-No-02-Lluvias-14062024-al-17062024.pdf (accessed on 20 June 2024).
- SNGRE. Sitrep de Cierre por Lluvias 11.01.2024 al 15.01.2024—A Nivel Nacional; Secretaría Nacional de Gestión de Riesgos: Samborondón, Ecuador, 2024. Available online: https://www.gestionderiesgos.gob.ec/wp-content/uploads/2024/01/Sitrep-de-Cierre-por-LLuvias-11012024-al-15012024.pdf (accessed on 20 June 2024).
- SNGRE-UPREA. Informe de la Unidad de Preparación y Respuesta Los Ríos, Coordinación Zonal 5; Report SNGRE-UPREA-BG-2022-0020-INF; Secretaría Nacional de Gestión de Riesgos: Babahoyo, Ecuador, 2022.
- Municipalidad del Cantón Quinsaloma. Plan de Contingencia Cantonal para Etapa Lluviosa y Fenómeno del Niño, Quinsaloma 2023; GAD Municipal de Quinsaloma: Quinsaloma, Ecuador, 2023.
- Teng, J.; Jakeman, A.J.; Vaze, J.; Croke, B.F.W.; Dutta, D.; Kim, S. Flood Inundation Modelling: A Review of Methods, Recent Advances and Uncertainty Analysis. Environ. Model. Softw. 2017, 90, 201–216. [Google Scholar] [CrossRef] [Scilit]
- Cartaya, S.; Mantuano-Eduarte, R. Identificación de Zonas en Riesgo de Inundación Mediante la Simulación Hidráulica en un Segmento del Río Pescadillo, Manabí, Ecuador. Rev. Investig. 2016, 40, 158–170. [Google Scholar]
- Vallejo-Vizhuete, D.; Reyes-Zambrano, J.; Tenesaca-Saca, M.; Alarcón-Loor, J. Modelación Hidráulica HEC-RAS para la Estimación y Simulación de Inundaciones en la Quebrada Cunduana, Riobamba. Rev. Cient. INGENIAR 2024, 7, 344–366. Available online: https://journalingeniar.org/index.php/ingeniar/article/view/229 (accessed on 26 June 2024).
- Mora Mariño, W.; Ochoa Guerrero, R.G. Modelamiento de Zonas de Inundación por Medio de las Herramientas HEC-RAS, GEO-RAS y ArcGIS, para el Sector Comprendido Entre los Municipios de Corrales–Paz del Río a lo Largo del Río Chicamocha, Boyacá. Bachelor’s Thesis, Universidad Pedagógica y Tecnológica de Colombia, Tunja, Colombia, 2016. Available online: https://repositorio.uptc.edu.co/handle/001/1677 (accessed on 26 June 2024).
- Alcántara Boza, A.; Castro Tenorio, A. Determinación de Zonas Inundables con HEC-RAS en Zonas de la Cordillera Central de los Andes. Microcuenca del Río Saraus–Río La Llanga, Celendín. Rev. Inst. Investig. Fac. Minas Metal. Cienc. Geogr. 2021, 24, 181–187. [Google Scholar] [CrossRef] [Scilit]
- Rojo, F.; Re, M.; Kazimierski, L.D.; Badano, N.D. Validación de un Modelo Hidrológico-Hidráulico en una Cuenca Urbana con Información Generada por los Afectados por Inundaciones. In Proceedings of the IFRH 2016 Conference, Buenos Aires, Argentina, 6–7 October 2016; Available online: https://www.ina.gob.ar/ifrh-2016/trabajos/IFRH_2016_paper_67.pdf (accessed on 3 January 2025).
- SNGR. Lineamientos para Incluir la Gestión del Riesgo de Desastres en el Plan de Desarrollo y Ordenamiento Territorial (PDOT); Servicio Nacional de Gestión de Riesgos y Emergencias: Samborondón, Ecuador, 2019. Available online: https://www.gestionderiesgos.gob.ec/wp-content/uploads/downloads/2019/10/Lineamientos-para-incluir-la-gesti%C3%B3n-del-riesgo-de-desastres-en-el-Plan-de-Desarrollo-y-Ordenamiento-Territorial-PDOT.pdf (accessed on 14 January 2025).
- SIGR-E. Instructivo para Elaborar el Diagnóstico de Riesgos; Ministerio de Educación del Ecuador: Quito, Ecuador, 2017. Available online: https://online.fliphtml5.com/exes/bmqn/#p=1 (accessed on 24 June 2024).
- Cook, A.; Merwade, V. Effect of Topographic Data, Geometric Configuration and Modeling Approach on Flood Inundation Mapping. J. Hydrol. 2009, 377, 131–142. [Google Scholar] [CrossRef] [Scilit]
- Saksena, S.; Merwade, V. Incorporating the Effect of DEM Resolution and Accuracy for Improved Flood Inundation Mapping. J. Hydrol. 2015, 530, 180–194. [Google Scholar] [CrossRef] [Scilit]
- Sanders, B.F. Evaluation of On-Line DEMs for Flood Inundation Modeling. Adv. Water Resour. 2007, 30, 1831–1843. [Google Scholar] [CrossRef] [Scilit]
- Yamazaki, D.; Ikeshima, D.; Tawatari, R.; Yamaguchi, T.; O’Loughlin, F.; Neal, J.C.; Sampson, C.C.; Kanae, S.; Bates, P.D. A High-Accuracy Map of Global Terrain Elevations. Geophys. Res. Lett. 2017, 44, 5844–5853. [Google Scholar] [CrossRef] [Scilit]
- Hawker, L.; Bates, P.; Neal, J.; Rougier, J. Perspectives on Digital Elevation Model (DEM) Simulation for Flood Modeling in the Absence of a High-Accuracy Open Access Global DEM. Front. Earth Sci. 2018, 6, 233. [Google Scholar] [CrossRef] [Scilit]
- ASF DAAC. ALOS PALSAR Radiometric Terrain Corrected High-Resolution Product AP_27249_FBS_F7160_RT1; Includes Material © JAXA/METI 2011; Alaska Satellite Facility Distributed Active Archive Center: Fairbanks, AK, USA, 2015. [Google Scholar] [CrossRef] [Scilit]
- Municipalidad del Cantón Quinsaloma. Adecuación, Actualización y Alineación del Plan de Desarrollo y Ordenamiento Territorial del Cantón Quinsaloma 2020–2024; GAD Municipal de Quinsaloma: Quinsaloma, Ecuador, 2024. Available online: https://quinsaloma.gob.ec/wp-content/uploads/2020/07/ADECUACI%C3%93N-ACTUALIZACI%C3%93N-Y-ALINEACI%C3%93N-DEL-PLAN-DE-DESARROLLO-Y-ORDENAMIENTO-TERRITORIAL-DEL-CANT%C3%93N-QUINSALOMA-2020-2024.pdf (accessed on 14 January 2025).
- Brunner, G.W. HEC-RAS River Analysis System: Hydraulic Reference Manual, Version 6.0; CPD-69; US Army Corps of Engineers, Hydrologic Engineering Center: Davis, CA, USA, 2021. [Google Scholar]
- Cuello, M.M.; Camacho Castilla, R. Modelación de Inundaciones y Análisis Espacial en los Alrededores del Eje Ambiental con HEC-RAS y ArcGIS. Bachelor’s Thesis, Universidad de los Andes, Bogotá, Colombia, 2019. Available online: http://hdl.handle.net/1992/45763 (accessed on 9 June 2024).
- Chow, V.T. Open-Channel Hydraulics; McGraw-Hill: New York, NY, USA, 1959. [Google Scholar]
- Pappenberger, F.; Beven, K.; Horritt, M.; Blazkova, S. Uncertainty in the Calibration of Effective Roughness Parameters in HEC-RAS Using Inundation and Downstream Level Observations. J. Hydrol. 2005, 302, 46–69. [Google Scholar] [CrossRef] [Scilit]
- Hall, J.W.; Tarantola, S.; Bates, P.D.; Horritt, M.S. Distributed Sensitivity Analysis of Flood Inundation Model Calibration. J. Hydraul. Eng. 2005, 131, 117–126. [Google Scholar] [CrossRef] [Scilit]
- Cohen, J. A Coefficient of Agreement for Nominal Scales. Educ. Psychol. Meas. 1960, 20, 37–46. [Google Scholar] [CrossRef] [Scilit]
- Landis, J.R.; Koch, G.G. The Measurement of Observer Agreement for Categorical Data. Biometrics 1977, 33, 159–174. [Google Scholar] [CrossRef] [Scilit]
- Stephens, E.; Schumann, G.; Bates, P. Problems with Binary Pattern Measures for Flood Model Evaluation. Hydrol. Process. 2014, 28, 4928–4937. [Google Scholar] [CrossRef] [Scilit]
- Armijos, E.; Ortega, E.; Correa, E.; Collaguazo, Á. Análisis de Vulnerabilidad Hidrológica por Inundaciones en Ciudades de hasta 6000 Habitantes. Rev. Cienc. Constr. 2024, 5, 30–42. [Google Scholar]
- Horritt, M.S.; Bates, P.D. Evaluation of 1D and 2D Numerical Models for Predicting River Flood Inundation. J. Hydrol. 2002, 268, 87–99. [Google Scholar] [CrossRef] [Scilit]
- Ben Khalfallah, C.; Saidi, S. Spatiotemporal Floodplain Mapping and Prediction Using HEC-RAS–GIS Tools: Case of the Mejerda River, Tunisia. J. Afr. Earth Sci. 2018, 142, 44–51. [Google Scholar] [CrossRef] [Scilit]
- Devanand, M.R.; Kundapura, S. Flood Inundation Mapping of Harangi River Basin, Kodagu, Using GIS Techniques and HEC-RAS Model. In Trends in Civil Engineering and Challenges for Sustainability; Lecture Notes in Civil Engineering; Springer: Singapore, 2021; Volume 99, pp. 665–678. [Google Scholar] [CrossRef] [Scilit]

Disclaimer/Publisher’s Note: The statements, opinions and data contained in all publications are solely those of the individual author(s) and contributor(s) and not of MDPI and/or the editor(s). MDPI and/or the editor(s) disclaim responsibility for any injury to people or property resulting from any ideas, methods, instructions or products referred to in the content. |
© 2026 by the authors. Licensee MDPI, Basel, Switzerland. This article is an open access article distributed under the terms and conditions of the Creative Commons Attribution (CC BY) license.