


Abstract
Mountain regions are highly sensitive to climate warming, and the Himalayas are among the most vulnerable. Rising temperatures and changing hydroclimatic conditions are expected to increase forest fire risk, particularly in the Himalayan foothills and potentially at higher elevations. To investigate the meteorological conditions associated with forest fires in complex terrain, we analyzed 10 years (2011–2020) of km-scale (~3.3 km) ICON-CLM simulations together with MODIS/VIIRS fire observations, GFED5 fire emissions, and ERA5 reanalysis. Fire activity was examined across the Himalayan region (25–40° N, 70–115° E), with particular focus on elevation-dependent patterns. GFED5 indicates increasing black carbon and CO2 emissions from elevations above 1 km, suggesting rising fire activity in Himalayan forests, while MODIS/VIIRS observations show that March–May is the peak fire season. Analysis of meteorological conditions during observed fire events shows that fires are associated with higher temperature, lower relative humidity, stronger winds, and little to no precipitation. A clear elevational shift was identified: compared with fires at 500–1000 m, fire events at 2500–3000 m occurred under relatively cooler and more humid conditions. Both ICON-CLM and ERA5 reproduce this pattern, but ICON-CLM generally represents fire event environments as warmer and drier than ERA5, highlighting the added value of km-scale regional climate modeling for understanding wildfire risk in the complex Himalayan terrain.
1. Introduction
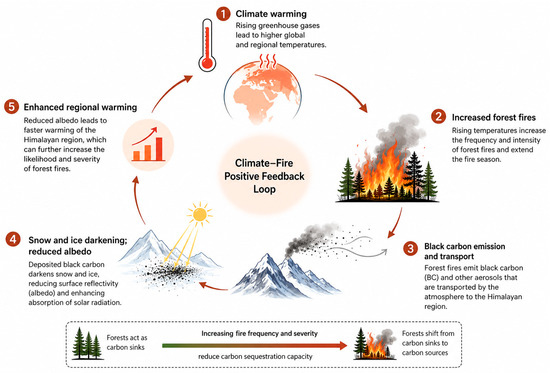
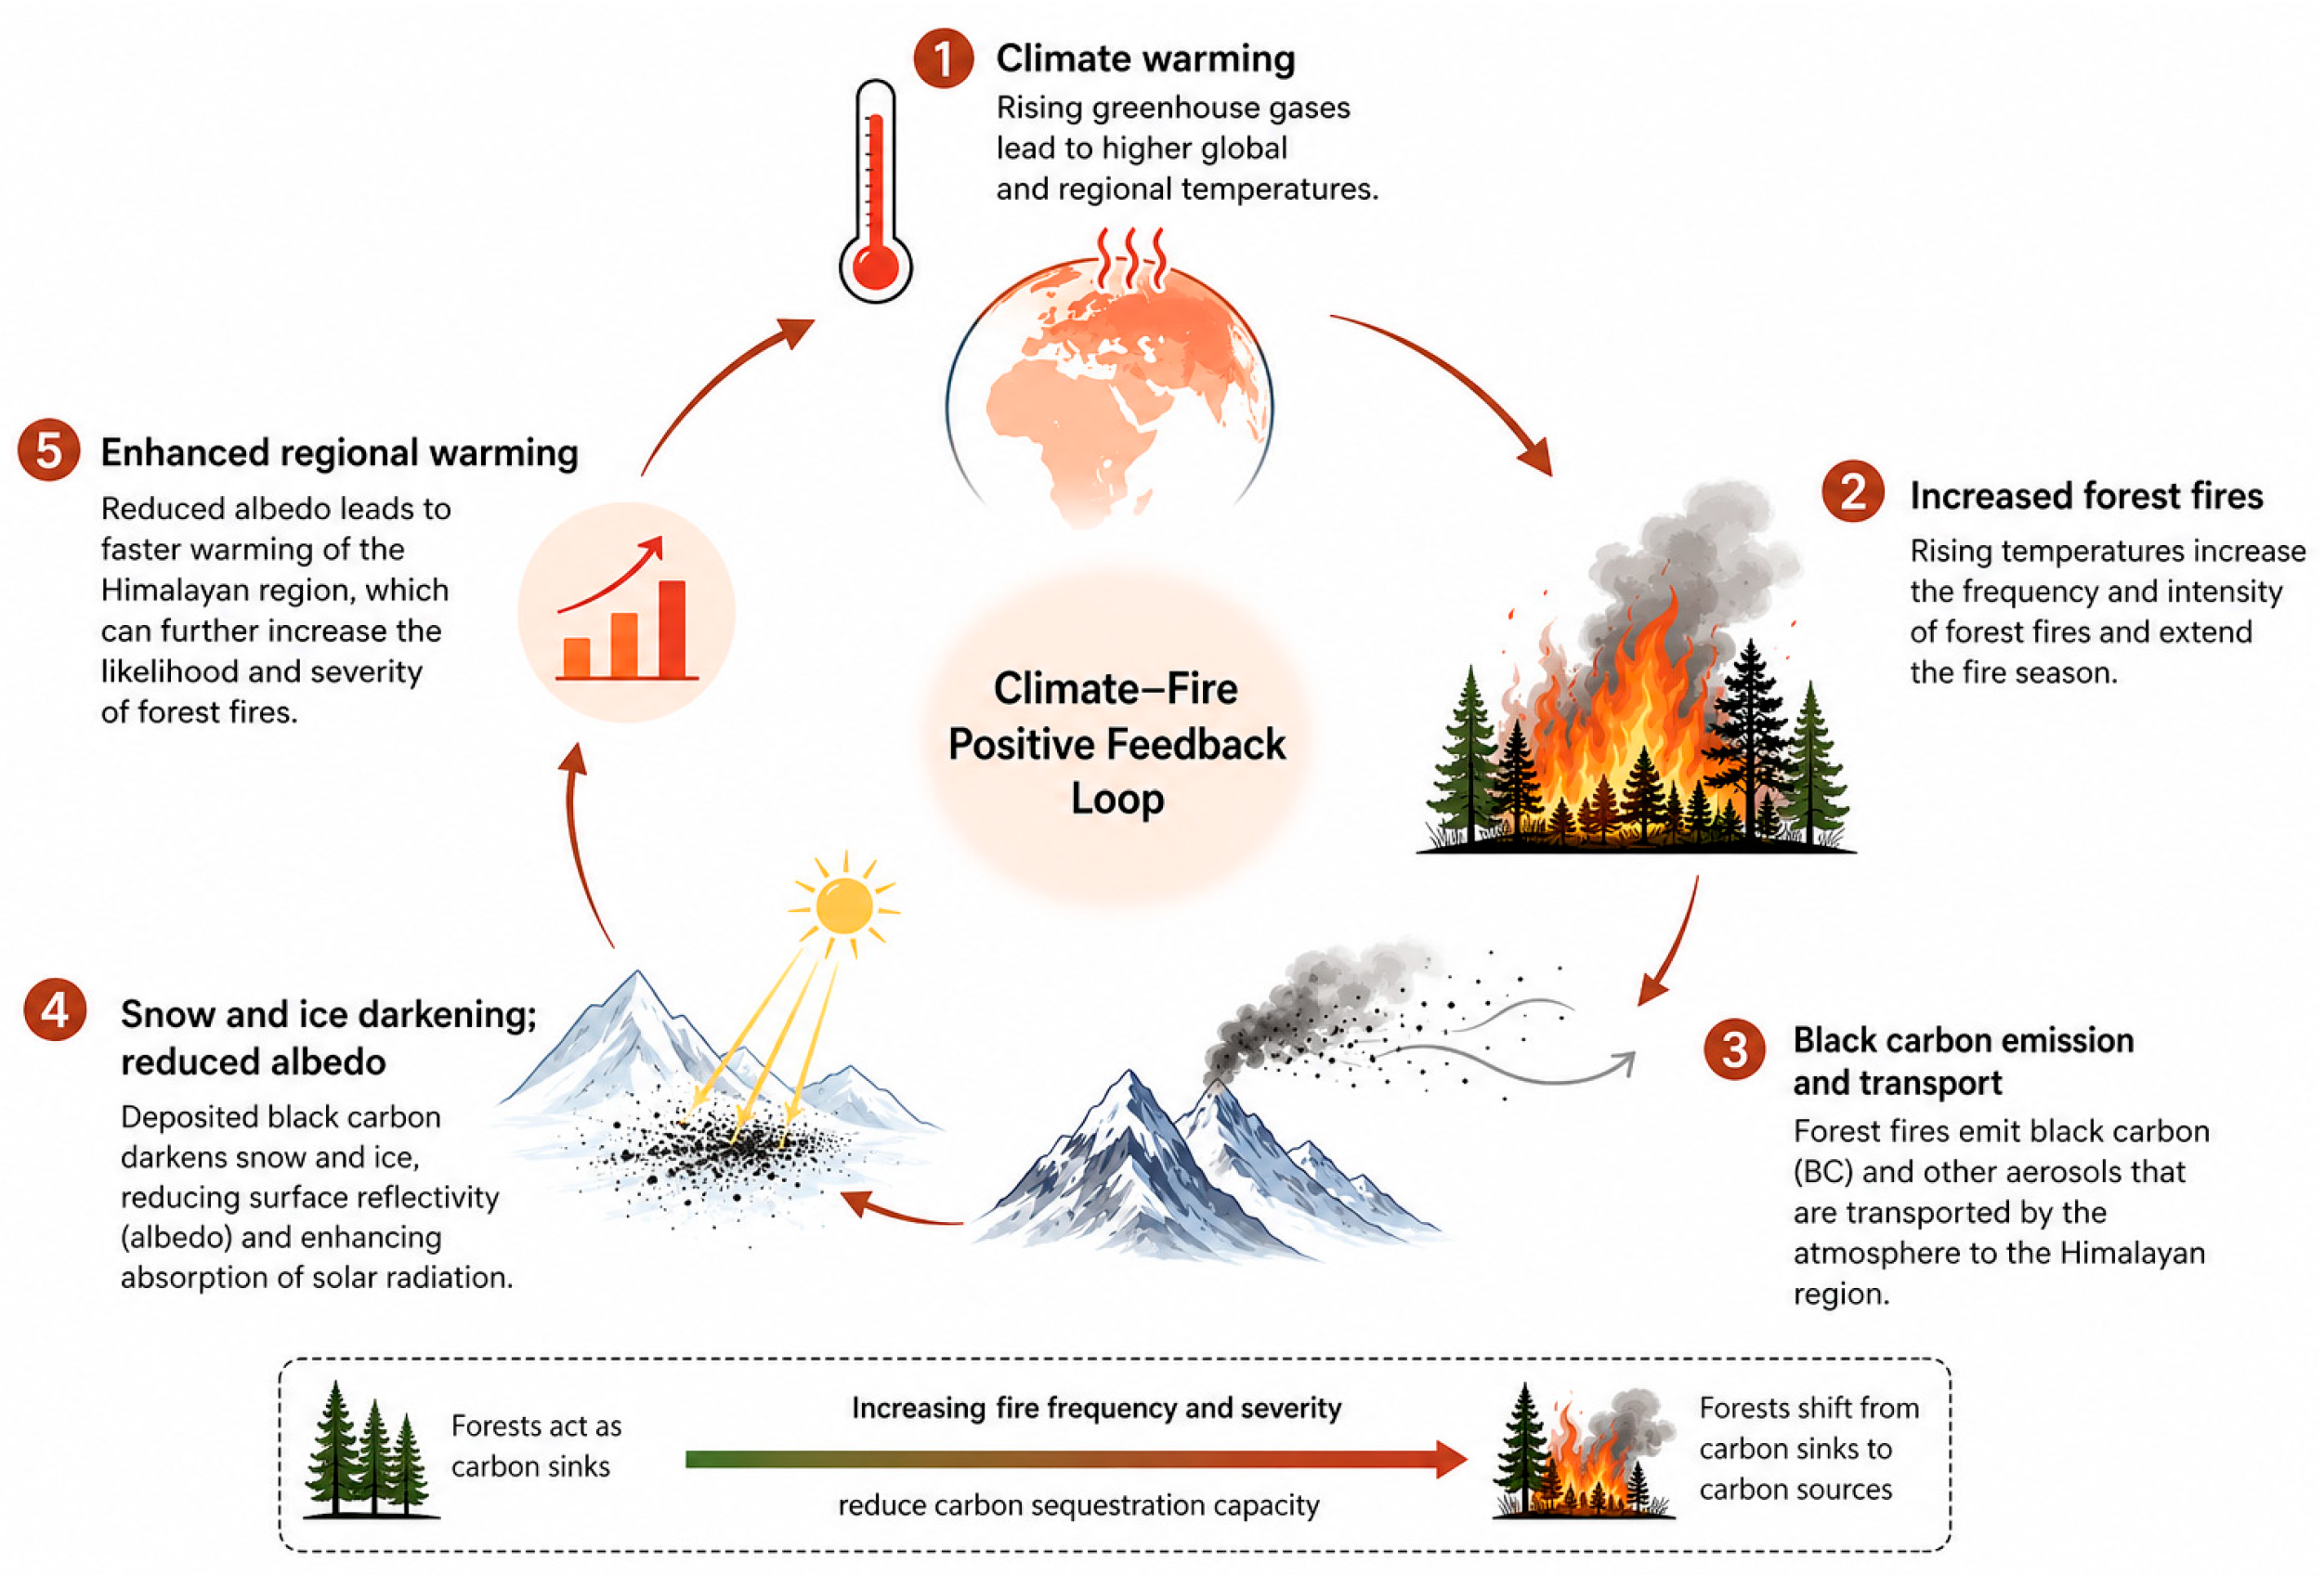
The Hindu-Kush Himalaya region, along with the Tibetan Plateau, is often referred to as the Third Pole (25–40° N, 70–115° E). This region feeds many rivers in South Asia, supporting the livelihoods of approximately 1.5 billion people. In the context of a changing climate [1,2], forest fires have emerged as a significant threat, as they can transport black carbon to the Himalayan region, contributing to a positive feedback loop of warming [3,4]. Rising temperatures may also increase the frequency and intensity of forest fires [5], potentially transforming forests from carbon sinks into major carbon sources (Figure 1).
Figure 1.
Schematic representation of the climate–fire feedback loop in the Himalayan forest.
The scarcity of observational networks and the limited reliability of reanalysis data over the complex terrain of the Himalayas and the Third Pole [6] make it difficult to understand forest fire activity, its drivers, and to predict future events. With advances in computational resources, km-scale simulations offer a valuable tool to investigate meteorological drivers and assess forest fire risk. This study, therefore, uses a decade-long km-scale downscaled meteorological dataset, together with fire observations and emissions data, to investigate fire patterns and their meteorological drivers across the Third Pole [7,8].
2. Data and Methods
This study combines satellite-based fire observations with km-scale ICON-CLM downscaled meteorological simulations and reanalysis data to investigate the meteorological drivers of fire activity in the region.
2.1. Satellite Data
The Global Fire Emissions Database version 5.1 (GFED5.1), available from 2001 onward at a 0.25° spatial resolution with daily and monthly temporal resolutions, was used to assess fire-related emissions over the region (last accessed: 12 May 2026; https://www.globalfiredata.org/index.html) [9].
Active fire data from the Moderate Resolution Imaging Spectroradiometer (MODIS; onboard the Aqua and Terra satellites) and the Visible Infrared Imaging Radiometer Suite (VIIRS; onboard the Suomi National Polar-orbiting Partnership satellite) were obtained from NASA FIRMS and used for fire event detection and trend analysis (last accessed: 12 May 2026; https://firms.modaps.eosdis.nasa.gov/download/).
To assess the role of natural ignition sources, lightning data were obtained from the Lightning Imaging Sensor (LIS) onboard the Tropical Rainfall Measuring Mission (TRMM) and the International Space Station (ISS) for the period 2011–2020. TRMM-LIS provided coverage between 38° N and 38° S from 1998 to early 2015, whereas ISS-LIS has provided coverage between 54.75° N and 54.75° S since 2017 (last accessed: 12 May 2026; https://www.earthdata.nasa.gov/data/catalog/ghrc-daac-comblisath-1).
2.2. ICON-CLM
The numerical ICOsahedral Nonhydrostatic (ICON) modeling framework in climate limited-area mode (CLM), ICON-CLM v2.6.5 [10], was used to dynamically downscale hourly ERA5 data over 25–40° N and 70–115° E at ~3.3 km horizontal resolution with 60 vertical levels. The simulation period extends from October 2010 to September 2020, with a spin-up period from June 2009 to September 2010. Detailed model configuration is provided in Singh and Ahrens (2023, 2025) [7,8].
2.3. Reanalysis (ERA5)
The European Centre for Medium-Range Weather Forecasts (ECMWF) fifth-generation atmospheric reanalysis, ERA5, was used for comparison with the ICON-CLM simulations and for analysis of meteorological conditions during fire events [11]. The data were obtained from the Copernicus Climate Data Store (last accessed on 12 May 2026; https://cds.climate.copernicus.eu).
2.4. Analysis
In this study, monthly fire activity was analyzed over the Himalayan region, with particular focus on fire events occurring above 1000 m within the Third Pole domain, as identified from MODIS/VIIRS satellite observations. Due to the sparse availability of in situ meteorological observations across the Third Pole region, km-scale ICON-CLM simulations were used to derive monthly mean meteorological variables, including 2 m relative humidity (RH2m), 2 m air temperature (T2m), 10 m wind speed (SP10m), and total precipitation (TP).
In addition, the Lightning Potential Index (LPI) derived from the simulations was used to assess the role of natural ignition sources for forest fires in high-elevation regions. The LPI is calculated as:
where is the integration volume, the vertical velocity in the convective updraft, and the effective hydrometeor mixing ratio in the charging zone [12].
Relative humidity at 2 m (RH2m) from ERA5 was calculated from the 2 m air temperature (T2m) and 2 m dewpoint temperature (D2m) using the formula below, following the method described in a previous study [13]:
3. Results
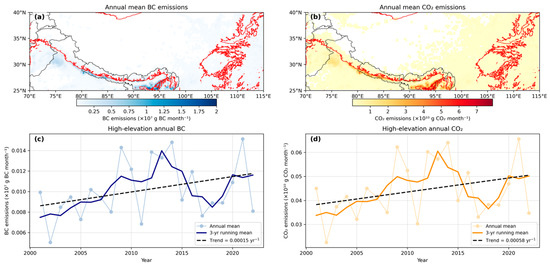
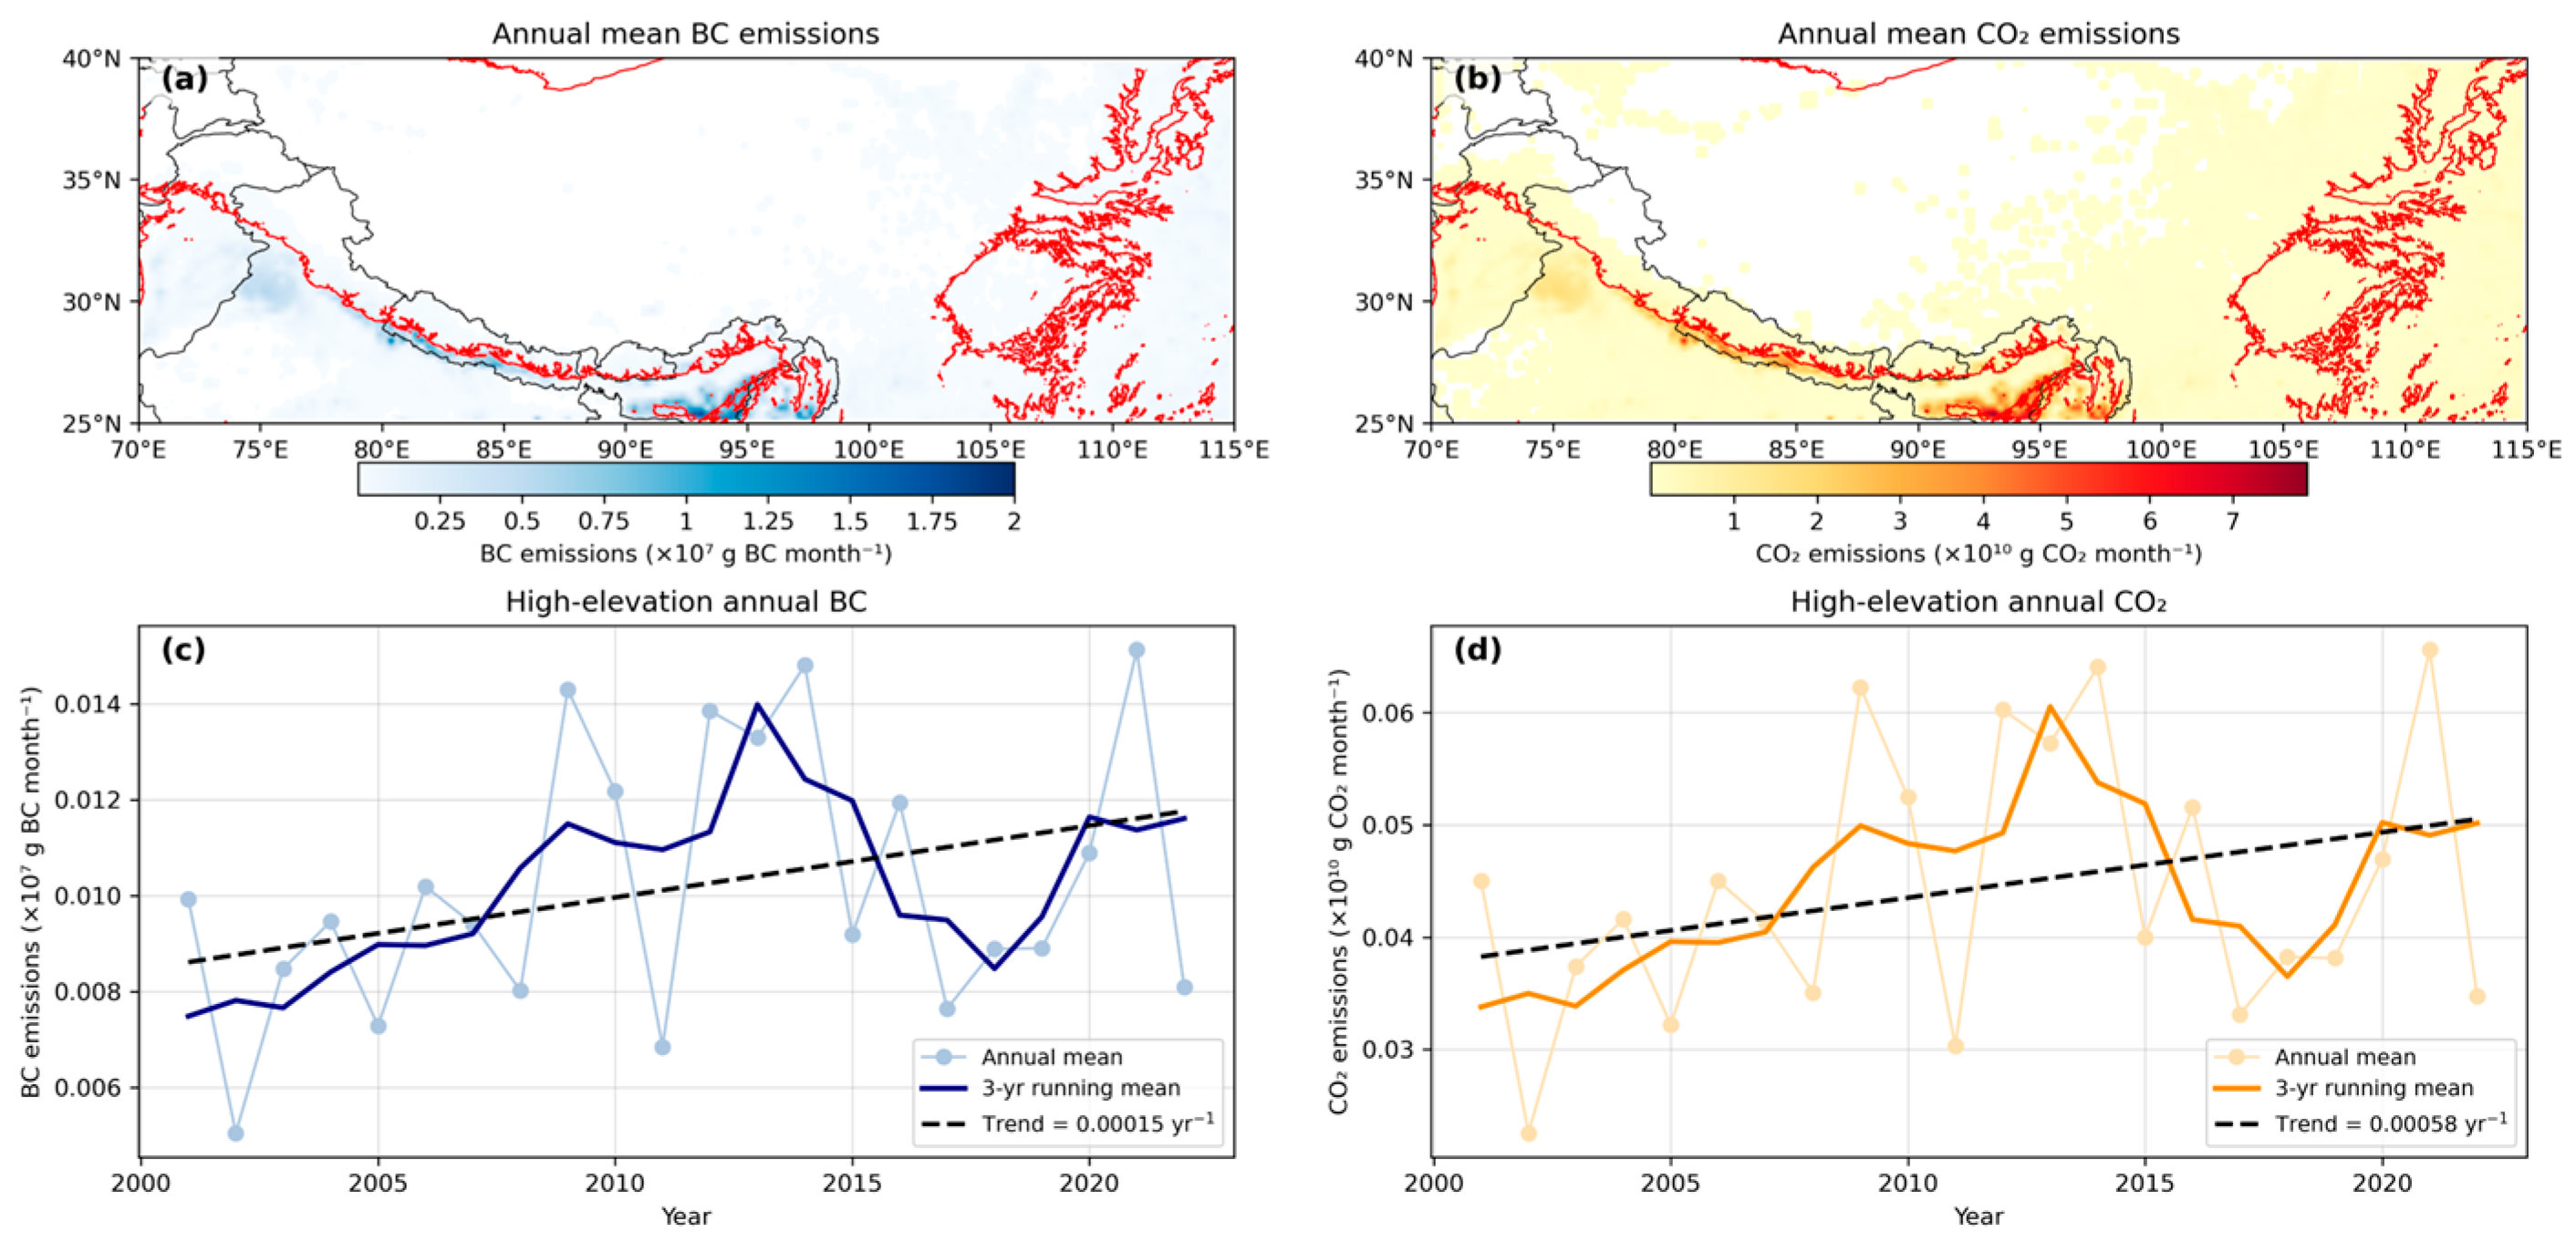
GFED5.1 fire emissions reveal a positive trend in fire-emitted black carbon (BC) and CO2 across the high-elevation Himalayan region. Figure 2a,b show the spatial distribution of mean BC and CO2 emissions, overlaid with the 1 km elevation contour (red). Trend analysis for 2001–2022 indicates an increase of about 1.5 kg month−1 year−1 in BC emissions and 5800 kg month−1 year−1 in CO2 emissions from fires across the Third Pole region, suggesting increasing fire activity and fire-related emissions at higher elevations (Figure 2c,d).
Figure 2.
(a,b) Mean BC and CO2 emissions from 2001 to 2024 over the third Pole region, with the 1000 m elevation contour shown in red. (c,d) Annual mean BC and CO2 emissions for grid cells ≥ 1000 m elevation, showing the linear trend.
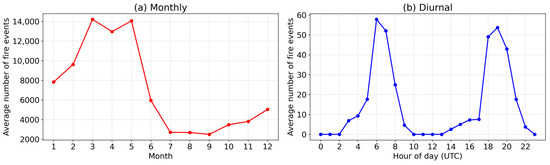
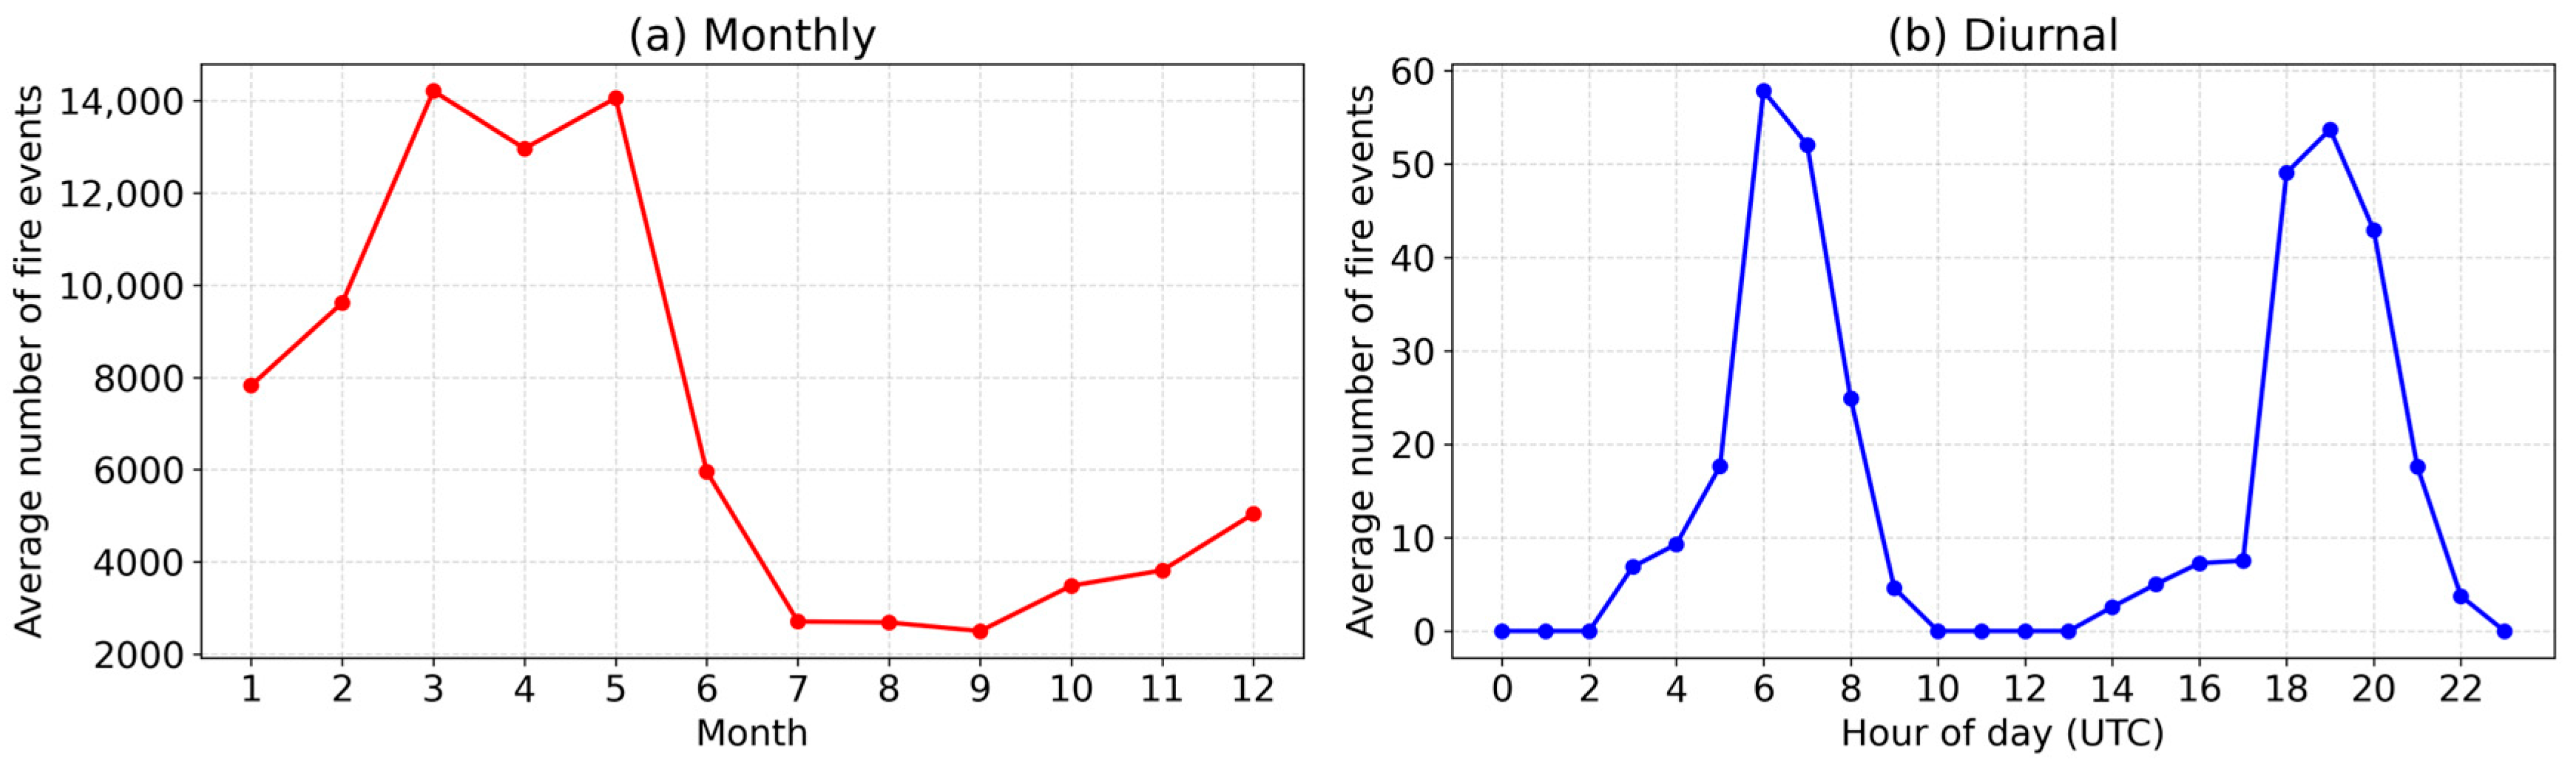
Analyses of MODIS and VIIRS active fire observations over the Third Pole region identified more than 4 million fire events during October 2010–September 2020. Among these, approximately 848,000 events were detected at elevations ≥ 1000 m, demonstrating substantial fire activity in high-elevation environments. Figure 3a presents the monthly mean distribution of fire occurrences across the study period. Fire activity at elevations ≥ 1000 m was most pronounced during the pre-monsoon season (March–May), coinciding with reduced precipitation and elevated surface temperatures. These meteorological conditions are conducive to fuel desiccation and, consequently, to enhanced fire occurrence [2]. The diurnal variation in fire detections exhibits a bimodal pattern, although this feature is partly influenced by the temporal sampling of satellite overpasses. Two prominent peaks are evident: one near 06 UTC (11:00–13:00 local time) and another around 19 UTC (01:00–03:00 local time) (Figure 3b). The daytime maximum is consistent with enhanced surface heating and lower fuel moisture during midday hours. In contrast, the nighttime peak may reflect a combination of factors, including satellite observation timing, anthropogenic influences, and continued fire persistence under relatively stable nocturnal atmospheric conditions (Figure 3b).
Figure 3.
VIIRS/MODIS-observed fire events: (a) monthly distribution and (b) diurnal pattern during the study period over the high elevation Himalayan region.
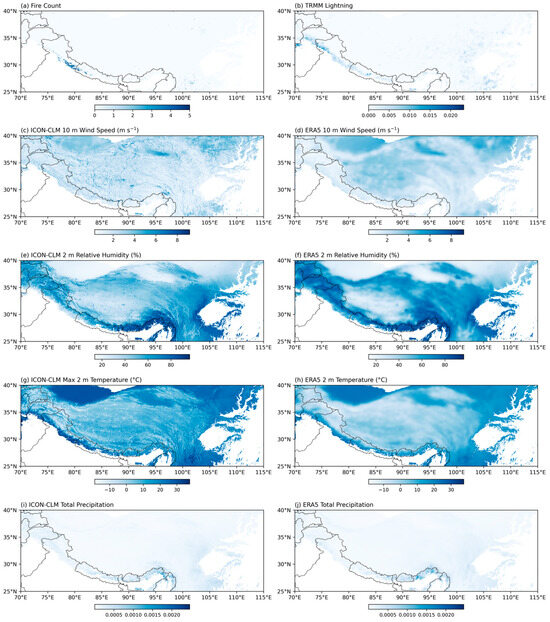
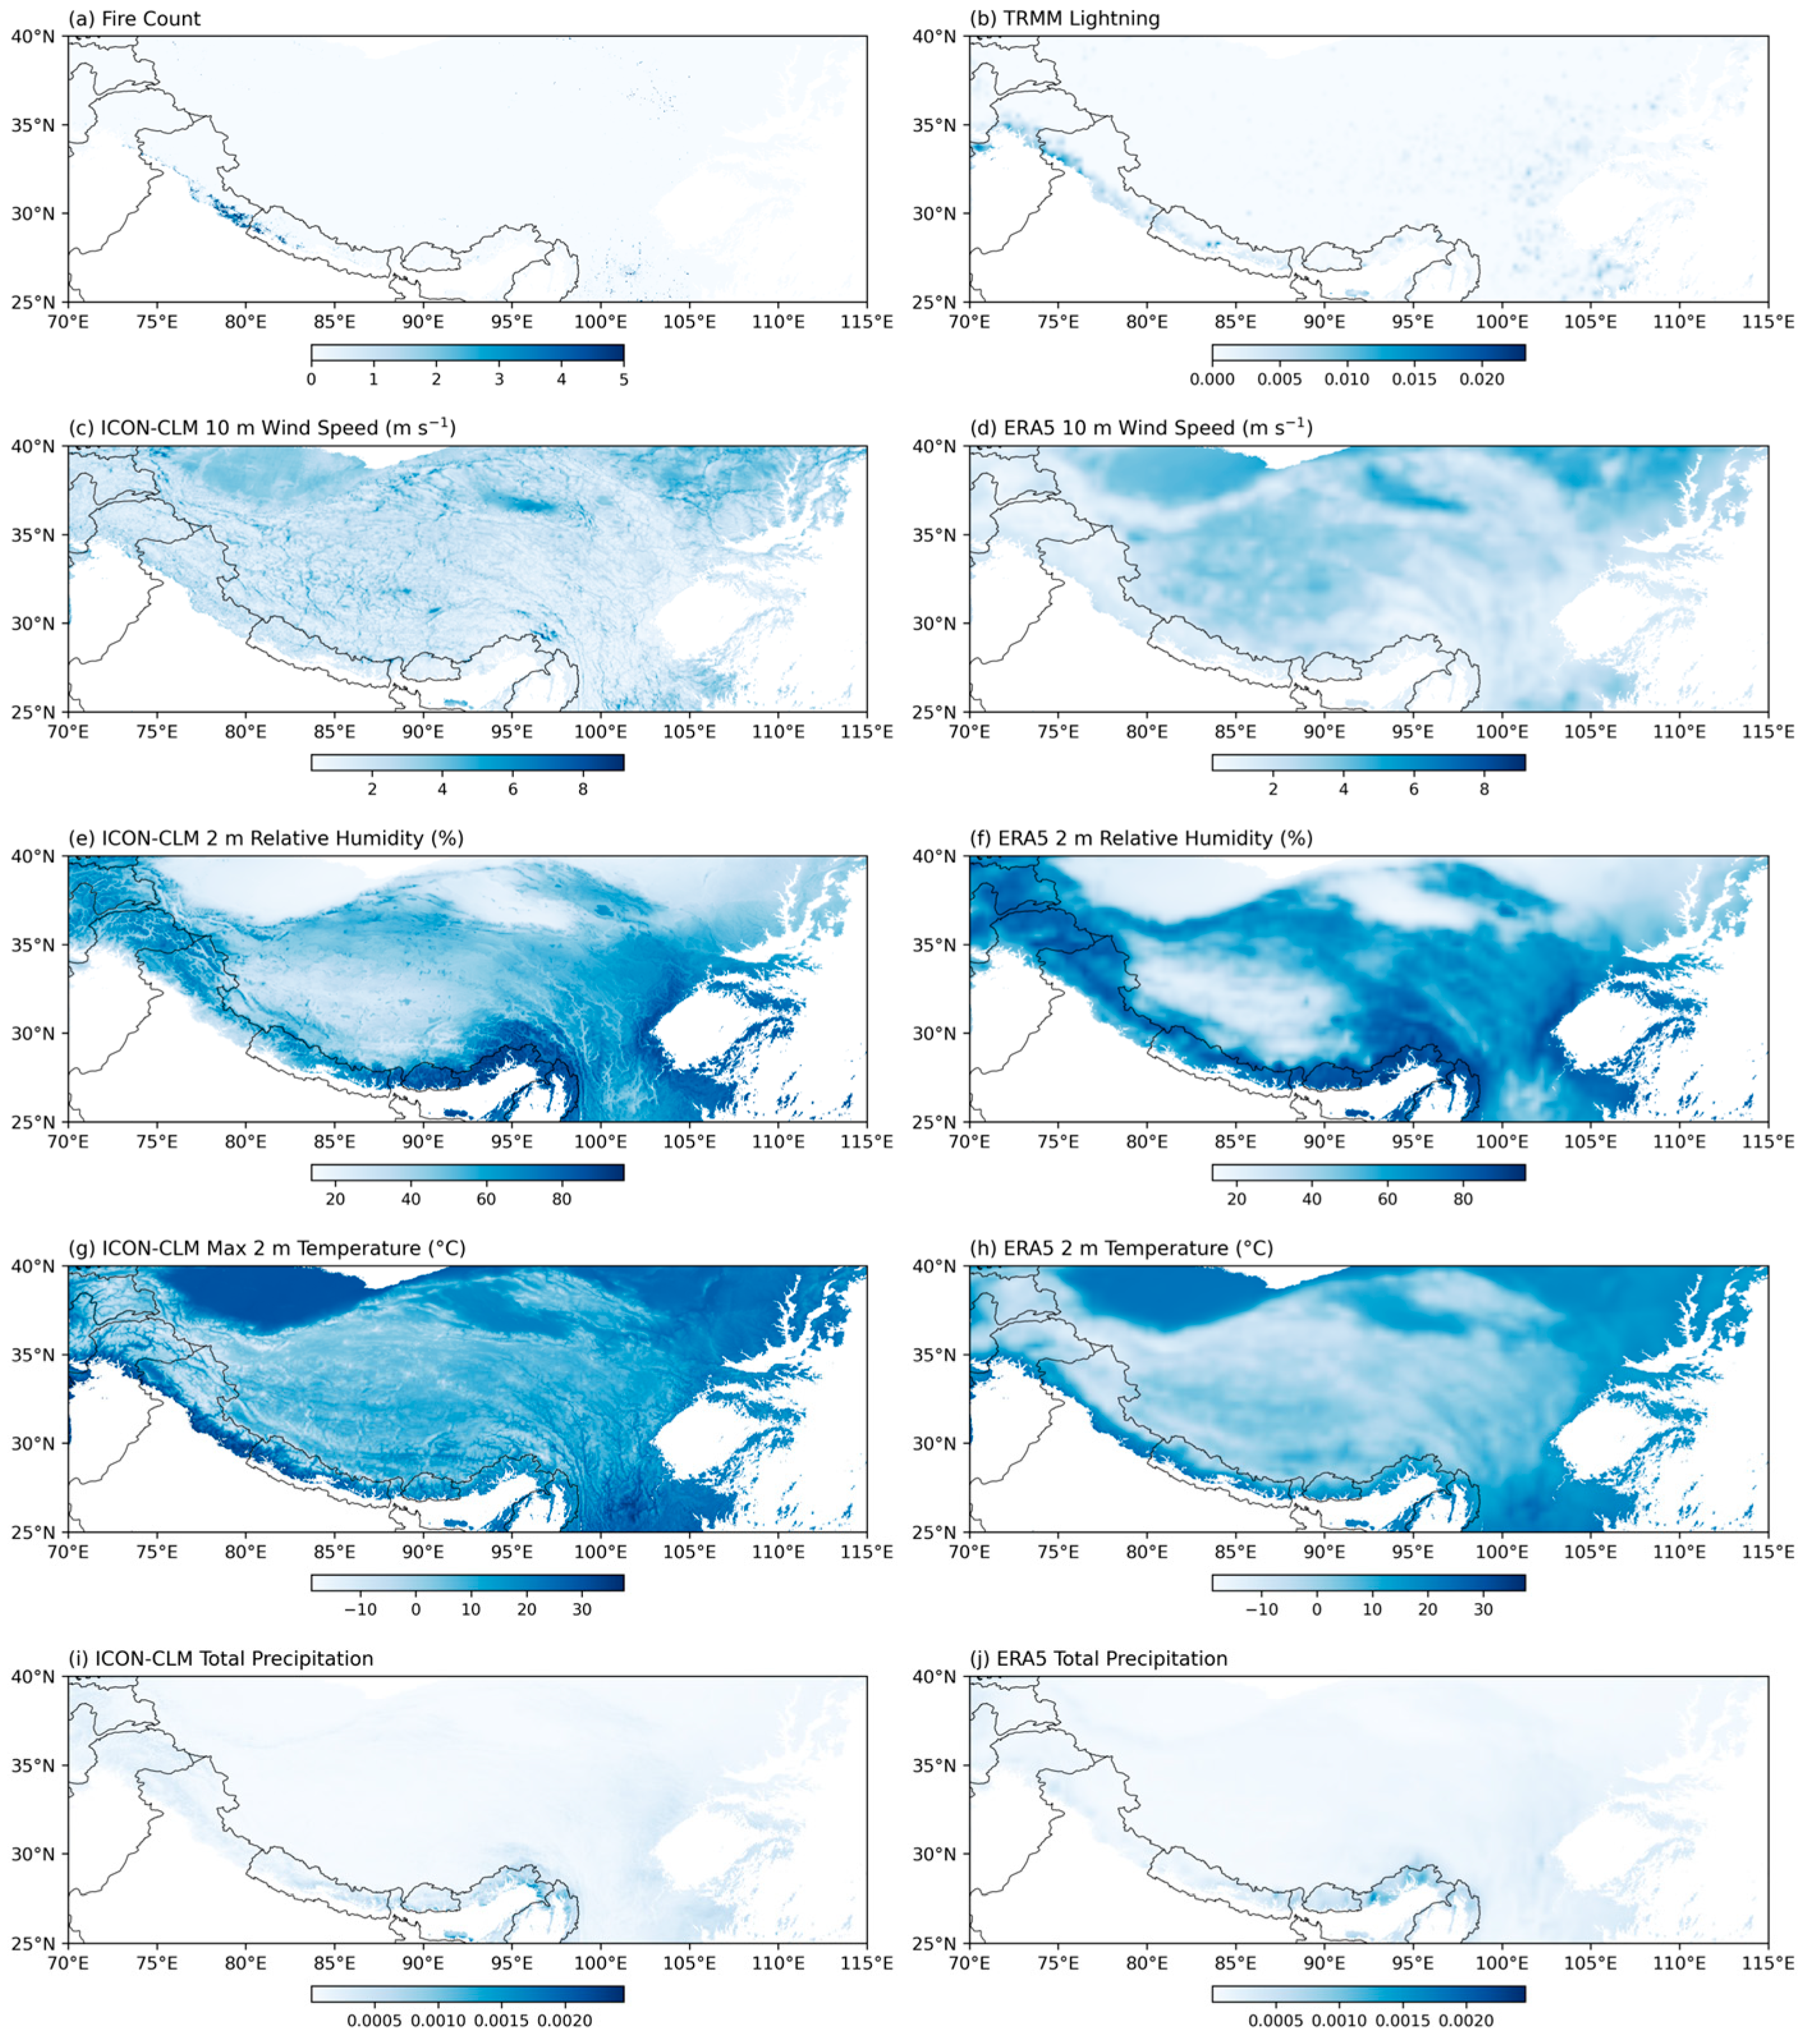
MODIS/VIIRS active fire detections reveal more than five fire events per ICON-CLM grid cell in the western Himalayas during May for the period 2011–2020. Consistent with this pattern, LIS lightning observations and km-scale ICON-CLM simulations of LPI indicate considerable lightning activity over the same region, co-occurring with elevated 2 m air temperatures in areas of observed fire occurrence (Figure 4). ICON-CLM also captures the spatial and temporal variability of key meteorological controls on fire activity, including near-surface wind speed, relative humidity, and precipitation rate, in close agreement with the observed distribution of fire events above 1000 m. By comparison, ERA5 reanalysis shows systematically higher 2 m relative humidity and lower 2 m air temperatures over these regions, thereby depicting a less fire-conducive meteorological environment. These differences suggest that km-scale ICON-CLM simulations provide a more realistic representation of fire-favorable conditions in the complex topography of the western Himalayas than the coarser-resolution ERA5 product.
Figure 4.
Observed fire events (VIIRS/MODIS) and lightning activity (TRMM/ISS), along with ICON-CLM simulations and ERA5 reanalysis of SP10m, RH2m, T2m, and TP for month of May (2011–2020) over regions above 1000 m elevation.
Analysis of MODIS/VIIRS fire occurrence and GFED5.1 fire emissions indicates that fire activity has increased in recent years in low-mountain regions (500–1000 m). Fire occurrence also increased in elevation bands above 1000 m, although events were less frequent than in the 500–1000 m band; importantly, the increasing trend at higher elevations was statistically significant (p < 0.05). Based on these elevational patterns, we further examined the meteorological characteristics of fire events in two representative elevation bands, 500–1000 m and 2500–3000 m, as defined using ICON-CLM orography.
Detailed analysis based on ICON-CLM simulations suggests a clear elevational shift in the meteorological conditions associated with fire events. At low elevations (500–1000 m), 10th, 50th, and 90th percentiles of fire event cases occurred at RH2m values below 15.74%, 28.21%, and 79.36%, respectively. At higher elevations (2500–3000 m), the corresponding RH2m values were 34.12%, 52.69%, and 66.29%. Similarly, the 10th–90th percentile range of T2m during fire events was 295.9–306.3 K at low elevations, but 283.3–290.5 K at high elevations. These findings indicate that fire events at higher elevations occur under relatively cooler and more humid conditions than those at lower elevations. Median values of relative humidity (2 m), temperature (2 m), wind speed (10 m), and precipitation during fire events for the two elevation bands are presented in Table 1.
Table 1.
Median meteorological parameter values simulated during Himalayan fire events in May month over 2011–2020.
A similar analysis using ERA5 reanalysis also revealed an elevational shift in meteorological conditions associated with fire events. At lower elevations, the 10th, 50th, and 90th percentile RH2m values during fire events were 36.83%, 53.36%, and 83.81%, respectively, increasing to 41.42%, 57.34%, and 73.74% at higher elevations. Likewise, the corresponding T2m values were 293.9 K, 298.6 K, and 301.9 K at lower elevations, compared with 279.9 K, 285.8 K, and 291.9 K at higher elevations. This pattern is consistent with the ICON-CLM results and indicates that fire events at higher elevations occur under relatively cooler and more humid conditions. However, systematic differences remain between the two datasets, with ICON-CLM showing generally higher 2 m temperatures and lower 2 m relative humidity during fire events than ERA5 (Figure 4; Table 1).
4. Discussion
Overall, both ICON-CLM and ERA5 indicate a clear elevational shift in the meteorological conditions associated with fire events, with higher-elevation fires occurring under relatively cooler and more humid conditions than those at lower elevations. This result suggests that although fire activity at higher elevations develops under a different meteorological condition than in low-mountain regions, these environments may still become increasingly vulnerable as warming alters regional fire-weather conditions. Previous studies of western Himalayan forest fires have highlighted the important role of human influence, showing that about 54% of human-caused fires occur within 200 m of roads and about 90% within 800 m [2,4]. Such findings indicate that accessibility and human activity are critical controls on fire ignition, particularly in regions where meteorological conditions are already favorable for burning. In a warming climate, higher elevations are expected to experience warmer [6] and, in many cases, drier conditions, which could increase the likelihood of fire-conducive weather and expand the spatial range of fire-prone environments. Under such conditions, human negligence or increased anthropogenic pressure may further amplify fire occurrence.
Large-scale climate variability may also modulate Himalayan fire activity. Prabhakaran and Srivastava (2024) reported links between western Himalayan fires and dry weather associated with ENSO, western disturbances, and phases of the Indian Ocean Dipole [14]. Other studies have suggested that a northward shift in heat-low systems toward the Himalayas may enhance dry conditions favorable for forest fires, particularly at higher elevations [1]. These large-scale climate and synoptic influences are consistent with our findings that fire events are linked to warmer, drier, and less rainy conditions, while also showing that the meteorological characteristics of these events vary systematically with elevation.
Most previous studies have relied on coarse-resolution reanalysis products or station-based meteorological observations, which are limited in their ability to represent the strong spatial heterogeneity of the Himalayan terrain. In this context, the km-scale ICON-CLM simulations used here provide added value by resolving topographic gradients and local meteorological variability more effectively than coarser datasets such as ERA5. Our results, therefore, emphasize the need for future studies that combine high-resolution meteorological fields with information on roads, settlements, land use, ignition sources, and fuel conditions to better quantify the interacting roles of climate, topography, and human activity in Himalayan fire regimes. Such integrated analyses would be particularly valuable for improving fire prediction, early warning, and risk reduction in rapidly changing high-elevation environments.
5. Conclusions
This study shows that fire activity in the Himalayan region during 2011–2020 was most pronounced during the pre-monsoon season and was not confined to low elevations, but also extended into mid- and high-elevation bands. Using MODIS/VIIRS fire observations together with LIS lightning data, ERA5 reanalysis, and km-scale ICON-CLM simulations, we found that fire occurrence in the western Himalayas is partly associated with lightning activity. Fires are also linked to meteorological conditions favorable for burning, particularly higher near-surface temperatures, lower relative humidity, stronger wind speeds, and limited precipitation. The analysis further reveals a clear elevational shift in the meteorological environment of fire events. Fire at higher elevations occurred under relatively cooler and more humid conditions than those at lower elevations, indicating that the meteorological conditions associated with fire activity change systematically with altitude. At the same time, systematic differences remain between datasets, with ICON-CLM generally representing fire-event conditions as warmer and drier than ERA5. These differences likely reflect the added value of km-scale regional modeling in resolving topographic gradients and near-surface meteorological variability in complex Himalayan terrain.
Our results highlight the importance of combining satellite observations with high-resolution regional climate simulations to improve understanding of wildfire occurrence and associated atmospheric emissions in the Himalayas. Such integrated analyses can also support a more reliable assessment of fire-conducive weather across elevation zones. Future event-based studies that explicitly consider ignition sources, fuel conditions, and human activities would further improve understanding of the drivers of Himalayan fires and help strengthen fire prediction, early warning, and risk reduction strategies in the region.
Author Contributions
Conceptualization, methodology, software, validation, formal analysis, investigation, data curation, visualization, and writing—original draft preparation, P.S.; resources, writing—review and editing, supervision, project administration, and funding acquisition, B.A. All authors have read and agreed to the published version of the manuscript.
Funding
This work was funded by the Deutsche Forschungsgemeinschaft (DFG, German Research Foundation)—TRR 301—Project-ID 428312742.
Institutional Review Board Statement
Not applicable.
Informed Consent Statement
Not applicable.
Data Availability Statement
The ICON-CLM simulation data can be accessed through CPTP-CORDEX at http://rcg.gvc.gu.se/cordex_fps_cptp/ (last access: 11 May 2026; Contribution No. 17). All observational and reanalysis datasets used in this study are publicly available and can be accessed from the sources listed in the Section 2.
Acknowledgments
The authors thank Goethe-NHR (project number: 26074) and DKRZ (project number: BB1064) for providing computational resources.
Conflicts of Interest
The authors declare no conflicts of interest.
References
- Singh, P. Significance of Summertime Heat Low over the Northern Part of the Indian Subcontinent in the Changing Climate. Environ. Earth Sci. Proc. 2025, 34, 4. [Google Scholar] [CrossRef] [Scilit]
- Charak, A.S.; Kumar, R.; Verma, A.K.; Kumar, B.R.; Kumar, S. Bioclimatic, Anthropogenic and Topographical Drivers of Forest Fire Dynamics in the Western Himalaya. Trees For. People 2026, 25, 101258. [Google Scholar] [CrossRef] [Scilit]
- Singh, P.; Sarawade, P.; Adhikary, B. Carbonaceous Aerosol from Open Burning and Its Impact on Regional Weather in South Asia. Aerosol Air Qual. Res. 2020, 20, 419–431. [Google Scholar] [CrossRef] [Scilit]
- Mina, U.; Dimri, A.P.; Farswan, S. Forest Fires and Climate Attributes Interact in Central Himalayas: An Overview and Assessment. Fire Ecol. 2023, 19, 14. [Google Scholar] [CrossRef] [Scilit]
- Flannigan, M.D.; Stocks, B.J.; Wotton, B.M. Climate Change and Forest Fires. Sci. Total Environ. 2000, 262, 221–229. [Google Scholar] [CrossRef] [Scilit] [PubMed]
- Rameshan, A.; Singh, P.; Ahrens, B. Cross-Examination of Reanalysis Datasets on Elevation-Dependent Climate Change in the Third Pole Region. Atmosphere 2025, 16, 327. [Google Scholar] [CrossRef] [Scilit]
- Singh, P.; Ahrens, B. Modeling Lightning Activity in the Third Pole Region: Performance of a Km-Scale ICON-CLM Simulation. Atmosphere 2023, 14, 1655. [Google Scholar] [CrossRef] [Scilit]
- Singh, P.; Ahrens, B. Lightning-Intense Deep Convective Transport of Water Vapour into the UTLS over the Third Pole Region. Atmos. Chem. Phys. 2025, 25, 17869–17888. [Google Scholar] [CrossRef] [Scilit]
- van der Werf, G.; Randerson, J.; van Wees, D.; Chen, Y.; Giglio, L.; Hall, J.; Vernooij, R.; Mu, M.; Binte Shahid, S.; Barsanti, K.; et al. Global Fire Emissions Database Version 5 (GFED5). 2025. Available online: https://zenodo.org/records/16794692 (accessed on 22 June 2026).
- Van Pham, T.; Steger, C.; Rockel, B.; Keuler, K.; Kirchner, I.; Mertens, M.; Rieger, D.; Zäng, G.; Früh, B. Icon in Climate Limited-Area Mode (Icon Release Version 2.6.1): A New Regional Climate Model. Geosci. Model Dev. 2021, 14, 985–1005. [Google Scholar] [CrossRef] [Scilit]
- Hersbach, H.; Bell, B.; Berrisford, P.; Hirahara, S.; Horányi, A.; Muñoz-Sabater, J.; Nicolas, J.; Peubey, C.; Radu, R.; Schepers, D.; et al. The ERA5 Global Reanalysis. Q. J. R. Meteorol. Soc. 2020, 146, 1999–2049. [Google Scholar] [CrossRef] [Scilit]
- Lynn, B.; Yair, Y. Prediction of Lightning Flash Density with the WRF Model. Adv. Geosci. 2010, 23, 11–16. [Google Scholar] [CrossRef] [Scilit]
- Pernov, J.B.; Gros-Daillon, J.; Schmale, J. Comparison of Selected Surface Level ERA5 Variables against In-situ Observations in the Continental Arctic. Q. J. R. Meteorol. Soc. 2024, 150, 2123–2146. [Google Scholar] [CrossRef] [Scilit]
- Prabhakaran, A.; Srivastava, P. Analysis of Prevailing Atmospheric Conditions during Wildfire Events in the Indian Himalayan Region. Q. J. R. Meteorol. Soc. 2024, 151, e4918. [Google Scholar] [CrossRef] [Scilit]

Disclaimer/Publisher’s Note: The statements, opinions and data contained in all publications are solely those of the individual author(s) and contributor(s) and not of MDPI and/or the editor(s). MDPI and/or the editor(s) disclaim responsibility for any injury to people or property resulting from any ideas, methods, instructions or products referred to in the content. |
© 2026 by the authors. Licensee MDPI, Basel, Switzerland. This article is an open access article distributed under the terms and conditions of the Creative Commons Attribution (CC BY) license.