


Abstract
Large language models are increasingly used for building fault diagnosis, but input representation is often changed alongside model adaptation or added knowledge. This study isolates serialization effects using matched rooftop unit measurements rendered as deterministic prose, fixed schema JSON, and JSON with a fixed evidence card covering all classes. Nine API models evaluated 240 windows from 39 source files in the public ORNL_RTU dataset across four diagnostic classes. Prompt development was separated from evaluation by season, and uncertainty was assessed at the source file level. Observed macro F1 differences between JSON and prose ranged from −0.082 to 0.029, and no model-specific contrast remained significant after Holm adjustment, which does not establish equivalence. Output validity nevertheless varied: JSON reduced the MiniMax invalid schema rate by 0.333, the evidence card increased Kimi diagnostic coverage by 0.508, and larger macro F1 changes coincided with changes in schema validity or abstention. Model condition macro F1 ranged from zero to 0.182, compared with 0.543 for a supervised Random Forest reference under seasonal holdout, so no evaluated zero-shot configuration is suitable for unattended fault classification. Diagnostic accuracy, schema validity, abstention, and name-level evidence grounding should therefore be evaluated jointly when selecting input representations.
1. Introduction
Heating, ventilation, and air conditioning (HVAC) systems can carry persistent faults that reduce energy efficiency, comfort, and equipment life without producing obvious alarms. Fault detection and diagnostics (FDD) includes physical, rule-based, statistical, and data-driven methods [1,2]. Recent reviews identify data quality, metadata standardization, performance benchmarking, interpretability, and transferability as persistent barriers to deployment in buildings [3,4,5]. Building automation data are often incomplete, irregularly logged, or affected by sensor drift and bias, so a faulty sensor can itself be the diagnostic target rather than a reliable input. Labeled faulted operation is scarce in real buildings, and supervised models trained on one system or season often transfer poorly to others [3,4]. Operators also need to understand why a fault is reported before acting on it, yet many data-driven classifiers offer limited interpretability [4,5]. Language models have attracted interest because they can return a diagnosis with a readable rationale without task-specific training, but this benefit depends on whether their outputs are valid, answerable, and grounded in the supplied measurements. The present evaluation controls these difficulties rather than solving them: data quality through explicit completeness and operation criteria, transfer between seasons through seasonal separation, and interpretability through a name-level evidence audit.
Large deployments also show that faults are sufficiently common and persistent to justify scalable diagnostic support [6,7]. A valid comparison requires an appropriate evaluation unit. Windows from the same physical run are correlated, and random splits at the window level can place signatures from one source file in both training and test data. Established FDD frameworks therefore require explicit fault definitions, reproducible test conditions, and a well-defined input sample [8]. The public Lawrence Berkeley National Laboratory (LBNL) FDD collection provides labeled faulted and fault-free data from simulation, controlled experiments, and field measurements, with detailed provenance [9,10]. Its ORNL_RTU subset includes controlled seasons, fault families, and intensities from a physical test facility.
Zero-shot LLM diagnosis differs from conventional supervised diagnosis because an API model can process operational summaries without task-specific training. Its response can depend on how the same tabular evidence is represented. Studies of tabular prompting show that LLMs can classify structured records rendered as language [11]. Studies of long context prompts and input formatting also show sensitivity to information position and presentation [12,13]. These studies were not designed around multichannel engineering telemetry, explicit abstention, or diagnostic output that must satisfy a machine-readable schema. Recent HVAC studies combine model tuning, retrieval, knowledge graphs, agents, active sampling, evidence condensation, and knowledge distillation [14,15,16,17,18]. These systems address broader design questions than the effect of a fixed operational schema on an unchanged general-purpose model. Building metadata standards such as Brick further establish the value of machine-readable equipment and point roles [19,20].
The primary analysis compares deterministic prose and JSON representations of one hour of rooftop unit measurements while holding numeric evidence, candidate labels, task instructions, model, and output schema constant. C0 contains a content-matched natural language summary. C1 contains structured JSON. C2 adds the same fixed evidence card for all four classes to every JSON input and estimates the contribution of concise documentation without window-specific retrieval. The paired evaluation estimates representation and documentation effects before model adaptation, retrieval, autonomous actions, or equipment control. Telemetry is transformed into a validated evidence object before the model receives its diagnostic input. Prompt development and report evaluation are separated by season. Source CSV files, not 60 min windows, define the split, leakage control, and uncertainty resampling units.
Relative to prior work on tabular serialization and prompt format sensitivity [11,12,13], the RTU setting has four features that can change how representation acts on a model. First, the input is a multichannel summary of numeric telemetry in which each value carries a physical unit, a statistic type, and a control role, so diagnosis depends on relationships among commands, measured responses, and setpoints rather than on any single field. Second, the label set is closed and includes explicit abstention, so representation can alter whether a model commits to a diagnosis separately from whether the diagnosis is correct. Third, the response must satisfy a strict schema for downstream automation, which makes output validity an outcome in its own right. Fourth, windows are clustered within physical runs, and inputs are held at exact information parity, so effects are estimated at the source file level and cannot arise from differences in numeric content. The contribution is therefore a separation of representation effects on diagnostic correctness, answerability, and output validity under exact information parity and source file clustering, rather than a transfer of earlier format sensitivity results to a new domain with more models. JSON may matter in this setting because it states variable identity, unit, and statistic type as explicit fields, uses the same serialization as the required output object, and changes token count and layout. Because these mechanisms can act in opposite directions, the endpoints fixed before the report run are restated here as three two-sided hypotheses for each model. H1: fixed schema JSON changes macro F1 relative to content-matched prose. H2: representation changes abstention and therefore diagnostic coverage. H3: representation changes the rate of schema-valid output. H1 is the primary confirmatory endpoint, whereas H2 and H3 correspond to prespecified secondary outcomes that are reported descriptively; the same outcomes describe the secondary contrast between C2 and C1.
2. Background and Related Work
2.1. HVAC Fault Diagnosis, Data, and Evaluation Units
Classical FDD methods range from first principles residual analysis and expert rules to statistical classification and modern machine learning [1,2,3,4,5]. Packaged rooftop units, RTUs, are suitable for controlled benchmarking because their modes, temperature relationships, damper commands, and component power provide interpretable signatures. Statistical learning has achieved multiclass RTU diagnosis from measured features [21], and hierarchical combinations of detection and classification have been proposed for broader HVAC systems [22]. These methods provide a task difficulty reference for the LLM evaluation. Differences in training data and split design preclude direct performance ranking.
The LBNL FDD collection supports common evaluation of building diagnostic algorithms [9], and the archive record preserves data provenance [10]. The selected ORNL_RTU subset was produced in a controlled, unoccupied commercial test facility with emulated internal loads. Each file contains one-minute measurements from a documented fault condition.
The data contain two observation scales. A source file represents one controlled physical run, and multiple 60 min windows can be extracted from that run. Treating these windows as independent would overstate the effective sample size. Source files remain intact in all split, leakage control, and bootstrap operations. Spring is reserved for prompt development. Fall, Summer, and Winter form the locked report set.
2.2. LLMs for Building Operation and Fault Diagnosis
Domain-specific HVAC language models have been trained with labeled diagnostic data [14]. Related building operation and maintenance systems combine LLMs with document processing, retrieval-augmented generation, and knowledge graphs [15]. Other studies combine an agent with an ontology and diagnostic rules [16], distill diagnostic capability into smaller models [17], or reduce labeling requirements through active sampling and SHAP-guided evidence condensation [18]. Model adaptation and additional knowledge make the isolated effect of input representation difficult to estimate.
The evaluation holds the surrounding system constant to measure serialization. Nine general-purpose API models from nine vendor families are evaluated without model tuning or window-specific retrieval. Each condition uses the same four candidate labels and JSON output schema. The difference between C1 and C0 estimates the serialization effect for each model.
2.3. Representation, Semantics, and Output Validity
Tabular data must be represented in text before an LLM can process it. TabLLM showed that rows rendered as text can support few-shot classification [11]. Representation choices can alter which relationships a model recovers. Prompt formatting can change model behavior even when task meaning is unchanged [13]. Evidence placement and irrelevant context can also reduce effective use of supplied information [12,23]. A fixed schema makes variable identity, unit, and statistic type explicit while changing information layout and token budget. The effect of this representation choice is measured empirically in the present evaluation.
Building ontologies illustrate the value of stable equipment and point roles. Brick formalizes entities and relationships used in building systems [19,20]. This evaluation uses stable machine-readable variable roles without constructing an ontology. Generated rationales are treated as contextual output. Evidence use is assessed only at the level of variable names returned in the evidence field, as defined in Section 3.2. The variable-level measure complements broader hallucination detection approaches [24].
3. Materials and Methods
3.1. Study Design, Dataset, and Sampling
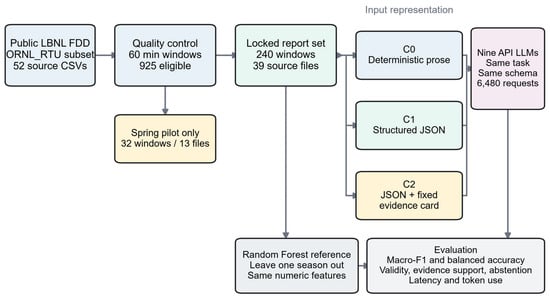
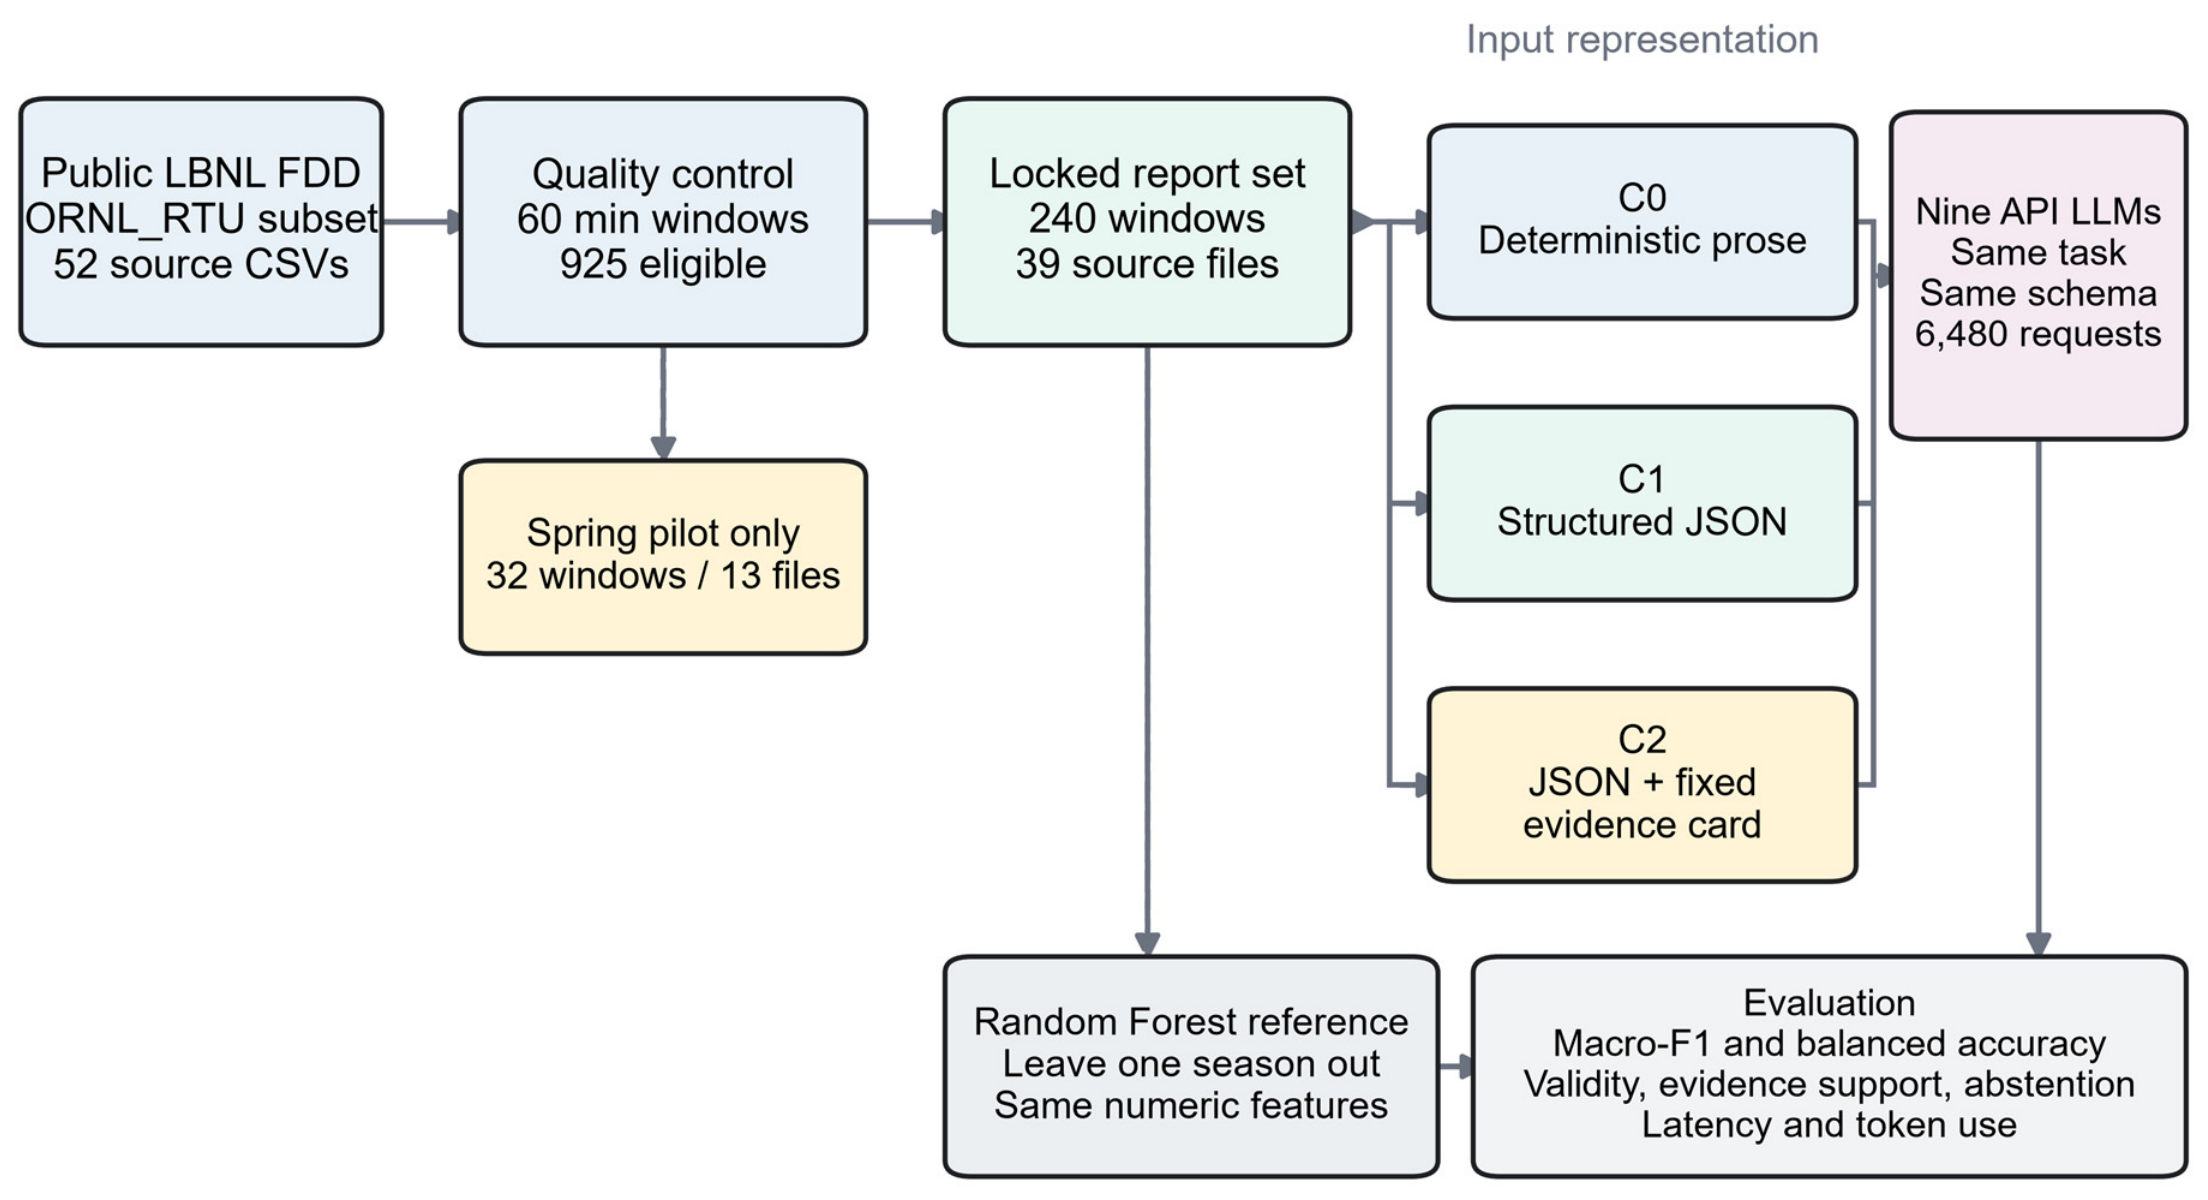
Figure 1 summarizes the leakage-controlled design. The primary endpoint is the paired difference in macro F1 between C1 and C0 for each model. The difference between C2 and C1 estimates the effect of the fixed evidence card conditional on JSON representation.
Figure 1.
Leakage-controlled study workflow showing the pilot, locked report set, input conditions, model run, baseline, and evaluation outputs.
No prompt is tuned against report labels. Prompt wording, selected signals, class vocabulary, window rules, evidence card, model settings, and evaluation code are frozen before the real report API run.
Data were obtained from the public LBNL FDD RTU archive, DOI 10.25984/1881324 [9,10]. The analysis uses the internally consistent ORNL_RTU controlled experimental subset. The four target classes are fault-free operation, incorrect economizer setpoint, outdoor air damper stuck, and supply air temperature sensor bias. The released files cover Fall 2020, Spring 2021, Summer 2021, and Winter 2022, with four intensities per fault family and one fault-free file per season, giving 48 fault files and 52 source CSV files, as listed in Table 1.
Table 1.
Dataset provenance and analysis partitions.
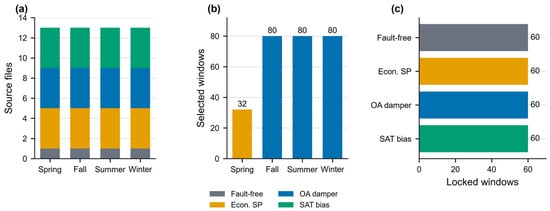
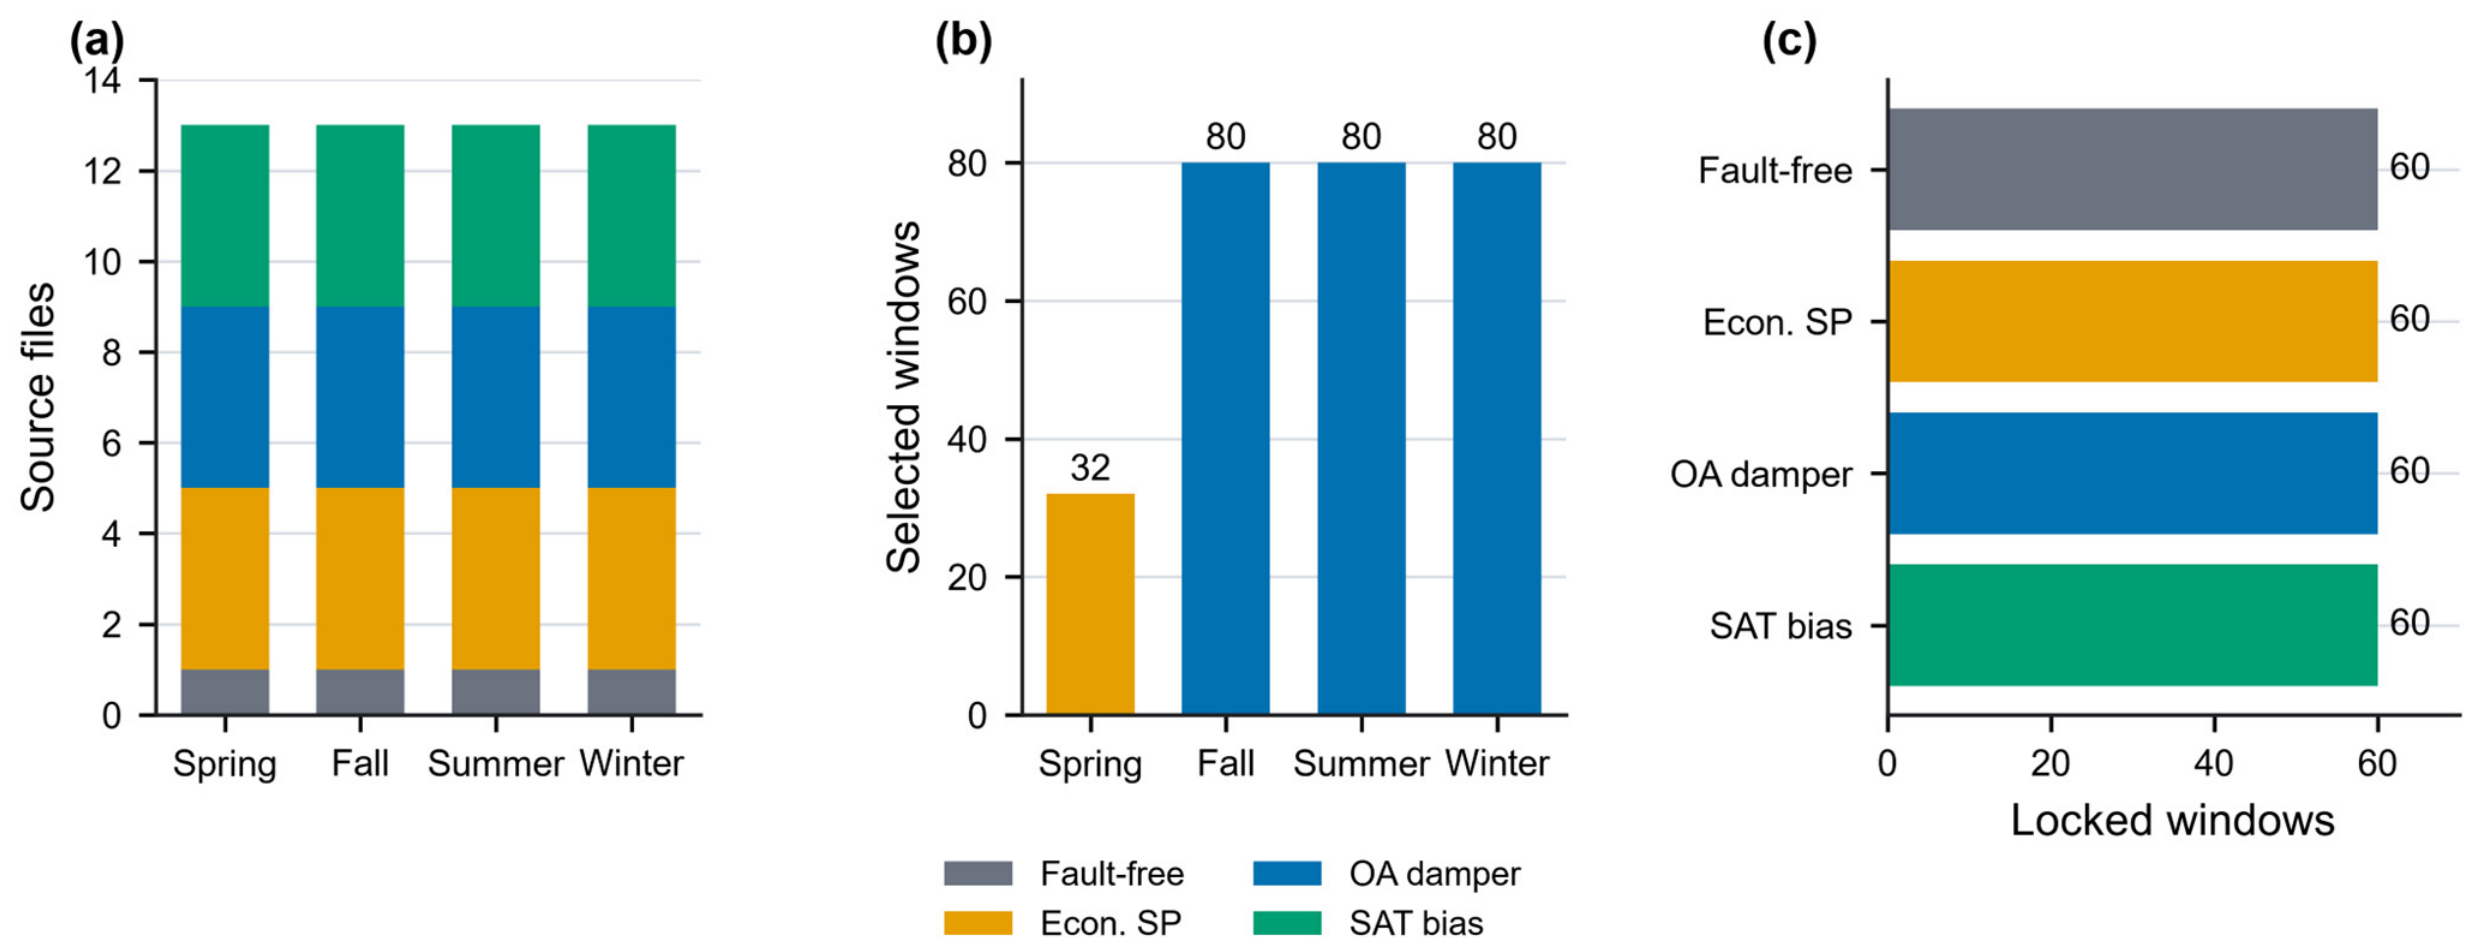
Figure 2 shows source file composition and selected analysis windows.
Figure 2.
Dataset and sampling protocol; panels (a–c) show source-file composition, seasonal sampling, and balanced report-set classes.
CSV files were decoded using the released schema and ordered by timestamp. Candidate windows were non-overlapping 60 min intervals from 07:00 to 22:00. A window required at least 54 observations, corresponding to 90 percent of the expected one-minute records. The same 90 percent threshold was applied to every required channel. Supply air fan power had to exceed 1 W in at least 90 percent of observations, providing a deterministic active operation criterion. Windows with missing required channels, insufficient completeness, or ineligible operation were excluded before sampling.
Fifteen channels were selected and grouped by control role: two control commands, the outdoor air and return air damper commands; 11 measured states, the outdoor, return, mixed, and supply air temperatures, supply airflow, supply fan power, two compressor powers, RTU total power, total HVAC power, and gas flow; and two setpoints, the zone cooling and heating setpoints. Supplementary Table S10 lists each channel with its released name, unit, and role. No supply air temperature setpoint or economizer status channel is among them. A channel had to belong to the rooftop unit economizer, supply air, or power loop and be complete in all four seasons. Selection was fixed before label inspection and stored in a versioned feature dictionary with units and human-readable variable roles. For each channel, the pipeline calculated mean, population standard deviation, minimum, maximum, linear slope per minute, and final value. This produced six statistics for each of 15 channels, or 90 numeric summary features. These values, together with variable name, unit, and observation count, form the common evidence object used by every condition. Outdoor and return air damper values released on a scale from zero to 100 were normalized to fractions from zero to one. Filenames, directory names, ground truth fields, fault intensity, and target labels were not included in model inputs.
The report windows were isolated in four steps. First, the segmentation, completeness, and active operation criteria above yielded 925 eligible windows from the 52 source files. Second, eligible windows were partitioned by season: the 209 Spring windows formed the prompt development pool, and the 716 Fall, Summer, and Winter windows formed the report pool. Third, within each season and class, windows were drawn by deterministic round robin across the available source files using a stored seed of 2026, giving eight windows per class for the 32-window pilot and 20 windows per class and season for the 240-window report set. Each season contains one fault-free file and one file per fault family and intensity, so every report fault file contributed five windows and each report season’s fault-free file contributed 20. Fourth, the protocol audit confirmed 13 pilot and 39 report source files, no overlapping window identifiers, no overlapping source files, and the intended season separation. Eligible report season windows outside the locked set were never presented to the LLMs and were entered only the Random Forest training folds described in Section 3.2; the remaining 177 Spring windows were not used.
The released code names the per-window identifier case_id. In this manuscript, window_id denotes that identifier and source_file denotes the physical run, clustering, and leakage control unit. Conditions are paired within each window.
3.2. Evidence Object, LLM Protocol, and Reference Model
All model inputs originate from one in-memory evidence object. A blocking parity assertion reconstructs C0 and C1 and verifies identical variable names, units, and statistic values. The condition name is not included in the model input. C0 and C1 use identical task instructions. Table 2 specifies the controlled differences. Supplementary Text S1 provides the complete system and user messages for C0, C1, and C2, one window rendered in all three conditions, the JSON output schema, and the full evidence card.
Table 2.
Experimental conditions and information-parity controls.
C0 expresses all variables in deterministic sentences. C1 encodes the same content as a fixed JSON structure with stable human-readable variable names, units, observation counts, and statistic fields; in both C0 and C1 the control role of a channel is conveyed only through its variable name, such as outdoor air damper command or zone cooling setpoint. C2 appends a short evidence card describing expected relationships for all four candidate states. The card contains no window values, target labels, fault intensity, worked examples, or window-specific retrieval. Its text and hash are constant across all windows. The card also states the documented 55 °F supply air temperature target and 50 °F economizer outdoor air threshold, which C0 and C1 do not supply. C0 and C1 present the 15 variables in the same order; within each variable, C1 lists the statistic fields in alphabetical key order, whereas C0 follows the sentence template. Mean user message length differed by 0.2 percent in characters between C0 and C1, 3682 versus 3691, so the difference in provider token counts reported in Section 4.3 arises from tokenization of JSON keys and punctuation rather than from added content.
Nine API LLMs from different vendor families were evaluated through the SiliconFlow OpenAI-compatible completion endpoint on 31 August 2026. The models were DeepSeek-V4-Flash, Kimi-K2.6, Qwen3.5-397B-A17B, MiniMax-M2.5, GLM-4-32B-0414, Seed-OSS-36B-Instruct, Hunyuan-A13B-Instruct, Ling-flash-2.0, and LongCat-2.0. The authenticated model catalog was checked before the run. The model identifier returned with every completed response exactly matched its configured identifier. Exact request identifiers are retained in the release manifest.
Requests were stateless, used temperature zero and a maximum of 500 output tokens, and followed deterministic rotations by window to distribute potential time-varying service effects across conditions. Reasoning was disabled when supported by the endpoint. MiniMax-M2.5 and Seed-OSS-36B-Instruct used the provider-supported minimum thinking budget of 128 tokens, which the provider counted in addition to the 500 visible output tokens. Request timeouts were 180 s, except for GLM-4-32B-0414 at 90 s. A failed transport request was retried at most four times with exponential backoff and jitter, giving no more than five attempts. Requests were cached by content hash. An append-only journal stored the prompt version, request hash, configured model, returned model identifier, provider trace identifier, latency, token use, finish reason, raw response, parse status, and retry count. Valid responses that did not meet diagnostic expectations were not rerun. Results were analyzed separately by model.
The system instruction restricted diagnoses to four canonical labels and unknown for abstention. The response required a fault label, confidence, concise rationale, evidence array, and abstention flag. Abstention and the unknown label had to be mutually consistent. Provider-constrained output was disabled for all models, and the same strict local schema validator defined schema validity. Code fences, trailing commentary, and malformed objects were retained in the raw journal and were not repaired. The models were not asked to reveal hidden reasoning.
An unsupported evidence variable flag is assigned when the evidence array names a variable absent from the supplied measurements. This rule evaluates variable identity only; the system instruction required every evidence item to be copied exactly from a supplied variable name, so the flag also measures adherence to this copying instruction and is raised by paraphrased names or combined name and value strings. It does not verify quoted numeric values, the diagnostic relevance of a cited variable, or the causal validity of the rationale. The outcome is therefore referred to as name-level evidence grounding, and a response without the flag cites only supplied variables but is not thereby shown to use them correctly. A label outside the canonical vocabulary is treated as a schema failure. Schema failures, API failures, unsupported evidence variable references, and model abstentions are stored and reported separately.
A Random Forest reference measures diagnostic information under a conventional supervised setting. It receives the same 90 numeric summary statistics provided to the LLM. It establishes task difficulty for interpreting the zero-shot results.
Random Forest was selected as a conventional tabular reference used in rooftop unit FDD studies [21] and does not require feature scaling. The implementation used 300 trees, class-balanced weights, and random seed 2026. Hyperparameters were fixed before evaluation and were not tuned on the report windows. Missing values were imputed with training fold medians, and no feature selection was applied. In each fold, the model trained on every eligible window from two report seasons and predicted the 80 locked windows from the held-out season. The three folds used 420, 506, and 506 training windows from 26 source files. These additional windows increase within-file sampling, but not the number of independent source runs. Spring remained excluded. A post hoc sensitivity analysis removed six summary features derived from the outdoor air damper command channel without changing the hyperparameters.
3.3. Outcomes, Statistical Analysis, and Reproducibility
The primary outcome is macro F1 across four classes. An abstention is counted as an incorrect forced classification outcome. Balanced accuracy, overall accuracy, recall for each class, diagnostic coverage, selective accuracy, schema-valid response rate, unsupported evidence variable rate, abstention rate, latency, and token use are secondary outcomes. Coverage denotes a schema-valid diagnosis that does not abstain. Selective accuracy is calculated among these diagnoses. Output validity refers jointly to schema validity, abstention, and diagnostic coverage; it does not denote diagnostic correctness or evidence quality.
Two failure modes are handled by prespecified rules. A transport failure is retried under the recorded policy. If a request still fails, it is reported as an API failure against all attempted requests. The corresponding window is removed from all three conditions for that model so that effect estimation remains paired. Malformed model content is not retried. It is retained as an incorrect invalid output and is not counted as a model abstention. For reporting, each attempted request is also assigned to one of five categories: API failure, schema failure, valid abstention, valid incorrect diagnosis, or valid correct diagnosis. Schema failures are subdivided from the validator message and the retained raw response, and length-limited termination is identified from the finish reason recorded in the journal. This classification was added during revision and uses only the frozen journals.
Point estimates are accompanied by 95 percent percentile confidence intervals from 10,000 paired source file cluster bootstrap resamples. In each resample, source files are drawn with replacement within each true class stratum, three fault-free files and 12 files for each fault class, all windows and conditions of a drawn file are carried together, and macro F1 for each condition and their paired difference are recalculated. Two-sided p values are obtained from 10,000 random cluster permutations under the sharp null hypothesis that the two compared condition labels are exchangeable within each source file. In each permutation, the two labels are swapped jointly for all windows of a source file with probability one half, and the macro F1 difference is recalculated; the p value is the proportion of permutations, with one added to the numerator and denominator, whose absolute difference is at least as large as the observed one. Inference on model-specific effects uses permutation tests with Holm adjustment across the nine models within each contrast, and the bootstrap intervals describe the precision of each estimate. Window-level McNemar and Cochran tests are not used because they treat correlated windows as independent. Class, season, and intensity analyses are descriptive and report the number of supporting source files. During revision, the paired contrasts were also recalculated within each report season and with each source file omitted in turn, as descriptive sensitivity analyses.
A bounded supplementary check was also run on 23 October 2026 on the 32 Spring pilot windows only, leaving the locked report set untouched. Three of the nine evaluated models, selected by a rule fixed before any request, Hunyuan-A13B-Instruct, Kimi-K2.6, and Ling-flash-2.0, were queried with the frozen prompts and settings and without cached responses, once in the original variable order for all three conditions and once with the 15 measurement entries in reversed order for C0 and C1. The scored outcome, a canonical label, unknown, or invalid output, was compared with the 31 August pilot response and, for the reversed order, with the same-day response in the original order. On 3 November 2026, a same-day control repeated the variable order check for the same three models in C0 and C1: each model received the original order, then the reversed order, then the original order again, with identical requests in the two original order runs and no cached responses. Disagreement between the two original order runs estimates repeated call variability on that day, and the mean disagreement between the reversed order run and each original order run, minus this baseline, estimates the excess attributable to variable order, with a source file cluster bootstrap interval.
The repository contains the official data downloader, archive checksum, deterministic preprocessing, prompt renderers, parity checks, pilot and report manifests, source file leakage audit, API runner, result flattener, baseline, statistical analysis, and figure scripts. A freeze command hashes configurations, source code, window manifests, processed data manifests, raw archive, model settings, and pilot journal before the report run. Model identifiers, run times, reasoning settings, and request parameters are listed in Supplementary Table S1.
Generative AI tools assisted with study planning, code review, manuscript drafting, and language editing. The authors verified all data transformations, analyses, citations, numerical statements, and interpretations. No AI system is listed as an author. The tools and their uses are described in the Acknowledgments.
4. Results
4.1. Data and Protocol Audit and Random Forest Reference
Table 3 confirms that the frozen protocol was executed as specified, including the 52 source files, the 240-window report set from 39 source files, and the absence of pilot and report overlap. The prespecified quality checks yielded 925 eligible windows (Table 1).
Table 3.
Frozen report-run protocol and execution checks.
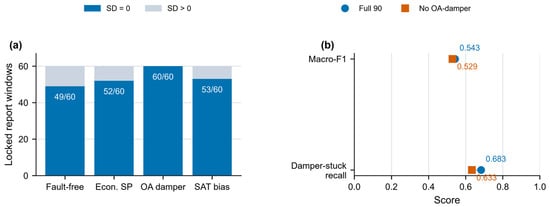
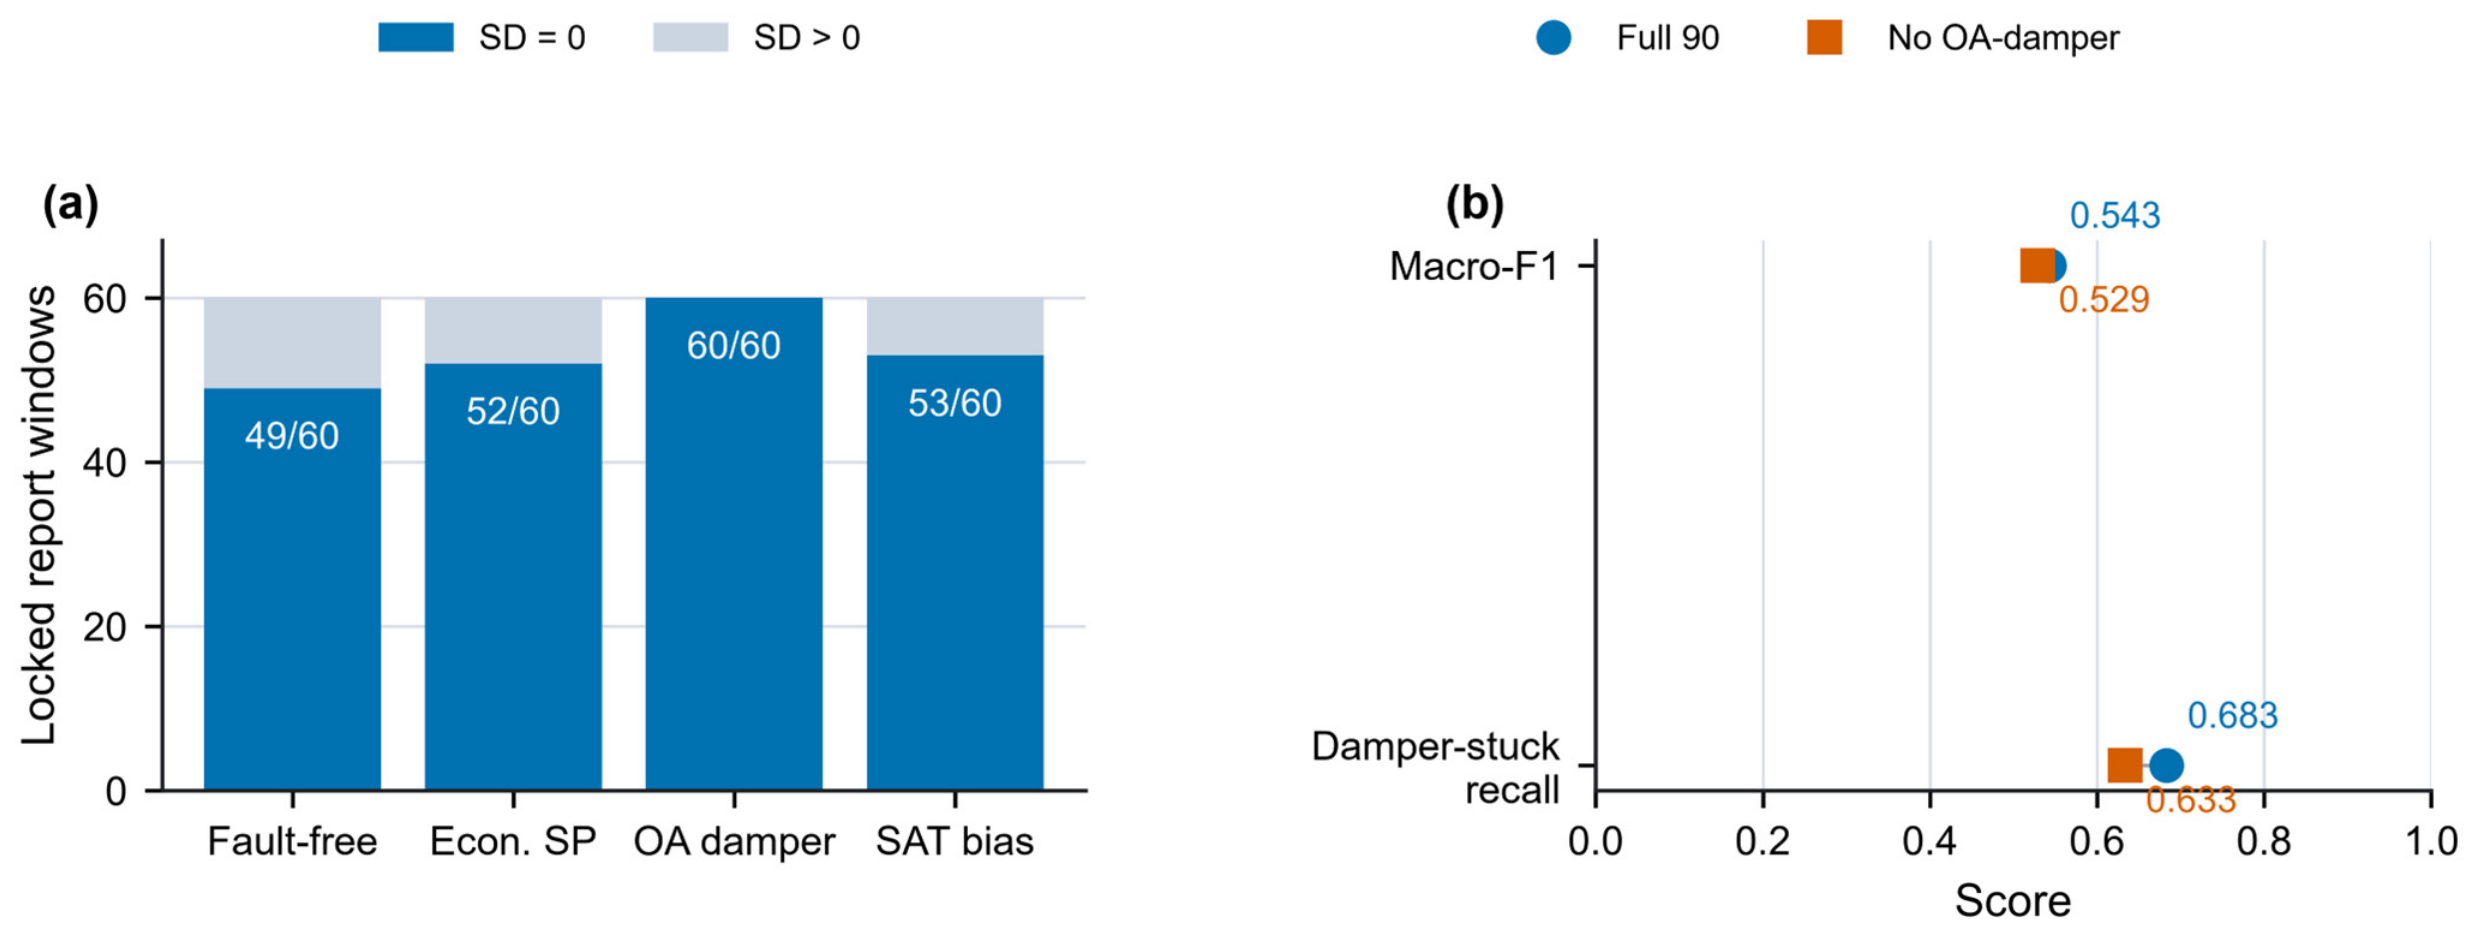
The outdoor air damper command standard deviation was zero in all 60 outdoor air damper stuck windows. Zero values were also common in the other classes. They occurred in 49 of 60 fault-free windows, 52 of 60 economizer setpoint error windows, and 53 of 60 supply air temperature sensor bias windows. This distribution indicates a shared operational signature, not a rule specific to one class. It is relevant to the supervised reference and C2, whose evidence card identifies persistent damper commands as one diagnostic signature.
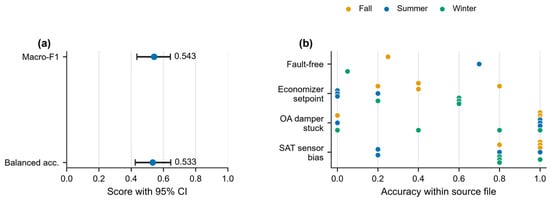
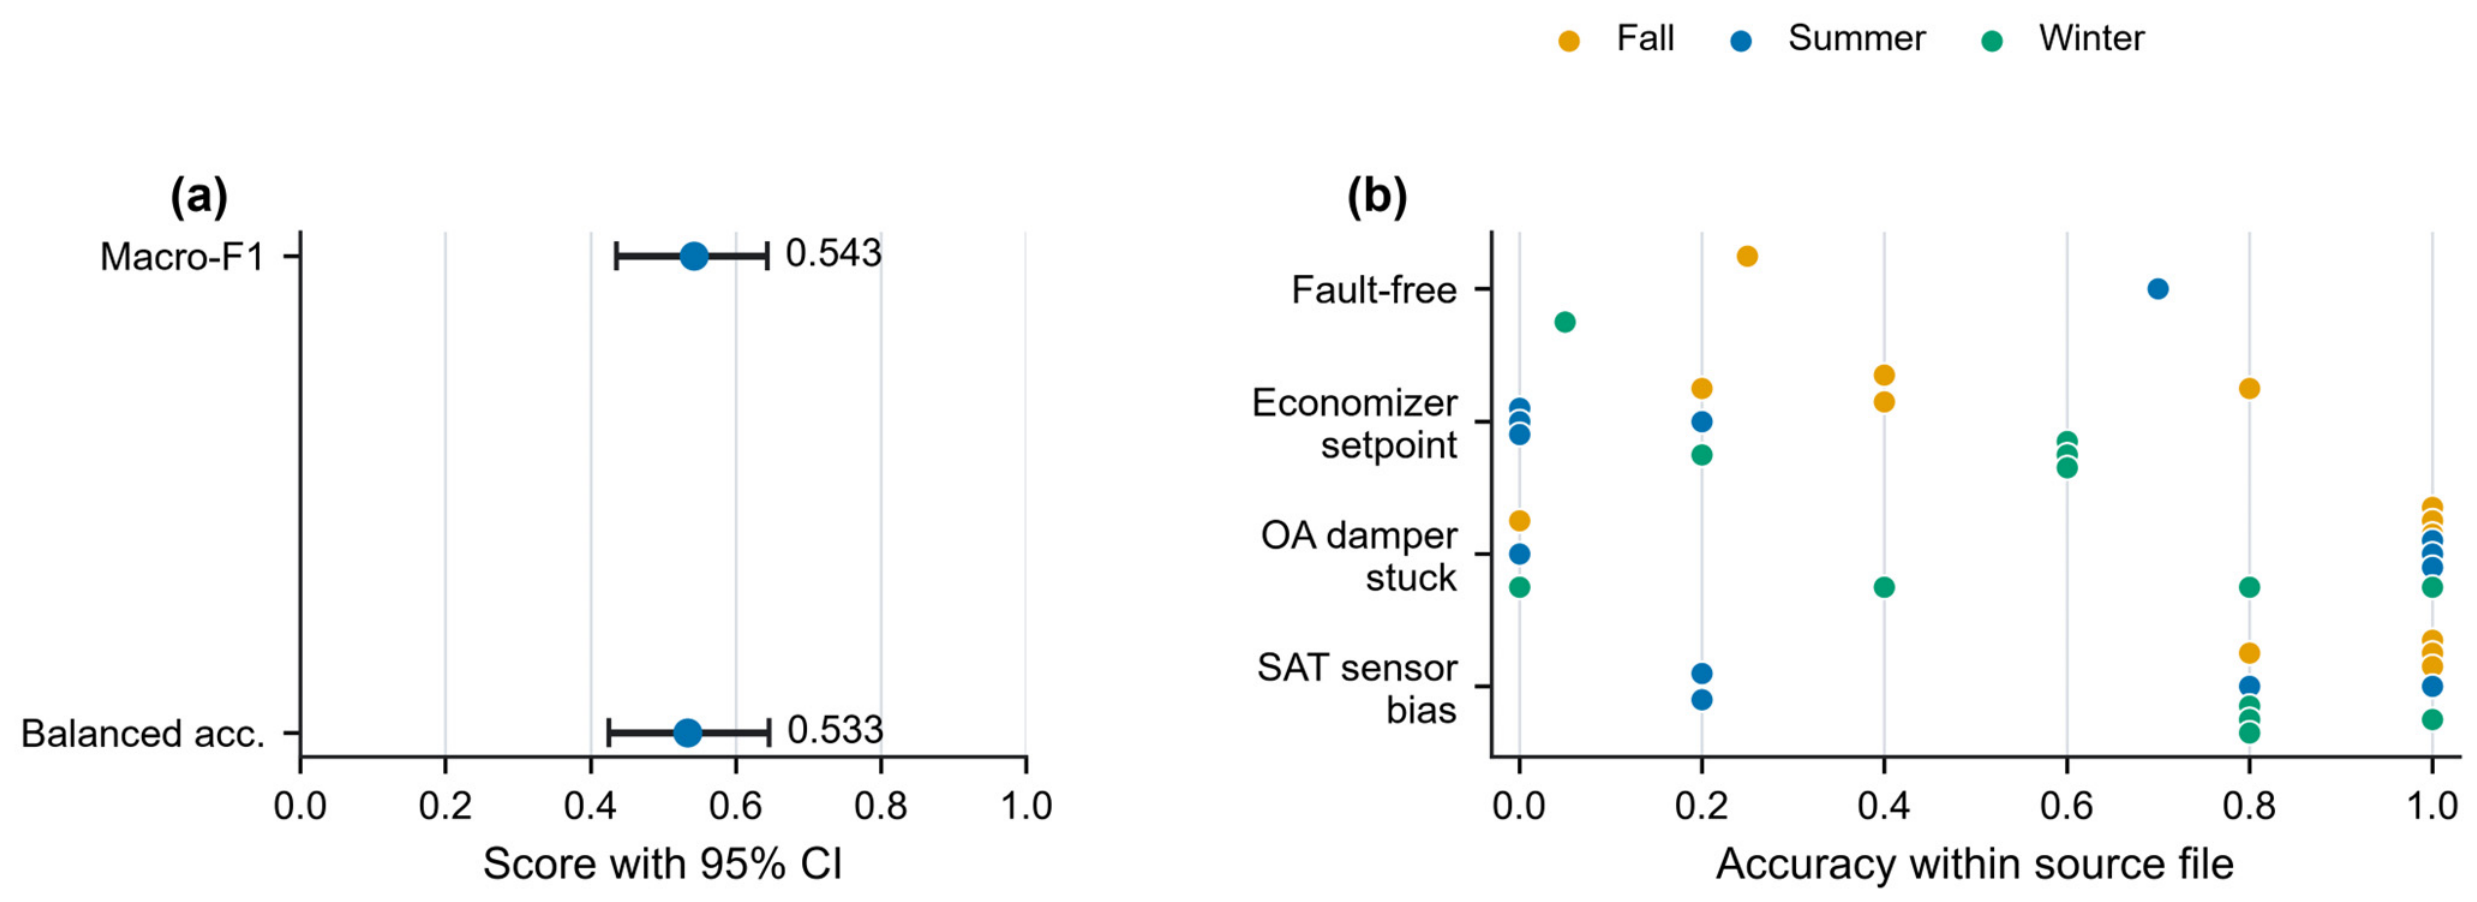
The leave-one-season-out Random Forest classified 128 of 240 locked report windows correctly, with macro F1 of 0.543 and balanced accuracy of 0.533. The class-stratified source file bootstrap intervals were 0.435 to 0.643 and 0.425 to 0.646, respectively. Table 4 and Figure 3a report these estimates, and Supplementary Table S9 lists the complete reference metrics. Figure 3b shows substantial variation between source files within every class. Source file accuracy ranged from zero to one, even though each file contributed repeated windows. The source file is therefore the relevant unit for uncertainty.
Table 4.
Random Forest reference and damper-channel sensitivity results.
Figure 3.
Leave-one-season-out Random Forest performance; panel (a) shows macro-F1 and balanced accuracy with 95% source-file cluster-bootstrap intervals, and panel (b) shows source-file accuracy across classes and seasons.
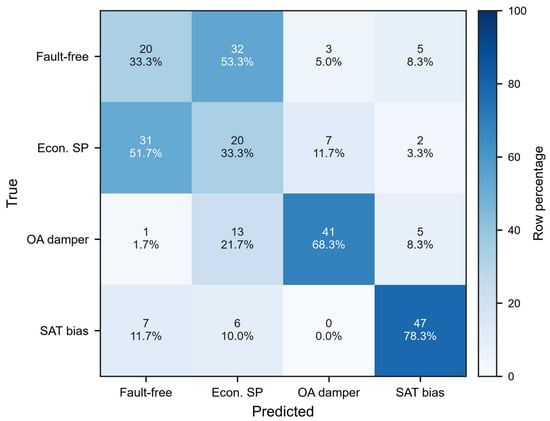
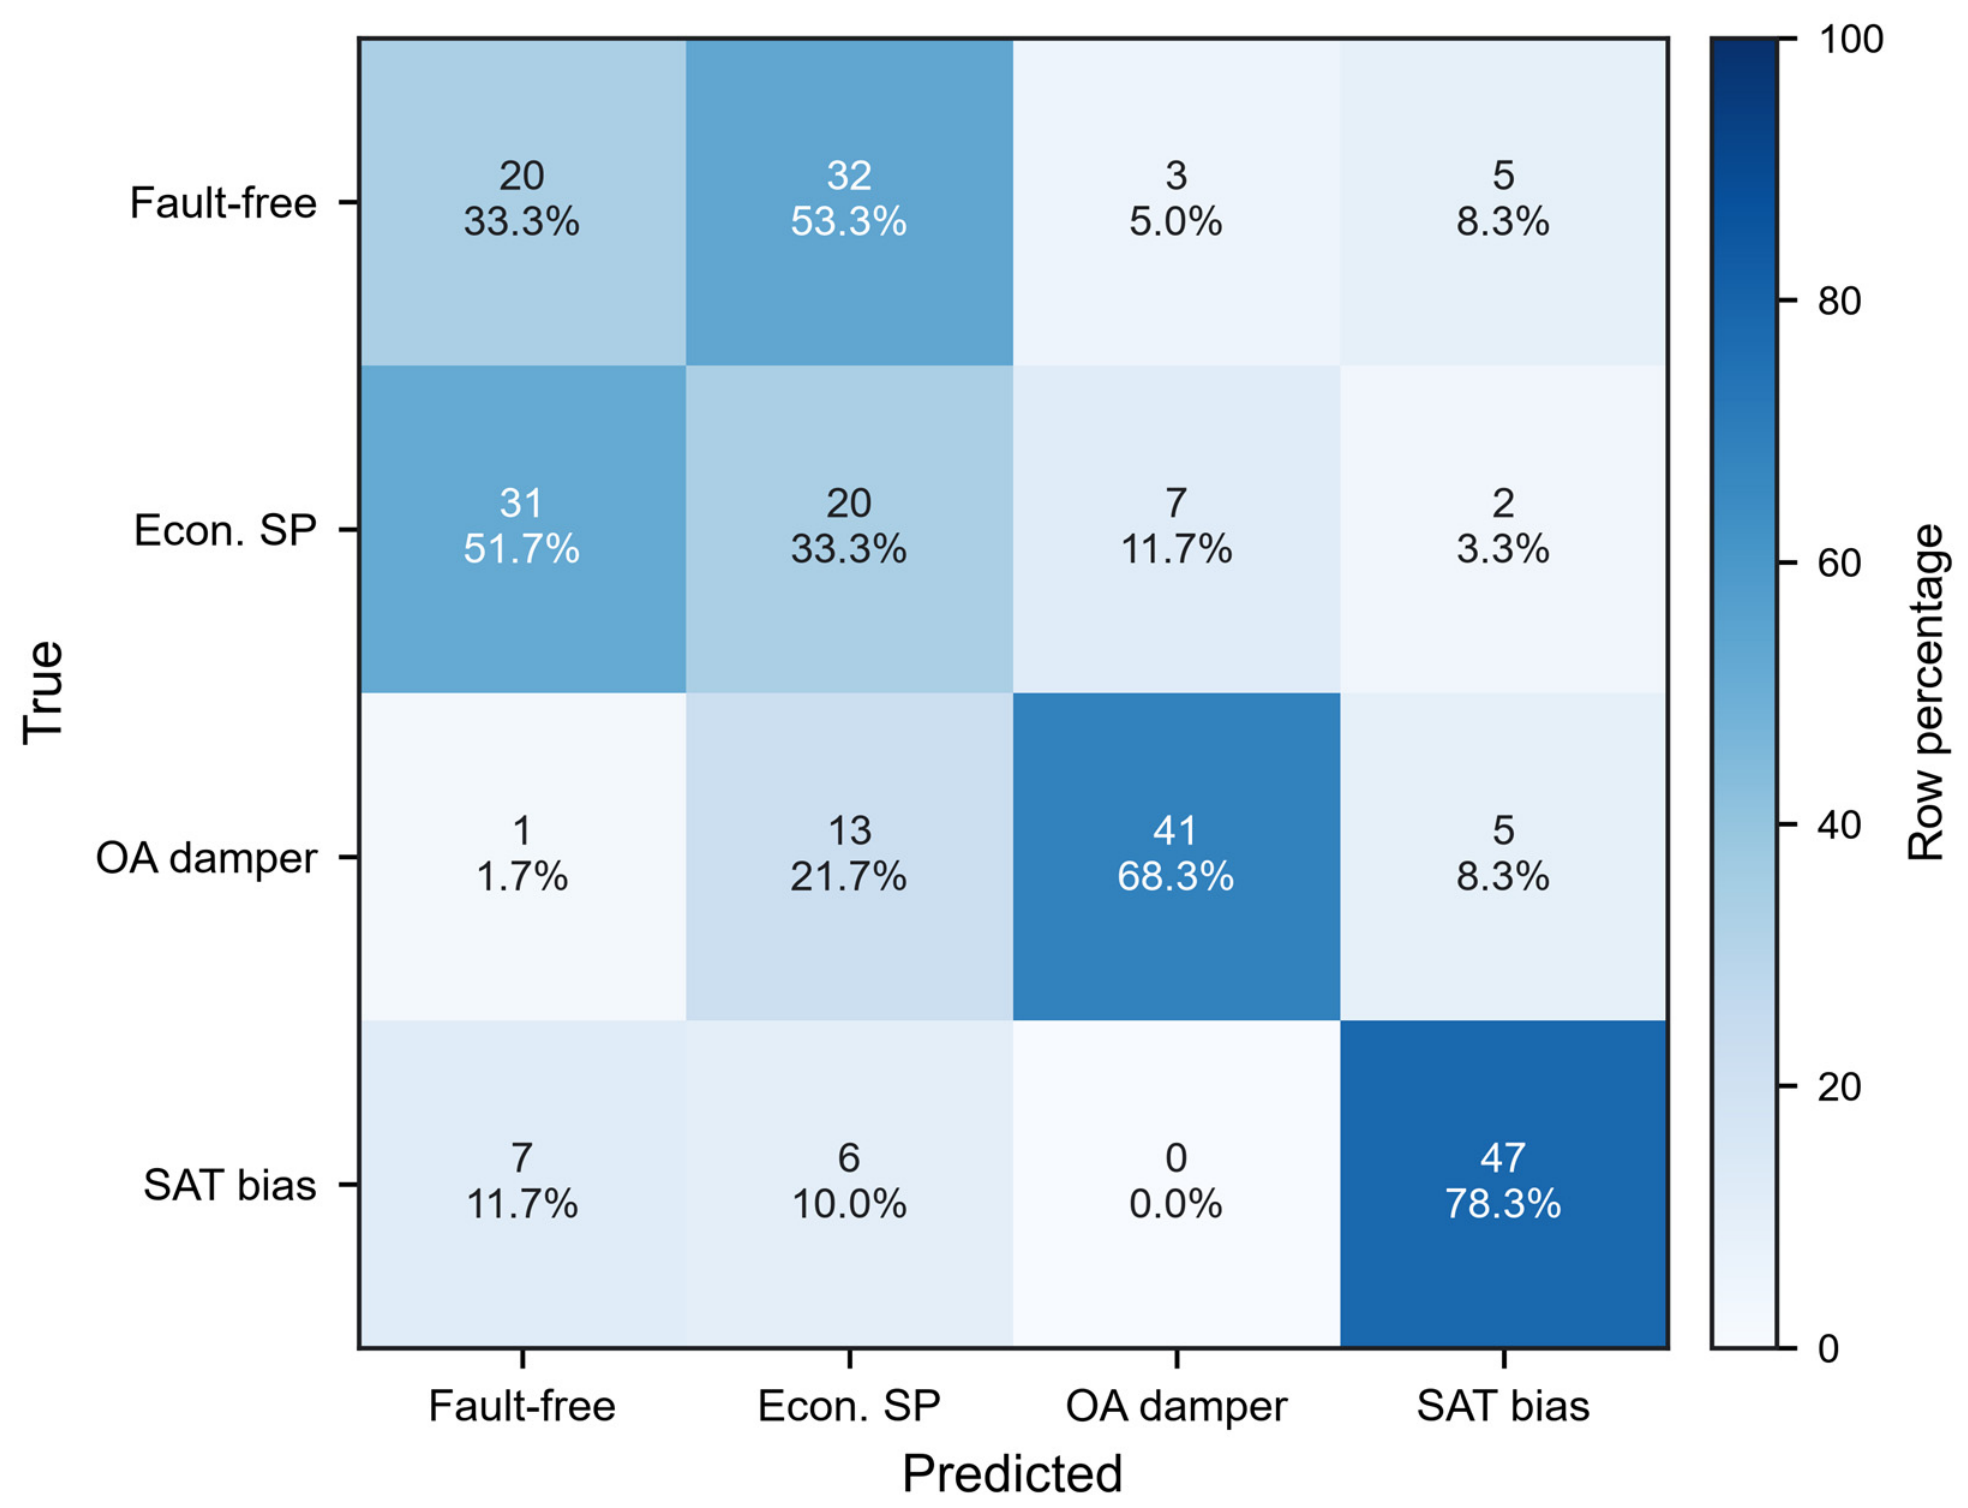
Class recall was 0.333 for fault-free and economizer setpoint error windows. It was 0.683 for outdoor air damper stuck windows and 0.783 for supply air temperature sensor bias windows. Figure 4 and Table 4 report these values. The most frequent error was confusion between fault-free and economizer setpoint error operation.
Figure 4.
Pooled leave-one-season-out Random Forest confusion matrix with counts and row-normalized percentages.
Removing six outdoor air damper command summary features reduced macro F1 from 0.543 to 0.529 and outdoor air damper stuck recall from 0.683 to 0.633. Figure 5 reports this sensitivity analysis. The channel contributes diagnostic information, but zero standard deviation is common across classes and cannot independently determine the predicted class.
Figure 5.
Outdoor-air damper sensitivity; panels (a,b) show zero-variance windows and the effect of removing six damper-derived features.
4.2. LLM Diagnostic Performance and Paired Effects
The frozen report run attempted 6480 requests across 240 windows, three conditions, and nine models. One DeepSeek-V4-Flash C1 request ended in a terminal HTTP 400 response. Paired effect estimates therefore use 239 windows for DeepSeek and 240 for every other model. The remaining 6479 responses carried an exact returned model identifier and a provider trace identifier.
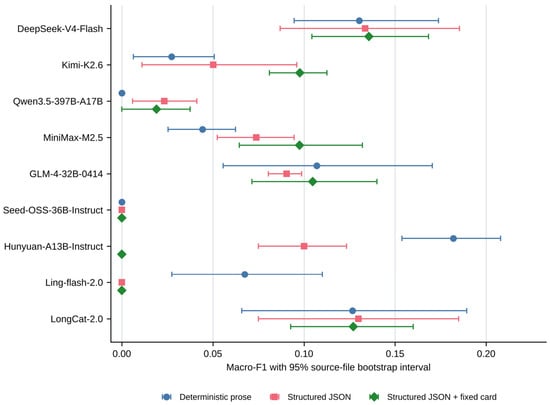
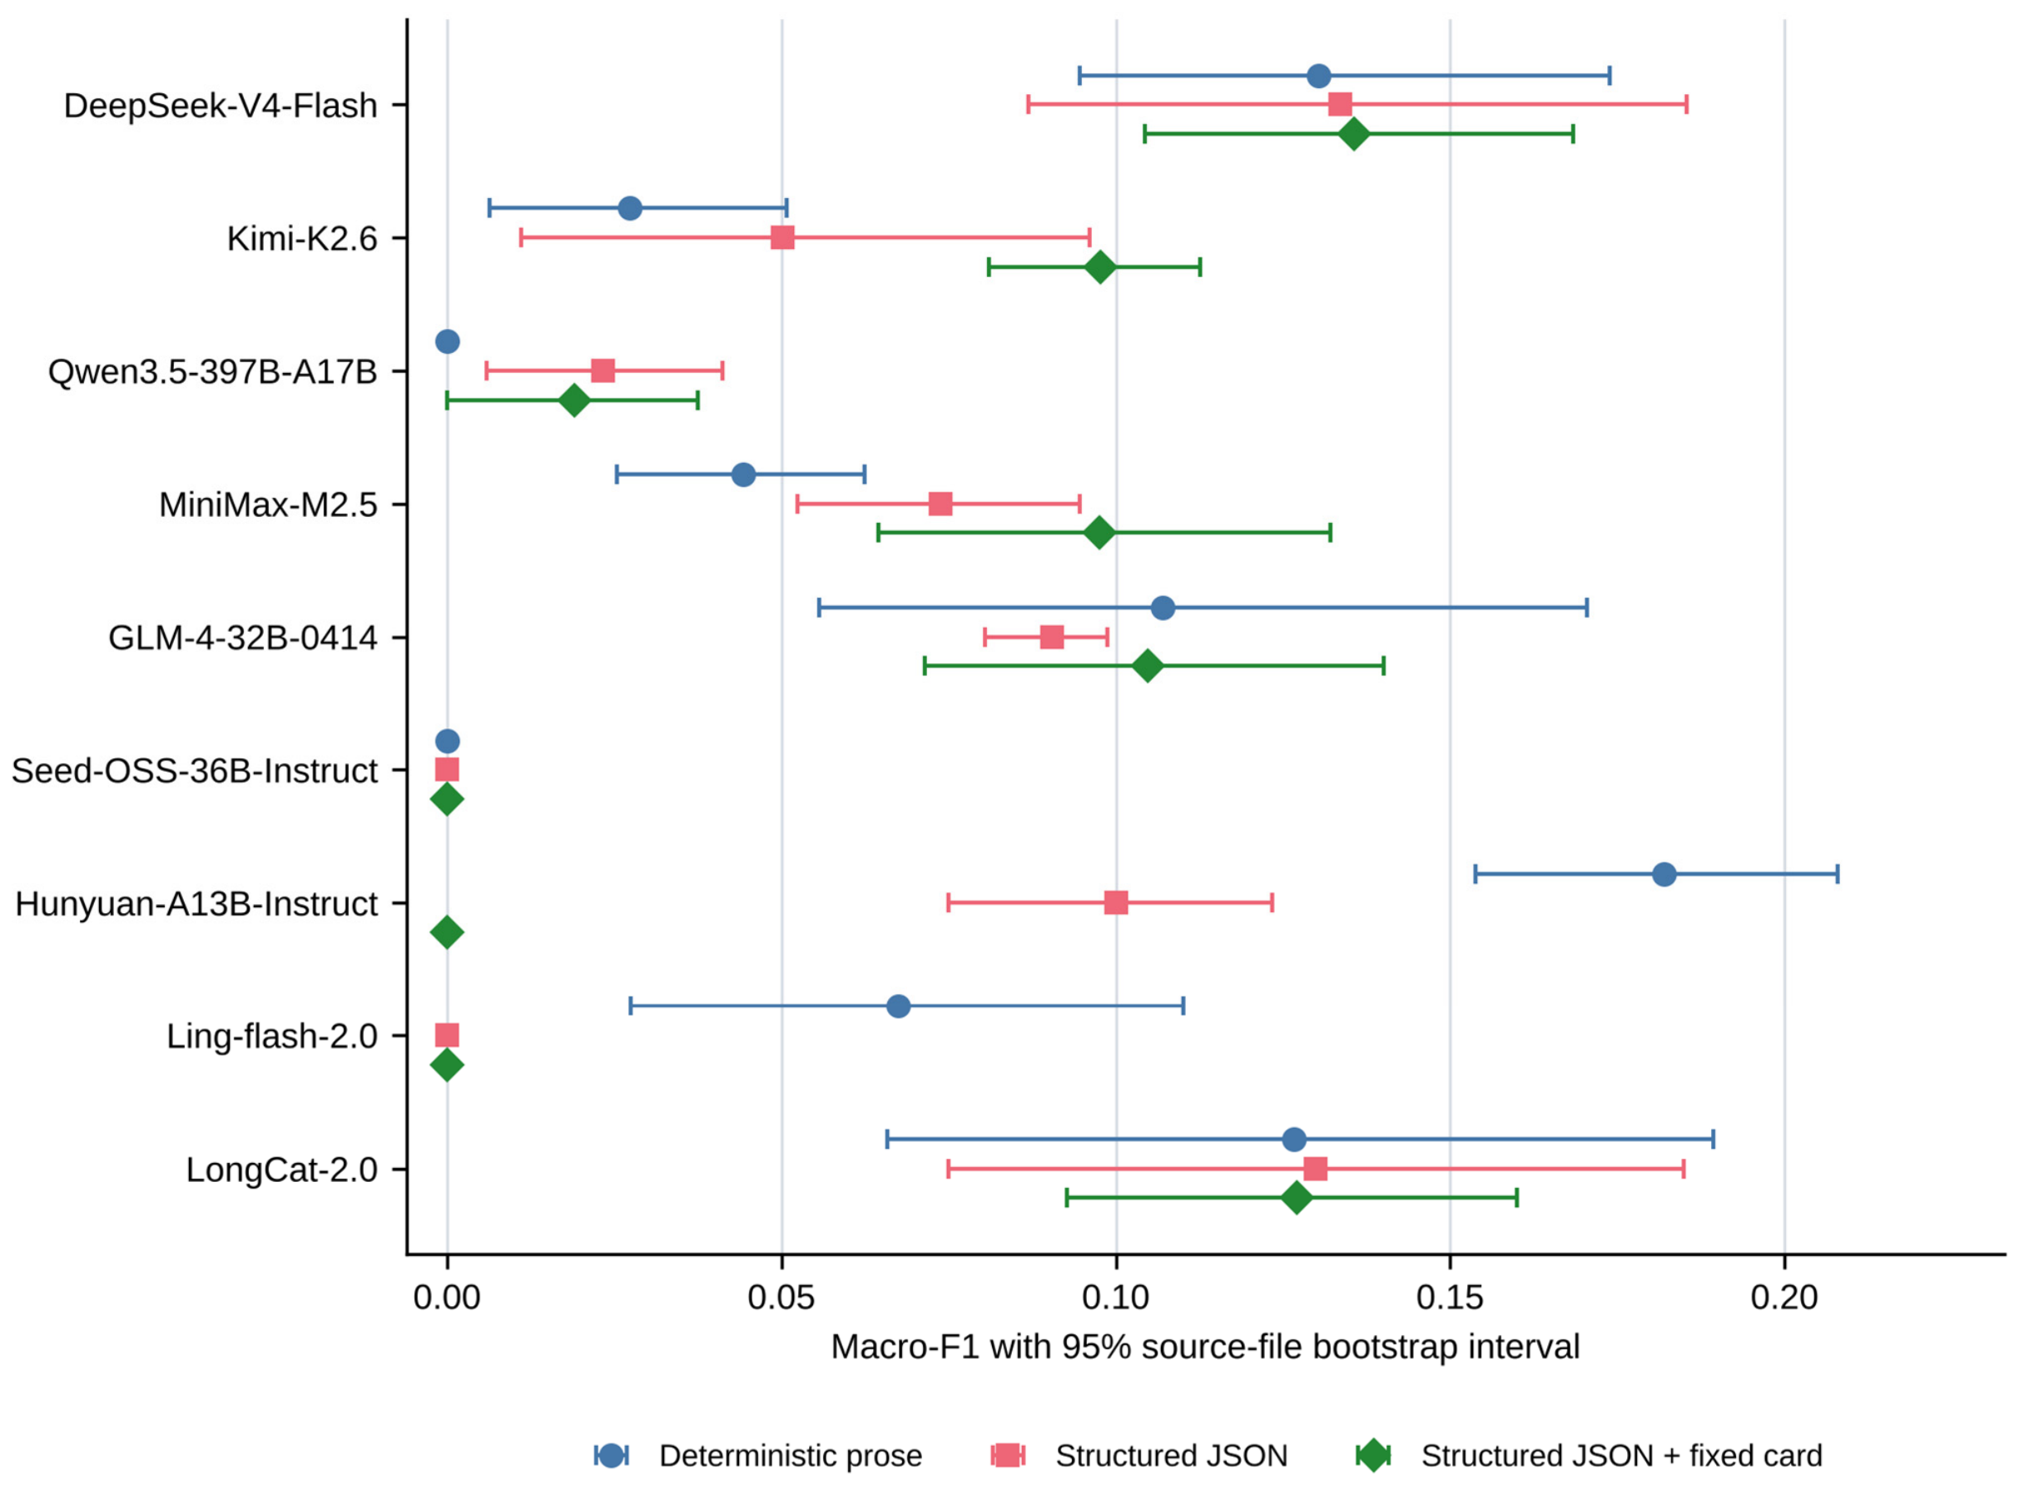
Table 5 and Figure 6 report macro F1 for each model and condition, and Supplementary Table S2 adds accuracy, balanced accuracy, coverage, and selective accuracy with their intervals. The maximum value was 0.182 for Hunyuan-A13B-Instruct with prose, with a 95 percent source file cluster bootstrap confidence interval from 0.154 to 0.208. Kimi-K2.6 increased from 0.027 in C0 to 0.098 in C2. Hunyuan-A13B-Instruct changed from 0.182 in C0 to zero in C2. Seed-OSS-36B-Instruct returned zero macro F1 in every condition. Ling-flash-2.0 returned zero under C1 and C2 because every response abstained. Schema validity, diagnostic coverage, and name-level evidence grounding are reported with macro F1 to distinguish diagnostic correctness from output validity.
Table 5.
Model-specific macro-F1 and 95% source-file bootstrap intervals.
Figure 6.
Model-specific macro-F1 across prose, JSON, and JSON with a fixed evidence card; points show 95% source-file cluster-bootstrap intervals.
Table 5 uses paired report windows. The three DeepSeek conditions use 239 windows after one terminal API failure. All other model condition cells use 240 windows. Zero values arise mainly from abstention, for Qwen3.5-397B-A17B in C0, Seed-OSS-36B-Instruct in every condition, and Ling-flash-2.0 in C1 and C2, or from strict schema failure, for Hunyuan-A13B-Instruct in C2; Supplementary Table S11 gives the request-level breakdown.
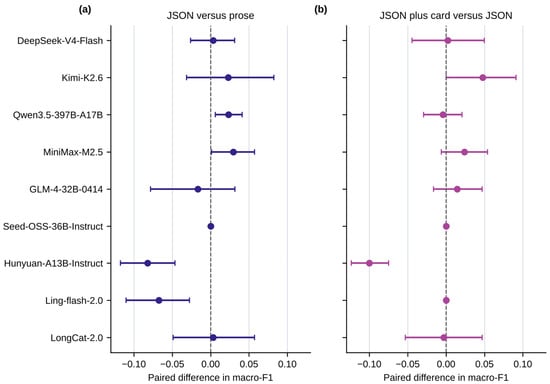
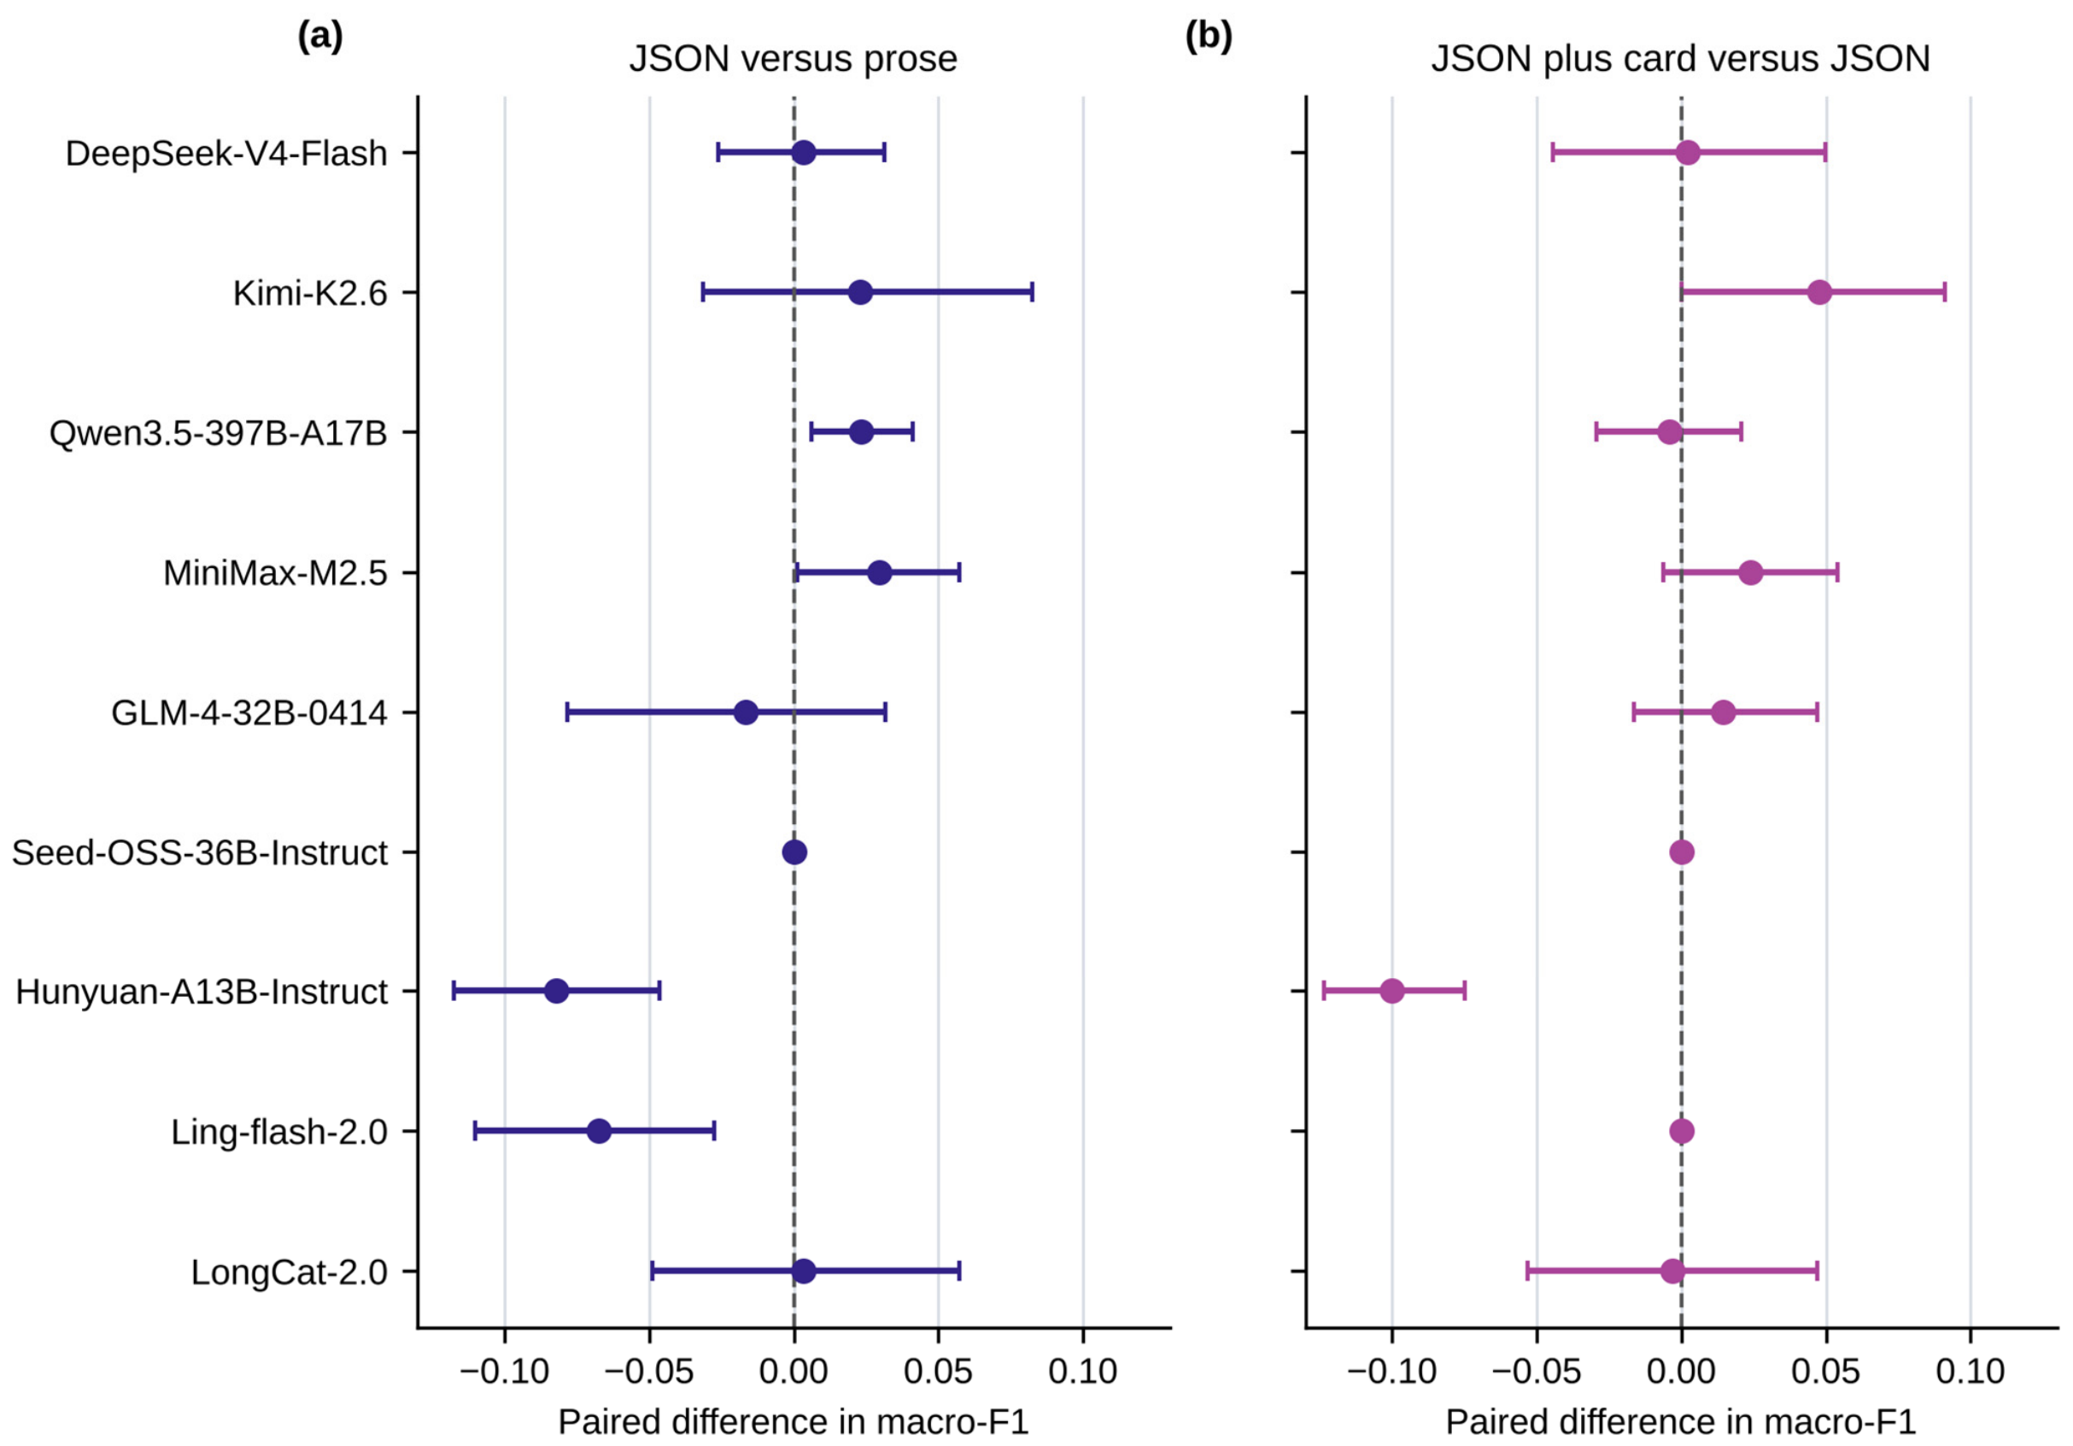
Differences between C1 and C0 in macro F1 ranged from −0.082 to 0.029. Figure 7 and Table 6 report all paired estimates, and Supplementary Table S3 adds the paired differences in accuracy, balanced accuracy, and coverage; the Figure 7 intervals are descriptive, and the significance of each contrast is given by the Holm-adjusted permutation p values in Table 6. Hunyuan-A13B-Instruct, −0.082, and Ling-flash-2.0, −0.067, had unadjusted cluster permutation p values of 0.033 and 0.017, which became 0.261 and 0.157 after Holm adjustment. The intervals for these two models and for MiniMax-M2.5, 0.029, and Qwen3.5-397B-A17B, 0.023, excluded zero; the remaining intervals included zero or were exactly zero. Estimates differed by model. Across the nine C1-C0 tests, no contrast remained significant after Holm adjustment.
Figure 7.
Paired macro-F1 effects: (a) JSON versus prose; (b) the fixed card versus JSON. Intervals are source-file cluster-bootstrap intervals and are descriptive, and no contrast was significant after Holm adjustment.
Table 6.
Paired macro-F1 contrasts and cluster-permutation tests.
Differences between C2 and C1 ranged from −0.100 to 0.048. Hunyuan-A13B-Instruct changed by −0.100, with unadjusted and Holm-adjusted p values of 0.008 and 0.076, and Kimi-K2.6 by 0.048, with an interval from 0.00002 to 0.091 and p values of 0.390 and 1.000. The remaining differences were smaller, and their intervals contained zero or were exactly zero. For three contrasts, the bootstrap interval excluded zero while the unadjusted permutation p value exceeded 0.05: Qwen3.5-397B-A17B and MiniMax-M2.5 between C1 and C0, and Kimi-K2.6 between C2 and C1. The two procedures answer different questions. The percentile interval describes variation of the estimate over resampled source files and can take only values that resampling of the observed outcomes produces; Qwen had no correct diagnosis under C0, so every resampled difference was zero or positive, and its C1 gain rested on four correct diagnoses from four source files. The permutation test asks how often a difference of the observed size arises when condition labels are exchanged within source files, which happens often when a difference is carried by few files. With 39 clusters and only three files in the fault-free stratum, percentile intervals can also be too narrow, so they are interpreted descriptively.
Table 6 reports paired windows after model-specific API failure exclusion and uses source file cluster permutation tests with Holm adjustment across nine models. Bootstrap intervals are descriptive; inference uses the Holm-adjusted permutation tests.
4.3. Output Validity, Efficiency, and Subgroups
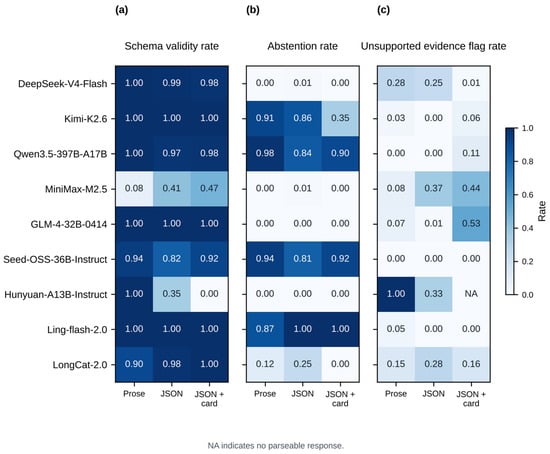
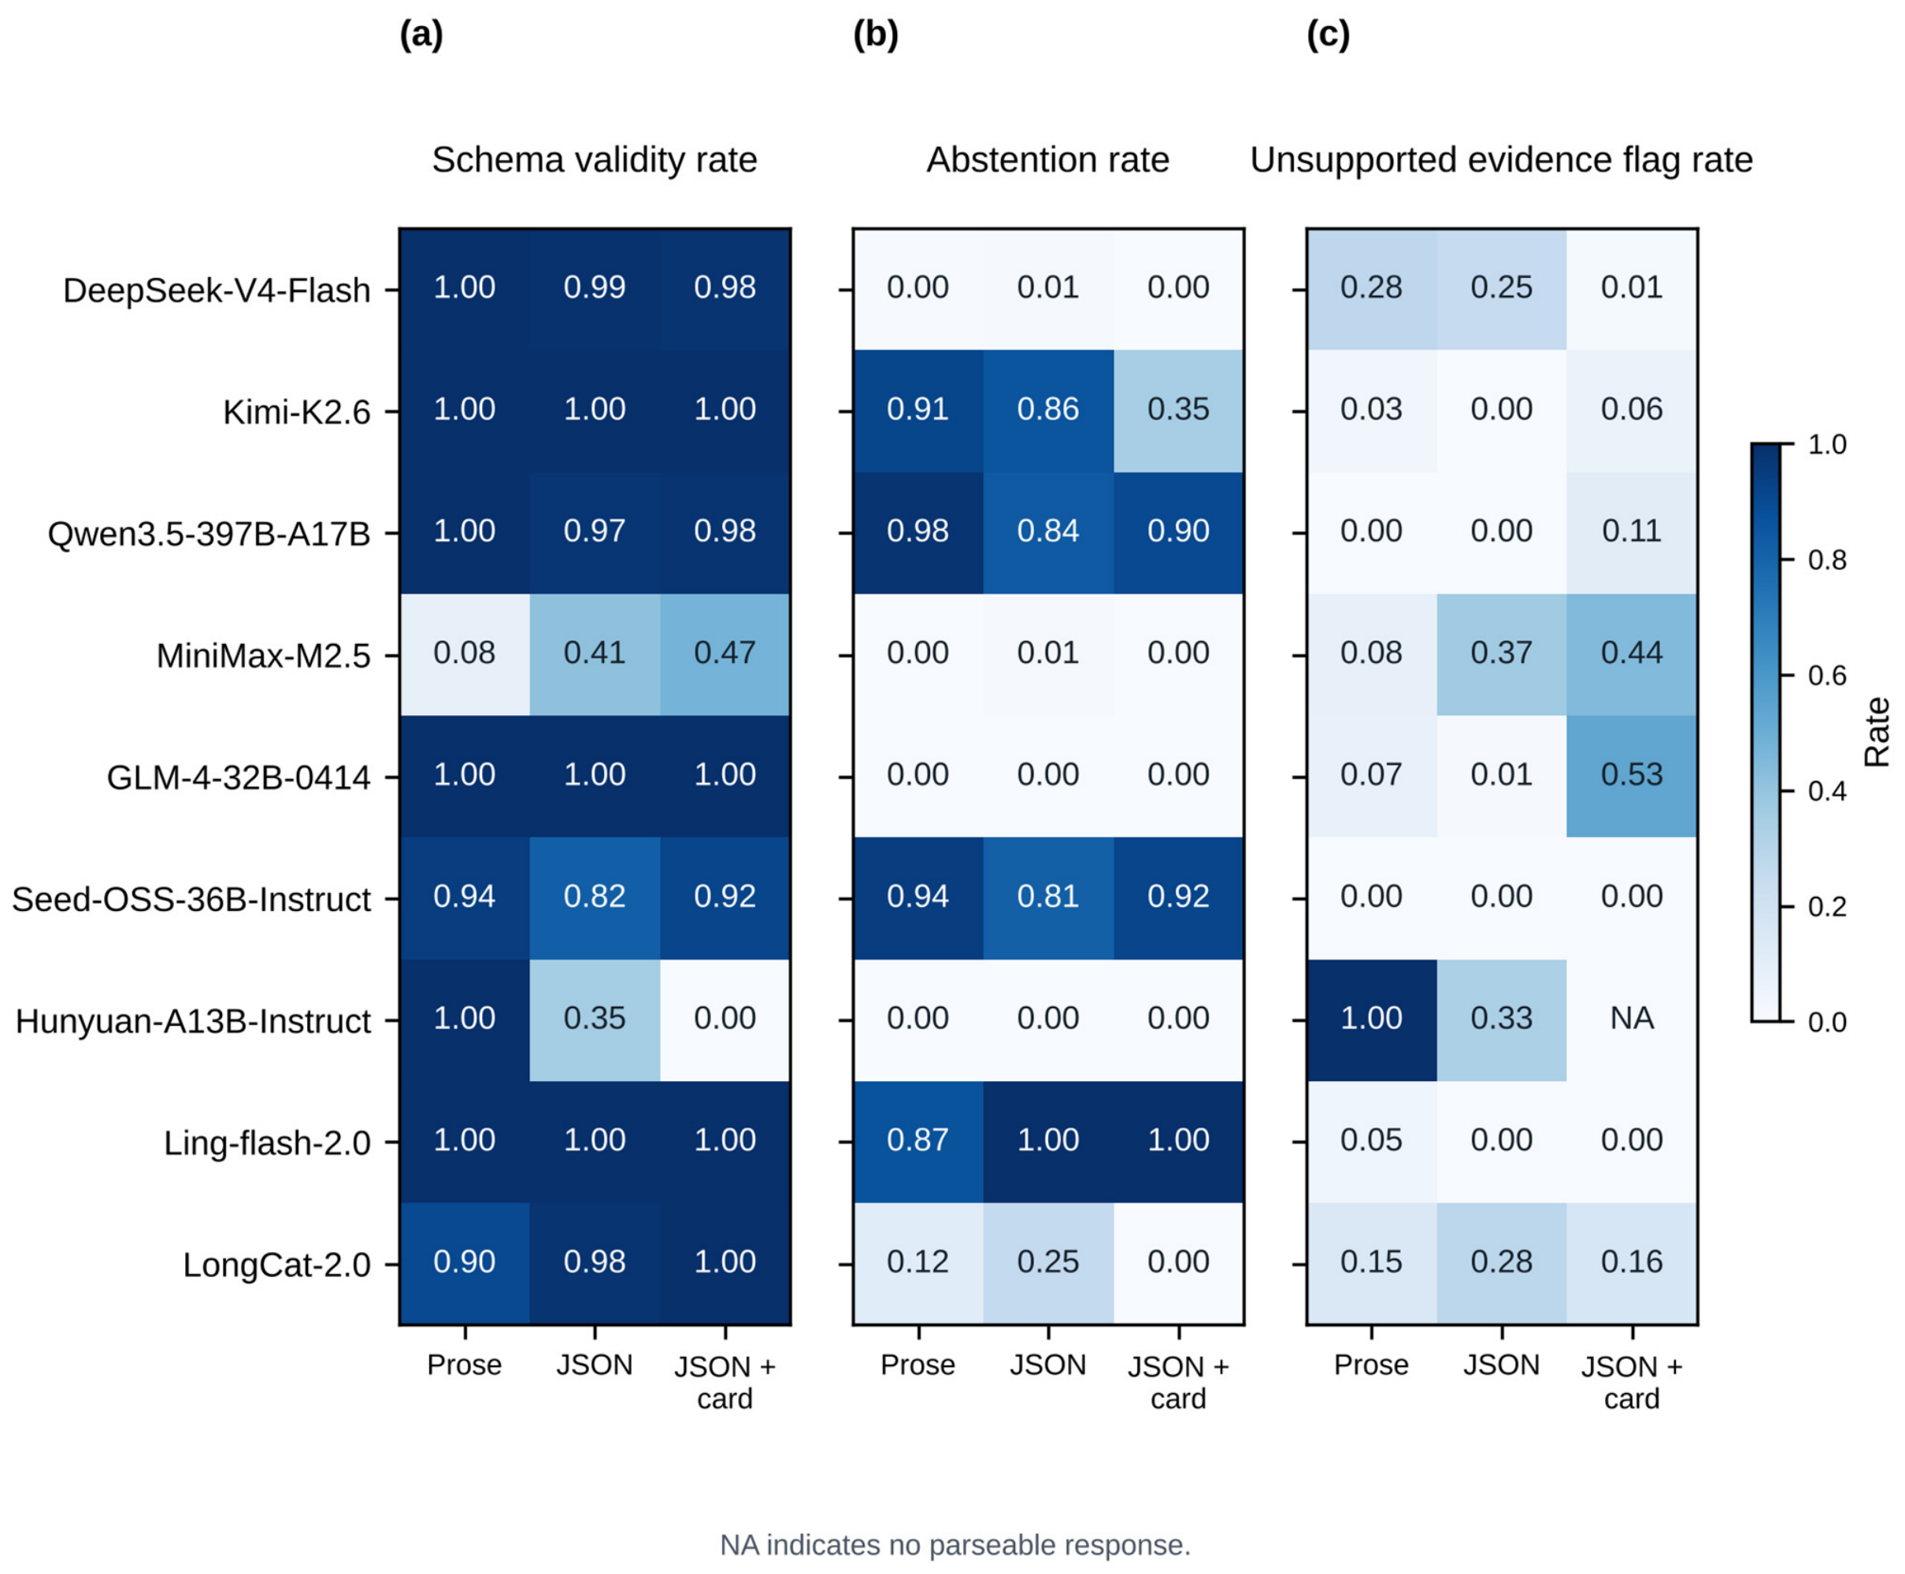
Across the 6479 completed responses, 1010 failed the strict local schema, 2584 were model abstentions, and 1010 named at least one variable absent from the supplied measurements; the two counts of 1010 coincide by chance. Unsupported variable names are audited only when a response is parseable. The rate therefore uses all completed responses as its denominator and combines name-level evidence grounding with schema validity. Figure 8 and Table 7 show different patterns across models and conditions, and Supplementary Table S4 adds request counts, token use, and latency. Schema validity was at least 0.975 in every condition for DeepSeek-V4-Flash, Kimi-K2.6, Qwen3.5-397B-A17B, GLM-4-32B-0414, Ling-flash-2.0, and LongCat-2.0, except for LongCat prose at 0.900. For MiniMax-M2.5, validity increased from 0.079 in C0 to 0.413 in C1 and 0.475 in C2. Hunyuan-A13B-Instruct changed from 1.000 in C0 to 0.354 in C1 and zero in C2. Seed-OSS-36B-Instruct was mostly schema-valid but abstained on 81.3 to 94.2 percent of completed responses. Kimi-K2.6, Qwen3.5-397B-A17B, and Ling-flash-2.0 also had high condition-dependent abstention. DeepSeek-V4-Flash and GLM-4-32B-0414 almost always returned a forced diagnosis.
Figure 8.
Output validity and name-level evidence grounding across models and conditions: (a) schema validity rate; (b) abstention rate; (c) unsupported-evidence flag rate. Rates are computed among non-API-completed responses, with audit values available only for schema-valid outputs.
Table 7.
Schema validity, abstention, and unsupported evidence variable rates by model and condition.
Unsupported evidence variable use also differed across conditions. GLM-4-32B-0414 increased from 0.008 in C1 to 0.533 in C2, while DeepSeek-V4-Flash decreased from 0.247 to 0.013. Among schema-valid responses, the Hunyuan unsupported reference rate was 1.000, or 240 of 240, in C0 and 0.929, or 79 of 85, in C1; the C0 rate reflects the combined name and value strings that Hunyuan prose returned instead of exact variable names, as noted in Supplementary Table S16, rather than citation of unrelated variables. Hunyuan C2 produced no parseable responses. Its audit cell is reported as NA, meaning not estimable. Parseable response numerators, denominators, and rates for all model condition cells are provided in Supplementary Table S6.
Values are schema-valid rate/abstention rate/unsupported-evidence flag rate, all using non-API-completed responses as the denominator. Table 7 uses completed responses within each condition; unsupported evidence is auditable only when the response passes the local schema. Hunyuan is not estimable in C2 because no response passed the schema. Diagnostic coverage equals the schema-valid rate minus the abstention rate. Coverage and selective accuracy are listed in Supplementary Table S12, failure subtypes and finish reasons in Table S11, and unsupported evidence rates among schema-valid responses in Table S6.
Supplementary Table S11 classifies all 6480 attempted requests. Besides the single API failure, they comprised 1010 schema failures, 2584 valid abstentions, 636 valid correct diagnoses, and 2249 valid incorrect diagnoses. The zero macro F1 values arose through different routes rather than from missing output. Seed-OSS-36B-Instruct returned a response to every request, but nearly every schema-valid response was an abstention, so it produced one forced diagnosis in 720 requests, and that diagnosis was incorrect. Ling-flash-2.0 abstained on 0.867 of C0 responses, leaving 31 forced diagnoses, and on every C1 and C2 response while remaining schema-valid. Hunyuan-A13B-Instruct never abstained, but all 395 of its C1 and C2 schema failures, 155 in C1 and all 240 in C2, were objects enclosed in Markdown code fences, which the system instruction prohibited and the prespecified parser does not repair. In an exploratory post hoc check, removing the fences recovered all 155 C1 failures and 236 of the 240 C2 failures. After recovery, Hunyuan C2 reached macro F1 of 0.200, with an interval from 0.162 to 0.239, accuracy of 0.279, and coverage of 0.983, against macro F1 of 0.182 and accuracy of 0.275 for its strictly parsed prose, and recovered C1 reached macro F1 of 0.125 at full coverage, as reported in Supplementary Table S15. The paired difference between recovered C2 and strict C0 was 0.018, with an interval from −0.020 to 0.057, and the recovered diagnoses named supply air temperature sensor bias in 198 of 240 C2 windows and 237 of 240 C1 windows. The C2 zero therefore reflects a formatting failure under the strict parser rather than an absence of diagnostic content, but the recovered answers do not show better class discrimination than prose. MiniMax-M2.5 failures were dominated by answers nested inside the schema keywords additionalProperties and properties copied from the supplied schema, 176 in C0, 112 in C1, and 97 in C2, so its validity gain under JSON mainly reflects fewer such wrappers. Truncation was a minor route overall: 183 of the 6479 completed responses ended at the output limit, mainly for Seed-OSS-36B-Instruct (76), MiniMax-M2.5 (63), and LongCat-2.0 prose (25), and 182 of them were schema failures, as detailed in Supplementary Tables S11 and S12. For Seed-OSS-36B-Instruct, however, truncation accounted for 76 of its 78 schema failures.
Mean input length was 1462 tokens per C0 request, 1766 for C1, and 2209 for C2. Mean output length ranged from 234 to 242 tokens. Median latency ranged from 1.93 to 9.71 s across model condition cells. These values are descriptive because all models were accessed through one shared inference gateway and requests were not scheduled as a latency benchmark.
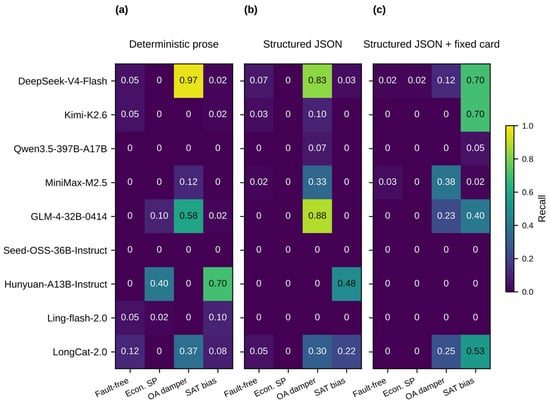
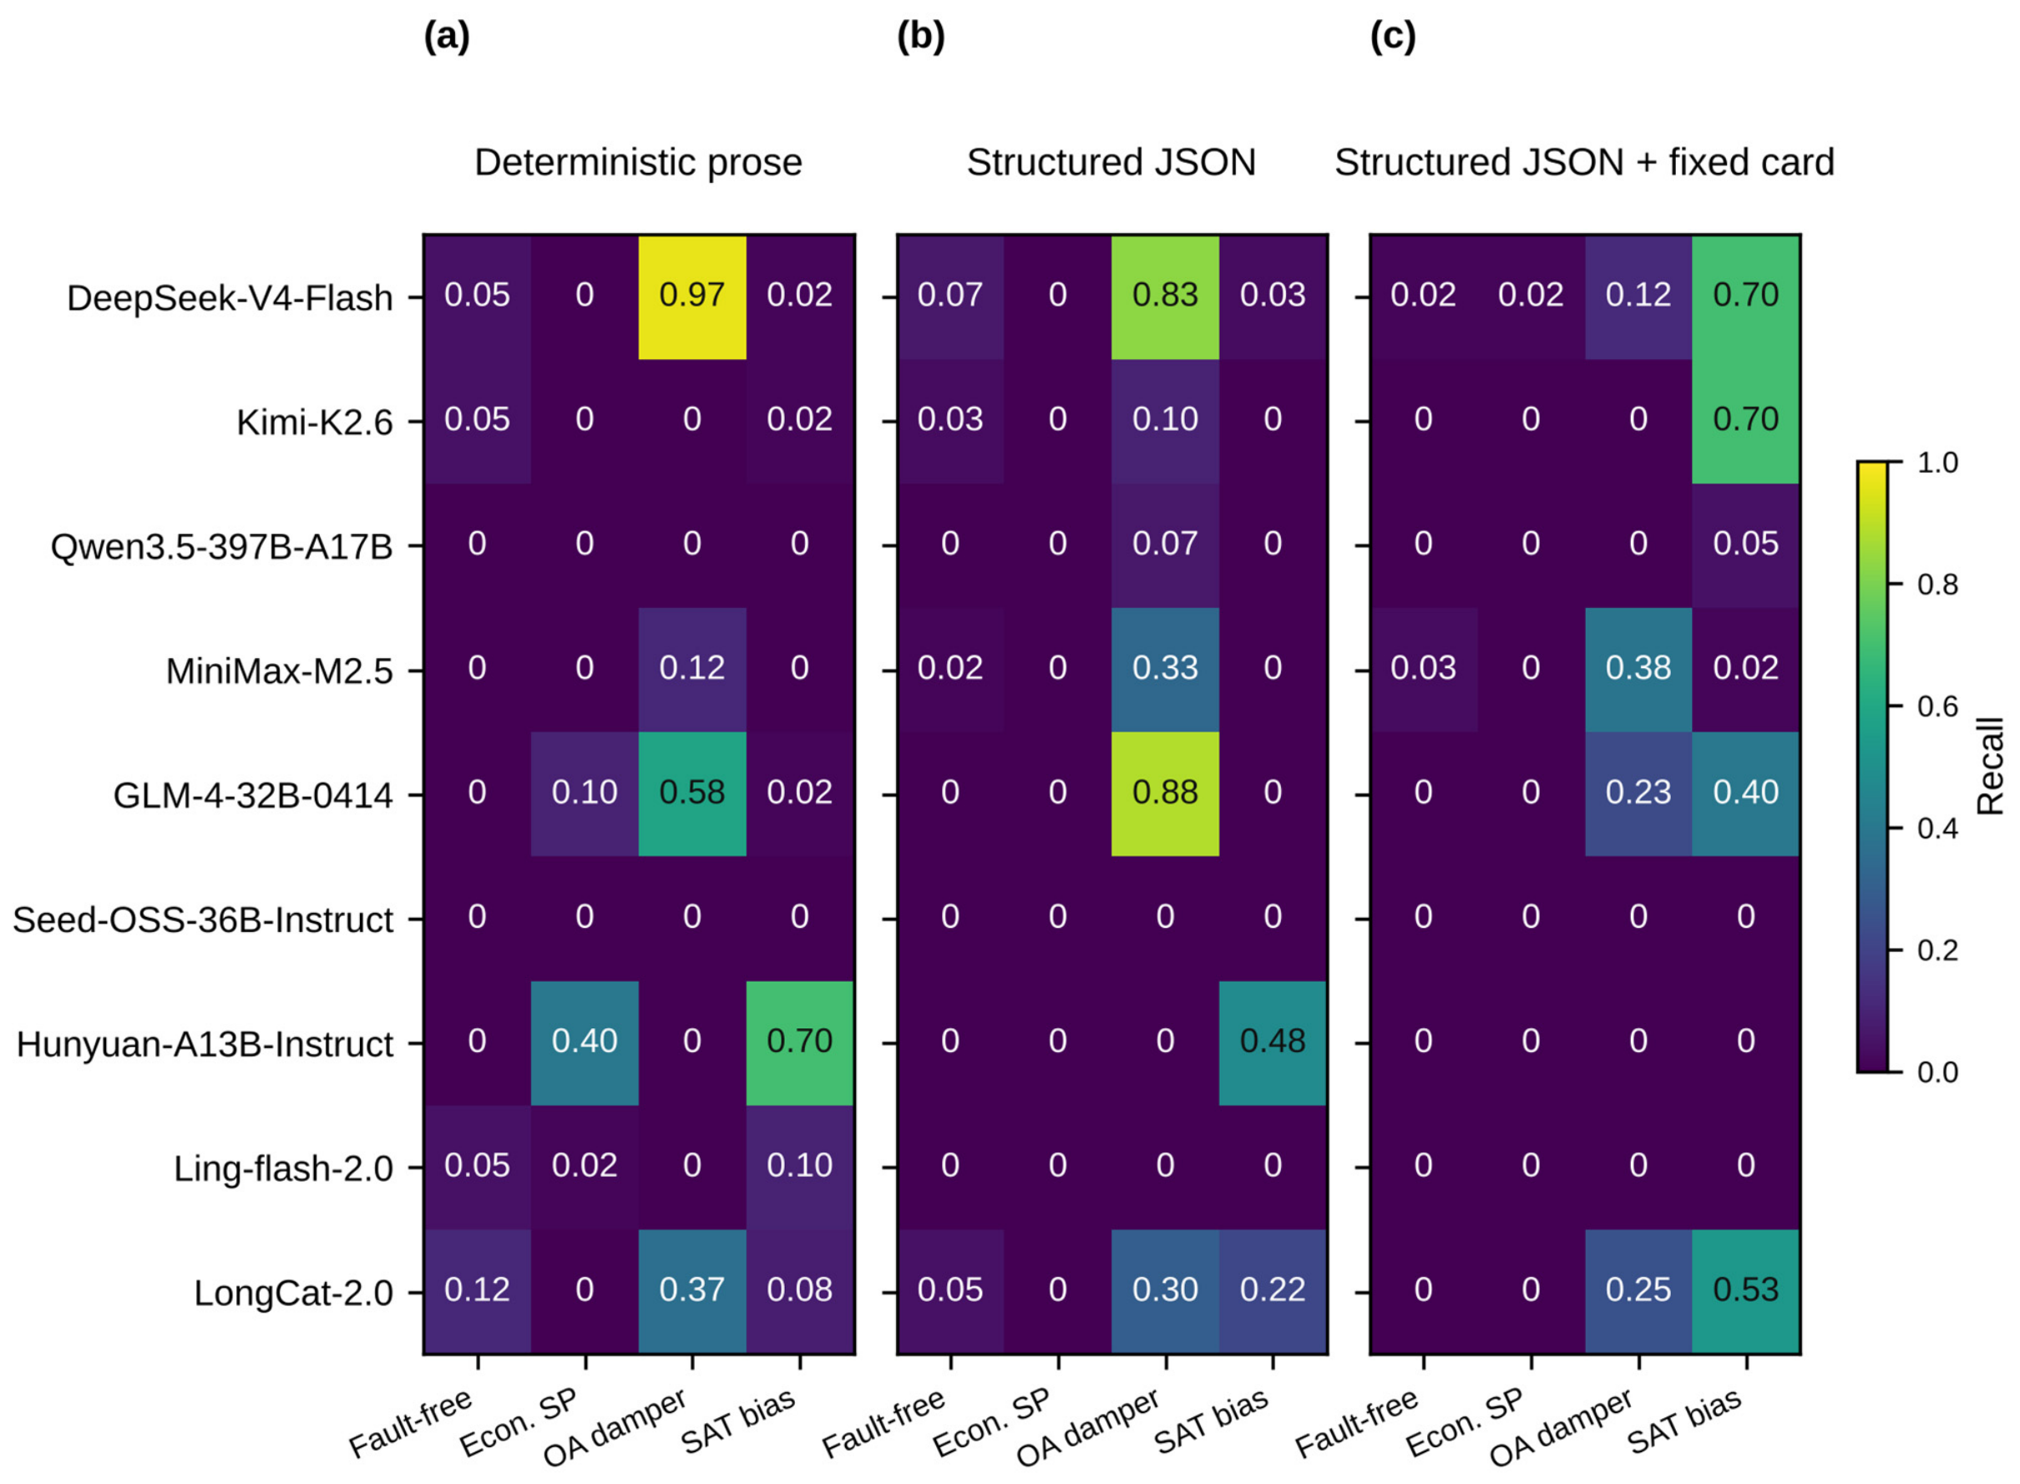
Figure 9 and Supplementary Table S13 show the class structure of the diagnostic errors; abstentions and invalid outputs count as misses in both. Supplementary Table S8 gives precision, recall, and F1 for each class, model, and condition, Supplementary Table S7 gives recall by fault severity, and Supplementary Figure S1 shows the confusion matrix of each model. Pooled across the nine models, recall for fault-free operation was 0.030, 0.019, and 0.006 in C0, C1, and C2, and recall for economizer setpoint error was 0.057, 0.000, and 0.002; these two classes accounted for 58 to 63 percent of incorrect forced diagnoses in every condition. Forced predictions concentrated on the outdoor air damper stuck class in C0 and C1, for example, 0.970 and 0.915 of DeepSeek-V4-Flash diagnoses and 0.829 and 0.971 of GLM-4-32B-0414 diagnoses. With four balanced classes, assigning one class to every window yields macro F1 of 0.100, close to the values of these two models. This concentration is consistent with the damper command profile in Section 4.1, where zero command variability also occurred in most windows of the other classes. C2 shifted predictions toward supply air temperature sensor bias, whose card entry states a 55 °F target that C0 and C1 do not supply, although the economizer entry likewise adds a 50 °F threshold without increasing economizer predictions. Pooled recall for supply air temperature sensor bias rose from 0.081 in C1 to 0.267 in C2, while recall for outdoor air damper stuck fell from 0.278 to 0.109. For DeepSeek, GLM, and LongCat, macro F1 changed by no more than 0.014 between C1 and C2, so the card redirected predictions between classes rather than improving their separation. Economizer setpoint error recall reached 0.400 for Hunyuan prose, the highest value for this class in any cell.
Figure 9.
Per-class recall across models and input representations: (a) deterministic prose; (b) structured JSON; (c) structured JSON with the fixed evidence card. DeepSeek uses 59 outdoor-air-damper-stuck windows and 60 windows for each other class. Abstentions and invalid outputs count as misses. Econ. SP, economizer setpoint error; OA damper, outdoor air damper stuck; SAT bias, supply air temperature sensor bias.
Season-specific macro F1, listed in Supplementary Table S5, ranged from zero to 0.202. Recalculated within each report season, the larger paired contrasts kept their sign in all three seasons: Hunyuan, Ling, MiniMax, Qwen, and Kimi between C1 and C0, and Hunyuan, MiniMax, and Kimi between C2 and C1. Omitting any single source file did not reverse these estimates, although for Qwen and Ling between C1 and C0 and for Hunyuan between C2 and C1, a condition without correct diagnoses fixes the sign. In contrast, near-zero contrasts for DeepSeek, LongCat, and GLM between C1 and C0 changed sign across seasons or omitted files, as listed in Supplementary Table S14.
The bounded pilot check reproduced the main output patterns but not every individual response, as shown in Supplementary Table S17. With prompt hashes identical to the August run, the outcome for a pilot window matched the 31 August response in 0.625 to 1.000 of windows per model and condition, with a mean of 0.806; because the two runs were 53 days apart, this agreement combines run-to-run variation with any change on the provider side. Hunyuan-A13B-Instruct again enclosed every C2 response and most C1 responses in code fences, and Kimi-K2.6 again abstained on almost every C0 and C1 window but on fewer C2 windows. Ling-flash-2.0 still abstained on most windows but returned 16 schema failures in 96 retest requests, 15 of them truncated, whereas its August pilot responses were all schema-valid. Reversing the variable order changed the outcome for 16 to 41 percent of windows relative to same-day responses, a share that also contains run-to-run variation, and lowered Kimi-K2.6 prose abstention from 0.969 to 0.562, while Hunyuan-A13B-Instruct JSON output remained largely invalid, with schema validity of 0.156 in the original order and zero in reversed order. In the same-day control on 3 November, reported in Supplementary Table S18, the two identical original-order runs agreed on 0.656 to 0.969 of the windows per model and condition. Order reversal exceeded this repeated-call variability for Kimi-K2.6 prose, with excess disagreement of 0.344 and an interval from 0.173 to 0.577; for Kimi-K2.6 JSON, 0.172, from 0.058 to 0.308, and for Hunyuan-A13B-Instruct prose, 0.234, from 0.077 to 0.344. Kimi-K2.6 prose abstention was 0.969 in both original-order runs and 0.594 in reversed order, and 12 of the 30 windows with identical outcomes in both original-order runs changed under reversal. For Ling-flash-2.0, the intervals included zero in both conditions, and for Hunyuan-A13B-Instruct JSON, the two original-order runs disagreed more often than either differed from the reversed-order run, because whether a response was fenced varied between identical requests, with schema validity of 0.125 and 0.219. With 32 windows, these results are descriptive.
5. Discussion
5.1. Main Findings and Representation Effects
The central finding is that input representation changed diagnostic and output behavior in a model-specific manner even when the measurements, labels, task instructions, and output schema were held constant. No model-specific macro F1 contrast remained significant after Holm adjustment within either comparison, so H1 was not supported for any model. Changes consistent with H2 and H3 occurred for individual models and in both directions and were assessed descriptively. These results do not show that JSON generally improves diagnosis: individual gains, their direction across seasons, and bootstrap intervals that excluded zero are descriptive, concern few models, and mostly coincided with changes in validity or abstention. Nor do the nonsignificant contrasts establish that the representations are equivalent. No equivalence margin was prespecified, and intervals such as −0.078 to 0.032 for GLM and −0.031 to 0.083 for Kimi between C1 and C0 include differences that would be large relative to the observed macro F1 range of zero to 0.182.
Because macro F1 alone cannot distinguish a valid abstention, a forced label citing absent variables, and an answer outside the output protocol, schema compliance, coverage, correctness, and name-level evidence grounding are reported as separate stages of the response.
The response routes in Section 4.3 point to different mechanisms. For Seed and Ling, the explicit unknown option and its consistency rule permitted a conservative policy in which uncertainty was resolved by abstention; for Ling, complete abstention coincided with JSON input, which omits the connecting sentences of the prose rendering. Seed abstentions were complete objects, not truncated outputs. For Hunyuan, the prohibited fenced output began with JSON input and became complete with the longer C2 input. Under the unrepaired parser, this format change alone removed all scored performance, although after fence removal the C2 answers reached macro F1 of 0.200 against 0.182 for C0 prose in the exploratory check, with a paired interval that included zero and with most diagnoses naming one class. Constrained decoding and validated repair therefore need separate evaluation with the same audit protocol.
The larger macro F1 changes coincided with changes in whether a scorable diagnosis was produced rather than with better class discrimination. Between C1 and C0, MiniMax gained 0.029 as schema validity rose from 0.079 to 0.413 and Qwen gained 0.023 as abstention fell from 0.983 to 0.838. Hunyuan lost 0.082 as schema validity fell from 1.000 to 0.354, and Ling lost 0.067 as abstention rose to 1.000. Selective accuracy moved opposite to macro F1 for MiniMax, 0.368 to 0.216, and Hunyuan, 0.275 to 0.341, while macro F1 for DeepSeek and GLM, which almost always returned valid diagnoses, changed by no more than 0.017. Six bootstrap intervals excluded zero and three unadjusted p values were below 0.05, as reported in Section 4.2, but none survived Holm adjustment. The larger contrasts kept their direction across seasons and source files, but this consistency is descriptive and, for Qwen and Ling between C1 and C0 and for Hunyuan between C2 and C1, partly mechanical because one condition had no correct diagnoses.
The 0.333 reduction in invalid MiniMax output under JSON has practical value where unparseable responses must otherwise be discarded or reviewed manually. Higher coverage helps only if the added diagnoses are correct. The card raised Kimi coverage by 0.508, but 0.994 of its C2 diagnoses named supply air temperature sensor bias, and its selective accuracy rose only from 0.235 to 0.269. LongCat abstention fell from 0.254 to zero, while its macro F1 changed only from 0.130 to 0.127. These changes concern output usability rather than diagnostic capability.
The card changed which class was predicted and which names were cited: the unsupported evidence flag rate rose sharply for GLM and fell for DeepSeek, as reported in Section 4.3, while their macro F1 changed by only 0.014 and 0.002. Nearly every C1 forced fault diagnosis by DeepSeek, GLM, Kimi, LongCat, and Qwen already cited a variable that the card associates with the predicted class, in an exploratory check reported in Supplementary Table S16, and the name-level flag cannot assess numeric or causal validity. Because these shares were already 1.000 in C1, and mixed air temperature and the damper commands belong to more than one card entry, this check could not have detected an improvement; whether the card makes the cited values or the rationale more correct remains untested. The C2 results therefore show changes in citation and labeling behavior and no measurable improvement in traceability at the variable name level.
5.2. Relationship to HVAC LLM Systems and Random Forest Reference
Unlike the domain-adapted HVAC systems reviewed in Section 2.2, the present design changes only the rendering of one evidence object, so its paired contrasts isolate serialization before trained weights, retrieval, ontologies, or agent actions are introduced.
The fixed all-class card is a controlled form of documentation augmentation that changes the information budget without target-dependent retrieval or worked examples. Because every window receives the same card, the model-specific responses show that documentation can alter answerability, output validity, and class behavior, but they do not estimate the value of document selection or retrieval quality.
The Random Forest reference shows that the selected 60 min summaries retain supervised diagnostic signal under seasonal holdout, with macro F1 of 0.543 against a maximum of 0.182 across the 27 model condition cells. Both received the same 90 summary statistics, so the gap does not arise from different window measurements. Four factors plausibly contribute to it. First, the Random Forest learned class-specific decision boundaries from 420 to 506 labeled windows of the same facility, whereas the LLMs received no labeled examples and, in C0 and C1, no documented supply air temperature target or economizer threshold. Second, the signal is uneven across classes: even the Random Forest recalled only 0.333 of fault-free and economizer setpoint error windows, which it most often confused with each other. An incorrect economizer setpoint is expected to change unit behavior mainly when outdoor conditions lie between the correct and incorrect changeover thresholds. The damper command was constant within 49 of 60 fault-free and 52 of 60 economizer setpoint error windows, so hourly summaries often contain no distinguishing response. Third, the primary endpoint scores abstentions and schema failures as incorrect, which the Random Forest cannot produce, as the response routes in Section 4.3 show. Fourth, models that usually returned a forced diagnosis concentrated predictions on few classes, as shown in Section 4.3. Across the 22 model condition cells with at least one forced diagnosis, selective accuracy never exceeded 0.368 and was below 0.25, the value expected from always predicting one class on balanced windows, in 16 cells, six of which rest on fewer than 35 diagnoses, as listed in Supplementary Table S12. The deficit is therefore not only an artifact of abstention. Because the Random Forest uses labeled training data and a different decision process, it calibrates task difficulty and the information available in the summaries and does not serve as a direct ranking comparator.
5.3. Practical Implications and Study Scope
A fixed schema supports deterministic input validation and evidence fields that can be audited by name. A practical evaluation should jointly assess diagnostic accuracy, schema compliance, diagnostic coverage, abstention behavior, and name-level evidence grounding for the selected model.
Given the gap to the supervised reference described in Section 5.2, the evaluated zero-shot configurations would produce frequent missed and false diagnoses if used as automatic fault labels. Their present value lies in showing how representation changes answerability, output validity, and evidence citation before validation layers, retrieval, or supervised components are added, not in replacing supervised or rule-based FDD.
For BIM or digital twin integration, the evidence object links telemetry to asset context and the parser gives an agent schema-validated output, so asset metadata, maintenance documents, retrieval, and actions can be evaluated without changing the representation of the measured evidence.
The estimates, based on 240 windows from 39 source files in three report seasons, apply to one 12.5-ton packaged RTU serving a ten-zone VAV system in a single controlled unoccupied ORNL test facility with emulated internal loads. Each fault, intensity, and season cell is represented by one source file contributing five windows, and the fault-free class rests on three files contributing 20 windows each, so the effective sample is closer to 39 physical runs than to 240 independent cases. Each fault run contains a single documented fault, the four classes are balanced, and the models choose among only four candidate labels, whereas field diagnosis must separate many more fault types. Field applications differ in ways this design does not test. Air handling units, chillers, and heat pumps involve other components, control sequences, and fault signatures. Occupied buildings add variable loads and manual overrides. Field data typically contain more sensor noise, drift, and missing values; point naming varies between sites, faults can occur simultaneously, and fault-free operation usually dominates, which changes precision and false alarm rates relative to a balanced design. The results therefore characterize representation effects within one well-specified RTU setting and require confirmation on other equipment types and field data before they are generalized.
The evidence object represents each signal through six summary statistics. These statistics retain the level, spread, range, linear trend, and end state of each channel within a window, but not the order and lag between a command and the equipment response, the timing of changeover events, or cycling within the hour. Random Forest class recall under seasonal holdout, reported in Section 4.1, indicates that the summaries separate the damper and sensor faults better than the economizer fault and fault-free operation. Windows were not selected conditional on outdoor air temperature, so an unknown share of economizer setpoint error windows contain no outdoor condition under which the incorrect setpoint changes unit behavior, which limits attainable recall for this class in every condition. Fault signatures that depend on such sequences are therefore only partially represented for both the Random Forest and the LLMs, and sequence-aware evidence objects can be compared with the present summaries under the same parity protocol. The evaluation addresses prompt-level diagnosis rather than maintenance recommendations, interventions, online control, occupant outcomes, energy savings, or safety, and a separate evaluation is required for the numeric and causal validity of free text rationales.
The deterministic prose condition defines the primary comparison as input rendering rather than free text field notes. Because C1 inputs were 304 tokens longer than C0 inputs on average at nearly identical character length, the difference between C1 and C0 estimates the effect of the complete serialization package, including field labels, punctuation, layout, and token count, rather than JSON syntax alone. Each condition used one template in the report run. In the pilot check with a same-day repeated-call control, reversing the variable order changed outcomes beyond repeated-call variability for Kimi-K2.6 in both conditions and for Hunyuan-A13B-Instruct prose, but not for Ling-flash-2.0 or Hunyuan-A13B-Instruct JSON, so variable order is itself a model-specific source of sensitivity whose effect on the report contrasts was not estimated. The reported contrasts therefore apply to the evaluated templates and the fixed variable order; alternative prose wordings and JSON key names remain untested, and format sensitivity can be substantial [13]. Each model evaluated each report window once at temperature zero through one shared inference gateway on one date. Temperature zero does not guarantee identical outputs from hosted models, and content hash caching prevents duplicate requests rather than enforcing determinism. Run-to-run variation is therefore contained in, but not separated from, the window-level variation captured by the source file bootstrap. Because conditions were paired within windows and rotated over time, this adds noise to the paired contrasts but is not expected to favor one representation. The pilot retest reported in Section 4.3 reproduced the main output patterns but not every response, and because two of the evaluated models, MiniMax-M2.5 and Qwen3.5-397B-A17B, were no longer offered by the provider on 23 October 2026, exact replication of the report run depends on the archived responses rather than on renewed requests.
6. Conclusions
A leakage-controlled paired design compared deterministic prose, fixed schema JSON, and JSON with a fixed all-class evidence card as inputs for zero-shot rooftop unit fault diagnosis by nine API models, with numerical evidence and task instructions held constant.
Matched representations and the fixed evidence card produced model-specific differences in macro F1, schema validity, diagnostic coverage, and name-level evidence grounding. No model-specific macro F1 contrast remained significant after Holm adjustment in either comparison, and the larger observed changes coincided with changes in schema validity or abstention rather than improved class discrimination. These results do not show that JSON generally improves diagnosis, and the absence of significant contrasts does not establish that the representations are equivalent. In a pilot check with a same-day repeated call control, reversing the variable order alone changed outcomes beyond repeated call variability for two of three models in at least one condition. Prompt representation is therefore not a neutral transport layer and must be assessed with the selected model and template.
With macro F1 no higher than 0.182 under the prespecified strict parser, against 0.543 for a supervised reference, the evaluated zero-shot configurations are not suitable for unattended fault classification, and their outputs require verification. The reproducible evidence object, paired protocol, source file-level uncertainty analysis, and output audit allow representation and documentation to be evaluated as measurable design choices before retrieval, ontology, BIM, or agent components are added. Numeric and causal verification of rationales lies outside this name-level audit.
Supplementary Materials
The following supporting information can be downloaded at: https://www.mdpi.com/article/10.3390/iic2040017/s1, Text S1: Complete prompts, output schema, evidence card, and a paired example; Table S1: Model run record of the report run on 31 August 2026; Table S2: Diagnostic metrics by model and condition; Table S3: Paired differences between representations; Table S4: Output validity and efficiency by model and condition; Table S5: Descriptive results by report season; Table S6: Name-level evidence audit among completed and parseable responses; Table S7: Recall and output behavior by fault class and severity; Table S8: Per-class precision, recall, and F1 by model and condition; Table S9: Supervised Random Forest reference metrics on the locked report set; Table S10: The 15 channels in the common evidence object, in rendering order; Table S11: Classification of all 6480 attempted requests by model and condition; Table S12: Coverage, selective accuracy, and output token use by model and condition; Table S13: Confusion matrices pooled across the nine models for each condition; Table S14: Robustness of paired macro F1 contrasts across report seasons and source files; Table S15: Exploratory post hoc diagnostic performance under strict and lenient parsing of schema failures; Table S16: Exploratory check of evidence citation against the evidence card entry for the predicted class; Table S17: Bounded supplementary rerun on the 32 Spring pilot windows, test-retest agreement, and variable order sensitivity; Table S18: Same-day repeated call control for the variable order check on the 32 Spring pilot windows; Figure S1: Confusion matrices of the nine models on the 240 locked report windows.
Author Contributions
K.L., W.H. and Y.C. jointly conceived the study. K.L. and W.H. designed the methodology, carried out the investigation, validated the results, performed the formal analysis, and prepared the original draft. K.L. developed the software, curated the data, and produced the visualizations. Y.C. supervised the project and was responsible for its administration. All authors have read and agreed to the published version of the manuscript.
Funding
This research received no external funding.
Institutional Review Board Statement
Not applicable. The study uses public equipment-operation data and involves no human participants or identifiable personal information.
Informed Consent Statement
Not applicable.
Data Availability Statement
The source data are publicly available in the LBNL Fault Detection and Diagnostics Data Sets, DOI 10.25984/1881324 [10].
Acknowledgments
Claude Opus 5 by Anthropic and Codex ChatGPT 5.6 Sol by OpenAI were used between August and October 2026 to assist code review, manuscript drafting, and language editing. The nine API models listed in Section 3.2 were experimental systems. The authors are responsible for verifying the AI-assisted material and for the final manuscript.
Conflicts of Interest
The authors declare no conflicts of interest.
References
- Katipamula, S.; Brambley, M.R. Methods for fault detection, diagnostics, and prognostics for building systems: A review, Part I. HVAC R Res. 2005, 11, 3–25. [Google Scholar] [CrossRef] [Scilit]
- Kim, W.; Katipamula, S. A review of fault detection and diagnostics methods for building systems. Sci. Technol. Built Environ. 2018, 24, 3–21. [Google Scholar] [CrossRef] [Scilit]
- Mirnaghi, M.S.; Haghighat, F. Fault detection and diagnosis of large-scale HVAC systems in buildings using data-driven methods: A comprehensive review. Energy Build. 2020, 229, 110492. [Google Scholar] [CrossRef] [Scilit]
- Chen, Z.; O’Neill, Z.; Wen, J.; Pradhan, O.; Yang, T.; Lu, X.; Lin, G.; Miyata, S.; Lee, S.; Shen, C.; et al. A review of data-driven fault detection and diagnostics for building HVAC systems. Appl. Energy 2023, 339, 121030. [Google Scholar] [CrossRef] [Scilit]
- Bi, J.; Wang, H.; Yan, E.; Wang, C.; Yan, K.; Jiang, L.; Yang, B. AI in HVAC fault detection and diagnosis: A systematic review. Energy Rev. 2024, 3, 100071. [Google Scholar] [CrossRef] [Scilit]
- Crowe, E.; Chen, Y.; Reeve, H.; Yuill, D.; Ebrahimifakhar, A.; Chen, Y.; Troup, L.; Smith, A.; Granderson, J. Empirical analysis of the prevalence of HVAC faults in commercial buildings. Sci. Technol. Built Environ. 2023, 29, 1027–1038. [Google Scholar] [CrossRef] [Scilit]
- Lin, G.; Kramer, H.; Granderson, J. Building fault detection and diagnostics: Achieved savings, and methods to evaluate algorithm performance. Build. Environ. 2020, 168, 106505. [Google Scholar] [CrossRef] [Scilit]
- Frank, S.; Lin, G.; Jin, X.; Singla, R.; Farthing, A.; Granderson, J. A performance evaluation framework for building fault detection and diagnosis algorithms. Energy Build. 2019, 192, 84–92. [Google Scholar] [CrossRef] [Scilit]
- Granderson, J.; Lin, G.; Chen, Y.; Casillas, A.; Wen, J.; Chen, Z.; Im, P.; Huang, S.; Ling, J. A labeled dataset for building HVAC systems operating in faulted and fault-free states. Sci. Data 2023, 10, 342. [Google Scholar] [CrossRef] [Scilit] [PubMed]
- Lawrence Berkeley National Laboratory. LBNL Fault Detection and Diagnostics Data Sets; U.S. Department of Energy Data Explorer; Lawrence Berkeley National Laboratory: Berkeley, CA, USA, 2022. [Google Scholar] [CrossRef]
- Hegselmann, S.; Buendia, A.; Lang, H.; Agrawal, M.; Jiang, X.; Sontag, D. TabLLM: Few-shot classification of tabular data with large language models. In Proceedings of the 26th International Conference on Artificial Intelligence and Statistics, Valencia, Spain, 25–27 April 2023; PMLR: Cambridge, MA, USA, 2023; Volume 206, pp. 5549–5581. Available online: https://proceedings.mlr.press/v206/hegselmann23a.html (accessed on 15 September 2026).
- Liu, N.F.; Lin, K.; Hewitt, J.; Paranjape, A.; Bevilacqua, M.; Petroni, F.; Liang, P. Lost in the middle: How language models use long contexts. Trans. Assoc. Comput. Linguist. 2024, 12, 157–173. [Google Scholar] [CrossRef] [Scilit]
- Sclar, M.; Choi, Y.; Tsvetkov, Y.; Suhr, A. Quantifying language models’ sensitivity to spurious features in prompt design or: How I learned to start worrying about prompt formatting. In Proceedings of the Twelfth International Conference on Learning Representations, Vienna, Austria, 7–11 May 2024; Available online: https://openreview.net/forum?id=RIu5lyNXjT (accessed on 15 September 2026).
- Zhang, J.; Zhang, C.; Lu, J.; Zhao, Y. Domain-specific large language models for fault diagnosis of heating, ventilation, and air conditioning systems by labeled-data-supervised fine-tuning. Appl. Energy 2025, 377, 124378. [Google Scholar] [CrossRef] [Scilit]
- Li, Y.; Ji, M.; Chen, J.; Wei, X.; Gu, X.; Tang, J. A large language model-based building operation and maintenance information query. Energy Build. 2025, 334, 115515. [Google Scholar] [CrossRef] [Scilit]
- Li, J.; Koo, J.; Lee, J.; Wang, P.; Zhao, T.; Yoon, S. Agentic fault detection and diagnosis for building HVAC systems using AI agent, ontology, and diagnosis rules. Build. Environ. 2026, 289, 114104. [Google Scholar] [CrossRef] [Scilit]
- Zhang, J.; Wang, F.; Zhang, C.; Liu, Y.; Lu, J.; Zhao, Y. LightLLM4FDD: Domain-specific lightweight large language models for fault detection and diagnosis in building HVAC systems. Adv. Eng. Inform. 2026, 74, 104794. [Google Scholar] [CrossRef] [Scilit]
- Wang, Z.; Chen, S.; Zhao, T.; Xu, B.; Chen, Z. Sample-efficient LLM fault diagnosis for HVAC systems via active sampling and SHAP-guided evidence condensation. Appl. Energy 2026, 423, 128381. [Google Scholar] [CrossRef] [Scilit]
- Balaji, B.; Bhattacharya, A.; Fierro, G.; Gao, J.; Gluck, J.; Hong, D.; Johansen, A.; Koh, J.; Ploennigs, J.; Agarwal, Y.; et al. Brick: Towards a unified metadata schema for buildings. In Proceedings of the 3rd ACM International Conference on Systems for Energy-Efficient Built Environments, Palo Alto, CA, USA, 16–17 November 2016; pp. 41–50. [Google Scholar] [CrossRef] [Scilit]
- Fierro, G.; Koh, J.; Nagare, P.; Zang, X.; Agarwal, Y.; Gupta, R.; Culler, D. Formalizing tag-based metadata with the Brick ontology. Front. Built Environ. 2020, 6, 558034. [Google Scholar] [CrossRef] [Scilit]
- Ebrahimifakhar, A.; Kabirikopaei, A.; Yuill, D. Data-driven fault detection and diagnosis for packaged rooftop units using statistical machine learning classification methods. Energy Build. 2020, 225, 110318. [Google Scholar] [CrossRef] [Scilit]
- Movahed, P.; Taheri, S.; Razban, A. A bi-level data-driven framework for fault-detection and diagnosis of HVAC systems. Appl. Energy 2023, 339, 120948. [Google Scholar] [CrossRef] [Scilit]
- Shi, F.; Chen, X.; Misra, K.; Scales, N.; Dohan, D.; Chi, E.H.; Scharli, N.; Zhou, D. Large language models can be easily distracted by irrelevant context. In Proceedings of the 40th International Conference on Machine Learning, Honolulu, HI, USA, 23–29 July 2023; PMLR: Cambridge, MA, USA, 2023; Volume 202, pp. 31210–31227. Available online: https://proceedings.mlr.press/v202/shi23a.html (accessed on 15 September 2026).
- Manakul, P.; Liusie, A.; Gales, M.J.F. SelfCheckGPT: Zero-resource black-box hallucination detection for generative large language models. In Proceedings of the 2023 Conference on Empirical Methods in Natural Language Processing, Singapore, 6–10 December 2023; pp. 9004–9017. [Google Scholar] [CrossRef] [Scilit]

Disclaimer/Publisher’s Note: The statements, opinions and data contained in all publications are solely those of the individual author(s) and contributor(s) and not of MDPI and/or the editor(s). MDPI and/or the editor(s) disclaim responsibility for any injury to people or property resulting from any ideas, methods, instructions or products referred to in the content. |
© 2026 by the authors. Licensee MDPI, Basel, Switzerland. This article is an open access article distributed under the terms and conditions of the Creative Commons Attribution (CC BY) license.