


Abstract
Urban green spaces (UGSs) serve multiple purposes. Most existing research uses questionnaires to capture how residents use and perceive various UGS ecosystem services (ESs), without documenting what is available and accessible to residents and without identifying underlying patterns. This study addresses this gap by first documenting UGSs in Srinagar, India, and then understanding their usage patterns and ES perceptions by using advanced machine learning. After documenting and mapping all 237 UGSs across Srinagar city, we surveyed 420 respondents across 20 selected UGSs, from April to July 2025, using a semi-structured questionnaire. We then applied a self-organizing map (SOM) to identify patterns, non-metric multidimensional scaling (NMDS) to picture them and permutation-based analysis to recognize key factors. The results show three distinct user groups, while NMDS showed that education, proximity to UGSs and visitation frequency were the main driving factors behind these three groups. There were clear contrasts between the three groups. Young students frequently visited UGSs and identified them as critical for psychological restoration and emotional well-being (Cluster I). Individuals with no formal education, older adults and housewives who live nearby UGSs utilize them for physical activity, child supervision and social cohesion (Cluster II). The engagement of middle-aged government employees and farmers/laborers was characterized by a utilitarian appreciation, and they emphasize the economic value of UGSs, specifically resource harvesting and livelihood support (Cluster III). These findings underscore the importance of considering differences between user groups when planning and managing UGSs.
1. Introduction
Urban green spaces (hereafter UGSs) typically describe areas that are characterized by higher vegetation cover, including parks, gardens, meadows, residential yards, grassy lawns, engineered green roofs and rain gardens [1]. Although they are generally recognized for their recreational or aesthetic merits, UGSs are hugely vital for maintaining environmental quality, hydrological processes, climate regulation, and biodiversity conservation. UGSs act as natural gathering points for people to converge for various purposes and promote healthy living [2]. Accordingly, the United Nations has specified the need for “providing universal access to green space for urban residents’’ in its 11th Sustainable Development Goal, which aims to make cities and human settlements inclusive, safe, resilient and sustainable [3].
UGSs in India have emerged as ecosystems that are not just seen as decorative landscape elements but that also offer vital ecological, social, cultural and psychological benefits [4,5]. Various regulatory frameworks and initiatives guide UGS planning and recommend area allocations, with many focusing on beautification rather than ecological performance [6]. Moreover, while India possesses pockets of green spaces like neighborhood parks and roadside trees [7], their availability remains low [8,9]. A growing demand for civic amenities amid increasing land scarcity, inefficient rainwater retention, and increasing water scarcity has largely hampered UGS expansion across India [10,11]. Fragmented governance, poor coordination and less emphasis on UGS multifunctionality further undermine the effective maintenance of UGSs [12].
Explicating user perception of ecosystem services in UGSs primarily involves highlighting their importance for physical, mental and environmental well-being. User perception is significantly moderated by demographic, socio-economic and cultural factors, which leads to varied experiences across different user groups [13,14]. In particular, age, academic level, duration of urban residency and gender significantly influence safety perceptions, with women often reporting greater safety risks and facing constraints due to time limitations [15]. Moreover, people’s perceptions, socio-cultural attachments and interactions with UGSs deeply influence how such spaces are used or even protected. Thus, without understanding these perspectives, UGS policies risk being disconnected from realities.
Although earlier studies have focused on diverse topics [16], the broader human dimension of UGS services, including usage and perceptions, in the rapidly urbanizing Himalayan region remains underexplored. Moreover, while traditional statistical methods have been commonly used to assess demographic differences [17], they may not always capture complex patterns in survey responses. More recent advancements include computational methods like self-organizing maps (SOMs) [18], which can be used to gain behavioral insights and identify clusters within data. However, as SOMs alone may not sufficiently display relationships among high-dimensional variables, techniques like non-metric multidimensional scaling (NMDS) are also applied to visualize patterns more effectively [19]. SOMs and NMDS have an edge over other statistical methods in terms of revealing nonlinear patterns in complex and high-dimensional data.
For regions like Srinagar city, where UGSs are intricately related to cultural identity and livelihoods, elucidating and displaying how residents perceive and value different ecological services is hugely vital. Earlier studies related to the UGSs of Srinagar have either studied their extent from a business performance perspective [16] or elucidated how urban expansion [20] or invasive species alter their ecological balance [21] without any mention of distribution, usage and accessibility. Accessibility to a UGS is highly important from an environmental justice perspective [22], and numerous workers have defined it variably, considering it both in terms of geographical accessibility as well as travel features [23,24]. Following Hansen [25], who proposed that accessibility refers to the ease of travel from an origin to a destination using a specific mode of transportation, the present study defines it as respondent-level proximity, taking into account the residential distance from a UGS and the trip mode (walking, using public or personal transport, etc.). Moreover, there have been no studies focused on how local residents perceive and value the different UGS ecological services offered across the Himalayan region. This is hugely limiting because understanding the perceptions and interactions of locals is vital for restoring and enhancing green infrastructure in ways that align with environmental goals as well as community needs. In this context, the present study is among the first to document and map UGSs across Srinagar city and to examine how people from diverse socio-economic backgrounds use and perceive UGS services and functions. However, notwithstanding the wider typology, the UGSs in this study are defined as spaces which are accessible and used for physical activity and relaxation [26]. Thus, only gardens and parks are considered for this study.
2. Materials and Methods
2.1. Study Area
Srinagar—the summer capital of the Union Territory of Jammu and Kashmir, located between 34°0′ N to 34°15′ N and 74°40′ E to 75°09′ E—is known for its pleasant gardens and tree-lined boulevards. The city has undergone rapid expansion and, from a size of 12.80 km2 in 1901, its present spread is estimated to have reached 341 km2 [27]. As an important urban destination that holds a key position in the entire Indian Himalayan Region, it harbors diverse flora with 920 plant species [28], including 342 species reported from its UGSs alone [21]. Its UGSs have long served as a backbone of the tourism industry and drawn vacationers from around the world. But recent urban sprawl has significantly altered its land-use, including green cover, so much so that between 2001 and 2018, it lost about 13,626 hectares (ha) to urban sprawl and land conversion [16]. This may have far-reaching implications, not only for its ecological integrity but also its socio-economic vitality.
2.2. Documentation, Mapping and Site Selection
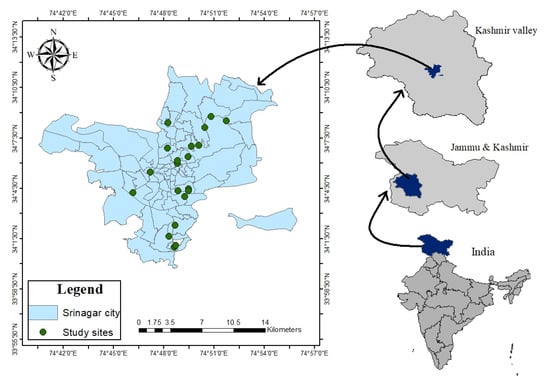
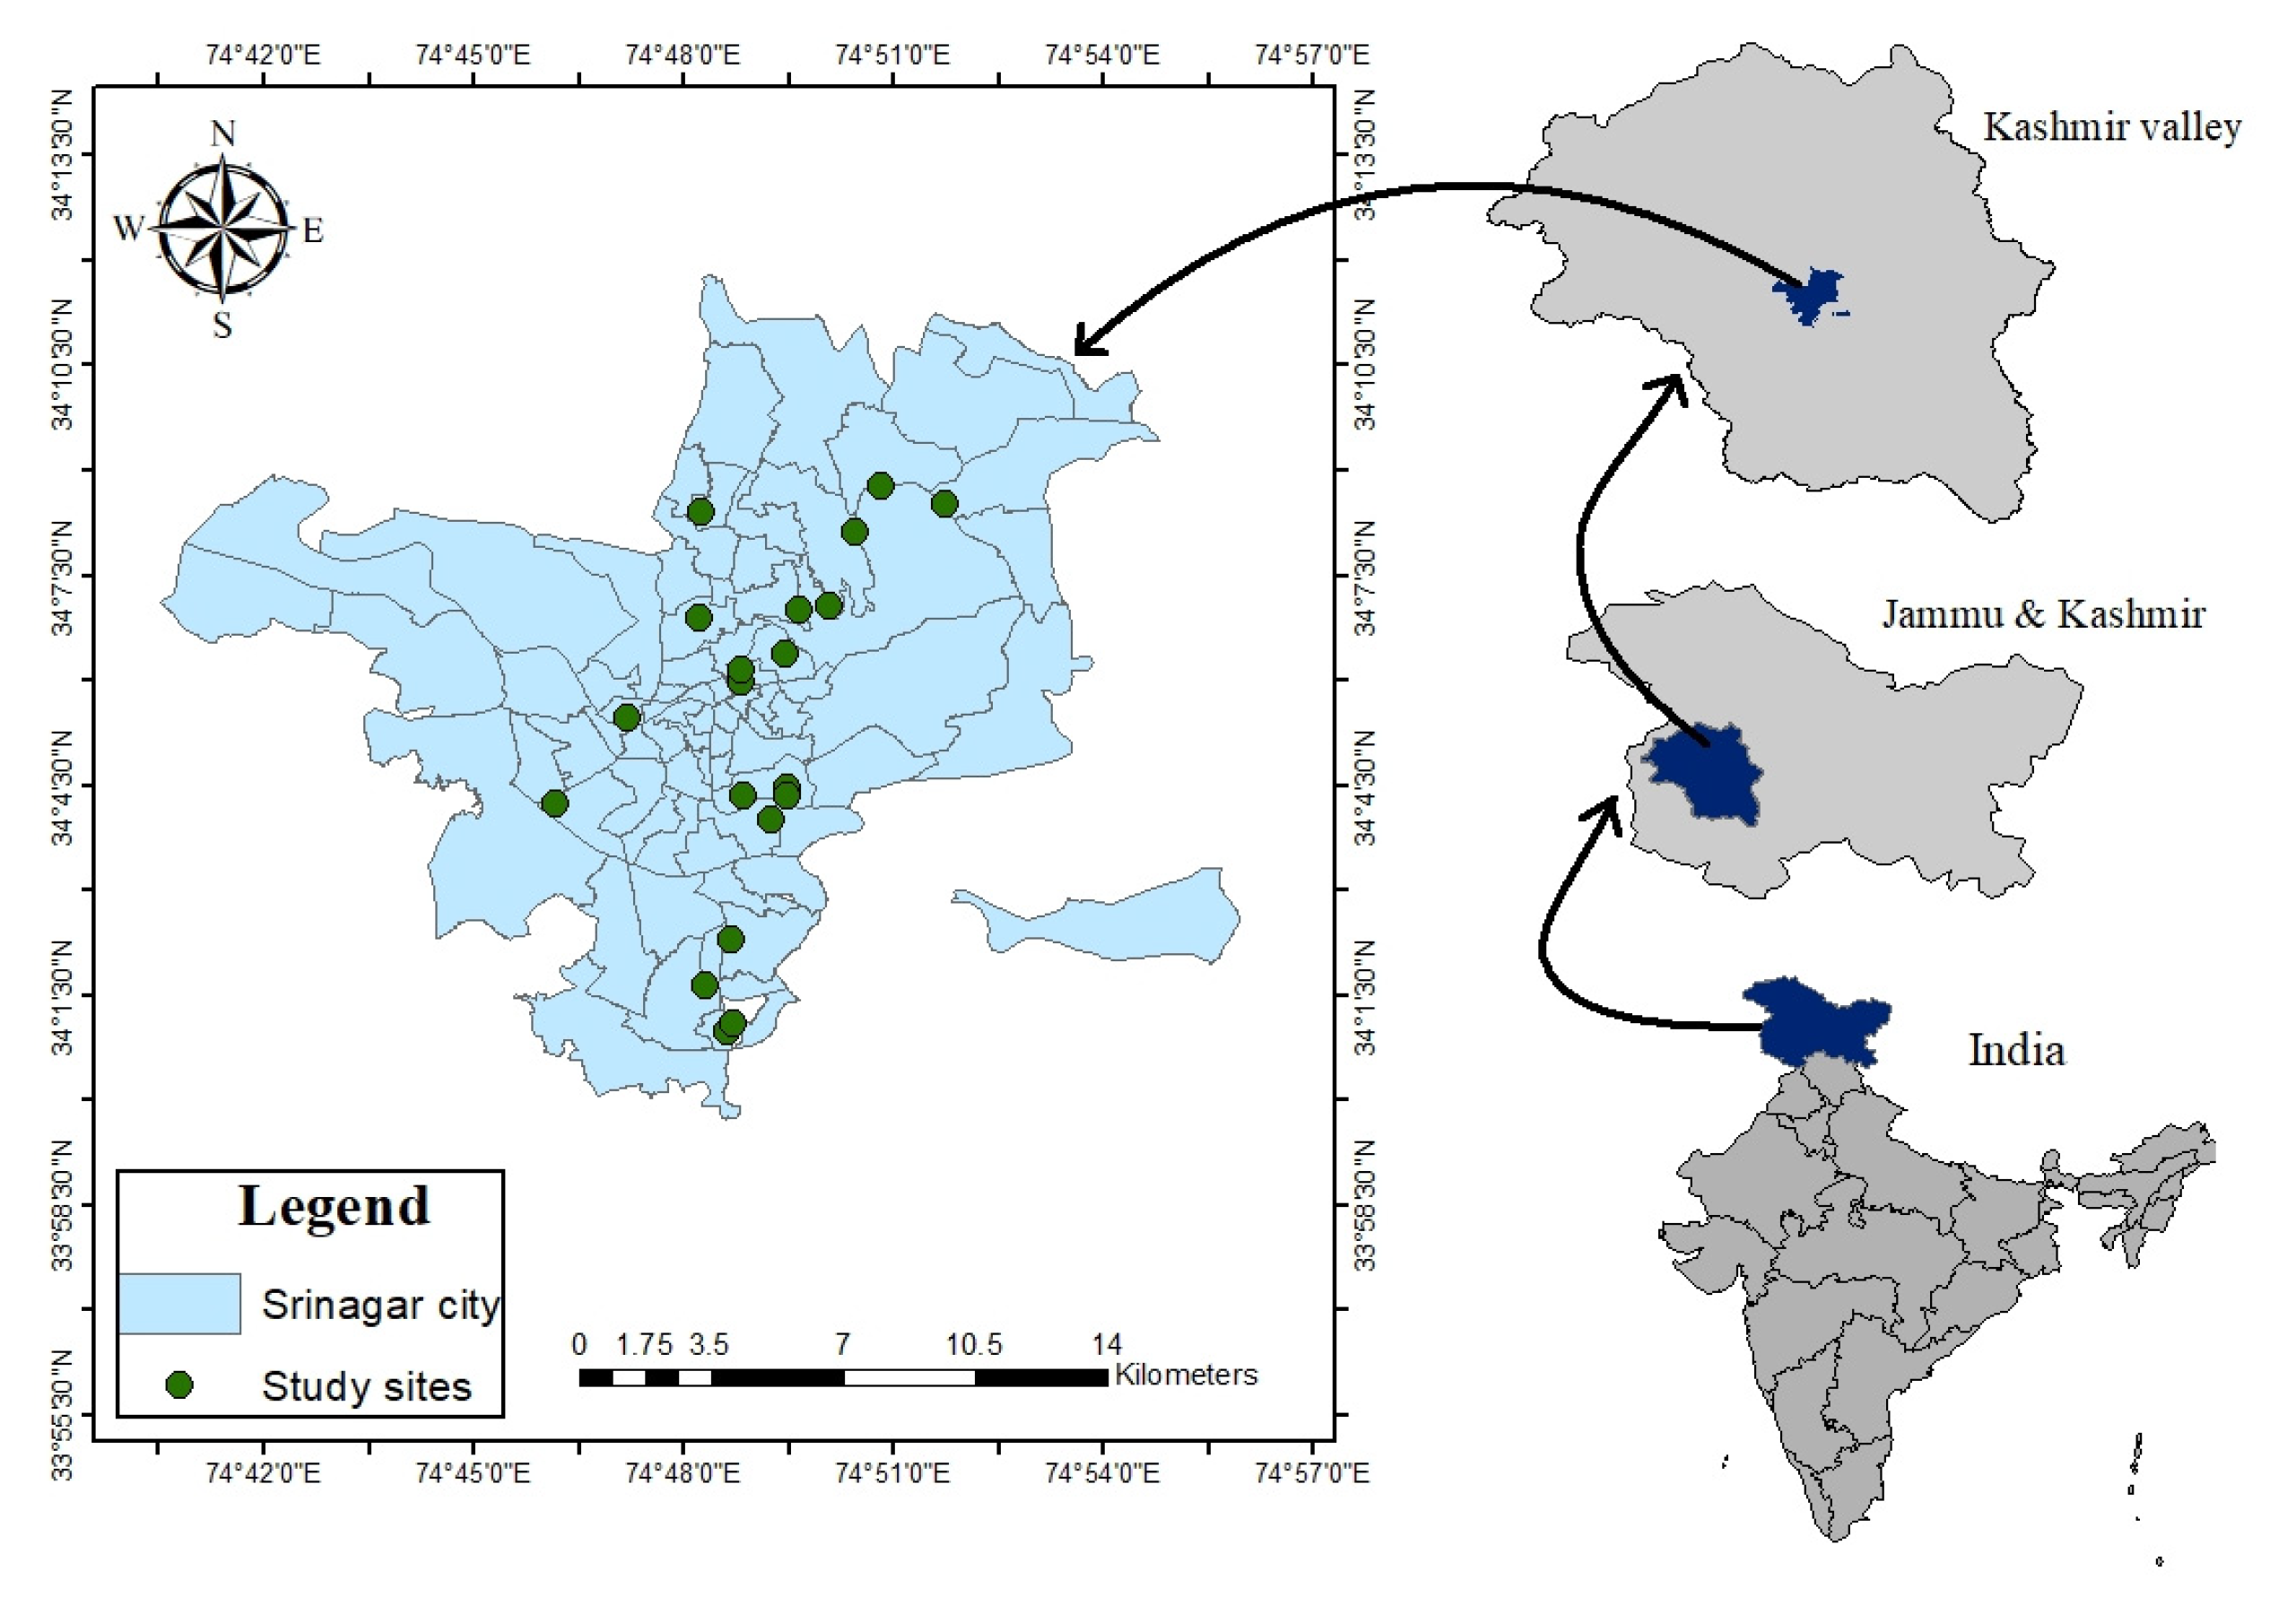
The first phase involved surveying, documenting and mapping UGSs within city limits (Figure 1).
Figure 1.
Map of the study area, showing the location of twenty selected UGSs across the 74 administrative wards. (Note: The discontinuity in the map is administrative).
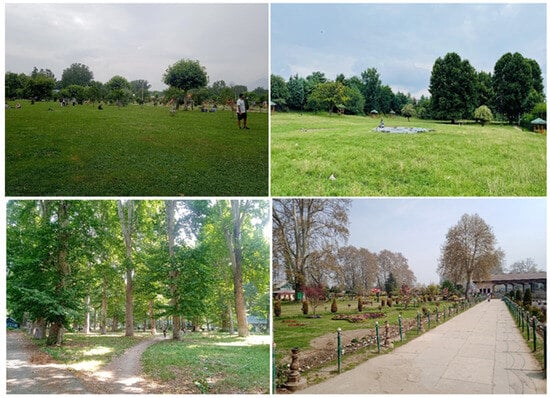
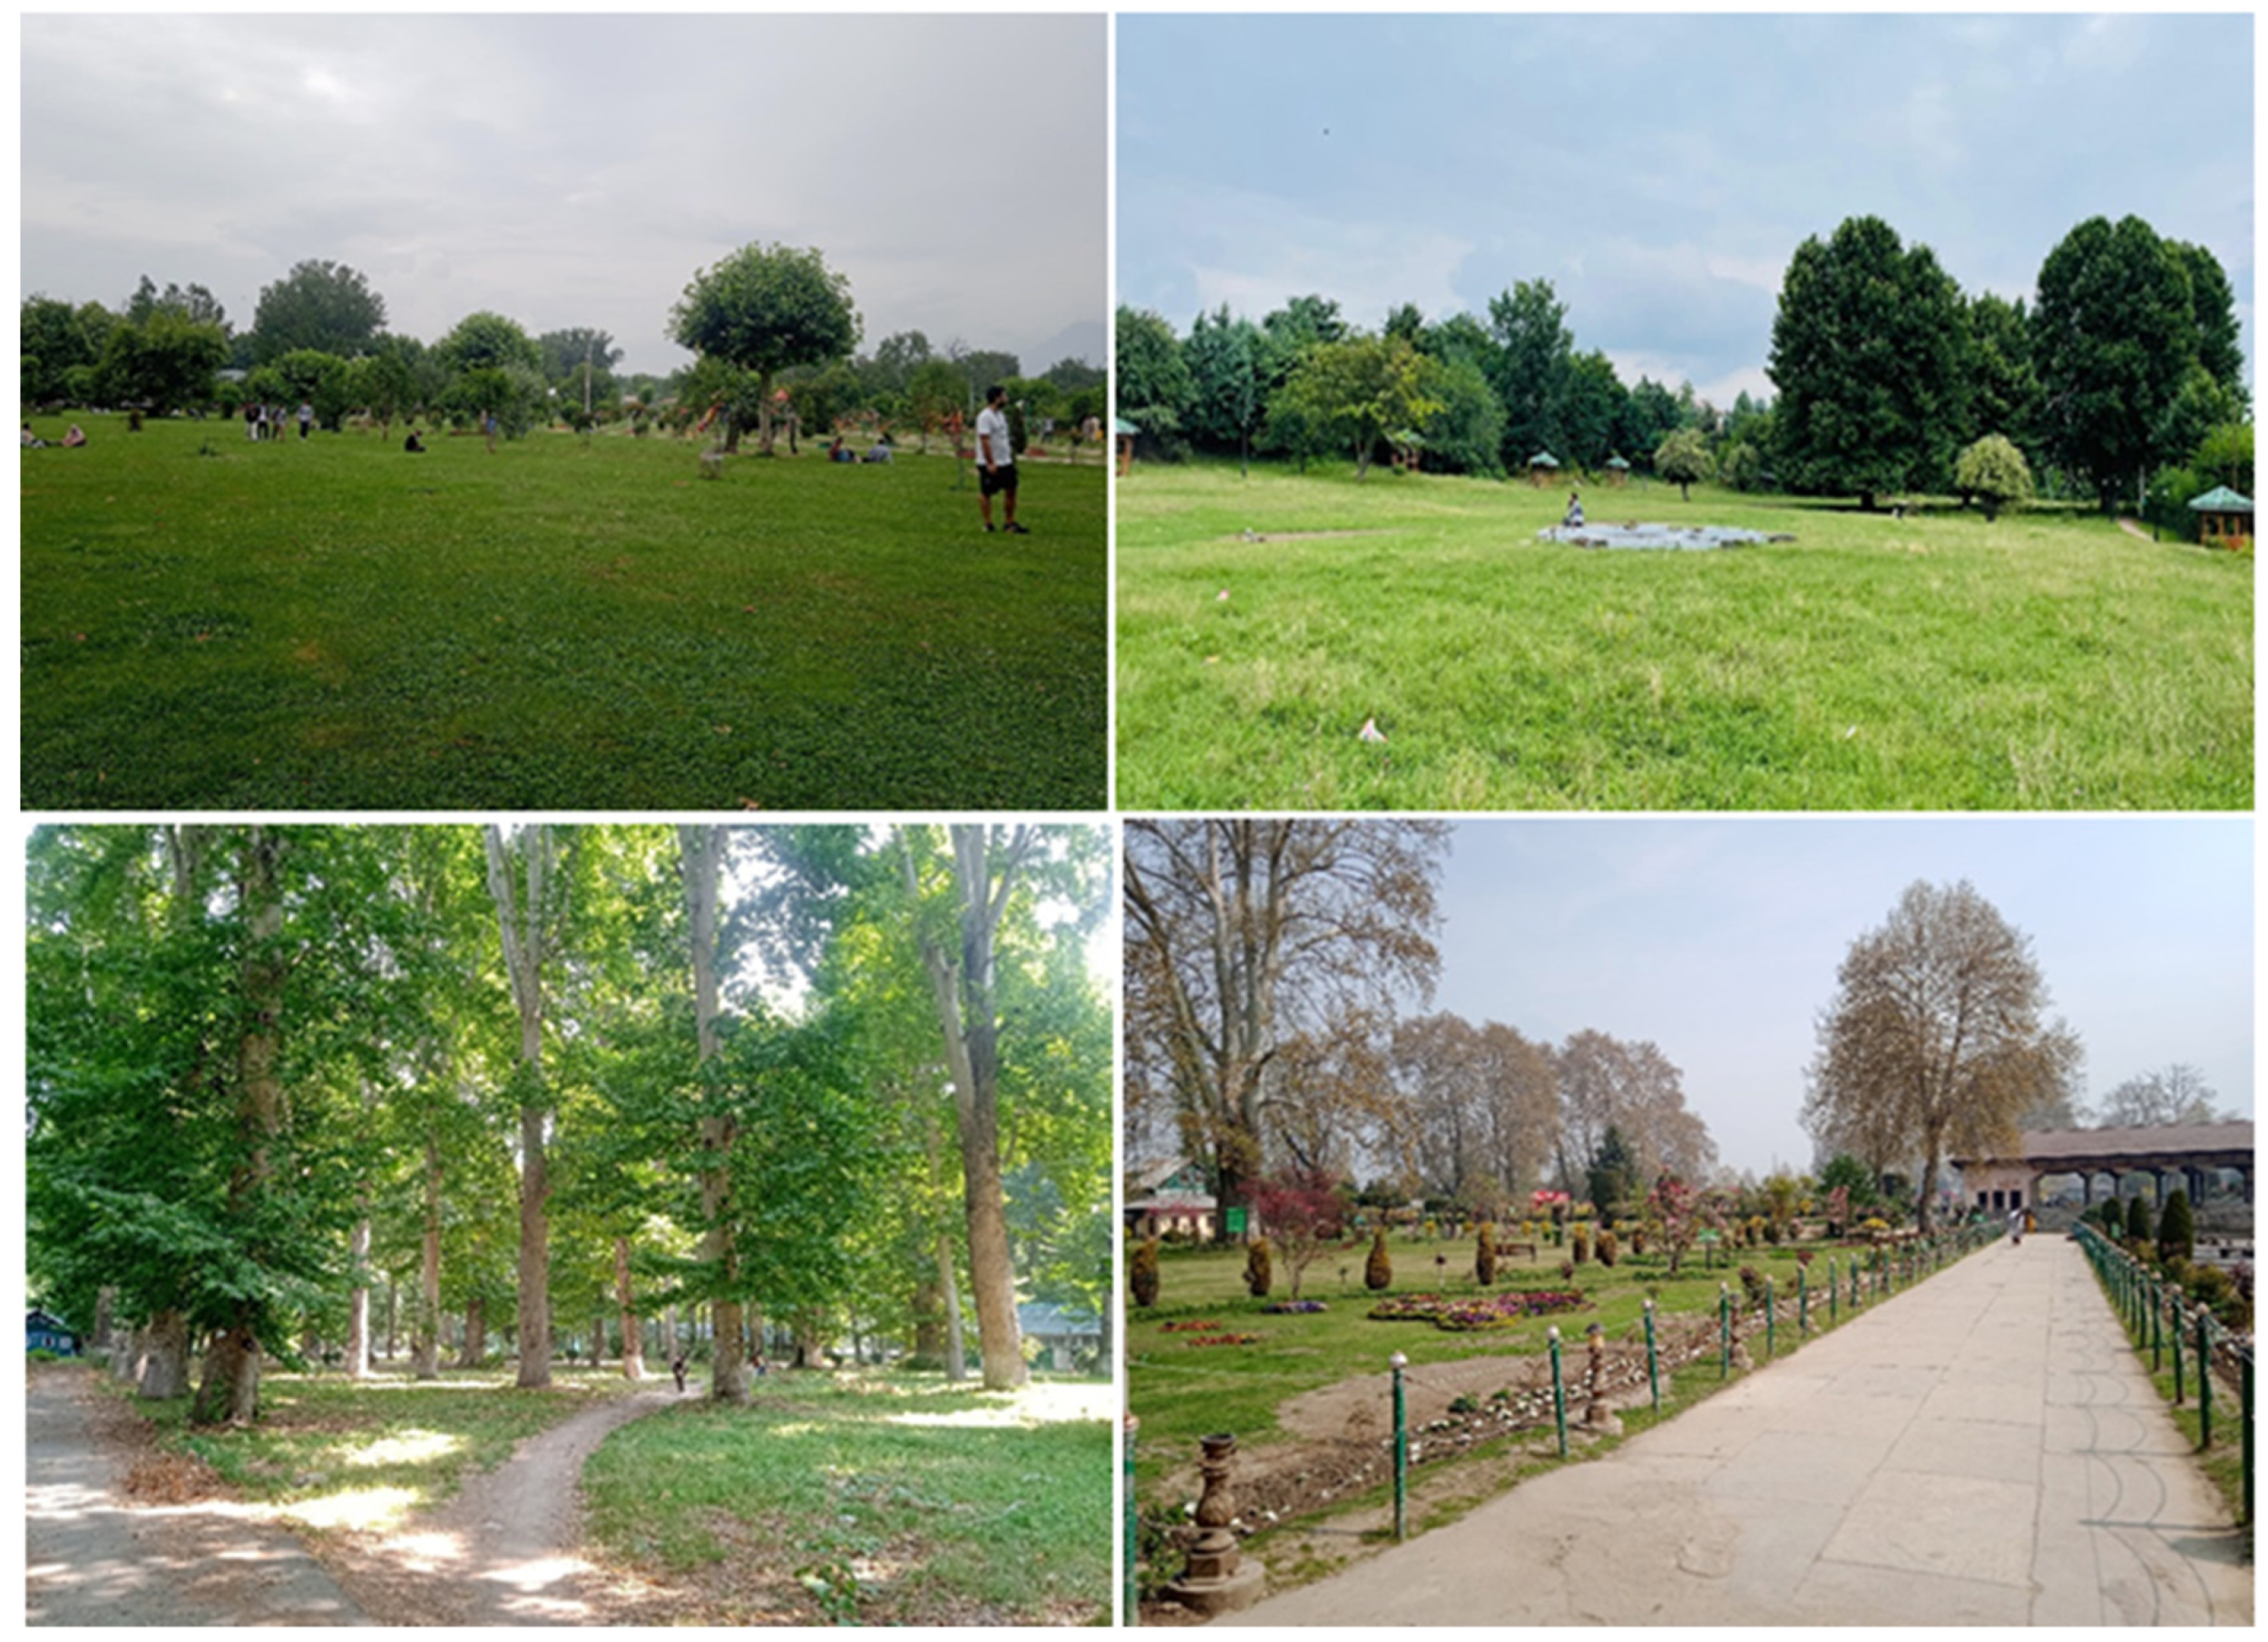
Using a detailed field survey across all 74 administrative wards from January to June 2025, the ground truthing of datasets pertaining to UGS distribution was carried out. The georeferencing via Google Earth Imagery was carried to record, identify and map the UGSs at the lowest possible scale. At each site, we recorded the location (latitude, longitude and altitude), size, overall appearance and presence of public amenities. To understand the usage, accessibility and public perception regarding the ecosystem services, a total of 20 UGSs were selected. The selection criteria included selecting sites that were located both adjacent and away from the city center, the presence and availability of plant vegetation, the presence of public amenities, non-ticketed entry, good public footfall and overall aesthetic appeal (Figure 2). While this selection criteria served the study objective, it did introduce a bias as issues in lower-quality or less-used UGSs were underrepresented. We therefore maintain that the study conclusion should not be generalized for all UGSs across the study area.
Figure 2.
A pictorial representation of a few selected UGSs across Srinagar city.
2.3. Questionnaire Design
A semi-structured questionnaire with four different types of questions, viz. open-ended, closed-ended, rating (Likert) scale and multiple-choice format was used (Appendix A.1). The questionnaire was organized into six thematic sections, including (i) demographic and socio-economic status, (ii) housing and accessibility to UGSs, (iii) usage and visit frequency, (iv) satisfaction with UGS amenities, (v) importance of UGSs as perceived by respondents and (vi) suggestions for the improvement of UGSs.
2.4. Data Collection
The data collection was carried from April to July 2025. Before data collection, we carried a pilot study to pre-test the questionnaire to ensure its clarity, relevance and acceptance. Minor revisions in terms of wording, structure and content were made. The target population was defined as all neighborhood residents of a UGS while sampling unit was defined as any individual from those residents that use a UGS. While this sampling strategy is beneficial as it avoids recording responses from non-users, it did not represent the entire urban population. To facilitate clear communication, the questionnaire was administered through direct interviews and questions were asked in English. To accommodate the respondents with limited English proficiency, we also provided explanations in Urdu and Kashmiri. The respondents were informed about the study purpose and assured of the confidentiality of their responses, and those who voluntarily consented were included in the final survey.
The sampling strategy was based on the assumption that the target population was heterogenous in terms of demographic and socio-economic characters, and therefore a simple random sampling method was used. The survey was collected with 420 respondents who were approached randomly inside the UGSs. To capture heterogeneity, both male and female respondents from diverse age groups were included. Although the total sample size represents only 0.034% of the city population of 1.23 million, it appears adequate for large-scale social research. In fact, for populations exceeding one million, a sample size of 384, which corresponds to about 0.031% of the population, is deemed sufficient, assuming a ±5% margin of error at a 95% confidence level [29]. As the sample size for the present study (n = 420) surpasses the required minimum of 384, it supports data reliability and aligns with standard threshold requirements for large-scale social research. The data was collected across multiple time slots, including morning (7:00–10:00 a.m.), afternoon (12:00–3:00 p.m.) and evening (4:00–8:30 p.m.), throughout the week, including public holidays. This was carried out to capture the variations amongst users.
2.5. Data Processing
To facilitate data analysis using machine learning (the SOM) methods that require a numeric input, a tailored system of scoring was applied to the collected data. It included coding binary variables like gender as 0 or 1 (e.g., 0 = male, 1 = female) and dummy-coding categorical variables like occupation and education to 0 or 1, with each category then treated as a separate binary variable (e.g., if a respondent was a student, the “student” variable received 1, and all others received 0). For open-ended questions like harvesting/collecting anything from UGSs, willingness to pay an entry fee and knowledge about native plants were binary-coded, with “1” indicating yes, i.e., a positive response and “0” indicating no, i.e., a negative response. The monthly income was scaled from 0.2 to 1, with 0.2 assigned to incomes of ≤₹10,000 and 1 assigned to incomes of ≥₹50,000. The satisfaction levels and opinions were assessed using two formats, including a Likert scale scoring from −1 (strongly disagree) to +1 (strongly agree), which allowed for attitudinal directionality, and a three-category ordinal scale (“Agree,” “Disagree,” or “Not sure”). Although some questions included Likert-type scales suitable for reliability testing, the majority of questions addressed diverse and independent constructs, such as demographic characteristics, occupation and income.
To better understand the patterns in perceptions, the SOM and NMDS was used to detect associations and clusters within responses [30,31]. As internal consistency measures like Cronbach’s alpha assume uni-dimensionality didn’t hold for our overall questionnaire, it was not used [32]. Multicollinearity diagnostics like variance inflation factors were also not calculated because each question was treated as an independent variable [33]. Moreover, as our study primarily focused on understanding associations between individual variables and response patterns, we took the instances of collinearity as meaningful results [34] and retained all variables to preserve data diversity [35,36]. To better facilitate the application of machine learning and ordination algorithms, we pre-processed data as per Ha et al. [37], which involved addressing right skewness and reducing the impact of outliers, as well as subjecting continuous variables to natural logarithmic and square root transformations. All variables were then normalized and scaled to a common range of 0 to 1 [38].
2.6. Data Analysis
The data was analyzed using an SOM and NMDS. SOMs identify patterns by uncovering the latent structures without relying on any assumptions [39,40]. SOM analyses were conducted using SOM Toolbox (v2.0 beta) in MATLAB R2024a (MathWorks, Inc., Natick, MA, USA). The lattice size selection was guided by heuristic 5 × √n, where n is the sample size (420 respondents). Multiple node configurations were tested to identify optimal SOM structure, using quantization error (QE) and topographic error (TE) as key performance metrics for model evaluation [41]. For training, a Gaussian neighborhood function was used to iteratively update node weights based on their Euclidean distance from input vectors. During it, the nodes compete to represent each data point, with the winning node and its neighbors updated accordingly. To account for the stochastic variability, the process was repeated 100 times using different random initializations, and the SOM model with the lowest combined QE and TE values was finally selected as the optimal model [42,43].
The clusters were derived from a trained SOM using a k-means algorithm [44], with their optimal number determined using the “kmeans_clusters” function, which evaluates clustering error and internal validation metrics, including the Davies–Bouldin index (DBI). The cluster interpretation was supported by unified distance matrices, or U-matrices, which visualize topological distances between the nodes and identifies cluster boundaries; component planes, which depict the distributions of individual variables across the node; and hit maps, which show the densities and distributions of respondents. To identify how different variables relate to identified clusters, NMDS analysis of SOM weight values was conducted. For the NMDS analysis, no additional scaling or normalization was needed, as SOM weight values are inherently constrained to a 0–1 range. The SOM-derived cluster labels helped us to interpret relationships between clusters and key explanatory variables in the ordination space. The reliability of NMDS ordination was assessed using the Shepard stress plot, which compares observed dissimilarities with ordination distances. To minimize the risk of overfitting, the “metaMDS ()” function of R package vegan, which applies multiple random starts and data standardization to avoid local minima and reduce outlier influence, was used. The ellipses in the NMDS were also generated from R package vegan using ggplot2. The 3D stress value (0.09) exhibited good representation of the data in three dimensions, while the 2D stress value (0.21) indicated a moderate fit [45]. For ease of visual interpretation, the 2D ordination plot is shown. An “envfit” function with 999 permutations was used to assess the significance of variable associations, retaining only those with p-values below 0.05 and r2 above 0.46, in order to ensure that only meaningful gradients were included in the final interpretation [46]. To further evaluate differences between attitude-based clusters, we applied ANOSIM and PERMANOVA, using 999 permutations and treating “Cluster” as a grouping variable. ANOSIM evaluates dissimilarities between groups based on internal versus between-group dissimilarities, with high, statistically significant clusters derived from SOM weights. Variables were considered primary contributors based on their average contribution to overall dissimilarity (≥1.5%) and statistical relevance (p ≤ 0.05). Following ANOSIM, we used similarity percentages (SIMPER) to identify which variables/factors contributed most to differences in clusters.
3. Results
3.1. Distribution and Characteristics of UGSs
A total of 237 UGSs, totaling 268.43 hectares (ha), with variations in size, from small neighborhood parks to expansive recreational UGSs, were documented and mapped during the study. The large UGSs are ticketed and tourist-oriented, while the majority of UGSs are small, with an average size of 1.13 ha, and serve locals. Spatially, UGSs are largely distributed in central and northern areas, while the southern and peripheral areas have fewer UGSs, with as many as 19 municipal wards devoid of any designated UGS. The Urban green space Index (GSI), denoting the area of green space available per 1000 people, is 0.22 ha, which points to the overall scarcity of UGSs.
3.2. Demographic and Socio-Economic Characteristics
A male bias in the survey sample was recorded, with 277 respondents (66%) being male and 143 (34%) being female (Table 1). Most respondents were young, with 52.8% (n = 222) aged between 18 and 35 and only about 10.23% (n = 43) aged above 60. The respondents were well educated, with about 31.19% (n = 131) being graduates, while 20.95% had no formal education. In total, 30.24% (n = 127) respondents were employed in either a private (17.14%; n = 72) or government sector (13.10%, n = 55), while only about 0.47% (n = 2) were farmers. Of all the respondents who were employed, 20.4% (n = 86) earned between ₹10,000 and ₹30,000 monthly and only 13.1% (n = 55) earned above ₹50,000.
Table 1.
Demographic profile of the respondents.
3.3. Patterns of Usage and Ecosystem Service Perception Through SOM Analysis
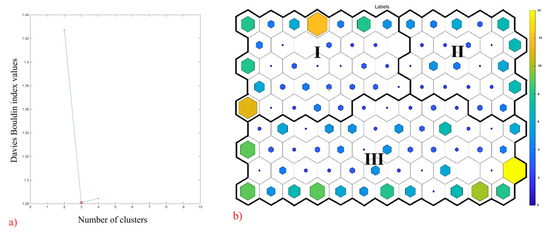
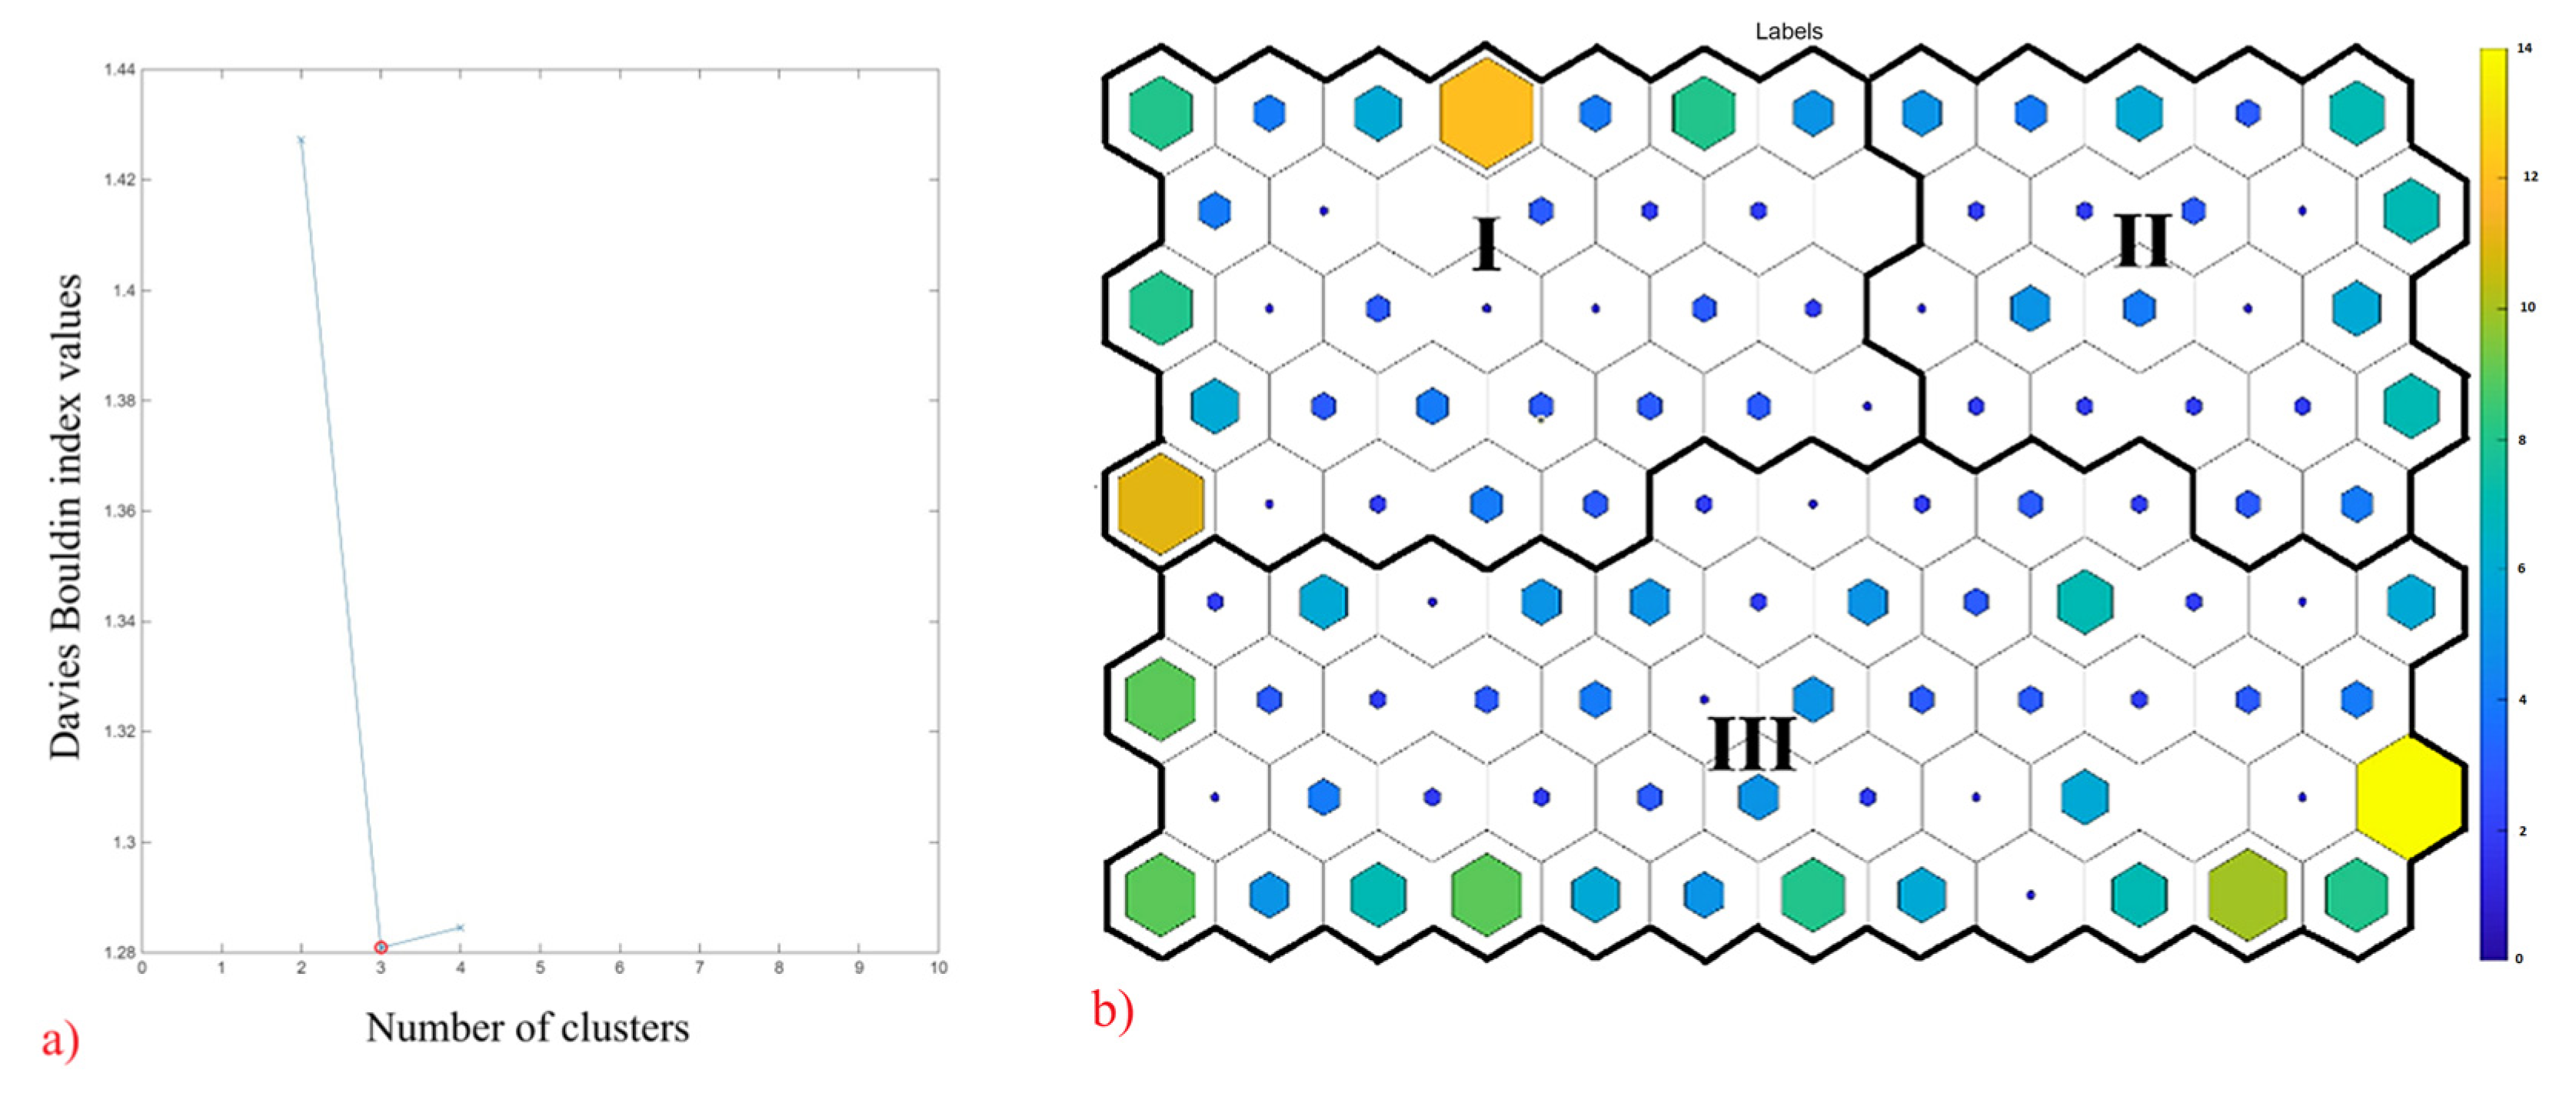
Among the tested Self-Organizing Map (SOM) configurations, a 9 × 12 hexagonal node grid was identified as the optimal configuration. The quantization error and topographic error for this configuration were low, viz. 3.346 and 0.012, respectively, which exhibit high representational accuracy besides preserving the topological structure of the dataset. The SOM output revealed three distinct clusters (Figure 3), with Cluster I representing 33 nodes, Cluster II representing 22 nodes and Cluster III representing 53 nodes (Table 2). The SOM variable interpretation consisted of 104 component planes (Supplementary Figure S1).
Figure 3.
Results of the SOM analysis: (a) Davies–Bouldin index values, with the red circle indicating the optimal number of clusters (three); (b) the three identified clusters, labelled with Roman numerals, on the SOM. Each hexagon represents a node, with the color (color bar) and dot size reflecting the number of responses: more fully filled hexagons represent a higher number of responses, while less filled hexagons represent a lower number.
Table 2.
Summaries of three clusters based on socio-demographics, access, and attitudes toward Urban green spaces at Srinagar, Jammu and Kashmir.
Cluster I: This cluster is characterized by young students who pursue postgraduate studies, live at distances typically exceeding 2 km from a UGS, and use private or public transit to reach any UGS. The visitation frequency of this cluster is high, with a preference for afternoon visits with peers. The members prioritize solitary restoration over active socialization. Their perception of ecosystem services is profound, and they identify UGSs as critical for urban heat island mitigation and psychological restoration, citing benefits such as stress reduction and emotional well-being. While satisfied with infrastructural management, these members demand increased UGS density within their communities.
Cluster II: This cluster comprises a diverse group with individuals who have no formal education as well as graduates. It contains more older adults, housewives and self-employed individuals who live within 500 m of a UGS. The members of this group utilize UGSs both during the morning and evening hours for physical activity, child supervision and communication with family and neighbors. While these members acknowledge its benefits, specifically regarding noise attenuation and air quality improvement, their satisfaction levels are mixed. They appreciate the recreational facilities but express concern regarding security, maintenance and a lack of native biodiversity. They perceive more socio-spatial inequality, with respondents noting a disparity in UGS quality between high-income and low-income neighborhoods.
Cluster III: This cluster primarily consists of middle-aged government employees and farmers/laborers. Living at moderate distances from UGSs, these members maintain a consistent visitation frequency of approximately three visits per week. Their engagement is characterized by an aesthetic and utilitarian appreciation of UGSs, and they emphasize economic value of UGSs, specifically regarding resource harvesting and livelihood support, rather than its recreational, cultural and psychological benefits. While they express satisfaction with the proximity of UGSs, they are dissatisfied with the amount of available water infrastructure.
3.4. Visualization of Patterns Through NMDS Ordination
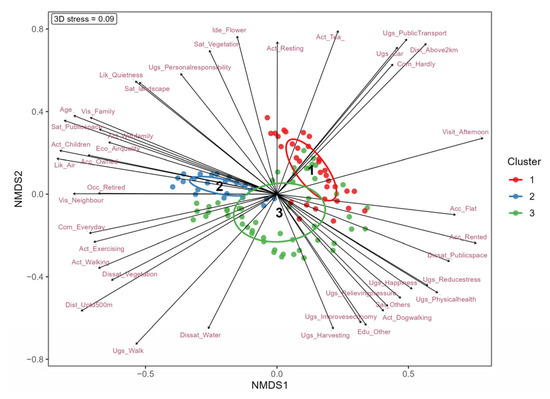
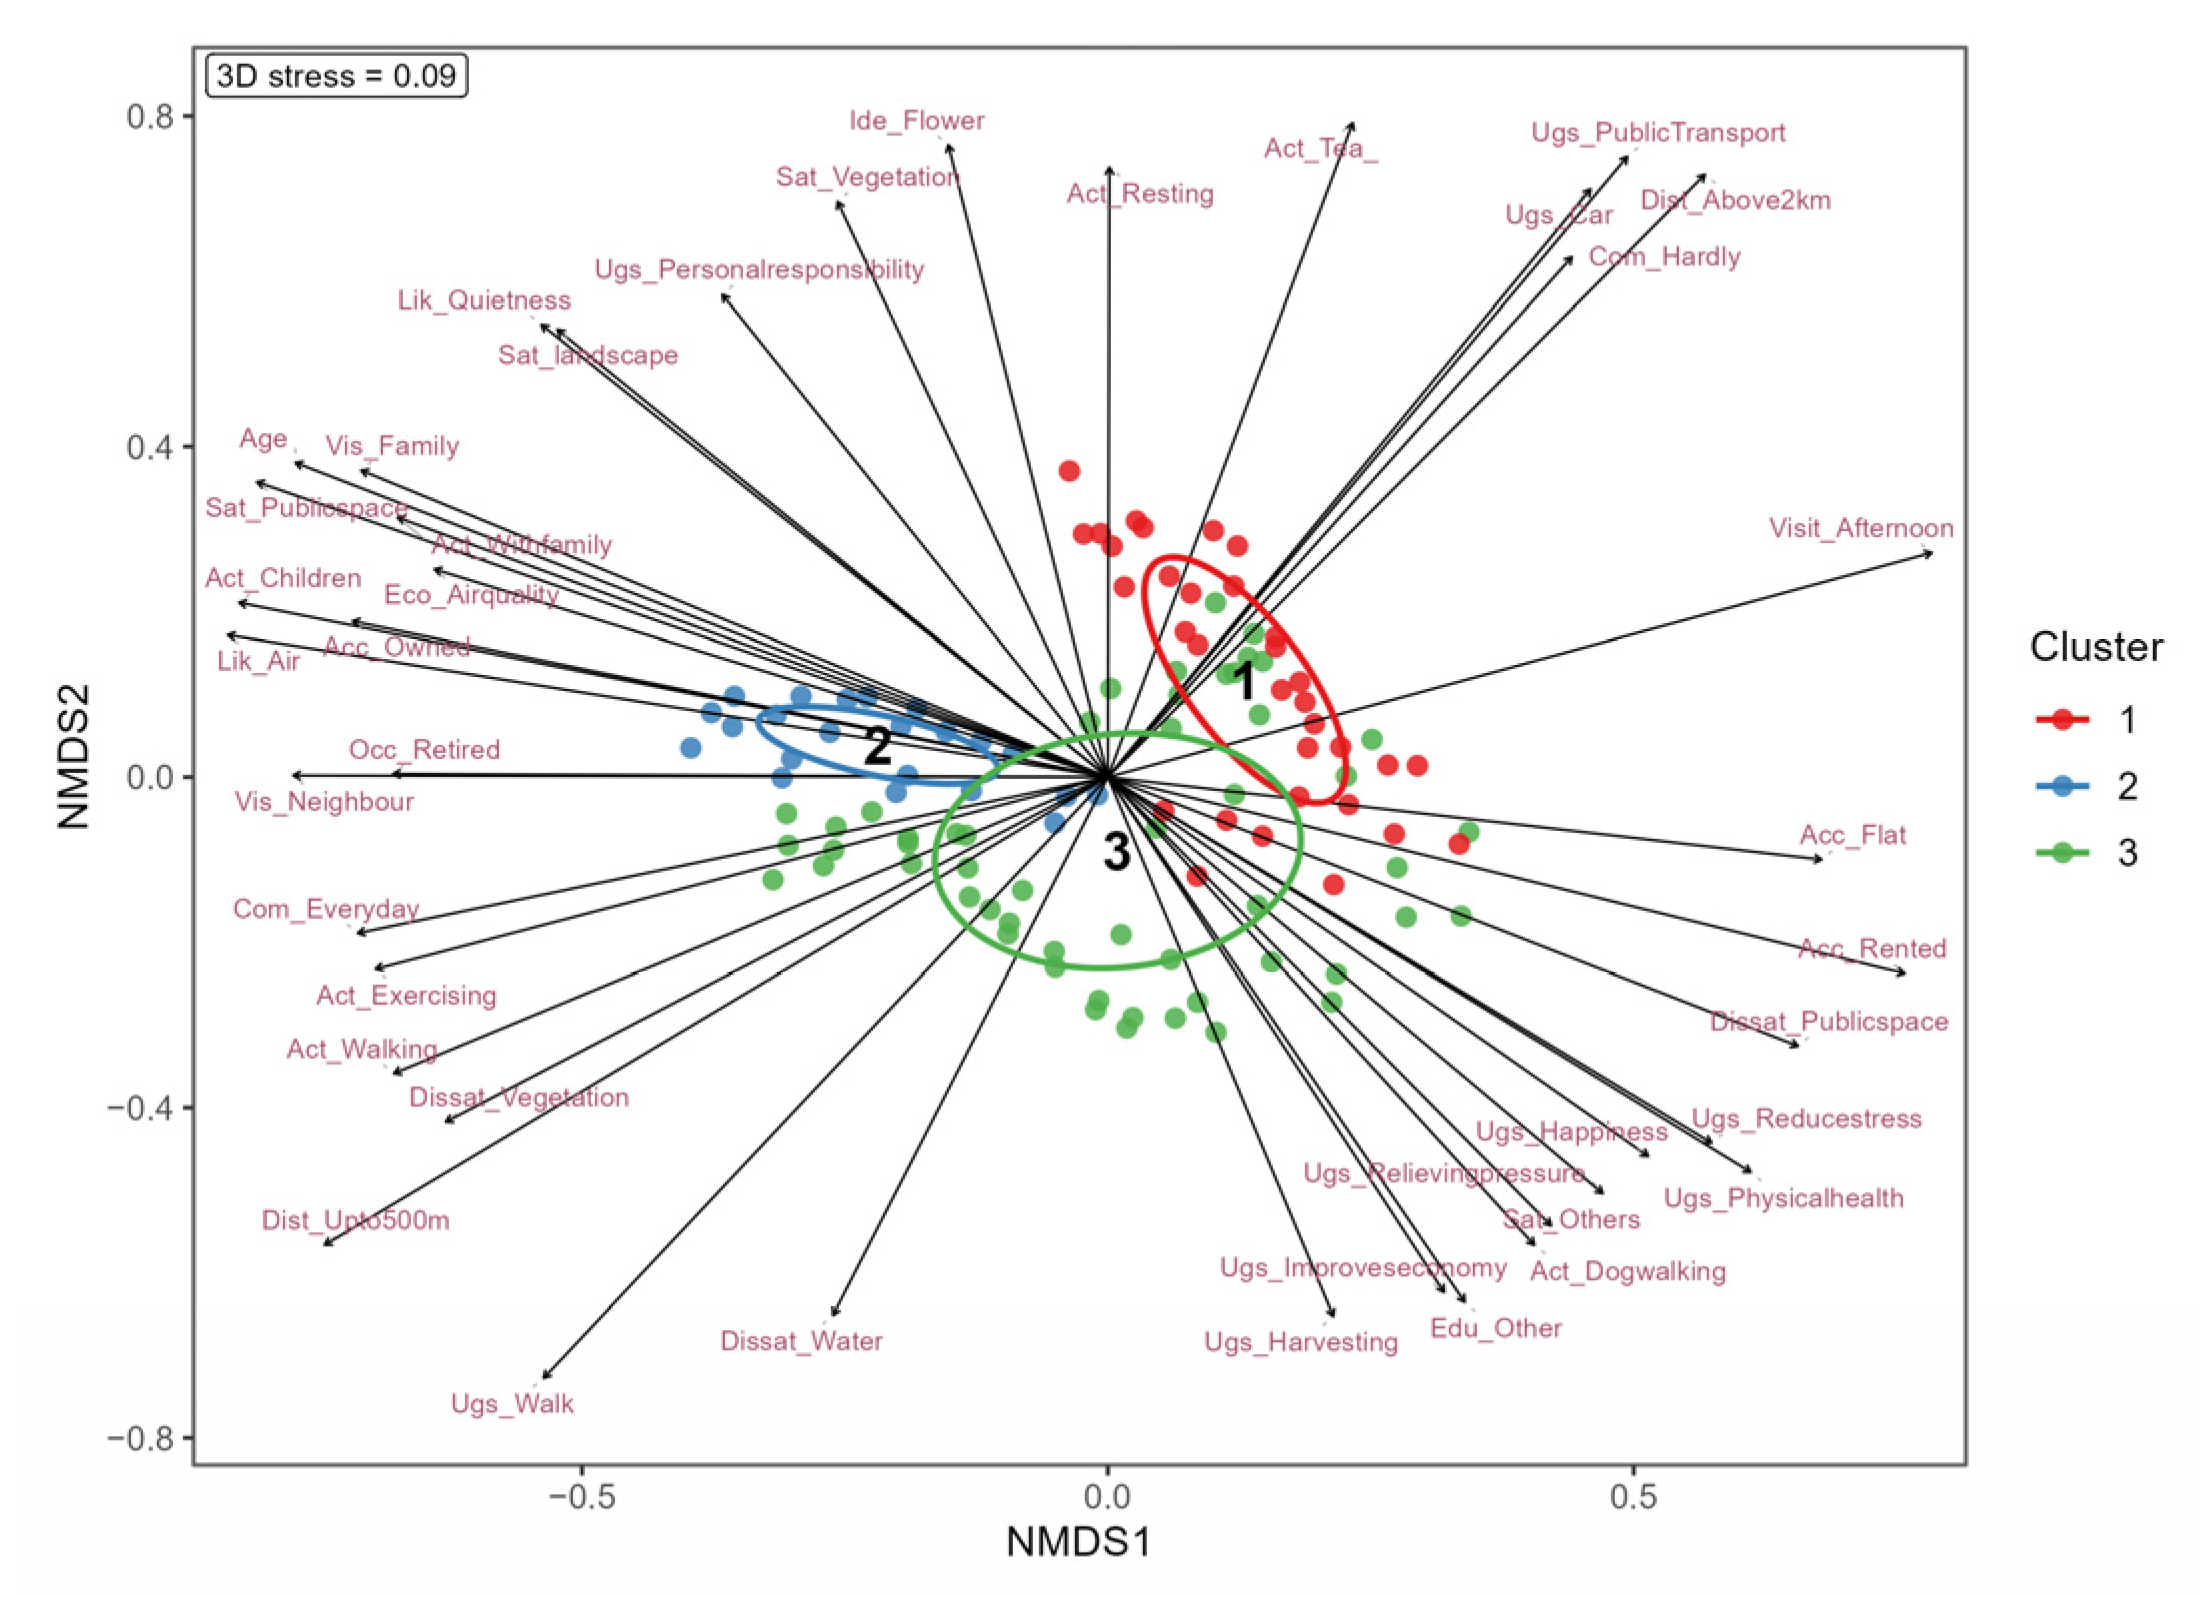
With a stress value of 0.09, the NMDS ordination (Figure 4) indicated a good fit and exhibited a clear spatial segregation of three clusters. The orientation and magnitude of significant vectors confirm that stakeholder relationships are systematically structured by a gradient of accessibility, use patterns and varying ecosystem service perceptions (Figure 4).
Figure 4.
NMDS plot illustrating the relationship between clusters (represented by ellipses) and associated variables along NMDS1 and NMDS2 axes.
Along the positive side of NMDS1, Cluster I indicated a strong correlation with motorized transport, visitation frequency and perceived benefits such as stress relief and health restoration. Conversely, Cluster 2 ordinated along the negative side and reflected a correlation with UGS proximity, active transit and daily routines like exercise and social interaction, alongside a high awareness of regulating services like air quality and noise reduction. In contrast, cluster 3 exhibited greater dispersion along NMDS2 and suggested a more heterogeneous and utilitarian relationship characterized by an emphasis on provisioning services like resource harvesting and economic utility, as well as by dissatisfaction with infrastructural quality.
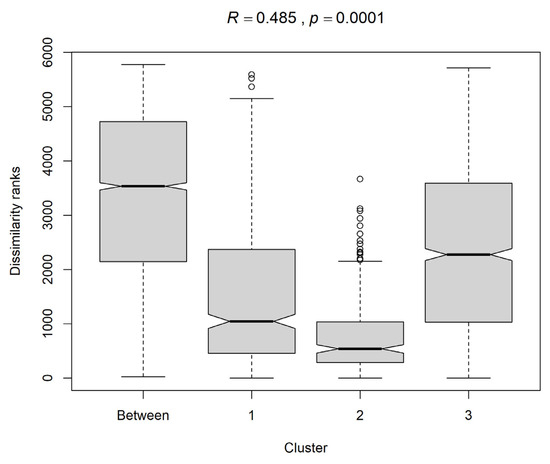
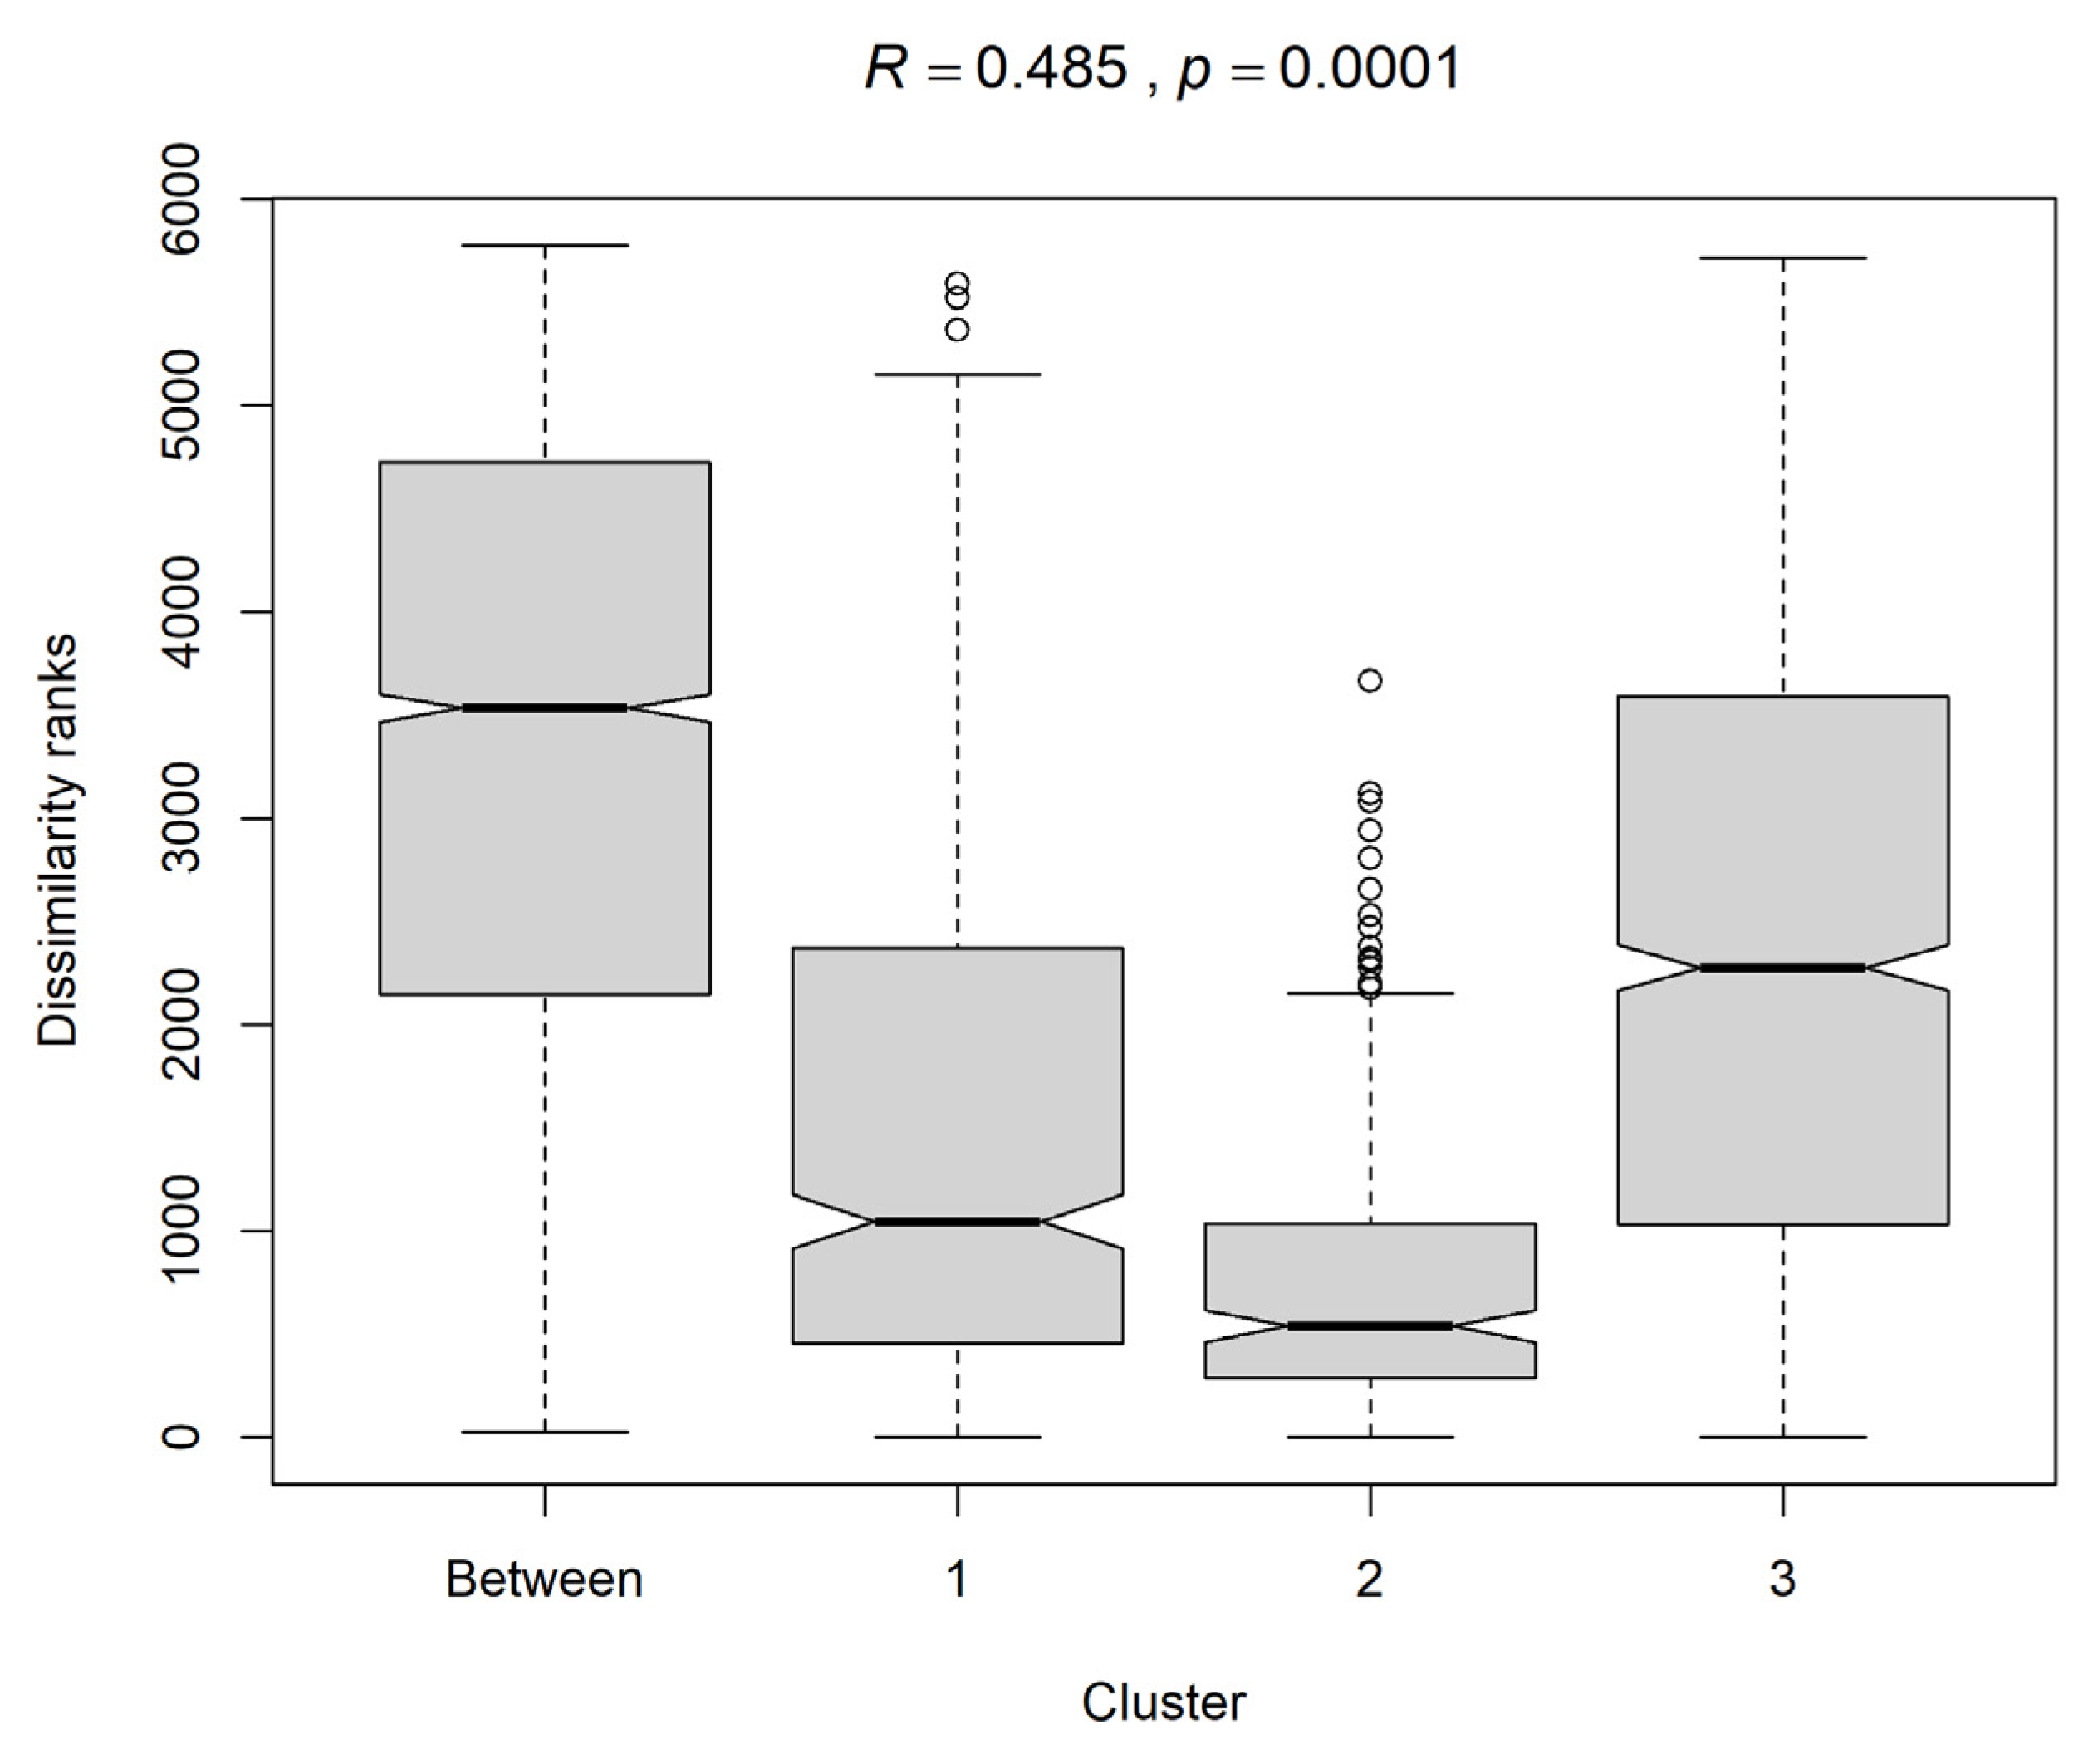
The reliability of NMDS ordination, assessed using the Shepard stress plot, depicted a high non-metric fit (R2 = 0.992) and a strong linear fit (R2 = 0.934), confirming that ordination accurately preserves the rank-order relationships among samples. The Analysis of Similarities (ANOSIM) (Figure 5) exhibited a statistically significant partition among identified clusters (Global R = 0.485, p < 0.0001), supporting the distinctiveness of the identified groups. The PERMANOVA (pseudo-F = 20.80, p < 0.001) also identified significant dissimilarities among clusters, confirming robust group separation.
Figure 5.
ANOSIM boxplot showing between- and within-cluster dissimilarities based on SOM-derived clusters. The analysis indicates significant differences among clusters (R = 0.485, p < 0.01).
3.5. Variation in Patterns Through SIMPER Analysis
The SIMPER analysis helped identify which variables contributed most to cluster differences. Cluster I is characterized by a strong student presence (Occ_Student, ava = 0.37), high education levels (Edu_PostGraduate, ava = 0.20), a higher proportion of long-distance visitors and reliance on public transit, with Dist_Above2km (ava = 0.68) and Ugs_Public Transport (ava = 0.50) serving as primary distinguishing factors (p < 0.001). These variables differentiate it from Cluster III and II, in which these variables contribute substantially less (avb = 0.14 and 0.02; and 0.12 and 0.03 respectively).
Cluster II is characterized by its close residential proximity to UGSs, as reflected by the dominant contribution of individuals living within 500 m of a UGS (Dist_Upto500m, avb = 0.90) and those who access UGSs by walking (Ugs_Walk, avb = 0.91). It reflects a more deeply embedded community identity and is characterized by daily usage (Com_Everyday, avb = 0.59) and active physical engagement, such as exercising (avb = 0.45) and walking (avb = 0.83). The cluster exhibits a robust commitment to space, as reflected by a higher contribution from daily visitors (Com_Everyday, avb = 0.59).
Cluster III is primarily defined by its passive nature and is distinguished from Cluster II by its significantly lower visit duration (Visit_Duration, ava = 0.33 vs. avb = 2.26; p < 0.001). It is characterized by a higher proportion of individuals with a distinct perception that UGSs are primarily for the wealthy (Ugs_Richpeople, ava = 0.36), though this value is notably lower than that of Cluster II (avb = 0.89). This cluster features a unique demographic presence that includes farmers and laborers (Occ_Farmer, p < 0.001), setting it apart from the more urban-centric profiles of other groups and indicating a specialized or occasional user subset.
4. Discussion
4.1. Urban Green Space Provision and Planning
The documentation and mapping of 237 urban green spaces (UGSs) across the Srinagar city fits with the recommendations of the National Institution for Transforming India (NITI) Ayog Report on Urban Planning Capacity in India, which supports the mapping of blue–green–grey infrastructure (including rivers, waterbodies, forests, parks, sanitation, water supply, solid waste management, etc.) in cities [47]. Although the presence of 237 urban green spaces is suggestive of the richness of green infrastructure, the distribution of these UGSs is highly uneven. This therefore suggests that urban greening initiatives may inadvertently reinforce socio-economic disparities [48,49]. The per-capita availability of UGSs is also low, with only 0.22 ha per 1000 people. It is presumably because our study considered only parks and gardens and excluded other Urban green space elements such as urban forests, riverbank vegetation and playgrounds, road verges, derelict land and informal green forests. However even accounting for omissions, the availability appears low and well below the established standards, such as the World Health Organization recommended 9 m2 of accessible, safe and functional Urban green space per person [50,51].
The identification of 36 UGSs for which administrative records were either absent or hard to find highlights the limitations of existing inventories. The absence of UGSs from official databases, as reported elsewhere from India, for instance Kumar and Rajak [52] for Patna, Bihar reflects a broader need to recognize and integrate informal UGSs into city-level planning. This is particularly important for the Srinagar city, where most documented UGSs (n = 123) are smaller (<0.1 ha). These smaller UGSs broadly termed as pocket parks, have similar ability to stimulate physical health and mental restoration and enhance psychological well-being, as do large community green spaces [53]. For a region like Srinagar city (Kashmir) where mental distress, anxiety and depression are widespread among both children and young adults [54,55], maintaining and improving smaller UGSs is hugely vital.
4.2. Age and Gender Patterns in Green Space Use
With the majority of respondents aged below 35 years, our results indicate a higher possibility of younger residents engaging in Urban green space usage. Although consistent with observations that young people are active users of recreational UGSs [56], the under-representation of older people points to a probable sampling gap, as senior citizens (>75 years) in urban settings are often highly dependent on local green spaces for walking, socializing and stress relief [57]. However, the participation of women in the present study was low, probably due to social and cultural constraints.
4.3. SOM Analysis, NMDS Ordination and SIMPER Analysis
Our results identified three different clusters for Urban green space usage and ecosystem service perceptions primarily driven by factors like education, Urban green space proximity and visitation frequency. Using techniques like SOM and NMDS helped us to understand these clusters better, uncover complex ecosystem service perceptions and understand both the dominant and minority perspective. The SIMPER analysis identified variables that contributed most to the difference between identified clusters (Appendix A.2). The identification of three different clusters, for the present study, agrees with previous research that argues that Urban green space utilization is non-uniform and varies according to user profiles and perceived benefits [58]. Our results showed that members in Cluster I are mostly postgraduate students who use the public transport and travel long (>2 kms). It contradicts previous observations that ranks proximity and access as strong predictors of park visitation [59]. In fact, the visitation frequency of this cluster, particularly during afternoons remained high. While earlier studies, attributing this behavior to work-day schedules have reported similar preferential visitation patterns [60], our analysis for a mountainous city-Srinagar, specifically identified the members.
The perception of ecosystem services of Cluster I was profound and they identified UGSs as critical for climate regulation, stress reduction and emotional well-being. These members reflected an attitude that a high personal responsibility is necessary to promote environmental stewardship (Table 2). The recognition of ecosystem services of Urban green spaces mirrors global research that links exposure to urban greenery with improved microclimate, cleaner air and lower perceived noise [61]. For Cluster I, this perspective is likely associated with their higher education levels. Similar patterns of higher education levels and actively correlating nature with stronger pro-environmental attitudes and acceptance of UGS services have been recorded elsewhere [62,63]. This group seems to have a deeper attachment with UGSs (reflected in their investing more time and resource to visit a UGS) that helps to notice nature more keenly [64] and promote nature connectedness.
The individuals in Cluster II living close to a UGS are aged adults, including housewives who visit UGSs for physical activity and social reproduction like child supervision and communication with family and neighbors. The usage of neighborhood UGSs as places for community gathering are widely available [7,58], with social interactions, either verbal or non-verbal reported to foster social bonding and community interaction. The members of this cluster exhibit a neutral stance toward UGS service perception (Table 2), suggesting that proximity and frequency of usage alone does not guarantees acknowledgement of ecosystem services. While we find that ecosystem services of UGSs have long been identified [65], the importance of factor like proximity and usage frequency has not been detailed enough. Thus, understanding and utilizing these factors can play a critical role in reconnecting our cities to biosphere and reducing ecological footprint.
For present study, the lesser recognition of UGS services by Cluster II was presumably because either ecosystem services were not strong enough to shape the perception of respondents or many members had a higher perception of socio-spatial UGS inequality. These members consistently highlighted disparities in UGS quality, observing that high-income neighborhoods benefit from better-managed, aesthetically superior and more secure UGSs compared to low-income areas. The disparity in UGS occurrence, termed as “green inequity,” wherein higher-income communities often have higher proximity of UGSs is widespread across Indian cities [11] and aligns with observations that green infrastructure often follows the path of wealth [48]. At Srinagar city, as investment is directed more towards maintaining large UGSs as destinations that act as prime tourist destinations [66], smaller UGSs at community neighborhoods suffer from neglect and infrastructural decline. This quality gap explains why Cluster II members, despite living in close proximity to a UGS, are dissatisfied with security and maintenance. Thus, it follows that at Srinagar city, geographic access is being undermined, mirroring observations by Kleinschroth et al. [67], who argue that uneven distribution of high-quality maintenance reinforces socio-economic marginalization. While many previous studies across the study area have documented this socio-economic inequality, in terms of the provision of urban amenities [68], healthcare institutions and ration depots [69] and environmental variables [70], this study specifically highlights it for its urban green spaces.
Cluster III represents a diverse and notable group, with many members enjoying economic stability (government employees) and others having daily wage jobs (farmers and laborers). Living at a moderate proximity from UGSs, this cluster has the lowest visitation frequency; its members exhibit aesthetic and utilitarian appreciation and perceive UGSs as provisioning resources that are vital for promoting local business. This perspective reflects an often-overlooked role of provisioning ecosystem services, particularly in Global South cities [71] where UGSs are vital for urban dwellers for ecological resilience as well as economic safety [72]. While this perspective is in agreement with observations that farmers/laborer’s attribute slightly lower importance to ecosystem services except for provisioning services [73], it contradicts studies that argue for the prioritization of community cohesion over economic outcomes [56,74].
One likely reason for this perspective, at least for members who enjoy economic stability, is the absence of experiential and more frequent engagement with urban green spaces, which otherwise could have enhanced their emotional attachment and fostered a more ecosystem-oriented perspective vis-à-vis urban green spaces. The members of Cluster III were satisfied with landscaping and plant biodiversity but not cleanliness and security (Table 3). In agreement with earlier arguments that experience of UGSs is shaped jointly by ecological quality and functional space for recreation [75,76], our results reinforce the vitality of greenness and usable space and suggest that the holistic environment matters more than any individual element.
Table 3.
A summary of urban planning intervention measures recommended for the proper usage of the urban green spaces in Srinagar, Jammu and Kashmir.
Notwithstanding the differing perspectives, the inclusion of Cluster III, though smaller, ensured that the perceptions captured reflect a range of experiences across social strata. While the detection of this smaller group reflects the capability of SOM analysis to preserve minute patterns within high-dimensional datasets [77], it helped us to include minor perspectives in analysis and understand them better. The NMDS also aided us in visually representing these relationships in reduced two-dimensional space [78] and conceptualizing complex multi-variable associations easily. While such multivariate frameworks are increasingly used in global urban ecology [79], their adoption within the Himalayan urban planning context remains nascent. The present study thus represents an advancement of the methodological approach to aid planners in Himalayan Mountain Cities.
4.4. Suggestions and Recommendations
The present study underscores the need for an integrated UGS policy that balances tourism-oriented heritage gardens with community-level UGSs. The key interventions needed to align the existing UGSs with global urban sustainability agendas, including The UN Sustainable Development Goals (SDG 11: Sustainable Cities and Communities), may include tailoring interventions to specific cluster needs (Table 3).
However, beyond these accessibility considerations, the findings have important implications for UGS governance and policy formulation across the Himalayan region in general and in Srinagar city in particular. There is an urgent need to incorporate user-specific priorities into planning and management processes. Policy interventions such as reducing UGS inequality, greater investment towards smaller UGSs and facilitating their integration into urban health planning and nature-based solutions and interventions like promoting awareness and urban outreach may enhance the long-term sustainability of UGSs.
4.5. Limitations
While this study represents the first comprehensive endeavor to document and map urban green spaces across Srinagar city and provides detailed insights into understanding user perceptions, it had some limitations. To begin with, the sample size (n = 420) was not sufficient; although it appears methodologically sound [29], the generalization of results on a regional level demands carefulness. Moreover, as our sampling strategy was focused on UGS users and does not represent entire population, it further limits the applicability of the findings. Third, higher reliance on relatively open UGSs meant that smaller UGSs like roadside plantations and spaces which require an entry fee were excluded. Moreover, the existing criteria introduced a bias by selecting only favored non-ticketing locations. While this also may not have affected our principal findings, it may enhance the diversity of perspectives. Fourth, as we normalized and log-scaled variables for SOM and NMDS clustering to exhibit patterns across data [37,38], it decreased the instinctive interpretability of variables, particularly income levels. Fifth, the assessment of public amenities, maintenance and infrastructure available at the UGSs was based on one-time field observation. Thus, addressing these limitations will be highly vital to reduce bias and provide more detailed insights into the usage pattern of urban green spaces across the region.
5. Conclusions
This study documented and mapped urban green spaces across Srinagar city and examined how people from diverse socio-economic backgrounds use and perceive various UGS services and functions. The results demonstrated key characteristics including uneven distribution and smaller sizes of urban green spaces and highlighted the socio-spatial inequities of the region. Using advanced analytical tools such as SOM, NMDS, ANOSIM, PERMANOVA and SIMPER analysis, three distinct clusters for urban green space usage and ecosystem service perceptions primarily driven by factors like education, proximity to an urban green space and visitation frequency were identified. While students living at longer distances identified Urban green spaces as vital for psychological restoration, citing benefits for stress reduction and emotional well-being, people who live close to an urban green space and visited frequently specifically mentioned urban green spaces as vital for noise attenuation and air quality improvement. More socio-spatial inequality was perceived by these members. Notably, individuals with economic stability (government employees), as well as farmers and laborers, presented an aesthetic and utilitarian appreciation of UGSs and emphasize their economic significance. With growing population and developmental rapidity expected to increase demand for and use of a city’s urban green space, understanding and responding to diverse perspectives can help future practitioners to coordinate inclusive urban planning.
Supplementary Materials
The following supporting information can be downloaded at https://www.mdpi.com/article/10.3390/rsee3040016/s1: Figure S1. Component planes generated by the self-organizing map that illustrate patterns in the data. In each component plane, yellow indicates the highest value and blue the lowest. The varying color shades provide a visual representation of the respondent distribution across different nodes, allowing for the identification of trends and relationships within the dataset. However, as the number of components was over 100, our data showed complex patterns.
Author Contributions
Conceptualization, J.M.D.; methodology, J.M.D., T.N. and N.S.; validation, J.M.D.; formal analysis, J.M.D., T.N. and N.S.; investigation, T.N. and N.S.; curation, Javaid M. Dad; writing—J.M.D.; writing—review and editing, J.M.D., T.N. and N.S.; visualization, J.M.D.; supervision, J.M.D.; project administration, J.M.D. All authors have read and agreed to the published version of the manuscript.
Funding
This research received no external funding.
Institutional Review Board Statement
Not applicable.
Informed Consent Statement
Informed consent was obtained from all subjects involved in the study.
Data Availability Statement
The data generated during the study, supporting the reported results, can be made available upon request.
Acknowledgments
The authors are grateful to the people who took part in the survey. The support received from The Head, Department of Environmental Science, University of Kashmir, is appreciated. The authors also acknowledge Shahab Ud Din, Department of Animal Science and Biotechnology, Kyungpook National University, South Korea, for his help and encouragement throughout the study.
Conflicts of Interest
The authors declare no conflicts of interest.
Abbreviations
The following abbreviations are used in this manuscript:
| NMDS | Non-Metric Dimensional Scaling |
| UGSs | Urban green spaces |
| SOM | Self-Organizing Maps |
Appendix A
Appendix A.1. Questionnaire
- 1.
- Name of the respondent (optional) _________________________
- 2.
- Age: Under 18 (), 18–25 (), 26–35 () 36–45 (), 46–60 (), Above 60 ()
- 3.
- Gender: Male (), Female () Other ()
- 4.
- Locality/Area of residence: _________________________
- 5.
- Educational qualification: No formal education (), Primary (), Secondary (), Graduate (), Post graduate ().
- 6.
- Occupation: Student (), Government employee (), Private sector employee (), Self-employed (), Farmer (), Laborer () Retired (), other (please specify)
- 7.
- Monthly income: <10k (), 10–30k (), 31–50k (), >50k ()
- 8.
- What type of accommodation do you live in? (a) House (b) Flat
- 9.
- What is your type of the accommodation? (a) Rented (b) Own
- 10.
- How far is the nearest green space from your home? <500 m (), 500 m–1 km (), 1–2 km (), >2 km ()
- 11.
- How do you usually travel to green space? Walk () Bicycle () Public transport () Car ()
- 12.
- How often do you visit the green space? Daily () Weekly () Monthly () Rarely () Never ()
- 13.
- When do you usually visit green spaces? Morning () Afternoon () Evening ()
- 14.
- How much time do you usually spend during your visit? <30 min () up to 1 h () 1–2 h () More than 2 h ()
- 15.
- What do you value most in green spaces? Clean air () Shade and trees () Quietness () Aesthetics ()
- 16.
- What ecological benefits have been observed from green spaces in your area? Improved air quality (), Reduction in urban heat (), Reduction in noise pollution ().
- 17.
- Are you usually alone or with others in green spaces? Alone (), with family () with neighbors (), with friends ().
- 18.
- How often do you communicate with your neighbors or family in the green spaces? Every day (), three or more times a week (), three or more times a month (), once in a while (), hardly ().
- 19.
- Your main activities in green spaces are: Please check all that apply
- physical: walking (), exercising ()
- leisure: resting (), drinking tea (), playing cards ()
- social: meeting friends/chatting (), with family ()
- child-related: looking after children ()
- cultural: participating in cultural activities (calligraphy, singing, dancing, painting) (), pet-related: walking the dog ().
- 20.
- What aspects of green spaces are you most satisfied with? Select that may apply.
- Vegetation coverage ratio (),
- water body setting (),
- public activities space (),
- landscape pattern (),
- nearness/remoteness to road (),
- cleanliness (),
- watch and ward (),
- native plants (),
- management (),
- other ().
- 21.
- What aspects of green spaces are you most dissatisfied with? Select that may apply
- Vegetation coverage ratio (),
- water body setting (),
- public activities space (),
- landscape pattern (),
- nearness/remoteness to road (),
- cleanliness (),
- watch and ward (),
- native plants (),
- management (),
- other ().
- 22.
- To what extent do you agree with the following statements? 1 (Strongly Agree) 5 (Strongly Disagree)
- Mental/Emotional Benefits
- Urban green spaces help me reduce stress.

- I feel happier and more relaxed after spending time in green spaces.
- Green space is good for relieving pressure.
- Physical/Health Benefits
- Access to green space improves my physical health.
- Community/Infrastructure
- My community needs more and better managed green spaces.
- My community needs more and better managed green spaces.
- Green spaces promote nationhood or community bonding.
- Green spaces contribute to local economic activities.
- Green spaces promote social interaction.
- Satisfaction:
- Satisfaction with recreational activities.
- Satisfaction with plant decoration.
- Satisfaction with landscape design for quiet visiting.
- Satisfaction with green space infrastructure (e.g., recreational/rest facilities).
- Satisfaction with management.
- 23.
- Do you think respondents from higher income neighborhood have better quality or more green space access than those from lower income areas? [ ] Yes [ ] No
- 24.
- Do you harvest or take anything from the park? (Like leaves, medicinal plants, flowers, fodder, oilseeds, cuttings to plant etc.)
- 25.
- Name some of the species that you can identify in this park.
| Trees: |
| Flowers: |
| Birds: |
| Fruits: |
| Medicinal Plants: |
- 26.
- Do you think entry to the park should be priced? (a) Yes (b) Nob) Why? ______________________________________c) If yes, what would be the ideal price according to you?
- 27.
- Do you feel a personal responsibility for keeping public green spaces clean and protected? [ ] Yes [ ] No
- 28.
- What improvements would you suggest?
Appendix A.2. SIMPER Analysis Results Comparing Average Dissimilarities, Ratio and Significance Levels for All Variables Across All Possible Cluster Comparisons
Table A1.
Clusters I and III.
Table A2.
Contrast: 1_2.
Table A3.
Contrast: 3_2.
References
- Paudel, S.S.; States, S.L. Urban green spaces and sustainability: Exploring the ecosystem services and disservices of grassy lawns versus floral meadows. Urban For. Urban Green. 2023, 84, 127932. [Google Scholar] [CrossRef] [Scilit]
- Godoi, N.M.I.; Gomes, R.C.; Longo, R.M. Contributions of urban green spaces to cities: A literature review. Sustain. Environ. 2025, 11, 2464418. [Google Scholar] [CrossRef] [Scilit]
- Chen, B.; Wu, S.; Song, Y.; Webster, C.; Xu, B.; Gong, P. Contrasting inequality in human exposure to green space between cities of Global North and Global South. Nat. Commun. 2022, 13, 4636. [Google Scholar] [CrossRef] [Scilit]
- Ali, J.M.; Rahaman, M.; Hossain, S.I. Urban green spaces for elderly human health: A planning model for healthy city living. Land Use Policy 2022, 114, 105970. [Google Scholar] [CrossRef] [Scilit]
- Das, M.; Das, A.; Momin, S. Quantifying the cooling effect of urban green space: A case from urban parks in a tropical mega metropolitan area (India). Sustain. Cities Soc. 2022, 87, 104062. [Google Scholar] [CrossRef] [Scilit]
- Turaga, R.M.R.; Thakur, U.J.M.; Chakrabarti, S.; Hossain, D. Exploring the role of urban green spaces in smartening cities in India. Impact Assess. Proj. Apprais. 2019, 38, 479–490. [Google Scholar] [CrossRef] [Scilit]
- Chaudhry, P.; Tewari, V.P. Role of public parks/gardens in attracting domestic tourists: An example from City Beautiful of India. Tourismos 2010, 5, 101–109. [Google Scholar]
- Anguluri, R.; Narayanan, P. Role of green space in urban planning: Outlook towards smart cities. Urban For. Urban Green. 2017, 25, 58–65. [Google Scholar] [CrossRef] [Scilit]
- Jabbar, M.; Yusoff, M.M.; Shafie, A. Assessing the role of urban green spaces for human well-being: A systematic review. GeoJournal 2022, 87, 4405–4423. [Google Scholar] [CrossRef] [Scilit]
- Gill, S.E.; Handley, J.F.; Ennos, A.R.; Pauleit, S. Adapting cities for climate change: The role of the green infrastructure. Built Environ. 2007, 33, 115–133. [Google Scholar] [CrossRef] [Scilit]
- Ramaiah, M.; Avtar, R. Urban green spaces and their need in cities of rapidly urbanizing India: A review. Urban Sci. 2019, 3, 94. [Google Scholar] [CrossRef] [Scilit]
- Yogita. Fragmented governance and inter-agency coordination in Delhi: Challenges for effective urban policy implementation. Int. J. Hum. Soc. Sci. Res. 2026, 13, 137–142. [Google Scholar]
- Zhang, L.; Cao, H.; Han, R. Residents’ preferences and perceptions toward green open spaces in an urban area. Sustainability 2021, 13, 1558. [Google Scholar] [CrossRef] [Scilit]
- Sarika, S. People’s perception on use and management of urban green spaces of Gurugram India. Geography 2025, 151, 511–517. [Google Scholar]
- Basu, S.; Nagendra, H. Perceptions of park visitors on access to urban parks and benefits of green spaces. Urban For. Urban Green. 2021, 57, 126959. [Google Scholar] [CrossRef] [Scilit]
- Ahmad, Z.; Batool, N.; Shah, S.A. GIS-based analysis of green space in urban Himalayas and modelling the effects on destination business performance. Int. J. Tour. Cities 2022, 8, 1102–1126. [Google Scholar] [CrossRef] [Scilit]
- Dash, M.; Chakraborty, M. Distribution of green spaces across socio-economic groups: A study of Bhubaneswar India. J. Arch. Urban. 2023, 47, 57–67. [Google Scholar] [CrossRef] [Scilit]
- Slave, A.R.; Iojă, I.C.; Hossu, C.A.; Grădinaru, S.R. Assessing public opinion using self-organizing maps: Lessons from urban planning in Romania. Landsc. Urban Plan. 2023, 231, 104641. [Google Scholar] [CrossRef] [Scilit]
- Takala, T.; Brockhaus, M.; Hujala, T.; Tanskanen, M. Discursive barriers to voluntary biodiversity conservation: The case of Finnish forest owners. Policy Econ. 2022, 136, 102681. [Google Scholar] [CrossRef] [Scilit]
- Ali, A.; Ahmed, K.A. Quantifying the environmental impacts of urban expansion in Srinagar City, Jammu & Kashmir, India through remote sensing and geostatistical analysis. GeoJournal 2026, 91, 110. [Google Scholar] [CrossRef] [Scilit]
- Mehraj, G.; Khuroo, A.A.; Hamid, M.; Muzafar, I.; Rashid, I.; Malik, A.H. Floristic diversity and correlates of naturalization of alien flora in urban green spaces of Srinagar city. Urban Ecosyst. 2021, 24, 1231–1244. [Google Scholar] [CrossRef] [Scilit]
- Ding, T.; Wang, C.; Zeng, B.; Li, Y.; Li, Y. Accessibility and Social Equity of Urban Park Green Spaces in Megacities from an Environmental Justice Perspective: A Case Study of the Six Central Districts of Beijing. Land 2026, 15, 484. [Google Scholar] [CrossRef] [Scilit]
- Cao, Y.; Guo, Y.; Zhang, M. Research on the Equity of Urban Green Park Space Layout Based on Ga2SFCA Optimization Method—Taking the Core Area of Beijing as an Example. Land 2022, 11, 1323. [Google Scholar] [CrossRef] [Scilit]
- Mullick, A. Accessibility issues in park design: The national parks. Landsc. Urban Plan. 1993, 26, 25–33. [Google Scholar] [CrossRef] [Scilit]
- Hansen, W.G. How accessibility shapes land use. J. Am. Inst. Palnners 1959, 25, 73–76. [Google Scholar] [CrossRef] [Scilit]
- Powell, L.M.; Slater, S.; Chaloupka, F.J.; Harper, D. Availability of physical activity–related facilities and neighborhood demographic and socioeconomic characteristics: A national study. Am. J. Public Health 2006, 96, 1676–1680. [Google Scholar] [CrossRef] [Scilit]
- Majid, M.; Mir, B.A. Landfill site selection using GIS based multi-criteria evaluation technique: A case study of Srinagar city India. Environ. Chall. 2021, 3, 100031. [Google Scholar] [CrossRef] [Scilit]
- Muzafar, I.; Khuroo, A.A.; Mehraj, G.; Hamid, M.; Rashid, I.; Malik, A.H. Floristic diversity along the roadsides of an urban biodiversity hotspot in Indian Himalayas. Plant Biosyst. 2019, 153, 222–230. [Google Scholar] [CrossRef] [Scilit]
- Gunawan, J.; Marzilli, C.; Aungsuroch, Y. Establishing appropriate sample size for developing and validating a questionnaire in nursing research. Belitung Nur. J. 2021, 7, 356–360. [Google Scholar] [CrossRef] [Scilit]
- Li, Z.; Wang, R.; Zhang, X.S.; Chen, L. Self-organizing map of complex networks for community detection. J. Syst. Sci. Complex. 2010, 23, 931–941. [Google Scholar] [CrossRef] [Scilit]
- Izakovicova, Z.; Špulerová, J.; Baránková, Z.; Palaj, A. Perception of the values of the biocultural landscape types of Slovakia by the population. Land 2022, 11, 72. [Google Scholar] [CrossRef] [Scilit]
- Tavakol, M.; Dennick, R. Making sense of cronbach’s alpha. Int. J. Med. Educ. 2011, 2, 53–55. [Google Scholar] [CrossRef] [Scilit]
- O’Brien, R.M. A caution regarding rules of thumb for variance inflation factors. Qual. Quant. 2007, 41, 673–690. [Google Scholar] [CrossRef] [Scilit]
- Gregorich, M.; Strohmaier, S.; Dunkler, D.; Heinze, G. Regression with highly correlated predictors: Variable omission is not the solution. Int. J. Environ. Res. Public Health 2021, 18, 4259. [Google Scholar] [CrossRef] [Scilit]
- Graham, M.H. Confronting multicollinearity in ecological multiple regression. Ecology 2003, 84, 2809–2815. [Google Scholar] [CrossRef] [Scilit]
- Dormann, C.; Elith, J.; Bacher, S.; Buchmann, C.; Carl, G.; Carré, G.; García-Márquez, J.R.; Gruber, B.; Lafourcade, B.; Leitão, P.J.; et al. Collinearity: A review of methods to deal with it and a simulation study evaluating their performance. Ecography 2013, 36, 27–46. [Google Scholar] [CrossRef] [Scilit]
- Ha, T.N.; Lubo-Robles, D.; Marfurt, K.J.; Wallet, B.C. An in-depth analysis of logarithmic data transformation and per-class normalization in machine learning: Application to unsupervised classification of a turbidite system in the Canterbury Basin New Zealand and supervised classification of salt in the Eugene Island Mini basin. Interpretation 2021, 9, 685–710. [Google Scholar] [CrossRef] [Scilit]
- Wang, B.; Sun, F.; Luan, Y. Comparison of the effectiveness of different normalization methods for metagenomic cross-study phenotype prediction under heterogeneity. Sci. Rep. 2024, 14, 7024. [Google Scholar] [CrossRef] [Scilit]
- Abarca-Álvarez, F.J.; Campos-Sánchez, F.S. Survey assessment for decision support using self-organizing maps profile characterization with an odd and cluster heat map: Application to children’s perception of urban school environments. Entropy 2019, 21, 916. [Google Scholar] [CrossRef] [Scilit]
- Kim, H.G.; Hong, S.; Chon, T.S.; Joo, G.J. Spatial patterning of chlorophyll a and water-quality measurements for determining environmental thresholds for local eutrophication in the Nakdong River basin. Environ. Pollut. 2021, 268, 115701. [Google Scholar] [CrossRef] [Scilit]
- Lee, C.W.; Jang, J.D.; Jeong, K.S.; Kim, D.K.; Joo, G.J. Patterning habitat preference of avifaunal assemblage on the Nakdong River estuary (South Korea) using self-organizing map. Ecol. Inform. 2010, 5, 63–69. [Google Scholar] [CrossRef] [Scilit]
- Chaudhary, V.; Bhatia, R.S.; Ahlawat, A.K. A novel self-organizing map (SOM) learning algorithm with nearest and farthest neurons. Alex. Eng. J. 2014, 53, 827–831. [Google Scholar] [CrossRef] [Scilit]
- Hong, S.; Chon, T.S.; Joo, G.J. Spatial distribution patterns of Eurasian otter (Lutra lutra) in association with environmental factors unravelled by machine learning and diffusion kernel method. J. Environ. Inform. 2021, 37, 130–141. [Google Scholar] [CrossRef] [Scilit]
- Taczanowska, K.; González, L.M.; García-Massó, X.; Iglesias-Pérez, S. Nature-based tourism or mass tourism in nature? Segmentation of mountain protected area visitors using self-organizing maps (SOM). Sustainability 2019, 11, 1314. [Google Scholar] [CrossRef] [Scilit]
- Clarke, K.R.; Gorley, R.N. Getting Started with PRIMER v7; PRIMER-E: Plymouth, UK, 2015; p. 296. [Google Scholar]
- Ramette, A. Multivariate analyses in microbial ecology. FEMS Microbiol. Ecol. 2007, 62, 142–160. [Google Scholar] [CrossRef] [Scilit]
- NITI Aayog Government of India. Reforms in Urban Planning Capacity in India. 2021. Available online: https://www.niti.gov.in/sites/default/files/2021-09/UrbanPlanningCapacity-in-India-16092021.pdf (accessed on 20 September 2025).
- Bressane, A.; Pinto, J.P.C.; Medeiros, L.C.C. Countering the effects of urban green gentrification through nature-based solutions: A scoping review. Nat. Based Solut. 2024, 5, 100131. [Google Scholar] [CrossRef] [Scilit]
- Wang, J.; Hu, Y.; Zhang, X. Is green gentrification a pernicious paradox in the urban greening process? Land Use Policy 2005, 158, 107766. [Google Scholar] [CrossRef] [Scilit]
- Hassan, Y.N.; Jombach, S. Urban Green Space per Capita for Sustainable and Equitable Urban Planning: A Systematic Review and Bibliometric Analysis. Land 2026, 15, 29. [Google Scholar] [CrossRef] [Scilit]
- Morar, T.; Radoslav, R.; Spiridon, L.C.; Păcurar, L. Assessing pedestrian accessibility to green space using GIS. Transylv. Rev. Adm. Sci. 2014, 10, 116–139. [Google Scholar]
- Kumar, S.; Rajak, F. Assessment of urban green open spaces of micro- and meso-level zones based on the growth pattern: Case of Patna City. Sustainability 2023, 15, 1609. [Google Scholar] [CrossRef] [Scilit]
- Zhang, Y.; Hu, Y.; Wei, Y.; Xie, Y. Can pocket parks be compared to community parks in the restoration effect of physical and mental health for young adults: A comparative experiment in high-density urban green spaces. Front. Public Health 2025, 13, 1610497. [Google Scholar] [CrossRef] [Scilit]
- Housen, T.; Lenglet, A.; Ariti, C. Prevalence of anxiety depression and post-traumatic stress disorder in the Kashmir Valley. BMJ Glob. Health 2017, 2, e000419. [Google Scholar] [CrossRef] [Scilit]
- Paul, M.A.; Khan, W. Prevalence of childhood mental disorders among school children of Kashmir Valley. Community Ment. Health J. 2019, 55, 1031–1037. [Google Scholar] [CrossRef] [Scilit]
- Bhor, N.; Mayavel, D. The socio-spatial distribution and equity of access to urban parks: A case study of Bengaluru, India. Challenges 2024, 15, 20. [Google Scholar] [CrossRef] [Scilit]
- Sugiyama, T.W.; Thompson, C. Older people’s health outdoor activity and supportiveness of neighbourhood environments. Landsc. Urban Plan. 2007, 83, 168–175. [Google Scholar] [CrossRef] [Scilit]
- Li, D.; Zhai, Y.; Xiao, Y. Subtypes of park use and self-reported psychological benefits among older adults: A multilevel latent class analysis approach. Landsc. Urban Plan. 2019, 190, 103605. [Google Scholar] [CrossRef] [Scilit]
- Lahoti, S.; Kefi, M.; Lahoti, A.; Saito, O. Mapping methodology of public urban green spaces using GIS: An example of Nagpur City India. Sustainability 2019, 11, 2166. [Google Scholar] [CrossRef] [Scilit]
- Paul, S.; Nagendra, H. Factors influencing perceptions and use of urban nature: Surveys of park visitors in Delhi. Land 2017, 6, 27. [Google Scholar] [CrossRef] [Scilit]
- Zhang, F.; Qian, H.A. Comprehensive review of the environmental benefits of urban green spaces. Environ. Res. 2024, 252, 2118837. [Google Scholar] [CrossRef] [Scilit]
- Włodarczyk-Marciniak, R.; Krauze, K. Does educational profile influence student perception of ecosystem service provision by blue-green infrastructure? Soc. Nat. Res. 2023, 36, 840–859. [Google Scholar] [CrossRef] [Scilit]
- Saha, B.; Atiqul Haq, S.M. Perception of urban green space among university students in Bangladesh. PLoS ONE 2024, 19, e0311033. [Google Scholar] [CrossRef] [Scilit]
- Richardson, M.; Hunt, I.; Butler, C.W.; Thomas, R.; Hallam, A. Actively noticing nature (not just time in nature) helps promote nature connectedness. Ecopsychology 2022, 14, 8–16. [Google Scholar] [CrossRef] [Scilit]
- Ignatieva, M.; Haase, D.; Dushkova, D.; Haase, A. Lawns in cities: From a globalised urban green space phenomenon to sustainable nature-based solutions. Land 2020, 9, 73. [Google Scholar] [CrossRef] [Scilit]
- Chari, P.R.; Chandran, D.S.; Akhtar, S. Tourism and Peace Building in Jammu and Kashmir (Special Report No. 281). United States Institute of Peace. 2011. Available online: https://ciaotest.cc.columbia.edu/wps/usip/0022835/f_0022835_18718.pdf (accessed on 16 September 2025).
- Kleinschroth, F.; Savilaakso, S.; Kowarik, I.; Martinez, P.J.; Chang, Y.; Jakstis, K.; Schneider, J.; Fischer, L.K. Global disparities in urban green space use during the COVID-19 pandemic from a systematic review. Nat. Cities 2024, 1, 136–149. [Google Scholar] [CrossRef] [Scilit]
- Parry, J.A.; Ganaie, S.A.; Nengroo, A.; Bhat, M.S. Spatial Analysis on the provision of Urban Amenities and their Deficiencies—A Case Study of Srinagar City, Jammu and Kashmir, India. Res. Humanit. Soc. Sci. 2012, 2, 192–219. [Google Scholar]
- Parry, J.A.; Kuchay, N.A.; Ganaie, S.A.; Bhat, M.S. Spatial Analysis of Urban Amenities in Srinagar City Jammu and Kashmir. Glob. J. Arts Humanit. Soc. Sci. 2001, 1, 20–31. [Google Scholar]
- Nengroo, Z.A.; Bhat, M.S.; Kuchay, N.A. Measuring urban sprawl of Srinagar city, Jammu and Kashmir, India. J. Urban Manag. 2017, 6, 45–55. [Google Scholar] [CrossRef] [Scilit]
- Zinia, N.J.; McShane, P. Significance of urban green and blue spaces: Identifying and valuing provisioning ecosystem services in Dhaka City. Eur. J. Sustain. Dev. 2018, 7, 435–446. [Google Scholar] [CrossRef] [Scilit]
- Grêt-Regamey, A.; Brunner, S.H.; Kienast, F. Mountain ecosystem services: Who cares? Mt. Res. Dev. 2012, 32, S23–S34. [Google Scholar] [CrossRef] [Scilit]
- Thiemann, M.; Riebl, R.; Haensel, M.; Schmitt, T.M.; Steinbauer, M.J.; Landwehr, T. Perceptions of ecosystem services: Comparing socio-cultural and environmental influences. PLoS ONE 2022, 17, e0276432. [Google Scholar] [CrossRef] [Scilit]
- Sen, A.; Unnikrishnan, H.; Nagendra, H. Imperilled waterscapes: The social-ecological transformation of lakes in Bengaluru. Ecol. Econ. Soc. 2020, 3, 125–134. [Google Scholar]
- Barbosa, O.; Tratalos, J.A.; Armsworth, P.R.; Davies, R.G.; Fuller, R.A.; Johnson, P.; Gaston, K.J. Who benefits from access to urban green space? A case study from Sheffield, UK. Landsc. Urban Plan. 2007, 83, 187–195. [Google Scholar] [CrossRef] [Scilit]
- Rigolon, A. A complex landscape of inequity in access to urban parks: A literature review. Landsc. Urban Plan. 2016, 153, 160–169. [Google Scholar] [CrossRef] [Scilit]
- Bigdeli, A.; Maghsoudi, A.; Ghezelbash, R. Application of self-organizing map (SOM) and K-means clustering algorithms for portraying geochemical anomaly patterns in Moalleman district NE Iran. J. Geochem. Explor. 2022, 233, 106923. [Google Scholar] [CrossRef] [Scilit]
- Mendez-Suarez, M.; Delbello, L.; de Vega de Unceta, A. Factors affecting consumers’ attitudes towards artificial intelligence. J. Prom. Manag 2024, 30, 1141–1158. [Google Scholar] [CrossRef] [Scilit]
- Raymond, C.M.; Frantzeskaki, N.; Kabisch, N.; Berry, P.; Breil, M.; Nita, M.R.; Geneletti, D.; Calfapietra, C. A framework for assessing and implementing the co-benefits of nature-based solutions in urban areas. Environ. Sci. Policy 2017, 77, 15–24. [Google Scholar] [CrossRef] [Scilit]

Disclaimer/Publisher’s Note: The statements, opinions and data contained in all publications are solely those of the individual author(s) and contributor(s) and not of MDPI and/or the editor(s). MDPI and/or the editor(s) disclaim responsibility for any injury to people or property resulting from any ideas, methods, instructions or products referred to in the content. |
© 2026 by the authors. Licensee MDPI, Basel, Switzerland. This article is an open access article distributed under the terms and conditions of the Creative Commons Attribution (CC BY) license.