


Abstract
Background: Neurodegenerative diseases such as Alzheimer’s disease (AD) and Parkinson’s disease (PD) are increasingly recognized as biologically heterogeneous disorders. Although biomarker-based frameworks have improved disease stratification, they may not fully capture the molecular diversity underlying disease mechanisms. This study aimed to define biologically meaningful AD and PD subtypes by employing large-scale plasma proteomics to characterize mechanism-driven patient stratification. Methods: We analyzed plasma proteomic data from the Global Neurological Proteomics Consortium (GNPC) dataset and performed disease-specific unsupervised clustering to identify molecular subtypes. We performed differential protein expression and pathway enrichment analyses to characterize subtype-specific and shared biological signatures. Results: Clustering analysis revealed three molecular AD subtypes and two PD subtypes, each exhibiting unique proteomic signatures despite similar demographic and cognitive profiles. AD subtypes differed in the relative involvement of immune activation, mitochondrial dysfunction, synaptic signaling, and calcium-related pathways, whereas PD subtypes showed divergence in neuroinflammatory, oxidative stress, and mitochondrial programs. Conclusions: We demonstrated stratification of AD and PD into molecular subtypes, potentially supporting scalable, mechanism-directed stratification and the development of future targeted, disease-modifying therapies.
1. Introduction
Neurodegenerative diseases, such as Alzheimer’s (AD), Parkinson’s (PD), and Amyotrophic Lateral Sclerosis (ALS), are traditionally characterized as single progressive conditions. However, emerging molecular evidence supports stratifying these chronic disorders to explain the heterogeneity observed in clinical cases [1,2,3,4,5,6,7]. Despite these advances, our understanding of the AD and PD continuum remains limited, posing a significant barrier to developing effective treatments. These limitations are present at various stages of drug development, including target identification, patient stratification, and biomarker development [8].
AD and PD are two of the most common neurodegenerative disorders and represent a growing global health burden [9]. While AD is the most prevalent of dementia cases, dementia itself is a syndrome consisting of other major types of dementias, including PD dementia (PDD), dementia with Lewy bodies (DLB), vascular dementia (VD), and frontotemporal dementia (FTD) [10]. Importantly, AD and PD share overlapping clinical features, including cognitive impairment, and partially overlapping proteinopathies, involving amyloid-β, tau, and α-synuclein, highlighting shared pathogenic mechanisms between these disorders. In the 1970s, neuropathological studies combined with expanded brain tissue collection established dementias as distinct biological diseases, defined by neuropathic lesions rather than clinical presentation alone [11]. These histopathological frameworks later enabled molecular characterization of disease-defining pathologies, including amyloid-β plaques, tau neurofibrillary tangles, and α-synuclein aggregates, which now underpin our modern framework of these diseases [12]. One such framework is the proposed A/T/N classification system, a biomarker-based paradigm for stratifying AD patients. Briefly, “A” represents amyloid-β, T (tau), and N, neurodegeneration [13]. Notably, the A/T/N paradigm has gained significant traction in recent years [14,15,16].
While informative, the A/T/N system and other related frameworks may underrepresent the molecular complexity underlying neuropathology. To overcome this challenge, several groups have developed data-driven approaches to stratify based on molecular signatures. Eshima et al. identified distinct ALS subtypes using unsupervised clustering algorithms [5]. Concretely, they clustered ALS patients using RNA-seq data, yielding three unique subtypes: ALS-Glia (inflammatory subtype), ALS-Ox (oxidative stress subtype), and ALS-TD (transcriptional dysregulation). For PD, three molecular subtypes were recently characterized using a multi-modal integrative approach that combined longitudinal clinical data, cerebrospinal fluid (CSF) biomarkers, brain imaging, and whole-blood transcriptomic data [17]. Notably, the PD subtypes had different rates of disease progression, with a group of faster progressors identified. Several studies explored leveraging molecular clustering to identify AD subtypes [3,18,19,20]. Inflammatory AD subtypes are consistently reported. Tijms et al. recently characterized five molecular AD subtypes based on CSF samples, defined by hyperplasticity, neuroinflammation, RNA dysregulation, choroid plexus dysfunction, and blood–brain barrier (BBB) impairment [19].
In this study, we aim to characterize AD and PD subtypes within the GNPC study to improve our understanding of these complex disorders by identifying distinct molecular mechanisms underlying their heterogeneity. Building on previous efforts in patient stratification, such insights could prove valuable for the discovery of companion diagnostic biomarkers, novel disease targets, precision treatments, and future clinical trial design.
2. Materials and Methods
2.1. Study Data and Sample Selection
Global Neurological Proteomics Consortium (GNPC) v1 harmonized proteomic and clinical data were accessed and processed using the Alzheimer’s Disease Data Initiative Repository and Workbench [21]. Data used in the preparation of this article were obtained on 1 September 2025 from the GNPC Harmonized Data Superset Version 1 [22]. While the investigators within the GNPC contributed data to GNPC, they did not necessarily participate in the analysis or writing of this report. In total, the dataset included 33,848 biospecimens processed across 387 assay plates, including 739 cerebrospinal fluid (CSF) samples, 6291 EDTA plasma samples, 1663 serum samples, and 113 citrate plasma samples. Proteomic profiling was primarily performed on EDTA plasma samples using the SomaLogic SOMAmer-based SomaScan 7k assay, which quantifies approximately 7000 proteins per sample. Analyses were restricted to EDTA plasma samples from participants labeled as AD (n = 2902), PD (n = 462), or healthy controls (n = 1186). Controls were filtered to retain individuals with relatively low levels of neurodegenerative markers (amyloid precursor protein, tau, and α-synuclein) to reduce potential inclusion of preclinical pathology. Quintiles were calculated for each marker. For tau and α-synuclein, “low” was defined as values below the 50th percentile of the control distribution. For APP, “low” was defined as values below the 20th percentile. Accordingly, all thresholds used to classify “low” biomarker levels were derived from relative distributions within the study cohort rather than from pre-specified absolute quantitative cutoffs. Participant-level covariates (age, sex) and assay metadata (e.g., plate identifiers) were merged before downstream analyses.
2.2. Data Pre-Processing, Feature Selection, and Clustering
Proteomic data were processed using standard bioinformatic workflows [23]. Protein abundance values were z-score normalized across samples, proteins with no measurable variation were removed, and plate-related technical variation was mitigated using standard batch-correction options in the limma v3.66.0 R package [24]. For unsupervised subtype discovery, analyses were performed within each disease group separately. Feature selection was performed within each disease group using sparse principal component analysis (PCA), reducing the proteomic feature space to 175 proteins in AD and 502 proteins in PD. Disease subtype clusters were then identified using standard unsupervised clustering methods. Clustering robustness was assessed by running multiple times with different initializations, yielding stable subtype assignments and consistent molecular signatures. Formal stability metrics were not applied. Patient subtypes were visualized using t-SNE applied to the reduced feature space. Subtype assignments were carried forward for subtype-stratified comparisons.
2.3. Differential Protein Expression Analysis
Differential protein expression was assessed using the limma v3.66.0 R package [24]. For each subtype, protein abundances were compared with controls, adjusting for age, sex, and assay plate. Empirical Bayes moderation was used to handle variance estimation across proteins. Statistical significance was determined using the Benjamini–Hochberg method to control for multiple testing; thresholds were applied to identify significantly differentially expressed proteins (e.g., FDR-adjusted p < 0.05). An overlap between AD and PD subtype signatures was quantified using UpSetR v1.4.0 [25].
2.4. Pathway Enrichment Analysis
Pathway enrichment analysis was performed using rank-based gene set enrichment against Reactome pathway libraries available in msigdbr v25.1.1 R package [26]. Proteins were mapped to gene symbols, ranked by differential expression statistics, and enrichment was computed using an established GSEA framework with multiple-testing correction. Significantly enriched pathways were defined using conventional thresholds (e.g., FDR-adjusted p < 0.05 with a minimum absolute normalized enrichment score), and subtype-specific versus shared pathway patterns were summarized using overlap analyses.
3. Results
We analyzed biospecimens curated within the GNPC V1 harmonized dataset, a large multi-cohort resource designed to study neurodegenerative diseases [22]. While GNPC V1 includes multiple disease groups, including frontotemporal dementia and amyotrophic lateral sclerosis, the scope of this study was focused on comparisons between healthy controls and individuals with Alzheimer’s disease (AD) and Parkinson’s disease (PD). Among the available EDTA plasma samples, 2902 were from individuals with AD, 1186 from healthy controls, and 462 from PD subjects, providing broad coverage across disease groups.
3.1. Differential Relationships Between α-Synuclein, Amyloid Precursor Protein, and Tau
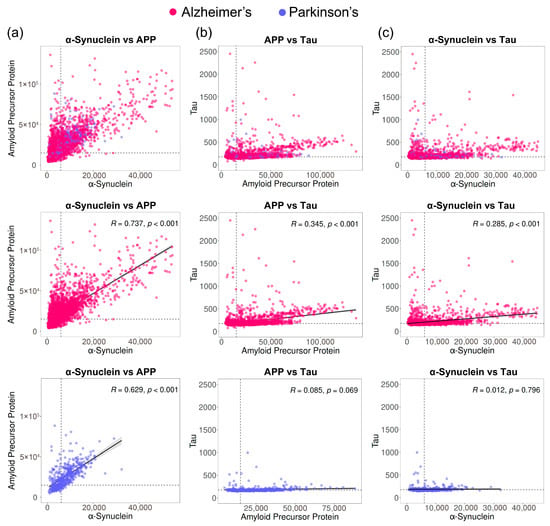
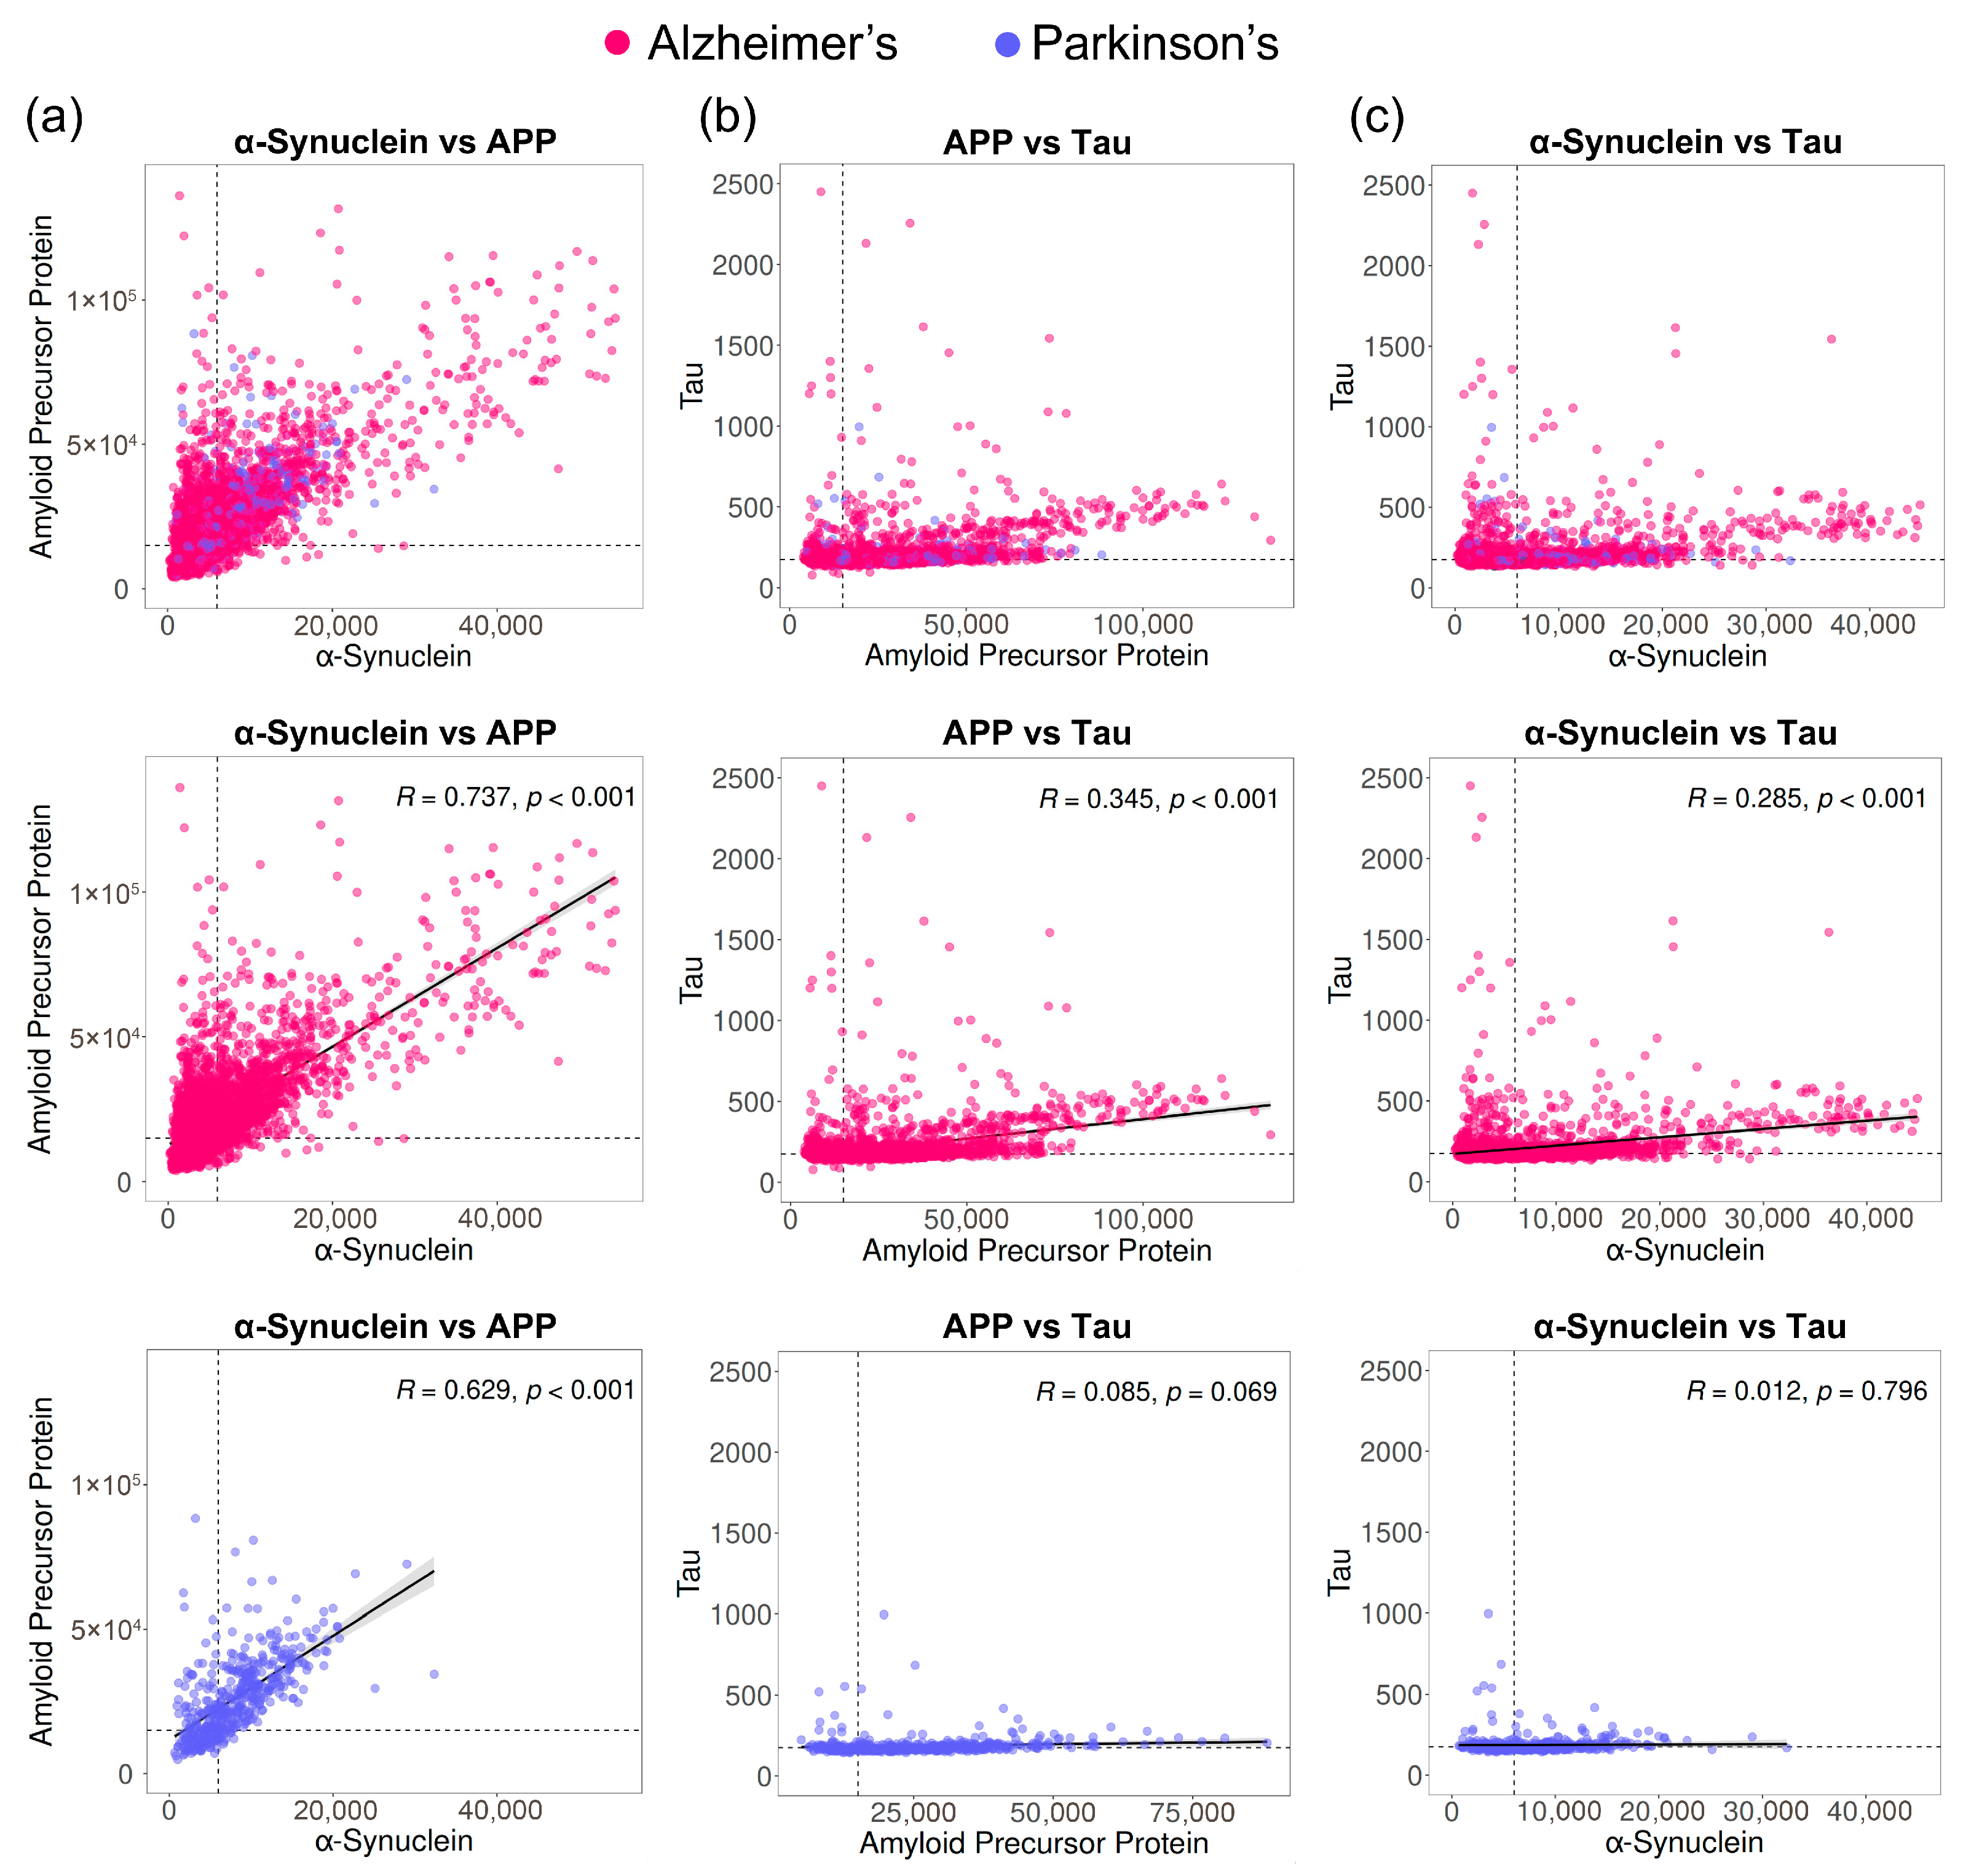
Amyloid-β and tau are widely recognized as the canonical molecular hallmarks of AD, representing distinct yet interacting processes of amyloid deposition and neurofibrillary pathology, whereas α-synuclein aggregation represents the central pathogenic feature of PD and related synucleinopathies [12]. Increasingly, amyloid-β, tau, and α-synuclein are being incorporated into expanded A/T/N-based frameworks to capture overlapping and disease-specific proteinopathies across neurodegenerative disorders [13]. As amyloid-β itself was not directly assayed in the SomaScan platform, APP levels were used as a proxy for amyloid. To assess pathological burden, we quantified pairwise linear associations among the plasma biomarkers for α-synuclein, tau, and APP in the GNPC dataset using Pearson correlation. In AD, we observed a positive correlation between (1) α-synuclein and APP, (2) APP and tau, and (3) α-synuclein and tau (Figure 1). Pearson correlation analysis revealed a modest but robust association between APP and tau (r = 0.345, p < 0.001, Figure 1b) and α-synuclein and tau (r = 0.285, p < 0.001, Figure 1c) in AD samples. In contrast, we observed no significant correlation between APP and tau (r = 0.085, p = 0.069; Figure 1b) or between α-synuclein and tau (r = 0.012, p = 0.796; Figure 1c) in PD samples. Notably, α-synuclein and APP were strongly correlated in both AD (r = 0.737, p < 0.001, Figure 1a) and PD (r = 0.629, p < 0.001, Figure 1a) samples.
Figure 1.
Relationships among plasma levels of α-synuclein, amyloid precursor protein (APP), and tau in Alzheimer’s disease and Parkinson’s disease. Scatter plots show pairwise associations between α-synuclein and APP (a), APP and tau (b), and α-synuclein and tau (c). Data are shown for individuals with Alzheimer’s disease (pink) and Parkinson’s disease (blue), with the top panels displaying all samples. Middle panels show correlations within Alzheimer’s disease, with linear regression lines (black line) superimposed and the corresponding correlation statistics reported (Pearson’s R and p-values). Bottom panels show the same analyses for Parkinson’s disease. Dashed lines indicate control-derived percentiles (50th percentile for tau and α-synuclein, and 20th percentile for APP). p-values were not corrected for multiple comparisons. Regression bands (grey) represent 95% confidence intervals.
3.2. Identification of Molecularly Distinct AD and PD Patient Subtypes
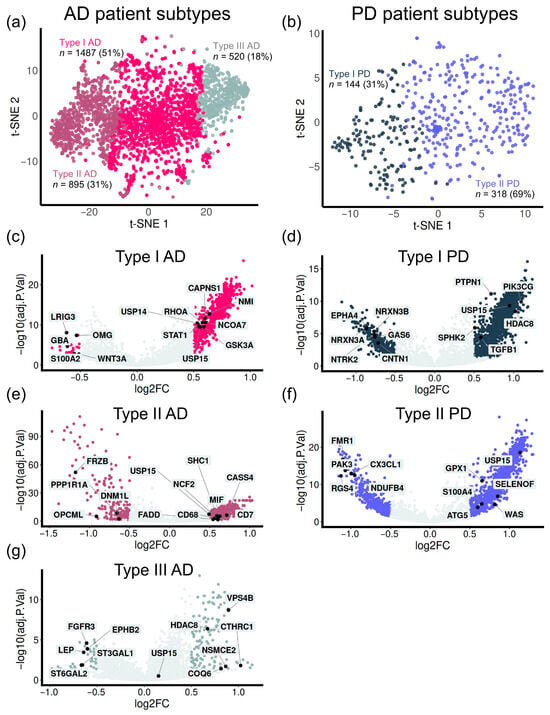
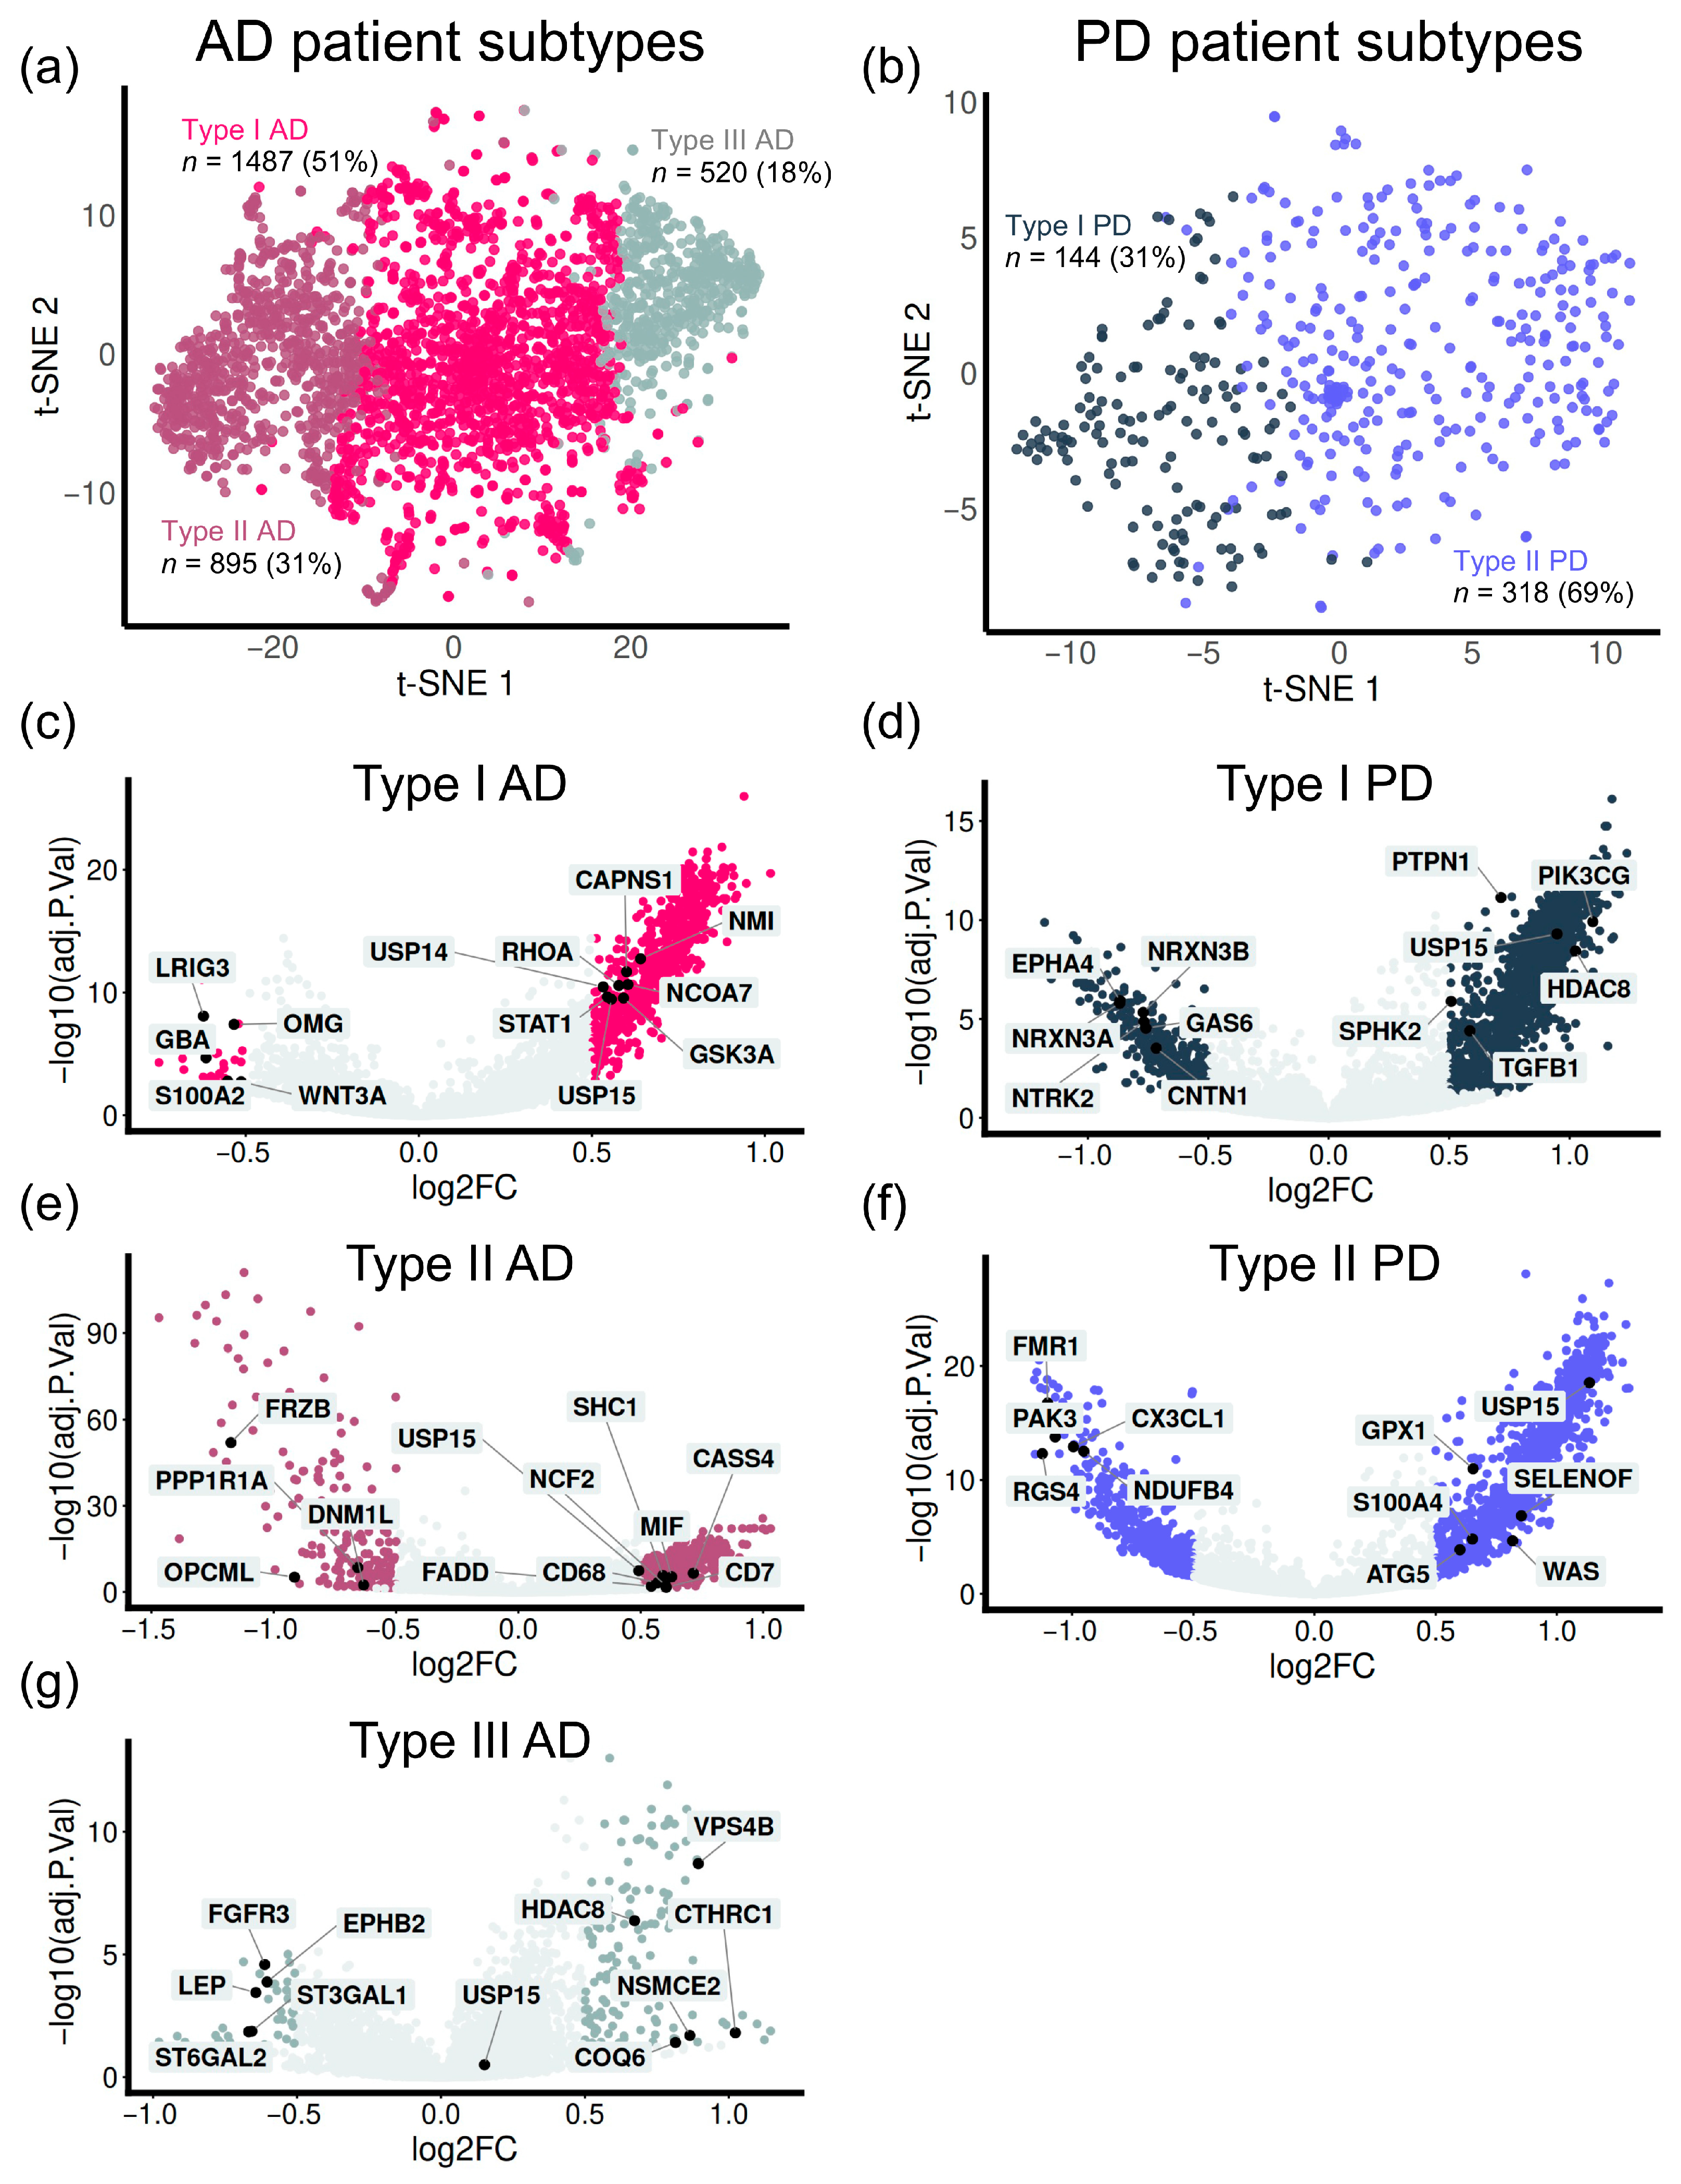
We next investigated whether molecularly distinct subtypes could be identified among individuals with AD and PD. For each disease, we applied an unsupervised analysis framework that incorporated batch correction, sparse dimensionality reduction, and clustering. Proteomic data were standardized and corrected for plate-level batch effects prior to feature selection using sparse principal component analysis, followed by unsupervised clustering. Within the AD cohort, we characterized three distinct clusters (Table 1, Figure 2a): Type I AD (n = 1487, 51%), Type II AD (n = 895, 31%), and Type III AD (n = 520, 18%). Clustering analysis of PD samples identified two distinct molecular subtypes (Figure 2b): Type I PD (n = 144, 31%) and Type II PD (n = 318, 69%).
Table 1.
General demographics of Alzheimer’s and Parkinson’s subtypes.
Figure 2.
Stratification of Alzheimer’s disease (AD) and Parkinson’s disease (PD) patients reveals distinct molecular profiles. (a) t-SNE visualization of AD patient samples showing three transcriptionally distinct subtypes: Type I AD, Type II AD, and Type III AD. (b) t-SNE visualization of PD patient samples, identifying two major subtypes: Type I PD and Type II PD. Each point represents an individual patient sample, colored by subtype assignment. (c–g) Volcano plots showing differentially expressed proteins (DEPs) for each disease subtype compared with all other samples within the same disease cohort. Each point represents an individual protein, and significantly up- and down-regulated DEPs (log2 fold change > 0.5, adjusted p-value < 0.5) are colored by subtype assignment. The x-axis indicates log2 fold change (log2FC) and the y-axis represents –log10 of the adjusted p-value.
To assess clinical differences, we compared memory outcomes and demographic characteristics across the identified AD and PD subtypes. AD subtypes had similar years of education (Table 1; Type I AD, 12.9 ± 4.7 years; Type II AD, 13.2 ± 4.5 years; Type III AD, 13.7 ± 4.5 years) and Mini Mental State Examination (MMSE) scores (Type I AD, 21.4 ± 6.6; Type II AD, 22.0 ± 6.2; Type III AD, 22.4 ± 6.4). In contrast, we observed higher odds ratios for Clinical Dementia Rating (CDR) scores (Type I AD: 14.7; Type II AD: 19.9; Type III AD: 21.5). Notably, Type III AD had the worst outcome among the other subtypes. In PD subtypes, we also did not observe any differences in educational level (Table 1; Type I PD, 13.8 ± 4.4 years; Type II PD, 13.9 ± 4.0 years) and MMSE scores (Type I PD, 26.3 ± 4.9; Type II PD, 26.2 ± 4.8). CDR odds ratios for PD subtypes (Type I PD, 2.8; Type II PD, 2.8) were relatively small compared to those for AD subtypes, consistent with typical PD vs. AD presentations. Together, these findings suggest that CDR testing may be more sensitive than MMSE exams in detecting cognitive differences.
Among the AD subtypes, we observed minimal differences in APOE genotype distributions, including the number of ε4 and ε2 carriers. In Type I AD (n = 1049), the most prevalent genotypes were ε3/ε4 (40%, n = 425) and ε3/ε3 (39%, n = 407), followed by ε4/ε4 (12%, n = 122). Less common genotypes included ε2/ε3 (6%, n = 64), ε2/ε4 (3%, n = 29), and ε2/ε2 (<1% n = 2), resulting in an overall ε4 carrier frequency of 55% (n = 576) and an ε2 carrier frequency of 9% (n = 95). In Type II AD (n = 683), ε3/ε3 and ε3/ε4 genotypes were observed at comparable frequencies (each 40%, n = 274). Homozygous ε4/ε4 carriers accounted for 10% (n = 70), while ε2 carrier genotypes comprised approximately 10% of samples (n = 65). The overall ε4 carrier frequency in this subtype was 53% (n = 365). In Type III AD (n = 419), ε3/ε4 was the most common genotype (44%, n = 183), followed by ε3/ε3 (39%, n = 162) and ε4/ε4 (12%, n = 49). ε2 carriers were relatively less represented (6%, n = 25), resulting in ε4 and ε2 carrier frequencies of 57% (n = 239) and 6% (n = 25), respectively.
Similarly, APOE genotype distributions were broadly similar across PD subtypes, with subtle differences in ε4 and ε2 burden. In Type I PD (n = 111), ε3/ε3 comprised ~59% (n = 66), ε3/ε4 ~21% (n = 23), ε2/ε3 ~14% (n = 15), ε4/ε4 ~5% (n = 6) and ε2/ε2 (<1%, n = 1), corresponding to ε4 and ε2 carrier frequencies of ~26% (n = 29) and ~14% (n = 16), respectively. In Type II PD (n = 251), ε3/ε3 accounted for 54% (n = 136), ε3/ε4 for 26% (n = 65), ε2/ε3 for 11% (n = 28), ε3/ε2 for 6% (n = 14), ε2/ε4 for 2% (n = 4), and ε4/ε4 for 2% (n = 4), representing ε4 and ε2 carrier frequencies of 29% (n = 73) and 18% (n = 46), respectively. Notably, PD subtypes had lower frequencies ε4 (Type I PD = ~26%, Type II PD = ~29%) compared to AD subtypes (Type I AD = ~55%, Type II AD = ~53%, Type III AD = ~57%). In contrast, the proportion of ε2 carriers was similar across PD subtypes (Type I PD, 14%; Type II PD, 18%) and AD subtypes (Type I AD, 9%; Type II AD, 10%; Type III AD, 6%). This is consistent with the well-documented role of the APOE ε4 allele in AD [27].
3.3. Proteomic Signatures Underlying Disease Subtypes Among AD and PD Subjects
3.3.1. Differential Analysis Revealed Perturbed Protein Expression Across AD Subtypes
To identify disease-specific protein expression patterns, each subtype was compared with healthy controls, which showed relatively low levels of APP, tau, and α-synuclein, consistent with the A/T/N classification framework described above. All preprocessing, normalization, and differential expression steps followed established proteomics analysis pipelines, as previously described. Briefly, protein abundances were standardized, technical and biological covariates were adjusted using linear models, and differential expression was assessed using an empirical Bayes method. Significantly differentially expressed proteins were identified after correction for multiple hypothesis testing.
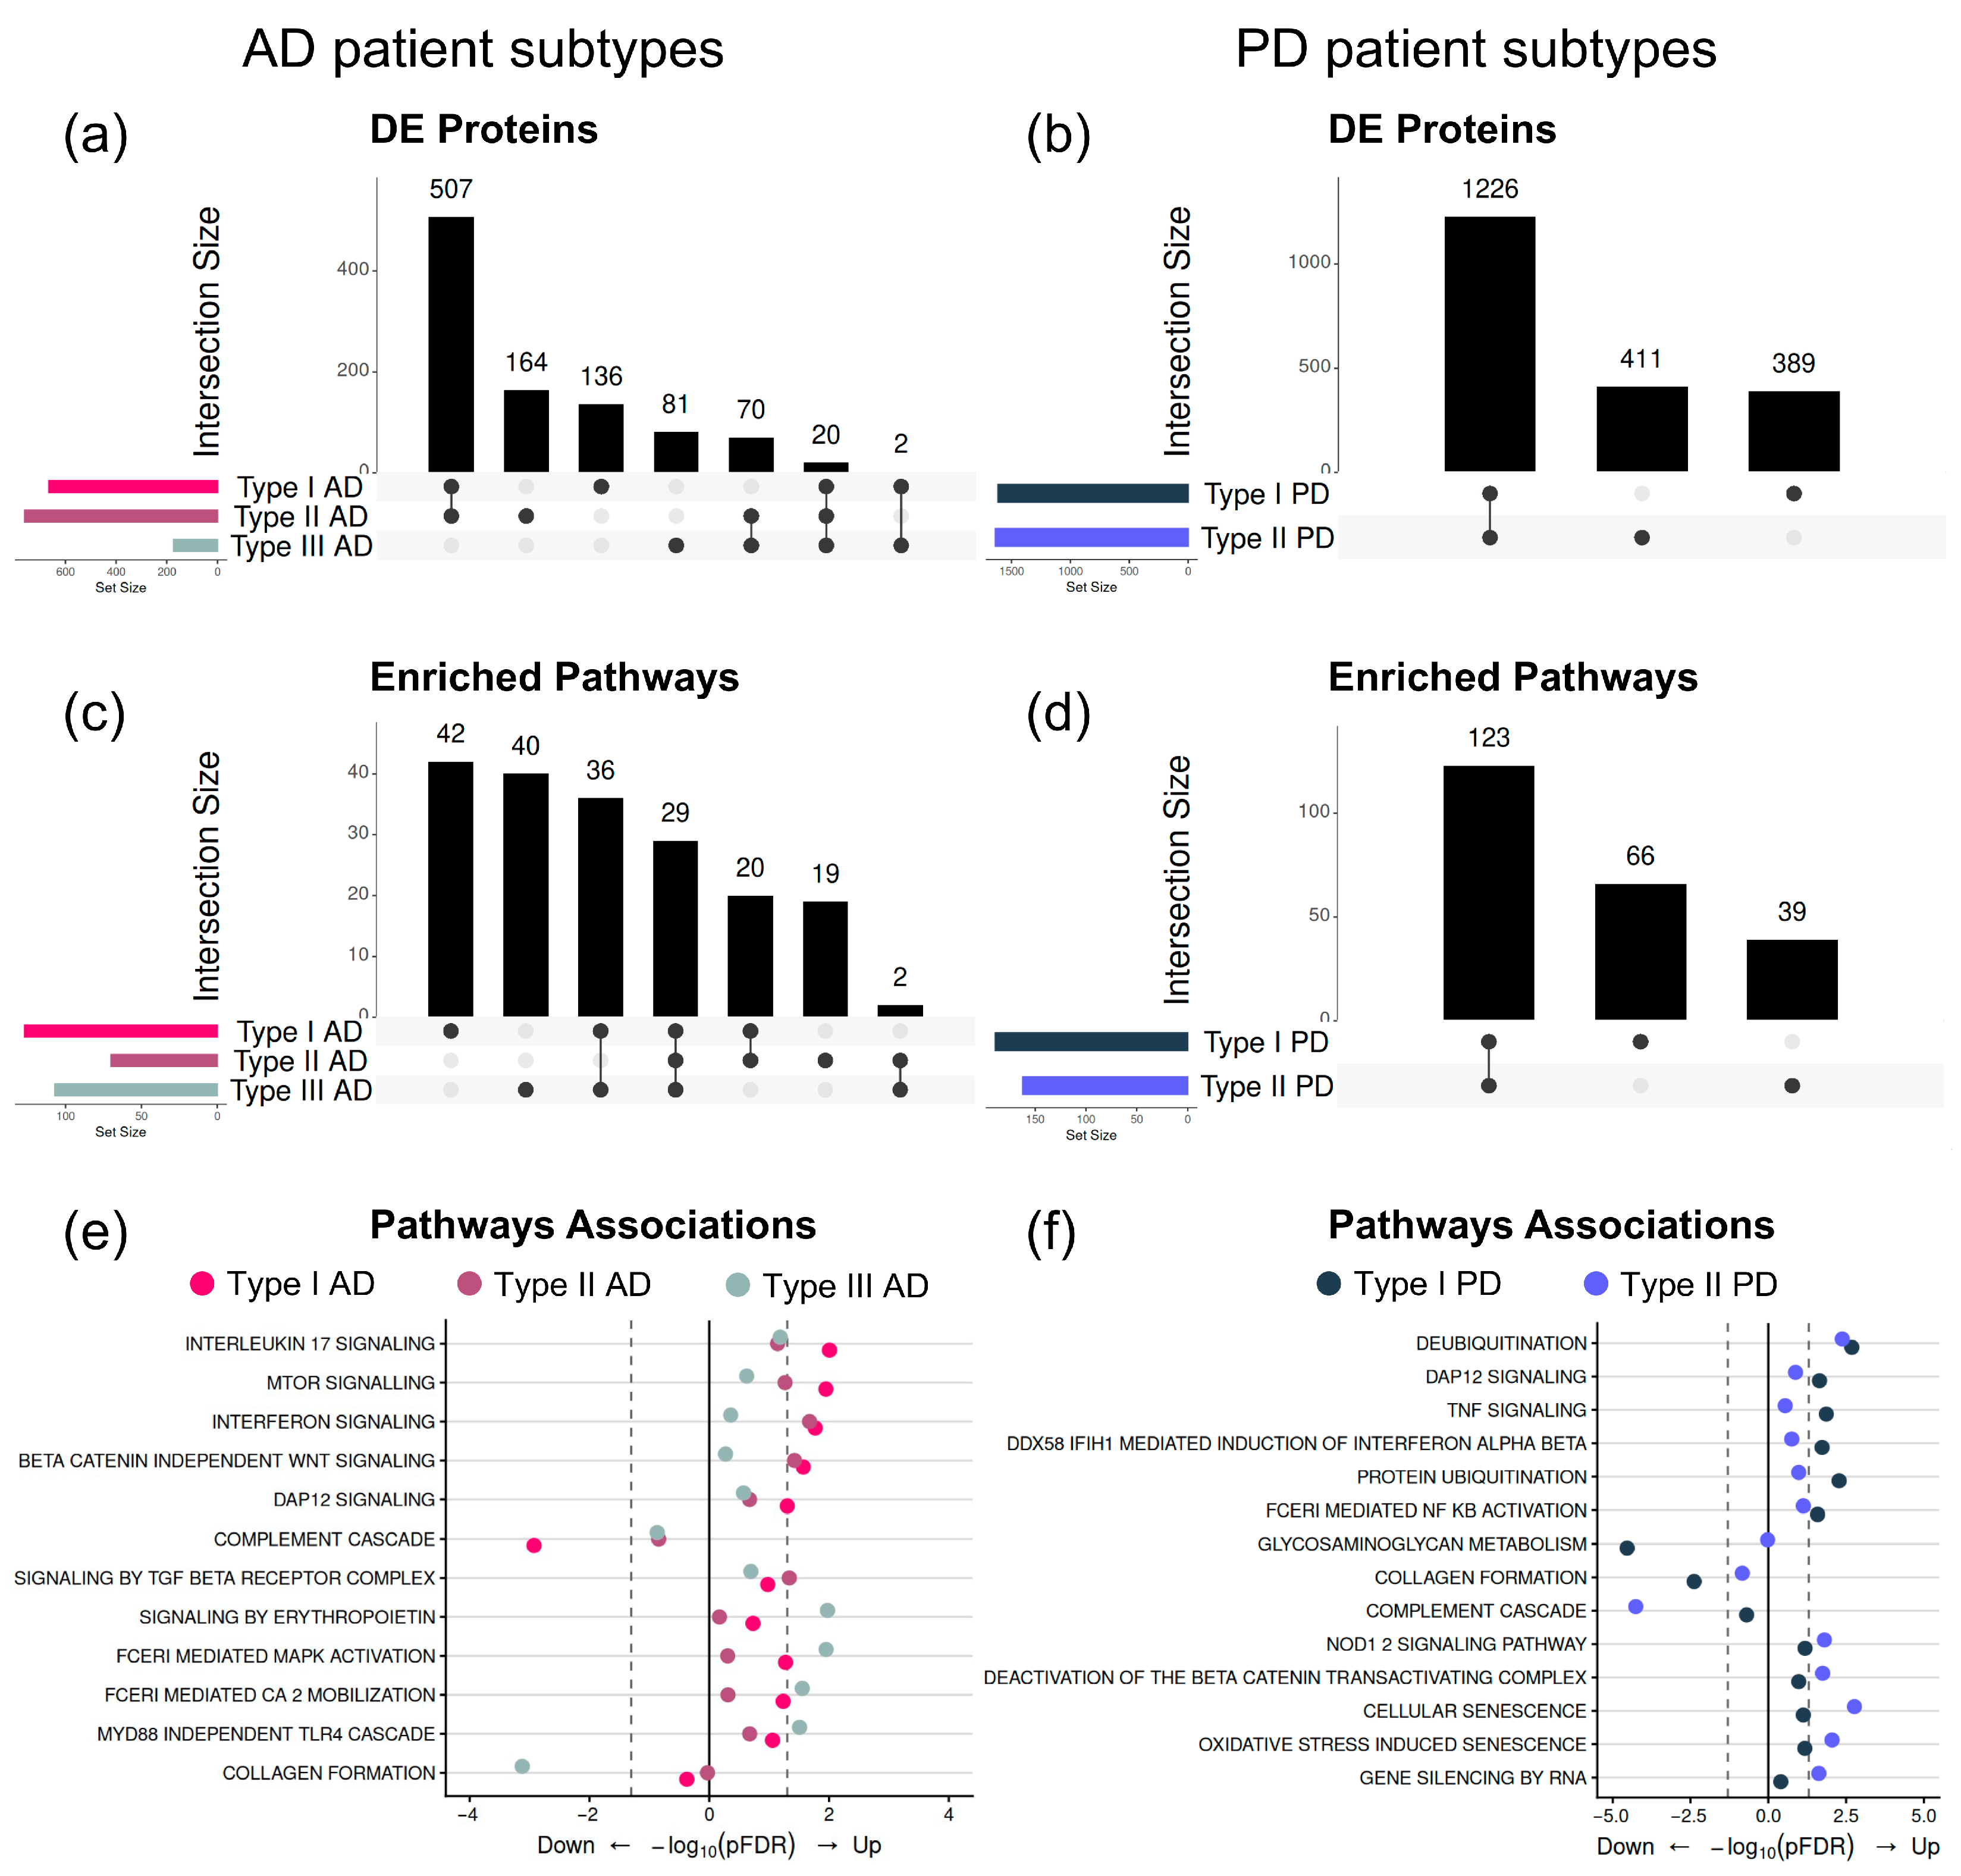
Proteomic analysis revealed differential protein expression patterns for all three AD subtypes. We identified 1238 upregulated and 556 downregulated differentially expressed proteins (DEPs) in Type I AD subjects compared to controls (adjusted p-value < 0.05; Table S1). Among the 1794 DEPs, 665 DEPs had an absolute log2 fold change (log2FC) greater than 0.5 (Figure 2c). Differential expression analysis revealed that Type I AD shared several DE proteins with Type II AD (n = 507), indicating notable overlap between these two subtypes. In contrast, a smaller subset of DEPs was unique to Type I AD (n = 136). Type I AD showed minimal overlap with Type III AD (n = 2), while a relatively smaller group of DEPs was shared across all three AD subtypes (n = 20). Together, these findings indicate that Type I AD is more closely related to Type II AD than to Type III AD. Among the 136 DEPs uniquely expressed in Type I AD, we identified several proteins known to be related to AD, including CAPNS1 [28], GBA [29], GSK3A [30], LRIG3 [31], NCOA7 [32], NMI [33], OMG [34], RHOA [35], S100A2 [36], STAT1 [37], USP14 [38], USP15 [39], and WNT3A [40]. We noted that several DEPs are associated with immune & inflammatory signaling, with a subset of these proteins (STAT1 [41], NMI [42], USP15 [43,44,45]) showing significantly increased levels in Type I AD subjects (Figure 2c). NMI is a co-regulator of STAT1 [46], whereas STAT1 has been reported to be elevated in AD and to function together to amplify interferon-driven inflammatory responses [47].
We also observed changes in proteins involved in the ubiquitin–proteasome system (CAPNS1 [48], USP14 [49], USP15 [49]), as well as in intracellular signaling and kinase pathways (GSK3A [30], RHOA [35], WNT3A [40]). GSK3A contributes to dysregulated kinase activity in AD, leading to hyperphosphorylation of tau [30]. USP15 is a deubiquitinating enzyme that regulates immune and stress response signaling and has been directly implicated in multiple neurodegenerative diseases, including multiple sclerosis [43], Parkinson’s [50,51], and Huntington’s [52].
In Type II AD subjects, we identified 1245 upregulated and 585 downregulated DEPs compared to controls (adjusted p-value < 0.05), with 761 DEPs having an absolute log2FC > 0.5 (Figure 2e). Type II AD subjects expressed 164 distinct DEPs, compared with the other AD subtypes, and shared 70 DEPs with the Type III AD cohort (Figure 3a). The unique list of DEPs included proteins involved in neuronal signaling & synaptic integrity (FRZB [53], OPCML [54], PPP1R1A [55]), cell death & stress signaling (FADD [56], SHC1 [57]). Like Type I AD subjects, we detected upregulation of immune proteins (CASS4 [58], CD7 [59], CD68 [59], MIF [60], NCF2 [61]) in Type II AD subjects. Notably, CASS4 is a replicated, late-onset AD risk factor identified in extensive genome-wide association studies [58], whereas DNM1L is associated with mitochondrial health [62]. Downregulation of DNM1L in Type II AD indicates mitochondrial dysfunction, a hallmark of AD [63]. We also observed upregulation of USP15 in Type II AD subjects, suggesting a consistent role in AD subtypes with immune and mitochondrial dysfunction.
Figure 3.
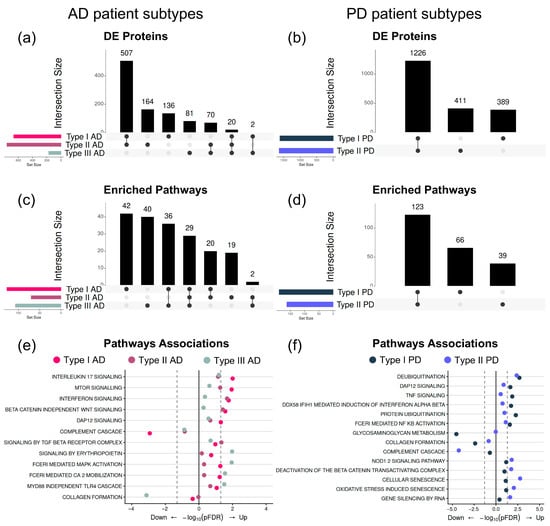
Alzheimer’s and Parkinson’s subtypes have unique molecular signatures at the gene and pathway level. (a,b) UpSet plots summarizing overlap and subtype-specific differentially expressed proteins (DEPs) among AD subtypes (Type I–III) and PD subtypes (Type I–II), respectively. Bar heights indicate intersection sizes. (c,d) UpSet plots showing overlap of significantly enriched pathways across AD and PD subtypes. (e,f) Dot plots illustrating subtype-specific pathway associations for AD and PD, respectively. Dots represent enriched pathways, colored by subtype; position along the x-axis indicates direction and strength of enrichment (−log10 FDR), with dashed lines denoting significance thresholds.
In the Type III AD cohort, we detected 933 and 296 DEPs compared to controls (adjusted p-value < 0.05). These DEPs consisted of 173 proteins with absolute log2FC > 0.5 (Figure 2g). We noted 81 uniquely expressed proteins (Figure 3a) that are primarily involved in neuronal signaling & synaptic integrity (ST3GAL1 [64], ST6GAL2 [65], EPHB2 [66], FGFR3 [67], LEP [68]). EPHB2 stabilizes NMDA receptors and is a well-established factor in AD-related cognitive decline [66]. Rescue of EPHB2 restores synaptic and memory deficits in AD animal models. Downregulation of these Type III AD proteins suggests a significant compromise in neuronal function. The lack of overlap between Type I and II AD indicates a unique disease mechanism in Type III AD subjects.
3.3.2. Differences Observed in the Proteomic Profiles of PD Subtypes
Proteomic analysis detected differential protein expression profiles in both PD subtypes. We identified 1498 upregulated and 611 downregulated DEPs in Type I PD subjects compared to controls (adjusted p-value < 0.05), with 1615 proteins with absolute log2FC > 0.5 (Figure 2d). Type I PD subjects expressed 389 unique DEPs, compared with the Type II PD cohort, and shared 1226 DEPs with the Type II PD subjects (Figure 3b). Among the 389 non-overlapping DEPs, we identified upregulated proteins that play roles in immune & inflammatory signaling (PIK3CG [69], TGFB1 [70], HDAC8 [71], USP15) and signal transduction & kinase regulation (PTPN1 [72], SPHK2 [73]). Like Type I and Type II AD, USP15 is also upregulated in Type I PD, suggesting consistency in neurodegenerative-related inflammation. In contrast, we detected downregulated DEPs involved in synaptic signaling & integrity (NTRK2/TrkB [74], EPHA4, NRXN3A [75], NRXN3B [75]), axon guidance & neuronal connectivity (CNTN1) [76], and neuronal support (GAS6) [77]. Like AD, EPHA4 has also been linked to PD pathogenesis [78]. Notably, EPHA4 was shown to be a predictive marker in CSF from PD subjects compared with controls, further enhancing its potential translational role as a plasma biomarker for Type I PD.
In Type II PD subjects, we detected 1453 upregulated and 877 downregulated DEPs. A subset of the DEPs (n = 1637) had an absolute log2FC > 0.5 (Figure 2f). Comparative analysis revealed 411 unique DEPs in Type II PD subjects compared to 1226 DEPs shared with the Type I PD cohort (Figure 3b). Within the 411 unique DEPs, several upregulated proteins are involved in immune activation & cytoskeletal remodeling (WAS [79], S100A4 [80], USP15) and oxidative stress & autophagy (GPX1 [81], ATG5 [82], SELENOF [83]). We found multiple downregulated DEPs that play roles in mitochondrial function (NDUFB4 [84]) and synaptic function & neuronal integrity (FMR1 [85], PAK3 [86]). CX3CL1, which is down in Type II PD, is known to suppress microglia-driven inflammation [87]. RGS4 is a vital pathway protein involved in dopamine and GPCR signaling [88], whereas NDUFB4 is a part of the mitochondrial Complex I, a canonical PD mechanism [84]. Linked to neuroinflammation, S100A4 has previously been reported as a candidate biomarker associated with PD diagnosis [80].
3.3.3. Pathway Analysis Reveals Distinct Biological Pathways Among AD Subtypes
We next investigated the effects of subtype-specific proteomic changes on key biological pathways and processes. Pathway enrichment analysis was performed using gene set enrichment analysis against the Reactome pathway library. Differential protein signatures for each AD subtype were ranked and tested for pathway-level changes, with statistical significance defined by false discovery rate correction. A comparative analysis was employed to identify shared and subtype-specific pathways across AD subtypes.
Pathway enrichment analysis revealed both shared and subtype-specific biological pathways and processes across the three AD subtypes (Figure 3c). We observed that the AD subtypes exhibit distinct mechanisms within disease pathways. Type I AD showed 42 pathways that were uniquely enriched (adjusted p-value < 0.05), suggesting heightened or more diverse pathway perturbation. Type III AD displayed 40 unique pathways (adjusted p-value < 0.05), whereas Type II AD demonstrated a smaller set of 19 subtype-specific pathways (adjusted p-value < 0.05), indicating comparatively more restricted biological deviation. Notably, a small number of pathways (n = 2) were exclusively shared between Type II and Type III AD (adjusted p-value < 0.05), underscoring a subtle divergence between these subtypes.
In Type I AD, we observed a positive enrichment of the Interleukin-17 (IL-17) and MTOR signaling cascades (Figure 3e). Plasma taken from AD patients reportedly shows increased levels of IL-17, a proinflammatory cytokine shown to potentiate cognitive impairment in AD animal models, including APP/PS1 and 3xTgAD mice [89,90,91]. Similarly, MTOR has been extensively shown to be dysregulated in AD and is likely to contribute to impaired autophagy, abnormal protein aggregation (Amyloid-β and tau), and synaptic dysfunction [92,93,94,95]. We also observed a negative enrichment of the complement cascade signaling in Type I AD. While the complement cascade complex is a major contributor to neuroinflammation and neurodegeneration, chronic activation can lead to depletion of complement proteins in the CSF and plasma of AD patients [96,97]. In Type II AD, we noted positive enrichment of the TGF-β signaling cascade (Figure 3e). This is consistent with previous studies showing sustained activation of the TGF-β pathway in AD, exacerbating chronic neuroinflammation [98]. In Type III AD, pathway analysis revealed upregulation of the MAP kinase (MAPK) and Calcium (Ca2+) signaling pathways, more closely related to the calcium hypothesis of AD than in Type I and Type II AD (Figure 3e). The calcium signaling hypothesis has been well-described and is supported by studies demonstrating that disruption of calcium homeostasis leads to autophagy dysfunction [99]. We observed enhanced TLR4 signaling in Type III AD subjects. This is consistent with evidence showing that aging primes neurons for TLR4-dependent Ca2+ dysregulation, which is further amplified by amyloid-β in Alzheimer’s disease [100]. Analysis showed that Type III AD subjects had upregulated signaling. Previous studies have demonstrated that erythropoietin is a compensatory and protective factor in AD [101], suggesting that Type III AD individuals may have inherent neuroprotective mechanisms absent in Type I and II AD subjects.
We also identified multiple shared enriched pathways, suggesting convergence on several disease mechanisms despite molecular heterogeneity. In total, 36 pathways were shared between Type I and Type III AD, 20 between Type I and Type II AD, and 29 were jointly enriched across all three subtypes (adjusted p-value < 0.05), highlighting a conserved set of biological processes that may reflect fundamental features of AD pathophysiology. These shared pathways were predominantly related to immune activation, inflammatory signaling, extracellular matrix organization, and cellular stress responses, consistent with widespread dysregulation of immune signaling across AD subtypes. We noted upregulation of non-canonical WNT signaling (independent of β-catenin) and interferon signaling in Type I and Type II AD, but not in Type III AD (Figure 3e). Enrichment of interferon signaling is consistent with the lack of upregulation of DUB enzymes like USP15 in Type III AD (Figure 2g), but with higher levels of USP15 in Type I and Type II AD (Figure 2c,e).
Collectively, these results demonstrate that AD subtypes are characterized by a combination of shared and distinct disease mechanisms, supporting a model in which common elements coexist across the AD continuum.
3.3.4. Subtype-Specific Pathway Associations Identified in PD Patients
We observed both shared and subtype-specific biological pathways and processes in Type I and Type II PD (Figure 3d). Type I PD had 66 distinct pathways, whereas Type II PD had 36 subtype-specific pathways (adjusted p-value < 0.05). In Type I PD individuals, we found increased enrichment of neuroinflammatory pathways, including TNF signaling, NF-κB signaling, and the interferon α/β cascade (Figure 3f). It has been widely shown that TNF activation directly potentiates downstream activators, such as NF-κB, in PD [102]. Interferon signaling also plays a vital role in driving proinflammatory responses in PD pathogenesis [103]. We also noted upregulation of DAP12 signaling in Type I AD. DAP12, also known as TYROBP, is a transmembrane adaptor protein that forms complexes with proteins such as TREM1 to drive inflammation [104]. Pathway analysis also revealed pathways uniquely enriched in Type II PD, including NOD1/2 signaling, oxidative stress-induced senescence, and RNA-related gene silencing. Previous studies have shown upregulation of NOD1/2 in blood samples of PD patients [105], and NOD2 is linked to neuroinflammation in PD [72]. Cellular senescence is emerging as a potential component of PD pathogenesis [106]. Enrichment analysis also revealed an overlap of 123 pathways between Type I and Type II PD, including a significant increase in deubiquination (Figure 3f). As in the AD subtypes, this observation is consistent with increased expression of DUBs, such as USP15 (Figure 2d,f).
4. Discussion
In this study, we investigated whether heterogeneity could be captured in the proteomic profiles of AD and PD patients. Clustering analyses not only confirmed multiple subtypes for both disorders but also replicated disease mechanisms previously seen in neurodegeneration. These mechanisms included elevated inflammation, calcium dysregulation, and mitochondrial dysfunction across different molecular subtypes. For example, we observed consistent upregulation of proteins involved in interferon signaling and autophagy, accompanied by increased expression of DUBs, such as USP14 and USP15.
Similarly, S100A4 and CAPNS1 were both upregulated, but in separate disease subtypes (Type II PD and Type I AD, respectively), suggesting they could be explored as novel targets or predictive markers. In AD, CAPNS1 is positively correlated with cortical amyloid-β and GSK3 [107]. Here, we showed that CAPNS1 is uniquely expressed in Type I AD, along with elevated GSK3. In contrast, GBA is downregulated in Type I AD. This is consistent with lower GBA levels in the CSF of the recently identified AD Subtype 2, [19]. As in Type I AD, we also observed significant upregulation of CAPNS1 in Subtype 2 [19]. Subtype 2 AD patients were characterized by enhanced innate immune activation. Likewise, we observed significant inflammation in Type I AD, drawing parallels between the plasma and CSF proteomic studies and supporting future efforts to perform more extensive, comparative meta-analyses.
Consistent with these molecular distinctions, clinical measures showed subtype-specific differences in AD, with similar MMSE scores but divergent CDR profiles, whereas clinical differentiation across PD subtypes was more modest, reflecting both biological heterogeneity and limited PD-specific clinical annotation (Unified Parkinson’s Disease Rating Scale scores). Together, these findings highlight the need for future studies combining deep molecular profiling with richer longitudinal and clinical phenotyping to fully resolve the clinical relevance of proteomic disease subtypes.
In our PD cohort, we did not observe significant correlations between tau and markers of APP or α-synuclein. This is consistent with prior studies indicating that changes in tau expression in PD are highly variable and may reflect secondary or partially independent pathological processes, rather than being directly coupled to amyloid or α-synuclein pathways as in AD. In contrast to AD, where amyloid-β and tau biomarkers are tightly linked, tau alterations in PD are more heterogeneous and may reflect secondary or partially independent pathological processes. Multiple CSF and plasma studies in PD cohorts have reported weak or absent correlations between α-synuclein and tau biomarkers. For example, CSF α-synuclein levels do not correlate with tau and are independently associated with PD [108]. Similarly, plasma amyloid-β and phosphorylated tau levels are strongly correlated in AD but show no significant association in PD [109].
Follow-up studies may include establishing a strong correlation between plasma changes shown here and protein expression in the CSF of AD and PD patients, as well as tracking robust markers over disease progression. Because all signatures were derived from plasma, they reflect plasma-specific and potentially systemic biology rather than direct CSF pathology and may therefore be influenced by comorbidities common in older populations. Integrating CSF measurements and richer clinical annotation will be essential to disentangle disease-specific from confounding effects. We also support future efforts to explore similarities between AD and PD. Here, we show unique but adjacent molecular mechanisms in both disorders, including multiple pathways and processes involved in inflammation. And while these findings may enhance the identification of novel disease targets, they also provide a unique opportunity to develop invaluable time-dependent biomarkers for disease subtypes and set the framework for ushering in an era of precision medicine for two of the most common neurological disorders.
5. Conclusions
Large-scale plasma proteomics revealed that both AD and PD are composed of distinct molecular subtypes characterized by shared yet divergent inflammatory, synaptic, and metabolic pathways. These subtype-specific signatures align with differences in clinical measures, particularly in AD, and highlight convergent mechanisms such as immune activation alongside subtype-restricted biology that may inform targeted intervention strategies. Together, our findings support a precision medicine framework in which molecular stratification can guide biomarker development, patient selection, and the rational design of future disease-modifying therapies across the neurodegenerative continuum.
Supplementary Materials
The following supporting information can be downloaded at: https://www.mdpi.com/article/10.3390/jdad3020017/s1, Table S1: List of DEPs and pathway analysis data.
Author Contributions
This work was a collaborative effort amongst all authors. Y.C., A.L., M.N.K., and J.R. wrote parts of the manuscript. All authors assisted in editing the paper and contributed to the structure of this project and provided critical references. All authors have read and agreed to the published version of the manuscript.
Funding
The authors acknowledge the financial support from the Alzheimer’s Disease Data Initiative. Jermaine Ross is an employee of Alleo Labs and has received a research grant from the Alzheimer’s Disease Data Initiative as a William H. Gates Sr. fellow.
Institutional Review Board Statement
Not applicable.
Informed Consent Statement
Not applicable.
Data Availability Statement
The GNPC v1 data is publicly available for request via the AD Data Initiative. Members of the global research community can request free data access via the Alzheimer’s Disease Discovery Portal (https://discover.alzheimersdata.org/). Access is contingent upon adherence to the GNPC Data Use Agreement and the Publication Policies.
Conflicts of Interest
Y.C., A.L., M.N.K., and J.R. are employed by Alleo Labs Corporation. All authors declare that the research was conducted in the absence of any commercial or financial relationships that could be construed as potential conflicts of interest.
Abbreviations
The following abbreviations are used in this manuscript:
| A/T/N | Amyloid/Tau/Neurodegeneration |
| AD | Alzheimer’s disease |
| ALS | Amyotrophic lateral sclerosis |
| APP | Amyloid precursor protein |
| BBB | Blood–brain barrier |
| BH | Benjamini–Hochberg |
| Ca2+ | Calcium ion |
| CDR | Clinical Dementia Rating |
| CSF | Cerebrospinal fluid |
| DEPs | Differentially expressed proteins |
| DLB | Dementia with Lewy bodies |
| DUB | Deubiquitinating enzyme |
| FDR | False discovery rate |
| FTD | Frontotemporal dementia |
| GNPC | Global Neurological Proteomics Consortium |
| GSEA | Gene set enrichment analysis |
| log2FC | Log2 fold change |
| PCA | Principal component analysis |
| PD | Parkinson’s disease |
| PDD | Parkinson’s disease dementia |
| RNA-seq | RNA sequencing |
| VD | Vascular dementia |
References
- Jellinger, K.A. Recent Update on the Heterogeneity of the Alzheimer’s Disease Spectrum. J. Neural Transm. 2022, 129, 1–24. [Google Scholar] [CrossRef] [Scilit]
- Avelar-Pereira, B.; Belloy, M.E.; O’Hara, R.; Hosseini, S.M.H.; Alzheimer’s Disease Neuroimaging Initiative. Decoding the Heterogeneity of Alzheimer’s Disease Diagnosis and Progression Using Multilayer Networks. Mol. Psychiatry 2023, 28, 2423–2432. [Google Scholar] [CrossRef] [Scilit]
- Tijms, B.M.; Vromen, E.M.; Mjaavatten, O.; Holstege, H.; Reus, L.M.; van der Lee, S.; Wesenhagen, K.E.; Lorenzini, L.; Vermunt, L.; Venkatraghavan, V.; et al. Large-Scale Cerebrospinal Fluid Proteomic Analysis in Alzheimer’s Disease Patients Reveals Five Molecular Subtypes with Distinct Genetic Risk Profiles. medRxiv 2023. [Google Scholar] [CrossRef] [Scilit]
- Ferreira, D.; Pereira, J.B.; Volpe, G.; Westman, E. Subtypes of Alzheimer’s Disease Display Distinct Network Abnormalities Extending Beyond Their Pattern of Brain Atrophy. Front. Neurol. 2019, 10, 524. [Google Scholar] [CrossRef] [Scilit]
- Eshima, J.; O’Connor, S.A.; Marschall, E.; NYGC ALS Consortium; Bowser, R.; Plaisier, C.L.; Smith, B.S. Molecular Subtypes of ALS Are Associated with Differences in Patient Prognosis. Nat. Commun. 2023, 14, 95. [Google Scholar] [CrossRef] [Scilit] [PubMed]
- Greenland, J.C.; Williams-Gray, C.H.; Barker, R.A. The Clinical Heterogeneity of Parkinson’s Disease and Its Therapeutic Implications. Eur. J. Neurosci. 2019, 49, 328–338. [Google Scholar] [CrossRef] [Scilit] [PubMed]
- Schalkamp, A.-K.; Rahman, N.; Monzón-Sandoval, J.; Sandor, C. Deep Phenotyping for Precision Medicine in Parkinson’s Disease. Dis. Model. Mech. 2022, 15, dmm049376. [Google Scholar] [CrossRef] [Scilit] [PubMed]
- Cha, Y.; Kagalwala, M.N.; Ross, J. Navigating the Frontiers of Machine Learning in Neurodegenerative Disease Therapeutics. Pharmaceuticals 2024, 17, 158. [Google Scholar] [CrossRef] [Scilit]
- Wang, S.; Jiang, Y.; Yang, A.; Meng, F.; Zhang, J. The Expanding Burden of Neurodegenerative Diseases: An Unmet Medical and Social Need. Aging Dis. 2024, 16, 2937–2952. [Google Scholar] [CrossRef] [Scilit]
- Gomperts, S.N. Lewy Body Dementias: Dementia with Lewy Bodies and Parkinson Disease Dementia. Continuum 2016, 22, 435–463. [Google Scholar] [CrossRef] [Scilit]
- Knopman, D.S.; Petersen, R.C.; Jack, C.R. A Brief History of “Alzheimer Disease”. Neurology 2019, 92, 1053–1059. [Google Scholar] [CrossRef] [Scilit]
- Sengupta, U.; Kayed, R. Amyloid β, Tau, and α-Synuclein Aggregates in the Pathogenesis, Prognosis, and Therapeutics for Neurodegenerative Diseases. Prog. Neurobiol. 2022, 214, 102270. [Google Scholar] [CrossRef] [Scilit]
- Jack, C.R.; Bennett, D.A.; Blennow, K.; Carrillo, M.C.; Feldman, H.H.; Frisoni, G.B.; Hampel, H.; Jagust, W.J.; Johnson, K.A.; Knopman, D.S.; et al. A/T/N: An Unbiased Descriptive Classification Scheme for Alzheimer Disease Biomarkers. Neurology 2016, 87, 539–547. [Google Scholar] [CrossRef] [Scilit]
- Altomare, D.; de Wilde, A.; Ossenkoppele, R.; Pelkmans, W.; Bouwman, F.; Groot, C.; van Maurik, I.; Zwan, M.; Yaqub, M.; Barkhof, F.; et al. Applying the ATN Scheme in a Memory Clinic Population: The ABIDE Project. Neurology 2019, 93, e1635–e1646. [Google Scholar] [CrossRef] [Scilit] [PubMed]
- Tan, M.-S.; Ji, X.; Li, J.-Q.; Xu, W.; Wang, H.-F.; Tan, C.-C.; Dong, Q.; Zuo, C.-T.; Tan, L.; Suckling, J.; et al. Longitudinal Trajectories of Alzheimer’s ATN Biomarkers in Elderly Persons without Dementia. Alzheimer’s Res. Ther. 2020, 12, 55. [Google Scholar] [CrossRef] [Scilit]
- Roe, C.M.; Babulal, G.M.; Stout, S.H.; Ott, B.R.; Carr, D.B.; Williams, M.M.; Benzinger, T.L.S.; Fagan, A.M.; Holtzman, D.M.; Ances, B.M.; et al. Using the A/T/N Framework to Examine Driving in Preclinical AD. Geriatrics 2018, 3, 23. [Google Scholar] [CrossRef] [Scilit]
- Su, C.; Hou, Y.; Xu, J.; Xu, Z.; Zhou, M.; Ke, A.; Li, H.; Xu, J.; Brendel, M.; Maasch, J.R.M.A.; et al. Identification of Parkinson’s Disease PACE Subtypes and Repurposing Treatments through Integrative Analyses of Multimodal Data. npj Digit. Med. 2024, 7, 184. [Google Scholar] [CrossRef] [Scilit]
- Tijms, B.M.; Gobom, J.; Teunissen, C.; Dobricic, V.; Tsolaki, M.; Verhey, F.; Popp, J.; Martinez-Lage, P.; Vandenberghe, R.; Lleó, A.; et al. CSF Proteomic Alzheimer’s Disease-Predictive Subtypes in Cognitively Intact Amyloid Negative Individuals. Proteomes 2021, 9, 36. [Google Scholar] [CrossRef] [Scilit] [PubMed]
- Tijms, B.M.; Vromen, E.M.; Mjaavatten, O.; Holstege, H.; Reus, L.M.; van der Lee, S.; Wesenhagen, K.E.J.; Lorenzini, L.; Vermunt, L.; Venkatraghavan, V.; et al. Cerebrospinal Fluid Proteomics in Patients with Alzheimer’s Disease Reveals Five Molecular Subtypes with Distinct Genetic Risk Profiles. Nat. Aging 2024, 4, 33–47. [Google Scholar] [CrossRef] [Scilit]
- Neff, R.A.; Wang, M.; Vatansever, S.; Guo, L.; Ming, C.; Wang, Q.; Wang, E.; Horgusluoglu-Moloch, E.; Song, W.-M.; Li, A.; et al. Molecular Subtyping of Alzheimer’s Disease Using RNA Sequencing Data Reveals Novel Mechanisms and Targets. Sci. Adv. 2021, 7, eabb5398. [Google Scholar] [CrossRef] [Scilit]
- McHugh, C.P.; Clement, M.H.S.; Phatak, M. AD Workbench: Transforming Alzheimer’s Research with Secure, Global, and Collaborative Data Sharing and Analysis. Alzheimer’s Dement. 2025, 21, e70278. [Google Scholar] [CrossRef] [Scilit] [PubMed]
- Imam, F.; Saloner, R.; Vogel, J.W.; Krish, V.; Abdel-Azim, G.; Ali, M.; An, L.; Anastasi, F.; Bennett, D.; Pichet Binette, A.; et al. The Global Neurodegeneration Proteomics Consortium: Biomarker and Drug Target Discovery for Common Neurodegenerative Diseases and Aging. Nat. Med. 2025, 31, 2556–2566. [Google Scholar] [CrossRef] [Scilit] [PubMed]
- Brothers, J.F.; Ung, M.; Escalante-Chong, R.; Ross, J.; Zhang, J.; Cha, Y.; Lysaght, A.; Funt, J.; Kusko, R. Integrity, Standards, and QC-Related Issues with Big Data in Pre-Clinical Drug Discovery. Biochem. Pharmacol. 2018, 152, 84–93. [Google Scholar] [CrossRef] [Scilit] [PubMed]
- Limma. Available online: http://bioconductor.org/packages/limma/ (accessed on 31 December 2025).
- Conway, J.R.; Lex, A.; Gehlenborg, N. UpSetR: An R Package for the Visualization of Intersecting Sets and Their Properties. Bioinformatics 2017, 33, 2938–2940. [Google Scholar] [CrossRef] [Scilit]
- Igordot Msigdbr/DESCRIPTION at Main Igordot/Msigdbr. Available online: https://github.com/igordot/msigdbr/blob/main/DESCRIPTION (accessed on 31 December 2025).
- Troutwine, B.R.; Hamid, L.; Lysaker, C.R.; Strope, T.A.; Wilkins, H.M. Apolipoprotein E and Alzheimer’s Disease. Acta Pharm. Sin. B 2022, 12, 496–510. [Google Scholar] [CrossRef] [Scilit]
- Mahaman, Y.A.R.; Huang, F.; Kessete Afewerky, H.; Maibouge, T.M.S.; Ghose, B.; Wang, X. Involvement of Calpain in the Neuropathogenesis of Alzheimer’s Disease. Med. Res. Rev. 2019, 39, 608–630. [Google Scholar] [CrossRef] [Scilit]
- GBA and APOE Ε4 Associate with Sporadic Dementia with Lewy Bodies in European Genome Wide Association Study—PubMed. Available online: https://pubmed.ncbi.nlm.nih.gov/31065058/ (accessed on 31 December 2025).
- Hooper, C.; Killick, R.; Lovestone, S. The GSK3 Hypothesis of Alzheimer’s Disease. J. Neurochem. 2008, 104, 1433–1439. [Google Scholar] [CrossRef] [Scilit]
- Seto, M.; Clifton, M.; Gomez, M.L.; Coughlan, G.; Gifford, K.A.; Jefferson, A.L.; De Jager, P.L.; Bennett, D.A.; Wang, Y.; Barnes, L.L.; et al. Sex-Specific Associations of Gene Expression with Alzheimer’s Disease Neuropathology and Ante-Mortem Cognitive Performance. Nat. Commun. 2025, 16, 9466. [Google Scholar] [CrossRef] [Scilit]
- Yang, C.; Cook, N.; Reid, D.M.; Belloy, M.E. Genetic Pleiotropy Across Hormone-Related Traits and Alzheimer’s Disease Reveals Sex-Specific Relationships and Risk Genes. Alzheimer’s Dement. 2025, 21, e103719. [Google Scholar] [CrossRef] [Scilit]
- Romito-DiGiacomo, R.R.; Menegay, H.; Cicero, S.A.; Herrup, K. Effects of Alzheimer’s Disease on Different Cortical Layers: The Role of Intrinsic Differences in Abeta Susceptibility. J. Neurosci. 2007, 27, 8496–8504. [Google Scholar] [CrossRef] [Scilit]
- Remnestål, J.; Bergström, S.; Olofsson, J.; Sjöstedt, E.; Uhlén, M.; Blennow, K.; Zetterberg, H.; Zettergren, A.; Kern, S.; Skoog, I.; et al. Association of CSF Proteins with Tau and Amyloid β Levels in Asymptomatic 70-Year-Olds. Alzheimer’s Res. Ther. 2021, 13, 54. [Google Scholar] [CrossRef] [Scilit]
- Cai, R.; Wang, Y.; Huang, Z.; Zou, Q.; Pu, Y.; Yu, C.; Cai, Z. Role of RhoA/ROCK Signaling in Alzheimer’s Disease. Behav. Brain Res. 2021, 414, 113481. [Google Scholar] [CrossRef] [Scilit]
- Cristóvão, J.S.; Gomes, C.M. S100 Proteins in Alzheimer’s Disease. Front. Neurosci. 2019, 13, 463. [Google Scholar] [CrossRef] [Scilit]
- Hsu, W.-L.; Ma, Y.-L.; Hsieh, D.-Y.; Liu, Y.-C.; Lee, E.H. STAT1 Negatively Regulates Spatial Memory Formation and Mediates the Memory-Impairing Effect of Aβ. Neuropsychopharmacology 2014, 39, 746–758. [Google Scholar] [CrossRef] [Scilit]
- Lee, J.H.; Shin, S.K.; Jiang, Y.; Choi, W.H.; Hong, C.; Kim, D.-E.; Lee, M.J. Facilitated Tau Degradation by USP14 Aptamers via Enhanced Proteasome Activity. Sci. Rep. 2015, 5, 10757. [Google Scholar] [CrossRef] [Scilit]
- de Sousa, D.M.B.; Poupardin, R.; Villeda, S.A.; Schroer, A.B.; Fröhlich, T.; Frey, V.; Staffen, W.; Mrowetz, H.; Altendorfer, B.; Unger, M.S.; et al. The Platelet Transcriptome and Proteome in Alzheimer’s Disease and Aging: An Exploratory Cross-Sectional Study. Front. Mol. Biosci. 2023, 10, 1196083. [Google Scholar] [CrossRef] [Scilit]
- Kostes, W.W.; Brafman, D.A. The Multifaceted Role of WNT Signaling in Alzheimer’s Disease Onset and Age-Related Progression. Cells 2023, 12, 1204. [Google Scholar] [CrossRef] [Scilit]
- Valiukas, Z.; Tangalakis, K.; Apostolopoulos, V.; Feehan, J. Microglial Activation States and Their Implications for Alzheimer’s Disease. J. Prev. Alzheimer’s Dis. 2025, 12, 100013. [Google Scholar] [CrossRef] [Scilit]
- Jing, X.; Yao, Y.; Wu, D.; Hong, H.; Feng, X.; Xu, N.; Liu, Y.; Liang, H. IFP35 Family Proteins Promote Neuroinflammation and Multiple Sclerosis. Proc. Natl. Acad. Sci. USA 2021, 118, e2102642118. [Google Scholar] [CrossRef] [Scilit] [PubMed]
- Torre, S.; Polyak, M.J.; Langlais, D.; Fodil, N.; Kennedy, J.M.; Radovanovic, I.; Berghout, J.; Leiva-Torres, G.A.; Krawczyk, C.M.; Ilangumaran, S.; et al. USP15 Regulates Type I Interferon Response and Is Required for Pathogenesis of Neuroinflammation. Nat. Immunol. 2017, 18, 54–63. [Google Scholar] [CrossRef] [Scilit] [PubMed]
- Zhou, Q.; Cheng, C.; Wei, Y.; Yang, J.; Zhou, W.; Song, Q.; Ke, M.; Yan, W.; Zheng, L.; Zhang, Y.; et al. USP15 Potentiates NF-κB Activation by Differentially Stabilizing TAB2 and TAB3. FEBS J. 2020, 287, 3165–3183. [Google Scholar] [CrossRef] [Scilit]
- Georges, A.; Gros, P.; Fodil, N. USP15: A Review of Its Implication in Immune and Inflammatory Processes and Tumor Progression. Genes. Immun. 2021, 22, 12–23. [Google Scholar] [CrossRef] [Scilit]
- Zhu, M.; John, S.; Berg, M.; Leonard, W.J. Functional Association of Nmi with Stat5 and Stat1 in IL-2- and IFN γ-Mediated Signaling. Cell 1999, 96, 121–130. [Google Scholar] [CrossRef] [Scilit]
- Li, X.; Hong, X.; Wang, Y.; Zhang, S.; Zhang, J.; Li, X.; Liu, Y.; Sun, D.; Feng, Q.; Ye, J.; et al. Tau Accumulation Triggers STAT1-Dependent Memory Deficits by Suppressing NMDA Receptor Expression. EMBO Rep. 2019, 20, e47202. [Google Scholar] [CrossRef] [Scilit] [PubMed]
- Gan-Or, Z.; Rouleau, G.A. Calpain 1 in Neurodegeneration: A Therapeutic Target? Lancet Neurol. 2016, 15, 1118. [Google Scholar] [CrossRef] [Scilit] [PubMed]
- Qin, B.; Chen, X.; Wang, F.; Wang, Y. DUBs in Alzheimer’s Disease: Mechanisms and Therapeutic Implications. Cell Death Discov. 2024, 10, 475. [Google Scholar] [CrossRef] [Scilit]
- Cornelissen, T.; Haddad, D.; Wauters, F.; Van Humbeeck, C.; Mandemakers, W.; Koentjoro, B.; Sue, C.; Gevaert, K.; De Strooper, B.; Verstreken, P.; et al. The Deubiquitinase USP15 Antagonizes Parkin-Mediated Mitochondrial Ubiquitination and Mitophagy. Hum. Mol. Genet. 2014, 23, 5227–5242. [Google Scholar] [CrossRef] [Scilit]
- Wu, X.; Wen, Y.; Yuan, Y.; Bai, T.; Yang, N.; Xu, L.; Ma, Y.; Su, P.; Luo, W.; Li, W. The AKT-USP15 Axis Modulates Autophagy in MPP+-Induced Parkinson’s Disease Model of SN4741 Cells. Cell. Signal. 2025, 134, 111879. [Google Scholar] [CrossRef] [Scilit]
- Chan, S.C.; Tung, C.-W.; Lin, C.-W.; Tung, Y.-S.; Wu, P.-M.; Cheng, P.-H.; Chen, C.-M.; Yang, S.-H. miR-196a Provides Antioxidative Neuroprotection via USP15/Nrf2 Regulation in Huntington’s Disease. Free Radic. Biol. Med. 2023, 209, 292–300. [Google Scholar] [CrossRef] [Scilit]
- Aghaizu, N.D.; Jin, H.; Whiting, P.J. Dysregulated Wnt Signalling in the Alzheimer’s Brain. Brain Sci. 2020, 10, 902. [Google Scholar] [CrossRef] [Scilit] [PubMed]
- Salluzzo, M.; Vianello, C.; Abdullatef, S.; Rimondini, R.; Piccoli, G.; Carboni, L. The Role of IgLON Cell Adhesion Molecules in Neurodegenerative Diseases. Genes 2023, 14, 1886. [Google Scholar] [CrossRef] [Scilit]
- Chen, C.-Y.; Maner-Smith, K.; Khadka, M.; Ahn, J.; Gulbin, X.L.; Ivanova, A.A.; Dammer, E.B.; Seyfried, N.T.; Bennett, D.A.; Hajjar, I.M.; et al. Integrative Brain Omics Approach Highlights Sn-1 Lysophosphatidylethanolamine in Alzheimer’s Dementia. Nat. Commun. 2025, 16, 9627. [Google Scholar] [CrossRef] [Scilit]
- Zhou, H.; Zhou, M.; Hu, Y.; Limpanon, Y.; Ma, Y.; Huang, P.; Dekumyoy, P.; Maleewong, W.; Lv, Z. TNF-α Triggers RIP1/FADD/Caspase-8-Mediated Apoptosis of Astrocytes and RIP3/MLKL-Mediated Necroptosis of Neurons Induced by Angiostrongylus Cantonensis Infection. Cell. Mol. Neurobiol. 2022, 42, 1841–1857. [Google Scholar] [CrossRef] [Scilit]
- Identification of the Neuroprotective Shc Target in Alzheimer’s and Validation of the Neuroprotective Benefit of a Set of Small-Molecule Shc Blockers—Tomilov—2021—Alzheimer’s & Dementia—Wiley Online Library. Available online: https://alz-journals.onlinelibrary.wiley.com/doi/abs/10.1002/alz.054369 (accessed on 31 December 2025).
- Lin, E.; Tsai, S.-J.; Kuo, P.-H.; Liu, Y.-L.; Yang, A.C.; Kao, C.-F. Association and Interaction Effects of Alzheimer’s Disease-Associated Genes and Lifestyle on Cognitive Aging in Older Adults in a Taiwanese Population. Oncotarget 2017, 8, 24077–24087. [Google Scholar] [CrossRef] [Scilit]
- Li, C.; Zhao, Q.; Feng, L.; Li, M. Emerging Roles of Adaptive Immune Response in Alzheimer’s Disease. Aging Dis. 2024, 16, 2315–2342. [Google Scholar] [CrossRef] [Scilit]
- Petralia, M.C.; Battaglia, G.; Bruno, V.; Pennisi, M.; Mangano, K.; Lombardo, S.D.; Fagone, P.; Cavalli, E.; Saraceno, A.; Nicoletti, F.; et al. The Role of Macrophage Migration Inhibitory Factor in Alzheimer′s Disease: Conventionally Pathogenetic or Unconventionally Protective? Molecules 2020, 25, 291. [Google Scholar] [CrossRef] [Scilit]
- Bido, S.; Muggeo, S.; Massimino, L.; Marzi, M.J.; Giannelli, S.G.; Melacini, E.; Nannoni, M.; Gambarè, D.; Bellini, E.; Ordazzo, G.; et al. Microglia-Specific Overexpression of α-Synuclein Leads to Severe Dopaminergic Neurodegeneration by Phagocytic Exhaustion and Oxidative Toxicity. Nat. Commun. 2021, 12, 6237. [Google Scholar] [CrossRef] [Scilit] [PubMed]
- Roy, M.; Kageyama, Y.; Iijima, M.; Sesaki, H. PARK2/Parkin Becomes Critical When DNM1L/Drp1 Is Absent. Autophagy 2015, 11, 573–574. [Google Scholar] [CrossRef] [Scilit] [PubMed]
- McGill Percy, K.C.; Liu, Z.; Qi, X. Mitochondrial Dysfunction in Alzheimer’s Disease: Guiding the Path to Targeted Therapies. Neurotherapeutics 2025, 22, e00525. [Google Scholar] [CrossRef] [Scilit]
- Seo, Y.; Song, I.; Kim, K.J.; Chang, B.; Pradeep, P.; Roh, W.S.; Won, W.; Joo, J.; Kim, M.; Jeong, J.C.; et al. Abnormal O-Glycan Sialylation in the mPFC Contributes to Depressive-like Behaviors in Male Mice. Sci. Adv. 2025, 11, eady2733. [Google Scholar] [CrossRef] [Scilit] [PubMed]
- Kang, Y.; Zhang, Q.; Xu, S.; Yu, Y. The Alteration and Role of Glycoconjugates in Alzheimer’s Disease. Front. Aging Neurosci. 2024, 16, 1398641. [Google Scholar] [CrossRef] [Scilit]
- Hu, R.; Wei, P.; Jin, L.; Zheng, T.; Chen, W.-Y.; Liu, X.-Y.; Shi, X.-D.; Hao, J.-R.; Sun, N.; Gao, C. Overexpression of EphB2 in Hippocampus Rescues Impaired NMDA Receptors Trafficking and Cognitive Dysfunction in Alzheimer Model. Cell Death Dis. 2017, 8, e2717. [Google Scholar] [CrossRef] [Scilit]
- Thorns, V.; Masliah, E. Evidence for Neuroprotective Effects of Acidic Fibroblast Growth Factor in Alzheimer Disease. J. Neuropathol. Exp. Neurol. 1999, 58, 296–306. [Google Scholar] [CrossRef] [Scilit]
- Folch, J.; Patraca, I.; Martínez, N.; Pedrós, I.; Petrov, D.; Ettcheto, M.; Abad, S.; Marin, M.; Beas-Zarate, C.; Camins, A. The Role of Leptin in the Sporadic Form of Alzheimer’s Disease. Interactions with the Adipokines Amylin, Ghrelin and the Pituitary Hormone Prolactin. Life Sci. 2015, 140, 19–28. [Google Scholar] [CrossRef] [Scilit]
- Lv, L.; Qian, J.; Sang, J.; Li, J.; Liu, T. Protective Effects of PIK3CG Knockdown Against OGD/R-Induced Neuronal Damage via Inhibition of Autophagy Through the AMPK/mTOR Pathway. Neuroscience 2025, 565, 91–98. [Google Scholar] [CrossRef] [Scilit] [PubMed]
- Karampetsou, M.; Vekrellis, K.; Melachroinou, K. The Promise of the TGF-β Superfamily as a Therapeutic Target for Parkinson’s Disease. Neurobiol. Dis. 2022, 171, 105805. [Google Scholar] [CrossRef] [Scilit]
- Fontana, A.; Cursaro, I.; Carullo, G.; Gemma, S.; Butini, S.; Campiani, G. A Therapeutic Perspective of HDAC8 in Different Diseases: An Overview of Selective Inhibitors. Int. J. Mol. Sci. 2022, 23, 10014. [Google Scholar] [CrossRef] [Scilit]
- Santiago, J.A.; Bottero, V.; Potashkin, J.A. Evaluation of RNA Blood Biomarkers in the Parkinson’s Disease Biomarkers Program. Front. Aging Neurosci. 2018, 10, 157. [Google Scholar] [CrossRef] [Scilit]
- Pyszko, J.A.; Strosznajder, J.B. The Key Role of Sphingosine Kinases in the Molecular Mechanism of Neuronal Cell Survival and Death in an Experimental Model of Parkinson’s Disease. Folia Neuropathol. 2014, 52, 260–269. [Google Scholar] [CrossRef] [Scilit]
- Ali, N.H.; Al-Kuraishy, H.M.; Al-Gareeb, A.I.; Alexiou, A.; Papadakis, M.; AlAseeri, A.A.; Alruwaili, M.; Saad, H.M.; Batiha, G.E. BDNF/TrkB Activators in Parkinson’s Disease: A New Therapeutic Strategy. J. Cell. Mol. Med. 2024, 28, e18368. [Google Scholar] [CrossRef] [Scilit] [PubMed]
- Martirosyan, A.; Ansari, R.; Pestana, F.; Hebestreit, K.; Gasparyan, H.; Aleksanyan, R.; Hnatova, S.; Poovathingal, S.; Marneffe, C.; Thal, D.R.; et al. Unravelling Cell Type-Specific Responses to Parkinson’s Disease at Single Cell Resolution. Mol. Neurodegener. 2024, 19, 7. [Google Scholar] [CrossRef] [Scilit]
- Chatterjee, M.; van Steenoven, I.; Huisman, E.; Oosterveld, L.; Berendse, H.; van der Flier, W.M.; Del Campo, M.; Lemstra, A.W.; van de Berg, W.D.J.; Teunissen, C.E. Contactin-1 Is Reduced in Cerebrospinal Fluid of Parkinson’s Disease Patients and Is Present Within Lewy Bodies. Biomolecules 2020, 10, 1177. [Google Scholar] [CrossRef] [Scilit]
- Tremblay, M.-E.; Cookson, M.R.; Civiero, L. Glial Phagocytic Clearance in Parkinson’s Disease. Mol. Neurodegener. 2019, 14, 16. [Google Scholar] [CrossRef] [Scilit] [PubMed]
- Verma, M.; Chopra, M.; Kumar, H. Unraveling the Potential of EphA4: A Breakthrough Target and Beacon of Hope for Neurological Diseases. Cell. Mol. Neurobiol. 2023, 43, 3375–3391. [Google Scholar] [CrossRef] [Scilit]
- Kumar, S.; Abbas, M.M.; Govindappa, S.T.; Muthane, U.B.; Behari, M.; Pandey, S.; Juyal, R.C.; Thelma, B.K. Compound Heterozygous Variants in Wiskott-Aldrich Syndrome like (WASL) Gene Segregating in a Family with Early Onset Parkinson’s Disease. Park. Relat. Disord. 2021, 84, 61–67. [Google Scholar] [CrossRef] [Scilit]
- D’Ambrosi, N.; Milani, M.; Apolloni, S.; D’Ambrosi, N.; Milani, M.; Apolloni, S. S100A4 in the Physiology and Pathology of the Central and Peripheral Nervous System. Cells 2021, 10, 798. [Google Scholar] [CrossRef] [Scilit]
- Power, J.H.T.; Blumbergs, P.C. Cellular Glutathione Peroxidase in Human Brain: Cellular Distribution, and Its Potential Role in the Degradation of Lewy Bodies in Parkinson’s Disease and Dementia with Lewy Bodies. Acta Neuropathol. 2009, 117, 63–73. [Google Scholar] [CrossRef] [Scilit]
- Hu, Z.; Chen, B.; Zhang, J.; Ma, Y. Up-Regulation of Autophagy-Related Gene 5 (ATG5) Protects Dopaminergic Neurons in a Zebrafish Model of Parkinson’s Disease. J. Biol. Chem. 2017, 292, 18062–18074. [Google Scholar] [CrossRef] [Scilit] [PubMed]
- Salaramoli, S.; Joshaghani, H.R.; Shoeibi, A.; Hashemy, S.I. Selenium and Selenoproteins Role in Parkinson’s Disease: Is There a Link between Selenoproteins and Accumulated Alpha-Synuclein? J. Trace Elem. Med. Biol. 2024, 81, 127344. [Google Scholar] [CrossRef] [Scilit]
- Danielson, S.R.; Andersen, J.K. Oxidative and Nitrative Protein Modifications in Parkinson’s Disease. Free Radic. Biol. Med. 2008, 44, 1787–1794. [Google Scholar] [CrossRef] [Scilit] [PubMed]
- Hall, D.A.; Howard, K.; Hagerman, R.; Leehey, M.A. Parkinsonism in FMR1 Premutation Carriers May Be Indistinguishable from Parkinson Disease. Park. Relat. Disord. 2009, 15, 156–159. [Google Scholar] [CrossRef] [Scilit]
- PAKs in the Brain: Function and Dysfunction—ScienceDirect. Available online: https://www.sciencedirect.com/science/article/pii/S0925443917304192 (accessed on 31 December 2025).
- Angelopoulou, E.; Paudel, Y.N.; Shaikh, M.F.; Piperi, C. Fractalkine (CX3CL1) Signaling and Neuroinflammation in Parkinson’s Disease: Potential Clinical and Therapeutic Implications. Pharmacol. Res. 2020, 158, 104930. [Google Scholar] [CrossRef] [Scilit] [PubMed]
- Min, C.; Cheong, S.-Y.; Cheong, S.-J.; Kim, M.; Cho, D.-I.; Kim, K.-M. RGS4 Exerts Inhibitory Activities on the Signaling of Dopamine D2 Receptor and D3 Receptor Through the N-Terminal Region. Pharmacol. Res. 2012, 65, 213–220. [Google Scholar] [CrossRef] [Scilit]
- Brigas, H.C.; Ribeiro, M.; Coelho, J.E.; Gomes, R.; Gomez-Murcia, V.; Carvalho, K.; Faivre, E.; Costa-Pereira, S.; Darrigues, J.; de Almeida, A.A.; et al. IL-17 Triggers the Onset of Cognitive and Synaptic Deficits in Early Stages of Alzheimer’s Disease. Cell Rep. 2021, 36, 109574. [Google Scholar] [CrossRef] [Scilit] [PubMed]
- Cao, M.; Liu, J.; Zhang, X.; Wang, Y.; Hou, Y.; Song, Q.; Cui, Y.; Zhao, Y.; Wang, P. IL-17A Promotes the Progression of Alzheimer’s Disease in APP/PS1 Mice. Immun. Ageing 2023, 20, 74. [Google Scholar] [CrossRef] [Scilit]
- Doecke, J.D.; Laws, S.M.; Faux, N.G.; Wilson, W.; Burnham, S.C.; Lam, C.-P.; Mondal, A.; Bedo, J.; Bush, A.I.; Brown, B.; et al. Blood-Based Protein Biomarkers for Diagnosis of Alzheimer Disease. Arch. Neurol. 2012, 69, 1318–1325. [Google Scholar] [CrossRef] [Scilit]
- Tramutola, A.; Triplett, J.C.; Di Domenico, F.; Niedowicz, D.M.; Murphy, M.P.; Coccia, R.; Perluigi, M.; Butterfield, D.A. Alteration of mTOR Signaling Occurs Early in the Progression of Alzheimer Disease (AD): Analysis of Brain from Subjects with Pre-Clinical AD, Amnestic Mild Cognitive Impairment and Late-Stage AD. J. Neurochem. 2015, 133, 739–749. [Google Scholar] [CrossRef] [Scilit]
- Ma, T.; Hoeffer, C.A.; Capetillo-Zarate, E.; Yu, F.; Wong, H.; Lin, M.T.; Tampellini, D.; Klann, E.; Blitzer, R.D.; Gouras, G.K. Dysregulation of the mTOR Pathway Mediates Impairment of Synaptic Plasticity in a Mouse Model of Alzheimer’s Disease. PLoS ONE 2010, 5, e12845. [Google Scholar] [CrossRef] [Scilit]
- Cai, Z.; Chen, G.; He, W.; Xiao, M.; Yan, L.-J. Activation of mTOR: A Culprit of Alzheimer’s Disease? Neuropsychiatr. Dis. Treat. 2015, 11, 1015–1030. [Google Scholar] [CrossRef] [Scilit] [PubMed]
- Zhang, Z.; Wang, X.; Zhang, D.; Liu, Y.; Li, L. Geniposide-Mediated Protection Against Amyloid Deposition and Behavioral Impairment Correlates with Downregulation of mTOR Signaling and Enhanced Autophagy in a Mouse Model of Alzheimer’s Disease. Aging 2019, 11, 536–548. [Google Scholar] [CrossRef] [Scilit] [PubMed]
- Veteleanu, A.; Pape, S.; Davies, K.; Kodosaki, E.; Hye, A.; Zelek, W.M.; Strydom, A.; Morgan, B.P. Complement Dysregulation and Alzheimer’s Disease in Down Syndrome. Alzheimer’s Dement. 2023, 19, 1383–1392. [Google Scholar] [CrossRef] [Scilit] [PubMed]
- Li, M.; Ma, Y.-H.; Guo, Y.; Liu, J.-Y.; Tan, L.; Alzheimer’s Disease Neuroimaging Initiative. Associations of Cerebrospinal Fluid Complement Proteins with Alzheimer’s Pathology, Cognition, and Brain Structure in Non-Dementia Elderly. Alzheimer’s Res. Ther. 2024, 16, 12. [Google Scholar] [CrossRef] [Scilit] [PubMed]
- Grammas, P.; Ovase, R. Cerebrovascular Transforming Growth Factor-β Contributes to Inflammation in the Alzheimer’s Disease Brain. Am. J. Pathol. 2002, 160, 1583–1587. [Google Scholar] [CrossRef] [Scilit]
- Wang, M.; Zhang, H.; Liang, J.; Huang, J.; Wu, T.; Chen, N. Calcium Signaling Hypothesis: A Non-Negligible Pathogenesis in Alzheimer’s Disease. J. Adv. Res. 2025, 77, 513–534. [Google Scholar] [CrossRef] [Scilit] [PubMed]
- Calvo-Rodriguez, M.; García-Rodríguez, C.; Villalobos, C.; Núñez, L. Role of Toll Like Receptor 4 in Alzheimer’s Disease. Front. Immunol. 2020, 11, 1588. [Google Scholar] [CrossRef] [Scilit]
- Kalluru, P.K.R.; Bhavanthi, S.; Vashist, S.; Gopavaram, R.R.; Mamilla, M.; Sharma, S.; Gundoji, C.R.; Goguri, S.R. Role of Erythropoietin in the Treatment of Alzheimer’s Disease: The Story so Far. Ann. Med. Surg. 2024, 86, 3608–3614. [Google Scholar] [CrossRef] [Scilit]
- Flood, P.M.; Qian, L.; Peterson, L.J.; Zhang, F.; Shi, J.-S.; Gao, H.-M.; Hong, J.-S. Transcriptional Factor NF-κB as a Target for Therapy in Parkinson’s Disease. Park. Dis. 2011, 2011, 216298. [Google Scholar] [CrossRef] [Scilit]
- Chen, S.; Crack, P.J.; Taylor, J.M. The Contribution of Type-I IFN-Mediated Neuroinflammation to Parkinson’s Disease Progression. Brain Behav. Immun. Health 2025, 46, 101017. [Google Scholar] [CrossRef] [Scilit]
- Trivedi, N.; Bhosale, J.D.; Pant, A.; Suryawanshi, S.P.; Tiwari, P.; Abel, P.W.; Jadhav, G.P. Triggering Receptor Expressed on Myeloid Cells-1 (TREM-1) in Inflammation and Disease: Mechanisms, Therapeutic Potential, and Future Directions. Int. J. Mol. Sci. 2025, 26, 10386. [Google Scholar] [CrossRef] [Scilit]
- Seo, B.A.; Kwon, S.-H.; Kim, D.; Kim, H.-B.; Ma, S.-X.; Gadhave, K.; Burgess, N.; Mao, X.; Rosenthal, L.S.; Redding-Ochoa, J.; et al. Pathologic α-Synuclein-NOD2 Interaction and RIPK2 Activation Drives Microglia-Induced Neuroinflammation in Parkinson’s Disease. bioRxiv 2024. [Google Scholar] [CrossRef] [Scilit]
- Ma, Y.; Erb, M.L.; Moore, D.J. Aging, Cellular Senescence and Parkinson’s Disease. J. Park. Dis. 2025, 15, 239–254. [Google Scholar] [CrossRef] [Scilit] [PubMed]
- Kurbatskaya, K.; Phillips, E.C.; Croft, C.L.; Dentoni, G.; Hughes, M.M.; Wade, M.A.; Al-Sarraj, S.; Troakes, C.; O’Neill, M.J.; Perez-Nievas, B.G.; et al. Upregulation of Calpain Activity Precedes Tau Phosphorylation and Loss of Synaptic Proteins in Alzheimer’s Disease Brain. Acta Neuropathol. Commun. 2016, 4, 34. [Google Scholar] [CrossRef] [Scilit] [PubMed]
- Akhtar, R.S.; Licata, J.P.; Luk, K.C.; Shaw, L.M.; Trojanowski, J.Q.; Lee, V.M.-Y. Measurements of Auto-Antibodies to α-Synuclein in the Serum and Cerebral Spinal Fluids of Patients with Parkinson’s Disease. J. Neurochem. 2018, 145, 489–503. [Google Scholar] [CrossRef] [Scilit]
- Chiu, M.-J.; Yang, S.-Y.; Chen, T.-F.; Lin, C.-H.; Yang, F.-C.; Chen, W.-P.; Zetterberg, H.; Blennow, K. Synergistic Association Between Plasma Aβ1–42 and p-Tau in Alzheimer’s Disease but Not in Parkinson’s Disease or Frontotemporal Dementia. ACS Chem. Neurosci. 2021, 12, 1376–1383. [Google Scholar] [CrossRef] [Scilit] [PubMed]

Disclaimer/Publisher’s Note: The statements, opinions and data contained in all publications are solely those of the individual author(s) and contributor(s) and not of MDPI and/or the editor(s). MDPI and/or the editor(s) disclaim responsibility for any injury to people or property resulting from any ideas, methods, instructions or products referred to in the content. |
© 2026 by the authors. Licensee MDPI, Basel, Switzerland. This article is an open access article distributed under the terms and conditions of the Creative Commons Attribution (CC BY) license.