


Abstract
The shrinking of a city evokes an image that the amount of the main urban components, such as public facilities, infrastructure, and built-up areas, also shrinks. However, in reality, even in so-called shrinking cities with declining population, physical and spatial expansion is reported to continue and remain growth-oriented. This study examines whether some main urban components are shrinking in response to population and household decline by analyzing 1709 municipalities in Japan, around 80% of which have already experienced population decline over the past decade (2012–2022). The analyses use two datasets disclosing total quantities of respective urban components at the municipal level in the two endpoint years of 2012 and 2022, employing some simple techniques: correlation, simple regression analysis, and cross-tabulation. The results reveal that public facilities, road networks, and urban areas were supplied accordingly during periods of population growth but no corresponding downsizing occurs during periods of population decline; instead, several population-declining municipalities witness continuous expansion of these three urban components, contradicting the decrease in population and households. This tendency will create an imbalance between population and urban components, raising concerns that excessive public facilities, infrastructure, and urban areas disproportionate to population decline will undermine the efficiency of urban services and increase the burden on administrative and fiscal operations.
1. Introduction
Urban planning has developed various infrastructures, public facilities, and built-up areas in response to population increases due to urbanization [1]. In this study, the term “urban components” is defined as the physical elements that constitute a city—namely, public facilities, infrastructure networks, and built-up (urban) areas—which together form the physical hardware of a city that provides essential services for daily life and urban functions. The quantities of these urban components are inherently closely related to population size. Population is related to the supply and demand; users and residents use urban components, whereas taxpayers and the labor force maintain them. However, some countries are beginning to experience population decline [2]. Discussions about population decline have always emerged in the United States, Europe, and East Asia since the 2000s [3,4]. In response to population decline, the terms “shrinking” and “shrinking cities” were frequently used in the 2000s and 2010s [3,5,6,7]. Urban shrinkage is not a purely demographic phenomenon but a multidimensional process embedded in sociological and economic contexts: it is driven by interacting factors such as deindustrialization and economic restructuring, suburbanization, post-socialist transformation, low fertility, aging, and the selective out-migration of younger people, and it manifests itself in declining local economies, underused infrastructure, growing vacancies, and fiscal stress of local governments [7,8,9].
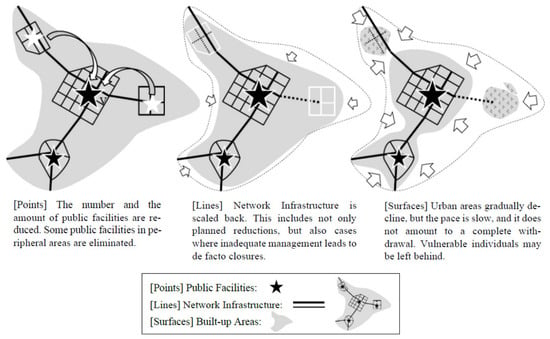
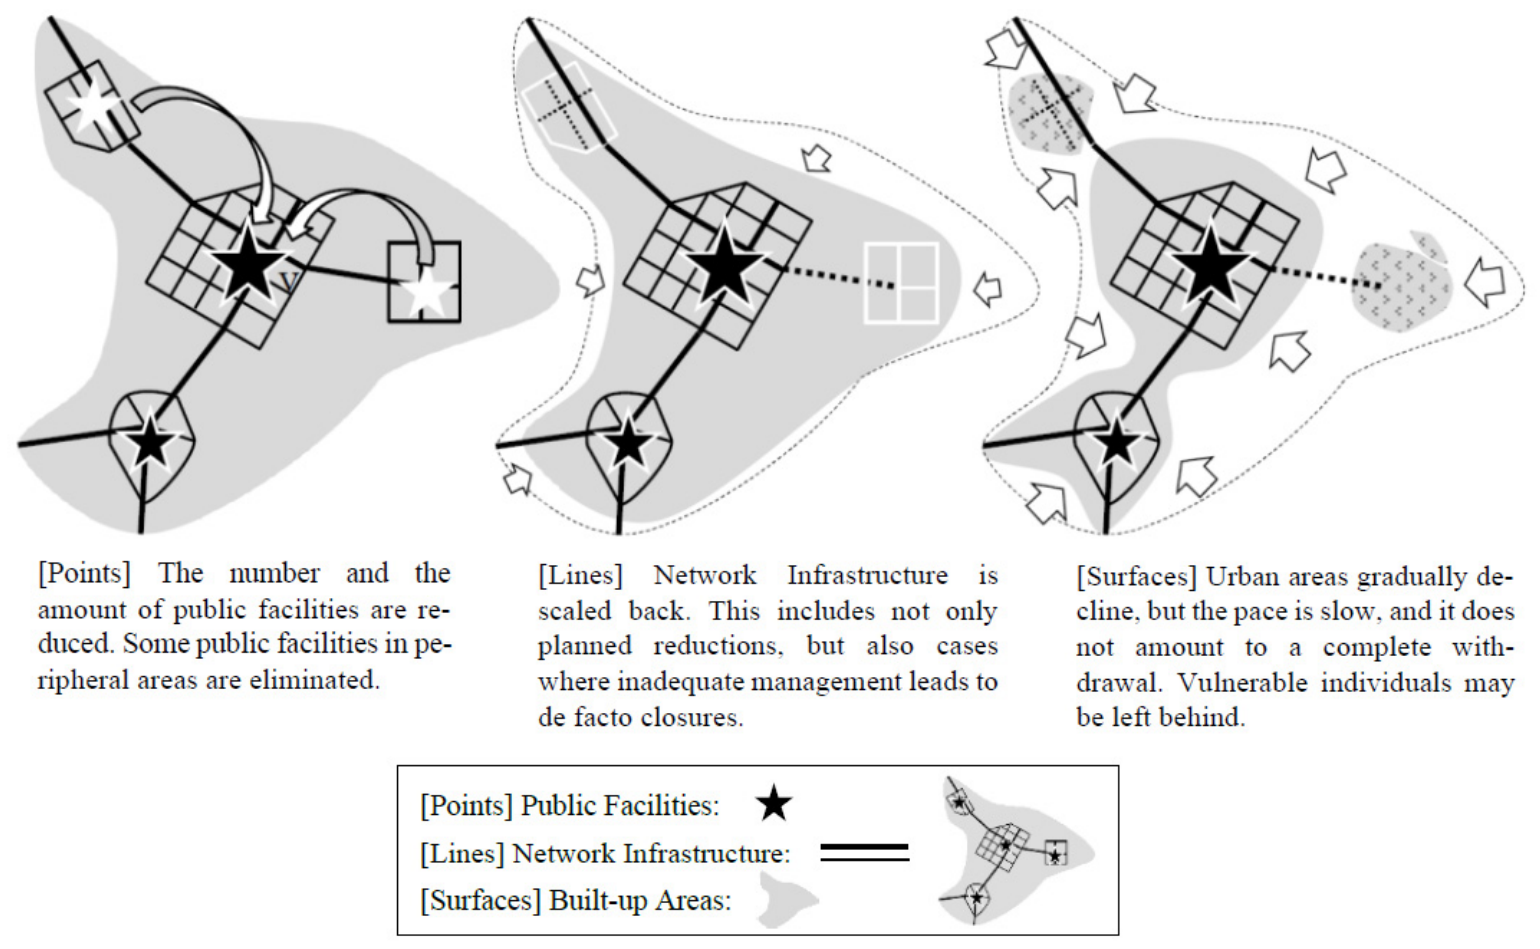
If the term “shrinking city” were taken literally, it would imply that the amount of public facilities, infrastructure, and built-up areas also decreases in parallel with population. In reality, however, urban components, once developed, do not disappear spontaneously: buildings and roads remain in place unless governments or landowners deliberately demolish, abandon, or convert them, which entails considerable costs and difficult decisions. However, even in so-called shrinking cities with a declining population, it has been reported that spatial expansion continues and policies remain growth-oriented [10,11,12]. It is argued that in Japan, with a declining population in most municipalities, the urban components are conceptually divided into “points”, “lines”, and “surfaces”. It is also argued that public facilities, which are regarded as points, were relatively easy to shrink; infrastructure networks regarded as lines, such as roads and water and sewerage systems, were difficult to shrink; and urban areas, which are regarded as surfaces, were even more difficult to shrink [13] (Figure 1). However, there has been no evidence to support how urban components have actually changed during population decline.
Figure 1.
Diagram of points, lines, and surfaces as urban components [13].
In many countries, including Japan, public facilities and infrastructure networks that constitute cities are primarily managed and operated using financial resources by local or regional governments, providing services to residents living in built-up areas. If these facilities do not shrink concurrently with population decline, inefficiencies in public services will be assumed. Further, there is a risk that built-up areas with some population will remain where public facilities have been withdrawn, resulting in service supply disruptions, which could lead to inconsistency issues. Therefore, this study aims to examine whether some main urban components are shrinking in response to population and household decline, using representative urban components in a simplified manner. Stated explicitly, the objective of this study is twofold: (1) to empirically clarify, at the nationwide municipal scale, whether the quantities of the three main urban components—public facilities, road networks, and residential land—have been reduced in response to population and household decline, and (2) to identify differences in this response among the three components. The target cities are almost all 1709 municipalities in Japan, approximately 80% of which have already experienced population decline over the past decade. The analysis focuses on the decade spanning 2012 to 2022, comparing the two endpoint years.
2. Literature Review
2.1. Trends in Population Decline Research
Although numerous studies related to population decline have addressed specific issues, such as the increase in vacant lands and houses, I review existing studies that focus on municipalities, cities, or regions. Early research on population decline focused primarily on demographic dynamics, with studies predominantly originating in the United States [14] and Europe [8,15,16]. Recently, there has been an increase in quantitative analyses of the relationship between population decline and other socioeconomic indicators, particularly in East Asia [17,18,19,20]. However, research on the relationship between population growth and urban components, which are thought to be correlated with population change, is inadequate.
More specifically, research on population decline and shrinking cities has developed in several main directions. The first direction is the identification, measurement, and typology of shrinking cities: shrinkage patterns and local strategies have been classified in Germany and the USA [5], trajectories of European cities have been typologized through long-term comparative analyses [16], and shrinking cities have been identified using census, registered-population, and nighttime-light data in East Asia [17,18,19,20]. The second direction concerns causes and conceptual models: urban shrinkage has been explained by macroprocesses such as deindustrialization, suburbanization, post-socialist transformation, and demographic change, and a heuristic model linking these macrodrivers to place- and time-specific local trajectories has been proposed [8,9,14,15]. The third direction is demographic projection, exemplified by the official municipal-level population projections in Japan [21]. The fourth direction addresses socioeconomic consequences, including economic decline [15], increases in vacant land and housing [22,23,24], and inefficiencies in public services and fiscal operations [25,26]. The fifth direction discusses planning and policy responses, ranging from persistent growth orientation to de-growth or shrinkage-accepting strategies [10,11]. This study is positioned in the fourth direction but focuses on the physical total quantity of urban components, which has rarely been measured.
2.2. Demographic Changes in Japan
Japan’s total population peaked at approximately 128 million around 2008–2010 and has since been declining, making Japan one of the first major countries to experience nationwide population decline [2]. The decline results from persistently low fertility—the total fertility rate has remained far below the replacement level since the mid-1970s—combined with the world’s most advanced population aging, with the share of people aged 65 or over approaching 30%. In Japan, population decline was initially reported from a sociological perspective as a phenomenon occurring after population aging in rural areas where depopulation is progressing [27,28]. However, population decline has now spread to several cities all over Japan; as of 2015, 1419 municipalities, or 82.5% of the 1719 municipalities nationwide, were said to experience population decline [29]. Future population projections indicate with a high degree of certainty that this population decline in each municipality will continue for at least several decades [21]. Population decline can be observed even in major metropolitan regions, such as Tokyo and Osaka [30]. Particularly, population decline has begun in some suburbs [31,32] and is expected to continue. These new demographic trends have heightened interest in the issue of population decline even in fields more closely tied to applied sciences, such as civil engineering and urban planning. Thus, the impact of population decline on the applied sciences, which directly influence the formation of cities, is significant, since most of them have been substantially based on the premise of urbanization accompanied by population growth. In the following section, I will summarize research trends by category of urban components; however, studies based on the premise of a population decline are limited across all categories, leaving significant room for further research. Meanwhile, in contrast to the population, the number of households in Japan has continued to increase, owing to the shrinking average household size; according to the 2020 National Census, single-person households accounted for 38.1% of all households, reflecting both young adults postponing family formation and the growing number of elderly people living alone [33]. This combination of a declining population and increasing households constitutes an essential context for the analyses in this study.
2.3. Urban Components and Population Decline
Regarding the changes population decline brings to cities, there is inadequate research on the relationship between urban components and population growth/decline, which are inherently thought to be correlated; meanwhile, the global research trend focuses on specific problems arising from population decline, such as economic decline and vacant land and house increase [25].
Regarding the relationship between public facilities and population decline, studies have examined schools [34], libraries [35], hospitals [36,37], gas stations [38], and other specific public facilities. These studies discuss the relationship between population trends and other factors. Several studies have examined multiple public facilities [39,40]. Although these studies consider policy implications for population decline and specific issues, they did not statistically examine the correlation between the stock of public facilities and population growth/decline; that is, the question has been left largely uninvestigated rather than investigated with null results, since their interests lay in the planning, accessibility, or management of individual facility types. It should also be noted that the relationship between facility development and demographic change varies considerably across institutional contexts. For example, in many European countries, capital investment by local governments depends heavily on the availability of European Union funding [41], and investment in social infrastructure is often adopted as a strategy for increasing the attractiveness of places for current and prospective residents, rather than as a direct response to demographic change. Such supranational funding schemes do not exist in Japan, and this institutional difference should be borne in mind when comparing the results of this study with those of other countries.
Existing Japanese research exhibits a similar tendency. There are numerous case studies and policy proposals concerning the consolidation and closure of public facilities, termed facility management [42,43]. Although attention has been drawn to the need to restructure public facilities in the context of population decline [44], this need is as a consequence overlooked and none purely correlate population growth/decline with public facilities.
This study focuses on road networks, as a representative linear infrastructure network, considering the situation of Japan’s open data. The relationship between population and traffic demand is well-established for road networks, as even basic traffic engineering methods, such as the four-step estimation method, use zone-specific population data [45]. Several studies have also focused on the direct relationship between population and road infrastructure. For example, Duranton and Turner [46] estimated the long-term impact of interstate highways on urban employment; Taillanter and Barthelemy [47] determined the commuter threshold for the emergence of freeways and ring roads; and Cleveland and Rainham [48] examined the relationship between road length per residential area and net population density. Nevertheless, these studies assumed a relationship between population growth and new road construction/expansion and do not reflect infrastructure conditions during population decline. Regarding the quantity of road infrastructure (length, area, etc.) during population decline, He et al. [49] analyzed the spatiotemporal changes in transportation land use and population structure across 121 counties (cities/districts) in Guangdong Province, China, arguing that the imbalance among population, transportation, and construction is worsening. However, to the best of our knowledge, existing research focusing on Japan, where population decline is occurring at the national level, lacks analyses from this perspective.
The expansion of residential land can be considered synonymous with urbanization, and extensive research has been conducted in various countries during periods of population growth. Conversely, the relationship between population and residential land during periods of population decline has been examined in studies addressing vacant land [22,23], land use efficiency [50], population density and fiscal efficiency [26], among others, focusing on the specific problems they cause. In Japan, there are reports on land use intensification in response to population decline in Yubari City, a former coal mining town that experienced long-term population decline and fiscal collapse [51]. In addition, research has been conducted on urban densification related to Japan’s Compact City policy, the Location Optimization Plans formulated since 2014 [52,53]. However, as Hebbert [54] and Sorensen [55] previously reported, Japan’s land use regulations have generally been lax, permitting urban sprawl and low population density in suburban areas. It cannot be said that urban areas are shrinking and intensifying in response to population decline in terms of residential land. Further, several cities still see an increase in households even as populations decline and exhibit a strong correlation with household numbers, since the number of residential units and residential land are said to be more closely related to the number of households than to population [12].
The increase in the number of households despite population decline is a demographic phenomenon now commonly observed in developed countries, resulting from changes in household structure that are often summarized as the second demographic transition: young adults increasingly postpone marriage and family formation, raising the number of single-person households, while population aging multiplies elderly one-person households [33]. In addition, the migration of younger people to urban areas, which are generally perceived as offering more attractive living conditions, sustains household growth in cities even under national population decline [33]. A comparative analysis of 188 European cities further showed that urban land area continued to spread even in “double-declining” cities losing both population and households, because rising per capita living space counteracts the reduction in land consumption [56]. These broader demographic processes underlie the treatment of households alongside population in this study. It should also be noted that a substantial body of research has examined the relationship between population decline and housing vacancy, including the accumulating studies on vacant houses (akiya) in Japan [22,23,24,25]. Vacancy rates capture the demand or utilization side of the privately owned housing stock; however, no equivalent indicator of “vacancy” exists for roads or public facilities. The present study is therefore complementary to vacancy research in that it addresses the physical total quantity of urban components, which vacancy indicators cannot capture.
Regarding integrated urban models encompassing multiple elements, including infrastructure such as public facilities and roads, as well as urban areas, analysis has primarily focused on the district level within cities [57,58]. However, neither of these studies enables comparison across numerous cities. No research has comprehensively discussed the situation of population decline and urban component shrinking by comparing several cities.
3. Mechanisms and Hypotheses
The logic connecting population and the urban components can be organized in terms of demand and supply. On the demand side, population and households generate the demand for urban services: residents use schools, libraries, and other public facilities, travel on municipal roads, and occupy dwellings on residential land. On the supply side, public facilities and road networks are supplied and maintained by municipal governments financed mainly by local taxes paid by the resident and working population, whereas residential land is supplied chiefly through market transactions by private landowners and developers under planning regulations. During the population growth phase, growing demand is translated into the expansion of the urban components through public investment and private development; therefore, a strong positive correlation between population and the quantities of the urban components is expected.
During the population decline phase, in contrast, several mechanisms prevent the urban components from being reduced in proportion to the decrease in demand. First, the urban components are durable capital stocks: buildings and roads physically remain for decades unless they are deliberately demolished, and demolition itself requires additional fiscal expenditure while generating no revenue. Second, reduction tends to provoke political resistance, because the closure of facilities or the abandonment of roads directly affects existing users and neighborhoods. Third, the ease of reduction differs among the three components. Public facilities (points) operate as relatively independent units, so an individual facility can be closed, consolidated, or demolished by a decision of its single owner, the municipal government. Road networks (lines) function through interconnection; removing one segment can break the connectivity of the entire network and affect the remaining residents along it, which makes partial reduction difficult even though the roads are also publicly owned. Residential land (surfaces) consists mostly of privately owned parcels, so the public sector cannot directly reduce it within the socio-economic systems of capitalist economies; its reduction depends on dispersed decisions by numerous landowners. These mechanisms lead to the expectation that the reduction in the urban components does not keep pace with population and household decline and that the degree of reduction differs among the three components in the order of points, lines, and surfaces.
First, as a precondition, the existence of a correlation between population and urban components during population growth and urbanization due to urban infrastructure development is established. Second, the relationship between population and urban components during population decline is examined. There are differences in tendencies among urban components; thus, another hypothesis reflecting these differences is considered. Although the focus is primarily on population decline, residential areas are considered to be deeply related to the decline of households based on the discussion in the previous chapter. Thus, both population and households are considered in analyzing the population decline phase. Accordingly, the following three hypotheses are proposed.
H1.
As a result of urbanization, there is a strong correlation among the floor area of administrative properties, length of municipal roads, area of residential land, and population size.
H2.
The reduction in the floor area of administrative properties, length of municipal roads, and area of residential land does not keep pace with population and household decline.
H3.
The degree of reduction in the three urban components varies in response to the extent of population decline in each municipality. In municipalities experiencing population decline, the floor area of administrative properties tends to decrease significantly, whereas the length of municipal roads and area of residential land often do not decrease in several municipalities.
It might be argued that these hypotheses merely describe the current situation and therefore require no verification. However, although the above tendencies have been recognized anecdotally or through individual case studies, no nationwide quantitative evidence has been presented on whether, and to what extent, the three urban components respond to population and household decline, as noted in Section 1. Formally testing the hypotheses against data covering 1709 municipalities makes it possible to quantify the strength of these relationships, to detect the differences among the three components, and to provide a baseline for urban models and planning policies under population decline; this constitutes the contribution of the present study.
4. Methodology and Data Used
4.1. Data on Public Facilities
As an urban component, public facilities were selected as the data of points. This study considers all buildings, such as city halls, public schools, public housing, libraries, cultural halls, community centers, and similar institutions. The Ministry of Internal Affairs and Communications provides a longitudinal comparison table called the “Survey on Public Facilities (公共施設状況調: Kokyo-shisetsu-jokyo-shirabe) [59],” which allows for a more comprehensive analysis of the scale and trends of public facilities than any other data like POI data provided by other organizations. This table compiles cumulative annual data on the area and number of all public facilities owned by each prefecture and municipality.
For public facility data, I used the “Floor Area of Administrative Properties” from the items listed in this table. Here, “administrative property” refers to a property used by government employees, jointly used by citizens, or designated for citizen use. Because administrative properties constitute public real estate that supports various public services provided to citizens by government offices, a correlation with population was expected.
4.2. Data on Road Network
Road networks were selected as the data of lines. Although infrastructure comprising networks includes water supply, sewerage, electricity, and gas, none of these, except roads, exist as open data at the national level in Japan. Road networks were provided as open data, specifically in the same multi-year comparison tables of the Survey on Public Facilities [59], broken down by municipality. Another advantage of using the table is that it reveals the scale of roads by the construction authority. Municipal roads, primarily comprising local streets expected to expand or contract based on population and households, align well with this study’s objectives. Other categories, such as national highways or expressways, may be strongly influenced by industrial activity or other non-population elements or concentration in specific municipalities with particular conditions. For road network data, I used the “Actual Length of Municipal Roads” item. Although road area data were also available, measuring network size by length and assessing its correlation with population is considered more appropriate.
4.3. Data on Residential Area
Residential land by municipality was considered for the data of surfaces. Within built-up land, residential land was expected to show a high correlation with population and households, unlike industrial and commercial lands, which provide space for uses other than residents and do not seem to exhibit such correlations [12].
As data on the quantity of residential land, this study employs the “Summary Report on Prices, etc. of Fixed Assets (固定資産の価格等の概要調書: Koteishisan-no-kakakuto-no-gaiyochosho” [60], which is not commonly used in other Japanese research. Although this report classifies urban areas into several types, the combined total of “Land for Small-Scale Residences” and “Land for General Residences” was considered to approximate the total area of residential land for each municipality. All privately owned residential land subject to land area measurement was included in the fixed asset tax calculation and is recorded in this report. However, residential land that was not subject to fixed asset tax calculation includes public-use residential land (such as government employee housing) and public housing. However, compared with some European and other countries, Japan has fewer public-use and public-housing units and fewer residents living in them. According to the 2020 National Census, only 1,901,580 of Japan’s total 55,704,949 households (3.4%) live in public rental housing. Residential land in village districts where land area surveys have not been conducted cannot be captured by these data either. However, village districts generally have low population densities, and the proportion of residential land is considered negligible. Therefore, the aforementioned data are used for the areas of residential land in this study.
4.4. Data Limitations and Objective Municipalities
Table 1 summarizes the data for the floor areas of administrative properties, lengths of municipal roads, and areas of residential land, presented as points, lines, and surfaces, respectively. Public facility data for several municipalities before 2010 are missing in the Survey on Public Facilities. Therefore, this study uses the latest data (2022) available as of November 2025 and data from 10 years prior (2012) to examine the rate of change over the decade.
Table 1.
Scope of the three components covered and not covered based on guidelines of “Survey on Public Facilities” and “Summary Report on Prices, etc. of Fixed Assets”.
The analysis covers all Japanese municipalities except nine municipalities in Fukushima Prefecture (Minamisoma City, Kawamata Town, Naraha Town, Tomioka Town, Okuma Town, Futaba Town, Namie Town, Katsurao Village, and Iitate Village), where the 2011 nuclear accident considerably impacted population and households. Tokyo’s 23 special wards were also excluded because the “Summary Report on Fixed Asset Values” combines data for all 23 wards as the Tokyo Metropolitan Government collects the fixed asset tax together, and the combined total tends to show outliers due to the extremely large values for each urban component metric and its inclusion of the capital’s central business district. Consequently, the target sample comprises the remaining 1709 municipalities.
4.5. Research Methodology
The aforementioned data on the urban components represent the most quantitatively accurate data available for understanding each component. However, spatial information on individual public facilities, infrastructure, and urban districts is not publicly available. This study aims to demonstrate the relationship between changes in population and households and changes in the urban components within population-declining cities. Priority was placed on ensuring the transparency and reproducibility of results and explicitly outlining each stage of the analysis by utilizing methods that are easy to interpret, rather than employing complex models. Therefore, the employed research methods comprise simple techniques: correlation, simple regression analysis, and cross-tabulation.
The selection of these techniques is justified as follows. First, the purpose of this study is to verify the existence, strength, and sign of first-order relationships between demographic change and the urban components across a very large and heterogeneous sample of 1709 municipalities; simple and transparent statistics are suitable for this purpose and facilitate the interpretation and reproduction of the results. Second, correlation and regression analyses of municipal-level aggregate data have been employed in preceding studies on population and road infrastructure [48,49], which allows the results of this study to be compared with them. The specific formulations are as follows. Pearson’s product-moment correlation coefficient r between two variables x and y is defined as
where and denote the sample means. Simple linear regression was estimated by ordinary least squares (OLS) in the form
where is the rate of change in an urban component in municipality i, is the rate of change in population (or households), is the intercept, is the regression coefficient, and is the error term; the statistical significance of α and was tested by t-tests. The rate of change in each variable over the study period was calculated as
The analysis proceeds in the following steps: (1) descriptive statistics of all variables are summarized; (2) the correlations between the levels of population/households and the three urban components in 2012 and 2022, and the simple regressions for 2022, are computed to test H1; (3) all municipalities are classified into those with increasing and decreasing population (households), and the correlations and simple regressions between the ten-year rates of change are computed for each group to test H2; and (4) municipalities are cross-tabulated into four quadrants according to the signs of the changes in population/households and in each urban component to test H3.
Specifically, the study first quantifies and models the relationship between population size and the scale of three urban components in 2022, using correlation and simple linear regression analyses. Next, all municipalities in Japan were categorized into those with increasing populations and those with decreasing populations; the relationship between changes in population and households and changes in three urban components over a ten-year period (2012 to 2022) was then quantified and modeled using the same analytical methods. Furthermore, cross-tabulation was employed to supplement the analysis by capturing attribute-based trends that cannot be fully elucidated through quantitative variables alone.
5. Results
5.1. Descriptive Statistics
I clarify the overall situation using descriptive statistics in Table 2. Although Japan’s population decreased by 1.4%, the number of households increased by 9.8%. The three urban components also increased, although the growth magnitude varied by component. The area of residential land showed the largest growth rate, followed by the length of municipal roads, whereas the floor area of administrative properties increased only slightly. The high average value for the floor areas of administrative properties is likely influenced by the fact that some municipalities are still developing public facilities that provide new, large floor areas. When considering the median values, the trend is largely consistent with the national pattern.
Table 2.
Descriptive statistics.
5.2. Relationship Between Total Volume and Population/Households
Table 3 summarizes the correlation matrices. For both years, the three urban components showed high correlations with population and households. However, the degree of correlation was highest for the floor area of administrative properties, exceeding 0.95, followed by the area of residential land at 0.89–0.90. Meanwhile, the correlations of the length of municipal roads with population and households were approximately 0.71 and 0.69, respectively, both being somewhat lower. There are no substantial differences between 2012 and 2022, suggesting this trend is consistent over time.
Table 3.
Correlation between floor area of administrative properties, length of municipal roads, area of residential land, and population/households.
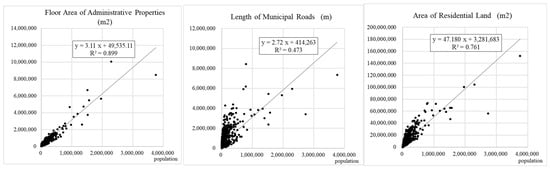
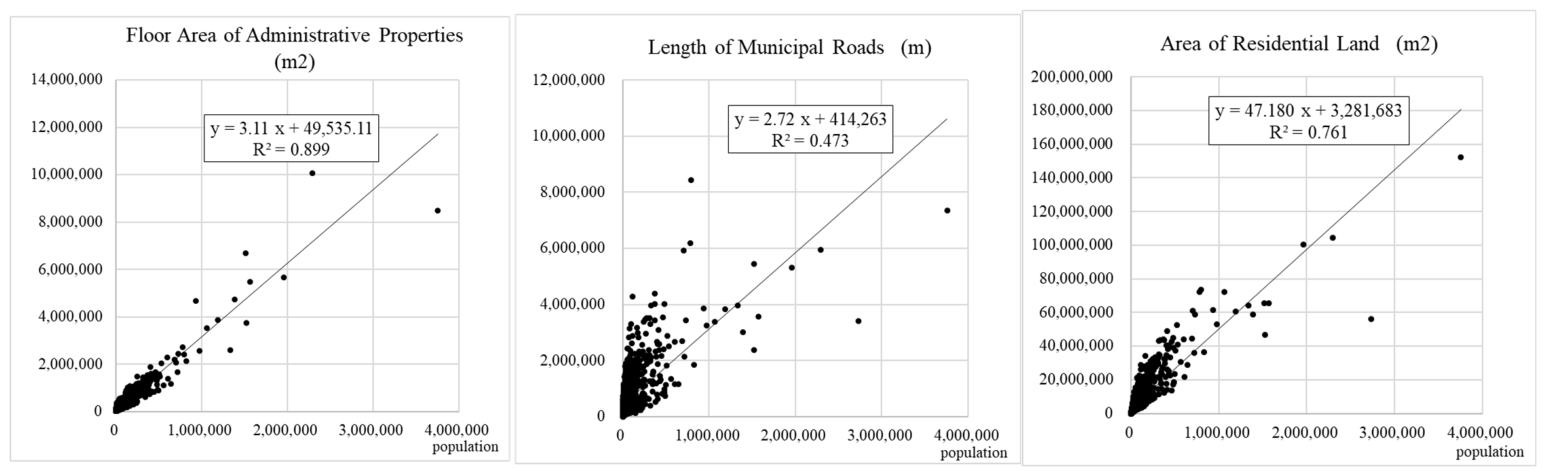
Figure 2 shows the scatter plots of the relationship between the population in 2022 and the three urban components. Although municipalities with large populations appear as outliers, they do not substantially impact the overall pattern. All components exhibit high coefficients of determination, but the floor area of administrative properties stands out, with population alone explaining 90% of the variation. The area of residential land also has a high coefficient of determination, although not as high as the floor area of administrative properties. The difference is likely influenced by factors such as disparity in residential space sizes between metropolitan and regional areas. The length of municipal roads also shows a reasonable correlation, although not as strong as that for the floor area of administrative properties or area of residential land. This is likely because in rural towns and villages, roads need to be laid out even in sparsely populated areas, leading to a tendency for road length to increase regardless of the total population or number of households. Nevertheless, overall, the three urban components correlate with population and households.
Figure 2.
Scatter plots of urban components and population.
5.3. Relationship Between Growth Rates
Table 4 summarizes the correlation between increases and decreases in the urban components and population/households over 10 years (2012–2022), comprising all objective municipalities and areas classified by increasing and decreasing populations and households. Looking at all municipalities, the correlations of the area of residential land with population and households are relatively high at 0.426 and 0.440, respectively. Meanwhile, the correlations for the length of municipal roads are low at 0.151 and 0.127, and the correlations for the floor area of administrative properties are almost nonexistent at 0.058 and 0.056.
Table 4.
Correlation between 10-year increase/decrease in population/households and the urban components.
When comparing population-growing and population-declining municipalities, the correlations for the floor area of administrative properties and length of municipal roads are higher in the former than in the latter, indicating an increase in per capita burden for the maintenance of these components, as they do not diminish as much as population and household decline. The correlation for the area of residential land seems to show a different tendency and relatively higher correlation for population-declining municipalities.
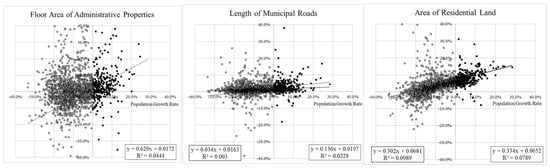
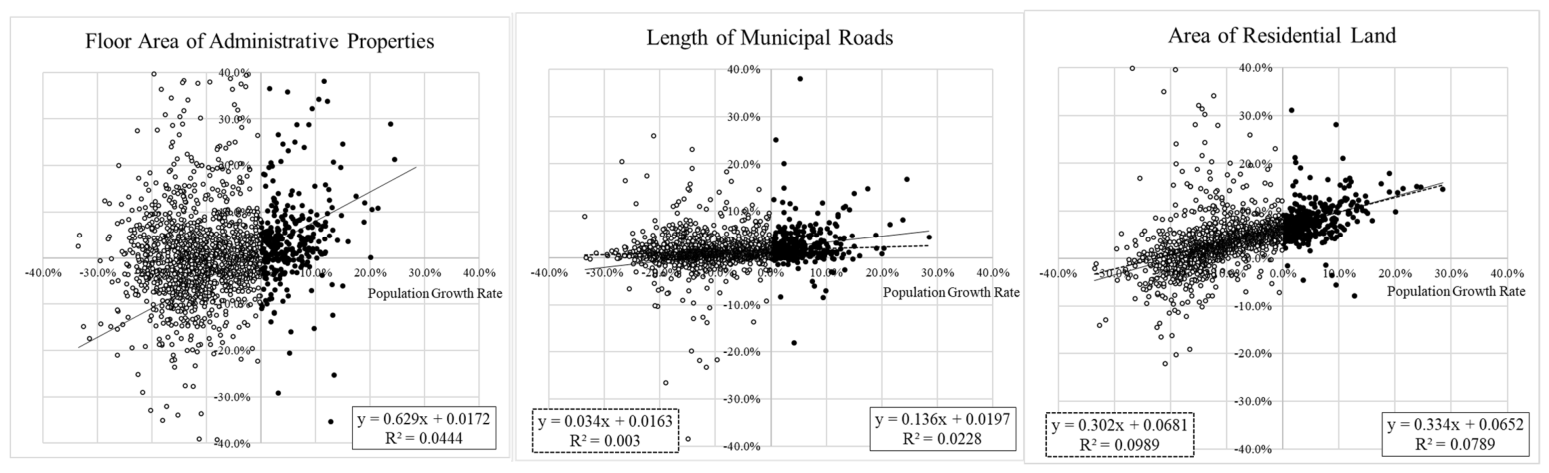
Table 5 summarizes the results of simple regression analysis performed separately for population-growing and population-declining municipalities, examining the three urban components against population. Figure 3 displays the resulting regression lines alongside scatter plots. In population-growing municipalities, a significant positive relationship is observed between population and the urban components. This positive relationship is strongest for the floor area of administrative properties (0.629) and weakest for the length of municipal roads (0.136). This suggests public facilities show the strongest relationship with population. However, in population-declining municipalities, the significance of population correlations with the floor area of administrative properties or length of municipal roads decreases. Notably, the relationship for the floor area of administrative properties becomes insignificant in population-declining municipalities. Further, although the changes in the length of municipal roads and area of residential land show significant positive correlations with population change, their coefficients are smaller. These results imply that although the urban components can maintain a positive relationship with the population during population growth, maintaining this positive relationship becomes difficult during population decline. In addition, examining the intercepts of regression lines reveals that the area of residential land is substantially larger and statistically significant in population-growing and population-declining municipalities. Because the intercept represents the estimated growth rate of the dependent variable when population change is 0% in the model, a strong overall upward trend in the area of residential land is implied even during population decline.
Table 5.
Results of simple regression analyses for population and three urban components.
Figure 3.
Scatter plots of urban components and regression lines by population growth/decline. Note: In each scatter plot, regression analysis for population-growing municipalities is shown by solid lines and the equation in the lower right corner, while regression analysis for population-declining municipalities is shown by dashed lines and the equation in the lower left corner. Regression analyses where the intercept or regression coefficient is not significant are not displayed.
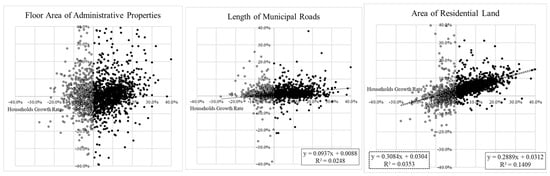
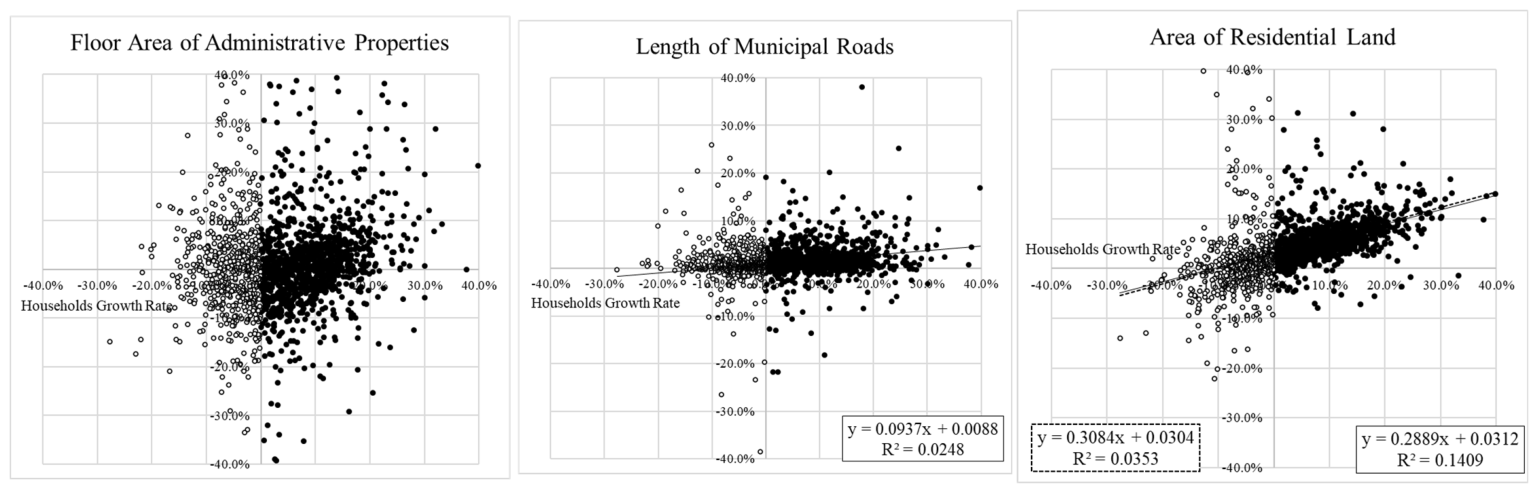
Figure 3 clearly shows the aforementioned characteristics. During population decline phases, the variation in changes in the floor area of administrative properties is markedly greater than that in the length of municipal roads or area of residential land, which decreases the statistical significance and intercept of the coefficient. It is inferred that changes in the floor area of administrative properties are more susceptible to factors other than population decline than changes in the length of municipal roads or area of residential land. Similar observations apply to the relationship between changes in households and the three urban components (Table 6; Figure 4).
Table 6.
Results of simple regression analyses for households and three urban components.
Figure 4.
Scatter plots of urban components and regression lines by household increase/decrease. Note: In each scatter plot, regression analysis for household-growing municipalities is shown by solid lines and the equation in the lower right corner, while regression analysis for household-declining municipalities is shown by dashed lines and the equation in the lower left corner. Regression analyses where the intercept or regression coefficient is not significant are not displayed.
In municipalities experiencing household decline, the relationship between changes in households and the floor area of administrative properties or the length of municipal roads is even weaker than that observed for population decline, and the regression coefficients become insignificant. Meanwhile, the relationship between changes in households and the area of residential land shows relatively similar regression coefficients, whether in municipalities with increasing or decreasing households.
5.4. Categorization of Increase/Decrease into Four Quadrants
Table 7 summarizes the relationship between population and household growth/decline and changes in the three urban components, categorized into four quadrants based on positive or negative trends. Examining the relationship between population and the three urban components, the proportions of municipalities experiencing decreases in the floor area of administrative properties, length of municipal roads, and area of residential land are relatively low at 46% (784 municipalities), 19% (331 municipalities), and 16% (280 municipalities), respectively, compared with those experiencing population decline at 81% (1384 municipalities). Further, focusing solely on population-declining municipalities, the majority of them are experiencing increases in the length of municipal roads and area of residential land. For example, among 1384 population-declining municipalities, only 292 show a decrease in the length of municipal roads and only 274 municipalities show a decrease in the area of residential land. Meanwhile, over half (694 municipalities) show a decrease in the floor area of administrative properties.
Table 7.
Four-quadrant diagram of population/households and three urban components.
Regarding households, although municipalities with increasing households still account for a large proportion, 1113 municipalities (65%), a similar trend to population changes can be observed in relation to the urban components. Among the 596 municipalities experiencing household declines, half (298 municipalities) also show a decrease in the floor area of administrative properties. Conversely, the length of municipal roads and area of residential land increased in most municipalities experiencing household declines (432 and 357 municipalities, respectively).
When interpreting these dichotomous classifications, caution is required. The simple categories of increasing and decreasing households mask changes in household composition: even where the total number of households increases, its internal structure may be shifting toward single- and two-person households, reflecting postponed family formation among the working-age population and the growth of elderly one-person households [33]. Because different household types demand different amounts and types of residential space and urban services, the same rate of household change can have different implications for the urban components. The dichotomous classification employed here should therefore be regarded as a first-order categorization, and a more detailed analysis by household composition remains an important task, as discussed in Section 7.
6. Discussion
Based on the above analyses, discussions on the hypotheses are presented accordingly.
H1.
As a result of urbanization, there is a strong correlation among the floor area of administrative properties, length of municipal roads, area of residential land, and population size.
Based on the analysis in Section 5.2 and the results presented in Table 3 and Figure 2, a correlation is evident, although there are some differences among the three urban components. Therefore, H1 is accepted. It can be said that urban components have been developed in proportion to urbanization and population growth. This study confirmed the significant positive correlation between population and urban components, underlying many existing studies that primarily focus on periods of population growth. These results can also be compared with previous research. The strong cross-sectional correlations of the floor area of administrative properties and the area of residential land with population are consistent with the demand-driven supply mechanism assumed in existing studies of facility planning and urbanization [39,40,61]. The relatively weaker correlation of the length of municipal roads is consistent with the finding that road length per resident is greater in low-density areas [48]: in rural municipalities, a minimum road network must be provided regardless of the number of residents, which weakens the linear relationship between total length and population. Confirming these relationships across 1709 municipalities of widely varying sizes provides a nationwide empirical foundation that individual case studies could not offer.
H2.
The reduction in the floor area of administrative properties, length of municipal roads, and area of residential land does not keep pace with population and household decline.
In Section 5.3, examining the correlations between increases and decreases in Table 4 shows that the correlation for the floor area of administrative properties and length of municipal roads is lower in municipalities experiencing population and household decline than in those experiencing growth. Further, examining the coefficients and significance levels from the simple regression analysis (Table 5 and Table 6) reveals that the significance levels decrease in municipalities experiencing population and household declines, becoming nonsignificant in some cases. Therefore, H2 is accepted for these two urban components.
Regarding the area of residential land, there was no significant difference in the coefficients or significance levels between municipalities with increasing and decreasing populations/households. This indicates a significant relationship where the area of residential land increases or decreases in response to population/household growth or decline. Meanwhile, because the intercept is also positive and significant, it suggests that although the area of residential land increases or decreases proportionally with population/household changes, it tends to maintain a higher growth rate than population/households themselves. Therefore, H2 is also accepted for the area of residential land.
Applying the above results to real policies implies that it is difficult to reduce these urban components even as demand decreases during population decline phases, whereas the urban components develop in response to expanding demand for urban services during population growth phases. The varying correlations observed for the floor area of administrative properties and length of municipal roads between population growth and decline phases imply that particular caution is required when constructing urban models using these components. Specifically, when creating urban models that incorporate public facilities and road networks, coefficients corresponding to population growth and decline will likely need to be adjusted separately. Regarding the area of residential land, the growth rate is inherently increasing regardless of the population growth/decline.
H3.
The degree of reduction in thethree urban components varies in response tothe extent of population declinein each municipality. In municipalities experiencing population decline, the floor area of administrative properties tends to decrease significantly, whereas the length of municipal roads and area of residential land often do not decrease in several municipalities.
Based on Table 7, the total area of administrative properties decreases in approximately half of the population-declining municipalities. However, the proportions where the length of municipal road and area of residential land decrease are small, at 21% and 14%, respectively. Therefore, H3 is also accepted. However, examining the regression analysis presented in Section 5.3 via Table 5 and Figure 3 reveals that the coefficient for the simple regression analysis of the floor area of administrative properties in population-declining municipalities is no longer significant and the variation is large, suggesting that factors other than population are exerting a stronger influence.
In any case, the differing trends in the three urban components within population-declining municipalities imply risks of discrepancies in administrative services at respective municipalities. The abolition of public facilities while roads and urban areas largely remain intact may prevent the restructuring of consistent services. Theoretically, these results suggest that the temporal lag among urban components occurs, as physical lifecycles and the ease of restructuring vary across these types. It is posited that lines, which function through interconnection, experience greater time lags than points, each of which operates with an independent function. Furthermore, surfaces are thought to entail even longer time lags, as they cannot be easily controlled by the public sector within the socio-economic systems of capitalist economies, including that of Japan. The findings also correspond with international research. He et al. [49] reported a worsening decoupling between transportation land and population in Guangdong Province, China; the present study confirms an analogous decoupling of municipal road length under nationwide population decline in Japan. The continued expansion of residential land despite population and household decline parallels the European evidence that urban land area kept spreading even in cities losing both population and households [56], as well as the reported persistence of growth-oriented spatial policies in shrinking cities [10,11]. It is also consistent with Japanese housing vacancy research showing that vacant houses accumulate on residential land that is not converted to other uses [24]; the expansion of residential land concurrent with rising vacancies implies that the utilization side and the physical stock side of urban shrinkage must be assessed with separate indicators, and the present study complements the vacancy-oriented literature by quantifying the latter.
7. Conclusions
This study examined the relationship between changes in population/households and three urban components—public facilities, road networks, and urban areas—using two municipal-level datasets [59,60]. The analysis shows that these components were supplied in step with population growth but were not correspondingly downsized during population decline; in several declining municipalities, they even expanded despite the decrease in population and households. This asymmetry—supply that responds to growth but not to decline—is the principal finding of this study.
These findings indicate a growing mismatch between population and urban components in declining municipalities, an issue that research on adaptation to population decline [62,63,64] should further address.
As a future research problem, it is necessary to analyze the relationship between demographic stratum dynamics and urban components to clarify the specific relationship between population/household change and urban components. For example, the Survey on Public Facilities is published by facility type, enabling the analysis of relationships such as the floor area of public elementary schools and the number of elementary school students. Nevertheless, it is difficult to identify the specific public facility types for the elderly or other demographic layers, suggesting that more detailed individual data will be required. Household composition (e.g., single- or two-person households) may also be a relevant factor influencing urban components, warranting further investigation in future research. Moreover, the future study would benefit from a more granular typological approach rather than relying on a rudimentary dichotomous categorization of “growing” versus “declining” populations in this paper.
Further, when considering the accessibility of urban services, spatial analysis based on the locations of urban components is essential. Spatial spillover effects among contiguous municipalities might also be analyzed by spatial autocorrelation tests. In Japan, the (public) Fixed Asset Ledgers issued by each municipality may be used for the study of public facilities, while each infrastructure has a ledger specific to each type, such as the road or water supply facility ledger. For urban areas, data from the Basic Urban Planning Survey provided for urban planning zones and National Land Numerical Information based on satellite data are available, allowing for some level of estimation. Conducting more detailed research will be necessary to clarify the status of urban components in relation to the population/households and several other factors to influence such as municipal fiscal health, demographic aging rates, local industrial structures, and topographical constraints, as well as to provide a reference for planning methodologies to adapt to population decline based on the results of these analyses. Since opposition from existing residents is anticipated regarding the reduction in urban components in response to population decline, there is a strong need for urban planning methods that facilitate a smooth reduction without compromising the quality of urban services.
Funding
This research was partly supported by a General Research Grant from the Kajima Foundation.
Institutional Review Board Statement
Ethical review and approval were waived for this study, because it used secondary analyses of pre-existing anonymous data, and this study did not directly involve human participants.
Informed Consent Statement
Informed Consent Statement was not required for this study because it used secondary analyses of pre-existing anonymous data, and this study did not directly involve human participants.
Data Availability Statement
The data presented in this study are publicly available from the Ministry of Internal Affairs and Communications (MIC) of Japan. The “Survey on Public Facilities” (公共施設状況調, Kōkyō-shisetsu-jōkyō-shirabe) is available online at https://www.soumu.go.jp/iken/shisetsu/ (accessed on 30 April 2026), and the “Summary Report on Prices, etc. of Fixed Assets” (固定資産の価格等の概要調書, Kotei-shisan-no-kakaku-tō-no-gaiyō-chōsho) is available online at https://www.soumu.go.jp/main_sosiki/jichi_zeisei/czaisei/czaisei_seido/ichiran08.html (accessed on 30 April 2026). The data supporting the conclusions of this article are drawn from online sources in the public domain, which are individually cited and appear in the references. An Excel spreadsheet of these data, and the author’s dichotomous transformations of these data, will be made available by the author upon request.
Acknowledgments
The author wishes to thank a series of anonymous reviewers who, previous to and following submission and processing of the manuscript, influenced the final product of this research.
Conflicts of Interest
The author declares that this study received funding from Kajima Foundation. The funder was not involved in the study design, collection, analysis, interpretation of data, the writing of this article or the decision to submit it for publication.
References
- Molotch, H. The city as a growth machine: Toward a political economy of place. Am. J. Sociol. 1976, 82, 309–332. [Google Scholar] [CrossRef] [Scilit] [PubMed]
- United Nations Department of Economic and Social Affairs, Population Division. World Population Prospects 2022: Summary of Results; UN DESA/POP/2022/TR/NO. 3; United Nations: New York, NY, USA, 2022. [CrossRef] [Scilit]
- Mallach, A.; Haase, A.; Hattori, K. The shrinking city in comparative perspective: Contrasting dynamics and responses to urban shrinkage. Cities 2017, 69, 102–108. [Google Scholar] [CrossRef] [Scilit]
- Matanle, P. Depopulation Dividend for a Shrinking Japan. AsiaGlobal Online, 5 July 2018. Available online: https://www.asiaglobalonline.hku.hk/depopulation-japan-aging-sustainability/ (accessed on 1 May 2026).
- Wiechmann, T.; Pallagst, K.M. Urban shrinkage in Germany and the USA: A comparison of transformation patterns and local strategies. Int. J. Urban Reg. Res. 2012, 36, 261–280. [Google Scholar] [CrossRef] [Scilit] [PubMed]
- Grossmann, K.; Bontje, M.; Haase, A.; Mykhnenko, V. Shrinking cities: Notes for the further research agenda. Cities 2013, 35, 221–225. [Google Scholar] [CrossRef] [Scilit]
- Martinez-Fernandez, C.; Weyman, T.; Fol, S.; Audirac, I.; Cunningham-Sabot, E.; Wiechmann, T.; Yahagi, H. Shrinking cities in Australia, Japan, Europe and the USA: From a global perspective. Int. J. Urban Sci. 2016, 105, 1–48. [Google Scholar] [CrossRef] [Scilit]
- Haase, A.; Rink, D.; Grossmann, K. Shrinking cities in post-socialist Europe: What can we learn from their analysis for theory building today? Geogr. Ann. Ser. B Hum. Geogr. 2016, 98, 305–319. [Google Scholar] [CrossRef] [Scilit]
- Haase, A.; Rink, D.; Grossmann, K.; Bernt, M.; Mykhnenko, V. Conceptualizing urban shrinkage. Environ. Plan. A Econ. Space 2014, 46, 1519–1534. [Google Scholar] [CrossRef] [Scilit]
- Marjanović, M.; Sagot Better, M.; Lero, N.; Nedovic-Budic, Z. Can acceptance of urban shrinkage shift planning strategies of shrinking cities from growth to de-growth? Urban Plan. 2024, 9, 6904. [Google Scholar] [CrossRef] [Scilit]
- Ortiz-Moya, F.; Sieloff, S. Urban planning responses to population decline in Japan’s shrinking cities: Growth strategies vs. decline management. Geogr. Ann. Ser. B Hum. Geogr. 2025, 107, 1–24. [Google Scholar] [CrossRef] [Scilit]
- Seta, F. Shrinkage does not follow population decline on a regional scale: Planning and reality of residential area in Japan. Land 2024, 13, 1543. [Google Scholar] [CrossRef] [Scilit]
- Seta, F. Beyond the Restructuring of Public Facilities. J. Policy Adm. 2016, 39, 33–38. [Google Scholar] [CrossRef] [PubMed]
- Beauregard, R.A. Urban population loss in historical perspective: United States, 1820–2000. Environ. Plan. A Econ. Space 2009, 41, 514–528. [Google Scholar] [CrossRef] [Scilit]
- Dijkstra, L.; Garcilazo, E.; McCann, P. The economic performance of European cities and city regions: Myths and realities. Eur. Plan. Stud. 2013, 21, 334–354. [Google Scholar] [CrossRef] [Scilit]
- Wolff, M.; Wiechmann, T. Urban growth and decline: Europe’s shrinking cities in a comparative perspective 1990–2010. Eur. Urban Reg. Stud. 2017, 25, 12–29. [Google Scholar] [CrossRef] [Scilit]
- Guo, F.; Qu, X.; Ma, Y.; Tong, L. Spatiotemporal pattern evolution and influencing factors of shrinking cities: Evidence from China. Cities 2021, 119, 103391. [Google Scholar] [CrossRef] [Scilit]
- Hu, D.; Pai, J.-T. Identification of shrinking cities: Based on Census and Registered Population on the Main Island of Taiwan. In Proceedings of the International Conference of Asia-Pacific Planning Societies 2021 (ICAPPS 2021), Online, 21–22 August 2021. [Google Scholar]
- Wang, Q.; Xin, Z.; Niu, F. Analysis of the spatio-temporal patterns of shrinking cities in China: Evidence from nighttime light. Land 2022, 11, 871. [Google Scholar] [CrossRef] [Scilit]
- Yuqi, Z.; Ochiai, C. A study on the long-term spatio-temporal changes of shrinking cities in China. Urban Reg. Plan. Rev. 2023, 10, 158–178. [Google Scholar] [CrossRef] [Scilit]
- Nishioka, H.; Esaki, Y.; Koike, S.; Yamauchi, M. (Eds.) The Official Regional Population Projections of Japan: Methodologies and Results; Springer: Singapore, 2025; Available online: https://link.springer.com/book/10.1007/978-981-96-2941-1 (accessed on 1 May 2026).
- Haase, A.; Wolff, M.; Rink, D. From shrinkage to regrowth: The nexus between urban dynamics, land use change and ecosystem service provision. In Urban Renewal and Transformation; Haase, A., Rink, D., Wolff, M., Eds.; Springer: Cham, Switzerland, 2018; pp. 201–220. [Google Scholar] [CrossRef] [Scilit] [PubMed]
- Xie, Y.; Gong, H.; Lan, H.; Zeng, S. Examining shrinking city of Detroit in the context of socio-spatial inequalities. Landsc. Urban Plan. 2018, 177, 33–42. [Google Scholar] [CrossRef] [Scilit]
- Kubo, T.; Yui, Y. (Eds.) The Rise in Vacant Housing in Post-growth Japan: Housing Market, Urban Policy, and Revitalizing Aging Cities; Springer: Singapore, 2020. [Google Scholar] [CrossRef] [Scilit]
- Döringer, S.; Uchiyama, Y.; Penker, M.; Kohsaka, R. A meta-analysis of shrinking cities in Europe and Japan. Towards an integrative research agenda. Eur. Plan. Stud. 2019, 28, 1693–1712. [Google Scholar] [CrossRef] [Scilit]
- Slach, O.; Bosák, V.; Krtička, L.; Nováček, A.; Rumpel, P. Urban shrinkage and sustainability: Assessing the nexus between population density, urban structures and urban sustainability. Sustainability 2019, 11, 4142. [Google Scholar] [CrossRef] [Scilit]
- Matanle, P.; Rausch, A.S. (Eds.) Japan’s Shrinking Regions in the 21st Century; Cambria Press: Amherst, NY, USA, 2011. [Google Scholar]
- Jain, V.; Okazawa, Y. Case Study on Territorial Development in Japan; Tokyo Development Learning Center Policy Paper Series, No. 2; World Bank: Tokyo, Japan, 2019; Available online: https://openknowledge.worldbank.org/handle/10986/31940 (accessed on 1 May 2026).
- Statistical Bureau, Ministry of Internal Affairs and Communications. Final Report of the 2015 Population Census: Population and Households of Japan (Summary Report); Statistical Bureau, Ministry of Internal Affairs and Communications: Tokyo, Japan, 2018. Available online: http://www.stat.go.jp/english/data/kokusei/2015/final_en/final_en.html#Summary (accessed on 1 May 2026).
- Aoki, T. Which generation should migration promotion measures target to shortly achieve a compact structure for shrinking cities? Cities 2024, 150, 105020. [Google Scholar] [CrossRef] [Scilit]
- Aoki, T.; Kadono, Y. New towns in the Kyoto-Osaka-Kobe area: Typological analysis of regional characteristics based on population structure and inflow. Urban Reg. Plan. Rev. 2020, 7, 43–66. [Google Scholar] [CrossRef] [Scilit]
- Tateishi, E.; Takahashi, K.; Nakano, T. Governance reaction to the emerging megacity shrinkage in Tokyo: The case of the Tsukuba express transit-suburban region. Cities 2021, 109, 103033. [Google Scholar] [CrossRef] [Scilit]
- Buzar, S.; Ogden, P.E.; Hall, R. Households matter: The quiet demography of urban transformation. Prog. Hum. Geogr. 2005, 29, 413–436. [Google Scholar] [CrossRef] [Scilit]
- Haartsen, T.; Van Wissen, L. Causes and Consequences of Regional Population Decline for Primary Schools. Tijdschr. Econ. Soc. Geogr. 2012, 103, 487–496. [Google Scholar] [CrossRef] [Scilit]
- Koontz, C.; Jue, D.; Bishop, B. Public library facility closure: An investigation of reasons for closure and effects on geographic market areas. Libr. Inf. Sci. Res. 2009, 31, 84–91. [Google Scholar] [CrossRef] [Scilit]
- Holmes, G.M.; Slifkin, R.; Randolph, R.; Poley, S.T. The effect of rural hospital closures on community economic health. Health Serv. Res. 2006, 41, 467–485. [Google Scholar] [CrossRef] [Scilit] [PubMed]
- Whitehead, J.; Pearson, A.; Lawrenson, R.; Atatoa-Carr, P. Framework for examining the spatial equity and sustainability of general practitioner services. Aust. J. Rural Health 2018, 26, 336–341. [Google Scholar] [CrossRef] [Scilit] [PubMed]
- Neumeier, S. Accessibility to services in rural areas. disP Plan. Rev. 2016, 52, 32–49. [Google Scholar] [CrossRef] [Scilit]
- van Bunningen, E. Concentration of Public Services in Municipal Real Estate in Response to Demografic Transition. In Exploring Energy Neutral Development: Part 3; Han, Q., Schaefer, W.F., Eds.; Technische Universiteit Eindhoven: Eindhoven, The Netherlands, 2013. [Google Scholar]
- Park, S.-J.; Kang, I.-H. An empirical study on the location and management plan of public facilities in the rural center place by declining population. J. Korean Inst. Rural Archit. 2018, 20, 27–35. [Google Scholar] [CrossRef] [Scilit]
- Charasz, P.; Vogler, J.P. Does EU funding improve local state capacity? Evidence from Polish municipalities. Eur. Union Polit. 2021, 22, 446–471. [Google Scholar] [CrossRef] [Scilit]
- Hsieh, P.-C.; Tsunoda, M. Facility Evaluation of Administrative Cost and Availability of Public Facilities: A Case Study of Tama City. In Proceedings of Building Stock Activation; Tokyo Metropolitan University: Tokyo, Japan, 2007. [Google Scholar]
- Hijino, K.V.L. The politics of depopulation in Japanese municipalities: Ideas and underlying ideologies. Contemp. Jpn. 2023, 36, 200–221. [Google Scholar] [CrossRef] [Scilit]
- Kimura, S. Outlook for Facility Management in Urban Local Governments—Fiscal Challenges and the Future Social Landscape. Meiji J. Gov. Stud. 2019, 4, 1–16. [Google Scholar]
- Kruszyna, M.; Śleszyński, P.; Rychlewski, J. Dependencies between demographic urbanization and the agglomeration road traffic volumes: Evidence from Poland. Land 2021, 10, 47. [Google Scholar] [CrossRef] [Scilit]
- Duranton, G.; Turner, M. Urban growth and transportation. Rev. Econ. Stud. 2008, 79, 1403–1440. [Google Scholar] [CrossRef] [Scilit]
- Taillanter, E.; Barthelemy, M. Evolution of road infrastructures in large urban areas. SSRN Electron. J. 2022, 7, 034304. [Google Scholar] [CrossRef] [Scilit]
- Cleveland, T.; Dec, P.; Rainham, D. Shorter roads go a long way: The relationship between density and road length per resident within and between cities. Can. Plan. Policy 2020, 2020, 71–89. [Google Scholar] [CrossRef] [Scilit]
- He, J.; Yang, S.; Deng, S.; Ye, J.; Chen, H. Research on the decoupling relationship between transportation land and population growth: A case of Guangdong province in China. Land 2024, 13, 484. [Google Scholar] [CrossRef] [Scilit]
- Shan, X.; Li, Z.; Shao, X.; Wang, X.; Feng, Z.; Wu, K. How do population changes and land use policies affect the relationship between the urban economy and public services? Land 2024, 13, 524. [Google Scholar] [CrossRef] [Scilit]
- Ohara, A.; Setoguchi, T. The Proposal for Yubari Compact City 2040 with Consolidation of Urban Area in Population Declining City: A Study for the Urban Integration Plan in Yubari City, Hokkaido. In Proceedings of the Nineteenth International Scientific Conference; PNU Press: Khabarovsk, Russia, 2019; Volume 2, pp. 22–26. [Google Scholar]
- Kato, H. How does the location of urban facilities affect the forecasted population change in the Osaka Metropolitan Fringe Area? Sustainability 2020, 13, 110. [Google Scholar] [CrossRef] [Scilit]
- Kamata, Y.; Nam, K.-W. Compact city strategies from the perspective of Japan’s location optimization plan: Focusing on the BUG region. J. Korea Plan. Assoc. 2025, 60, 92–108. [Google Scholar] [CrossRef] [Scilit]
- Hebbert, M. Urban sprawl and urban planning in Japan. Town Plan. Rev. 1986, 57, 141–158. [Google Scholar] [CrossRef] [Scilit]
- Sorensen, A. Building Suburbs in Japan: Continuous unplanned change on the urban fringe. Town Plan. Rev. 2001, 72, 247–273. [Google Scholar] [CrossRef] [Scilit]
- Haase, D.; Kabisch, N.; Haase, A. Endless urban growth? On the mismatch of population, household and urban land area growth and its effects on the urban debate. PLoS ONE 2013, 8, e66531. [Google Scholar] [CrossRef] [Scilit] [PubMed]
- Kikuchi, H.; Emberger, G.; Ishida, H.; Fukuda, A.; Kobayakawa, S. Dynamic simulations of compact city development to counter future population decline. Cities 2022, 127, 103753. [Google Scholar] [CrossRef] [Scilit]
- Wang, Y.; Homma, R. Prediction on optimum population capacity determined by facility density: A case of residence attraction areas in Kumamoto. Int. Rev. Spat. Plan. Sustain. Dev. 2023, 11, 81–98. [Google Scholar] [CrossRef] [Scilit] [PubMed]
- Ministry of Internal Affairs and Communications. Survey on Public Facilities (Kōkyō-Shisetsu-Jōkyō-Shirabe). Available online: https://www.soumu.go.jp/iken/shisetsu/ (accessed on 30 April 2026).
- Ministry of Internal Affairs and Communications. Summary Report on Prices, etc. of Fixed Assets (Kotei-Shisan-No-Kakaku-Tō-No-Gaiyō-Chōsho). Available online: https://www.soumu.go.jp/main_sosiki/jichi_zeisei/czaisei/czaisei_seido/ichiran08.html (accessed on 30 April 2026).
- Christiaanse, S. Rural facility decline: A longitudinal accessibility analysis questioning the focus of Dutch depopulation-policy. Appl. Geogr. 2020, 121, 102251. [Google Scholar] [CrossRef] [Scilit]
- Nemoto, Y.; Fujiki, H. Development of a standard model for comprehensive management plans for public facilities, and model cases. Public Policy Rev. 2016, 12, 69–94. [Google Scholar]
- van Ham, M.; Ubareviciene, R.; Burneika, D. Shrinking regions in a shrinking country: The geography of population decline in Lithuania 2001–2011. Urban Stud. Res. 2016, 5395379. [Google Scholar] [CrossRef] [Scilit]
- Batunova, E.; Gunko, M. Urban shrinkage: An unspoken challenge of spatial planning in Russian small and medium-sized cities. Eur. Plan. Stud. 2018, 26, 1580–1597. [Google Scholar] [CrossRef] [Scilit]

Disclaimer/Publisher’s Note: The statements, opinions and data contained in all publications are solely those of the individual author(s) and contributor(s) and not of MDPI and/or the editor(s). MDPI and/or the editor(s) disclaim responsibility for any injury to people or property resulting from any ideas, methods, instructions or products referred to in the content. |
© 2026 by the author. Licensee MDPI, Basel, Switzerland. This article is an open access article distributed under the terms and conditions of the Creative Commons Attribution (CC BY) license.