
Article

Micro-CT Scanning Tracks: A Means for Non-Destructively Exploring Volumetric Track Formation
by
Tash L. Prescott
*,
Benjamin W. Griffin
,
Andréas Jannel
and
Peter L. Falkingham
School of Biological and Environmental Sciences, Liverpool John Moores University, Liverpool L3 3AF, UK
*
Author to whom correspondence should be addressed.
Foss. Stud. 2026, 4(2), 14; https://doi.org/10.3390/fossils4020014
Submission received: 16 March 2026 / Revised: 21 May 2026 / Accepted: 23 May 2026 / Published: 1 June 2026
(This article belongs to the Special Issue New Directions in the Study of Vertebrate Trace Fossils)

Abstract

Animals frequently traverse a range of deformable substrates, leaving tracks. Track morphology is controlled by anatomy and motions of the foot, and substrate consistency, resulting in complex, three-dimensional structures that record dynamic foot-substrate interactions. Understanding such interactions can provide valuable biological and environmental insights, but visualising them remains challenging. Prior physical experiments explored track formation using various indenters impressed into a range of substrate types and consistencies. However, to visualise the deformation below the surface, destructive methods such as physical sectioning are often used, typically resulting in the sample being destroyed. Here, we present the methodology and challenges involved in experimentally generating tracks and introduce micro-CT scanning as a non-destructive approach to visualising sub-surface sediment movement during track formation. Two separate track volumes were produced using different substrate consistencies (‘soft’ and ‘very soft’) whereby sand and clay were alternately layered and then scanned during indentation by a cadaveric pheasant (Phasianus colchicus) foot. Across the two substrate consistencies, the CT reconstructions revealed differences in sub-surface sediment displacement, and in complex sub-surface features. Although there are challenges attributed to experimentally producing and visualising tracks, micro-CT offers a novel approach to viewing sub-surface sediment movement during experimental track formation in the lab.

1. Introduction

In nature, animals commonly traverse a variety of compliant substrates, often leaving tracks [1,2,3,4,5,6]. Fossil tracks can provide a wealth of biological information, such as locomotor capabilities [7,8,9,10,11,12] and anatomy of a trackmaker [13], as well as insights into the environmental conditions at the time of track formation [7,11,12,14,15,16,17,18,19,20,21,22]. There are three main factors that play an important role in the final morphology of a track: the anatomy and motions of the foot, and the substrate consistency at the time of formation [2,5,18,23,24,25]. Because of this, tracks are not simple anatomical imprints, and are rarely straightforward surface features [25,26]. Instead, tracks are complex, three-dimensional volumetric structures embodying the dynamic foot-substrate interaction [3,27,28,29,30,31,32]. However, with much of the sub-surface sediment movement and foot motions being obscured from view, visualising such interactions, even after the fact, remains challenging.
Visualising volumetric track morphology is notoriously difficult. In fossil tracks, this has generally required either destructively splitting rocks along or across laminations, or finding them naturally exposed in such a way [27,33,34,35,36]. A wealth of tracks from the Connecticut Valley collected by Edward Hitchcock in the 1830s–1850s and exposed as multiple surfaces within track volumes [37,38,39] has been instrumental in understanding track formation [25,26,29,30,40,41]. Unfortunately, such exposures require chance or destructive sampling, neither of which are desirable. Attempts to peer inside fossil tracks using CT scanning have so far been unsuccessful due to poor contrast between layers and very high overall density [42], though the possibility remains enticing. Using fossil tracks to study volumetric morphology can therefore be limiting and frustrating.
Ichnologists have therefore made significant efforts to understand the sub-surface track forming process via physical experiments, exploring how the deformation of sub-surface layers is transmitted from the surface [1,2,15,16,17,18,19,43]. These studies have used either flat arbitrary indenters [1,2,15,18], model feet [19,44], cadaveric bird feet [17,43], and in vivo experiments [43] to reflect diversity in trackmaker foot morphology. Indenters have often been manipulated to try to capture realistic foot motions, being impressed vertically, with a simple down and up motion [1,2,17,18,19] or with an added forward rolling movement [15], into substrates of varying consistency. Substrates such as plasticine [1,2], sand and plaster of Paris [15], coloured cement [17,43], plus clay, sand, and cement mixtures [16,18,19] have been used to facilitate examination of sub-surface deformation. In all cases, the substrate was hardened or stabilised and then physically sliced vertically or horizontally. In the case of interbedded hardening and non-hardening substrates (e.g., plaster of Paris and sand), 3D sub-surface tracks can be extracted. These processes may alter the track morphology by disrupting the structural arrangement of sediment layers or may result in a loss of context between and around recovered layers.
Recently, X-ray videos have been used to observe and capture footprint formation below the surface [29,31,41,45]. Efforts to capture sediment motion and deformation have been limited in spatial resolution [45] or have required abstraction to computer simulation [4,25,29,40,41,46,47,48]. These methods are particularly useful for penetrative tracks, in which the foot passes through multiple layers of soft sediment, and sub-surface deformation is caused directly by the foot rather than the transmission of force and displacement [25,40,49]. Foot motions such as splaying and collapse of digits [30], foot rotation [11,50], and looping of the foot [30,41] can create complex deformation structures beneath the exposed surface on which the animal walked. Because penetrative tracks require very compliant, deformable substrates in order to form, they are often challenging to replicate in an experimental setting, doubly so in such a way that they can subsequently be sampled internally. This makes it difficult to understand the formation process and analyse movement below the surface, without destroying the track.
In this study, we used micro-CT (µCT) scanning to visualise sub-surface sediment deformation beneath an indented foot. µCT offers a non-destructive approach for digital capture in three dimensions, enabling a 3D volumetric reconstruction to view the internal characteristics of a sample [51,52,53,54].
Our goal here is to present the process of generating and scanning the track produced by a small tridactyl foot indenting soft and very soft sediment, to capture the volumetric penetrative track phenomenon. Our experimental set-up offers a first look at penetrative track formation via non-destructive µCT scanning.

2. Materials and Methods

2.1. Sediment and Layering

Our experimental set-up consisted of layered ball clay (grain size ~0.004 mm) and play-pit sand (mean grain size ~0.24 mm), in a plastic container, and a cadaveric pheasant (Phasianus colchicus) foot acting as the indenter.
Two experiments were carried out using different substrate consistencies, ‘soft’ and ‘very soft,’ (approximately equivalent to ‘F’ and ‘H’ of Figure 2 in Gatesy and Falkingham (2017) [26]. In each case, 200 g of dry ball clay was mixed with water and deposited in layers 3–7 mm thick, interbedded with thin 1–2 mm layers of dry play-pit sand. Total depth of the sediment in the container was ~5 cm. These distinct layers were chosen because sand is denser than wet clay and appears brighter in the CT scan, enabling clear differentiation between them. To produce the differing consistencies, ~180 mL of water was added to one batch (‘soft’ clay), and ~240 mL of water was added to the other (‘very soft’ clay). Clay was applied with a spatula and smoothed to a horizontal layer, then dry sand was gently deposited on top using a shaker until the clay was completely covered, producing an evenly distributed sand layer. Moisture in the sand layer was present only due to seepage of water from layers above and below, but both scans and post-scanning investigation showed the layers were ultimately uniformly moist (i.e., layers were not composed of dry sand). The cohesivity of the clay and the confined space of the container made it difficult to spread layers thinly and evenly. The clay layers were applied and smoothed as gently as possible to minimise adhesion and disturbance to the underlying sand layer, and to prevent the sand from being dragged upwards into the clay. However, disturbances were not entirely avoidable, despite our best efforts, and it often only became evident when the CT images were visualised. Because of the difficulty in applying layers, and being limited in container size, quantitative measurements such as cone penetration or shear strength were not recorded. Future work where indentation forces might be recorded will need more quantitative sediment characterisation.
For the indenter, we used a cadaveric pheasant foot, relevant both for avian and small non-avian dinosaur tracks. The carcass was sourced from a local game dealer, and the foot was dried and completely rigid. The digit III (DIII) length was 50 mm, and interdigital angle was ~80 degrees. The tarsometatarsus (TMT) was severed proximally at 45 mm length for handling purposes. The TMT and DIII were approximately aligned (i.e., the digits were fully straightened). The foot was indented such that the tips of the digits contacted the substrate first, and then sank deeper, as is the case in in vivo data of guineafowl on soft substrates, at least for touch-down and sinking [29,30]. While this rigid foot is not capable of the full complex motions of an in vivo foot, it serves as an ideal biological model for simple vertical indentation experiments with which to test and demonstrate the method.
The container was a circular plastic tub 10 cm in diameter and 5 cm deep. Being circular means that X-ray transmission is consistent as the sample is rotated in the scanner. Water and sand are relatively high density and impede X-ray transmission; therefore the small size of the container was necessary to reduce the amount of material through which X-rays had to pass. Whilst edge effects might be an issue for subtle track details near the sides of the container, the semi-fluid nature of the substrate meant force and displacement were not transmitted laterally very far, and so edge effects were minimised.
For the purpose of developing this method, we focused solely on scanning the substrate volume with the foot fully impressed (Figure 1). Foot entry and exit were deliberately not captured.
Both experiments were scanned using a Bruker Skyscan 1273 system at energies of 130 kV and 300 µA, using a 1.0 mm copper filter. Exposure time was 786 ms, and pixel resolution size was 92 µm (binned 2 × 2). The total scan time for each scan was ~30 min and was deliberately kept as low as possible to reduce the opportunity for evaporation and sediment movement. Further reduction in scan time would require shorter exposures, which would not permit enough X-rays to pass through the denser parts of the sediment.
The raw CT projection images were visualised and reconstructed into a 3D volume using the Bruker software, Nrecon (version 2.2.0.6). During the reconstruction process, beam hardening correction was set to 65% for both scans to improve image quality and reduce a ‘darker’ centre to the scan.

2.2. Segmentation

The CT data were segmented in Dragonfly 3D World (Version 2025.1 [55]). Individual regions of interest (ROIs) were defined for the clay, sand, and the foot. The sand and clay ROIs were segmented using an intensity-based threshold, because they both exhibited different grayscale ranges in the reconstruction. However, the foot ROI was segmented using the manual paint tool, because it did not present a distinct intensity distribution relative to the surrounding layers; therefore a threshold could not isolate it reliably. The manual paint tool was used to tidy up sections of the sand and clay ROIs that the threshold did not pick up or where it labelled voxels in areas it should not have.

3. Results

Layers of clay and sand were clearly visible, and mostly distinguishable from each other in the CT data. This distinction meant that the volumetric track could be visualised in its entirety, though there were some issues where layers naturally started to interpenetrate and intermingle, becoming difficult to differentiate enough to segment them separately (see Section 4.1.2).
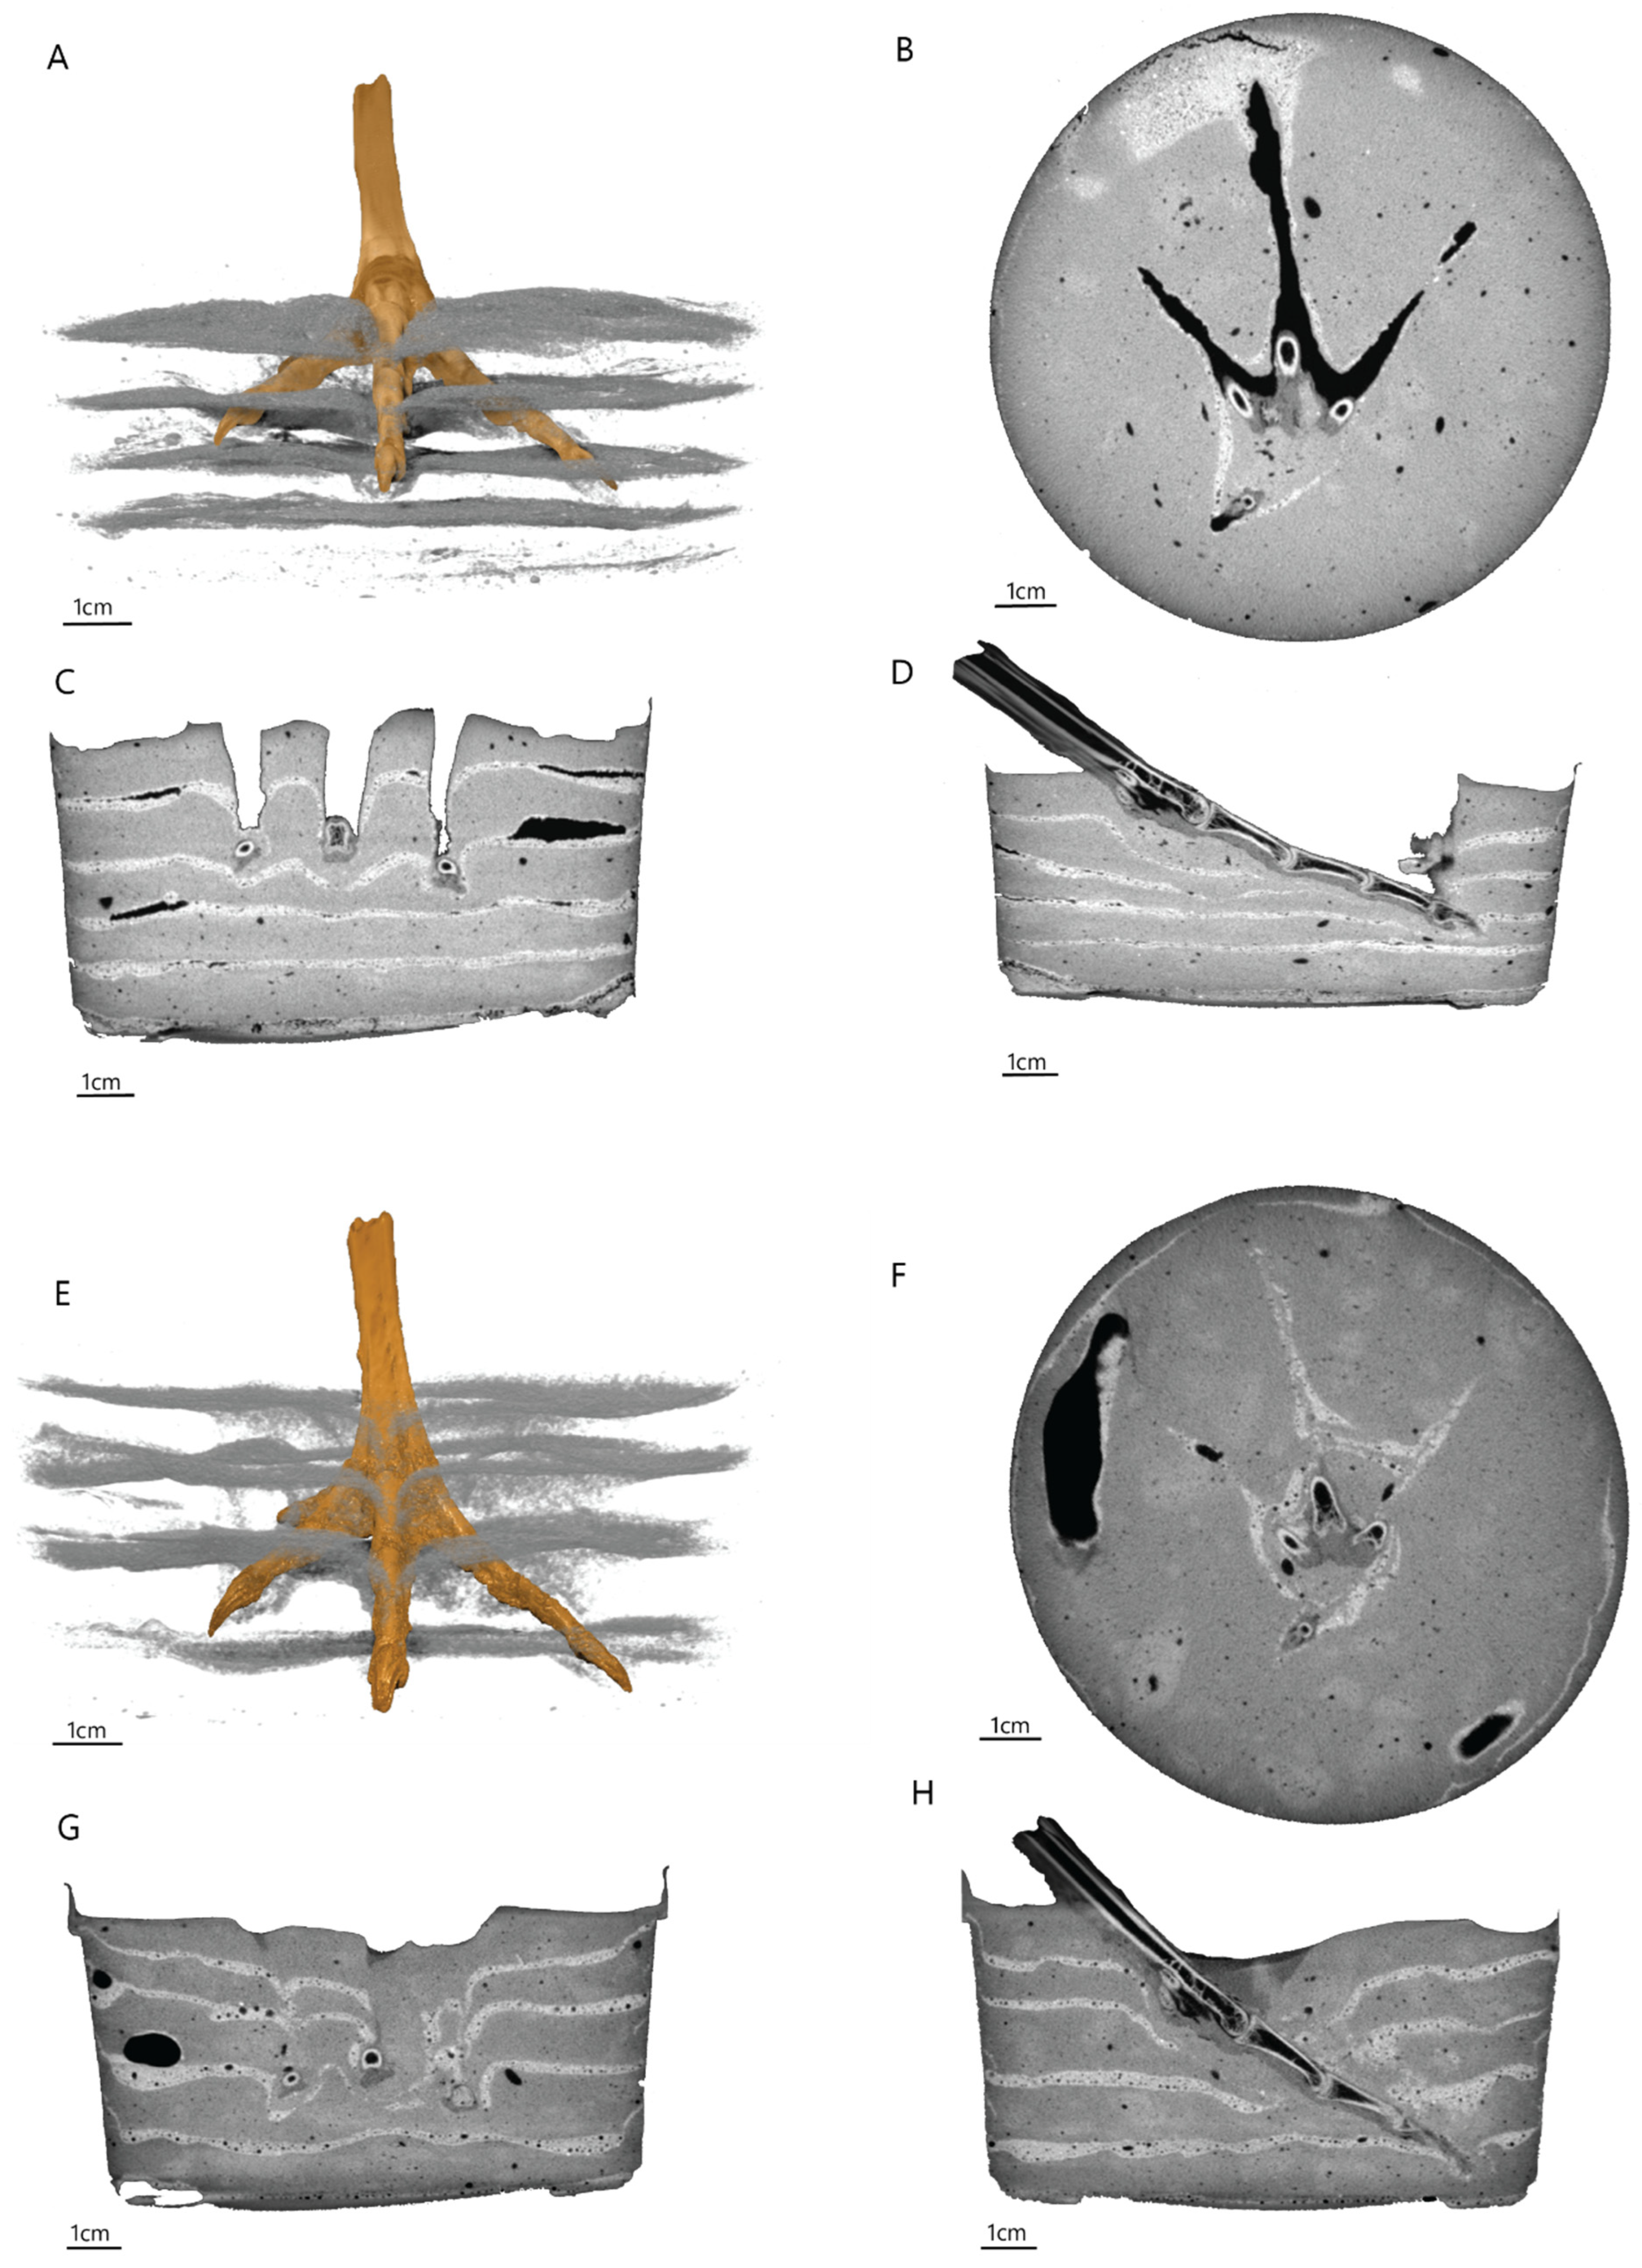
The data could be visualised across multiple axis orientations simultaneously (Figure 2), making complex sub-surface structures easier to identify throughout the track volume, without destroying it. For example, in the very soft consistency, the substrate sealed over the path of the foot, causing the layers to be pulled downwards as the foot descends, producing a penetrative track (Figure 2G,H). Additionally, the downward movement of the layers generated features known as nested V’s—a series of stacked V-shaped deformation structures within the track volume, which are characteristic features of penetrative tracks [40]. Such structures are particularly visible in cross-section and can also be observed in the 3D reconstructions (Figure 2A,E,G).
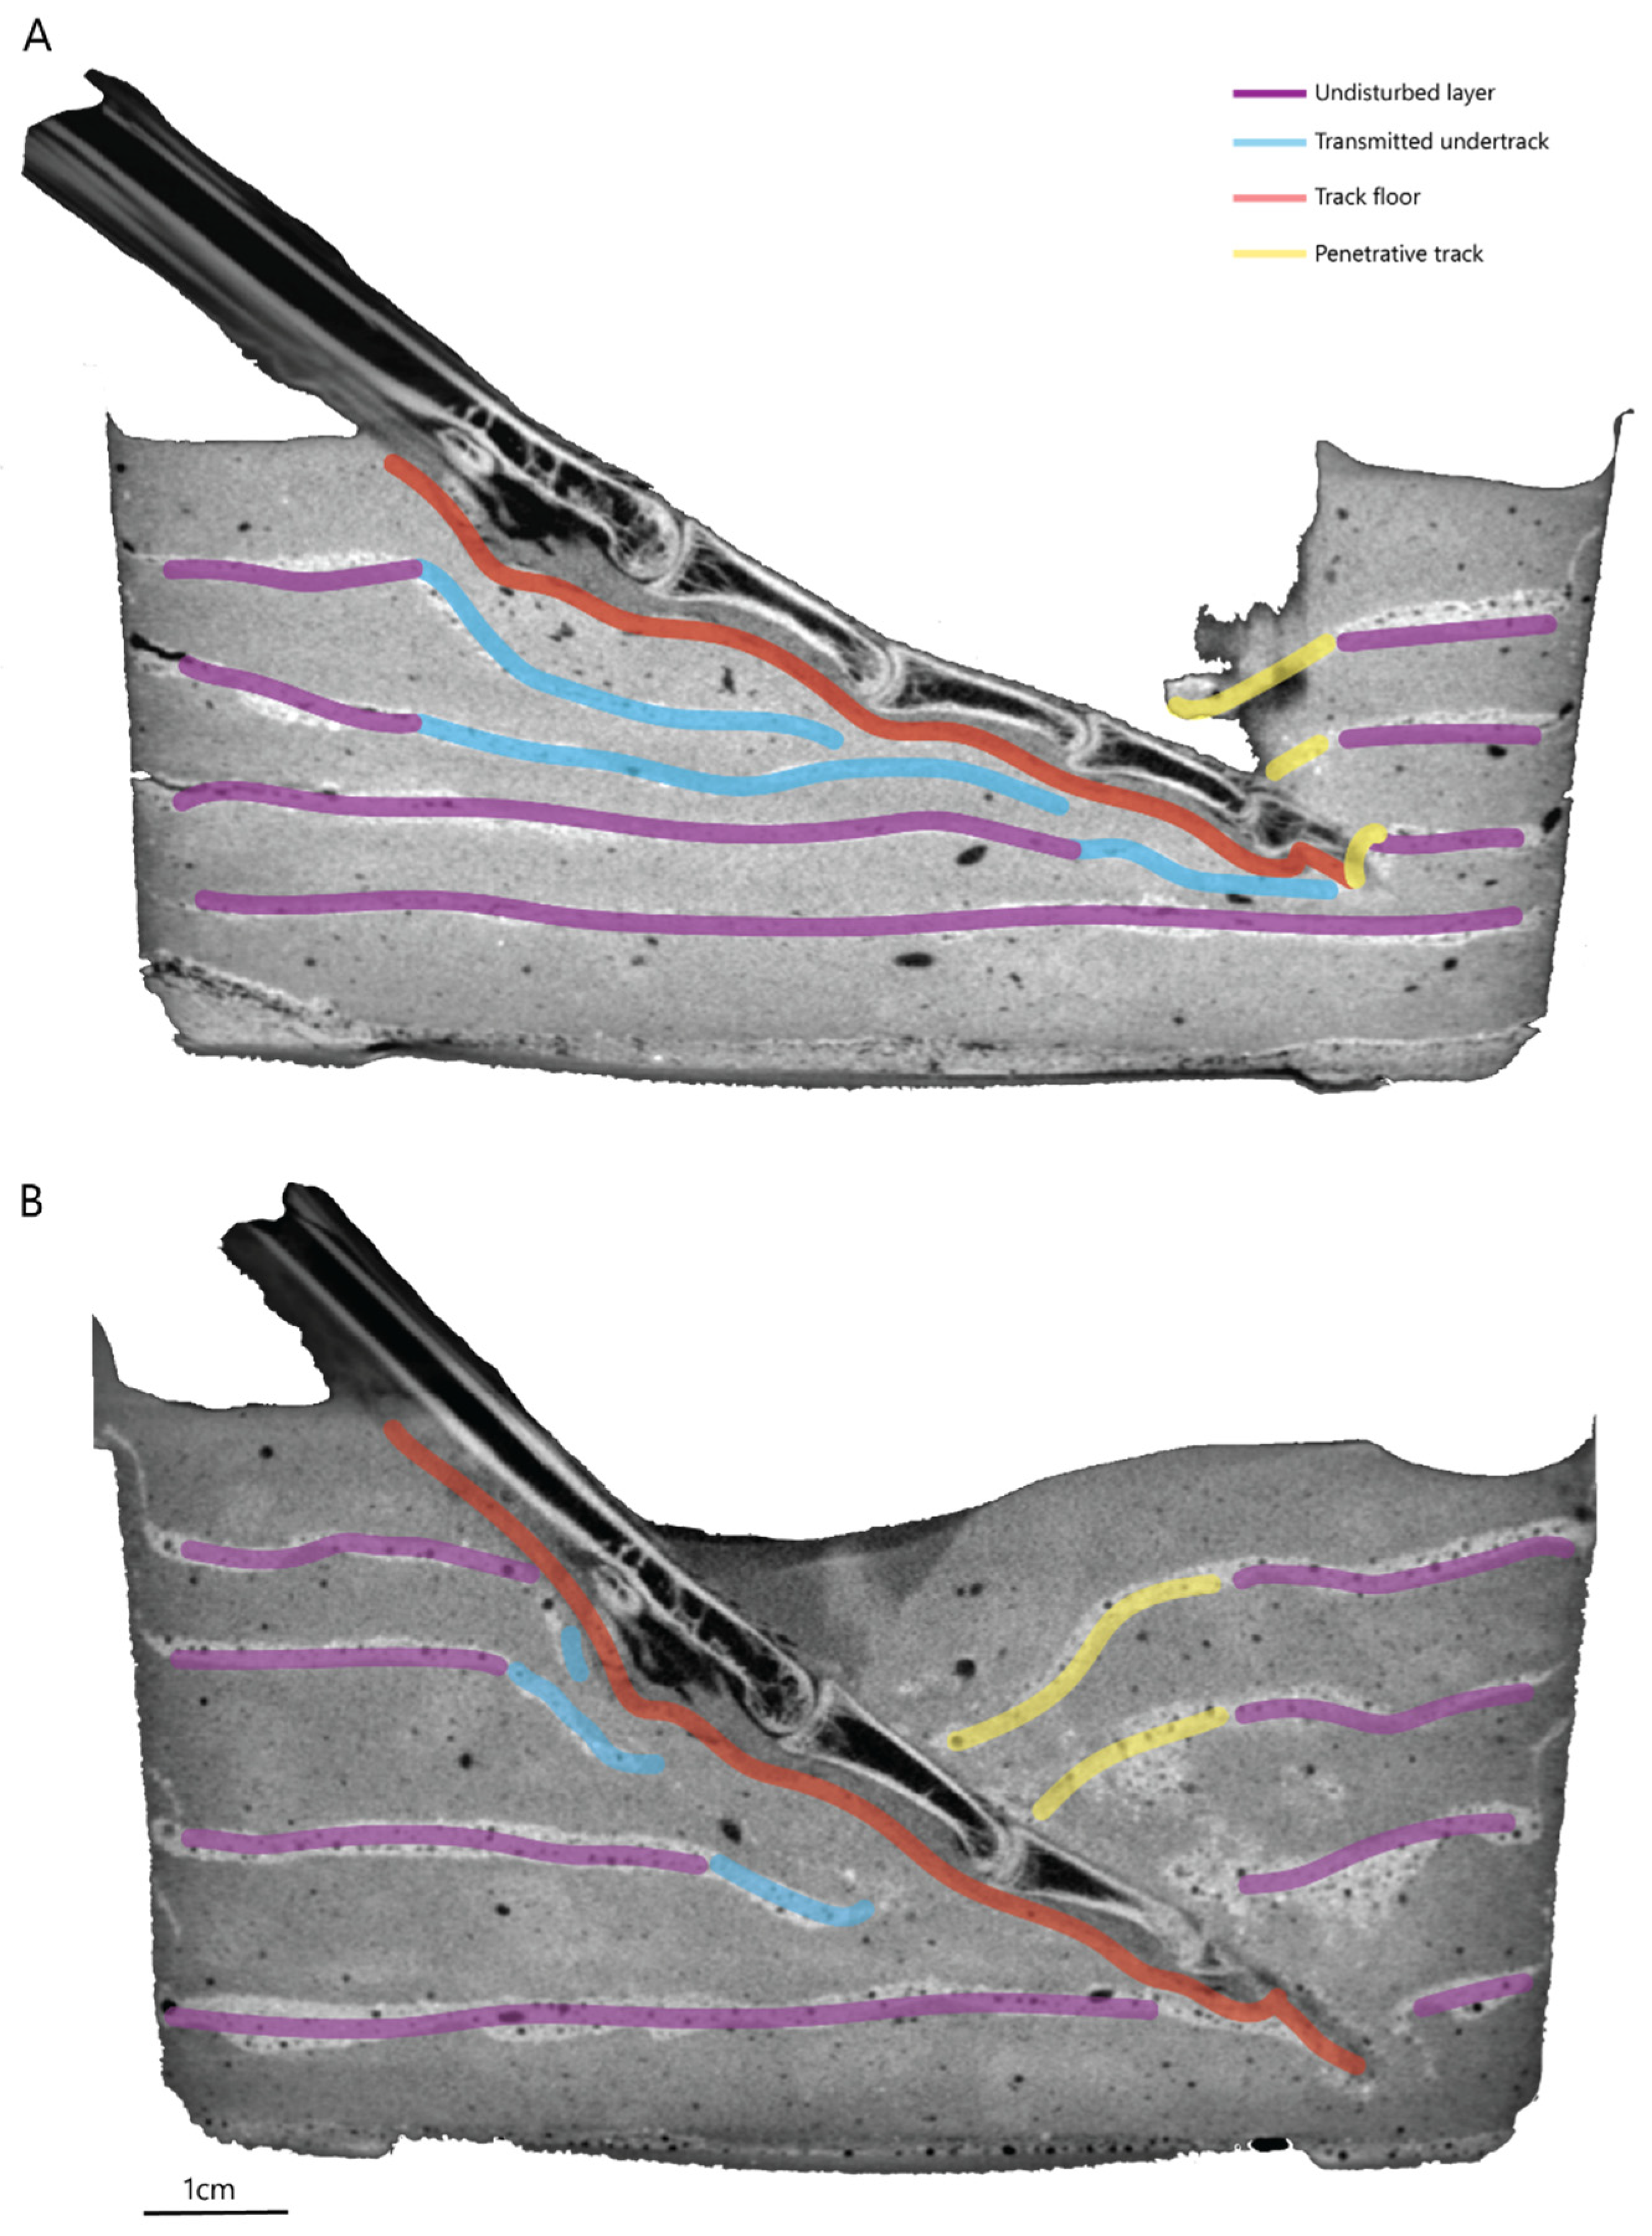
The CT reconstructions also revealed clear differences in sub-surface sediment movement between the two different substrate consistencies during track formation (Figure 2 and Figure 3). In the firmer substrate consistency (‘soft’), there was a higher level of transmitted displacement, particularly in the layers immediately below digit III where layers were indirectly deformed (transmitted undertracks, see [6]) (Figure 3A). However, in the very soft consistency, displacement was barely transmitted at all, and most deformation was a result of direct contact between the foot and the substrate. The increased compliancy of the substrate here meant that the foot could penetrate through multiple sediment layers to a deeper level, thus producing a penetrative track (Figure 3B).

4. Discussion and Conclusions

This study aimed to demonstrate µCT scanning as a non-destructive approach for visualising and capturing volumetric track morphology. The visualisation of the volumetric data offers an unparalleled view of 3D track morphology in a non-destructive manner. Our data clearly demonstrate the distinction between penetrative and transmitted undertracks, as well as distinctive features necessary for identifying penetrative tracks (i.e. nested Vs, punctured layers). However, there were significant challenges involved in capturing this data. The challenges here can stem from the experimental set-up, scan quality, and visualising/segmenting complex sub-surface features and are detailed as follows.

4.1. Challenges

4.1.1. Experimental Set-Up and Scan Quality

By having alternately layered sediment, understanding the track formation process can be made easier by being able to observe the deformation layer by layer. However, producing thin laminations of cohesive substrate within a confined container was difficult. Depositing the clay flat enough so that it was consistent, but without applying too much pressure that it would affect the layers below occasionally created air pockets between the clay and sand. This was compounded by scanning size constraints. A larger container would require X-rays to pass through more material, which in turn would increase the energy and scanning time requirements. The former, increased energy, was beyond the specifications of the scanner, while the latter, increased scanning time (itself linked to energies and exposures) would risk slumping and movement of the soft material during scanning, or evaporation throughout the scan, which would make data reconstruction fail. As such, our size trade-offs meant the container size was limited to a 10 cm diameter to permit scanning at reasonable energies and timescales. However, this meant that there was very little space to control the application and smoothing of the substrate, making it difficult for layers to be consistently the same thickness. In some ways, our experimental set-up with partially distorted layers might more closely mimic natural substrates, but there is a trade-off in losing the fine control possible in prior experiments (e.g., the very regular plasticine of Allen [2]). Further refinements to our experimental protocol may mitigate this issue in the future.

4.1.2. Visualisation and Segmentation

The data itself provided a mostly clear view of the layers, with good contrast between clay and sand. However, as the layers became mixed where the foot passed through them, they naturally became more difficult to separate using the intensity-based threshold alone, requiring more manual edits to refine and distinguish between. In physical experiments where layers are physically separated, the ‘layer’ becomes what is exposed. This parallels the way fossils are exposed. But when viewing the whole volume, differentiation of layers becomes problematic in places. This is less an issue with the technique, and more that scanning and visualising the whole volume in this way highlights a philosophical and terminological issue that has been previously described with reference to fossils and particle simulations, where layers may be fully or partially separated [25,40].

4.2. Utility of the Method

Despite the challenges, µCT scanning offers a novel, non-destructive approach to the visualisation of sub-surface sediment within a track volume. Unlike the 2D information delivered by slices or layers, the 3D volume reconstruction offers a continuous and complete view of the track. Our data present novel views of the track volume including the tracking surface, transmitted and penetrative undertracks, and the true track (see [6] for definitions) within the volume. We have demonstrated the ability to obtain both transverse and longitudinal sections of the same track (Figure 2 and Figure 3), and the data can of course be sectioned arbitrarily (e.g., along the axis of side toes).
We are able to generate these different views from a single track-forming event (i.e., a single foot and foot motion). Previous experimental studies [16,17] required a new track to be produced for each view, which could have provided different motion, or initial sediment states, potentially affecting the final morphology. Being able to view valuable mechanistic information relating to track formation across multiple orientations, without destroying the sample means we can perhaps gain new insights into this process.
Volumetric visualisation of the 3D track volume in this way has previously only been accomplished via computer simulation [4,25,29,40,41,46,48]. Our imaging of physical experiments replicates behaviours and subtleties that may not be fully captured by an idealised computer model, particularly when such models rely on using virtual particles much larger than clay or fine sand to approximate gross sediment behaviour.
CT scanning has been successfully applied to invertebrate trace fossils. For example, Amendola et al. [54] used μCT scanning to gain insight into the internal geometry of bees (as body fossils) within their cells and cocoonֹ (trace fossils). The method has also been applied to analyse sediment cores, whereby the isolation of burrows, burrow orientation, size, and connectivity was achieved for the first time [56,57], although this required scanning at high energies to view internal data. However, a previous attempt at CT scanning a vertebrate fossil track [42] failed to resolve internal geometry due to high density and low contrast between any layers. Tetrapod tracks will necessarily involve larger specimens and poorer contrast, which in turn require larger and higher-powered CT scanners to be successful. Although we do not know the exact taphonomic conditions that could allow this methodology to be applied to real fossil material, we have demonstrated that sufficient contrast between layers can improve the ability to distinguish internal track structures.
The digital nature of the μCT data makes integration with complimentary simulation data in the future a natural progression of what we have shown here. Future experimental work will use μCT to capture before, during, and after track formation. The digital data from these scans can act as ‘anchor points’ for computer simulations of sediment behaviour that in turn can fill in the temporal spaces between. This will facilitate a system grounded in physical reality, but exposing morphology and mechanisms throughout track formation.

Author Contributions

Conceptualisation T.L.P. and P.L.F.; methodology T.L.P., B.W.G., A.J. and P.L.F.; software T.L.P.; validation T.L.P., B.W.G., A.J. and P.L.F.; formal analysis T.L.P. and P.L.F.; investigation T.L.P., B.W.G., A.J. and P.L.F.; resources P.L.F.; data curation T.L.P.; writing—original draft preparation T.L.P. and P.L.F.; writing—review and editing T.L.P., B.W.G., A.J. and P.L.F.; visualisation T.L.P., B.W.G., A.J. and P.L.F.; project administration P.L.F.; funding acquisition P.L.F.; supervision P.L.F. All authors have read and agreed to the published version of the manuscript.

Funding

This work was funded by UKRI Frontier Research Grant TRACKEVOL (selected by the ERC for a consolidator award) awarded to PLF.

Data Availability Statement

All data relevant to this study are available from Figshare (link for Figshare https://figshare.com/s/3b6f6c7df0f06295b0bf) (accessed on 22 May 2026).

Acknowledgments

P.L.F. would like to thank Stephen Gatesy (Brown University) for ongoing discussions and advice around CT scanning tracks. We would also like to give thanks to the anonymous reviewers for their positive comments and valuable feedback on the manuscript.

Conflicts of Interest

The authors declare no conflicts of interest.

References

  1. Allen, J.R.L. Short Paper: Fossil Vertebrate Tracks and Indenter Mechanics. J. Geol. Soc. 1989, 146, 600–602. [Google Scholar] [CrossRef]
  2. Allen, J.R.L. Subfossil Mammalian Tracks (Flandrian) in the Severn Estuary, S.W. Britain: Mechanics of Formation, Preservation and Distribution. Philos. Trans. R. Soc. Lond. Ser. B Biol. Sci. 1997, 352, 481–518. [Google Scholar] [CrossRef]
  3. Gatesy, S.M.; Middleton, K.M.; Jenkins, F.A., Jr.; Shubin, N.H. Three-Dimensional Preservation of Foot Movements in Triassic Theropod Dinosaurs. Nature 1999, 399, 141–144. [Google Scholar] [CrossRef]
  4. Falkingham, P.L.; Bates, K.T.; Margetts, L.; Manning, P.L. The ‘Goldilocks’ Effect: Preservation Bias in Vertebrate Track Assemblages. J. R. Soc. Interface 2011, 8, 1142–1154. [Google Scholar] [CrossRef] [PubMed]
  5. Falkingham, P.L. Interpreting Ecology and Behaviour from the Vertebrate Fossil Track Record. J. Zool. 2014, 292, 222–228. [Google Scholar] [CrossRef]
  6. Lallensack, J.N.; Leonardi, G.; Falkingham, P.L. Glossary of Fossil Tetrapod Tracks. Palaeontol. Electron. 2025, 28, a8. [Google Scholar] [CrossRef]
  7. Thulborn, T. Dinosaur Tracks, 1st ed.; Chapman and Hall: London, UK, 1990. [Google Scholar]
  8. Farlow, J.O.; Gatesy, S.M.; Holtz, T.R., Jr.; Hutchinson, J.R.; Robinson, J.M. Theropod Locomotion. Am. Zool. 2000, 40, 640–663. [Google Scholar] [CrossRef]
  9. Wilson, J.A.; Marsicano, C.A.; Smith, R.M.H. Dynamic Locomotor Capabilities Revealed by Early Dinosaur Trackmakers from Southern Africa. PLoS ONE 2009, 4, e7331. [Google Scholar] [CrossRef]
  10. Marchetti, L.; Mujal, E.; Bernardi, M. An Unusual Amphisauropus Trackway and Its Implication for Understanding Seymouriamorph Locomotion. Lethaia 2017, 50, 162–174. [Google Scholar] [CrossRef]
  11. Avanzini, M.; Piñuela, L.; García-Ramos, J.C. Late Jurassic Footprints Reveal Walking Kinematics of Theropod Dinosaurs. Lethaia 2012, 45, 238–252. [Google Scholar] [CrossRef]
  12. Mármol-Guijarro, A.; Nudds, R.; Folkow, L.; Sellers, W.; Falkingham, P.; Codd, J. The Influence of Snow Properties on Speed and Gait Choice in the Svalbard Rock Ptarmigan (Lagopus Muta Hyperborea). Integr. Org. Biol. 2021, 3, obab021. [Google Scholar] [CrossRef] [PubMed]
  13. Milner, A.R.C.; Harris, J.D.; Lockley, M.G.; Kirkland, J.I.; Matthews, N.A. Bird-like Anatomy, Posture, and Behavior Revealed by an Early Jurassic Theropod Dinosaur Resting Trace. PLoS ONE 2009, 4, e4591. [Google Scholar] [CrossRef]
  14. Lockley, M.G. The Paleobiological and Paleoenvironmental Importance of Dinosaur Footprints. PALAIOS 1986, 1, 37–47. [Google Scholar] [CrossRef]
  15. Manning, P.L. A New Approach to the Analysis and Interpretation of Tracks: Examples from the Dinosauria. Geol. Soc. Lond. Spec. Publ. 2004, 228, 93–123. [Google Scholar] [CrossRef]
  16. Milàn, J. Variations in the Morphology of Emu (Dromaius Novaehollandiae) Tracks Reflecting Differences in Walking Pattern and Substrate Consistency: Ichnotaxonomic Implications. Palaeontology 2006, 49, 405–420. [Google Scholar] [CrossRef]
  17. Milàn, J.; Bromley, R.G. The Impact of Sediment Consistency on Track and Undertrack Morphology: Experiments with Emu Tracks in Layered Cement. Ichnos 2007, 15, 19–27. [Google Scholar] [CrossRef]
  18. Jackson, S.J.; Whyte, M.A.; Romano, M. Laboratory-Controlled Simulations of Dinosaur Footprints in Sand: A Key to Understanding Vertebrate Track Formation and Preservation. PALAIOS 2009, 24, 222–238. [Google Scholar] [CrossRef]
  19. Jackson, S.J.; Whyte, M.A.; Romano, M. Range of Experimental Dinosaur (Hypsilophodon foxii) Footprints Due to Variation in Sand Consistency: How Wet Was the Track? Ichnos 2010, 17, 197–214. [Google Scholar] [CrossRef]
  20. Campos-Soto, S.; Cobos, A.; Caus, E.; Benito, M.I.; Fernández-Labrador, L.; Suarez-Gonzalez, P.; Quijada, I.E.; Mas, R.; Royo-Torres, R.; Alcalá, L. Jurassic Coastal Park: A Great Diversity of Palaeoenvironments for the Dinosaurs of the Villar Del Arzobispo Formation (Teruel, Eastern Spain). Palaeogeogr. Palaeoclimatol. Palaeoecol. 2017, 485, 154–177. [Google Scholar] [CrossRef]
  21. Marmol-Guijarro, A.; Nudds, R.; Folkow, L.; Codd, J. Examining the Accuracy of Trackways for Predicting Gait Selection and Speed of Locomotion. Front. Zool. 2020, 17, 17. [Google Scholar] [CrossRef] [PubMed]
  22. Whyte, M.A.; Romano, M. A Dinosaur Ichnocoenosis from the Middle Jurassic of Yorkshire, UK. Ichnos 2001, 8, 223–234. [Google Scholar] [CrossRef]
  23. Padian, K.; Olsen, P.E. The Fossil Trackway Pteraichnus: Not Pterosaurian, but Crocodilian. J. Paleontol. 1984, 58, 178–184. [Google Scholar]
  24. Minter, N.J.; Braddy, S.J.; Davis, R.B. Between a Rock and a Hard Place: Arthropod Trackways and Ichnotaxonomy. LET 2007, 40, 365–375. [Google Scholar] [CrossRef]
  25. Falkingham, P.L.; Gatesy, S.M. Formation, Preservation, and Interpretation of Dinosaur Tracks. Palaeontology 2026, 69, e70040. [Google Scholar] [CrossRef]
  26. Gatesy, S.M.; Falkingham, P.L. Neither Bones nor Feet: Track Morphological Variation and ‘Preservation Quality’. J. Vertebr. Paleontol. 2017, 37, e1314298. [Google Scholar] [CrossRef]
  27. Avanzini, M. Anatomy of a Footprint: Bioturbation as a Key to Understanding Dinosaur Walk Dynamics. Ichnos 1998, 6, 129–139. [Google Scholar] [CrossRef]
  28. Milàn, J.; Falkingham, P.L. Experimental and Comparative Ichnology. In Dinosaur Tracks: The Next Steps; Falkingham, P.L., Marty, D., Richter, A., Eds.; Indiana University Press: Bloomington, Indiana, 2016; pp. 14–27. [Google Scholar]
  29. Falkingham, P.L.; Gatesy, S.M. The Birth of a Dinosaur Footprint: Subsurface 3D Motion Reconstruction and Discrete Element Simulation Reveal Track Ontogeny. Proc. Natl. Acad. Sci. USA 2014, 111, 18279–18284. [Google Scholar] [CrossRef] [PubMed]
  30. Turner, M.L.; Falkingham, P.L.; Gatesy, S.M. It’s in the Loop: Shared Sub-Surface Foot Kinematics in Birds and Other Dinosaurs Shed Light on a New Dimension of Fossil Track Diversity. Biol. Lett. 2020, 16, 20200309. [Google Scholar] [CrossRef]
  31. Turner, M.L.; Falkingham, P.L.; Gatesy, S.M. What Is Stance Phase on Deformable Substrates? Integr. Comp. Biol. 2022, 62, 1357–1368. [Google Scholar] [CrossRef]
  32. Lallensack, J.N.; Farlow, J.O.; Falkingham, P.L. A New Solution to an Old Riddle: Elongate Dinosaur Tracks Explained as Deep Penetration of the Foot, Not Plantigrade Locomotion. Palaeontology 2022, 65, e12584. [Google Scholar] [CrossRef]
  33. Graversen, O.; Milàn, J.; Loope, D.B. Dinosaur Tectonics: A Structural Analysis of Theropod Undertracks with a Reconstruction of Theropod Walking Dynamics. J. Geol. 2007, 115, 641–654. [Google Scholar] [CrossRef]
  34. Milàn, J.; Loope, D.B. Preservation and Erosion of Theropod Tracks in Eolian Deposits: Examples from the Middle Jurassic Entrada Sandstone, Utah, U.S.A. J. Geol. 2007, 115, 375–386. [Google Scholar] [CrossRef]
  35. Loope, D.B. Recognizing and Utilizing Vertebrate Tracks in Cross Section: Cenozoic Hoofprints from Nebraska. Palaios 1986, 1, 141–151. [Google Scholar] [CrossRef]
  36. Clemmensen, L.B.; Milàn, J.; Pedersen, G.K.; Johannesen, A.B.; Larsen, C. Dinosaur Tracks in Lower Jurassic Coastal Plain Sediments (Sose Bugt Member, Rønne Formation) on Bornholm, Denmark. Lethaia 2014, 47, 485–493. [Google Scholar] [CrossRef]
  37. Hitchcock, E. Final Report on the Geology of Massachusetts; Adams and J. H. Butler: Amherst and Northampton, MA, USA, 1841. [Google Scholar]
  38. Hitchcock, E. Ornithichnology—Description of the Foot Marks of Birds (Ornithichnites) on New Red Sandstone in Massachusetts. Am. J. Sci. 1836, 29, 307–340. [Google Scholar]
  39. Hitchcock, E. Ichnology of New England: A Report on the Sandstone of the Connecticut Valley, Especially Its Fossil Footmarks; William White: Boston, MA, USA, 1858; p. 220. [Google Scholar]
  40. Gatesy, S.M.; Falkingham, P.L. Hitchcock’s Leptodactyli, Penetrative Tracks, and Dinosaur Footprint Diversity. J. Vertebr. Paleontol. 2020, 40, e1781142. [Google Scholar] [CrossRef]
  41. Falkingham, P.L.; Turner, M.L.; Gatesy, S.M. Constructing and Testing Hypotheses of Dinosaur Foot Motions from Fossil Tracks Using Digitization and Simulation. Palaeontology 2020, 63, 865–880. [Google Scholar] [CrossRef]
  42. Larkin, N.R.; Duffin, C.J.; Dey, S.; Stukins, S.; Falkingham, P. The First Tetrapod Track Recorded from the Rhaetian in the British Isles. Proc. Geol. Assoc. 2020, 131, 722–729. [Google Scholar] [CrossRef]
  43. Milàn, J.; Bromley, R.G. True Tracks, Undertracks and Eroded Tracks, Experimental Work with Tetrapod Tracks in Laboratory and Field. Palaeogeogr. Palaeoclimatol. Palaeoecol. 2006, 231, 253–264. [Google Scholar] [CrossRef]
  44. White, M.A.; Cook, A.G.; Rumbold, S.J. A Methodology of Theropod Print Replication Utilising the Pedal Reconstruction of Australovenator and a Simulated Paleo-Sediment. PeerJ 2017, 5, e3427. [Google Scholar] [CrossRef] [PubMed]
  45. Ellis, R.G.; Gatesy, S.M. A Biplanar X-Ray Method for Three-Dimensional Analysis of Track Formation. Palaeontol. Electron. 2013, 16, 1–16. [Google Scholar] [CrossRef]
  46. Falkingham, P.L.; Margetts, L.; Smith, I.M.; Manning, P.L. Reinterpretation of Palmate and Semi-Palmate (Webbed) Fossil Tracks; Insights from Finite Element Modelling. Palaeogeogr. Palaeoclimatol. Palaeoecol. 2009, 271, 69–76. [Google Scholar] [CrossRef]
  47. Falkingham, P.L.; Hage, J.; Bäker, M. Mitigating the Goldilocks Effect: The Effects of Different Substrate Models on Track Formation Potential. R. Soc. Open Sci. 2014, 1, 140225. [Google Scholar] [CrossRef]
  48. Griffin, B.W.; Prescott, T.L.; Jannel, A.; Falkingham, P.L. Penetrative Track Morphology and Sediment Parameters: Subsurface Layers Are Robust to Changes in Substrate Properties. J. R. Soc. Interface 2026, 23, 20250796. [Google Scholar] [CrossRef]
  49. Lallensack, J.N.; Pérez-Lorente, F.; Amzil, M.; Oukassou, M.; Meyer, C.; Saber, H.; Klein, H.; Charriére, A.; Zafaty, O.; Falkingham, P.L. The Abundance and Diversity of Penetrative Tracks: A Critical Re-Evaluation of Theropod Ichnotaxa. Hist. Biol. 2026, 1–19. [Google Scholar] [CrossRef]
  50. Milàn, J.; Avanzini, M.; Clemmensen, L.B.; García-Ramos, J.C.; Piñuela, L. Theropod Foot Movement Recorded from Late Triassic, Early Juraassic and Late Jurassic Fossil Footprints. In The Triassic-Jurassic Terrestrial Transition; Harris, J.D., Lucas, S.G., Spielmann, J.A., Lockley, M.G., Milner, A.R.C., Kirkland, J.I., Eds.; New Mexico Museum of Natural History and Science Bulletin: Albuquerque, NM, USA, 2006; pp. 352–364. [Google Scholar]
  51. Keklikoglou, K.; Arvanitidis, C.; Chatzigeorgiou, G.; Chatzinikolaou, E.; Karagiannidis, E.; Koletsa, T.; Magoulas, A.; Makris, K.; Mavrothalassitis, G.; Papanagnou, E.-D.; et al. Micro-CT for Biological and Biomedical Studies: A Comparison of Imaging Techniques. J. Imaging 2021, 7, 172. [Google Scholar] [CrossRef]
  52. Ketcham, R.A.; Carlson, W.D. Acquisition, Optimization and Interpretation of X-Ray Computed Tomographic Imagery: Applications to the Geosciences. Comput. Geosci. 2001, 27, 381–400. [Google Scholar] [CrossRef]
  53. Cnudde, V.; Boone, M.N. High-Resolution X-Ray Computed Tomography in Geosciences: A Review of the Current Technology and Applications. Earth-Sci. Rev. 2013, 123, 1–17. [Google Scholar] [CrossRef]
  54. Amendola, M.; Barucci, A.; Baucon, A.; Zini, C.; Borrelli, C.; Casati, S.; Cencio, A.D.; Fiore, S.; Siano, S.; Agresti, J.; et al. Exploring How Micro-Computed Tomography Imaging Technology Impacts the Preservation of Paleontological Heritage. Heritage 2025, 8, 310. [Google Scholar] [CrossRef]
  55. Dragonfly 3D World, Version 2025.1; Comet Technologies Canada, Comet Technologies Canada Inc: Montreal, QC, Canada, 2025.
  56. Dorador, J.; Rodriguez-Tovar, F.J.; Titschack, J. Exploring Computed Tomography in Ichnological Analysis of Cores from Modern Marine Sediments. Sci. Rep. 2020, 10, 201. [Google Scholar] [CrossRef] [PubMed]
  57. Eltom, H.A.; Goldstein, R.H. Scale Dependence of Petrophysical Measurements in Reservoirs with Thalassinoides: Insights from CT Scans. Mar. Pet. Geol. 2023, 148, 106036. [Google Scholar] [CrossRef]
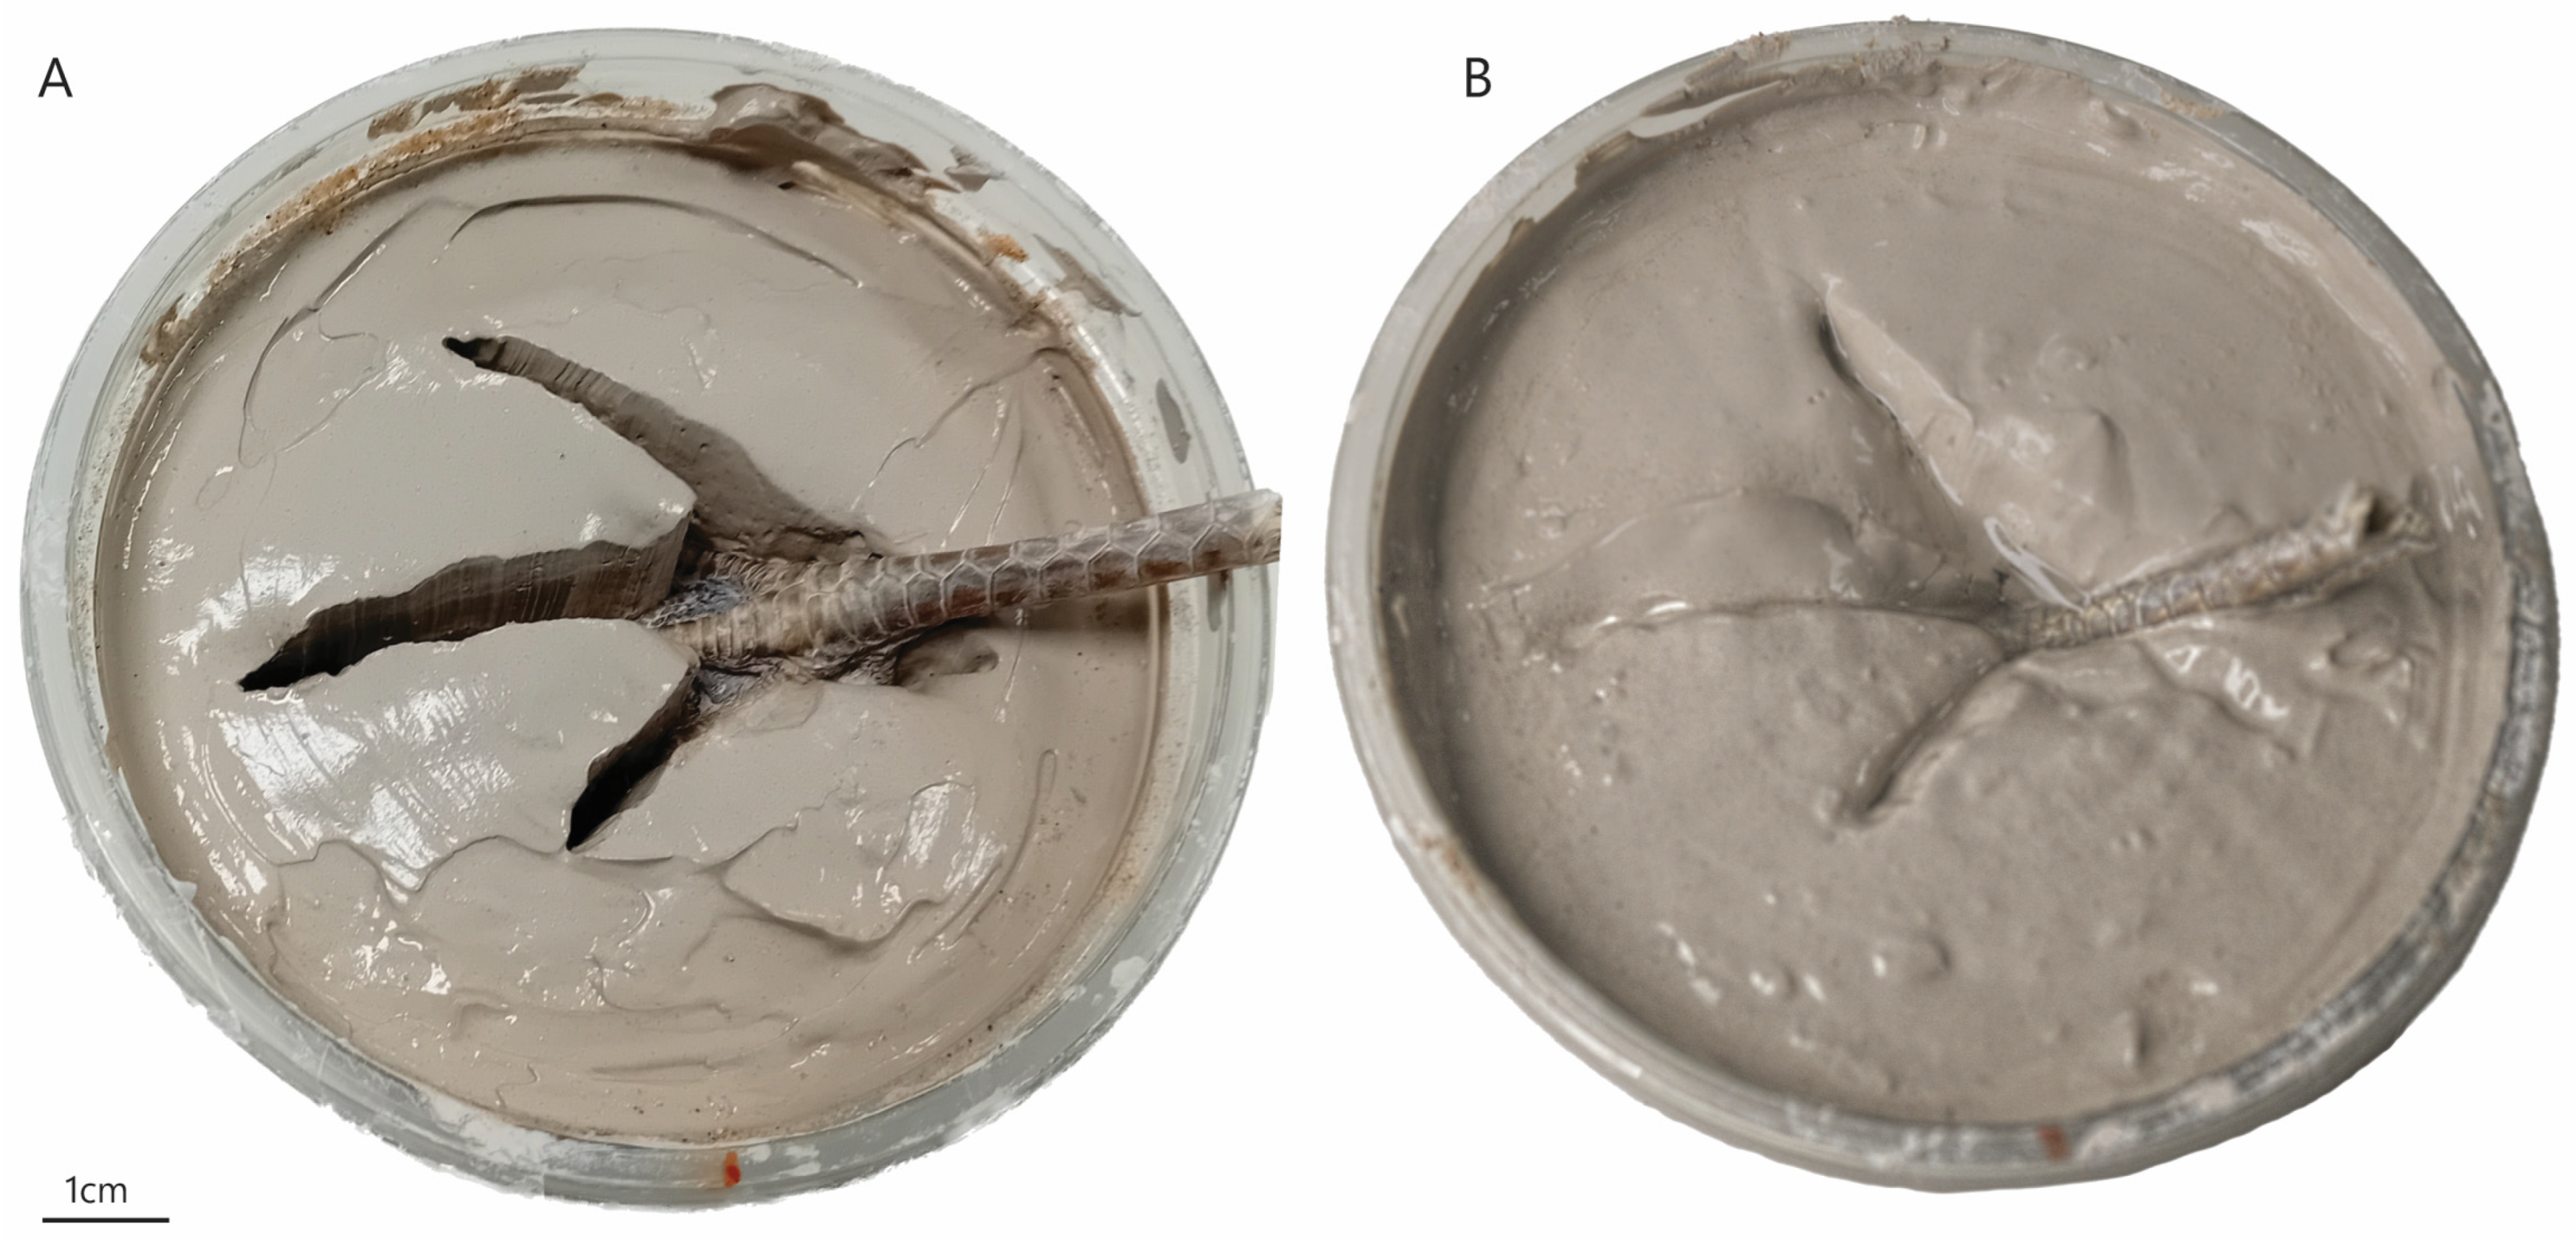
Figure 1. Substrate volumes during indentation. (A) ‘soft’ substrate consistency, and (B) ‘very soft’ substrate consistency (see Figshare link for videos on the experimental set-up and indentation—https://figshare.com/s/3b6f6c7df0f06295b0bf, accessed on 22 May 2026).
Fossstud 04 00014 g001
Figure 2. Visualisation of reconstructed CT images across 3D and 2D views. (AD) ‘soft’ substrate consistency, (EH) ‘very soft’ substrate consistency. Orientations are as follows: (A,E) 3D views (the layers showing here are the sand); (B,F) XZ (top-down); (C,G) XY; (D,H) ZY. In images (BD,FH), the brighter (white) layers are the sand, and darker (grey) are the clay.
Fossstud 04 00014 g002
Figure 3. Cross-sections of (A) ‘soft’ substrate consistency, and (B) ‘very soft’ substrate consistency, showing digit III in contact with the substrate volumes. Highlighted regions demonstrate the sub-surface displacement modes such as transmitted and penetrative tracks. The images of the two cross-sections without interpretations can be seen in Figure 2D,H. The scale bar is set for both images.
Fossstud 04 00014 g003
Disclaimer/Publisher’s Note: The statements, opinions and data contained in all publications are solely those of the individual author(s) and contributor(s) and not of MDPI and/or the editor(s). MDPI and/or the editor(s) disclaim responsibility for any injury to people or property resulting from any ideas, methods, instructions or products referred to in the content.