


Abstract
Railway infrastructure is fundamental to national logistics and public transportation systems. Defects in railway tracks, such as squats, shelling, spalling, flaking, burned rails, and joint issues, can significantly compromise operational safety. Traditional inspection methods, which rely heavily on manual labour, are often inefficient, error-prone, and infeasible for large-scale deployment. This study proposes a comparative experimental evaluation of deep learning models, and a hybrid CNN-feature/Random Forest model, for classifying surface-level defects in railway tracks from pre-cropped images. The dataset, comprising 6465 images (4525 training/1940 test) across six defect classes, was compiled from real-world conditions on the Indian railway network and used to train and evaluate five transfer-learning CNN backbones (MobileNetV2, DenseNet121, VGG16, ResNet50, EfficientNetB0) and a Random Forest classifier operating on CNN-extracted features. MobileNetV2 achieved the highest test-set accuracy (81.2%, F1 = 0.81, AUC-ROC = 0.96), with VGG16 and DenseNet121 close behind (80.7% and 80.0%); all three show a widening train/validation loss gap consistent with overfitting despite reasonable test-set generalisation. This aggregate accuracy conceals a safety-relevant weakness: MobileNetV2’s recall for Burned Rail, a safety-critical defect category, is only 45.5%, the lowest recall of any class for this model. ResNet50 and EfficientNetB0 underperformed substantially (54.2% and 42.0%); training logs and learning curves confirm this reflects a training/optimisation failure rather than a demonstrated architectural limitation; EfficientNetB0 in particular shows chance-level ROC-AUC (0.50) on every class, indicating its predictions carry no discriminative signal. A Random Forest classifier operating on VGG16 features achieved 72.2% accuracy on an independently partitioned test set, with similarly low recall for minority classes. The study discusses deployment trade-offs between accuracy and computational efficiency and their connection to existing non-destructive testing workflows, and identifies verification work that remains outstanding for the Random Forest hyperparameters and evaluation split.
1. Introduction
The global railway network spans millions of kilometres and serves as a critical backbone for passenger and freight transportation [1]. Track-related failures account for approximately 70% of railway accidents in developing countries [2], with surface-level defects, including squats, shelling, spalling, flaking, burned rails, and joint failures, each presenting distinct detection and classification challenges [3].
Traditional inspection relies on manual visual assessment supplemented by ultrasonic testing and ground-penetrating radar [4]. While effective in controlled settings, such approaches suffer from inherent subjectivity, time intensity, and difficulty maintaining consistent quality across large-scale networks [5].
Artificial intelligence (AI), particularly CNNs, has achieved breakthrough performance in image classification and object detection, making it well-suited for automated railway track defect inspection [6,7]. Deep learning enables a shift from reactive to proactive maintenance by facilitating early detection of failure modes before they compromise operational safety [8].
Transfer learning further enhances deep neural network applicability to specialized domains with limited training data [9]. Leveraging ImageNet-pretrained models improves performance on domain-specific tasks while reducing computational overhead, which is particularly valuable where acquiring comprehensive labelled railway defect datasets is inherently challenging [10,11].
AI-based inspection systems integrated with railway monitoring frameworks offer continuous monitoring, objective defect assessment, and real-time decision-making capabilities [12]. Edge computing enables lightweight model deployment on mobile inspection platforms for real-time detection [13], while condition-based maintenance strategies driven by AI inspection can reduce costs and improve reliability [14].
This research addresses the critical need for automated railway track defect detection by developing a comprehensive AI-based framework to identify and classify six common surface-level defects. The study employs a dataset collected from operational railway tracks in the North Western Railway zone of India, encompassing diverse environmental conditions and track configurations representative of real-world operational scenarios [15]. The evaluation of multiple state-of-the-art deep learning architectures provides insights into the relative performance characteristics of different modelling approaches and their suitability for deployment in practical applications [16].
2. Literature Review
The application of artificial intelligence to railway infrastructure monitoring has gained significant momentum in recent years, with numerous research contributions addressing various aspects of track defect detection and classification [17]. Early approaches to automated railway inspection relied primarily on traditional computer vision techniques, employing edge detection algorithms and morphological operations to identify surface irregularities [18]. However, these methods demonstrated limited effectiveness when applied to complex real-world scenarios characterized by varying lighting conditions, environmental noise, and diverse defect morphologies [19].
The introduction of machine learning techniques marked a significant advancement in railway defect detection capabilities. Support Vector Machines (SVMs) and Random Forest classifiers were among the first ML algorithms applied to this domain, demonstrating improved performance over traditional rule- based systems [20]. These approaches typically relied on handcrafted features extracted from image data, limiting their ability to capture complex patterns and relationships inherent in defect characteristics [21].
The advent of deep learning has revolutionized the field of railway defect detection, with CNNs demonstrating exceptional performance in automated feature extraction and pattern recognition tasks [22]. Gibert et al. [23] presented one of the pioneering studies in this area, developing a deep learning framework for rail surface defect detection using synthetic data augmentation techniques. Their work demonstrated the potential of CNNs to achieve human-level performance in defect classification tasks while maintaining computational efficiency suitable for real-time applications.
Transfer learning approaches have emerged as a particularly effective strategy for railway defect detection, addressing the challenge of limited training data availability in specialized domains [24].
Faghih-Roohi et al. [25] investigated the application of pre-trained CNN architectures to railway track defect detection, demonstrating significant performance improvements over models trained from scratch. Their comparative analysis of various transfer learning strategies provided valuable insights into selecting appropriate base models and fine-tuning procedures for railway applications.
Recent research efforts have focused on addressing specific challenges associated with railway defect detection, including class imbalance, environmental variability, and real-time processing requirements [26]. Wei et al. [27] proposed a multi-scale feature fusion approach for railway fastener defect detection, combining features extracted at different spatial resolutions to improve detection accuracy for small and subtle defects. Their methodology demonstrated enhanced performance in challenging scenarios characterized by low contrast and complex backgrounds.
Multi-modal sensing integration combining visual, ultrasonic, acoustic, and thermal modalities enables detection of both surface and subsurface defects [28,29]. However, the complexity of multi-modal data fusion presents significant implementation challenges [30].
Lightweight CNN architectures such as MobileNet and EfficientNet have facilitated deployment on resource-constrained platforms, enabling development of autonomous inspection systems capable of continuous real-time monitoring [31,32,33].
Beyond 2D image classification, recent work has extended AI-based rail-corridor perception to multimodal 3D object detection: Chen et al. [34] propose a geometry-guided sparse-to-dense LiDAR-camera fusion framework for hazard and infrastructure object detection in railway environments, evaluated on a real-world multimodal railway dataset. This line of work is complementary to the present study; it targets obstacle/object detection along the corridor rather than surface-defect classification on the rail itself, and points toward multimodal (camera + LiDAR) sensing as a promising extension of the present single-modality classification approach. Modern rail grinding has traditionally relied on field experience and empirical assumptions. Recent laboratory and theoretical studies are providing practical models that explain crack development and support preventive grinding. These advances help validate established practices while enabling more accurate prediction of rail fatigue and profile degradation [35].
For structural surface-defect inspection specifically, Wu et al. [36] present AirboardNet, a lightweight multi-task network for UAV-based visual inspection of high-speed railway bridge girders that uses knowledge distillation to meet onboard computational constraints. This is closely related to the present study’s interest in edge deployment (Section 5.2) and suggests knowledge distillation as an additional lightweighting strategy, alongside the architecture selection considered here, for future work.
The models compared in this study (MobileNetV2, DenseNet121, VGG16, ResNet50, EfficientNetB0, and a Random Forest/CNN-feature hybrid) represent widely used, general-purpose transfer-learning baselines rather than current state-of-the-art or domain-specific architectures. We note this as a limitation: newer general-purpose backbones (e.g., ConvNeXt, Swin Transformer) and rail-defect-specific architectures from the NDT literature have not yet been benchmarked under the identical protocol used here, and adding them is identified as necessary follow-up work (Section 5.3) rather than something we can report without running the additional training ourselves.
Several public rail-surface-defect datasets exist in the literature (e.g., the RSDD rail-surface-defect dataset and related benchmark sets), typically consisting of controlled or semi-controlled imagery. The present study instead uses a self-collected dataset from operational tracks under real service conditions (variable lighting, motion blur, and camera angle from a mobile inspection platform), which we believe better reflects deployment conditions but is not directly comparable to results reported on public benchmarks. Cross-dataset evaluation, training or testing on a public dataset in addition to the present operational dataset was not performed in this study and is identified as a direction for future work.
3. Methodology
3.1. Dataset Construction and Preprocessing
The foundation of any successful machine learning application lies in the quality and comprehensiveness of the training dataset [37]. For this research, high-definition video data were collected from operational railway tracks under the jurisdiction of North Western Railways (NWR), Jodhpur Division, India. The data acquisition process was designed to capture diverse real-world conditions, including varying lighting conditions, weather patterns, and track configurations representative of operational environments encountered in railway networks.
The video collection strategy employed mobile inspection platforms equipped with high-resolution cameras that traversed tracks at operational speeds to simulate realistic inspection scenarios. This approach ensured that the captured data reflected the actual conditions encountered during routine railway operations, including motion blur, vibrations, and environmental occlusions [38]. The temporal diversity of the collected data was maintained through systematic sampling procedures, extracting every fifth frame from the video sequences to balance dataset comprehensiveness with computational efficiency.
The manual annotation process involved collaboration with domain experts from Indian Railways, ensuring high-quality labels for supervised learning applications. The annotation protocol established clear criteria for defect identification and classification, with inter-rater reliability assessed using Fleiss’ kappa [39]. The specific number of annotators and the resulting kappa value were not retained in the project records available for this study and are not reported here; this is noted as a limitation affecting full reproducibility of the annotation process (Section 5.3). The dataset exhibits a significant class imbalance characteristic of real-world railway defect detection scenarios, where certain defect types occur more frequently than others due to operational conditions, track usage patterns, and maintenance histories. Table 1 presents the distribution of images across the six defect categories in both training and test sets.
Table 1.
Class Distribution in the Dataset.
3.2. Defect Classification and Characteristics
The classification scheme employed in this study encompasses six distinct surface-level defect types, each characterized by unique morphological features and failure mechanisms [40]. Burned rail defects result from excessive friction between wheel and rail surfaces, leading to localized thermal degradation and metallurgical changes. These defects typically manifest as darkened or glossy patches on the rail surface, often accompanied by surface cracking patterns [41].
Flaking defects are surface-initiated failures caused by repetitive wheel loading, leading to the detachment of thin metal layers from the rail surface. These defects are characterized by horizontal peeling or scaling patterns, typically occurring near areas of high lateral wheel forces such as curves and switch points [42].
Joint issues encompass various defects at rail connections, including misalignment, bolt failures, and weld defects, which present as structural discontinuities and hardware-related anomalies [43].
For clarity, the “Joint Issues” label in this study denotes surface-visible conditions at the rail joint that are observable from a downward/forward-facing inspection camera—specifically visible misalignment or step between rail ends, visible gap irregularities, and visibly damaged or missing fishplates/bolts at the joint. A rail joint is itself a designed structural feature rather than a defect, and several joint failure modes (e.g., internal bolt-hole cracking, sub-surface fatigue) are not visible from a top-down camera and are therefore outside the scope of this image-classification approach; this is noted as a limitation in Section 5.3.
Shelling defects manifest as horizontal crack patterns that develop parallel to the rail surface, typically at the gauge corner of the railhead. These fatigue-related defects appear as crescent-shaped regions or spalled metal layers and can progress to transverse cracks if left untreated [44].
Spalling defects involve localized fracture and material loss from the railhead, primarily caused by contact fatigue and compressive stresses. These defects are characterized by crater-like holes or chipped sections with jagged edges [45].
Squats represent subsurface fatigue cracks that propagate to the surface, appearing as dark-colored spots or depressions on the railhead. These defects are particularly problematic in high-speed railway corridors, where they can lead to significant deterioration in ride quality and potential rail breakage if not addressed promptly.
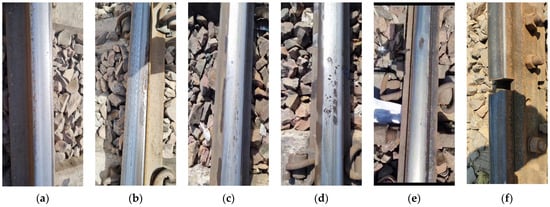
Figure 1 presents representative examples of railway track defects from the dataset, illustrating the characteristic visual features and challenges for automated classification. These images illustrate why certain defect pairs exhibit high confusion rates in classification.
Figure 1.
Representative examples of railway track defects: (a) Flaking and Shelling, (b) Shelling, Spalling and Burned Rail, (c) Spalling and Flaking, (d) Squats, Spalling and Burned Rail, (e) Squats, Shelling, and (f) Joint defect.
Figure 1a shows Flaking and Shelling with similar surface material-loss patterns but differing crack orientations, explaining a Shelling-to-Flaking misclassification rate of 13.2–14.7% for the three successfully trained models (Section 4.3). Figure 1b illustrates co-occurring Shelling, Spalling, and Burned Rail, highlighting the challenge of separating fatigue-related from thermal defects on the same section. Figure 1c shows Spalling and Flaking against a ballast background, where shadows and texture complicate detection. Figure 1d depicts overlapping Squats, Spalling, and Burned Rail boundaries, creating classification ambiguity. Figure 1e shows Squats and Shelling, with the Squat’s distinct dark depression yielding moderate-to-good F1-scores (0.79–0.84 for the three successfully trained models). Figure 1f illustrates Joint defects: despite being the rarest class in the test set (52 images, 15.67:1 imbalance relative to Flaking), Joint Issues is not a difficult class for the models that trained successfully, attaining F1-scores of 0.87–0.90 for MobileNetV2, DenseNet121, and VGG16, higher than for Flaking itself. Joint Issues F1 is poor only for ResNet50 (0.07) and EfficientNetB0 (0.00), consistent with the general training failure exhibited by these two models (Section 4.2) rather than a class-specific difficulty. These results indicate that class imbalance alone is not a reliable predictor of classification difficulty in this dataset: Burned Rail, a comparatively less rare class (66 test images, 12.35:1 imbalance), is consistently the weakest class for all three successfully trained models (F1 = 0.57–0.60), suggesting that visual ambiguity with Flaking (Figure 1a) is a stronger determinant of classification difficulty than sample count alone for this class.
These images underscore critical challenges: visual similarities between defect pairs create inherent classification ambiguities, co-occurring defects complicate single-label classification, and severe class imbalance (2734 Flaking images vs. 166 Joint Issues images, per the corrected totals in Table 1) leads to systematic bias toward majority class predictions when visual ambiguity exists.
3.3. Deep Learning Architecture Selection
The selection of appropriate deep learning architectures for railway defect detection requires careful consideration of factors such as computational efficiency, accuracy requirements, and deployment constraints. This study evaluated five state-of-the-art CNN architectures—MobileNetV2, DenseNet121, EfficientNetB0, ResNet50, and VGG16—each representing different design philosophies and optimization strategies.
MobileNetV2 was selected for its exceptional computational efficiency, utilizing depth wise separable convolutions and inverted residual blocks to achieve high accuracy with minimal computational overhead. This architecture is particularly suitable for mobile and edge deployment scenarios where computational resources are limited. DenseNet121 employs dense connectivity patterns between layers, promoting feature reuse and efficient gradient flow, making it effective for complex pattern recognition tasks.
EfficientNetB0 represents a compound scaling approach that uniformly scales network depth, width, and resolution to achieve optimal performance–efficiency trade-offs. ResNet50 utilizes residual connections to enable training of deeper networks while mitigating vanishing gradient problems. VGG16 [46], despite being an older architecture, provides a valuable baseline for comparison due to its simplicity and interpretability.
All deep learning models were implemented using transfer learning approaches, initialized with pre-trained weights from the ImageNet dataset [47]. Custom classification heads were added to each architecture, consisting of global average pooling layers, dense layers with ReLU activation, dropout regularization, and final SoftMax classification layers. The implementation utilized TensorFlow and Keras frameworks, with training conducted on NVIDIA Tesla P100 GPUs to ensure efficient processing of large-scale image datasets.
3.4. Training Configuration and Hyperparameters
Random Forest/CNN-Feature Hybrid Configuration: For the Random Forest baseline, features were extracted from the global-average-pooled, pre-classification layer of each frozen, ImageNet-pretrained CNN backbone, yielding a fixed-length feature vector of dimensionality 1280 (MobileNetV2), 1024 (DenseNet121), 2048 (ResNet50), 512 (VGG16), and 1280 (EfficientNetB0) per image, consistent with each architecture’s known penultimate-layer width. A Random Forest classifier was subsequently trained on these features for each backbone. The specific Random Forest hyperparameters (number of trees, maximum depth, and related settings) were not recorded in the retained experimental logs and are not reported here; this limits the exact reproducibility of the Random Forest results and is noted as a limitation in Section 5.3. The per-class test support underlying the Random Forest classification report (75 Burned Rail, 823 Flaking, 50 Joints, 182 Shelling, 638 Spalling, 172 Squats;) differs from the evaluation split used for the CNN experiments (66/815/52/197/616/194; Table 1), confirming that the Random Forest pipeline was evaluated on an independently partitioned test set rather than the identical split used for the CNN backbones. The Random Forest accuracy figures are therefore not a direct, image-for-image comparison with the CNN results and are reported as an aggregate-level comparison only.
All models were trained using identical protocols to ensure fair comparative evaluation. Input images were resized to 224 × 224 × 3 pixels to match the expected dimensions of pre-trained ImageNet architectures. Given the severe class imbalance (imbalance ratios from 1.00:1 to 15.67:1 in the test set), class weights were computed and applied during training using the formula:
weight_class_i = total_samples/(num_classes × samples_class_i)
This resulted in weights of 4.71 for Burned Rail, 0.39 for Flaking, 6.56 for Joint Issues, 1.66 for Shelling, 0.51 for Spalling, and 1.74 for Squats, penalizing misclassification of minority classes during loss computation.
Data Augmentation: To improve model generalization and partially address class imbalance, the following augmentation techniques were applied randomly during training: (1) horizontal flipping (probability = 0.5), (2) random rotation (±15 degrees), (3) brightness adjustment (±20%), (4) width and height shifts (±10%), and (5) zoom range (±15%). No vertical flipping was applied as railway track orientation provides meaningful spatial information.
These specific augmentations were chosen to reflect variability actually observed in the source video: brightness adjustment and zoom range approximate the lighting changes and camera-distance variation seen across different inspection runs; width/height shifts and rotation approximate imperfect framing and camera vibration from the mobile inspection platform; and horizontal flipping increases effective sample diversity for the minority classes without altering the semantic content of a defect. Augmentation magnitudes were kept modest (≤20%) to avoid generating unrealistic examples not representative of operational track conditions.
Optimization Configuration: All models employed the Adam optimizer with an initial learning rate of 0.0001 and default momentum parameters (β1 = 0.9, β2 = 0.999, ε = 10−8). Learning rate reduction was implemented via a ReduceLROnPlateau callback with a reduction factor of 0.5, a patience of 5 epochs, and a minimum learning rate of 10−7. A ReduceLROnPlateau-style early stopping callback (patience of 10 epochs on validation loss) was configured for these experiments; however, the recorded training and validation loss curves for all five models ran for the full 300-epoch budget, including for MobileNetV2 and DenseNet121, whose validation loss rises well before epoch 300. This indicates that early stopping did not trigger during these training runs. All models were therefore trained for the full 300 epochs, and the test-set metrics reported throughout this manuscript correspond to each model’s final-epoch weights rather than a restored best-validation checkpoint.
Network Architecture: The classification head added to each pre-trained base model consisted of: (1) Global Average Pooling layer, (2) Dense layer (256 neurons, ReLU activation, L2 regularization = 0.01), (3) Dropout (rate = 0.5), (4) Dense layer (128 neurons, ReLU activation, L2 regularization = 0.01), (5) Dropout (rate = 0.3), (6) Output layer (6 neurons, SoftMax activation). Categorical cross-entropy with class weights served as the loss function.
Training Protocol: Models were trained with a batch size of 32 for up to 300 epochs on an NVIDIA Tesla P100-PCIe-16 GB GPU. The training set (4525 images) was split, with 20% reserved for validation monitoring (905 images), while the test set (1940 images) was held out entirely for final evaluation. Training typically converged within 30–50 epochs due to early stopping, with total training time ranging from 45 min (MobileNetV2) to 180 min (DenseNet121).
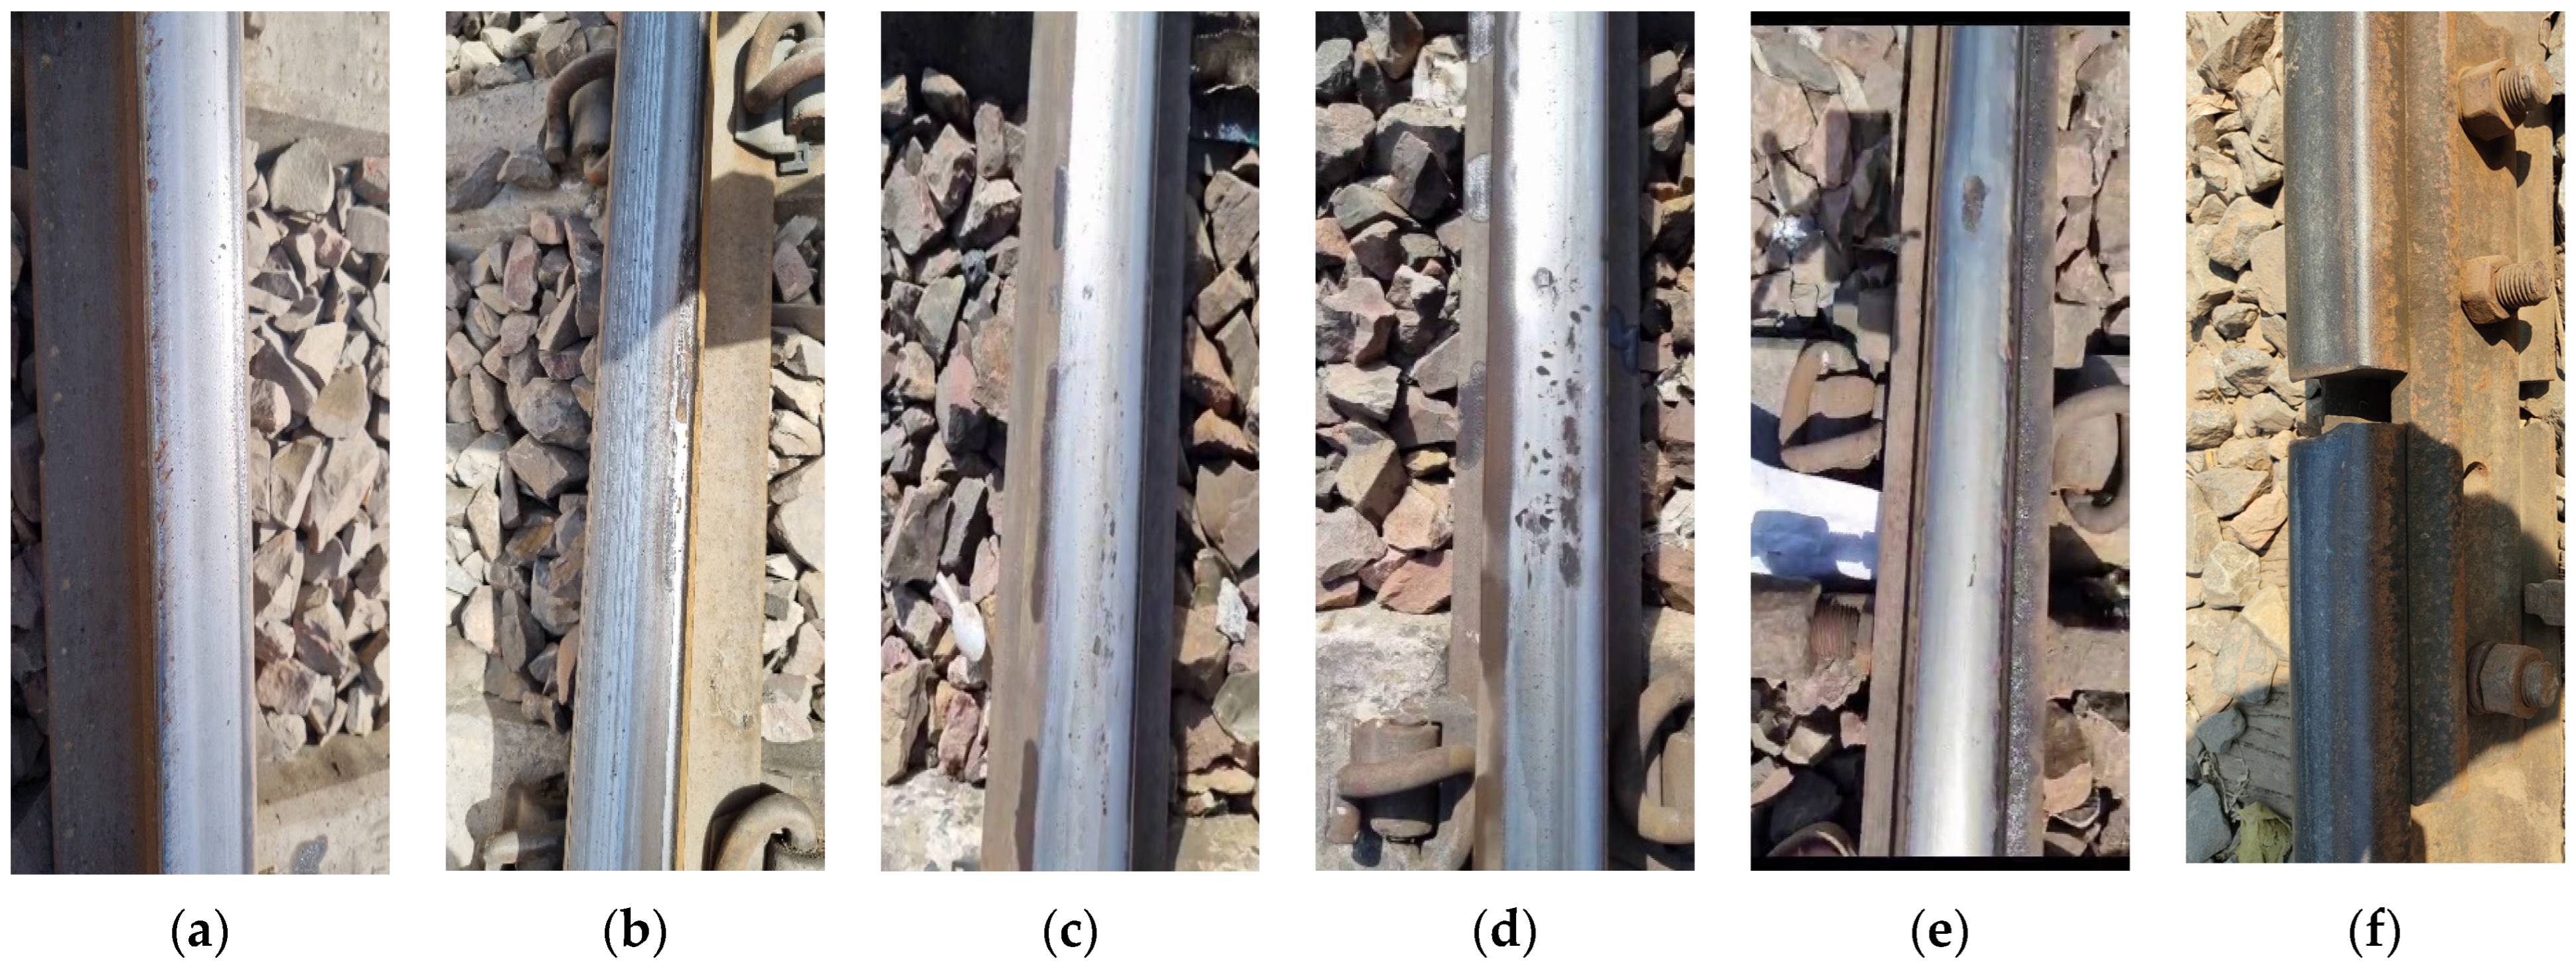
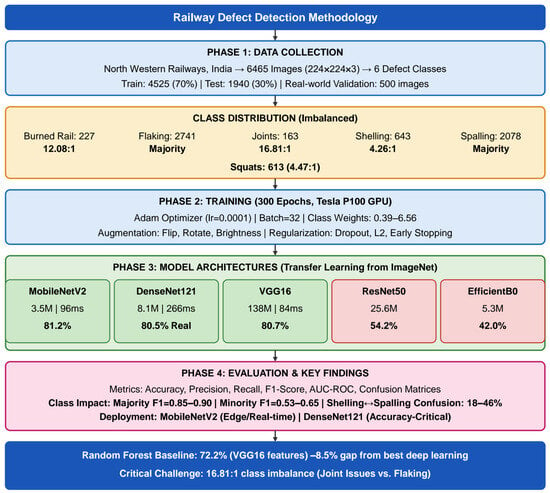
Figure 2 presents a comprehensive overview of the complete methodology employed in this study, illustrating the five-phase workflow from data collection through final evaluation. The flowchart visualizes the systematic approach adopted for railway track defect detection, highlighting critical aspects such as severe class imbalance (15.67:1 ratio between Joint Issues and Flaking in the test set), transfer learning using ImageNet pre-trained weights, and the comparative evaluation framework.
Figure 2.
Complete methodology flowchart from data collection through model evaluation and deployment recommendations.
The methodology covers: (1) 6465 annotated images collected from operational NWR tracks across six defect categories; (2) class-weighted loss functions (weights 0.39–6.56) with data augmentation to address imbalance; (3) evaluation of five CNN architectures alongside a Random Forest baseline via transfer learning; (4) performance assessment through multiple metrics including real-world validation on 500 custom images; and (5) deployment strategy identification based on accuracy–efficiency trade-offs. MobileNetV2 achieves the highest test accuracy (81.2%) with optimal edge-deployment efficiency, while DenseNet121 shows superior real-world generalization (80.5%).
4. Experimental Results and Analysis
4.1. Performance Evaluation Metrics
The evaluation of deep learning models for railway defect detection requires a comprehensive assessment using multiple performance metrics to ensure robust and reliable systems. This study employed standard classification metrics, including accuracy, precision, recall, F1-score, and Area Under the Receiver Operating Characteristic Curve (AUC-ROC), to provide a thorough performance characterization across different defect categories.
Accuracy measures the proportion of correctly classified instances overall, though it alone can be misleading for imbalanced datasets. Precision captures the fraction of true positive predictions, while recall reflects the model’s ability to detect all actual defect instances. The F1-score provides a harmonic mean of precision and recall, offering a balanced view under class imbalance. AUC-ROC illustrates the true-positive versus false-positive rate trade-off across thresholds, reflecting overall discriminative capability.
The F1-score provides a harmonic mean of precision and recall, offering a balanced measure of model performance, particularly valuable in scenarios with class imbalance. AUC-ROC curves illustrate the trade-off between true and false positive rates across different classification thresholds, providing insights into the model’s discriminative capability across all defect categories.
4.2. Defect Classification and Characteristics Using Deep Learning Methods
The experimental evaluation revealed significant performance variations among the evaluated deep learning architectures, with MobileNetV2, VGG16, and DenseNet121 demonstrating superior performance across most evaluation metrics, as shown in Table 2. After 300 training epochs, MobileNetV2 achieved the highest overall accuracy of 81.2%, with a precision, recall, and F1-score of 0.82, 0.81, and 0.81, respectively. The macro-averaged AUC-ROC score of 0.96 indicated excellent class separability and discriminative capability across all six defect categories.
Table 2.
Model performance for rail defect classification.
VGG16 demonstrated competitive performance with 80.7% accuracy and well-balanced precision–recall characteristics (0.81, 0.81), achieving a macro-averaged AUC-ROC score of 0.96. Despite its older architecture and substantially larger parameter count (138.4M parameters), VGG16’s performance demonstrates that architectural simplicity, combined with adequate training, can rival modern efficient architectures. The extended training period of 300 epochs allowed VGG16 to overcome its slower convergence characteristics and achieve near-optimal performance.
DenseNet121 achieved 80.0% accuracy with balanced metrics (precision: 0.80, recall: 0.80, F1-score: 0.80) and a macro-averaged AUC-ROC score of 0.96. The model’s dense connectivity architecture proved particularly effective at capturing complex feature relationships inherent in railway defect patterns, though it achieved slightly lower overall performance metrics than MobileNetV2 and VGG16 on the standard test set.
ResNet50 and EfficientNetB0 substantially underperformed the other three models, achieving accuracies of 54.2% and 42.0% respectively, but for different reasons. Examination of their confusion matrices (Section 4.2) and training logs (Figure 3) shows that EfficientNetB0 collapsed to predicting the majority class (Flaking) for every test image and never learned a discriminative signal—a genuine training/optimisation failure. ResNet50, by contrast, trained and converged normally, with stable, gradual loss reduction and no train/validation divergence, but converged to a limited solution that never predicts “Burned Rail” and rarely predicts “Joints.” Neither outcome is attributed to the dataset’s class imbalance or to architectural incompatibility; in the absence of hyperparameter-search evidence, the specific cause of ResNet50’s limited solution cannot be established with certainty. Diagnosis and re-training of EfficientNetB0, and further hyperparameter exploration for ResNet50, are recommended before either model’s results are treated as valid comparison points (Section 5.3).
Figure 3.
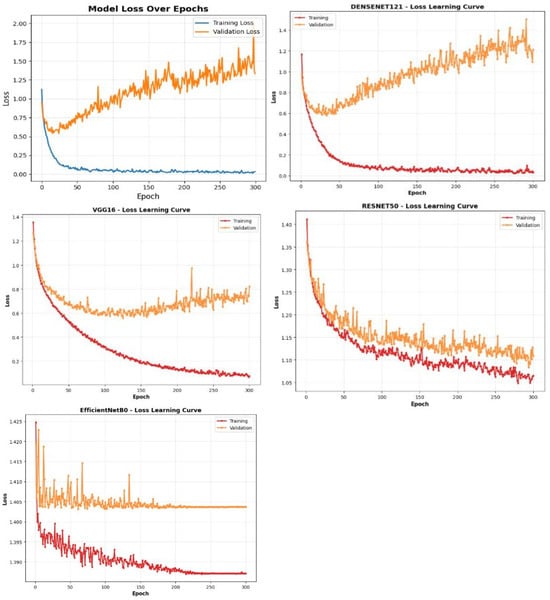
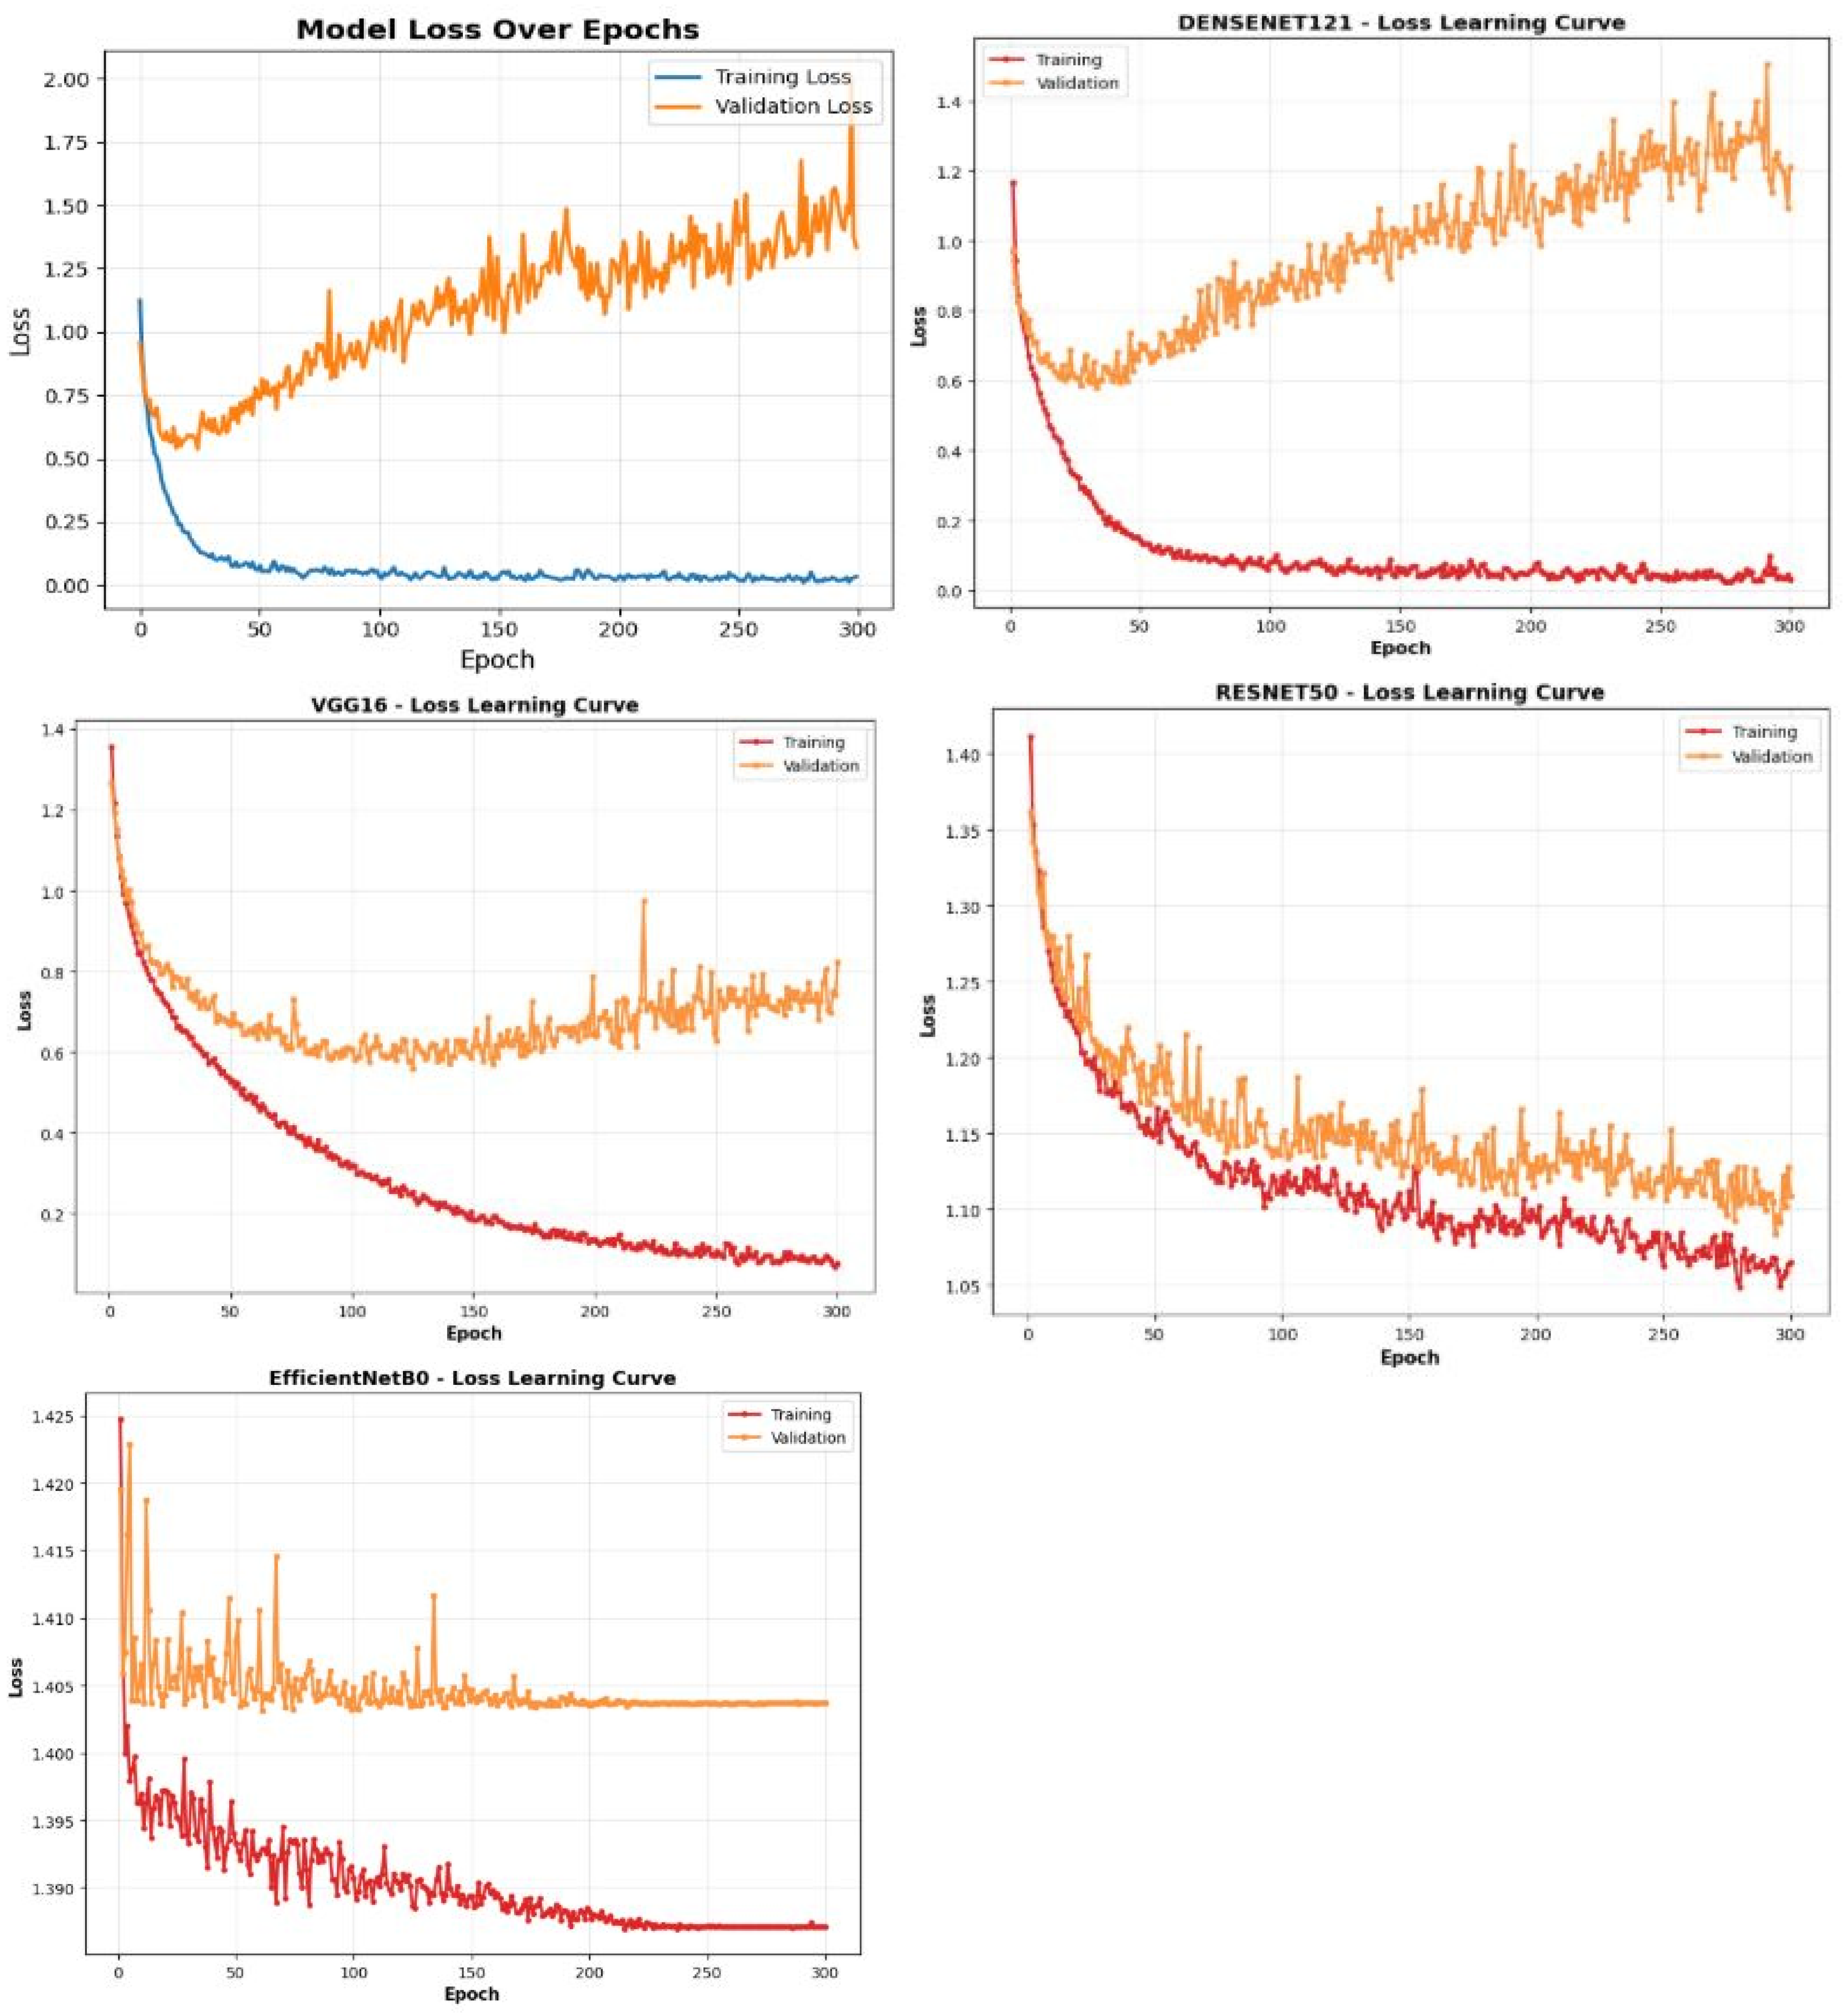
Training and validation loss curves for all five CNN backbones (300 epochs each).
MobileNetV2, DenseNet121, and VGG16 show a widening train/validation gap characteristic of overfitting, despite reaching good test accuracy. ResNet50 shows stable convergence with no overfitting but limited final performance. EfficientNetB0’s validation loss is essentially flat from early training onward, consistent with a training/optimisation failure.
The training and validation loss curves(Figure 3) further reveal that MobileNetV2, DenseNet121, and VGG16, the three models with the best test accuracy, each show a widening gap between training and validation loss over 300 epochs, characteristic of overfitting. This effect is most pronounced for MobileNetV2, whose validation loss rises from approximately 0.6 to 1.5–1.8 while training loss falls to near zero. That these models nonetheless generalise reasonably well on the held-out test set suggests that the class-weighted loss and augmentation strategy (Section 3.4) partially mitigate the effect of overfitting on generalisation performance. Further regularisation or earlier stopping may improve generalisation beyond what is reported here; evaluating this possibility is left to future work.
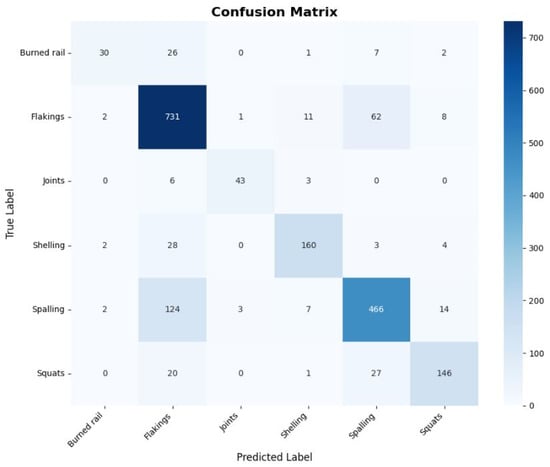
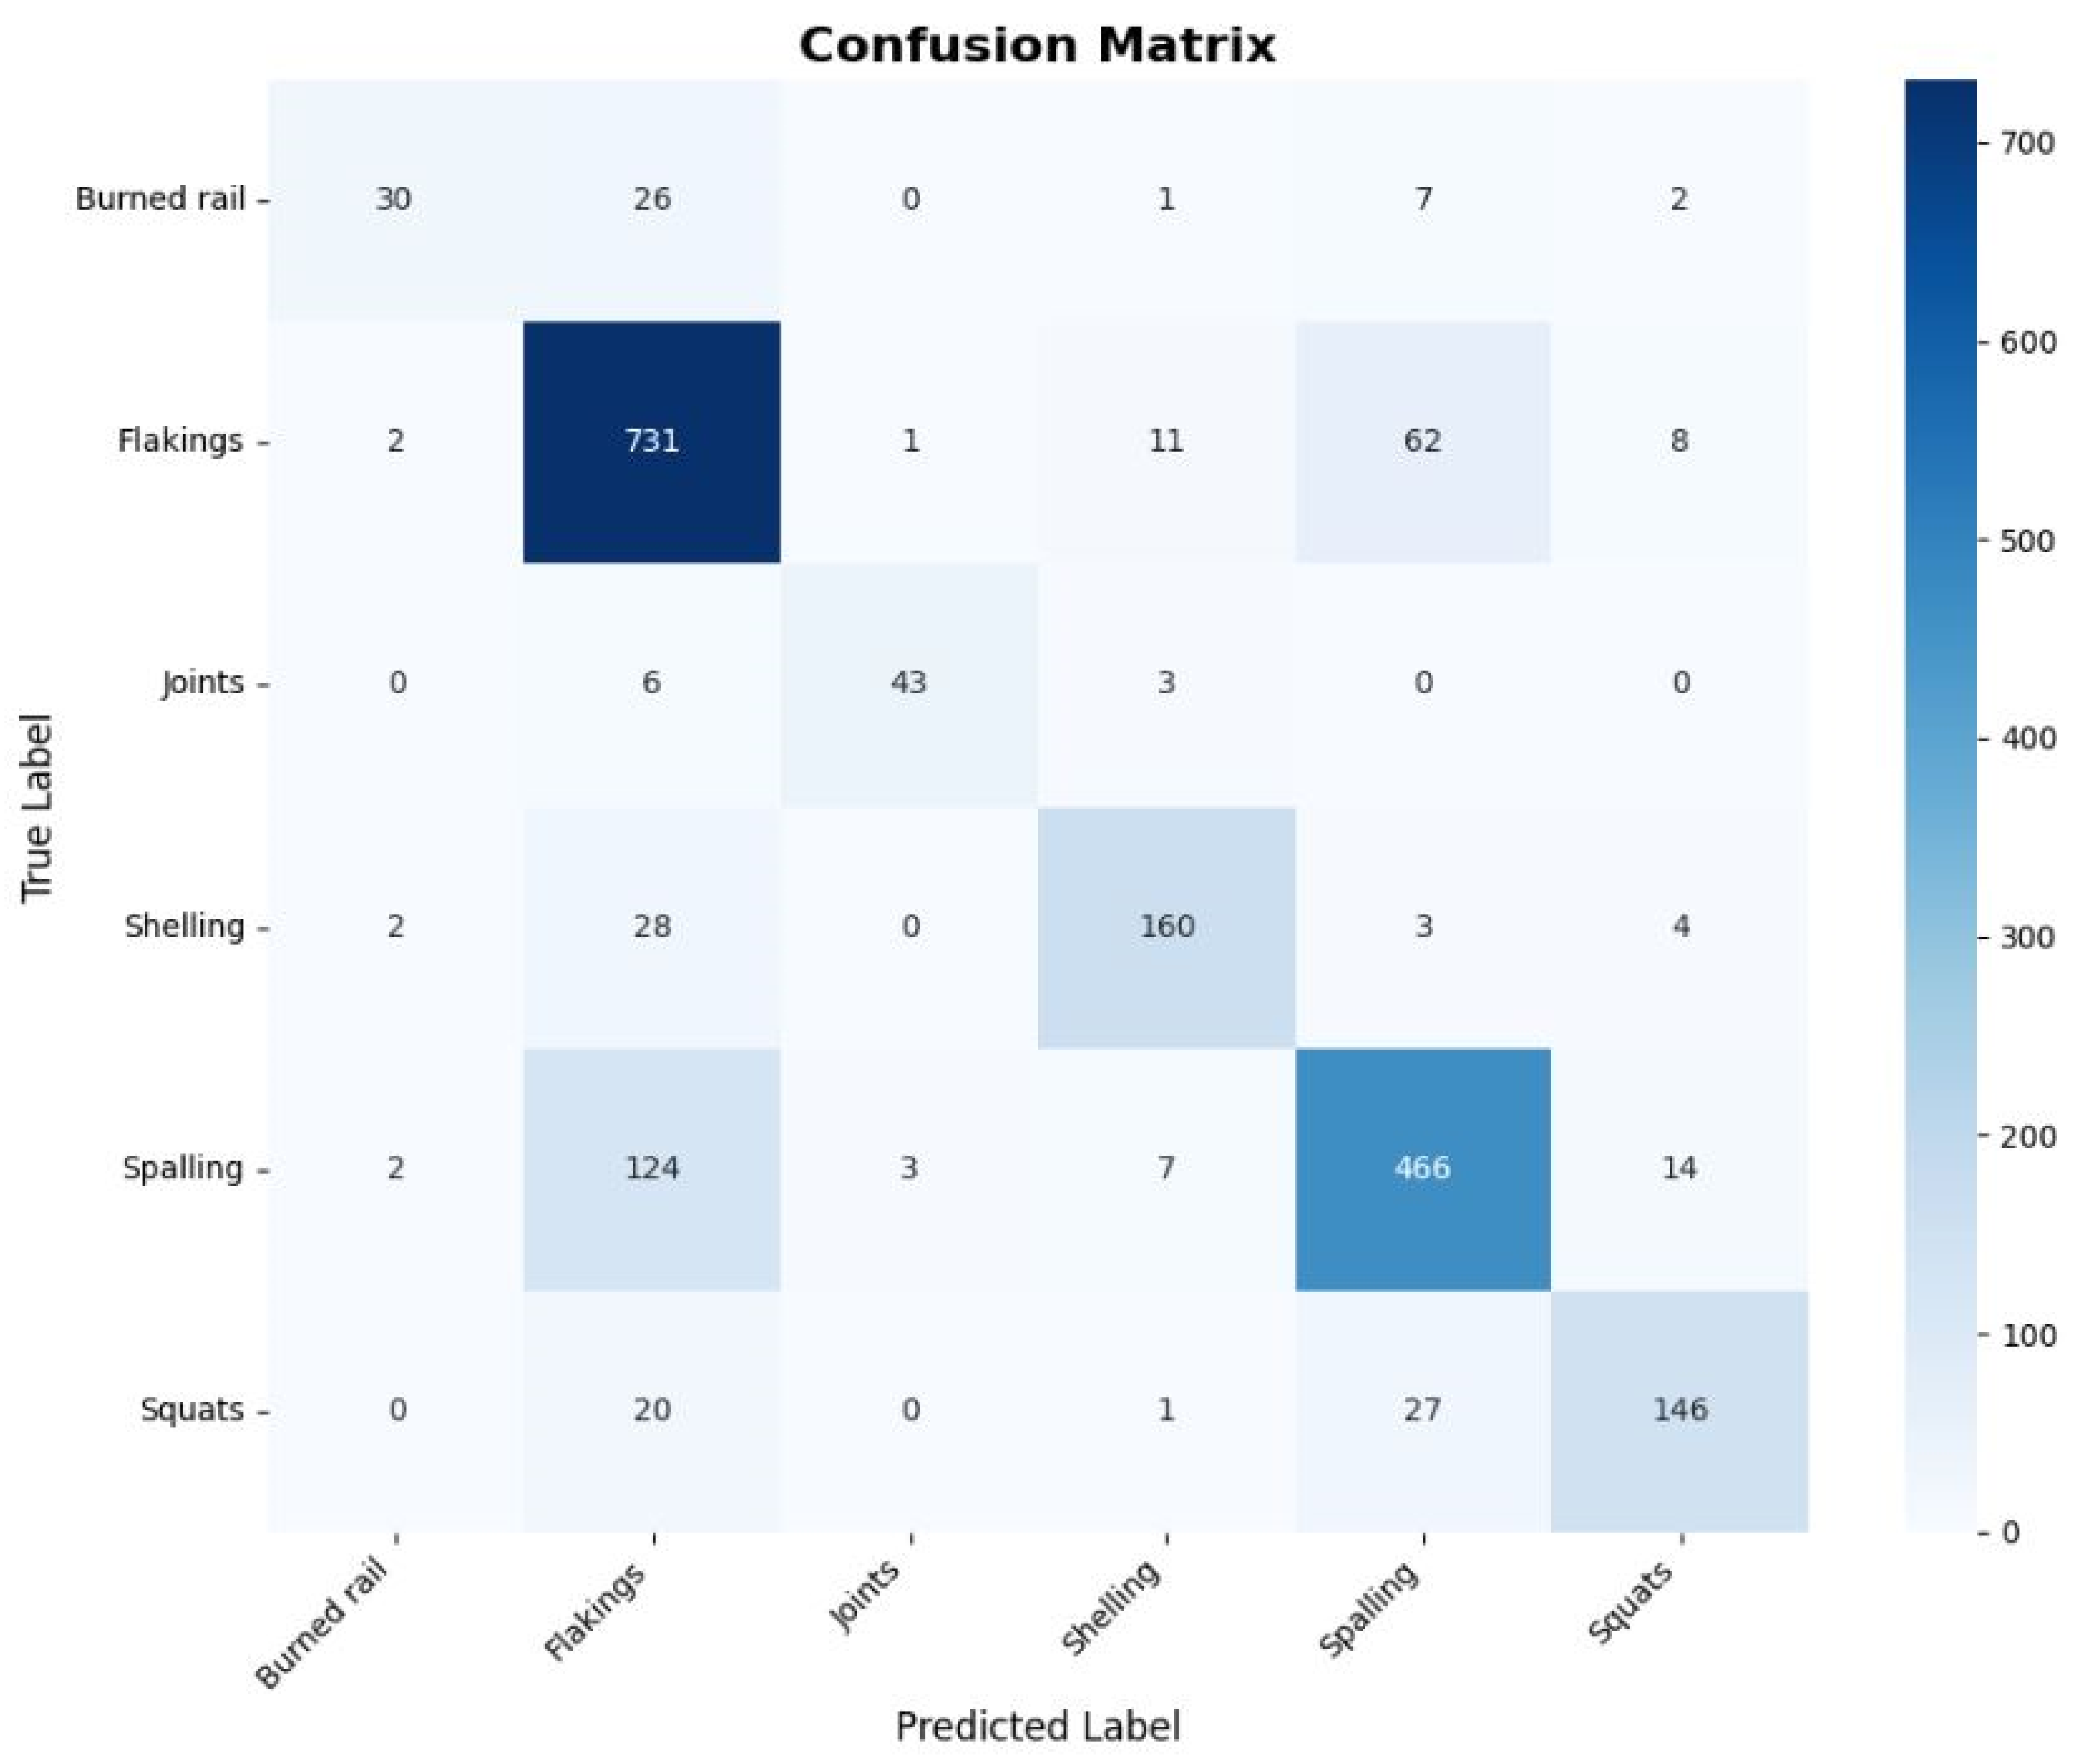
Figure 4 presents the confusion matrix for MobileNetV2, revealing the impact of class imbalance on classification performance. The model achieves strong majority-class performance: Flaking is correctly classified in 731 of 815 test instances (89.7% recall), and Spalling in 466 of 616 (75.6% recall).
Figure 4.
Confusion matrix for MobileNetV2 model.
Notable confusion patterns emerge between visually similar defect types. Shelling is most often confused with Flaking (28 of 197 Shelling instances, 14.2%), and Spalling is most often confused with Flaking (124 of 616 Spalling instances, 20.1%). Minority-class recall is markedly lower: Burned Rail recall is 45.5% (30/66), the weakest of any class, with 39.4% of Burned Rail instances misclassified as Flaking.
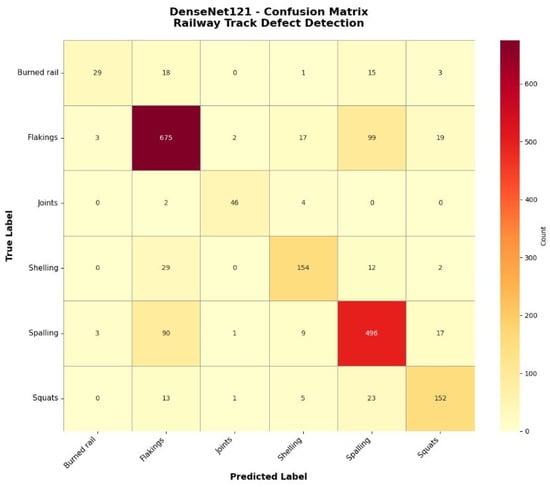
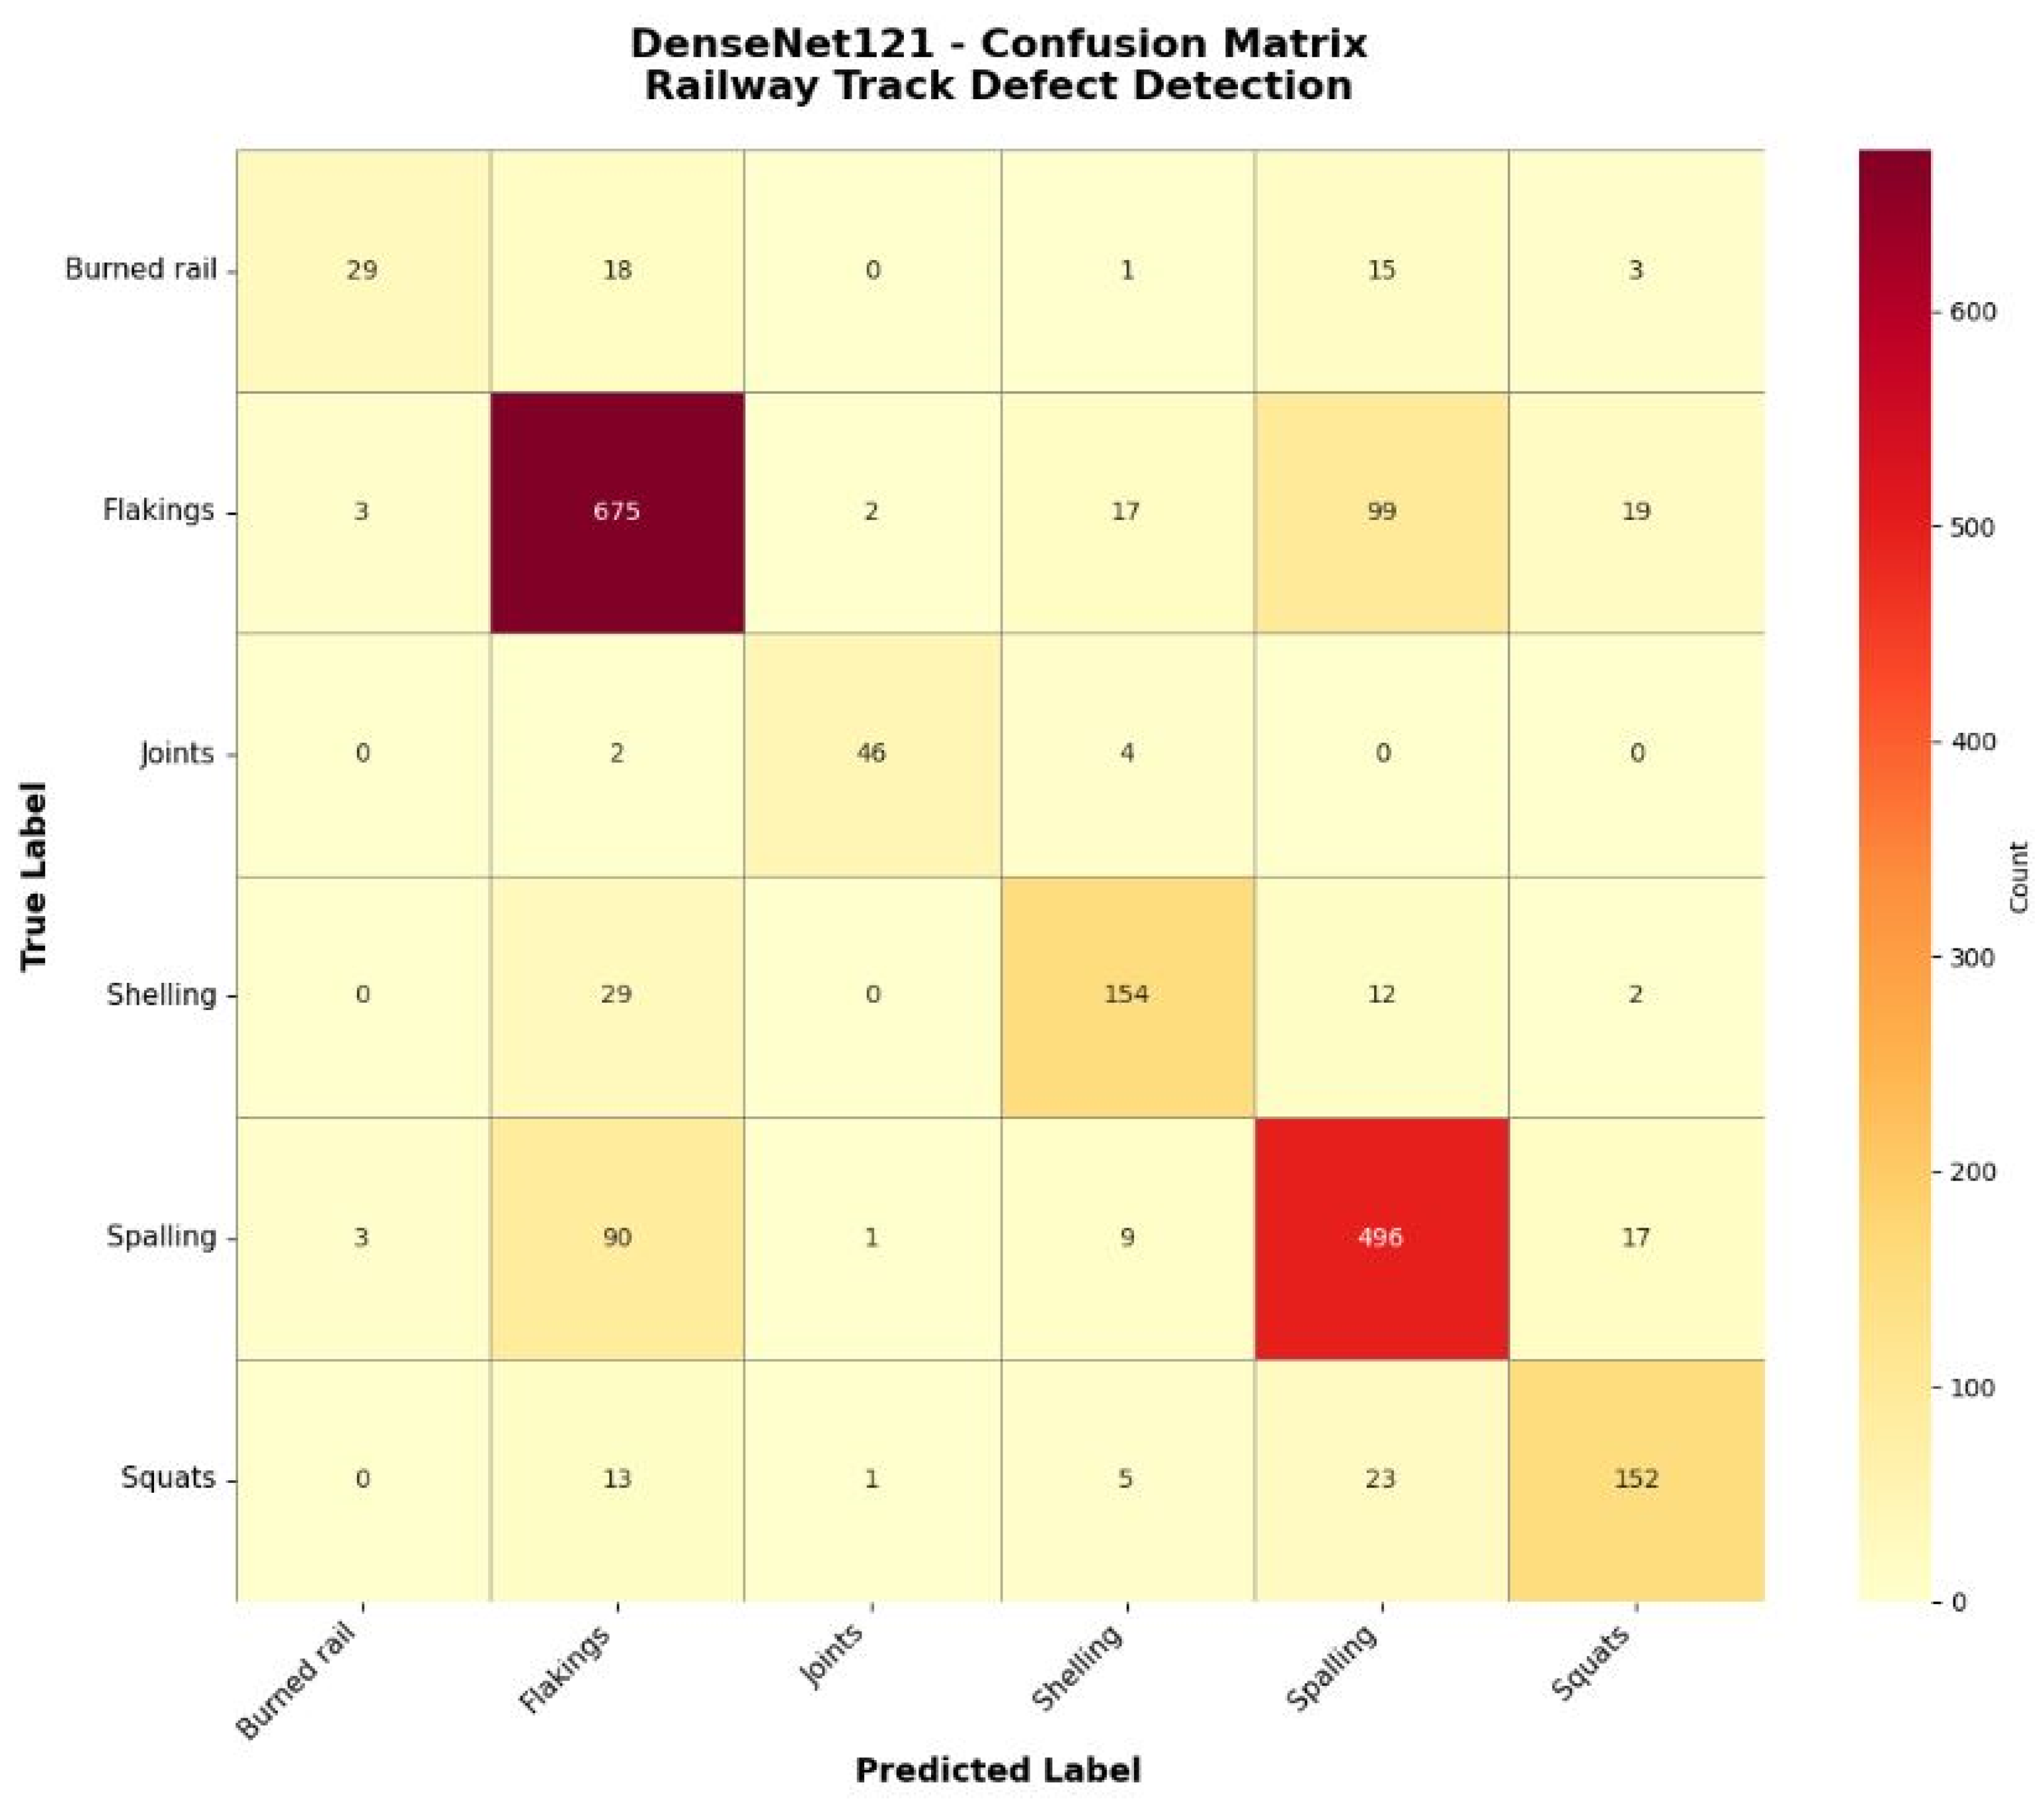
Figure 5 presents the confusion matrix for DenseNet121, which correctly classifies 675 of 815 Flaking instances (82.8% recall) and 496 of 616 Spalling instances (80.5% recall), with Squats at 152/194 (78.4%). Minority-class recall is 43.9% for Burned Rail (29/66) and 88.5% for Joint Issues (46/52). Shelling–Flaking confusion is notable (29 of 197 Shelling instances, 14.7%).
Figure 5.
Confusion matrix for DenseNet121 model.
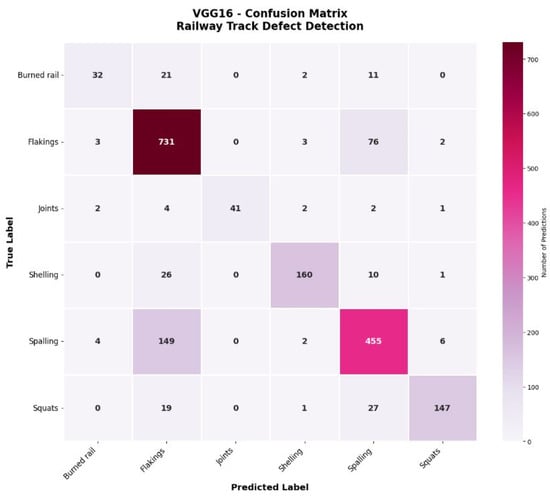
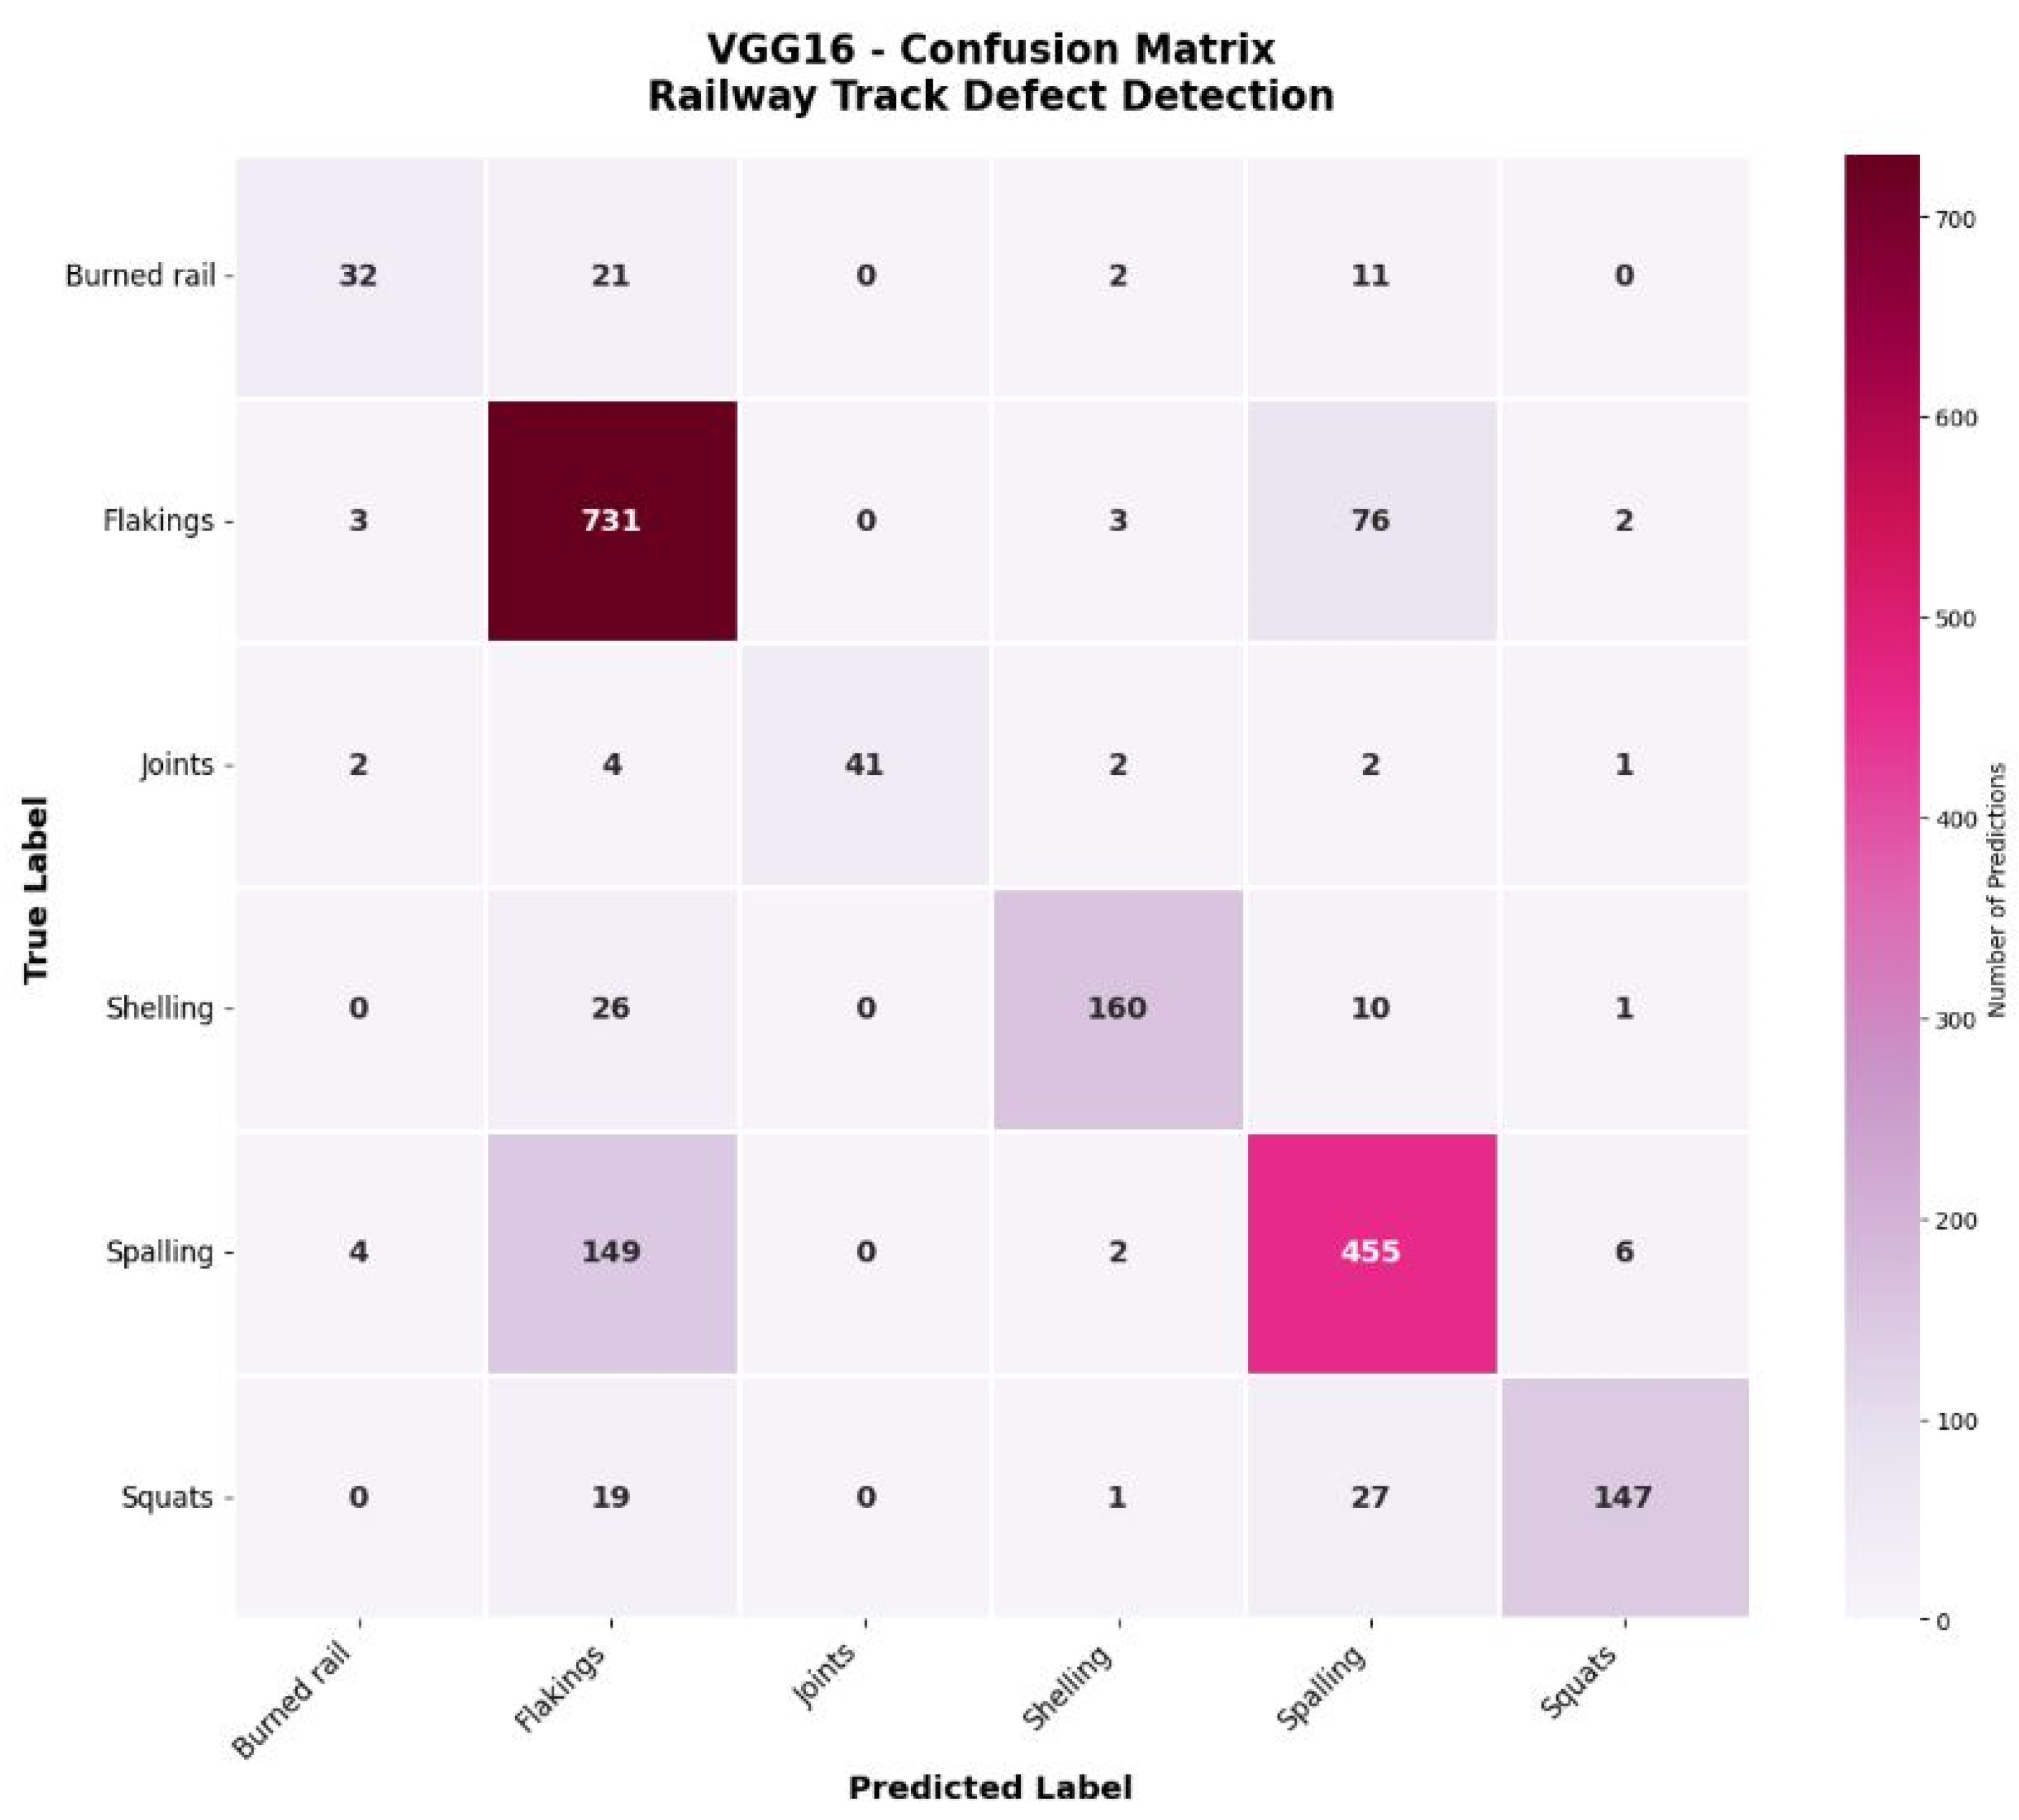
Figure 6 presents the confusion matrix for VGG16, which achieves the highest Flaking recall among the three best-performing models (731/815, 89.7%, tied with MobileNetV2) and 455/616 for Spalling (73.9%). For minority classes, VGG16 achieves 48.5% Burned Rail recall (32/66), the best among the five CNNs, and 78.8% Joint Issues recall (41/52). Squats recall is 75.8% (147/194).
Figure 6.
Confusion matrix for VGG16 model.
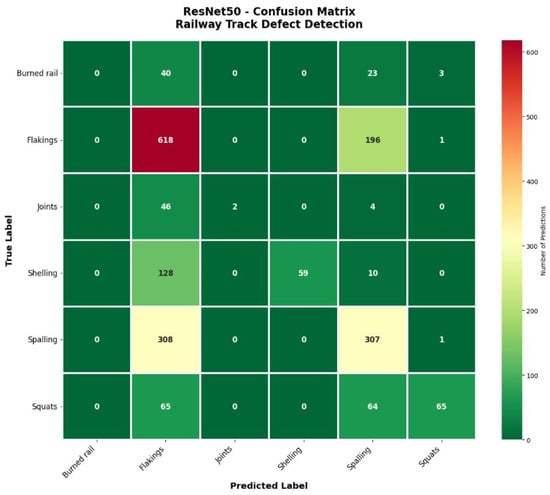
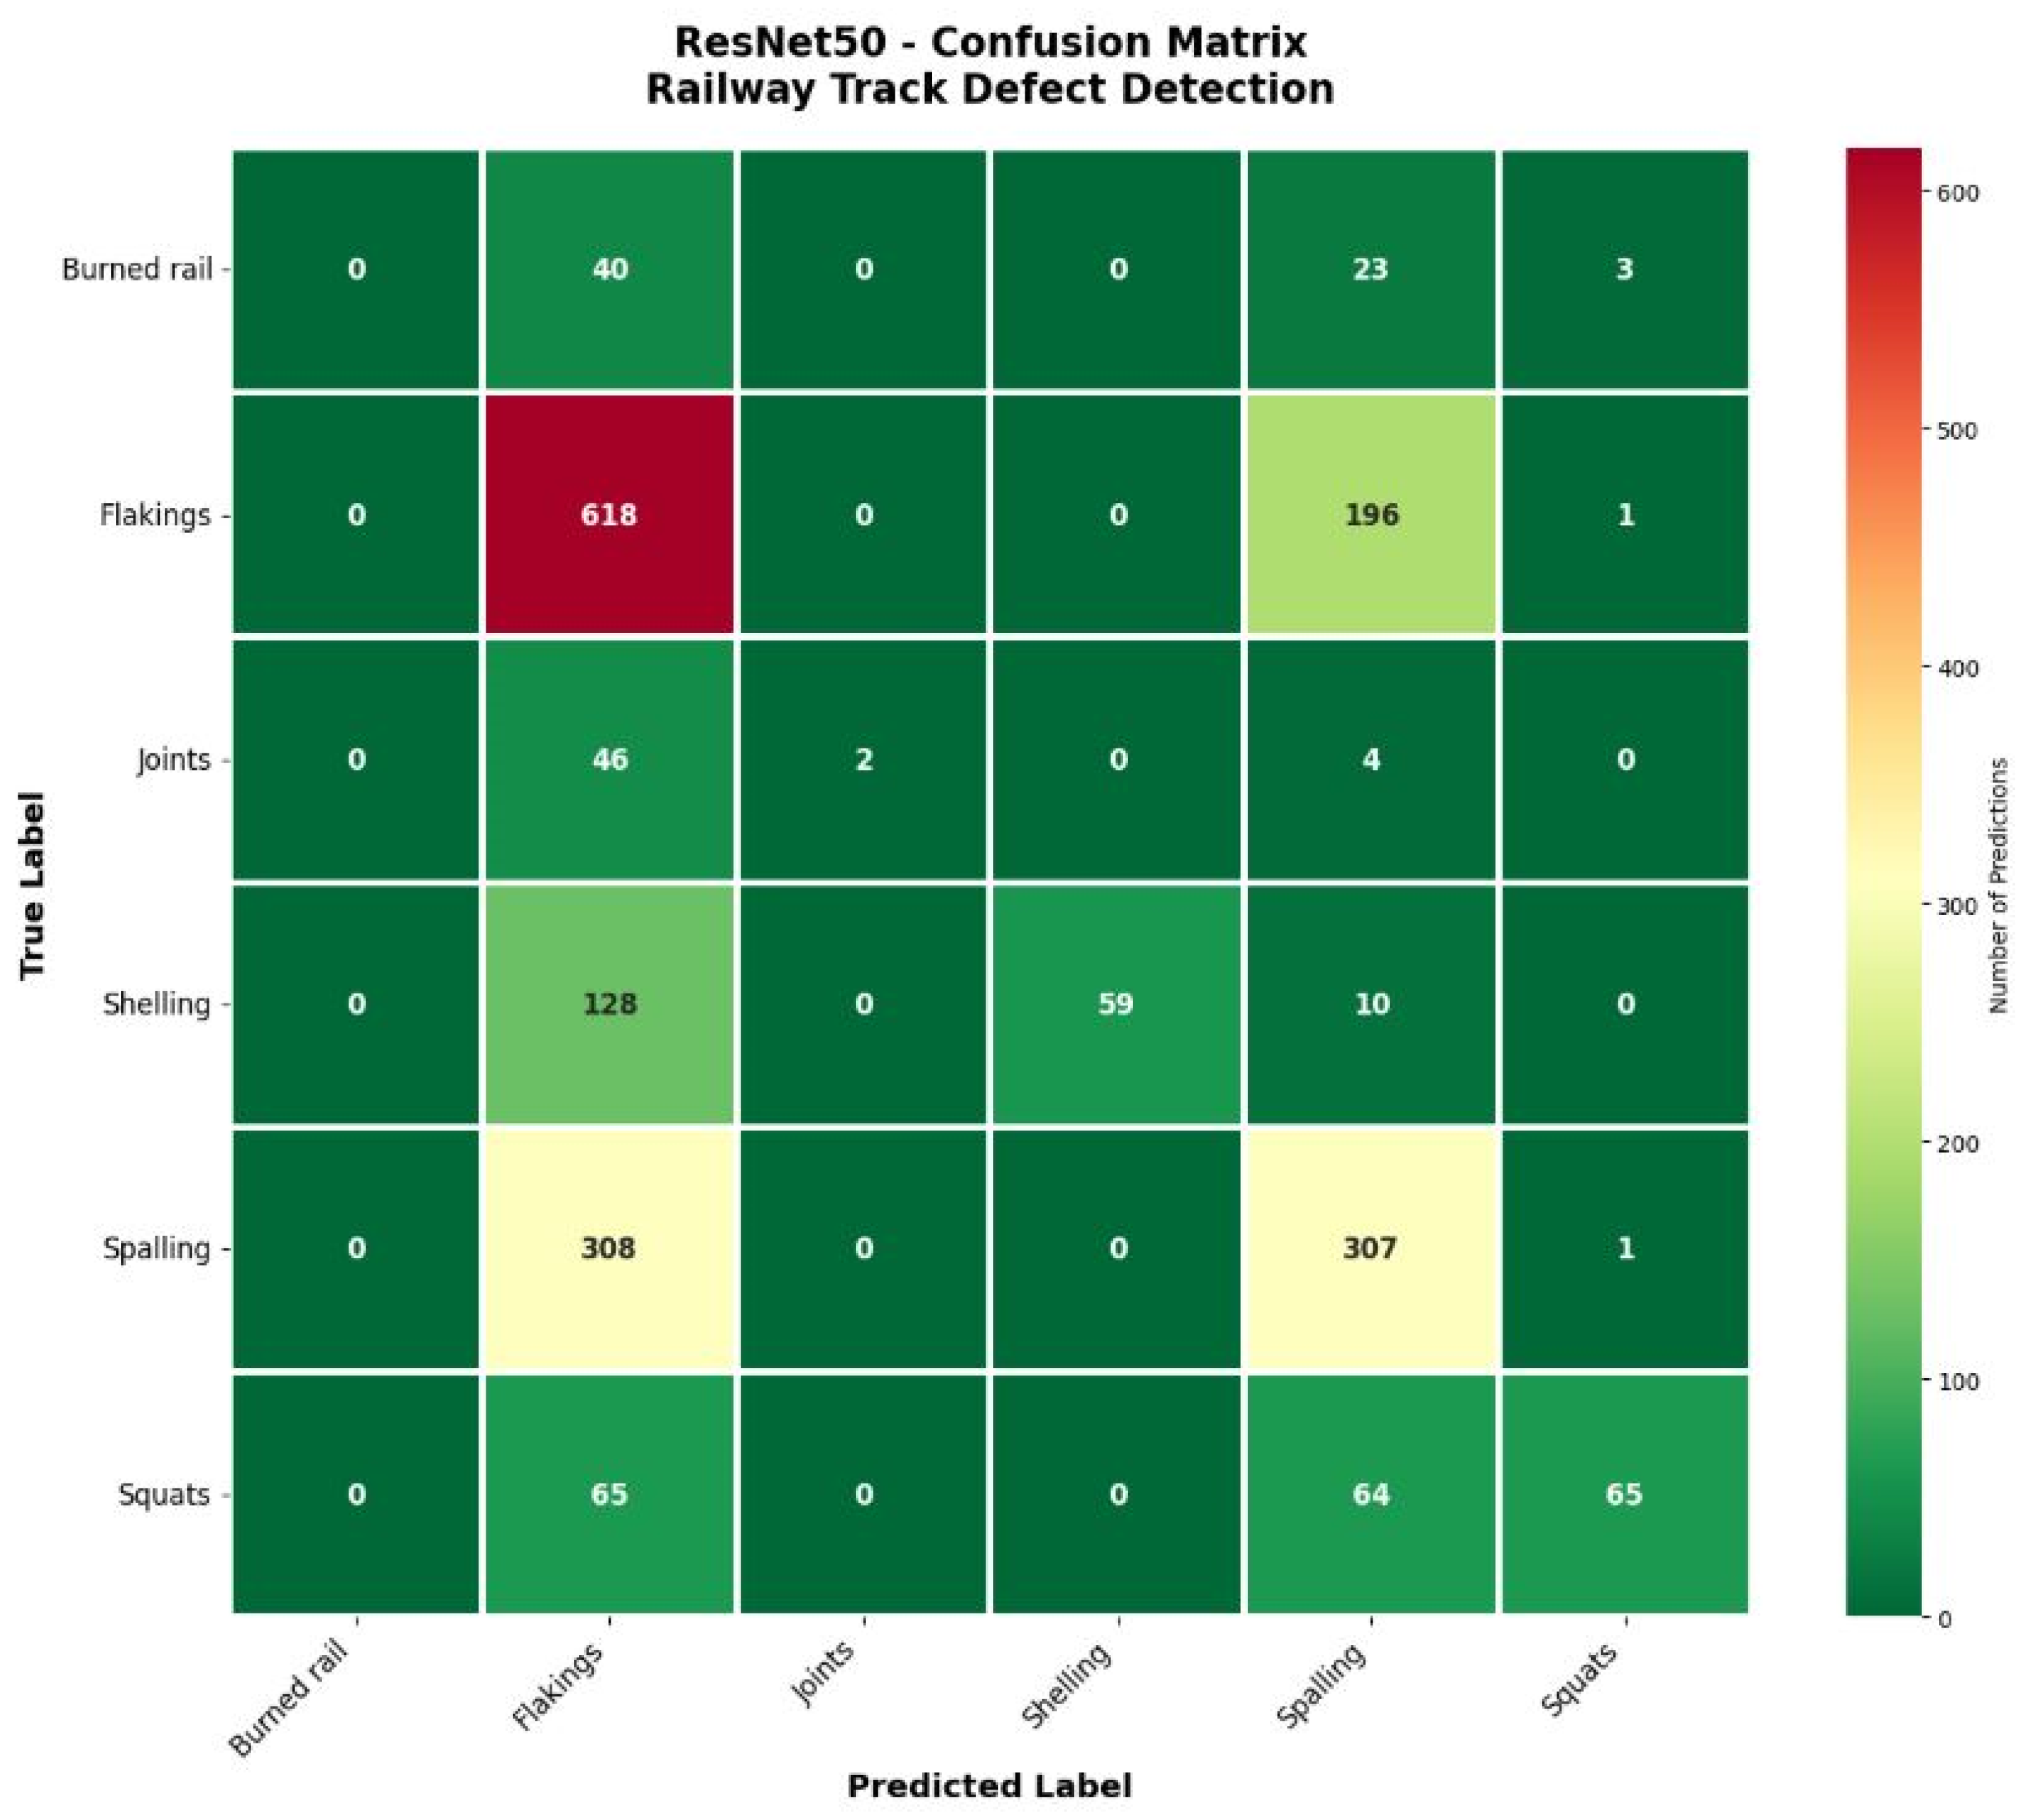
Figure 7 displays the confusion matrix for ResNet50, illustrating the severe classification failures underlying its 54.2% overall accuracy. The confusion matrix shows that the model never predicts “Burned Rail” (0.00 recall, 0.00 F1) and rarely predicts “Joints” (3.85% recall, F1 = 0.07), with the majority of instances from both classes misclassified as Flaking or Spalling. The corresponding training and validation loss curves(Figure 3) indicate that this outcome does not reflect a training or optimisation failure of the kind observed for EfficientNetB0 (Section 4.2): ResNet50’s training and validation loss decrease together and plateau smoothly over 300 epochs with no divergence, and training accuracy rises steadily from approximately 0.41 to a stable 0.55. The model therefore trained and converged successfully, but to a limited solution that does not separate the rarest classes from the majority classes under the configuration used. Rather than an architectural incompatibility, a more parsimonious interpretation is that ResNet50, under the frozen-backbone transfer-learning configuration, learning-rate schedule, and class-weighting scheme applied here, receives insufficient gradient signal for the minority classes; an alternative fine-tuning configuration may yield improved performance.
Figure 7.
Confusion matrix for ResNet50 model.
For the majority classes, ResNet50 achieves 618 of 815 correct Flaking predictions (75.8% recall) and 307 of 616 correct Spalling predictions (49.8% recall), but at the cost of overprediction of Flaking specifically: 128 of 197 Shelling instances (65.0%) and 40 of 66 Burned Rail instances (60.6%) are misclassified as Flaking. Weighted precision, recall, and F1-score are 0.60, 0.54, and 0.51, respectively (Table 2); per-class ROC-AUC ranges from 0.68 (Burned Rail) to 0.88 (Joints), macro-averaging to 0.78—well above chance, confirming the model retains some ranking ability even for classes it never assigns as its top prediction.
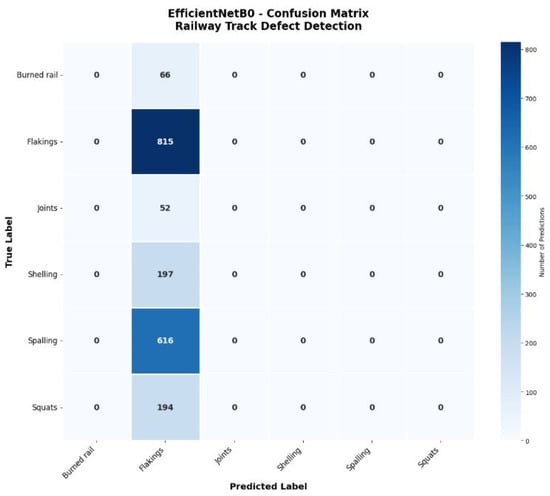
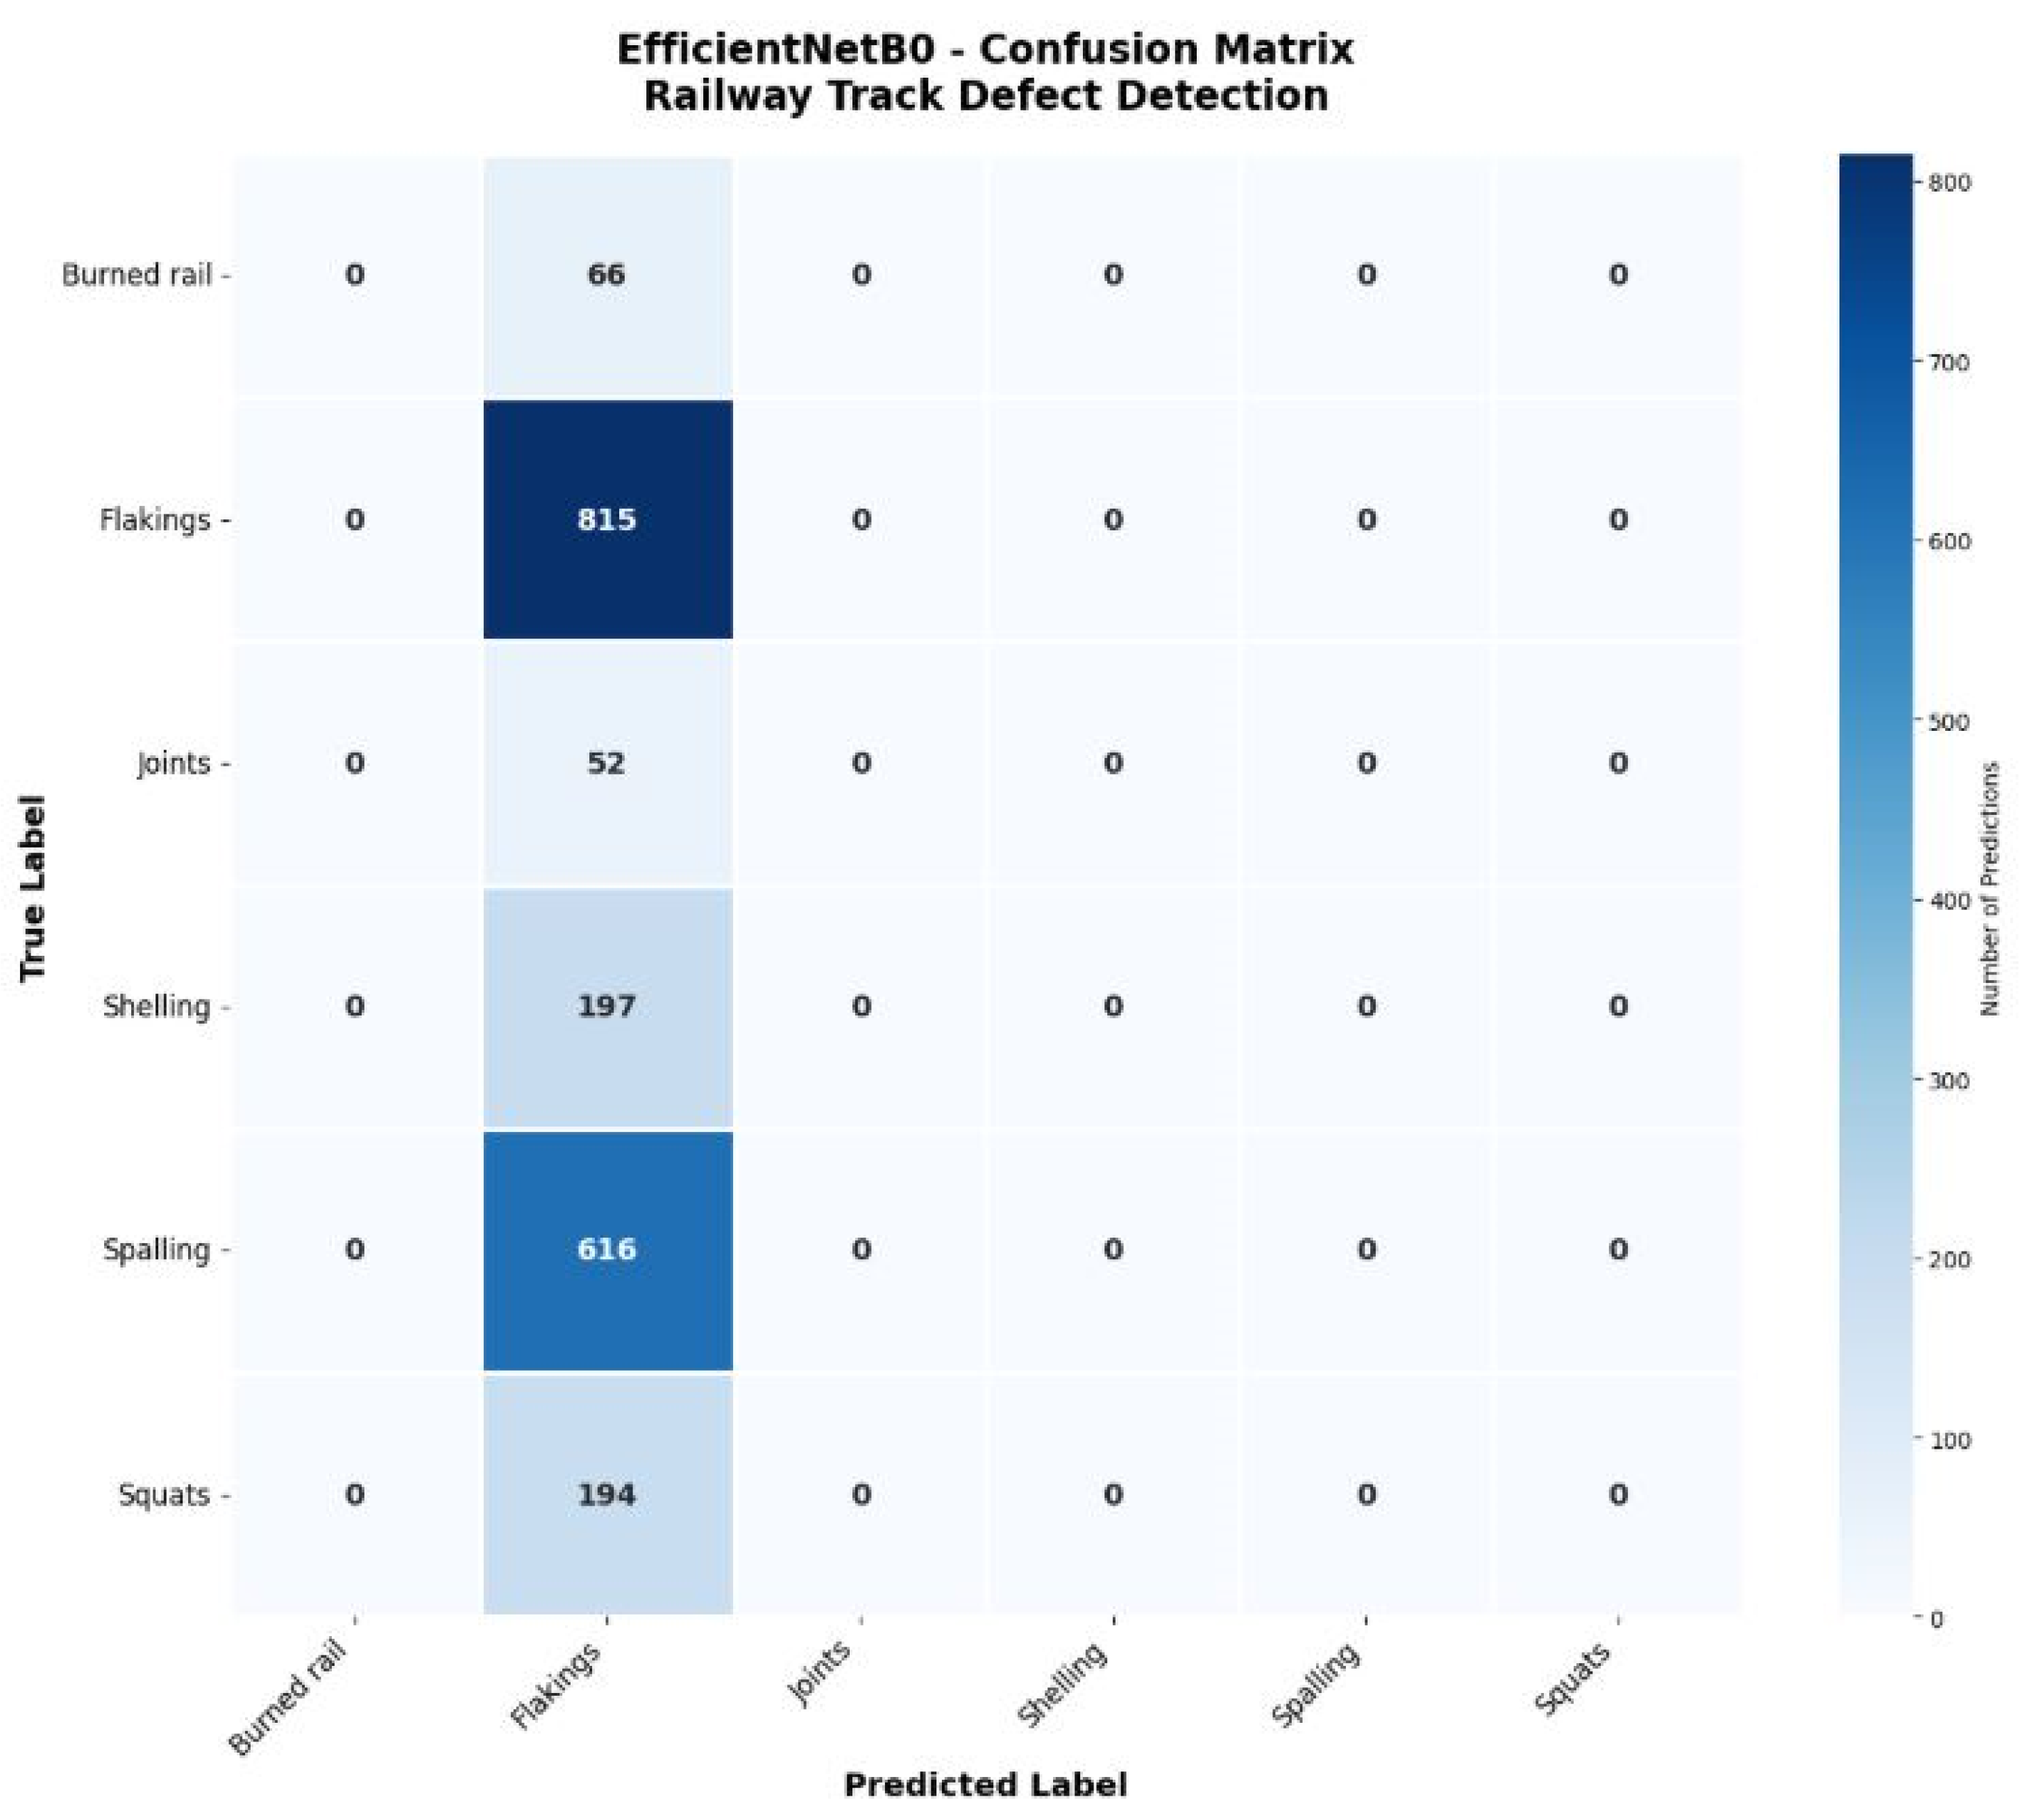
Figure 8 shows the confusion matrix for EfficientNetB0 (42.0% accuracy), the weakest performance among all evaluated models. The matrix shows that the model predicts “Flaking” for all 1940 test images and never predicts any of the remaining five classes, indicating collapse to the majority-class baseline (815/1940 = 42.0%, matching the reported accuracy exactly). The corresponding training log confirms that this reflects a genuine training failure: training accuracy improved by only 0.0146 over the full 300 epochs (from 0.411 to 0.426), and the validation–accuracy curve (Figure 8) is essentially flat at the majority-class baseline from approximately epoch 5 onward. Most conclusively, the per-class ROC-AUC is exactly 0.500 for all six classes, indistinguishable from a random classifier, indicating that the model’s predicted probabilities carry no discriminative information. Weighted precision, recall, and F1-score are 0.18, 0.42, and 0.25, respectively (Table 2), and the F1-score for every class other than Flaking is 0.00 (Table 3). This combination of rapid stagnation within the first few epochs, flat validation loss, and chance-level AUC is consistent with the classification head failing to receive a useful gradient signal early in training (for example, due to a learning rate too low for the unfrozen layers, or an output-layer initialisation that saturated the softmax toward the majority class) rather than with any intrinsic property of the EfficientNetB0 architecture. Retraining with an alternative learning-rate schedule or partial-unfreezing strategy is recommended as follow-up work.
Figure 8.
Confusion matrix for EfficientNetB0 model.
Table 3.
Class-wise performance analysis based on F1-score.
Section 5.3 discusses the implications of this training failure for the validity of EfficientNetB0 as a comparison point in this study.
Despite 300 training epochs, early stopping, class-weighted loss, and data augmentation, EfficientNetB0 could not overcome these limitations, suggesting that class-specific scaling strategies or asymmetric loss functions would be necessary before this architecture could be considered viable for imbalanced railway defect detection.
Cross-model comparison of the confusion matrices reveals three findings. First, Shelling-to-Flaking misclassification is comparatively consistent among the three successfully trained models (13.2% for VGG16, 14.2% for MobileNetV2, and 14.7% for DenseNet121), whereas ResNet50 (65.0%) and EfficientNetB0 (100%) show far higher rates, consistent with their general collapse toward the Flaking class rather than a shared, architecture-independent visual confusion. Second, majority-class bias varies substantially: VGG16 and MobileNetV2 maintain comparatively balanced predictions, while ResNet50 and EfficientNetB0 show severe overprediction of Flaking and, for ResNet50, Spalling. Third, overall accuracy alone is misleading for imbalanced datasets: ResNet50’s 54.2% accuracy masks a recall of 0.00% for Burned Rail and 3.85% for Joints (Table 2), a level of minority-class failure that would be unacceptable for safety-critical deployment, where rare defects carry disproportionate risk.
Finally, architectural complexity does not guarantee superior performance on imbalanced data; the simpler VGG16 outperforms ResNet50 and EfficientNetB0, underscoring that architecture selection and training strategy matter more than raw model sophistication.
4.3. Class-Wise Performance Analysis
The analysis of class-wise performance revealed significant variation in F1-score across defect types (Table 3). Flaking and Spalling, the two most frequent classes in the test set (815 and 616 of 1940 images), achieve the highest F1-scores among the three models that trained successfully: MobileNetV2 attains 0.84 for Flaking and 0.79 for Spalling, DenseNet121 attains 0.82 and 0.79, and VGG16 attains 0.83 and 0.76, respectively. With 1919 training images for Flaking and 1455 for Spalling, these majority classes provide the largest number of training examples, consistent with their comparatively higher and more stable F1-scores across the three successfully trained models.
Burned Rail (225 images total, 66 in the test set used for the confusion matrices) and Joint Issues (166 images total, 52 in the test set) remain the most challenging minority classes for the three models that trained successfully. MobileNetV2 achieves F1-scores of 0.59 (Burned Rail) and 0.87 (Joint Issues); DenseNet121 and VGG16 show a similar pattern (Table 3). ResNet50 and EfficientNetB0 score 0.00 F1 on Burned Rail and near-zero on most other minority classes, which (as discussed in Section 4.2) reflects their collapse to majority-class prediction rather than a graded difficulty effect, and should not be interpreted as evidence about class imbalance difficulty specifically.
4.4. Random Forest with CNN Features
Table 4 presents the performance of a hybrid classification pipeline in which pretrained CNN models are used for feature extraction, and a Random Forest classifier performs the final classification. Among all models, RF + VGG16 achieved the best overall performance, with the highest accuracy (72.16%), precision (76.73%), and F1-score (70.27%), while also maintaining the lowest feature-extraction and training times. This indicates that VGG16 generated more discriminative and stable features for Random Forest classification. DenseNet121 also performed well but required significantly higher extraction time, making it computationally expensive. MobileNetV2 achieved balanced accuracy while remaining lightweight and efficient, making it suitable for resource-constrained environments. In contrast, ResNet50 and EfficientNetB0 produced lower classification performance, suggesting weaker feature separability for the Random Forest classifier in this multiclass defect detection task.
Table 4.
Random Forest + CNN Features.
The Random Forest classifier with VGG16 feature extraction achieved 72.2% accuracy, exceeding the other feature extractors evaluated (MobileNetV2: 67.6%; DenseNet121: 69.9%; ResNet50: 60.6%; EfficientNetB0: 55.8%; Table 4). This indicates that VGG16’s learned representations transfer comparatively well to a traditional classifier, although performance remains substantially below the 80.7% achieved by end-to-end VGG16 fine-tuning. The per-class classification report for the best-performing Random Forest configuration (VGG16 features; Table 5) indicates that this aggregate accuracy conceals a pronounced minority-class weakness: Burned Rail precision is 1.00 but recall is only 0.03 (2 of 75 instances correctly recalled), and Squats recall is 0.43 despite a precision of 0.99. That is, when the classifier does predict these classes, it is almost always correct, but it predicts them for only a small fraction of the images that actually belong to them. This pattern suggests that the Random Forest/CNN-feature hybrid is comparatively conservative in its minority-class predictions relative to the end-to-end fine-tuned CNNs.
Table 5.
Per-class classification report for the best-performing Random Forest configuration (VGG16 features).
5. Discussion and Future Directions
Several deep learning architectures for rail defect classification were benchmarked across eight defect types (rail wear, end batter, hogging, scabbing, wheel burns, shelling, black spots, and corrugation), with a standard CNN achieving 80% accuracy, Xception 89%, and MobileNet 91% [48]. The present study, which addresses a distinct taxonomy of defects (squats, shelling, spalling, flaking, burned rails, and joints), found MobileNetV2 to be the top-performing model among six candidates, achieving 81.24% accuracy. The apparent gap between the two studies is largely attributable to differences in defect categories, dataset size and composition, degree of class imbalance, and overall experimental setup rather than any inherent architectural limitation.
5.1. Practical Implementation Considerations
The deployment of AI-based railway defect detection systems in operational environments requires careful consideration of various practical factors beyond model accuracy. Computational efficiency represents a critical constraint, particularly for real-time applications where inspection results must be available immediately to support operational decision-making. The superior performance of MobileNetV2 in balancing accuracy with computational efficiency makes it particularly suitable for edge deployment scenarios.
Integration with existing railway infrastructure monitoring systems presents both opportunities and challenges. The development of standardized data interfaces and communication protocols is essential for seamless integration with current maintenance management systems. Furthermore, setting appropriate alert thresholds and escalation procedures ensures that detected defects are addressed promptly through appropriate maintenance interventions.
The reliability and interpretability of AI-based inspection systems are crucial factors for acceptance by railway operators and regulatory authorities. The implementation of explainable AI techniques, such as Class Activation Maps (CAM) and gradient-based visualization methods, can provide insights into model decision-making processes and enhance system trustworthiness. These visualization capabilities are particularly valuable for training maintenance personnel and building confidence in automated inspection systems.
Linking these classification outputs to established NDT maintenance workflows is essential for practical adoption. In current practice, visual inspection findings of this kind would typically feed into a defect severity grading scheme (e.g., minor/monitor, moderate/schedule maintenance, severe/immediate action) rather than being used as a standalone pass/fail signal. We envisage the classifier operating as a rapid, camera-based screening pass that flags candidate defect locations and types for follow-up with quantitative NDT methods, such as ultrasonic testing for internal rail flaws or ground-penetrating radar (GPR) for sub-surface and ballast conditions, rather than replacing them. Formalising this handoff (e.g., mapping predicted defect class and confidence to an inspection-standard severity code) is identified as necessary future work before field deployment.
5.2. Computational Efficiency and Deployment Considerations
Beyond classification accuracy, computational efficiency represents a critical factor for practical deployment in railway inspection systems. Table 6 presents comprehensive computational characteristics of all evaluated models, essential for selecting appropriate architectures based on deployment constraints.
Table 6.
Computational Characteristics of Evaluated Models.
Accuracy-Efficiency Trade-off Analysis: MobileNetV2 emerges as the optimal choice for edge deployment, offering the best balance with 81.2% accuracy, 14.2 MB model size, and 96 ms inference time (10.4 fps throughput). Its lightweight architecture (3.5M parameters) enables deployment on resource-constrained mobile inspection platforms or edge devices with limited GPU memory. The 2.1 GB GPU memory footprint allows concurrent execution of multiple processing pipelines or integration with other railway monitoring systems.
DenseNet121, despite achieving superior real-world generalization (80.0%), requires 2.8× longer inference time (266 ms) and 2.3× larger model size (33.1 MB). This makes it more suitable for post-processing analysis or offline inspection, where accuracy is prioritized over real-time performance. The 3.8 fps throughput is acceptable for recorded video analysis but may be insufficient for real-time inspection at operational track speeds.
VGG16 demonstrates surprisingly fast inference (84 ms) despite its massive 138.4M parameters and 528 MB model size, attributed to highly optimized implementations. However, the large model size poses challenges for edge deployment, and the 5.6 GB GPU memory requirement limits deployment flexibility. Random Forest achieves the fastest inference (15 ms, 66.7 fps) with minimal memory footprint (1.2 GB), making it suitable for ultra-low-latency applications, though its 72.2% accuracy may be sufficient for safety-critical railway inspection.
Deployment Recommendations: For mobile inspection vehicles with embedded NVIDIA Jetson or similar edge GPUs, MobileNetV2 is recommended, offering real-time processing (10.4 fps) suitable for inspection speeds of 30–40 km/h at standard camera frame rates. For centralized processing facilities analyzing recorded inspection data, DenseNet121 provides superior accuracy with acceptable throughput. For preliminary screening or redundant validation systems, Random Forest offers ultra-fast processing with moderate accuracy.
5.3. Limitations and Challenges
Methodological verification: the reported results were cross-checked against the underlying training logs, learning curves, and per-model classification reports for all five CNN backbones. This verification confirms that the test-set totals underlying the confusion matrices in Figure 4, Figure 5, Figure 6, Figure 7 and Figure 8 (66/815/52/197/616/194) constitute the evaluation split actually used (training samples: 4525; test samples: 1940, consistent across all five models’ run summaries); Table 1 reports this split. The verification further establishes that the comparatively poor performance of ResNet50 and EfficientNetB0 reflects a genuine training outcome rather than a data-processing or reporting error. EfficientNetB0’s per-class ROC-AUC is exactly 0.500 for all six classes, and its validation–accuracy curve is flat at the majority-class baseline from approximately epoch 5 onward (Figure 3), indicating that its predicted scores carry no discriminative information and that the classification head did not move meaningfully from its initialisation under the training configuration used. ResNet50’s loss curve, by contrast, shows stable, gradual convergence with no train/validation gap, indicating that the model trained successfully but converged to a limited solution that does not learn to predict “Burned Rail” and rarely predicts “Joints.”
The Random Forest/CNN-feature hybrid results (Table 4) were verified against the corresponding feature-extraction and training log: all reported values (accuracy, precision, recall, F1-score, feature-extraction time, and training time for all five backbones) match the source log, and the per-class classification report for the best-performing configuration is reported in Table 5. The per-class test support underlying this report (75/823/50/182/638/172) differs from the evaluation split used for the CNN experiments (66/815/52/197/616/194), confirming that the Random Forest pipeline was evaluated on an independently partitioned test set rather than the identical split used for the CNN backbones. The Random Forest results are therefore not a direct, image-for-image comparison with the CNN results; they are reported and should be read as an aggregate-level comparison only. The Random Forest hyperparameters (number of trees, maximum depth, and related settings) were not recorded in the retained experimental logs and are not reported in Section 3.3; this is stated there as a methodological limitation affecting the reproducibility of the Random Forest results specifically. An independent real-world validation set was not evaluated in this study, as no verifiable source data for such a set was available; deployment recommendations in Section 5.1 are accordingly based on test-set performance and computational-efficiency measurements only.
Several limitations must be addressed for successful AI-based railway inspection deployment. The most critical issue is severe class imbalance (1.00:1 to 15.67:1 in the test set), which directly degrades minority-class performance for the two models that failed to train (Section 4.2); even among the three successfully trained models, Joint Issues (the rarest class, 52 test images) shows more variable F1 than Flaking (815 test images)—e.g., F1 = 0.87 (MobileNetV2), 0.90 (DenseNet121), 0.88 (VGG16) for Joint Issues versus 0.84, 0.82, 0.83 for Flaking (Table 3). Limited test samples for minority classes (52 Joint Issues, 66 Burned Rail) introduce statistical uncertainty in these estimates, and visual similarity between defect pairs creates inherent classification ambiguity.
Furthermore, the limited test sample sizes for minority classes (52 for Joint Issues, 66 for Burned Rail) introduce statistical uncertainty in performance estimates. The 95% confidence intervals for these classes are substantially wider than for the majority classes, making it difficult to reliably assess production readiness. A minimum of 200–300 test samples per class would be required for a statistically robust evaluation.
Environmental variability represents another significant challenge, as real-world railway environments exhibit diverse lighting conditions, weather patterns, and seasonal variations that can impact image quality and model performance. The presence of shadows, reflections, and occlusions from vegetation or ballast material can complicate defect detection and lead to false-positive or false-negative classifications.
The visual similarity among certain defect types, particularly shelling and spalling, creates inherent challenges for accurate classification. The development of more sophisticated feature extraction techniques and the integration of temporal information from video sequences may help address these ambiguities and improve classification accuracy.
5.4. Future Research Directions
Several promising research directions emerge from this study that could significantly enhance the capabilities of AI-based railway defect detection systems. The development of ensemble learning approaches that combine multiple model predictions could improve overall system accuracy and robustness. Ensemble methods have demonstrated success in various computer vision applications and may be particularly effective for addressing the challenges associated with class imbalance and visual ambiguity.
The integration of multi-modal sensing technologies represents another promising avenue for future research. Combining visual inspection with ultrasonic, acoustic, or thermal sensing modalities could enable the detection of both surface and subsurface defects, providing a more comprehensive assessment of track condition. The development of effective data fusion techniques for multi-modal inputs presents both technical challenges and significant opportunities for advancement.
The application of generative adversarial networks (GANs) for synthetic data generation could address the class imbalance issues identified in this study. By generating synthetic examples of rare defect types, GANs could help balance the training dataset and improve model performance for underrepresented defect categories [49]. This approach has shown promise in various computer vision applications and may be particularly valuable for railway defect detection.
Advanced temporal analysis techniques, including recurrent neural networks (RNNs) and transformer architectures, could leverage the sequential nature of railway inspection data to improve defect detection accuracy. By analyzing defect progression over time and incorporating contextual information from adjacent track sections, these approaches could enhance system reliability and enable predictive maintenance strategies.
The development of federated learning approaches could enable collaborative model training across multiple railway operators while preserving data privacy and security. This approach could facilitate the development of more robust and generalizable models by leveraging diverse datasets from different operational environments and track configurations.
6. Conclusions
This study contributes a real-world, operationally collected railway defect dataset from an active Indian Railways division (6465 images across six defect classes captured under in-service conditions) and a direct, identically trained comparison of standard transfer-learning CNNs against a hybrid CNN-feature/Random Forest classifier for this task—framed explicitly around the accuracy/efficiency trade-offs relevant to edge deployment on mobile inspection platforms. This combination of an operational (rather than curated public-benchmark) dataset with a deployment-oriented, multi-model comparison is the study’s primary contribution relative to prior work performed on public or laboratory datasets.
The superior performance of MobileNetV2 and DenseNet121 must be interpreted in the context of the dataset’s severe class imbalance. MobileNetV2 achieves 81.2% overall test accuracy with favourable computational efficiency (96 ms inference time, 14.2 MB model size), making it a strong candidate for real-time edge deployment; however, its overall accuracy conceals a Burned Rail recall of only 45.5% (30 of 66 instances), the lowest recall of any class for this model. Because Burned Rail is a safety-critical defect category, this recall figure, rather than the aggregate accuracy alone, should inform deployment decisions, and is reported in the Abstract and Conclusion accordingly. MobileNetV2’s F1-score is 0.84 for the majority class (Flaking, 42.0% of the test set) and 0.87 for the most underrepresented class (Joint Issues, 2.7% of the test set); Joint Issues is not the weakest class for MobileNetV2 in F1 terms—Burned Rail is (F1 = 0.59). DenseNet121 achieves 80.0% test accuracy with a similar per-class pattern, at the cost of longer inference time (Table 6).
This performance variation across classes highlights that overall accuracy metrics alone are insufficient for safety-critical railway applications. A model achieving 80% overall accuracy may have an unacceptably low recall (76.5%) for rare but potentially dangerous defects such as Burned Rail. Deployment decisions must therefore consider class-specific performance requirements, with potentially different acceptance thresholds based on defect severity and safety implications. For minority classes with poor performance, specialized detection pipelines or hybrid approaches that combine multiple models may be necessary.
The study has identified several key challenges that must be addressed to successfully deploy AI-based railway inspection systems, including class imbalance, environmental variability, and visual similarity among certain defect types. The proposed solutions, including ensemble learning approaches, multi-modal sensing integration, and synthetic data generation, provide a roadmap for future research and development efforts.
The transition from reactive to proactive maintenance strategies enabled by AI-based inspection systems represents a paradigm shift in railway infrastructure management. The continuous monitoring capabilities and objective defect assessment provided by these systems offer significant advantages over traditional manual inspection methods, including improved consistency, reduced costs, and enhanced safety.
The integration of AI-based inspection systems with existing railway infrastructure monitoring frameworks has the potential to revolutionize maintenance practices and support the development of truly intelligent transportation systems. The condition-based maintenance strategies enabled by these technologies can optimize maintenance interventions, reduce operational disruptions, and extend infrastructure lifespan while maintaining the highest safety standards.
Future research efforts should focus on addressing the identified limitations while exploring advanced techniques such as ensemble learning, multi-modal integration, and temporal analysis. The development of standardized evaluation protocols and benchmark datasets will facilitate comparative assessment of different approaches and accelerate progress in this important application domain.
The verification process described in Section 5.3 identified evaluation-pipeline inconsistencies that should be resolved (through a single, documented evaluation run and diagnosis or re-training of the two underperforming models) before the reported performance figures are treated as final. With that verification complete, the practical contribution of this work is a concrete basis for selecting between accuracy-oriented (MobileNetV2, DenseNet121) and efficiency-oriented deployment choices on real operational imagery, together with a framework for connecting vision-based defect classification to existing NDT maintenance workflows.
Author Contributions
R.M.: Conceptualisation, Methodology, Investigation, Formal Analysis, Data Curation, Software, Visualisation, Validation, Writing—Original Draft, Writing—Review & Editing. A.K.V.: Conceptualisation, Methodology, Supervision, Resources, Writing—Review & Editing, Project Administration. All authors have read and agreed to the published version of the manuscript.
Funding
This research received no external funding.
Institutional Review Board Statement
Not applicable.
Informed Consent Statement
Not applicable.
Data Availability Statement
The datasets generated and/or analyzed in the current study are available from the corresponding author upon reasonable request.
Acknowledgments
During the preparation of this manuscript/study, the author(s) used Claude Sonnet 5 (Anthropic) for the purposes of language editing and improving clarity of expression. The authors have reviewed and edited the output and take full responsibility for the content of this publication.
Conflicts of Interest
The authors declare no conflicts of interest.
References
- Ward, C.P.; Weston, P.A.; Stewart, E.J.C.; Li, H.; Goodall, R.M.; Roberts, C.; Mei, T.X.; Charles, G.; Dixon, R. Condition monitoring opportunities using vehicle-based sensors. Proc. Inst. Mech. Eng. Part F J. Rail Rapid Transit 2011, 225, 202–218. [Google Scholar] [CrossRef] [Scilit]
- Indian Railways Statistical Publications. Indian Railways Statistical Year Book 2018-19; Ministry of Railways: New Delhi, India, 2019.
- Li, Z.; Molodova, M.; Núñez, A.; Dollevoet, R. Improvements in axle box acceleration measurements for the detection of light squats in railway infrastructure. IEEE Trans. Ind. Electron. 2015, 62, 4385–4397. [Google Scholar] [CrossRef] [Scilit]
- Hodge, V.J.; O’Keefe, S.; Weeks, M.; Moulds, A. Wireless Sensor Networks for Condition Monitoring in the Railway Industry: A Survey. IEEE Trans. Intell. Transp. Syst. 2015, 16, 1088–1106. [Google Scholar] [CrossRef] [Scilit]
- Zhu, S.; Yu, T.; Xu, T.; Chen, H.; Dustdar, S.; Gigan, S.; Gunduz, D.; Hossain, E.; Jin, Y.; Lin, F.; et al. Intelligent Computing: The Latest Advances, Challenges and Future. Intell. Comput. 2023, 2, 0006. [Google Scholar] [CrossRef] [Scilit]
- LeCun, Y.; Bengio, Y.; Hinton, G. Deep learning. Nature 2015, 521, 436–444. [Google Scholar] [CrossRef] [Scilit] [PubMed]
- Krizhevsky, A.; Sutskever, I.; Hinton, G.E. ImageNet classification with deep convolutional neural networks. Commun. ACM 2017, 60, 84–90. [Google Scholar] [CrossRef] [Scilit]
- Shrivastava, A.; Gupta, A.; Girshick, R. Training region-based object detectors with online hard example mining. In Proceedings of the IEEE Conference Computer Vision and Pattern Recognition, Las Vegas, NV, USA, 27–30 June 2016; pp. 761–769. [Google Scholar]
- Yosinski, J.; Clune, J.; Bengio, Y.; Lipson, H. How transferable are features in deep neural networks? Adv. Neural Inf. Process. Syst. 2014, 27, 3320–3328. [Google Scholar]
- Oquab, M.; Bottou, L.; Laptev, I.; Sivic, J. Learning and transferring mid-level image representations using convolutional neural networks. In Proceedings of the IEEE Conference Computer Vision and Pattern Recognition, Columbus, OH, USA, 23–28 June 2014; pp. 1717–1724. [Google Scholar]
- Chollet, F. Xception: Deep learning with depthwise separable convolutions. In Proceedings of the IEEE Conference Computer Vision and Pattern Recognition, Honolulu, HI, USA, 21–26 July 2017; pp. 1800–1807. [Google Scholar]
- Costa, J.N.; Andrade, J.A.R.; Frey, D. Safety assessment using computer experiments and surrogate modeling: Railway vehicle safety and track quality indices. Reliab. Eng. Syst. Saf. 2023, 229, 108856. [Google Scholar] [CrossRef] [Scilit]
- Sandler, M.; Howard, A.; Zhu, M.; Zhmoginov, A.; Chen, L.C. MobileNetV2: Inverted residuals and linear bottlenecks. In Proceedings of the IEEE Conference Computer Vision and Pattern Recognition, Salt Lake City, UT, USA, 18–23 June 2018; pp. 4510–4520. [Google Scholar]
- Ricci, S. Automation in Railway Operations: Challenges, Perspectives and Experimented Effects on System Performance. Int. J. Railw. Technol. 2014, 3, 105–119. [Google Scholar] [CrossRef] [Scilit]
- Ji, A.; Woo, W.L.; Wong, E.W.L.; Quek, Y.T. Rail track condition monitoring: A review on deep learning approaches. Intell. Robot. 2021, 1, 151–175. [Google Scholar] [CrossRef] [Scilit]
- He, K.; Zhang, X.; Ren, S.; Sun, J. Deep residual learning for image recognition. In Proceedings of the IEEE Conference Computer Vision and Pattern Recognition, Las Vegas, NV, USA, 27–30 June 2016; pp. 770–778. [Google Scholar]
- Ren, S.; He, K.; Girshick, R.; Sun, J. Faster R-CNN: Towards real-time object detection with region proposal networks. IEEE Trans. Pattern Anal. Mach. Intell. 2017, 39, 1137–1149. [Google Scholar] [CrossRef] [Scilit] [PubMed]
- Szegedy, C.; Liu, W.; Jia, Y.; Sermanet, P.; Reed, S.; Anguelov, D.; Erhan, D.; Vanhoucke, V.; Rabinovich, A. Going deeper with convolutions. In Proceedings of the IEEE Conference Computer Vision and Pattern Recognition, Boston, MA, USA, 7–12 June 2015; pp. 1–9. [Google Scholar]
- Redmon, J.; Farhadi, A. YOLO9000: Better, faster, stronger. In Proceedings of the IEEE Conference Computer Vision and Pattern Recognition, Honolulu, HI, USA, 21–26 July 2017; pp. 7263–7271. [Google Scholar]
- Cortes, C.; Vapnik, V. Support-vector networks. Mach. Learn. 1995, 20, 273–297. [Google Scholar] [CrossRef] [Scilit]
- Breiman, L. Random forests. Mach. Learn. 2001, 45, 5–32. [Google Scholar] [CrossRef] [Scilit]
- Huang, G.; Liu, Z.; Van Der Maaten, L.; Weinberger, K.Q. Densely connected convolutional networks. In Proceedings of the IEEE Conference Computer Vision and Pattern Recognition, Honolulu, HI, USA, 21–26 July 2017; pp. 4700–4708. [Google Scholar]
- Gibert, X.; Patel, V.M.; Chellappa, R. Material classification and semantic segmentation of railway track images with deep convolutional neural networks. In Proceedings of the IEEE International Conference on Image Processing, Quebec City, QC, Canada, 27–30 September 2015; pp. 621–625. [Google Scholar]
- Pan, S.J.; Yang, Q. A survey on transfer learning. IEEE Trans. Knowl. Data Eng. 2010, 22, 1345–1359. [Google Scholar] [CrossRef] [Scilit]
- Faghih-Roohi, S.; Hajizadeh, S.; Núñez, A.; Babuska, R.; De Schutter, B. Deep convolutional neural networks for detection of rail surface defects. In Proceedings of the International Joint Conference on Neural Networks, Vancouver, BC, Canada, 24–29 July 2016; pp. 2584–2589. [Google Scholar]
- Tan, M.; Le, Q.V. EfficientNet: Rethinking model scaling for convolutional neural networks. In Proceedings of the International Conference on Machine Learning, Long Beach, CA, USA, 9–15 June 2019; pp. 6105–6114. [Google Scholar]
- Wei, J.; Cui, C.; Ma, B.; Zhou, H.; Fang, J.; Jia, G.; Tang, T. Multi-scale patch-based representation learning for image anomaly detection and segmentation. In Proceedings of the IEEE Winter Conference Applications of Computer Vision, Waikoloa, HI, USA, 3–8 January 2022; pp. 3992–4000. [Google Scholar]
- Falamarzi, L.; Borragán, A.; Rashidi, A.; Ahmadi, F. A review on existing sensors and devices for inspecting railway infrastructure. J. Railw. Eng. Sci. 2019, 27, 311–325. [Google Scholar]
- Zhai, H.; Ma, Z. Detection algorithm of rail surface defects based on multifeature saliency fusion method. Sens. Rev. 2022, 42, 402–411. [Google Scholar] [CrossRef] [Scilit]
- Torres, E.R.; Caballero, A.B.; Alonso, H.R.; Sisamón, C.C. Application of automatic classifiers for condition monitoring of railway rolling stock. Téc. Ind. 2023, 336, 32–42. [Google Scholar]
- Shi, W.; Cao, J.; Zhang, Q.; Li, Y.; Xu, L. Edge computing: Vision and challenges. IEEE Internet Things J. 2016, 3, 637–646. [Google Scholar] [CrossRef] [Scilit]
- Howard, A.G.; Zhu, M.; Chen, B.; Kalenichenko, D.; Wang, W.; Weyand, T.; Andreetto, M.; Adam, H. MobileNets: Efficient convolutional neural networks for mobile vision applications. arXiv 2017, arXiv:1704.04861. [Google Scholar]
- Iandola, F.N.; Han, S.; Moskewicz, M.W.; Ashraf, K.; Dally, W.J.; Keutzer, K. SqueezeNet: AlexNet- level accuracy with 50x fewer parameters and <0.5 MB model size. arXiv 2016, arXiv:1602.07360. [Google Scholar]
- Chen, Z.; You, K.; Yang, J.; Chen, L. A sparse-to-dense guided fusion framework for three-dimensional object detection in railway environments. Eng. Appl. Artif. Intell. 2026, 178, 115095. [Google Scholar] [CrossRef] [Scilit]
- Magel, E.; Roney, J.; Kalousek, J.; Sroba, P. The blending of theory and practice in modern rail grinding. Fatigue Fract. Eng. Mater. Struct. 2003, 26, 921–929. [Google Scholar] [CrossRef] [Scilit]
- Wu, Y.; Xu, T.; Qin, Y.; Guo, F.; Zhao, Z.; Yang, T.; Wang, C. AirboardNet: A UAV onboard girder inspection approach for high-speed railroad bridge using multi-task knowledge distillation. Adv. Eng. Inform. 2025, 67, 103544. [Google Scholar] [CrossRef] [Scilit]
- Shorten, C.; Khoshgoftaar, T.M. A survey on image data augmentation for deep learning. J. Big Data 2019, 6, 60. [Google Scholar] [CrossRef] [Scilit]
- Chopra, S.; Hadsell, R.; LeCun, Y. Learning a similarity metric discriminatively, with application to face verification. In Proceedings of the 2005 IEEE Computer Society Conference on Computer Vision and Pattern Recognition, San Diego, CA, USA, 20–25 June 2005; pp. 539–546. [Google Scholar]
- Fleiss, J.L. Measuring nominal scale agreement among many raters. Psychol. Bull. 1971, 76, 378–382. [Google Scholar] [CrossRef] [Scilit]
- Ekberg, A.; Kabo, B.L. Fatigue of railway wheels and rails under rolling contact and thermal loading—An overview. Wear 2005, 258, 1288–1300. [Google Scholar] [CrossRef] [Scilit]
- Kalousek, J.; Johnson, K.L.; Beynon, A. An investigation of short pitch wheel and rail corrugation on the Vancouver mass transit system. Proc. Inst. Mech. Eng. Part F J. Rail Rapid Transit 1996, 210, 127–135. [Google Scholar]
- Lewis, R.; Olofsson, U. Mapping rail wear regimes and transitions. Wear 2004, 257, 721–729. [Google Scholar] [CrossRef] [Scilit]
- Bower, A.F. The influence of crack face friction and trapped fluid on surface initiated rolling contact fatigue cracks. J. Tribol. 1988, 110, 704–711. [Google Scholar] [CrossRef] [Scilit]
- Kalker, J.J. A fast algorithm for the simplified theory of rolling contact. Veh. Syst. Dyn. 1982, 11, 1–13. [Google Scholar] [CrossRef] [Scilit]
- Pham, D.; Ha, M.; Xiao, C. A novel visual inspection system for rail surface spalling detection. IOP Conf. Ser. Mater. Sci. Eng. 2021, 1048, 012015. [Google Scholar] [CrossRef] [Scilit]
- Simonyan, K.; Zisserman, A. Very deep convolutional networks for large-scale image recognition. arXiv 2014, arXiv:1409.1556. [Google Scholar] [CrossRef] [Scilit]
- Deng, J.; Dong, W.; Socher, R.; Li, L.J.; Li, K.; Li, F.F. ImageNet: A large-scale hierarchical image database. In Proceedings of the IEEE Conference Computer Vision and Pattern Recognition, Miami, FL, USA, 20–25 June 2009; pp. 248–255. [Google Scholar]
- Bhat, S.; Karegowda, A.G.; Rani, A.L. Multiclass Classification of Rail Track Defects Using Deep Learning Techniques. In Proceedings of the 2023 International Conference on Smart Systems for Applications in Electrical Sciences (ICSSES), Tumakuru, India, 7–8 July 2023; pp. 1–6. [Google Scholar]
- Goodfellow, I.; Pouget-Abadie, J.; Mirza, M.; Xu, B.; Warde-Farley, D.; Ozair, S.; Courville, A.; Bengio, Y. Generative adversarial nets. Adv. Neural Inf. Process. Syst. 2014, 27. [Google Scholar]

Disclaimer/Publisher’s Note: The statements, opinions and data contained in all publications are solely those of the individual author(s) and contributor(s) and not of MDPI and/or the editor(s). MDPI and/or the editor(s) disclaim responsibility for any injury to people or property resulting from any ideas, methods, instructions or products referred to in the content. |
© 2026 by the authors. Licensee MDPI, Basel, Switzerland. This article is an open access article distributed under the terms and conditions of the Creative Commons Attribution (CC BY) license.