


Abstract
To address the need for rapid evaluation of large batches of Mee rough tea during the acceptance stage, this study aims to explore the feasibility of using portable Fourier transform near-infrared (FT-NIR) spectroscopy for preliminary quality screening. The goal is to develop a rapid, non-destructive, and relatively objective assessment method that is applicable to practical acceptance scenarios. This work represents an exploratory proof-of-concept study rather than a finalized industrial grading solution. Spectral data of three reference categories and thirty-six test samples were collected in the wavelength range of 1350– using a portable FT-NIR spectrometer. The sample configuration was designed to simulate practical acceptance sampling conditions. The spectra were preprocessed using multiplicative scatter correction, first-order derivative transformation, and mean-centering. Independent principal component analysis (PCA) models were constructed for each reference category to achieve class-wise feature dimensionality reduction, with cumulative explained variance exceeding . Distance thresholds were determined using the principle based on Euclidean distance and Mahalanobis distance. Classification was performed by distance-based matching between test samples and reference categories. Under optimized matching degree threshold settings of and , the two distance models achieved classification accuracies of and , respectively, demonstrating the feasibility of the proposed approach. The main contribution of this study is the application of class-wise PCA combined with distance-based discrimination to the acceptance stage of Mee rough tea. The proposed framework provides a practical exploratory approach for rapid screening and offers a preliminary digital tool to support acceptance decisions. Further validation using larger and more diverse datasets will be necessary prior to large-scale industrial implementation.
1. Introduction
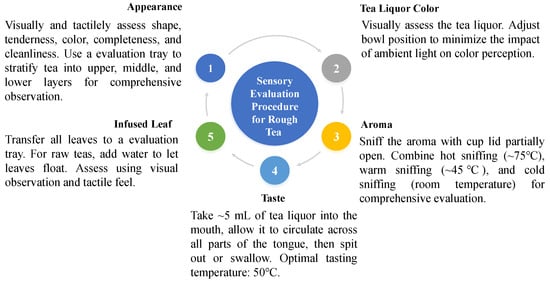
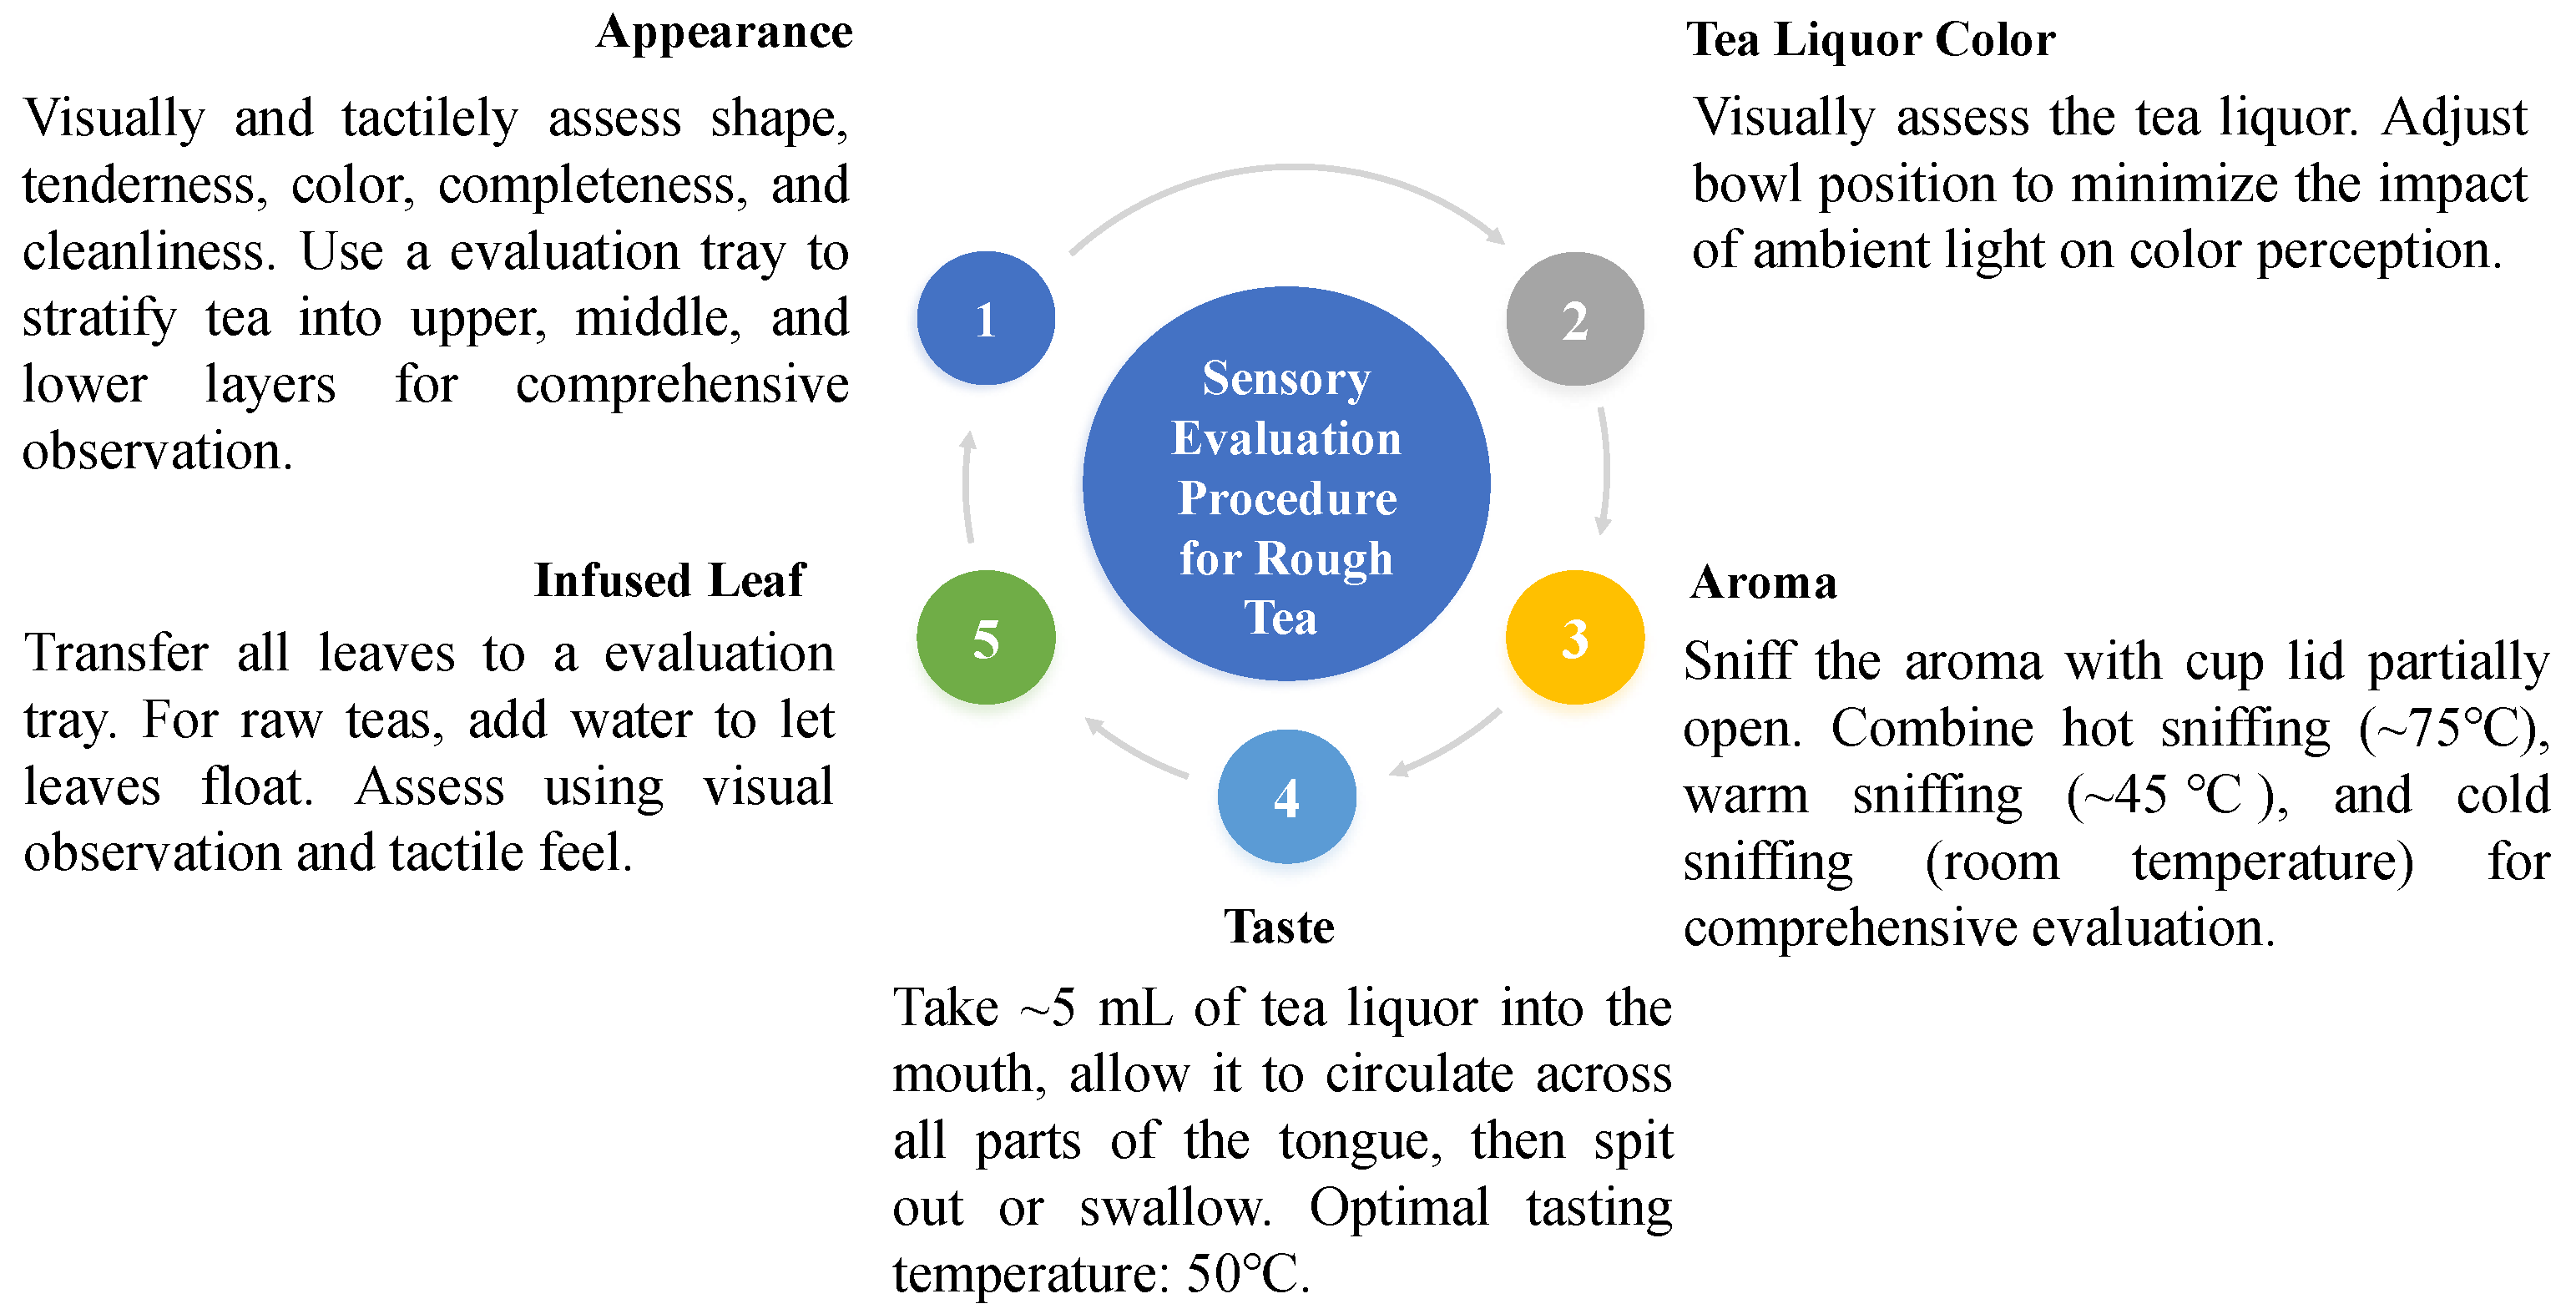
Tea is one of the world’s most popular drinks, and its medicinal value and health benefits have gained widespread recognition. Within China’s tea industry chain, tea processing is divided into primary processing and refined processing. Primary processing involves transforming fresh leaves into rough tea through techniques such as fixation, rolling, and drying. Refined processing entails further processing of rough tea into finished tea products. All refined tea factories implement sample-based processing, where standard samples serve as the physical basis for evaluating product quality [1,2]. Therefore, the quality specifications for all types of refined tea must adhere to the rough tea standard samples. Randomly sampled tea is assessed according to evaluation criteria, with the sensory evaluation of Mee tea rough tea following the standardized five-factor procedure shown in Figure 1 (appearance, tea liquor color, aroma, taste, and infused leaf), as specified in GB/T 23776-2018 [2].
Figure 1.
The five-factor sensory evaluation procedure for rough tea according to GB/T 23776-2018.
If chemical analysis methods are used during the rough tea inspection phase, techniques such as high-performance liquid chromatography (HPLC) and gas chromatography (GC) must be utilized for component detection. While these methods are very precise, they require complex sample preparation and often necessitate the use of organic solvents [3,4]. In the modern tea beverage industry, lengthy analytical procedures can no longer meet the needs of rapid raw material sampling and inspection.
Currently, refined tea factories still mainly rely on manual sensory evaluation for tea acceptance [2,5], as illustrated in Figure 1. This method is inefficient during internal quality assessment: brewing alone takes 4 min, while aroma evaluation may take up to 30 min [6], resulting in low throughput and high susceptibility to subjective factors.
Near-infrared spectroscopy provides a potential approach to address the inefficiency and high cost of rough tea acceptance. This non-destructive technique is efficient, stable, and does not damage samples, making it easier to implement standardized tea collection. These characteristics could enable it to meet the demands for rapid, objective, and comprehensive evaluation in rough tea purchasing, potentially overcoming some of the limitations of traditional methods.
Previous research has applied near-infrared (NIR) spectroscopy to tea similarity analysis through various methods. For example, some studies have focused on classifying different tea varieties [7] or analyzing different physical forms of tea [8]. Others have achieved high accuracy in grading crushed tea samples using specific algorithms [9]. However, these methods either target distinct tea types or require destructive sample preparation.
In contrast, this exploratory study aims to investigate a non-destructive screening method for rough tea. Thus far, few studies have reported on NIR-based grade classification for whole tea leaves. While related work exists, such as works using hyperspectral imaging for similarity prediction [10] or data fusion models for grading bagged tea [11], a direct and non-destructive method for rapid screening of rough tea has yet to be developed.
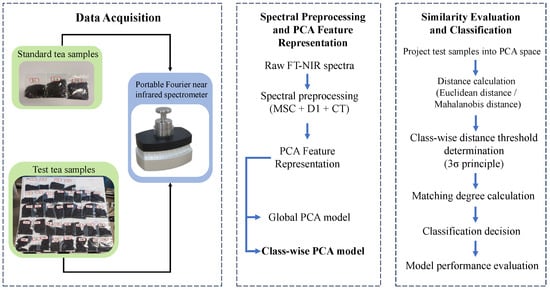
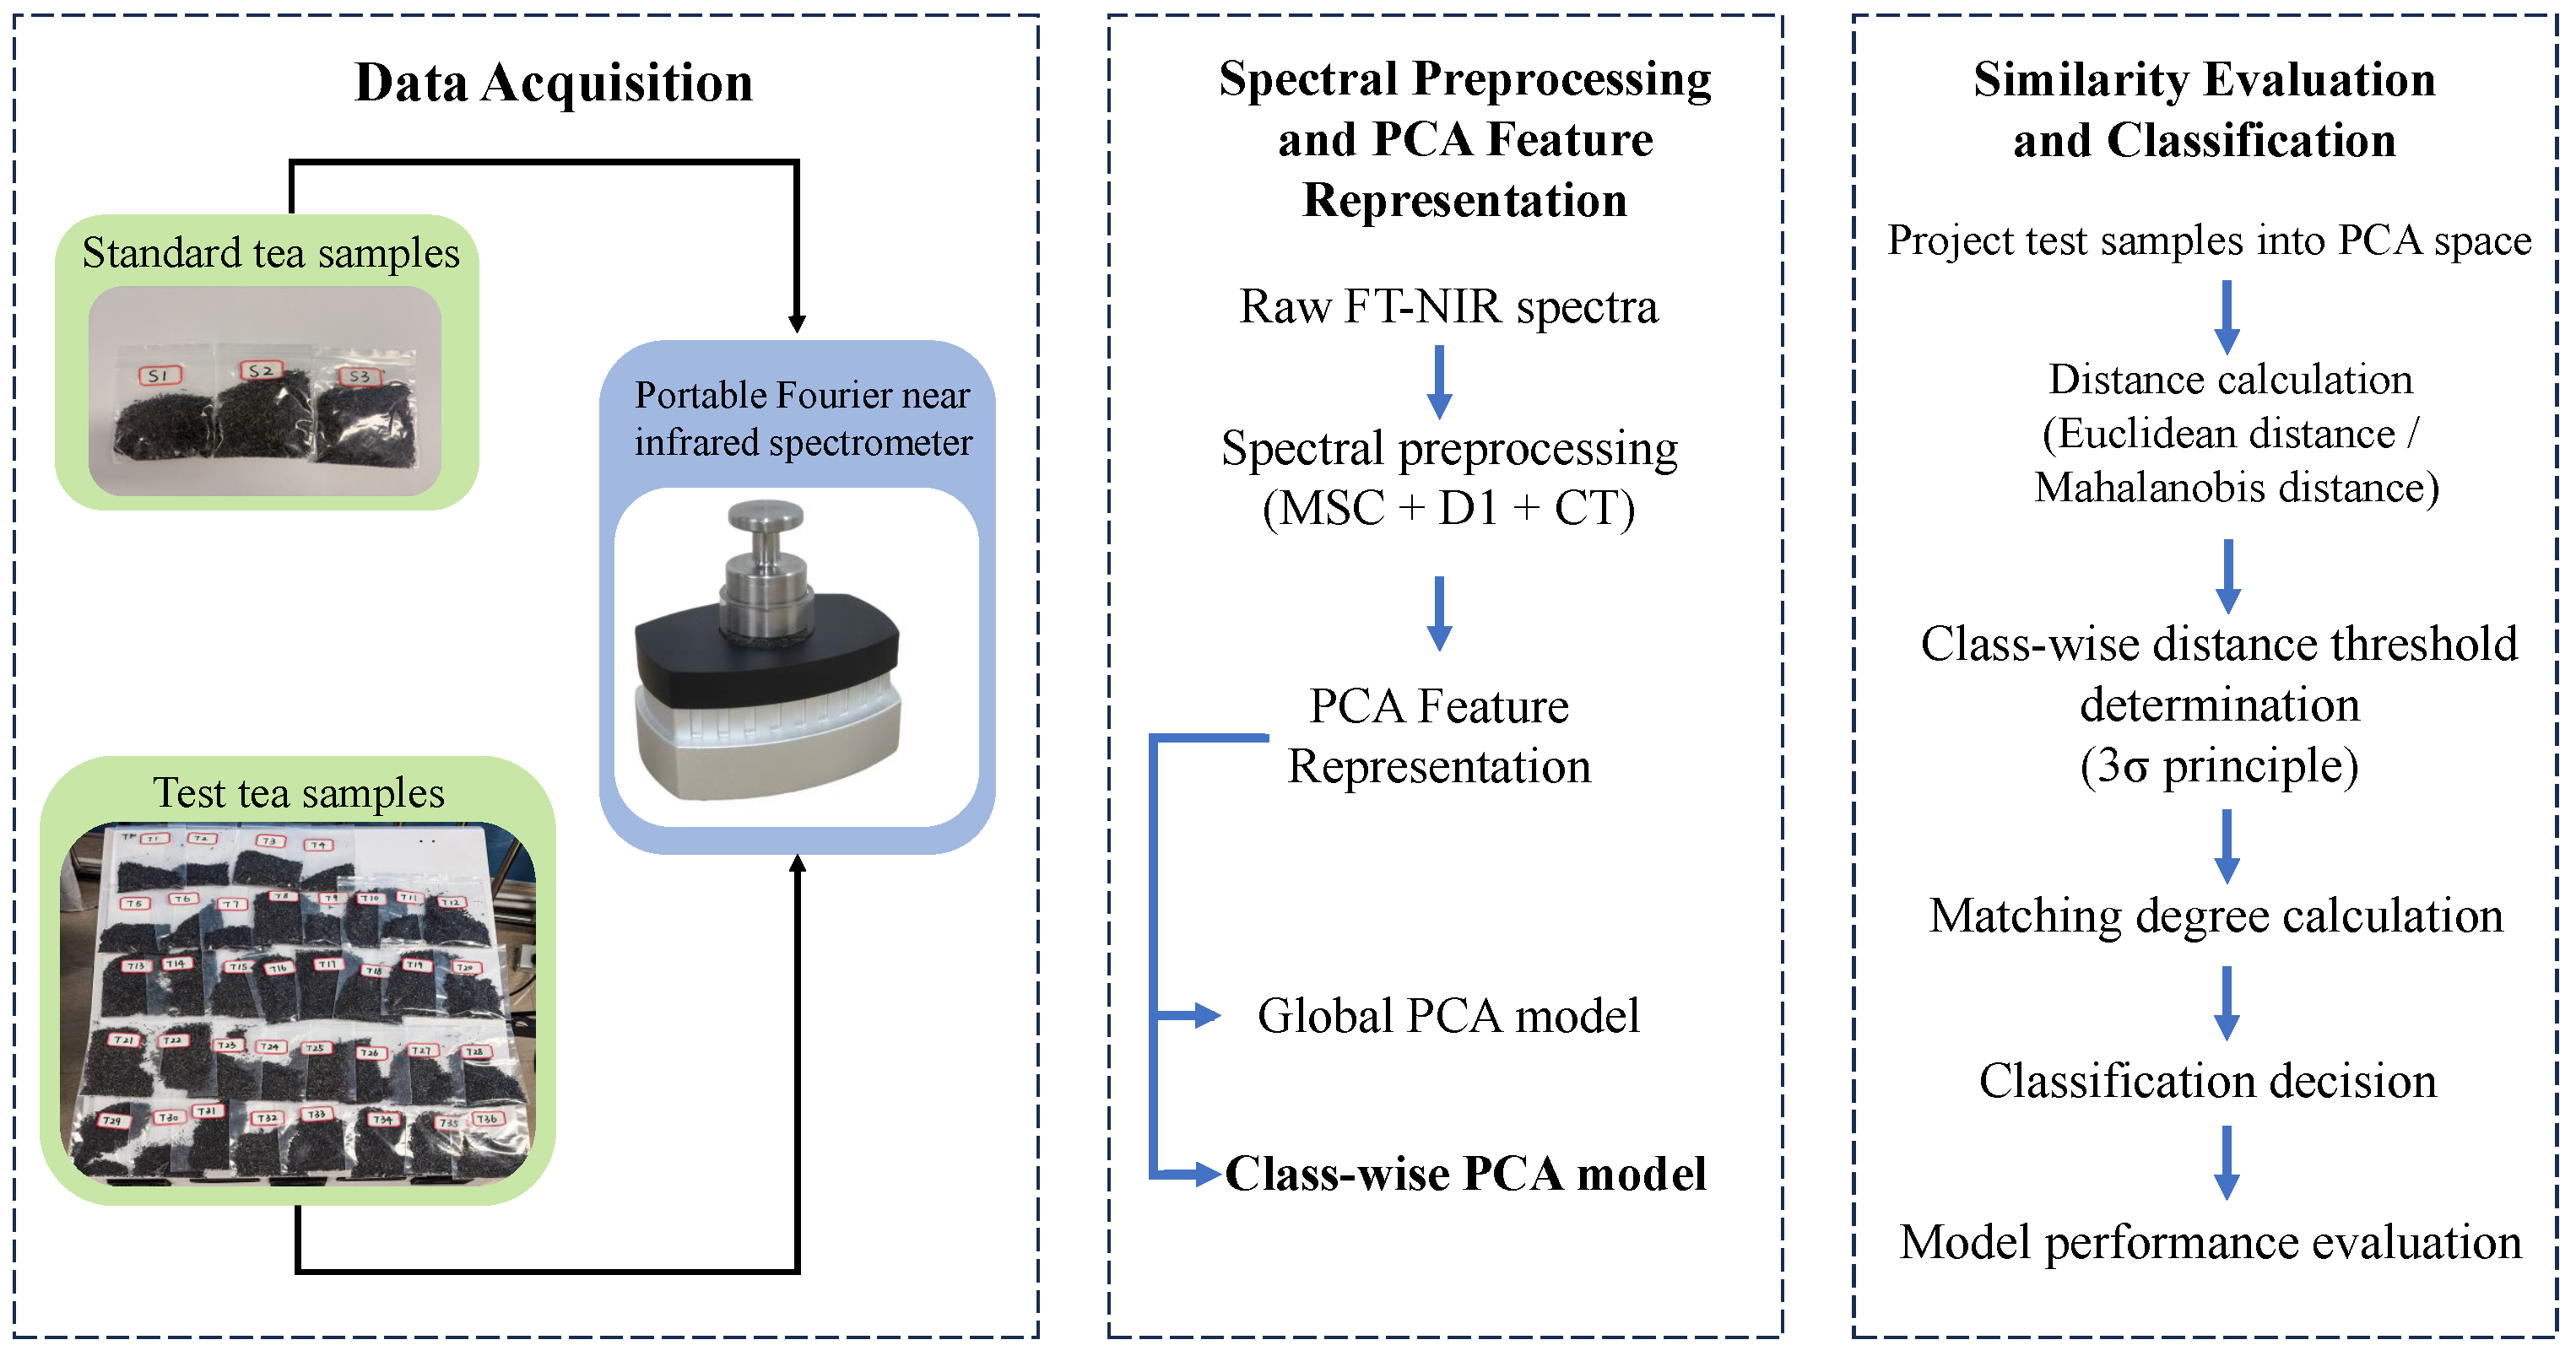
Based on the practical requirements of the rough tea collection stage in the Mee tea industry, this study explores the use of a portable FT-NIR spectrometer independently developed by Guangzhou Guangxin Technology Co., Ltd. to establish a preliminary rapid and non-destructive method for assessing the quality similarity of Mee rough tea [12,13], as illustrated in Figure 2. The proposed framework integrates spectral acquisition, preprocessing, PCA-based feature representation, and distance-based similarity evaluation to enable efficient screening during raw tea purchasing. As an exploratory proof-of-concept study, this work aims to evaluate the feasibility of improving the efficiency and objectivity of rough tea acceptance while maintaining manageable operational costs. The proposed approach is expected to provide rapid screening data to support subsequent blending [14,15] and refining processes, thereby contributing to the development of more standardized and intelligent approaches to tea raw material acceptance and quality management.
Figure 2.
The workflow of the proposed FT-NIR-based screening framework for Mee rough tea. The framework includes spectral acquisition, spectral preprocessing, PCA-based feature representation (global and class-wise PCA), distance-based similarity evaluation using Euclidean and Mahalanobis distances, class-wise distance threshold determination based on the principle, and final classification decision with performance evaluation.
2. Materials and Methods
2.1. Research Sample
The experimental samples were provided by Yichang Tea Industry Group Co., Ltd. (Yichang, China) A total of 39 tea samples were used to simulate the rough tea acceptance scenario. In such a scenario, only a small number of samples are required for testing, and the acceptance decision for the entire batch is based on the evaluation results of these tested samples. The samples included three standard Mee tea samples (No. S1–S3, all export-grade eyebrow tea 41022 Special Grade) and 36 test samples of unknown grade (No. T1–T36). Each standard sample represents a reference category used in the Mee tea purchasing process. To capture the intrinsic spectral variability within each category, approximately 200 independent tea samples were collected for each reference category, and one spectrum was measured from each sample, resulting in approximately 200 spectra per category. According to the manual sensory evaluation results shown in Figure 1, 17 of the test samples matched one specific reference category, while the remaining 19 test samples did not match any reference category. Detailed correspondence between the three reference categories and their corresponding test samples is provided in Table 1.
Table 1.
Assignment of test samples to reference standards.
2.2. Instrumentation and Equipment
A portable FT-NIR spectrometer (Model GX-1-S1325-S200, Guangzhou Guangxin Technology Co., Ltd., China) was used to acquire spectra in diffuse reflection mode over the 1350–2500 nm range. As shown in Figure 2, the setup included a quartz sample cup, cup holder, and sample press. The instrument collects 256 data points per spectrum with a resolution of 16 nm and a signal-to-noise ratio of 2000:1, ensuring stable and discriminative spectral data.
2.2.1. Equipment Collection Procedure
During sampling, the laboratory temperature was kept at about 25 °C with stable humidity. The instrument was preheated for 30 min before use to ensure a stable performance. For preparation, an appropriate amount of tea leaves was poured directly into a quartz cup and spread as evenly as possible. A sample press was then placed in the cup to minimize the gaps between the sample and the measurement port, reducing the impact of particle variations on the diffuse reflectance spectrum [16]. During collection, the cup was rotated approximately 60° each time. Five spectra were collected at different angles per sample and averaged to form one data point for modeling. Each tea grade was sampled 20 times without replacement, resulting in a total of 100 data points.
2.2.2. The Chemical Basis of Spectral Analysis
This study focuses on the spectral range of 1400–2550 nm, which includes key overtone and combination vibrations of C–H, O–H, and N–H bonds in tea leaves. The 1400–1500 nm range corresponds to the first overtone of C–H stretching vibrations, providing crucial information on carbohydrates such as monosaccharides, oligosaccharides, and cellulose. The 1650–1850 nm range relates to the first overtone of O–H bond vibrations, which is important for analyzing phenolic compounds, including polyphenols and flavonoids.
The 1900–2050 nm and 2100–2300 nm regions correspond to combination bands of C–H, O–H, and N–H bonds, associated with nitrogen-containing compounds such as proteins and amino acids. These regions contribute to the biochemical profile of tea [8,17]. The FT-NIR instrument used in this study operates in diffuse reflection mode across this range, allowing for a detailed analysis of the main chemical constituents in tea.
Tea polyphenols, particularly catechins, exhibit complex NIR spectra influenced by O-H, C-H, and C-C vibrations. The free O-H groups in phenolic compounds are critical, with absorption peaks in the 1400–1500 nm range. Additionally, C-H overtone vibrations are observed between 1690 and 1755 nm, and C-C bond vibrations generate bands around 2145–2395 nm. While water absorption does occur within the 1400–2550 nm range, these wavelengths still provide valuable spectral information for analyzing the polyphenol content, as they capture the key absorbance features of polyphenols, catechins, and other relevant components.
In conclusion, the complexity of the NIR spectra of tea polyphenols makes it challenging to assign every absorption peak to a specific molecular vibration. However, by focusing on the key overtone and combination bands within the 1400–2550 nm range, the study effectively captures the characteristic absorbance of polyphenols, catechins, and other important components, while accounting for water interference in certain regions.
2.3. Analysis Environment and Software
Data analysis was conducted using the Windows 10 platform, supported by Visual Studio Code and Python 3.10.
2.4. Data Preprocessing
In NIR spectroscopy data acquisition, factors like spectral baseline drift, light scattering, and random noise arise from sample temperature, detection location, and sample preparation conditions. To improve data quality [18,19], we used preprocessing. First, smoothing (like Moving Average or Savitzky–Golay) removed random noise. Then, Multiplicative Scatter Correction (MSC) reduced scattering effects from uneven particles [20]. Derivative methods (First and Second Derivative) helped to remove the baseline and separate overlapping peaks. Finally, methods like Mean Centering (MC) were applied to highlight differences between samples. For this study, the chosen preprocessing steps were MSC, First Derivative, and MC [11].
2.5. Data Feature Dimension Reduction
Feature extraction plays a crucial role in improving similarity-based analysis. In this study, principal component analysis (PCA) [21,22,23,24,25] was applied to the preprocessed and standardized near-infrared spectral data to reduce dimensionality. The primary objective is to preserve the most informative spectral features while improving computational efficiency. PCA transforms the original high-dimensional spectral variables into a new set of orthogonal variables, referred to as principal components, which are ranked according to their variance contributions (eigenvalues ). The cumulative variance contribution criterion [26] was adopted to select the minimum number of principal components that together explain at least 95% of the total variance.
To investigate the influence of different feature reduction strategies, two PCA-based dimensionality reduction approaches were considered in this study. In the first approach, a global PCA model was constructed using all standard samples jointly, and test samples were subsequently projected into this unified PCA space for feature representation and similarity analysis. In the second approach, PCA was performed separately for each reference category, resulting in class-specific PCA models. Test samples were independently projected into the PCA space of each reference category.
The class-wise PCA strategy is inspired by the modeling philosophy of SIMCA (Soft Independent Modeling of Class Analogy), which employs independent PCA models for each class to better characterize intra-class structure and reduce the influence of inter-class variability [27]. However, in this study, SIMCA is not used as a classification benchmark. Instead, the class-specific PCA models are employed as a feature extraction mechanism, and their performance is directly compared with that of the global PCA-based feature representation under identical distance-based similarity evaluation criteria.
2.6. Distance Threshold Setting and Matching Degree Calculation
2.6.1. Class-Wise Distance Threshold Determination
In this study, the distance threshold was established by measuring the similarity between test samples and reference categories using two distinct distance metrics: Euclidean distance and Mahalanobis distance. The intra-class distances for each reference category were calculated, followed by the definition of the distance threshold using the principle.
After establishing the class-wise distance thresholds, distance-based discrimination was performed at the individual spectrum level.
For each reference category, the set of intra-class distances , the mean , and the standard deviation are used to define a classification threshold. The distance from a new sample to the category is calculated as follows:
According to the principle [28,29], the probability that intra-class sample distances fall within the interval exceeds 99.7%. This establishes T as the “normal variation range” for the category, where samples with distances below the threshold are considered to belong to the respective category.
2.6.2. Spectrum-Level Distance-Based Decision
After establishing the class-wise distance thresholds, distance-based discrimination was performed at the individual spectrum level. For each test spectrum k belonging to test category i, the spectrum was projected onto the PCA space of reference category j, and the corresponding distance was calculated using the selected distance metric.
A binary decision rule was then applied:
- (1)
- Decision Rule 1: , the test spectrum is accepted by reference category j.
- (2)
- Decision Rule 2: , the test spectrum is rejected by reference category j.
This step ensures that spectral similarity assessment is conducted on a per-spectrum basis, allowing for the retention of intra-category variability within the test samples.
2.6.3. Category-Level Matching Degree and Derived Metrics
Based on the spectrum-level acceptance results, the degree of matching between the test category i and the reference category j was defined as:
Here, denotes the total number of spectra in test category i and is an indicator function that equals 1 when the condition is satisfied and 0 otherwise.The matching degree thus quantifies the proportion of spectra in test category i that fall within the normal variation range of reference category j.
A higher value indicates stronger overall spectral similarity between the two categories, consistent with recent reports on distance-based spectral similarity assessment [30,31].
Based on the matching degree, additional category-level metrics were defined:
- (1)
- Matching Degree: reflects the overall similarity between a test category and a reference category. It is calculated as the ratio of the number of test samples in category i that are accepted by reference category j to the total number of test samples in category i, and is denoted as .
- (2)
- Reject Ratio: defined as , represents the proportion of spectra in test category i that are not accepted by reference category j, thereby characterizing inter-category dissimilarity.
- (3)
- False Positive Rate: describes the proportion of test spectra that are accepted by an incorrect reference category and subsequently misclassified during the decision stage. It is calculated as the ratio of misclassified spectra to the total number of test spectra and serves as an indicator of classification reliability.
2.7. Classification Decision Rules
After constructing the similarity matrix composed of values between each test category and all reference categories, classification decision rules were applied using a predefined matching degree threshold (e.g., 0.5):
Single Match: If the test category’s similarity score exceeds for only one reference category, it is assigned to that category. Multiple Matches: If the similarity score exceeds for more than one reference category, the test category is assigned to the reference category with the highest score. No Match: If all similarity scores are below , the test category is labeled as “unknown”, indicating that it is not similar to any reference category.
2.8. Performance Evaluation Metrics
To objectively evaluate the performance of the proposed similarity-based classification framework, global accuracy was adopted as the primary evaluation metric. Accuracy reflects the overall correctness of classification results and is defined as:
where (True Positive) represents the number of samples correctly identified as belonging to the target category, (True Negative) represents the number of samples correctly identified as not belonging to the target category, (False Positive) represents the number of samples incorrectly identified as belonging to the target category, and (False Negative) represents the number of samples incorrectly identified as non-target categories. For multi-class classification problems, these quantities are aggregated across all categories to obtain the overall performance evaluation.
In the proposed framework, distance-based discrimination is performed at the individual spectrum level, whereas matching degree, reject ratio, and false positive rate are category-level statistical indicators derived from aggregating spectrum-level decisions. The overall classification performance is summarized using global accuracy, which reflects the model’s ability to correctly classify test samples across all reference categories.
The classification accuracy was calculated as the ratio between the number of correctly classified test samples and the total number of evaluated test samples. A test sample was considered correctly classified when it was assigned to the corresponding reference category according to the distance-based matching criterion.
Because the proposed framework does not involve supervised model training but instead relies on distance-based similarity evaluation between reference and test spectra, no cross-validation or resampling procedures were applied. The evaluation was therefore performed directly on the set of test samples to assess the feasibility of the proposed screening strategy under the simulated acceptance scenario.
3. Results and Discussion
3.1. Spectral Data Acquisition and Preprocessing
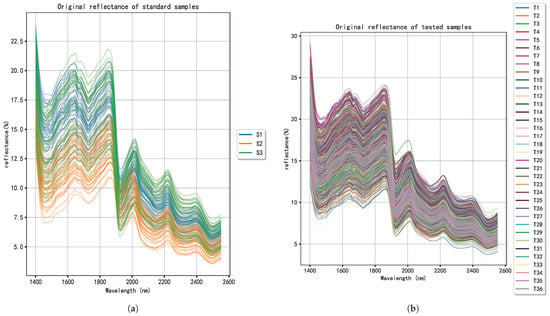
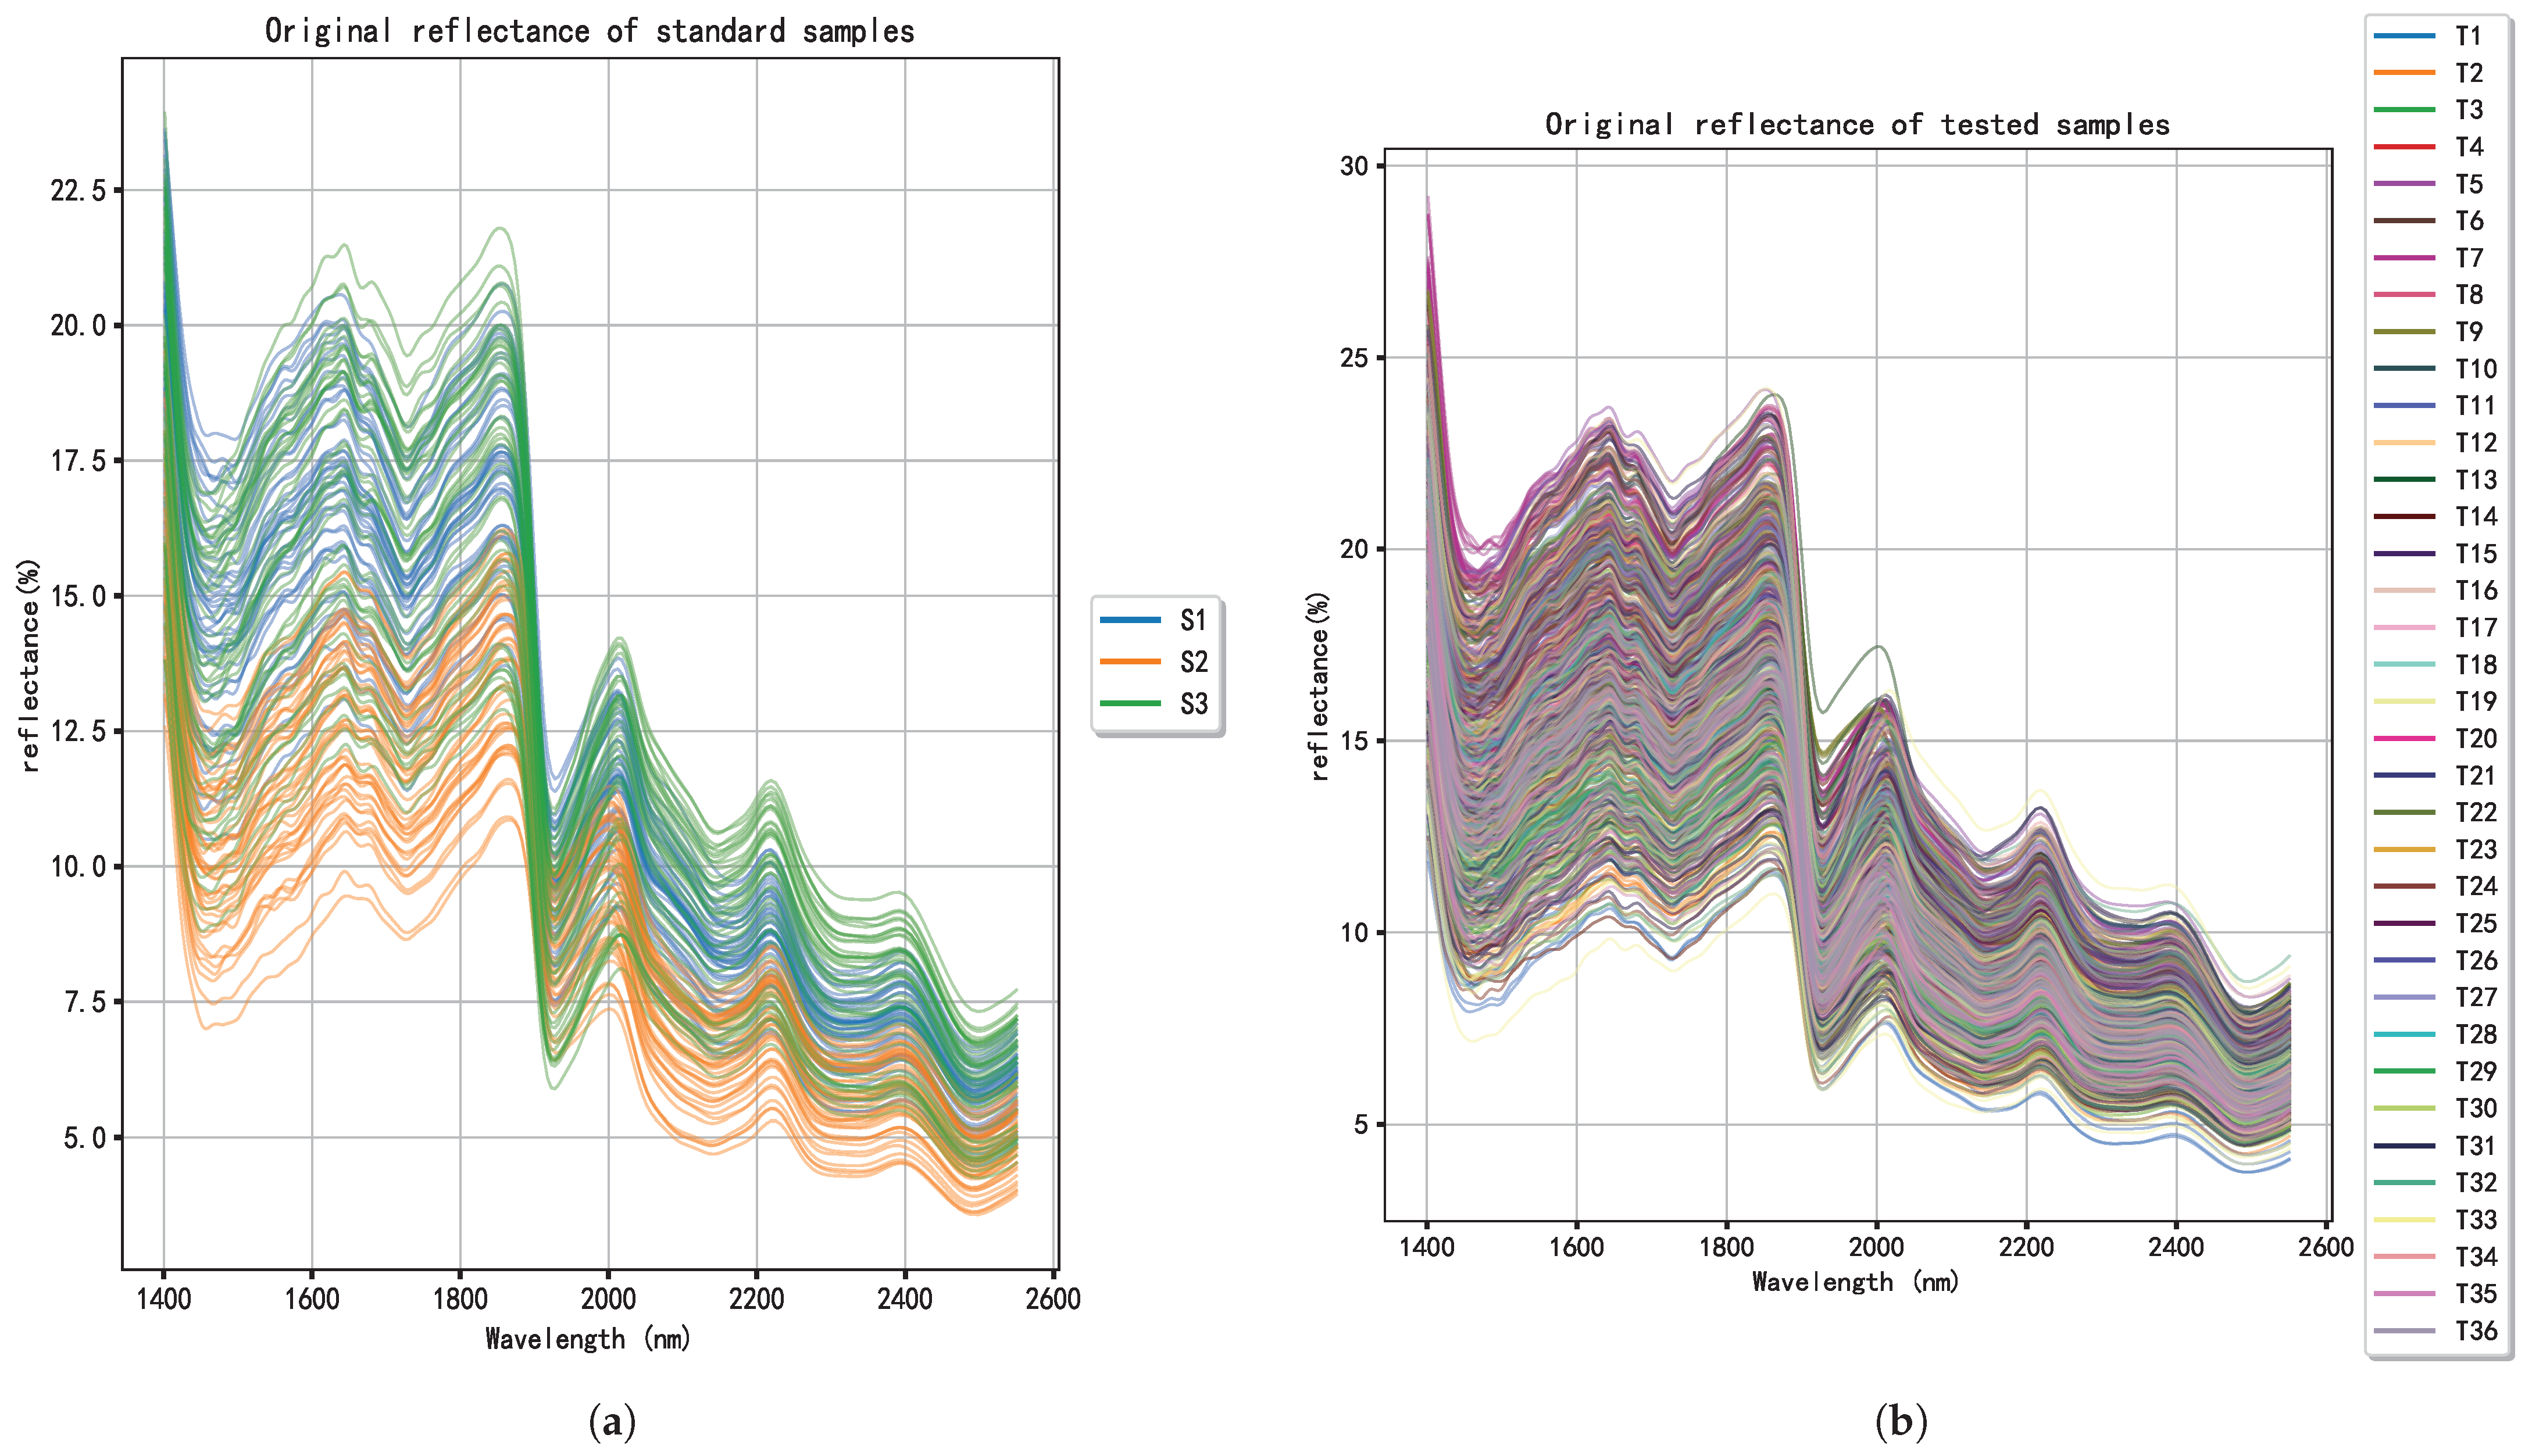
Near-infrared spectra of three standard samples and 36 test samples were collected using a portable FT-NIR spectrometer (GX-1-S1325-S200, Guangzhou Guangxin Technology Co., Ltd., China), following the method in Section 2.2. To reduce noise and improve model stability, data from the 1350–1400 nm range were removed, retaining the 1400–2550 nm range for analysis. The reflectance spectra are shown in Figure 3a,b. Following standard normalization procedures, the spectra were preprocessed in the following order: Multiple Scattering Correction (MSC), First-Derivative (D1), and Mean-Centering (CT).
Figure 3.
Raw reflectance spectra of standard and test samples (a,b).
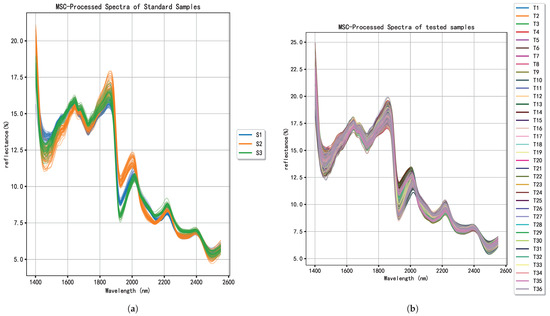
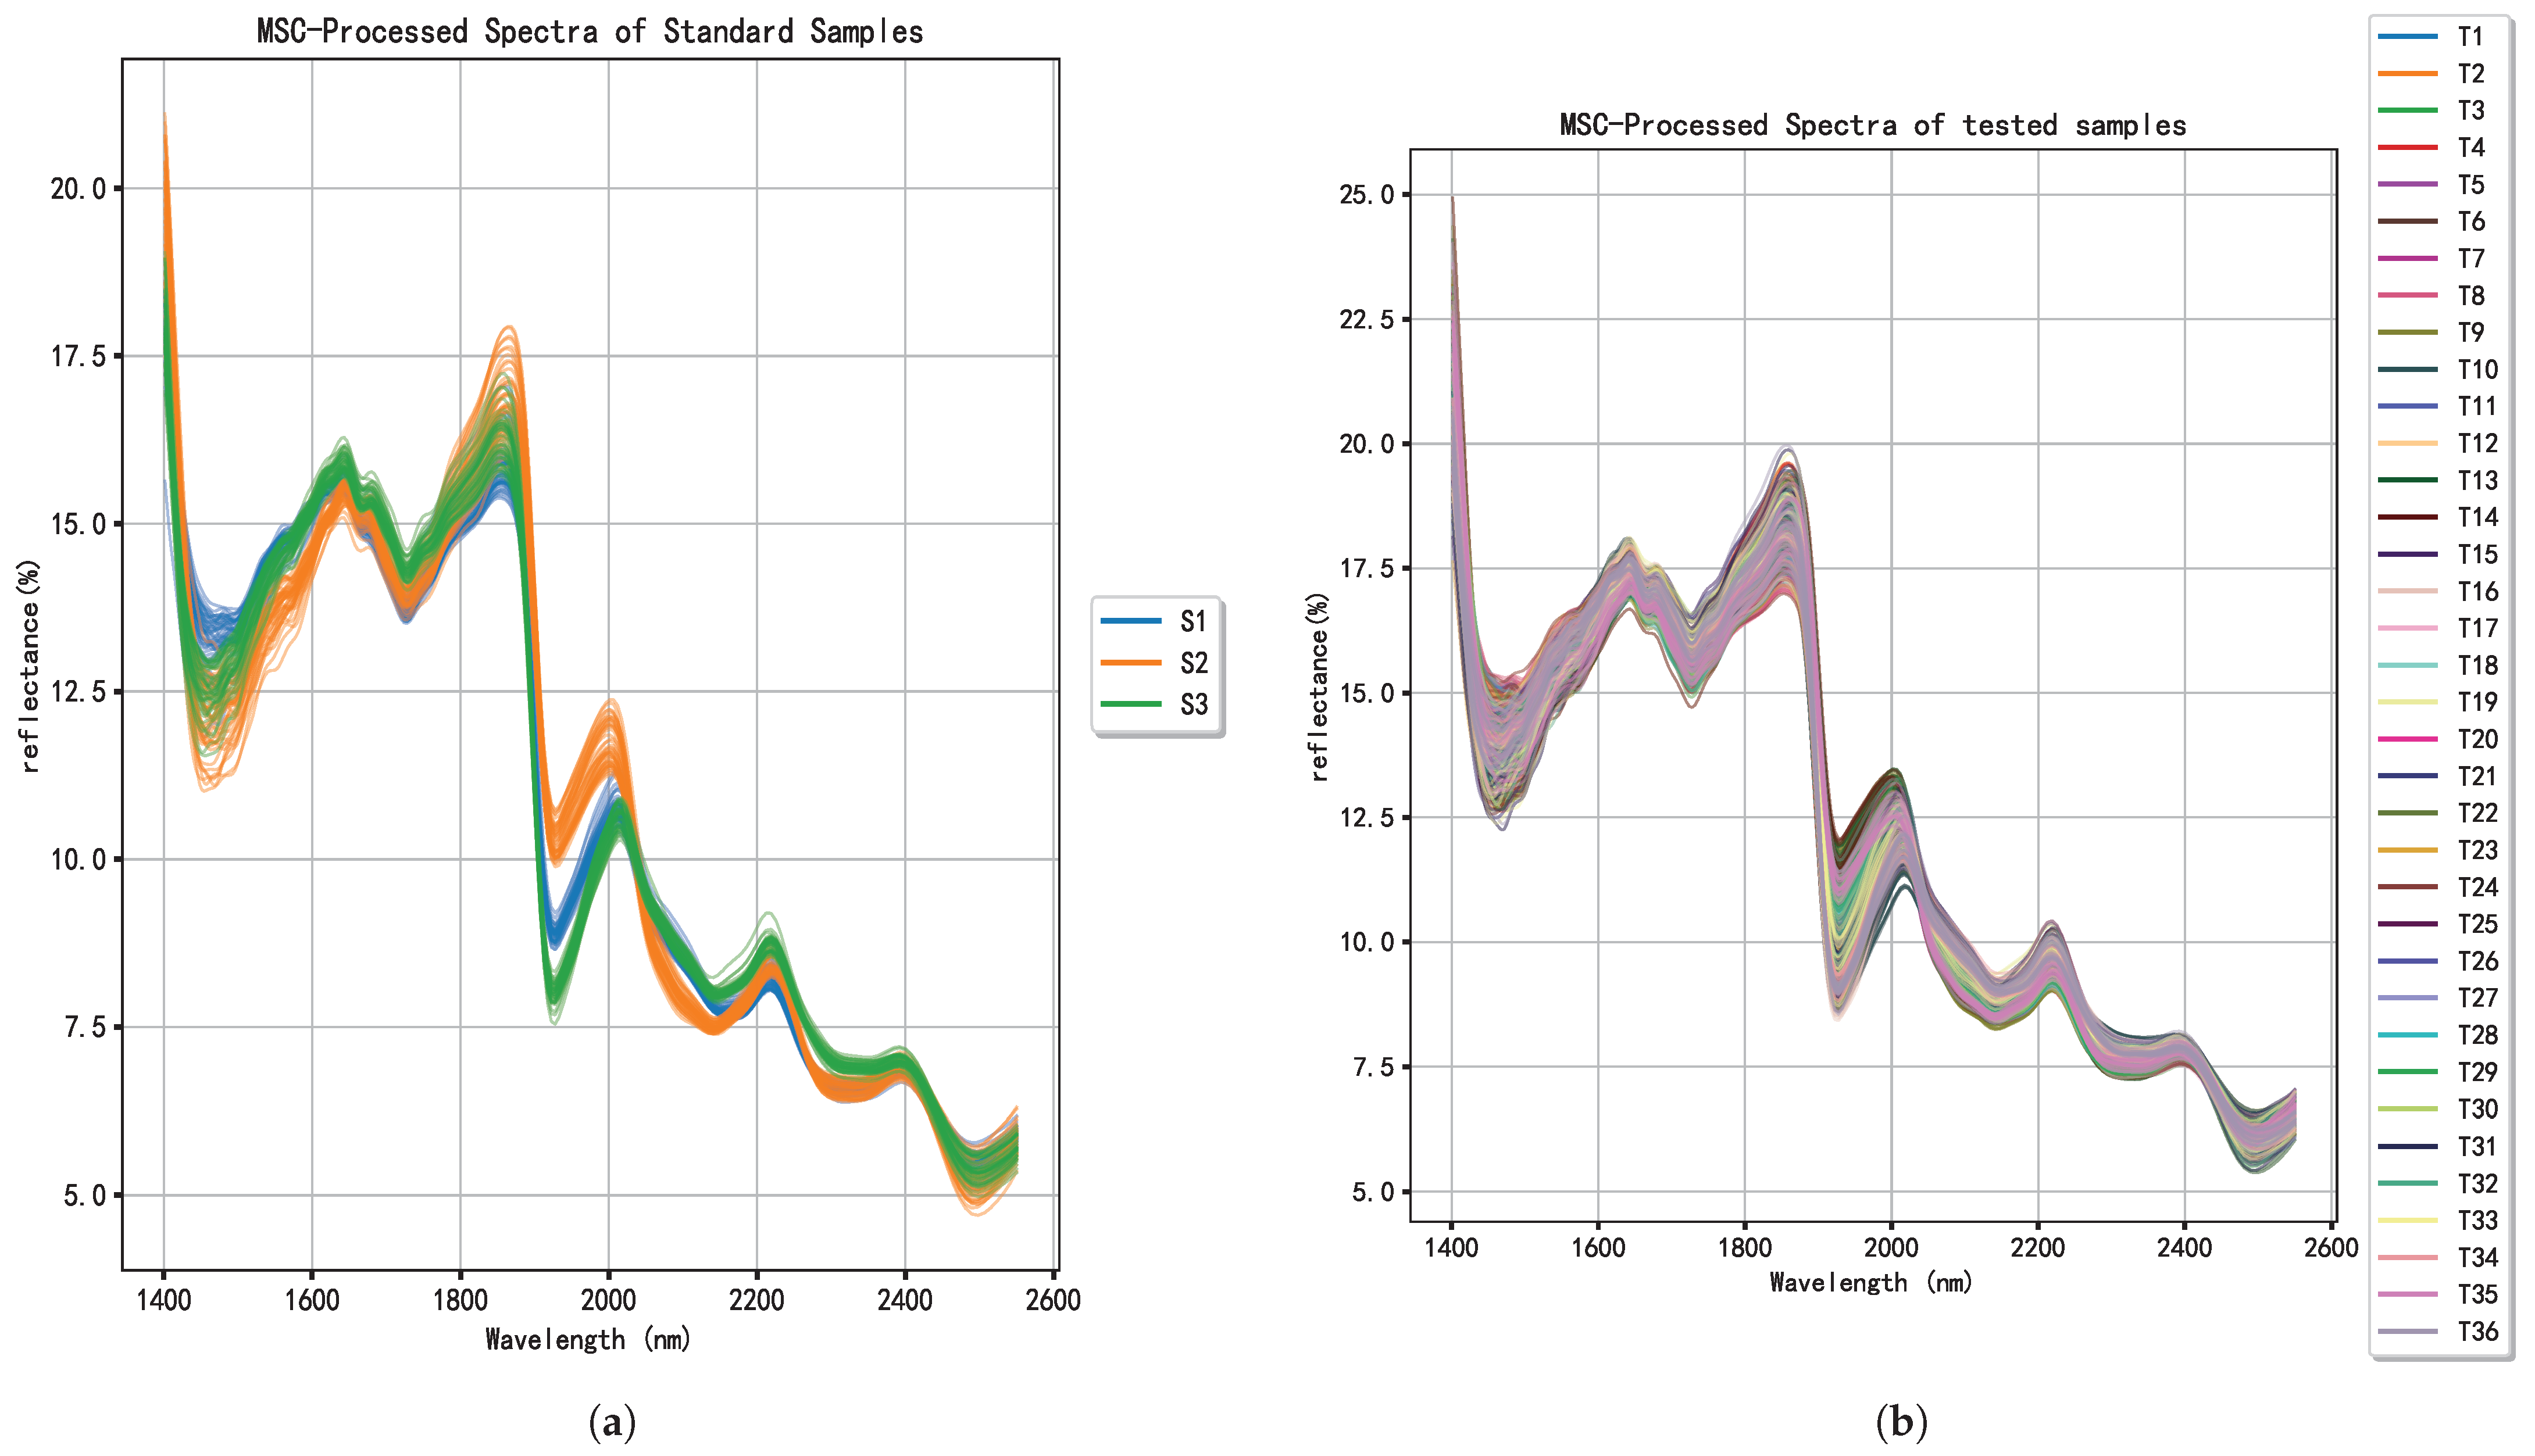
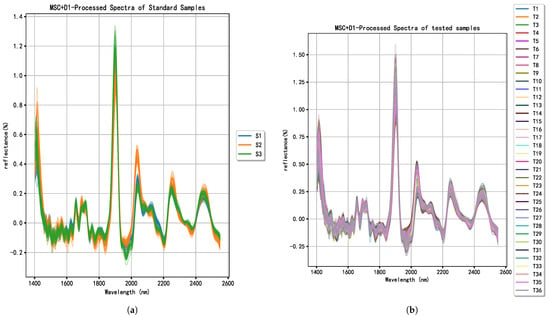
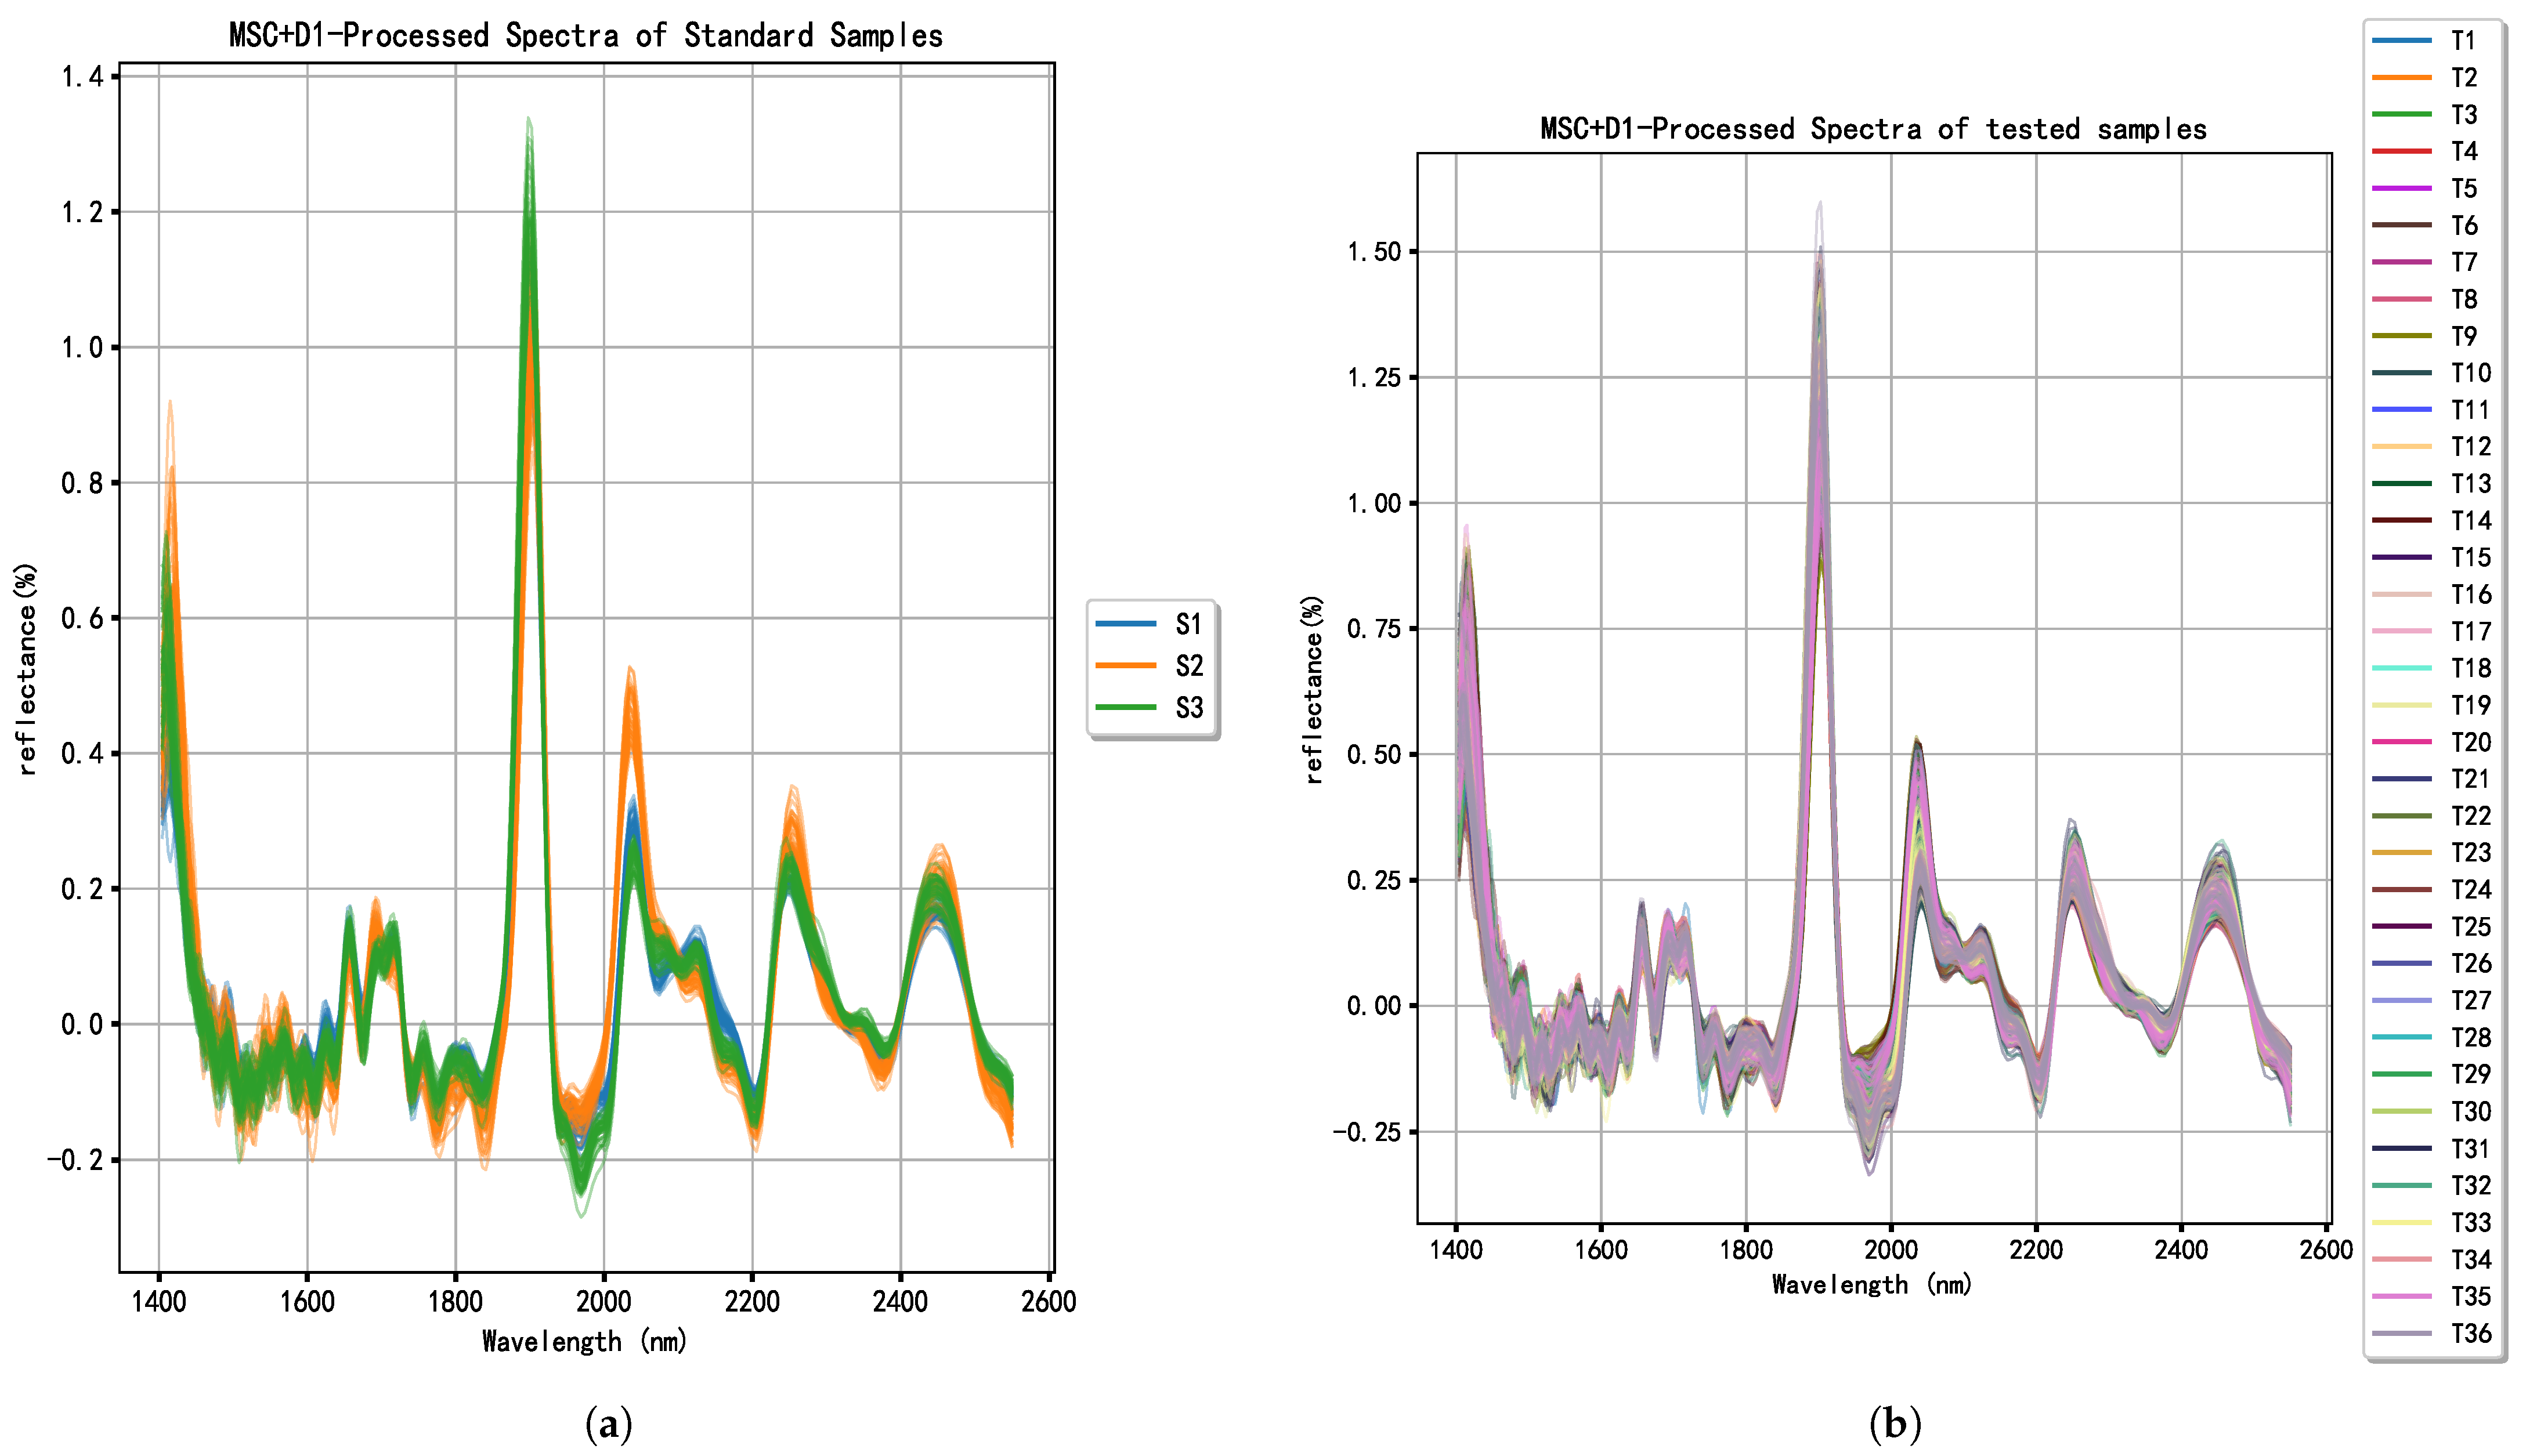
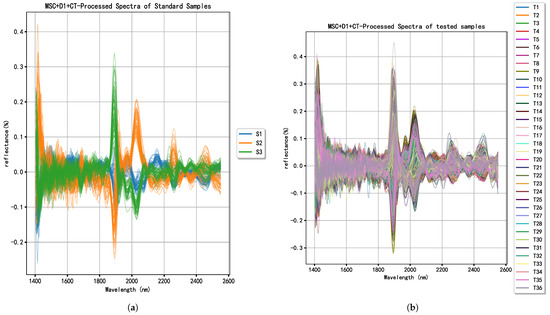
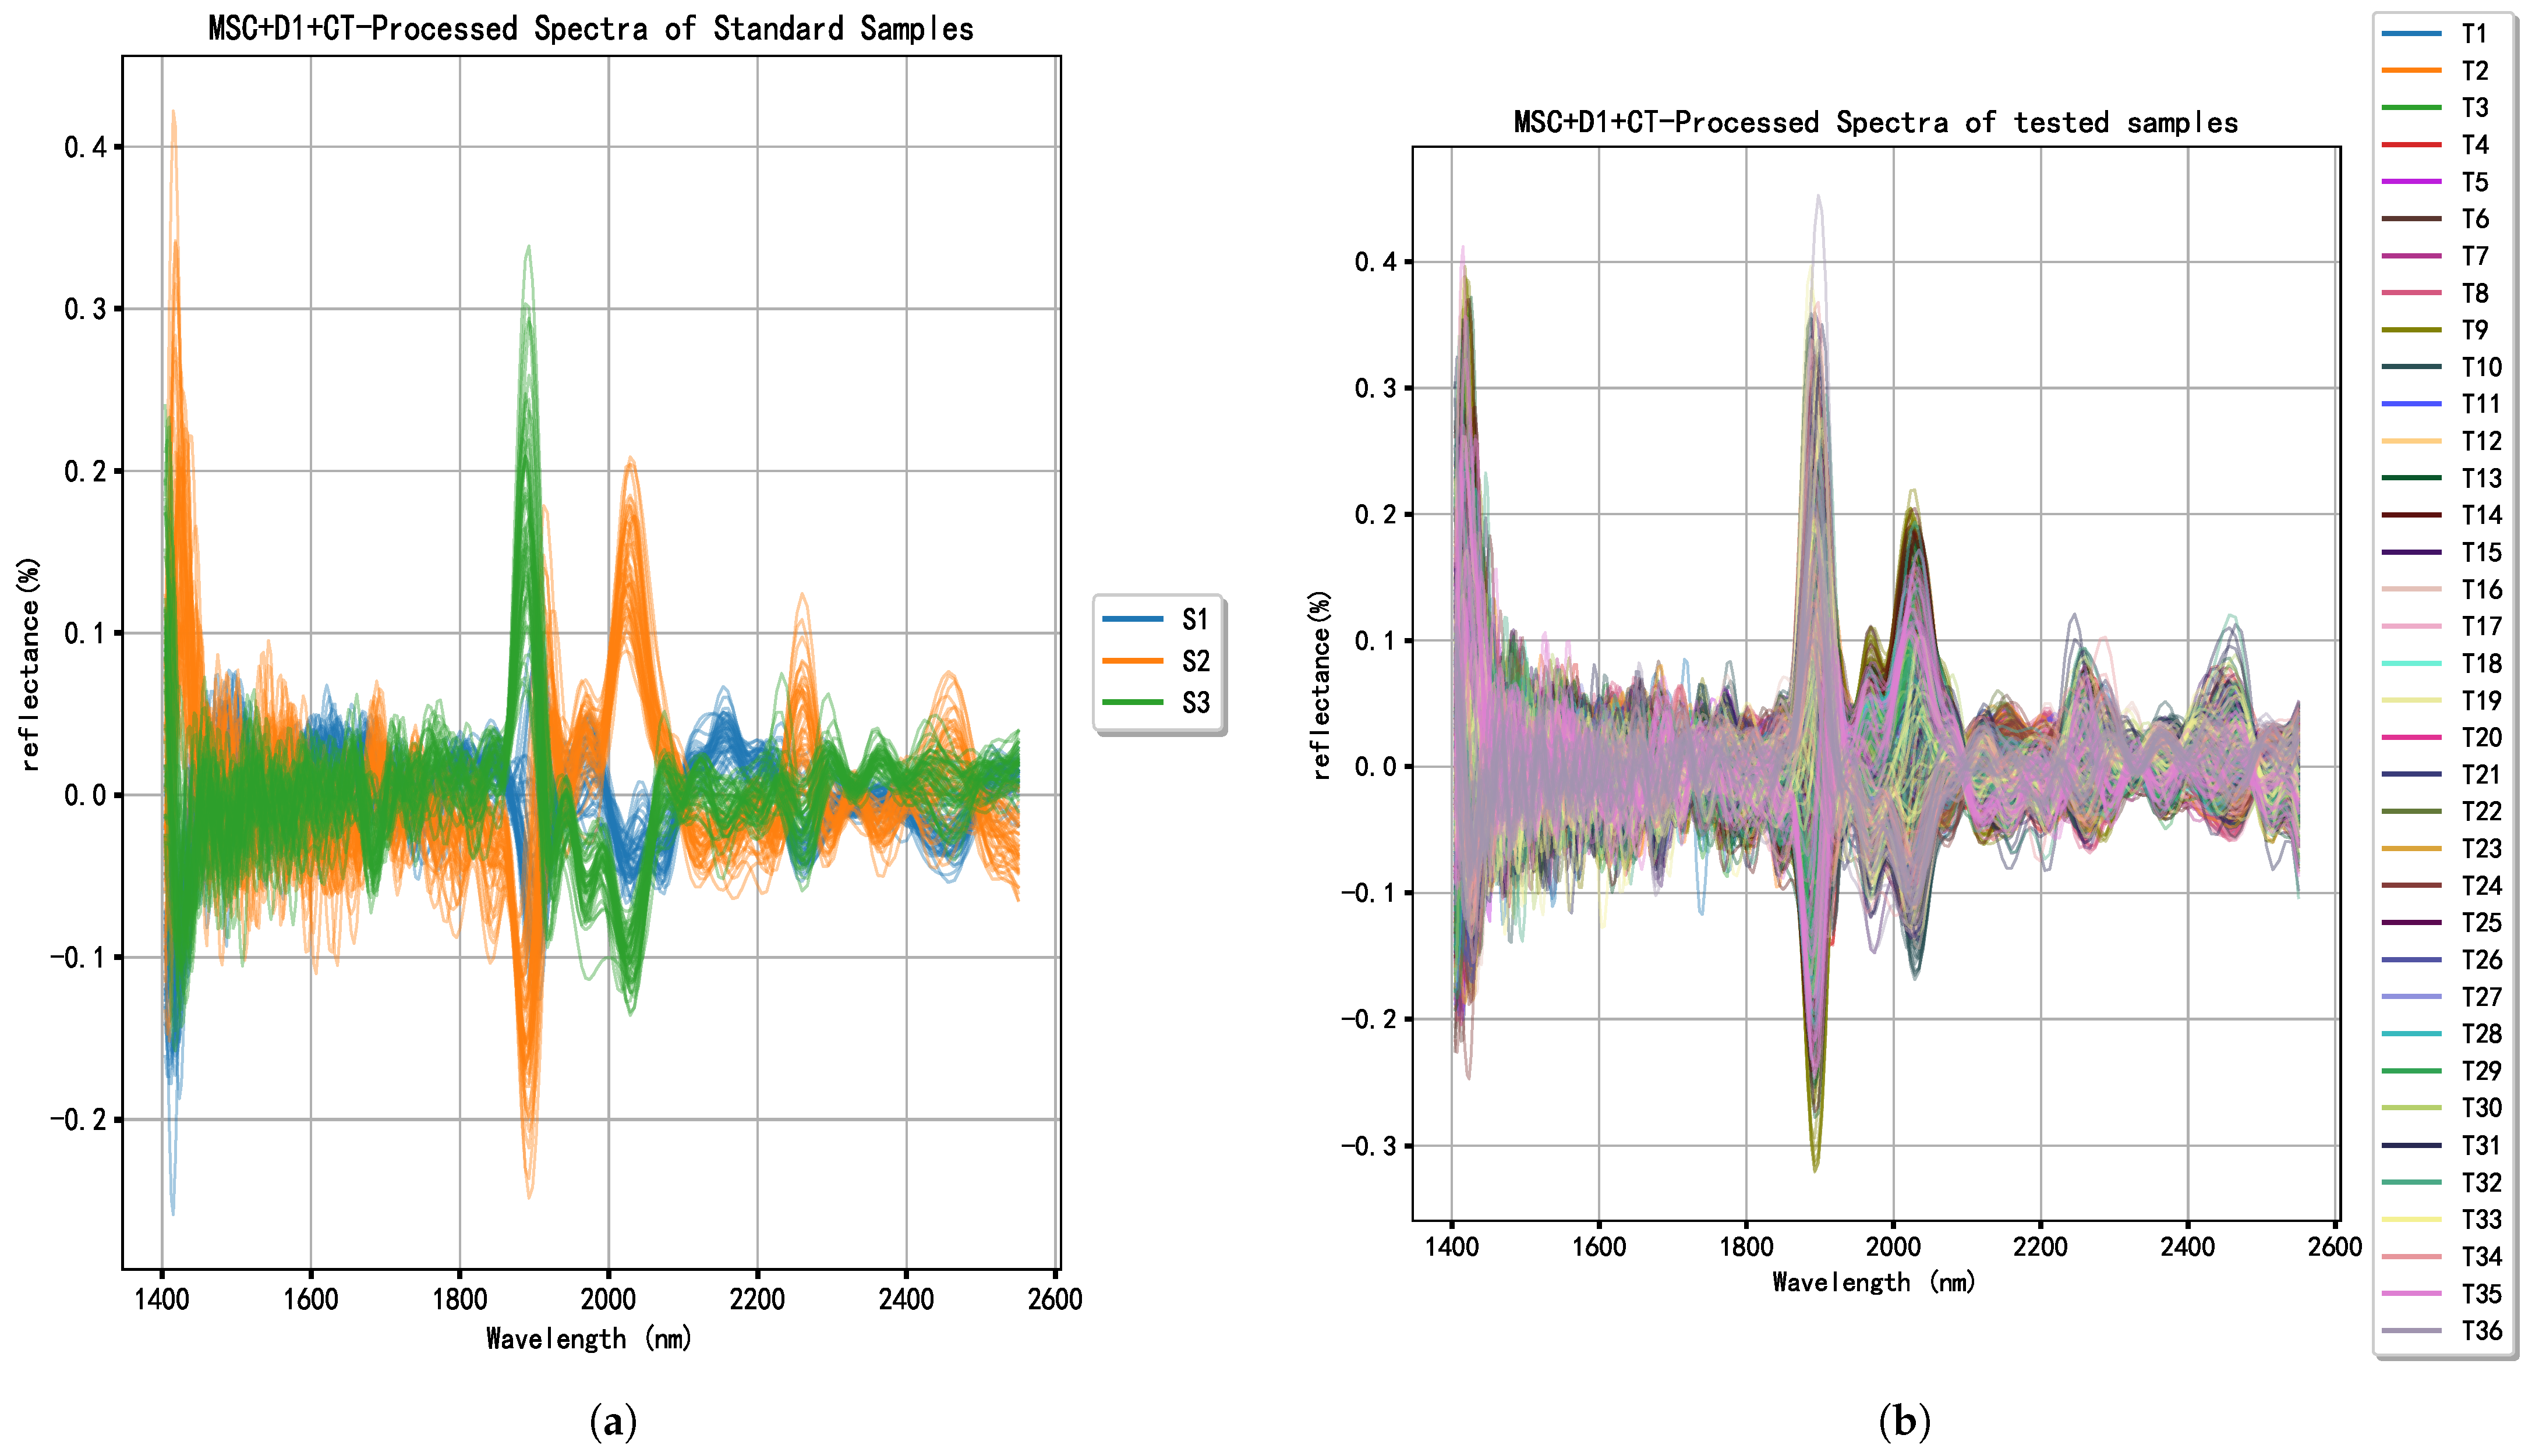
Initially, scattering variations caused by differences in tea leaf size and physical placement were eliminated. Figure 4a,b demonstrate more concentrated spectra, amplifying characteristic peaks associated with key chemical components. With the spectral features of the three reference categories achieving relative consistency, D1 processing was further applied. Figure 5a,b highlight the variable portions of the spectra, enhancing contrast between peaks and troughs. The final step involves CT processing. Figure 6a,b demonstrate that this step corrects global bias without altering the relative bias between samples, further enhancing data comparability and stability.
Figure 4.
MSC-corrected spectra of standard and test samples (a,b).
Figure 5.
First-derivative of MSC-corrected spectra of standard and test samples (a,b).
Figure 6.
Mean-centered first-derivative spectra of standard and test samples (a,b).
3.2. PCA Feature Dimension Reduction and Comparison of Global and Class-Wise Representations
After the standardization of the data, Principal Component Analysis (PCA) was performed separately on the three reference tea samples (S1, S2, and S3). Singular Value Decomposition (SVD) was applied to compute eigenvalues and eigenvectors, thereby constructing reduced-dimension feature subspaces for each class. For each reference category, samples were first separated according to their labels, and PCA was conducted independently. The number of retained principal components was determined using a 95% cumulative variance criterion. As shown in Table 2, 18 components were retained for S1, 17 for S2, and 17 for S3.
Table 2.
Parameters of PCA Dimension Reduction Results for Reference Standards.
This class-wise PCA strategy is inspired by the modeling philosophy of SIMCA, where independent PCA models are built to characterize intra-class structure and reduce the influence of inter-class variability. It should be noted that SIMCA itself is not employed as a classification benchmark in this study. Instead, class-wise PCA is used purely as a feature extraction method prior to distance-based similarity evaluation.
To assess whether the class-specific modeling strategy artificially enhances classification performance, a global PCA approach was also implemented for comparison. In the global PCA framework, a single PCA model was constructed using all reference samples, and the same 95% cumulative variance threshold resulted in 16 retained components (95.19% cumulative variance). Under both the class-wise and global PCA frameworks, similarity between test and reference samples was evaluated using identical Euclidean and Mahalanobis distance–based matching criteria.
As demonstrated in Section 3.3, the distance-based classifiers built on class-wise PCA features achieved better performance, confirming the effectiveness of this modeling strategy. A detailed comparison based on Euclidean distance is provided in Section 3.3.3, while a similar comparison based on Mahalanobis distance is shown in Section 3.3.4. Although this approach increases computational complexity by requiring projection into multiple subspaces during testing, it significantly enhances the discriminative capability for classification, making it a more effective strategy overall.
3.3. Model Selection and Similarity Analysis
3.3.1. Influence of Distance Threshold on Matching Degree and Error Metrics
In this section, we examine how variations in the distance threshold impact key performance metrics, specifically the Matching Degree, Reject Ratio, and False Positive Rate. The threshold is defined based on the principle, which governs the acceptance or rejection of test spectra relative to the reference category, thereby affecting classification accuracy.
Before analyzing the influence of the distance threshold, it is necessary to clarify the PCA modeling strategy used in this study. In conventional chemometric classification, PCA is often applied globally to all samples to construct a common feature space. However, when spectral variability differs substantially among reference categories, global PCA may obscure subtle class-specific spectral characteristics. In this study, PCA was therefore performed separately for each reference category (class-wise PCA). By constructing independent PCA models for each reference standard, the intrinsic spectral structure and intra-class variance of each category can be more effectively represented, thereby improving the sensitivity of similarity evaluation between test samples and reference categories.
(1) Impact on the Degree Matching
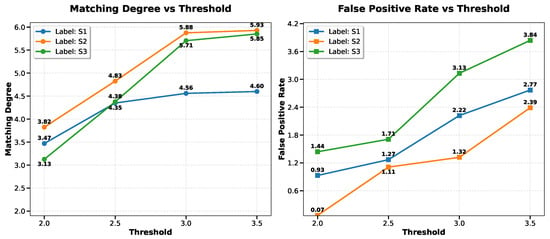
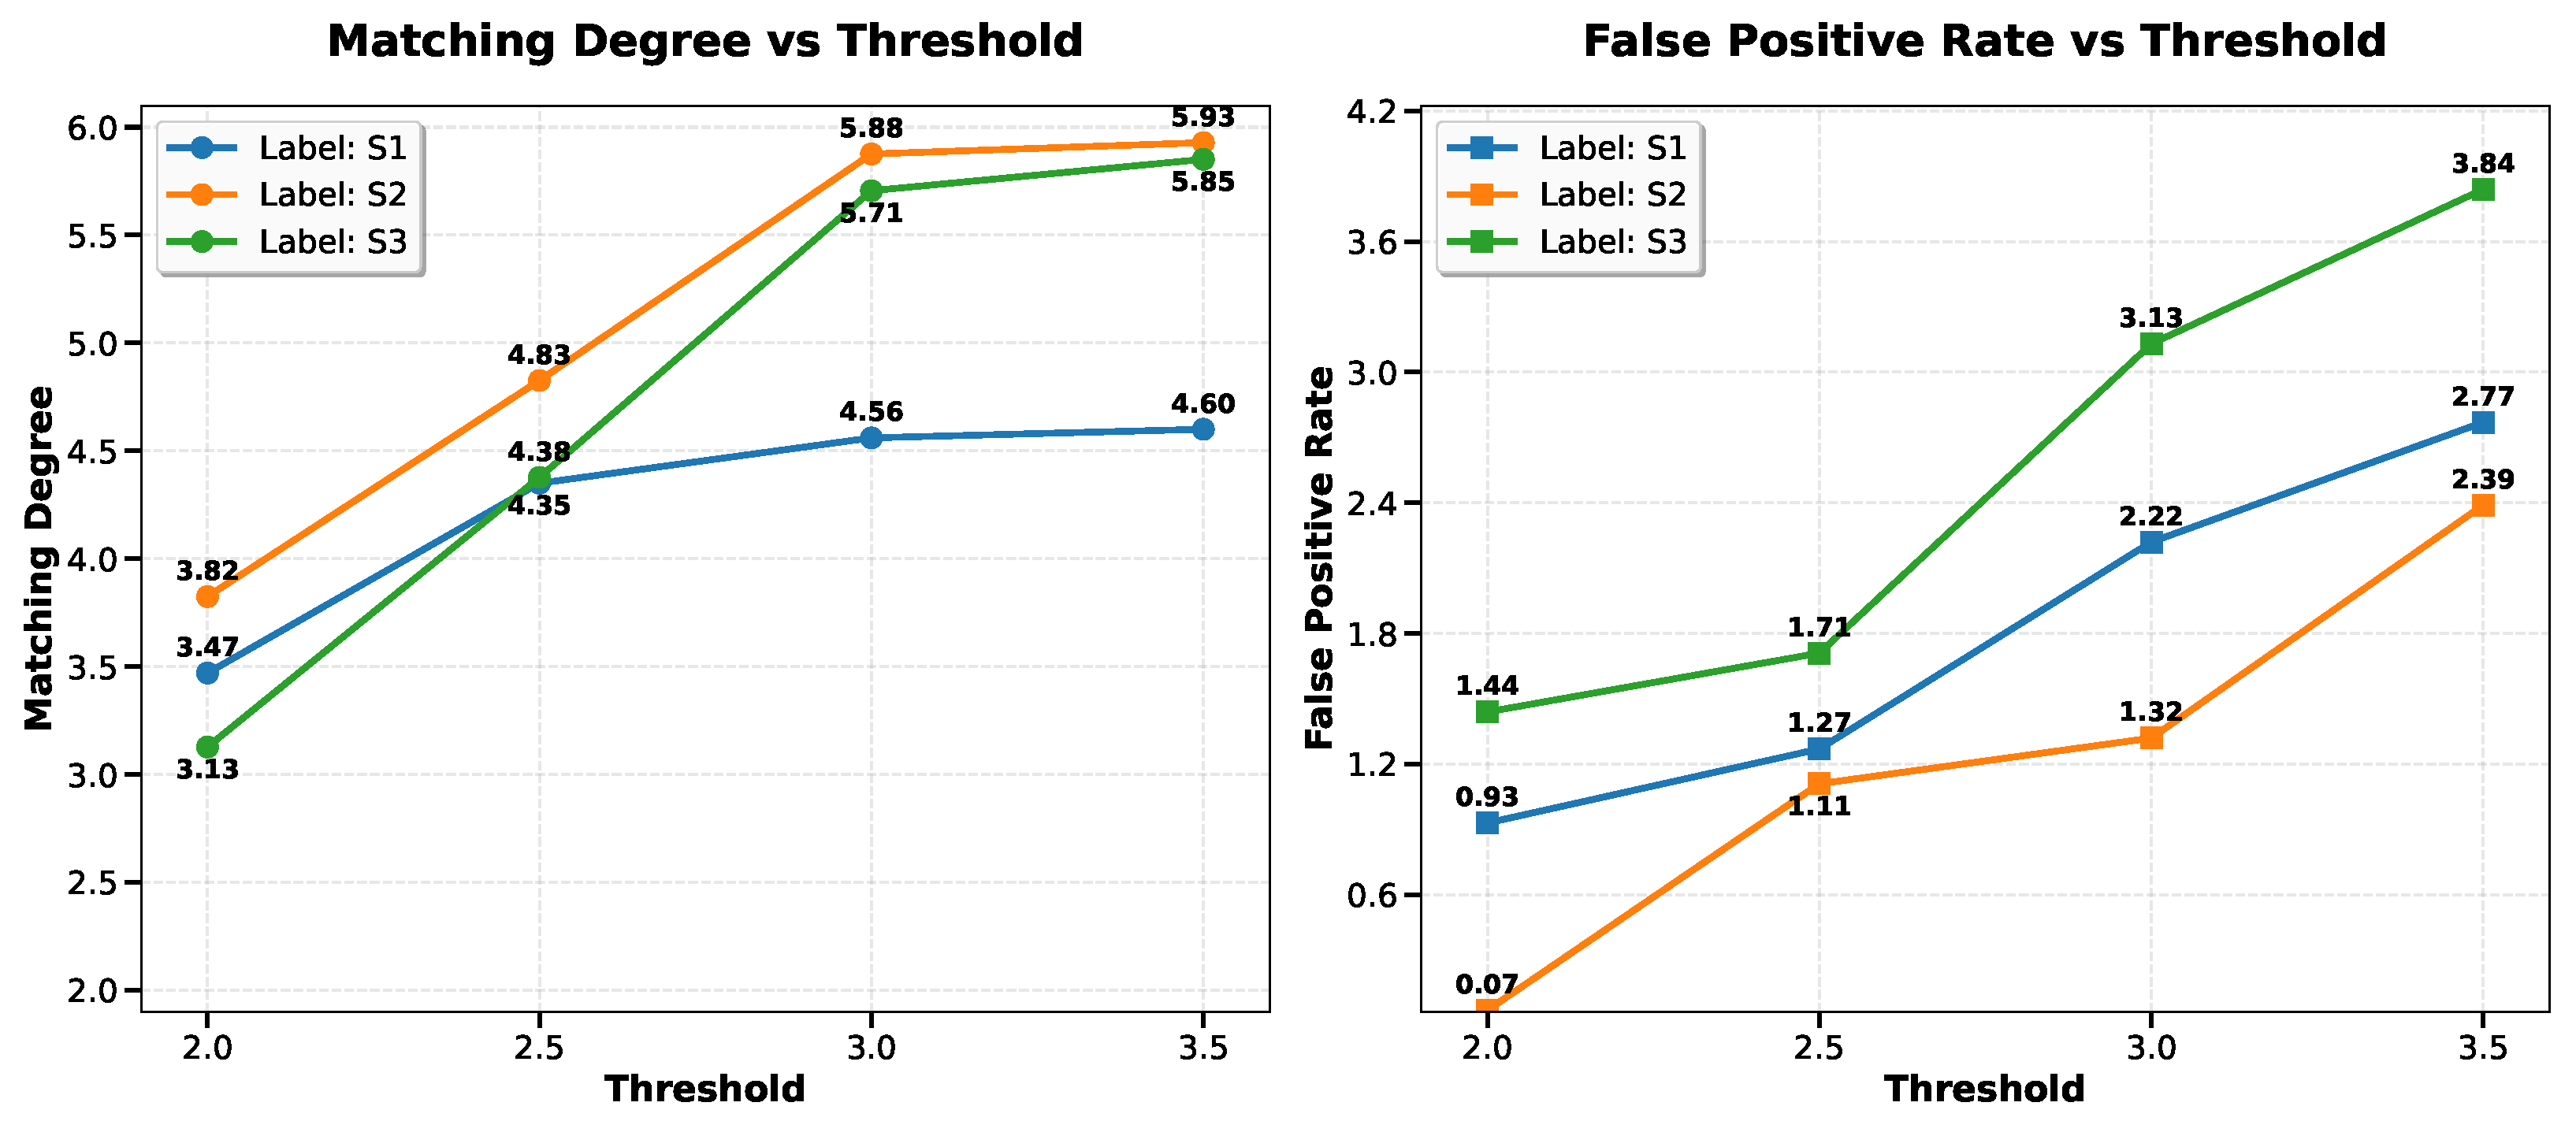
The Matching Degree represents the proportion of test samples with assigned category labels that are correctly identified as belonging to their corresponding reference category under a given distance threshold, as defined in Equation (2). According to Table 1, there are five test sample types that should match reference category tea sample S1, six that should match tea sample S2, and six that should match tea sample S3. Therefore, the theoretical perfect Matching Degree values are five, six, and six for tea samples S1, S2, and S3, respectively.
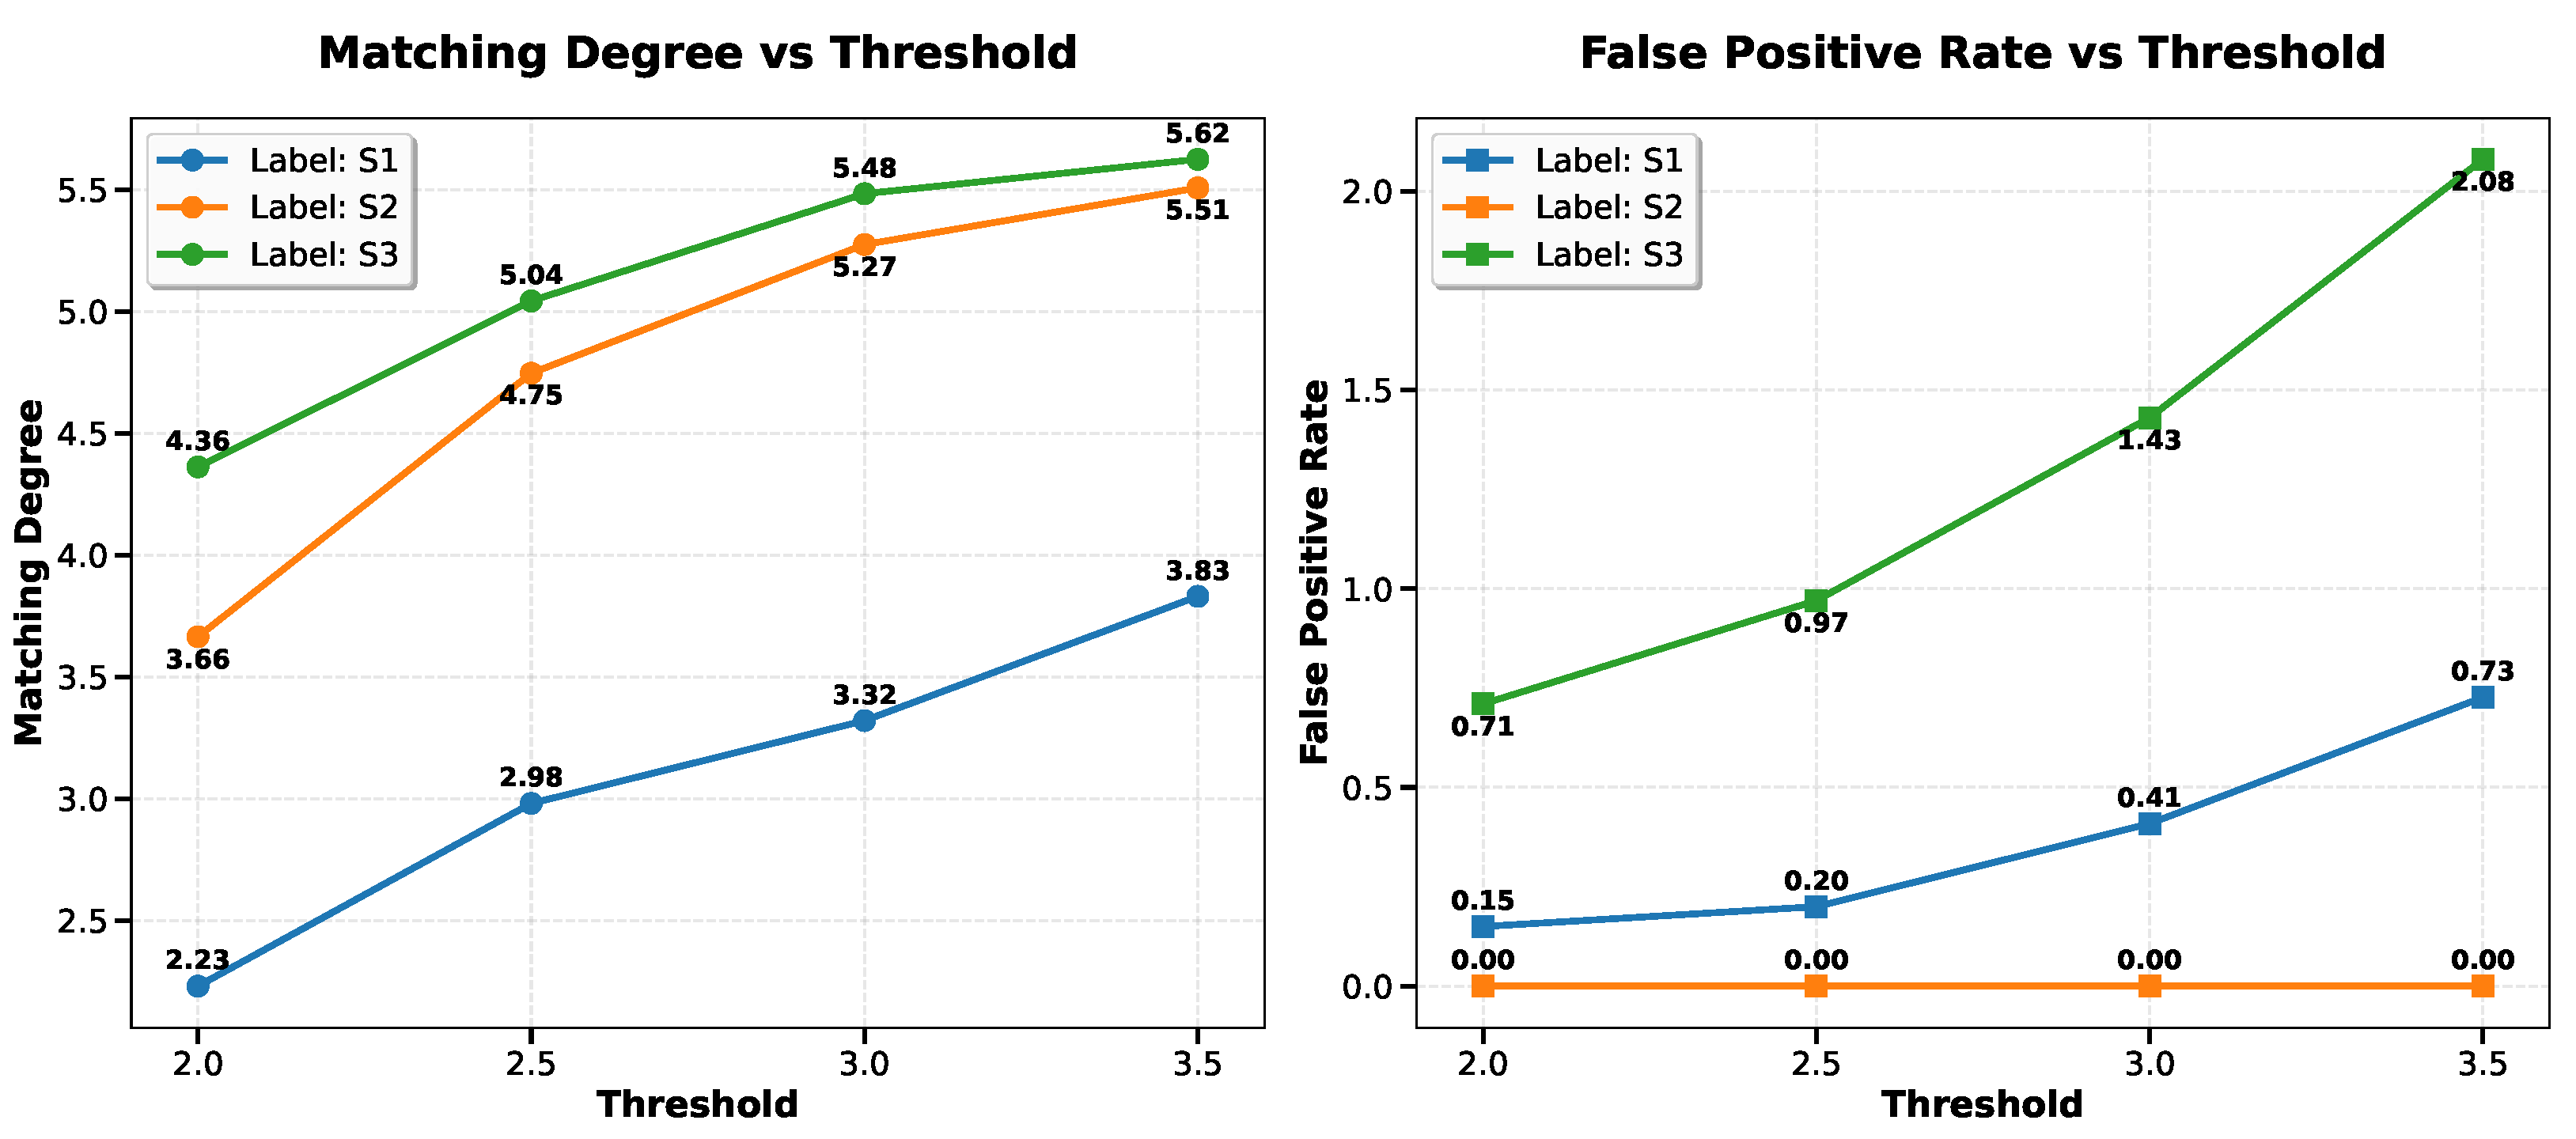
As shown in Figure 7 and Figure 8, as the distance threshold increases, the Matching Degree increases continuously for both Euclidean and Mahalanobis distance-based models. When approaches 3.5, the Matching Degree of tea sample S1 rises to between 4 and 5, while those of tea samples S2 and S3 approach their theoretical maximum value of 6. However, within the threshold interval from to , the growth rate becomes noticeably slower, indicating limited additional improvement in correct matching.
Figure 7.
Variation of matching degree and False-Positive Rate as functions of the distance threshold under the Euclidean distance framework. The horizontal axis represents the distance threshold , while the vertical axis represents the corresponding evaluation metric values for each reference category.
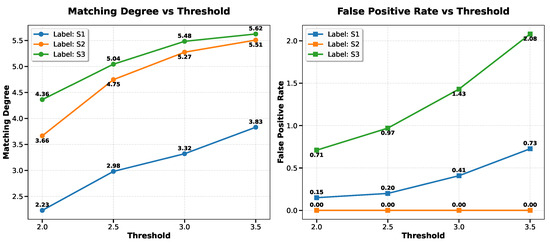
Figure 8.
Variation of matching degree and false positive rate as functions of the distance threshold under the Mahalanobis distance framework. The horizontal axis represents the distance threshold , while the vertical axis represents the corresponding evaluation metric values for each reference category.
(2) Impact on the false positive rate
The False-Positive Rate is defined as the number of incorrectly assigned test samples divided by the total number of test samples. As shown in Figure 7 and Figure 8, as increases, the False-Positive Rate shows a gradual upward trend for both Euclidean and Mahalanobis distance-based models. Within the interval to , while the improvement in Matching Degree becomes marginal, the False-Positive Rate continues to rise steadily.
Spectral comparison shows that tea samples S1 and S3 exhibit relatively similar spectral characteristics, whereas tea sample S2 differs more distinctly from the other two categories. As shown in Figure 8, under the Mahalanobis distance-based framework, the False-Positive Rate for tea sample S2 remains zero across all tested thresholds. Overall, increasing the distance threshold improves the Matching Degree but simultaneously increases the False-Positive Rate.
Based on the previous analysis, although increasing the distance threshold improves the Matching Degree, the improvement becomes marginal once exceeds 3.0, while the False-Positive Rate continues to rise. Therefore, to balance the Matching Degree and misclassification risk, the distance threshold was set to in this study.
Building on this threshold selection, the subsequent calibration process refines this choice by calculating the first-order sample moments in the PCA subspace. This ensures that the threshold values for both Euclidean and Mahalanobis distances are consistent with the observed variance in the data. The following sections provide detailed calculations for the Euclidean and Mahalanobis distances, which form the basis for determining the optimal distance thresholds for each reference category.
3.3.2. Distance Threshold Calibration
By calculating the first-order sample moments of the data after PCA dimensionality reduction across categories, the coordinates of the category centers in the PCA subspace were obtained. These coordinates serve as the reference baseline for subsequent distance metrics: as geometric reference points in Euclidean distance and as the mean parameter of the multivariate normal distribution in Mahalanobis distance.
For the Euclidean distance, the average deviation within the standard sample set was calculated. The Euclidean distance between a sample x and the category center is given by:
where denotes the mean spectral point for the standard sample category j. Since Euclidean distance assumes independent and equally weighted dimensions, it reflects the absolute positional differences of samples in the feature space. The calculated Euclidean distances for three standard samples (rounded to two decimal places) are presented in Table 3.
Table 3.
Calculation results of Euclidean distance threshold for reference standards (based on class-wise PCA).
To further evaluate the impact of different dimensionality reduction strategies on distance metrics, the same Euclidean distance calculation was performed on the feature space transformed by global PCA. Unlike class-wise PCA, which optimizes separability for specific categories, global PCA captures the overall variance structure of the entire dataset. The resulting distance values for the three standard samples under the global PCA subspace are reported in Table 4 (rounded to two decimal places).
Table 4.
Euclidean distance calculation results for reference standards in the Global PCA subspace.
The Mahalanobis distance was also calculated within the standard sample set based on the class-wise PCA subspace. By globally considering the distribution of data across all directions, this metric measures the degree of deviation relative to the typical distribution of the category. The Mahalanobis distance is calculated as:
where is the mean vector and is the covariance matrix. The calculated Mahalanobis distance results for the three standard samples (rounded to two decimal places) are presented in Table 5.
Table 5.
Calculation results of the Mahalanobis distance threshold for standard samples (based on class-wise PCA).
To maintain consistency with the Euclidean distance analysis, the same Mahalanobis distance calculation was performed on the feature space transformed by global PCA. This allows for a comparative assessment of how the two dimensionality reduction approaches—one category-specific and one dataset-wide—affect the Mahalanobis distance-based deviation measurement. The resulting Mahalanobis distance values for the three standard samples under the global PCA subspace are reported in Table 6 (rounded to two decimal places).
Table 6.
Mahalanobis distance calculation results for reference standards in the global PCA subspace.
3.3.3. Comparison Based on Euclidean Distance
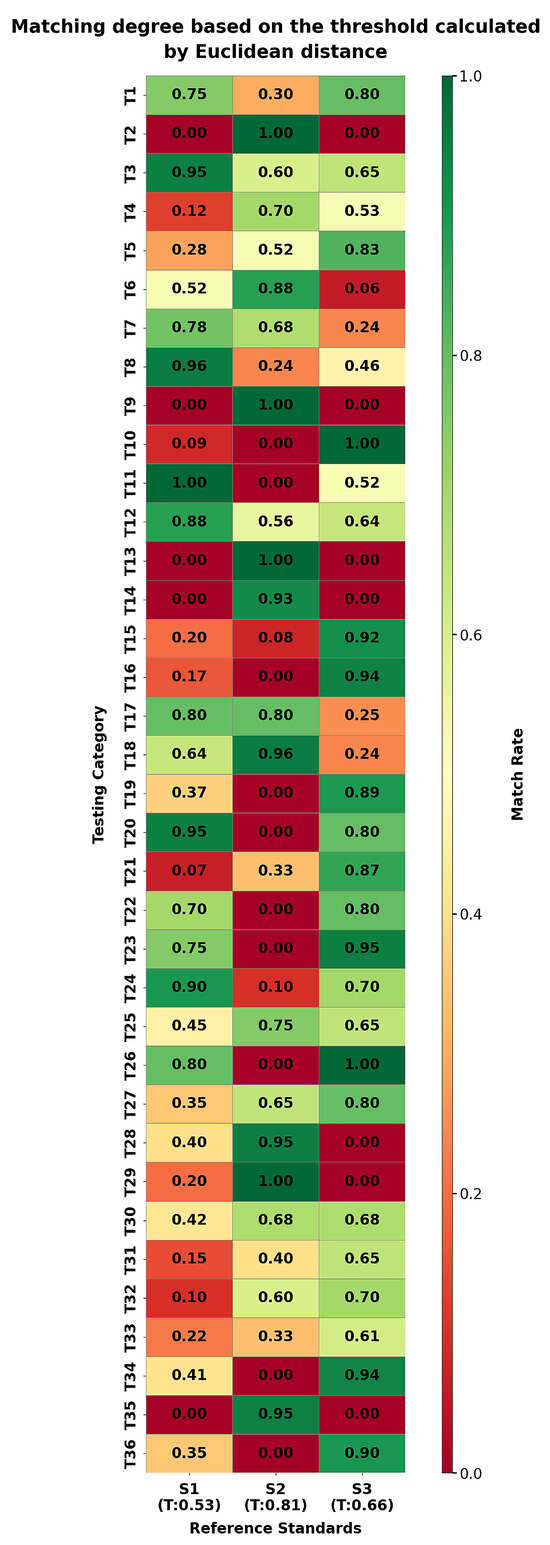
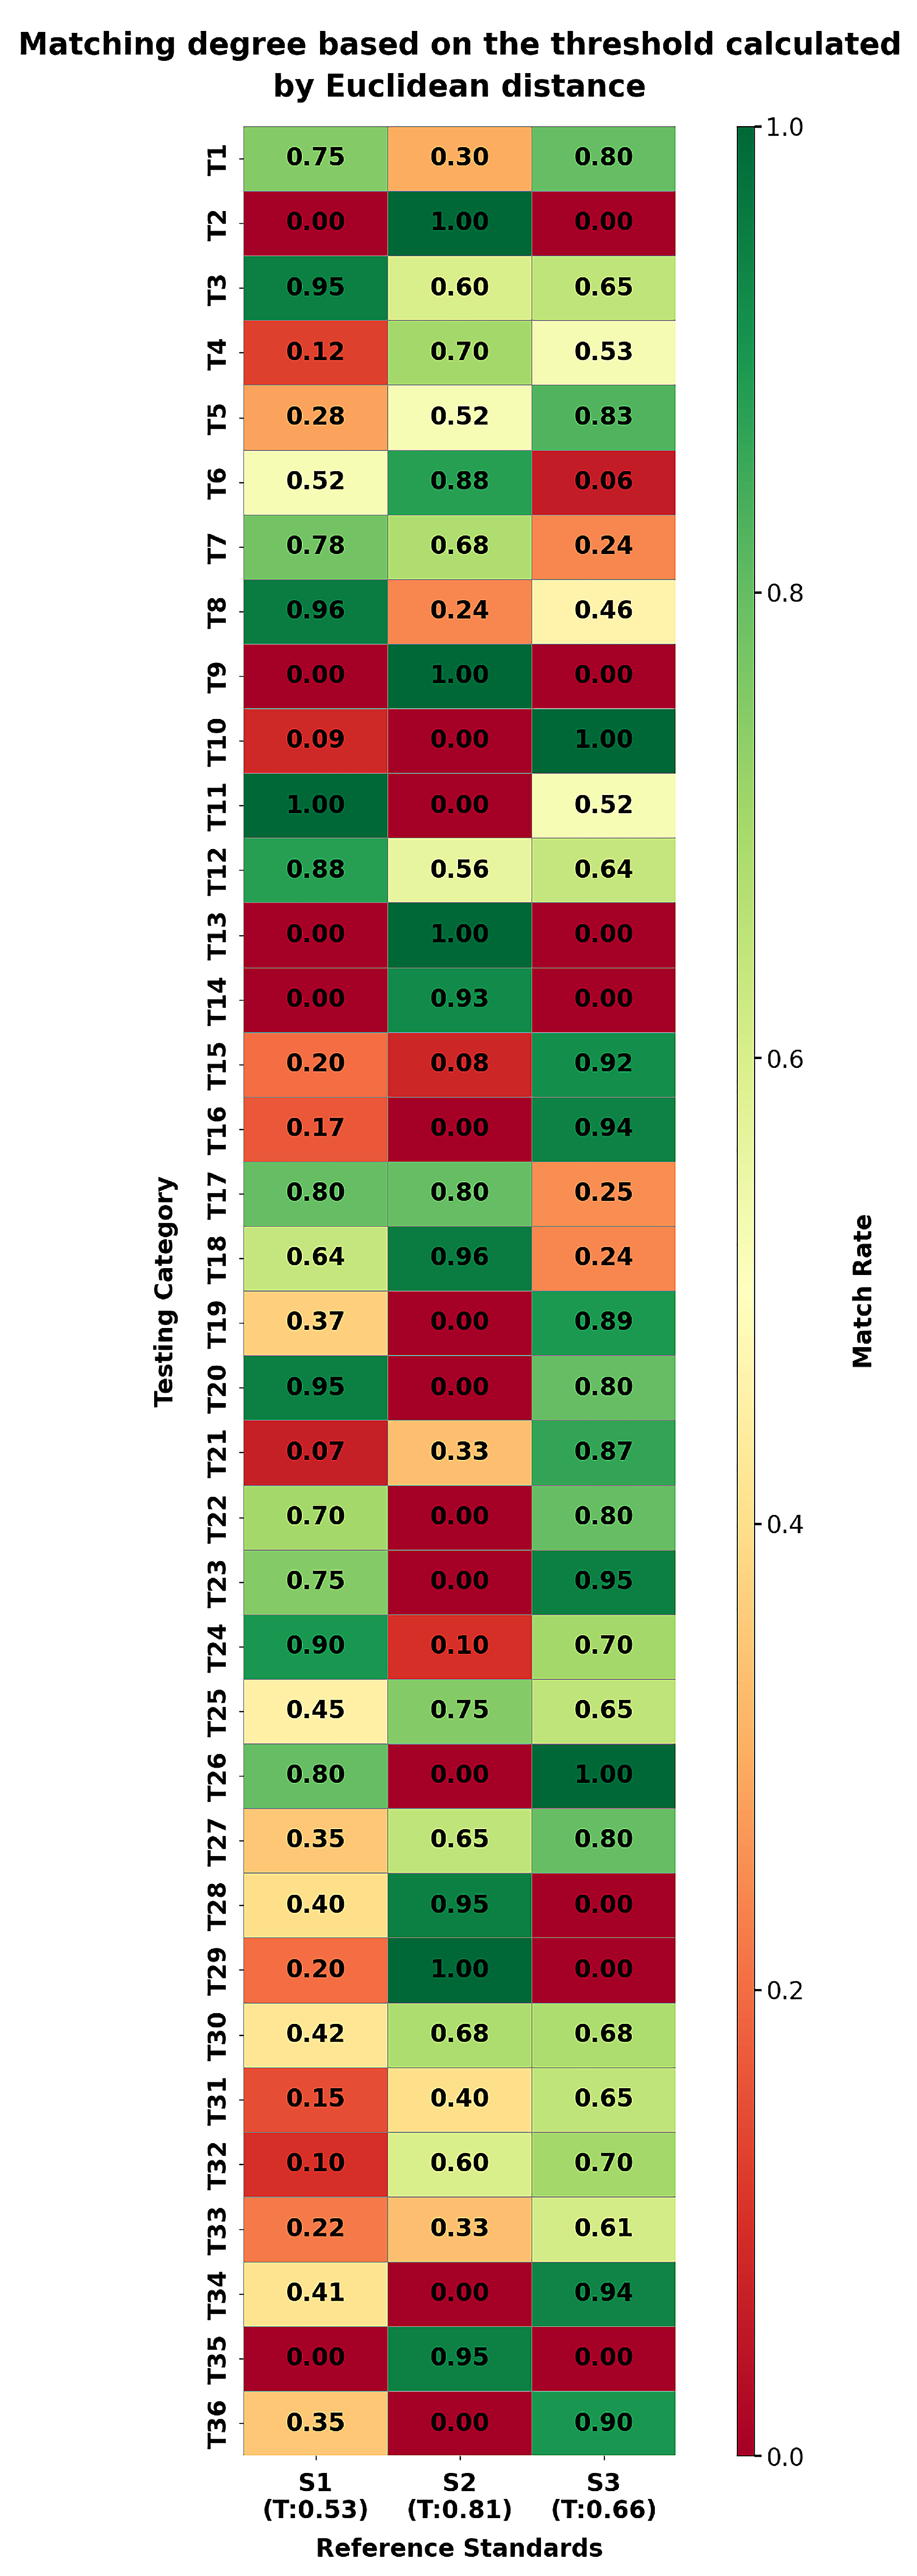
Figure 9 and Figure 10 present the similarity heatmaps calculated using Euclidean distance for the class-wise PCA and global PCA feature representations, respectively.
Figure 9.
Similarity heatmap based on Euclidean distance under the class-wise PCA feature representation. Rows correspond to test samples and columns correspond to reference categories (S1–S3). Color intensity represents the matching degree between each test sample and reference category, with higher values indicating stronger similarity.
Figure 10.
Similarity heatmap based on Euclidean distance under the global PCA feature representation. Rows correspond to test samples and columns correspond to reference categories (S1–S3). Color intensity indicates the matching degree, where higher values represent stronger similarity between the test sample and the reference category.
In the class-wise PCA case, test samples with assigned category labels exhibit high matching degrees with their corresponding reference samples, consistent with the results shown in Figure 9. Among the 16 test samples with known category labels, all exhibit matching degrees higher than 0.9. According to the classification rule described in Section 2.7, with the matching threshold set to 0.9, all 16 labeled samples satisfy the threshold and are correctly classified. Only sample T1, despite having a known label, shows a lower matching degree of 0.75 and is therefore correctly rejected.
However, an important issue arises with unlabeled samples—those that do not belong to any of the predefined categories (S1, S2, S3) and are not listed in Table 1. These samples should ideally be rejected by the classifier, as they are not represented in the reference library. Nevertheless, four unlabeled samples (T18, T20, T23, and T28) exhibit matching degrees exceeding 0.95, well above the established threshold of 0.9. As a result, these samples are incorrectly accepted as belonging to one of the reference categories, despite having no true category affiliation. Under this configuration, the overall classification accuracy—considering both correct acceptance of labeled samples and correct rejection of unlabeled samples—reaches 86.11%.
In contrast, when Euclidean distance is applied to the global PCA feature representation, the matching performance deteriorates, as shown in Figure 10. Although the same 16 labeled test samples still exhibit relatively high matching degrees (mostly above 0.8), misclassifications become more frequent. In addition to the correctly rejected unlabeled samples, a larger number of unlabeled samples—including T12, T17, T18, T19, T20, T23, and T28—are incorrectly accepted, as their matching degrees exceed the threshold despite having no true category affiliation. As a result, the overall classification accuracy decreases to 77.7%. Lowering the matching threshold to the range of 0.7–0.8 is found to be unsuitable, as a substantial number of unlabeled samples exhibit matching degrees within this range, which would lead to an even greater risk of false acceptance.
3.3.4. Comparison Based on Mahalanobis Distance
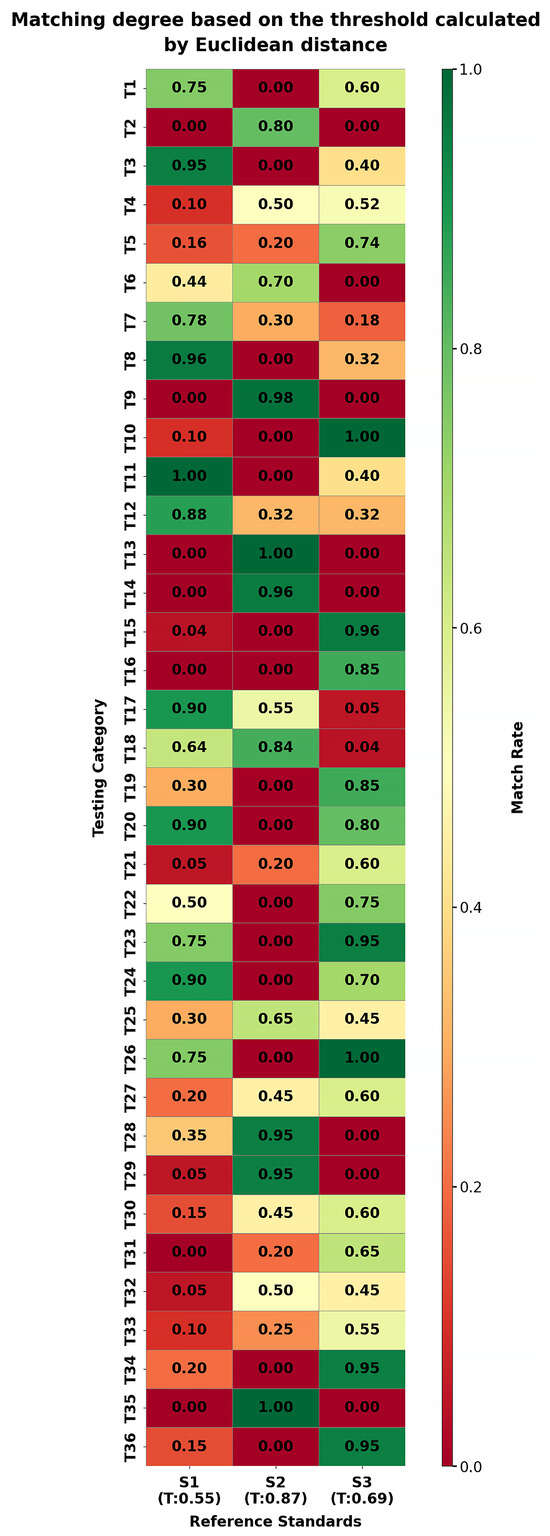
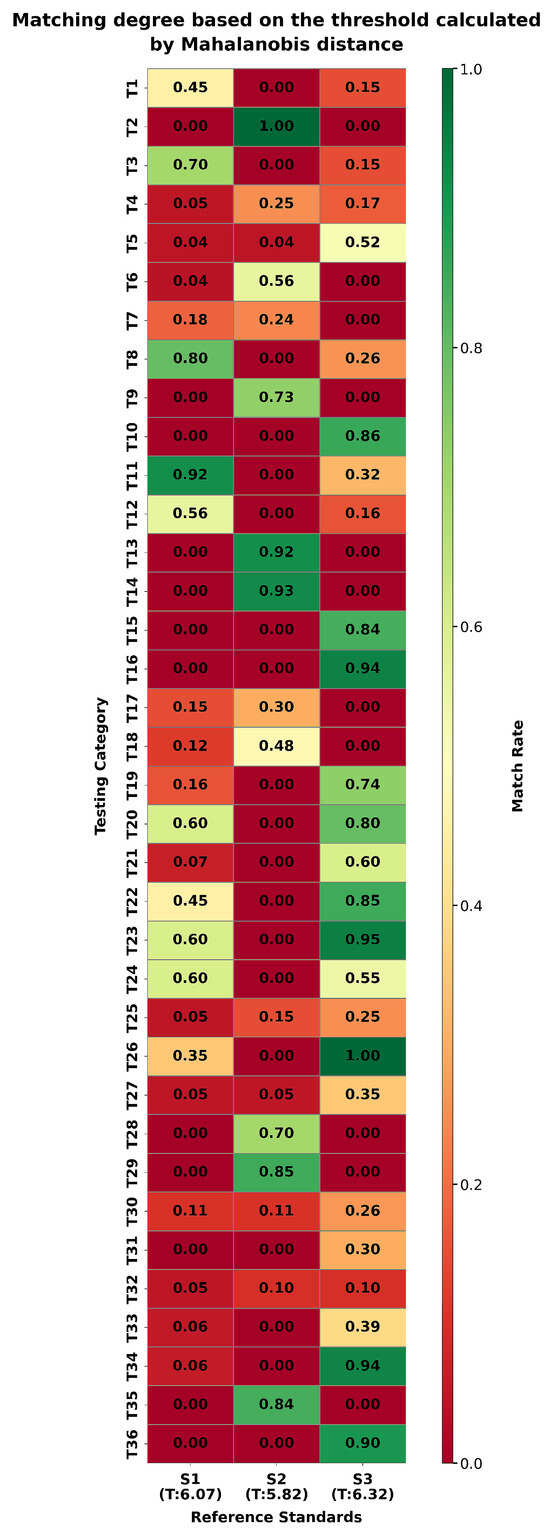
Figure 11 shows the similarity heatmap obtained using Mahalanobis distance under the class-wise PCA framework. The majority of test samples exhibit high similarity scores, with 15 labeled test samples showing matching degrees above 0.7. When the matching threshold is set to 0.7, these 15 samples are correctly classified, while only T1 and T24, with matching degrees of 0.6, fail to meet the threshold. Nevertheless, misclassifications are still observed among samples exceeding the threshold, including T19, T20, T22, and T23, all of which have matching degrees higher than 0.74. Under this setting, the overall classification accuracy is 83.33%.
Figure 11.
Similarity heatmap based on Mahalanobis distance under the class-wise PCA feature representation. Rows correspond to test samples and columns correspond to reference categories (S1–S3). Color intensity represents the calculated matching degree, where higher values indicate stronger similarity.
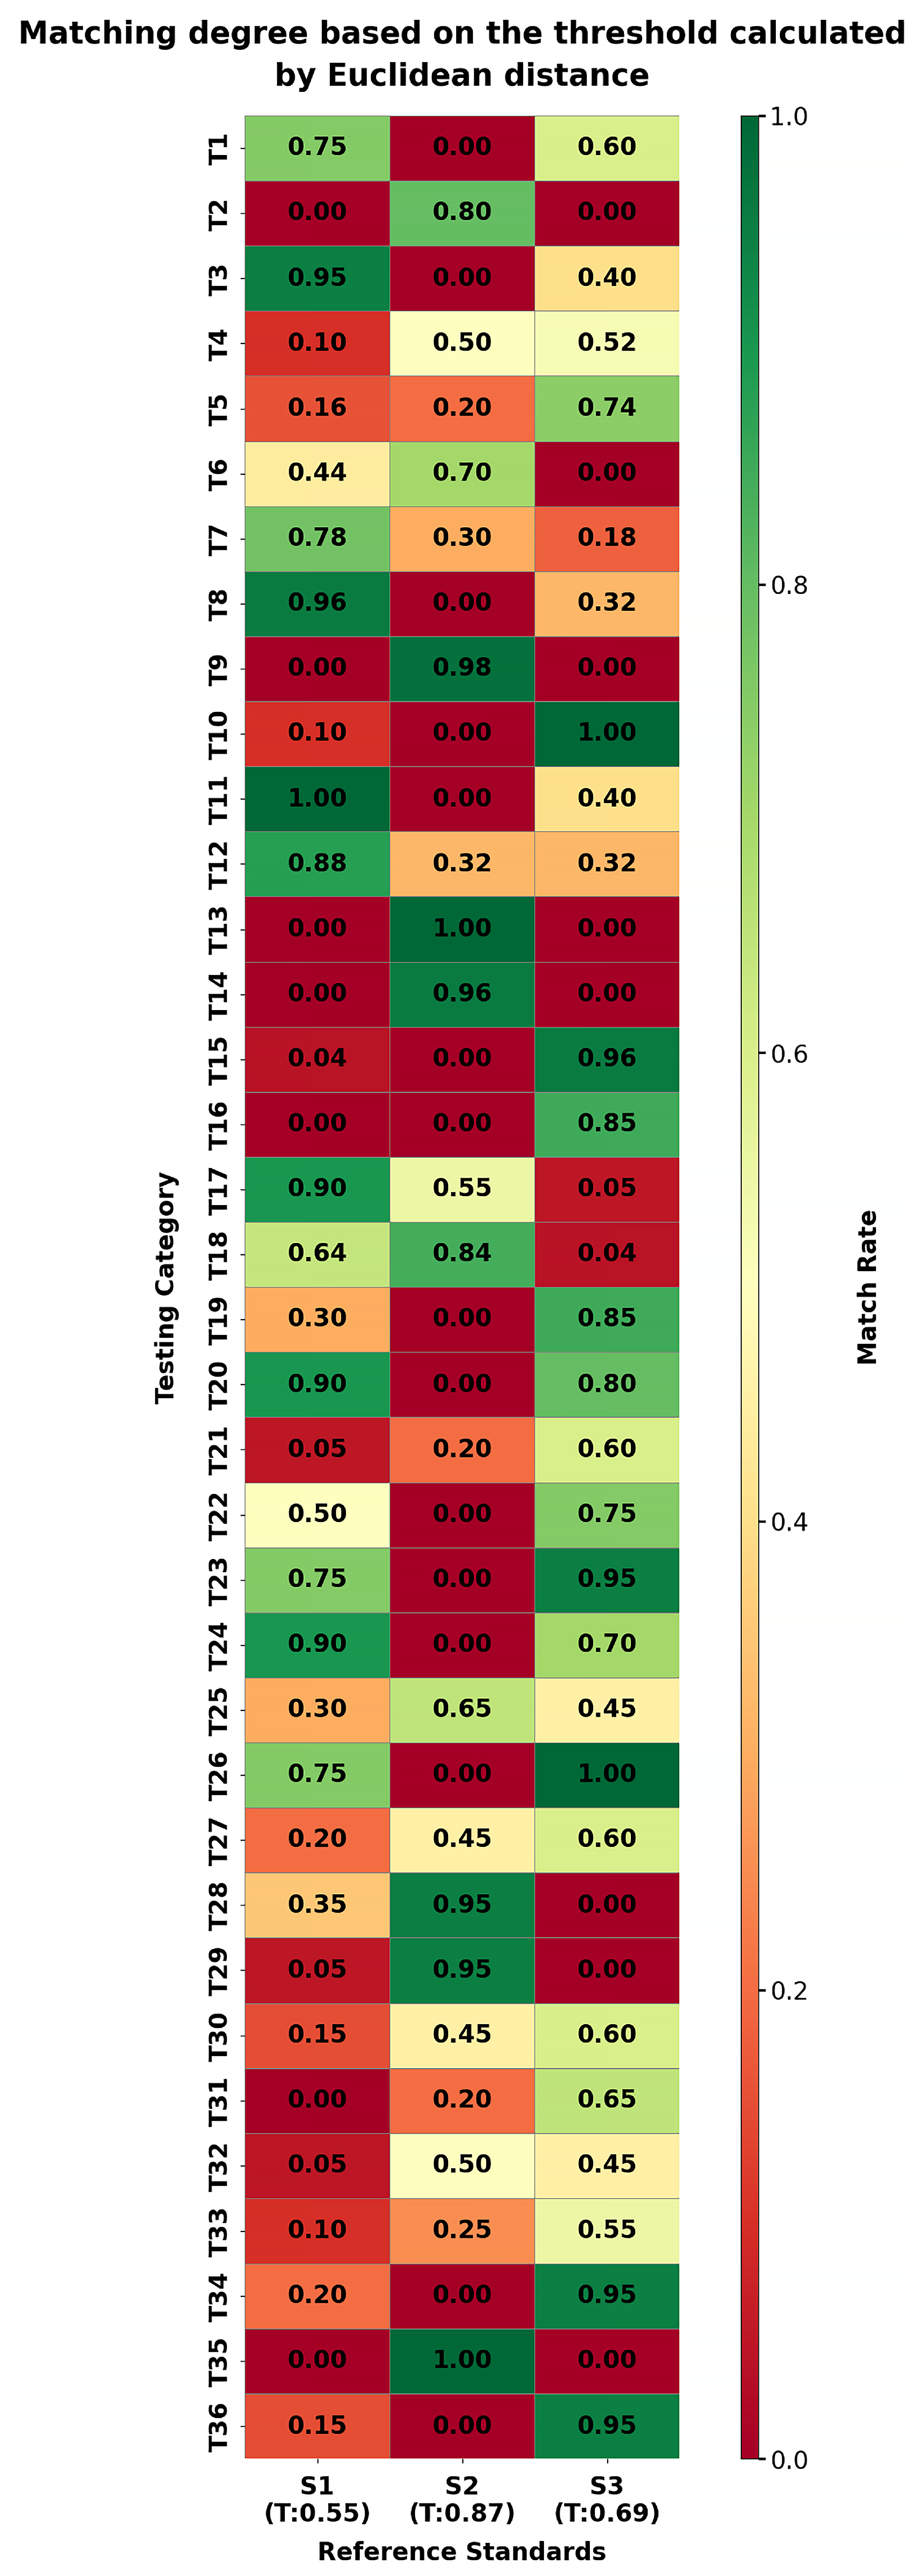
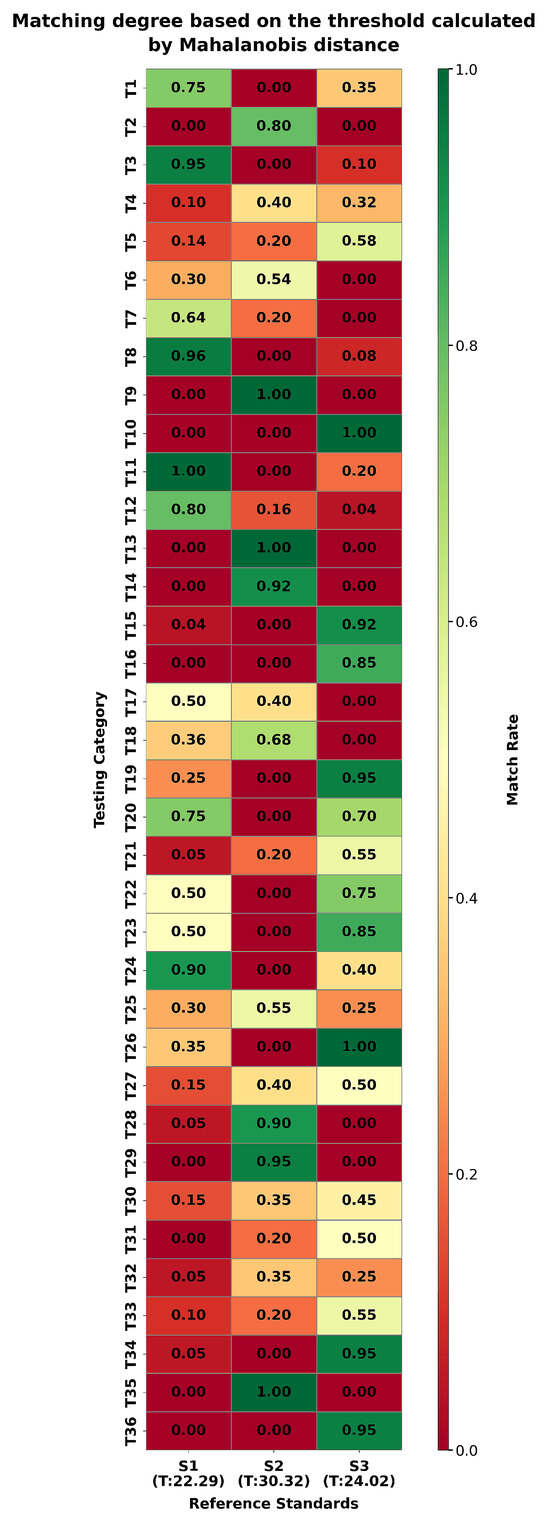
When Mahalanobis distance is applied to the global PCA feature representation, the overall classification accuracy remains at 83.33%, as shown in Figure 12. However, in this case, all 17 labeled test samples exceed the matching threshold and are correctly classified, with matching degrees consistently higher than 0.75. Compared with the class-wise PCA results, the matching degrees of correctly classified reference samples are generally higher, while the matching behavior of unlabeled samples remains largely unchanged. This suggests that Mahalanobis distance is less sensitive to the choice of PCA modeling strategy, likely due to its incorporation of covariance structure in the distance calculation.
Figure 12.
Similarity heatmap based on Mahalanobis distance under the global PCA feature representation. Rows correspond to test samples and columns correspond to reference categories (S1–S3). Color intensity represents the matching degree between test samples and reference categories.
3.3.5. Overall Evaluation
Based on the above analysis, the class-wise PCA method, inspired by the SIMCA approach, demonstrates clear advantages in improving classification performance, particularly when using Euclidean distance for similarity evaluation. By constructing independent PCA models for each reference category, the class-wise PCA framework effectively captures intra-class variance, resulting in higher matching degrees and improved classification accuracy. For instance, when the matching threshold is set to 0.9, the class-wise PCA achieves an impressive classification accuracy of 86.11%, whereas the global PCA approach, which uses a single model for all categories, yields a lower accuracy of 77.7%, largely due to misclassifications among samples with matching degrees above 0.8.
In contrast, for Mahalanobis distance, both the class-wise and global PCA methods yield the same classification accuracy of 83.33%, as shown in Figure 11. While the performance is similar, the class-wise PCA framework remains advantageous in terms of flexibility and better alignment with the inherent structure of each reference category. This makes it more robust in handling data with significant intra-class variance, ensuring a more stable and interpretable similarity distribution.
Overall, the class-wise PCA approach, despite showing a clear improvement in accuracy under Euclidean distance, offers consistent performance under Mahalanobis distance. Its ability to model each reference category separately makes it particularly suitable for cases with notable spectral differences between classes, where it enhances the robustness of distance-based matching and improves classification performance.
4. Conclusions
This study proposes a rapid and non-destructive tea quality assessment approach based on Fourier Transform Near-Infrared Spectroscopy (FT-NIR) for the screening of Mee rough tea samples. Principal Component Analysis (PCA) was applied to reduce the dimensionality of spectral data while preserving essential spectral information and improving computational efficiency. Unlike conventional global PCA approaches, this study employed a category-specific PCA strategy, which effectively reduced inter-category variability and better captured the intrinsic spectral structure within each category, thereby improving classification performance.
To further enhance model reliability, Euclidean distance and Mahalanobis distance were jointly used for similarity evaluation. By constructing PCA subspaces for each reference category, the proposed framework effectively reduced cross-category interference and improved the accuracy of classification decisions. The experimental results demonstrate that the method shows promising feasibility and practical potential for rapid screening of Mee tea samples under the simulated acceptance scenario. In addition, sensitivity analysis under different distance threshold settings further confirms the stability of the proposed approach.
Future research will focus on integrating additional spectral analysis techniques and machine learning algorithms to further improve the accuracy and applicability of tea quality analysis. Expanding the spectral database and increasing the diversity of sample sources will also help improve the generalization capability of the model and support the broader application of intelligent quality control technologies in the tea industry and other agricultural products.
Although the results demonstrate the feasibility of the proposed FT-NIR screening framework, further validation with a larger number of independent reference samples and samples collected from different production batches or seasons will be necessary to comprehensively evaluate the robustness and generalizability of the method. Such studies will help further assess the practical applicability of the proposed approach in real-world industrial scenarios for screening tea quality.
Author Contributions
Conceptualization, L.L. and X.Y.; Methodology, W.Z. and W.H.; Software, W.Z.; Validation, W.Z.; Formal Analysis, W.Z.; Investigation, W.Z.; Resources, L.L. and X.Y.; Data Curation, W.Z.; Writing—Original Draft Preparation, W.Z.; Writing—Review and Editing, W.Z., L.L. and W.H.; Visualization, W.Z.; Supervision, L.L. and X.Y.; Project Administration, L.L. and X.Y.; funding acquisition, X.Y. All authors have read and agreed to the published version of the manuscript.
Funding
This work was supported by the research project titled “Study on optical properties of spectral vision systems” and funded by Sun Yat-Sen University, China under Grant 74130-71010023.
Institutional Review Board Statement
Not applicable.
Informed Consent Statement
Not applicable.
Data Availability Statement
The data that support the findings of this study are available from the corresponding author upon reasonable request.
Acknowledgments
The authors would like to express their sincere gratitude to Li Luo of the School of Physics and Optoelectronic Engineering, Guangdong University of Technology, China, and Xiangyang Yu of the School of Physics, Sun Yat-sen University, for their expert guidance and steadfast academic support, which were instrumental in the completion of this research and manuscript.
Conflicts of Interest
Weibin Hong is an employee of Guangzhou Guangxin Technology Co., Ltd. Xiangyang Yu is affiliated with Guangzhou Guangxin Technology Co. Ltd. The remaining authors declare that the research was conducted in the absence of any commercial or financial relationships that could be construed as a potential conflict of interest.
References
- Gong, S.Y. Technical Know-How of “Blending” in Tea Refining Process. J. Tea 1994, 20, 35–38. (In Chinese) [Google Scholar]
- GB/T 23776-2018; National Tea Standardization Technical Committee (SAC/TC 339). Methodology for Sensory Evaluation of Tea. China Standards Press: Beijing, China, 2018.
- Qi, D.; Miao, A.; Cao, J.; Wang, W.; Chen, W.; Peng, S.; He, X.; Ma, C. Study on the Effects of Rapid Aging Technology on the Aroma Quality of White Tea Using GC–MS Combined with Chemometrics: In Comparison with Natural Aged and Fresh White Tea. Food Chem. 2018, 265, 189–199. [Google Scholar] [CrossRef] [Scilit]
- Huertas-Pérez, J.F.; Baslé, Q.; Dubois, M.; Feraud, E.; Boly, S.; Jamin, E.L.; Debrauwer, L.; Bichon, E.; Perdu, E. Multi-residue Pesticides Determination in Complex Food Matrices by Gas Chromatography Tandem Mass Spectrometry. Food Chem. 2024, 436, 137687. [Google Scholar] [CrossRef] [Scilit]
- Gong, S.Y. Lecture One: Purchase and Grading of Raw Tea. China Tea Processing 1994, 47, 36–37. [Google Scholar] [CrossRef]
- Dai, Q.L.; Liu, G.Q.; Zhang, R.; Niu, M.S.; Tu, T.Y.; Wang, S.T.; Shen, C.H.; Zheng, L. Quantitative Description Analysis of Black Tea Aroma Characteristics and Construction of Black Tea Aroma Flavor Wheel. Food Ferment. Sci. Technol. 2023, 59, 103–108. [Google Scholar] [CrossRef]
- Wang, J.; Wu, X.; Zheng, J.; Liu, H.; Dai, X.; Ye, Q.; Cai, S. Rapid Identification of Green Tea Varieties Based on FT-NIR Spectroscopy and LDA/QR. Food Sci. Technol. 2022, 42, e73022. [Google Scholar] [CrossRef] [Scilit]
- Bai, X.; Zhang, L.; Kang, C.; Liu, X.; Ye, X. Near-Infrared Spectroscopy and Machine Learning-Based Technique to Predict Quality-Related Parameters in Instant Tea. Sci. Rep. 2022, 12, 3833. [Google Scholar] [CrossRef] [Scilit] [PubMed]
- Peng, Q.; Liu, Y.; Yu, J.; Wei, X.; Tang, Y. Identification of Meitan Cuiya Tea Grades Based on Visible-Near-Infrared Technology. J. Tea Sci. 2017, 37, 458–464. [Google Scholar] [CrossRef]
- Zhao, L. Study on Several Machine Learning Methods in the Tea Blending Process. Ph.D. Dissertation, Anhui Agricultural University, Hefei, China, 2023. [Google Scholar] [CrossRef]
- Guo, Y.D.; Niu, Z.Y. Correlation Analysis of Different Morphology and Quality of Lu’an Guapian Based on Near-Infrared Spectroscopy. J. Anhui Agric. Univ. 2025, 52, 556–564. [Google Scholar] [CrossRef]
- Luo, W.; Tian, P.; Fan, G.; Yang, G.; Guo, C.; Chen, Z.; Zhang, X.; Xia, H. Non-destructive Determination of Four Tea Polyphenols in Fresh Tea Using Visible and Near-Infrared Spectroscopy. Infrared Phys. Technol. 2022, 123, 104037. [Google Scholar] [CrossRef] [Scilit]
- Chen, K.; Gao, Y.; Zhang, Z.; Huang, H.; Zheng, J.; Du, H.; Li, X. Intelligent Non-Destructive Biosensing of Fresh Tea Leaves by Portable Spectroscopy and Enhanced Transformer. Food Control 2025, 178, 111527. [Google Scholar] [CrossRef] [Scilit]
- Tao, L.Z. Discussion on Ways to Improve Product Quality in Refined Tea Factories. J. Tea Bus. 1989, 28–34. [Google Scholar] [CrossRef]
- Zheng, L.S. Blending Technology of Roasted Green Tea Products. J. Tea Bus. 1992, 38–39. [Google Scholar] [CrossRef]
- Jiang, Q.; Chen, B.; Chen, J.; Zeng, J.; Yang, X.; Wu, M.; Li, D. Non-Destructive Analysis for Machine-Picked Tea Leaf Composition Using Near-Infrared Spectroscopy Combined Chemometric Methods. Processes 2024, 12, 2397. [Google Scholar] [CrossRef] [Scilit]
- Ye, S.; Weng, H.; Xiang, L.; Jia, L.; Xu, J. Synchronously predicting tea polyphenol and epigallocatechin gallate in tea leaves using Fourier transform–near-infrared spectroscopy and machine learning. Molecules 2023, 28, 5379. [Google Scholar] [CrossRef] [Scilit] [PubMed]
- Yan, C. A Review on Spectral Data Preprocessing Techniques for Machine Learning and Quantitative Analysis. iScience 2025, 28, 112759. [Google Scholar] [CrossRef] [Scilit]
- Rinnan, Å.; van den Berg, F.; Engelsen, S.B. Review of the Most Common Pre-processing Techniques for Near-Infrared Spectra. TrAC Trends Anal. Chem. 2009, 28, 1201–1222. [Google Scholar] [CrossRef] [Scilit]
- Wan, C.; Yue, R.; Li, Z.; Wang, L.; Wang, Y. Prediction of Kiwifruit Sweetness with Vis/NIR Spectroscopy Based on Scatter Correction and Feature Selection Techniques. Appl. Sci. 2024, 14, 4145. [Google Scholar] [CrossRef] [Scilit]
- Zhou, X.; Wu, X.; Wu, B. Comparative Study of Indirect and Direct Feature Extraction Algorithms in Classifying Tea Varieties Using Near-Infrared Spectroscopy. Curr. Res. Food Sci. 2025, 10, 101065. [Google Scholar] [CrossRef] [Scilit] [PubMed]
- Yang, Z.; Lu, X.; Chen, L. Discriminating the Adulteration of Varieties and Misrepresentation of Vintages of Pu’er Tea Based on Fourier Transform Near Infrared Diffuse Reflectance Spectroscopy. Front. Chem. 2025, 13, 1546702. [Google Scholar] [CrossRef] [Scilit]
- Liu, P.; Wen, Y.; Huang, J.; Liu, F.; Zhou, L.; Liu, Z. A Novel Strategy of Near-Infrared Spectroscopy Dimensionality Reduction for Discrimination of Grades, Varieties and Origins of Green Tea. Vib. Spectrosc. 2019, 105, 102984. [Google Scholar] [CrossRef] [Scilit]
- Wu, B.; Tang, W.; Zhou, J.; Li, B.; Liu, H.; Tang, L.; Lu, Y. Near-Infrared Spectroscopy Combined with Fuzzy Fast Pseudoinverse Linear Discriminant Analysis to Discriminate Mee Tea Grades. Heliyon 2024, 10, e27732. [Google Scholar] [CrossRef] [Scilit] [PubMed]
- Zhu, M.Z.; Wen, B.; Wu, H.; Ma, J.; Li, P.L.; Zhang, L.; Wei, K.; Cheng, H. The Quality Control of Tea by Near-Infrared Reflectance (NIR) Spectroscopy and Chemometrics. J. Spectrosc. 2019, 2019, 8129648. [Google Scholar]
- Loewen, S.; Gonulal, T. Exploratory factor analysis and principal components analysis. In Advancing Quantitative Methods in Second Language Research; Routledge: New York, NY, USA, 2015; pp. 182–212. [Google Scholar]
- El Maouardi, M.; Alaoui Mansouri, M.; De Braekeleer, K.; Boukroute, A.; Kzaiber, F.; Berkia, A.; Hanine, H. Evaluation of Multivariate Filters on Vibrational Spectroscopic Fingerprints for the PLS-DA and SIMCA Classification of Argan Oils from Four Moroccan Regions. Molecules 2023, 28, 5698. [Google Scholar] [CrossRef] [Scilit]
- Yang, Y.; Ma, S.; Qi, F.; Yan, J.; Cui, W.; Wei, Y.; Lu, Z.; Wang, W. Application of Vis/NIR Spectroscopy in the Rapid and Non-Destructive Prediction of Soluble Solid Content in Milk Jujubes. Agriculture 2025, 15, 1382. [Google Scholar]
- Wang, Y.; Chen, Z.; Liu, J.; Zhang, Y.; Zhang, L. Outlier Identification Method Based on Multi-Model Weighted Consensus in Conjunction with Monte Carlo Cross-Validation. J. AOAC Int. 2025, 108, 818–827. [Google Scholar] [CrossRef] [Scilit]
- Wang, Y.; Wang, K.; Zhou, Z.; Wu, D.; Zhang, Y.; Liu, J. Modeling of Oil Near-Infrared Spectroscopy Based on Similarity and Transfer Learning Algorithm. Front. Chem. Sci. Eng. 2019, 13, 599–607. [Google Scholar] [CrossRef] [Scilit]
- Zhang, H.; Li, L.; Quan, S.; Guo, D.; Yang, X.; Wang, L.; Ding, Y.; Luo, L. Novel Similarity Methods Evaluation and Feasible Application for Pharmaceutical Raw Material Identification with Near-Infrared Spectroscopy. ACS Omega 2020, 5, 29864–29871. [Google Scholar] [CrossRef] [Scilit]

Disclaimer/Publisher’s Note: The statements, opinions and data contained in all publications are solely those of the individual author(s) and contributor(s) and not of MDPI and/or the editor(s). MDPI and/or the editor(s) disclaim responsibility for any injury to people or property resulting from any ideas, methods, instructions or products referred to in the content. |
© 2026 by the authors. Licensee MDPI, Basel, Switzerland. This article is an open access article distributed under the terms and conditions of the Creative Commons Attribution (CC BY) license.