


Abstract
Protein kinases are the most intensively targeted protein family for small-molecule drugs, and the large volume of inhibitory-assay data reported for them makes the family particularly well suited to data-driven and machine-learning approaches to drug discovery. This data, however, is scattered across heterogeneous assays, reports and publications, and its reuse for modeling requires substantial curation. Here, we present Kinoteca, a curated database of kinase inhibitory-activity data derived from ChEMBL and accessible through a web interface for browsing, filtering, visualization and download. Kinoteca reconciles the multiple raw independent measurements reported for each combination of compound, kinase and activity type into a single fused activity value, together with a dispersion score based on the mean unsigned error (MUE) that quantifies how consistent the underlying measurements were. The database currently organizes curated data for 585 kinases and arranges them along biologically meaningful groupings such as kinome family, pathway and source organism. Curated activities can be filtered by the physicochemical properties of the assayed molecules or by measurement quality, explored through summary statistics, activity distributions and structural clustering, and exported either as curated or semi-raw data tables or as molecular structure files. These data formats are suitable for the direct training of machine learning models, such as activity prediction models. By delivering reconciled, analysis-ready data with its provenance preserved, Kinoteca aims to lower the barrier to reproducible, data-driven kinase drug discovery.
1. Introduction
Protein kinases catalyze the transfer of a phosphate group from ATP to substrate proteins and thereby regulate nearly every aspect of cellular signalling, including proliferation, differentiation, metabolism, migration, and apoptosis. The human genome encodes more than 500 protein kinases, collectively termed the kinome, which are organized into families and subfamilies that share a conserved catalytic domain [1]. As the dysregulation of kinase activity through mutation, overexpression, or aberrant signalling drives many cancers, as well as inflammatory, metabolic, and neurodegenerative disorders, protein kinases have become one of the central target families of modern drug discovery [2].
The sustained interest in kinases has translated into a remarkable therapeutic output. Since the approval of imatinib in 2001, more than 90 small-molecule protein kinase inhibitors have been approved by the FDA, the large majority of them for the treatment of neoplasms, and every approved kinase inhibitor to date is a small molecule [3]. Although the therapeutic landscape has broadened to include immunotherapies, antibody–drug conjugates, and targeted protein degraders such as PROTACs, protein kinases continue to dominate the development of small-molecule anticancer agents [2]. A recurring challenge in this field is selectivity: Because the catalytic site is conserved across the kinome, inhibitors frequently act on multiple kinases. Therefore, understanding the full activity profile of a compound across many targets is essential for both efficacy and safety [2].
The decades of medicinal-chemistry research devoted to this family have generated an exceptionally large body of quantitative inhibition data. This accumulation has coincided with the rapid development of the artificial intelligence field, and machine learning models are now routinely used to predict kinase inhibition and to prioritize compounds for experimental evaluation by learning from the data available for a target family [2,4]. The performance of such models, however, depends critically on the quality and consistency of their training data. For any given combination of compound, kinase and activity type, the primary literature typically reports several independent measurements originating from different assays, and these values are frequently sparse, mutually inconsistent, or reported only as inequalities such as “greater than 10 μM” [4]. Combining and cross-checking measurements from multiple records has been shown to improve confidence and to expose likely errors, which makes such consensus curation directly valuable for downstream modeling. Yet before this data can be used, it must be retrieved, reconciled, quality-filtered and reshaped into an analysis-ready form, an effort that is repeated across research groups and rarely shared.
Currently available resources address parts of this problem but leave a gap for kinase-focused, model-ready activity data. General bioactivity repositories such as ChEMBL [5] and BindingDB [6] are comprehensive and authoritative, but they expose data at the level of individual reported measurements and are not specific to kinases. Kinase-specific resources, in turn, have largely emphasized structure: KLIFS, for example, provides detailed structural kinase–ligand interaction data derived from crystallographic structures [7], and more recent efforts such as KLSD organize kinase–ligand activities extracted from ChEMBL for similarity and selectivity analyses [8]. A broader survey of publicly available kinase-related repositories and tools, including general-purpose interaction browsers, kinase-substrate and kinase-fusion resources, and selectivity-profiling servers, is provided in Appendix A: Table A1 summarizes the scope, linked source databases, and species coverage of each resource, while Table A2 details their data-curation approach together with data-download and source-code availability. Across this landscape, a gap still remains for a kinase-dedicated database that reconciles redundant activity measurements into curated consensus values, records an explicit measure of their reliability, and packages the result for direct reuse in machine learning.
Here, we present Kinoteca, a curated database that fills this gap. Kinoteca compiles kinase inhibitory-activity data derived largely from ChEMBL and applies a structured curation pipeline that reconciles redundant measurements into a single consensus value per compound, kinase and activity type, accompanied by an explicit reliability score and by full provenance back to the records it was built from. It is deliberately positioned as a data-curation and data-exploration resource rather than a predictive-modeling product: It does not fit models or generalize beyond the data it contains but delivers datasets ready to train them. The database currently covers 585 kinases, cross-classified along biologically meaningful dimensions, such as kinome family, pathway and source organism, so that a training set can be assembled for a single target, for a disease-associated or family group or for the kinases of a given organism. A web interface lets users filter the resulting chemical library by activity range, physicochemical properties and measurement quality, and users can export the results in formats suitable for machine learning workflows. Table 1 contrasts Kinoteca with the resources discussed above along the axes that matter for model-ready reuse. Kinoteca is freely available at https://gqc.quimica.unlp.edu.ar/kinoteca/ (accessed on 30 June 2026).
Table 1.
Comparison of Kinoteca with the most closely related bioactivity and kinase resources. ✓: feature present; –: absent or not applicable.
2. Results
2.1. Database Content and Organization
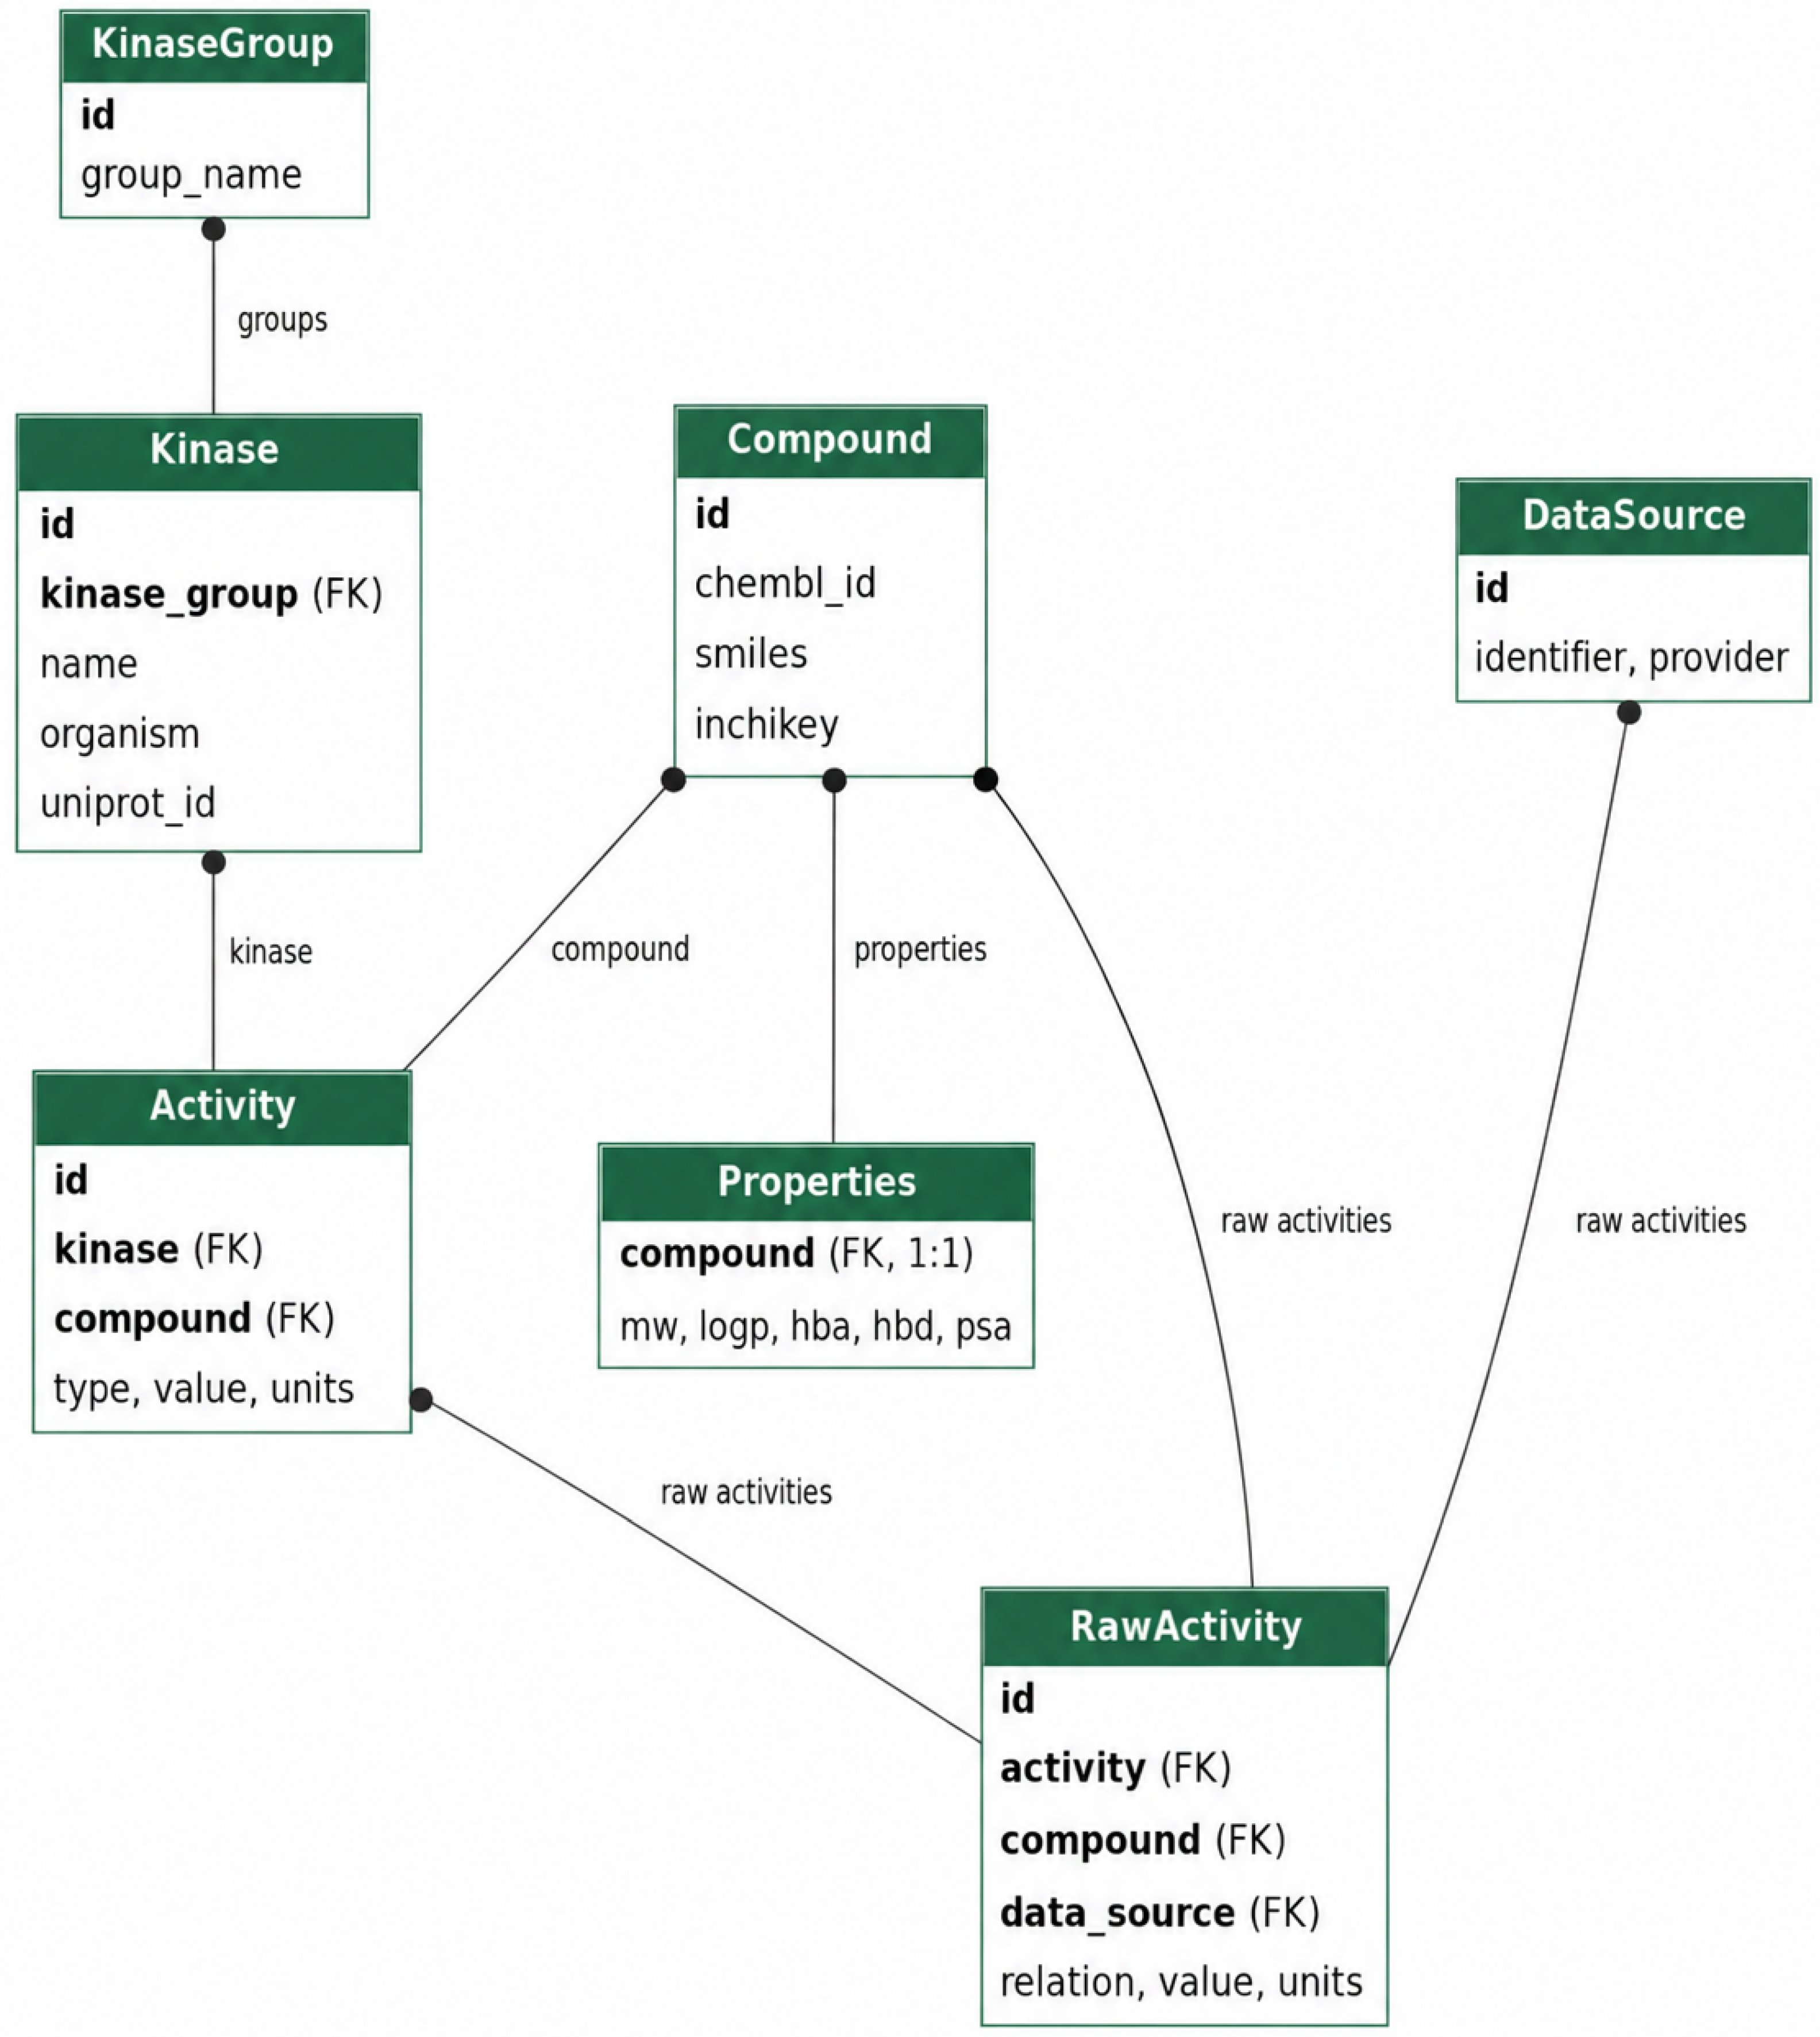
Kinoteca currently organizes curated kinase inhibitory-activity data for 585 kinases. Each kinase is described by its UniProt AC together with its kinome classification, ChEMBL target identifier, sequence length, and pharmacology summaries. Beyond this fixed set of fields, kinases are cross-classified into curator-managed grouping dimensions such as kinome family, biological pathway and source organism so that a user can select targets not only individually but also by biologically meaningful membership. Because these grouping dimensions are data-driven rather than hard-coded, new dimensions can be added as richer upstream annotation becomes available, without any change to the schema. The overall content of the database at the current release is summarized in Table 2; the core entities and their relationships are shown in Figure 1, and the role of each entity is listed in Table 3.
Table 2.
Summary of the Kinoteca database content at the current release.
Figure 1.
Simplified schema of the Kinoteca database models and relations between them.
Table 3.
Core entities of the Kinoteca data model and their role.
2.2. The Kinoteca Filtering Wizard
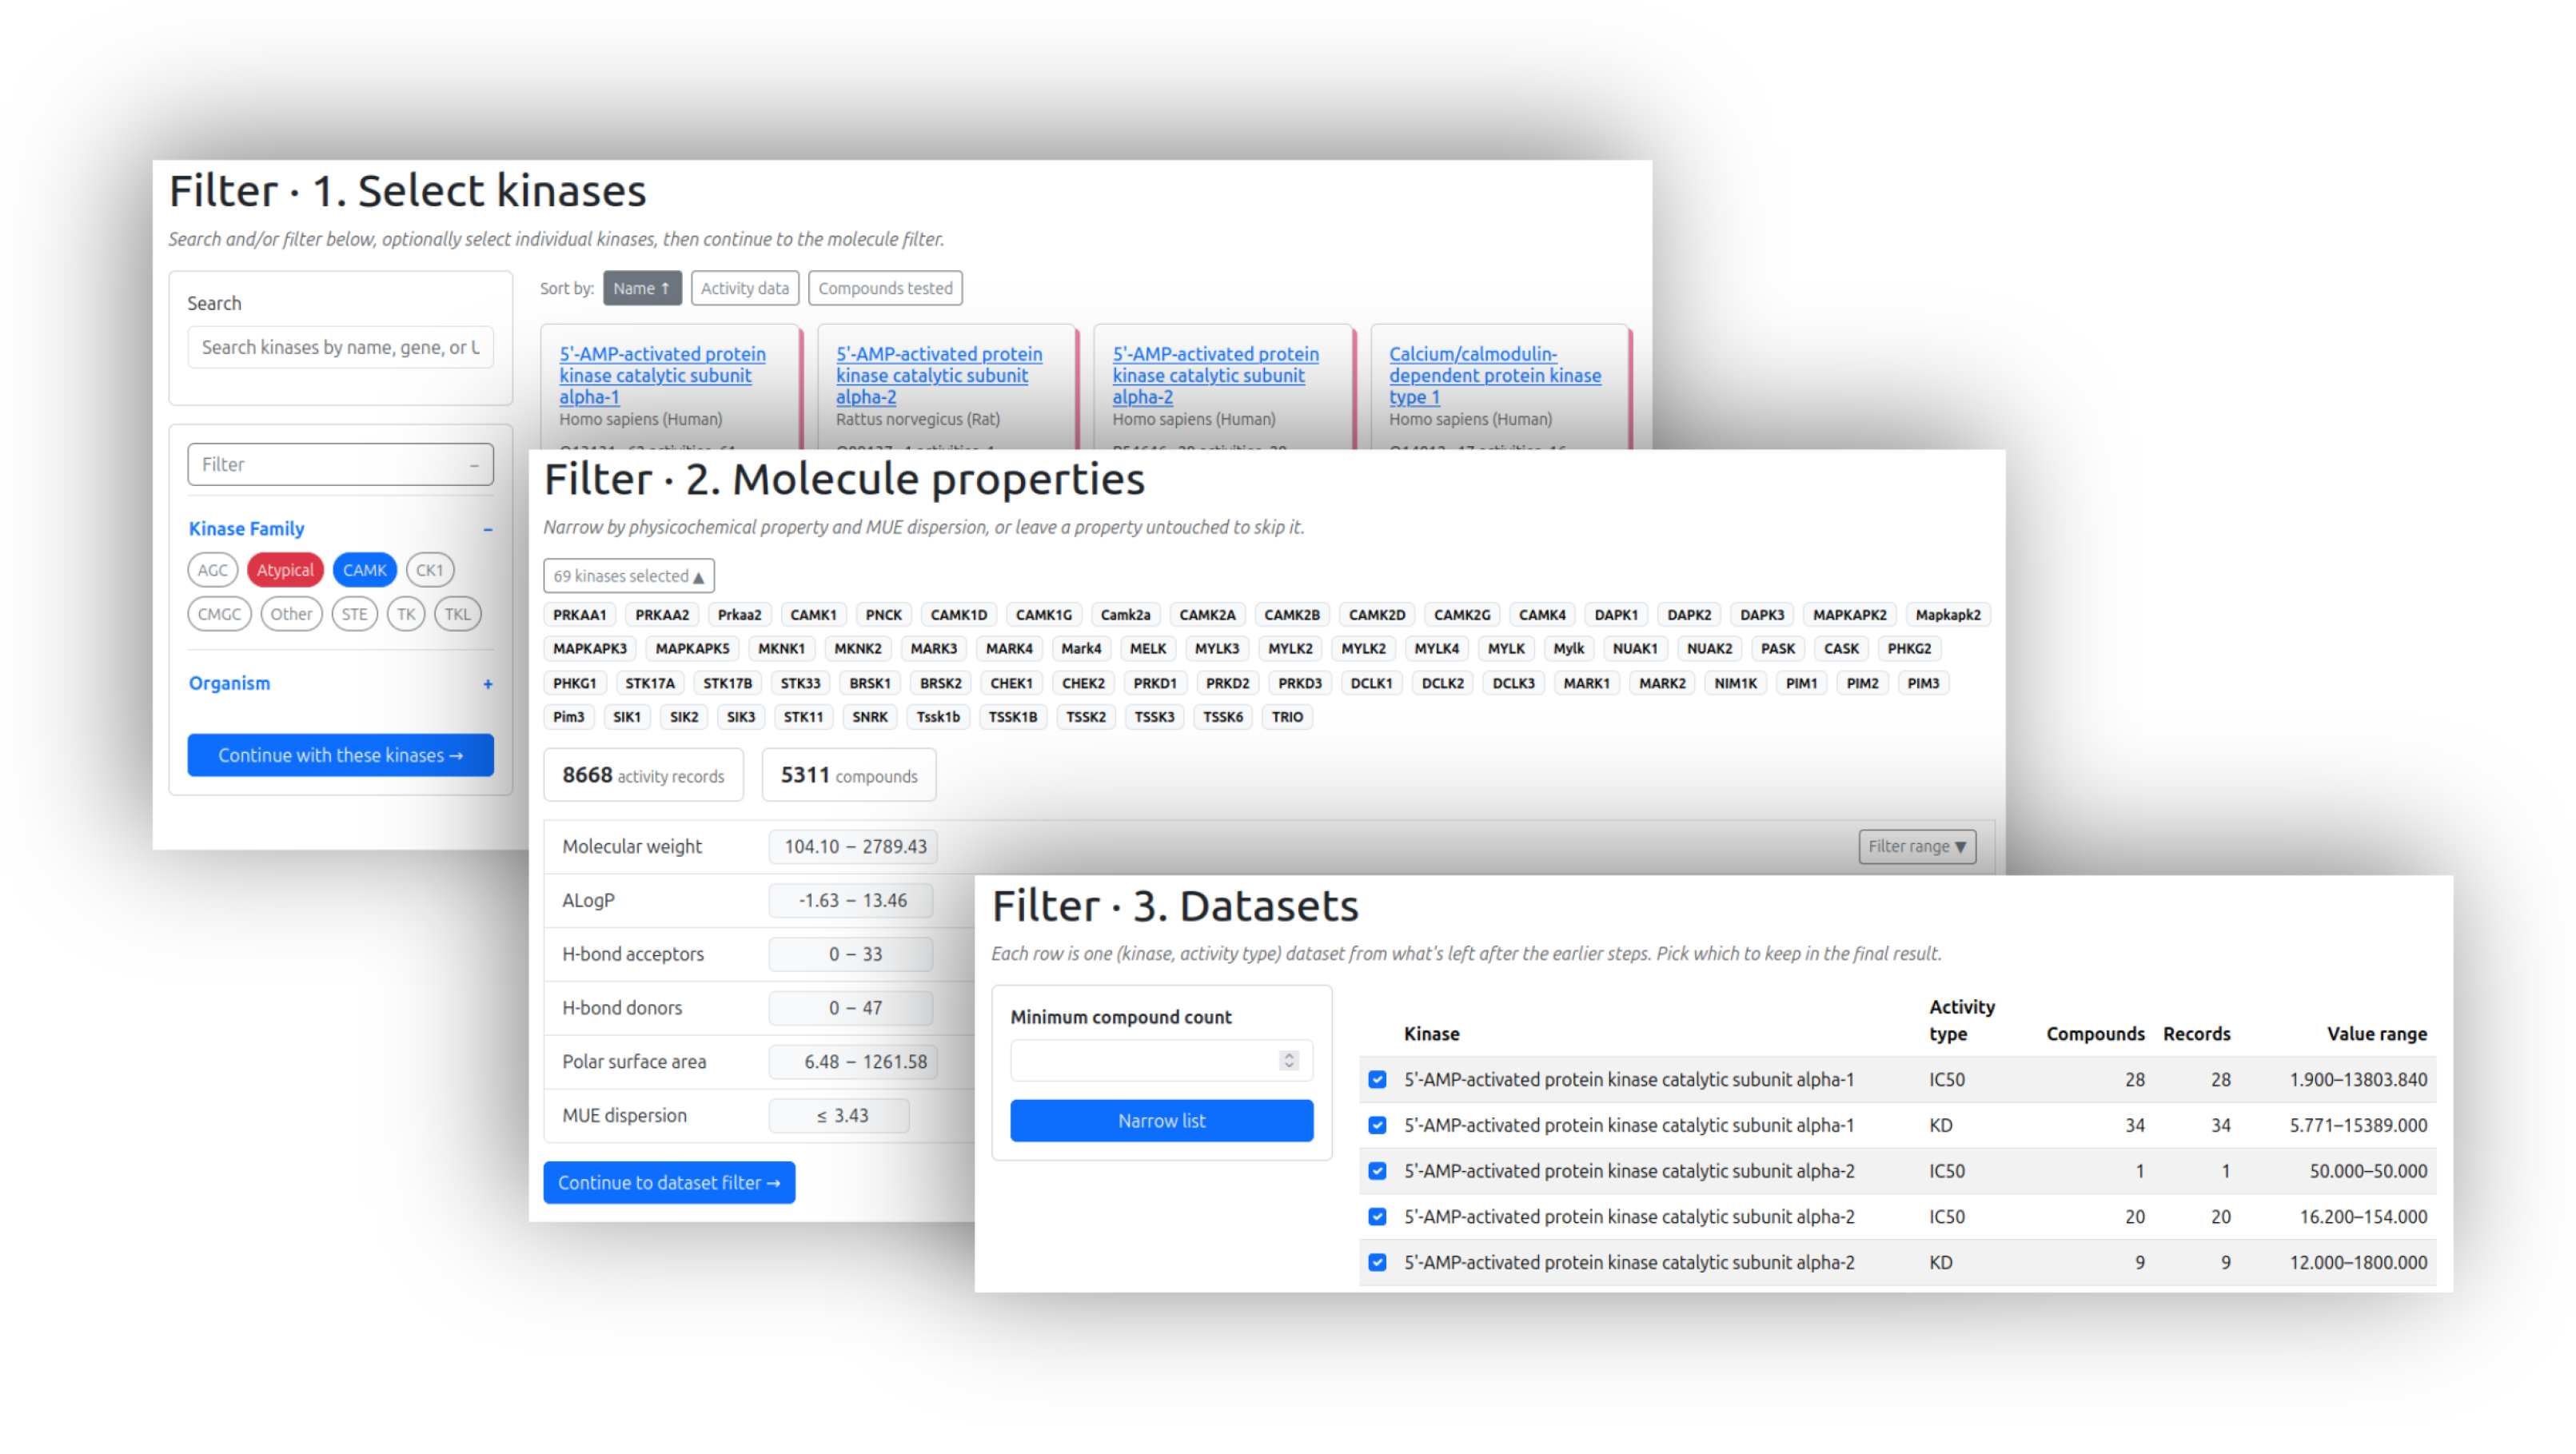
The principal way in which users interact with the data is a three-stage filtering wizard, designed to take a researcher from a target-selection question to a curated, analysis-ready dataset (Figure 1 illustrates the underlying data these stages traverse).
- Select Kinases. Targets are chosen by name, gene or UniProt search, and/or by curated group-membership facets (kinome family, pathway, source organism, and other dimensions).
- Filter Molecules. The candidate compound set is narrowed by physicochemical properties (molecular weight, ALogP, polar surface area, and hydrogen-bond donor and acceptor counts) and by measurement-dispersion quality (the MUE score), with live histograms showing how each threshold affects the result as it is dragged.
- Select Datasets. The user chooses which (kinase and activity-type) combinations to include in the final result, and they are optionally pre-filtered by a minimum compound count so that sparsely populated combinations can be excluded.
Because filtering on the MUE dispersion score is exposed directly in the wizard, users can trade dataset size against measurement reliability, retaining only tightly reconciled activity values when high confidence is required or relaxing the threshold to maximize coverage. A completed run is persisted as a single result object owned by the user, together with a snapshot of the exact criteria that produced it (Figure 2).
Figure 2.
The Kinoteca filtering wizard, showing the progression from kinase selection through molecular-property filtering to dataset selection.
2.3. Result Exploration and Visualization
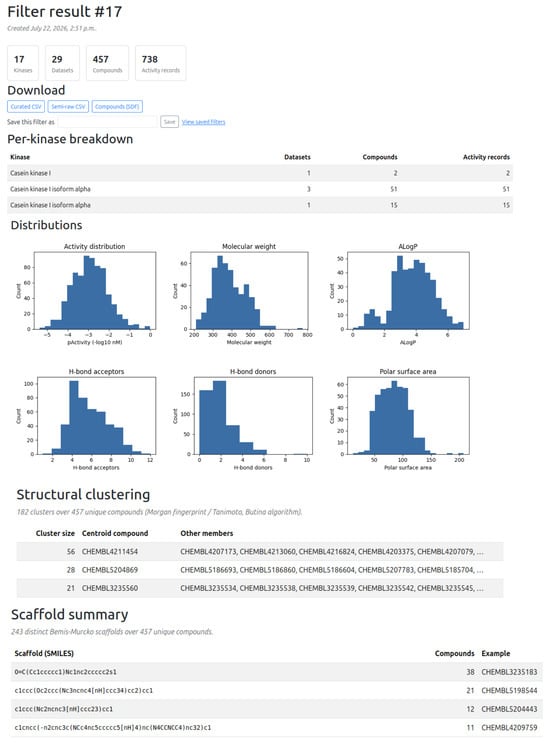
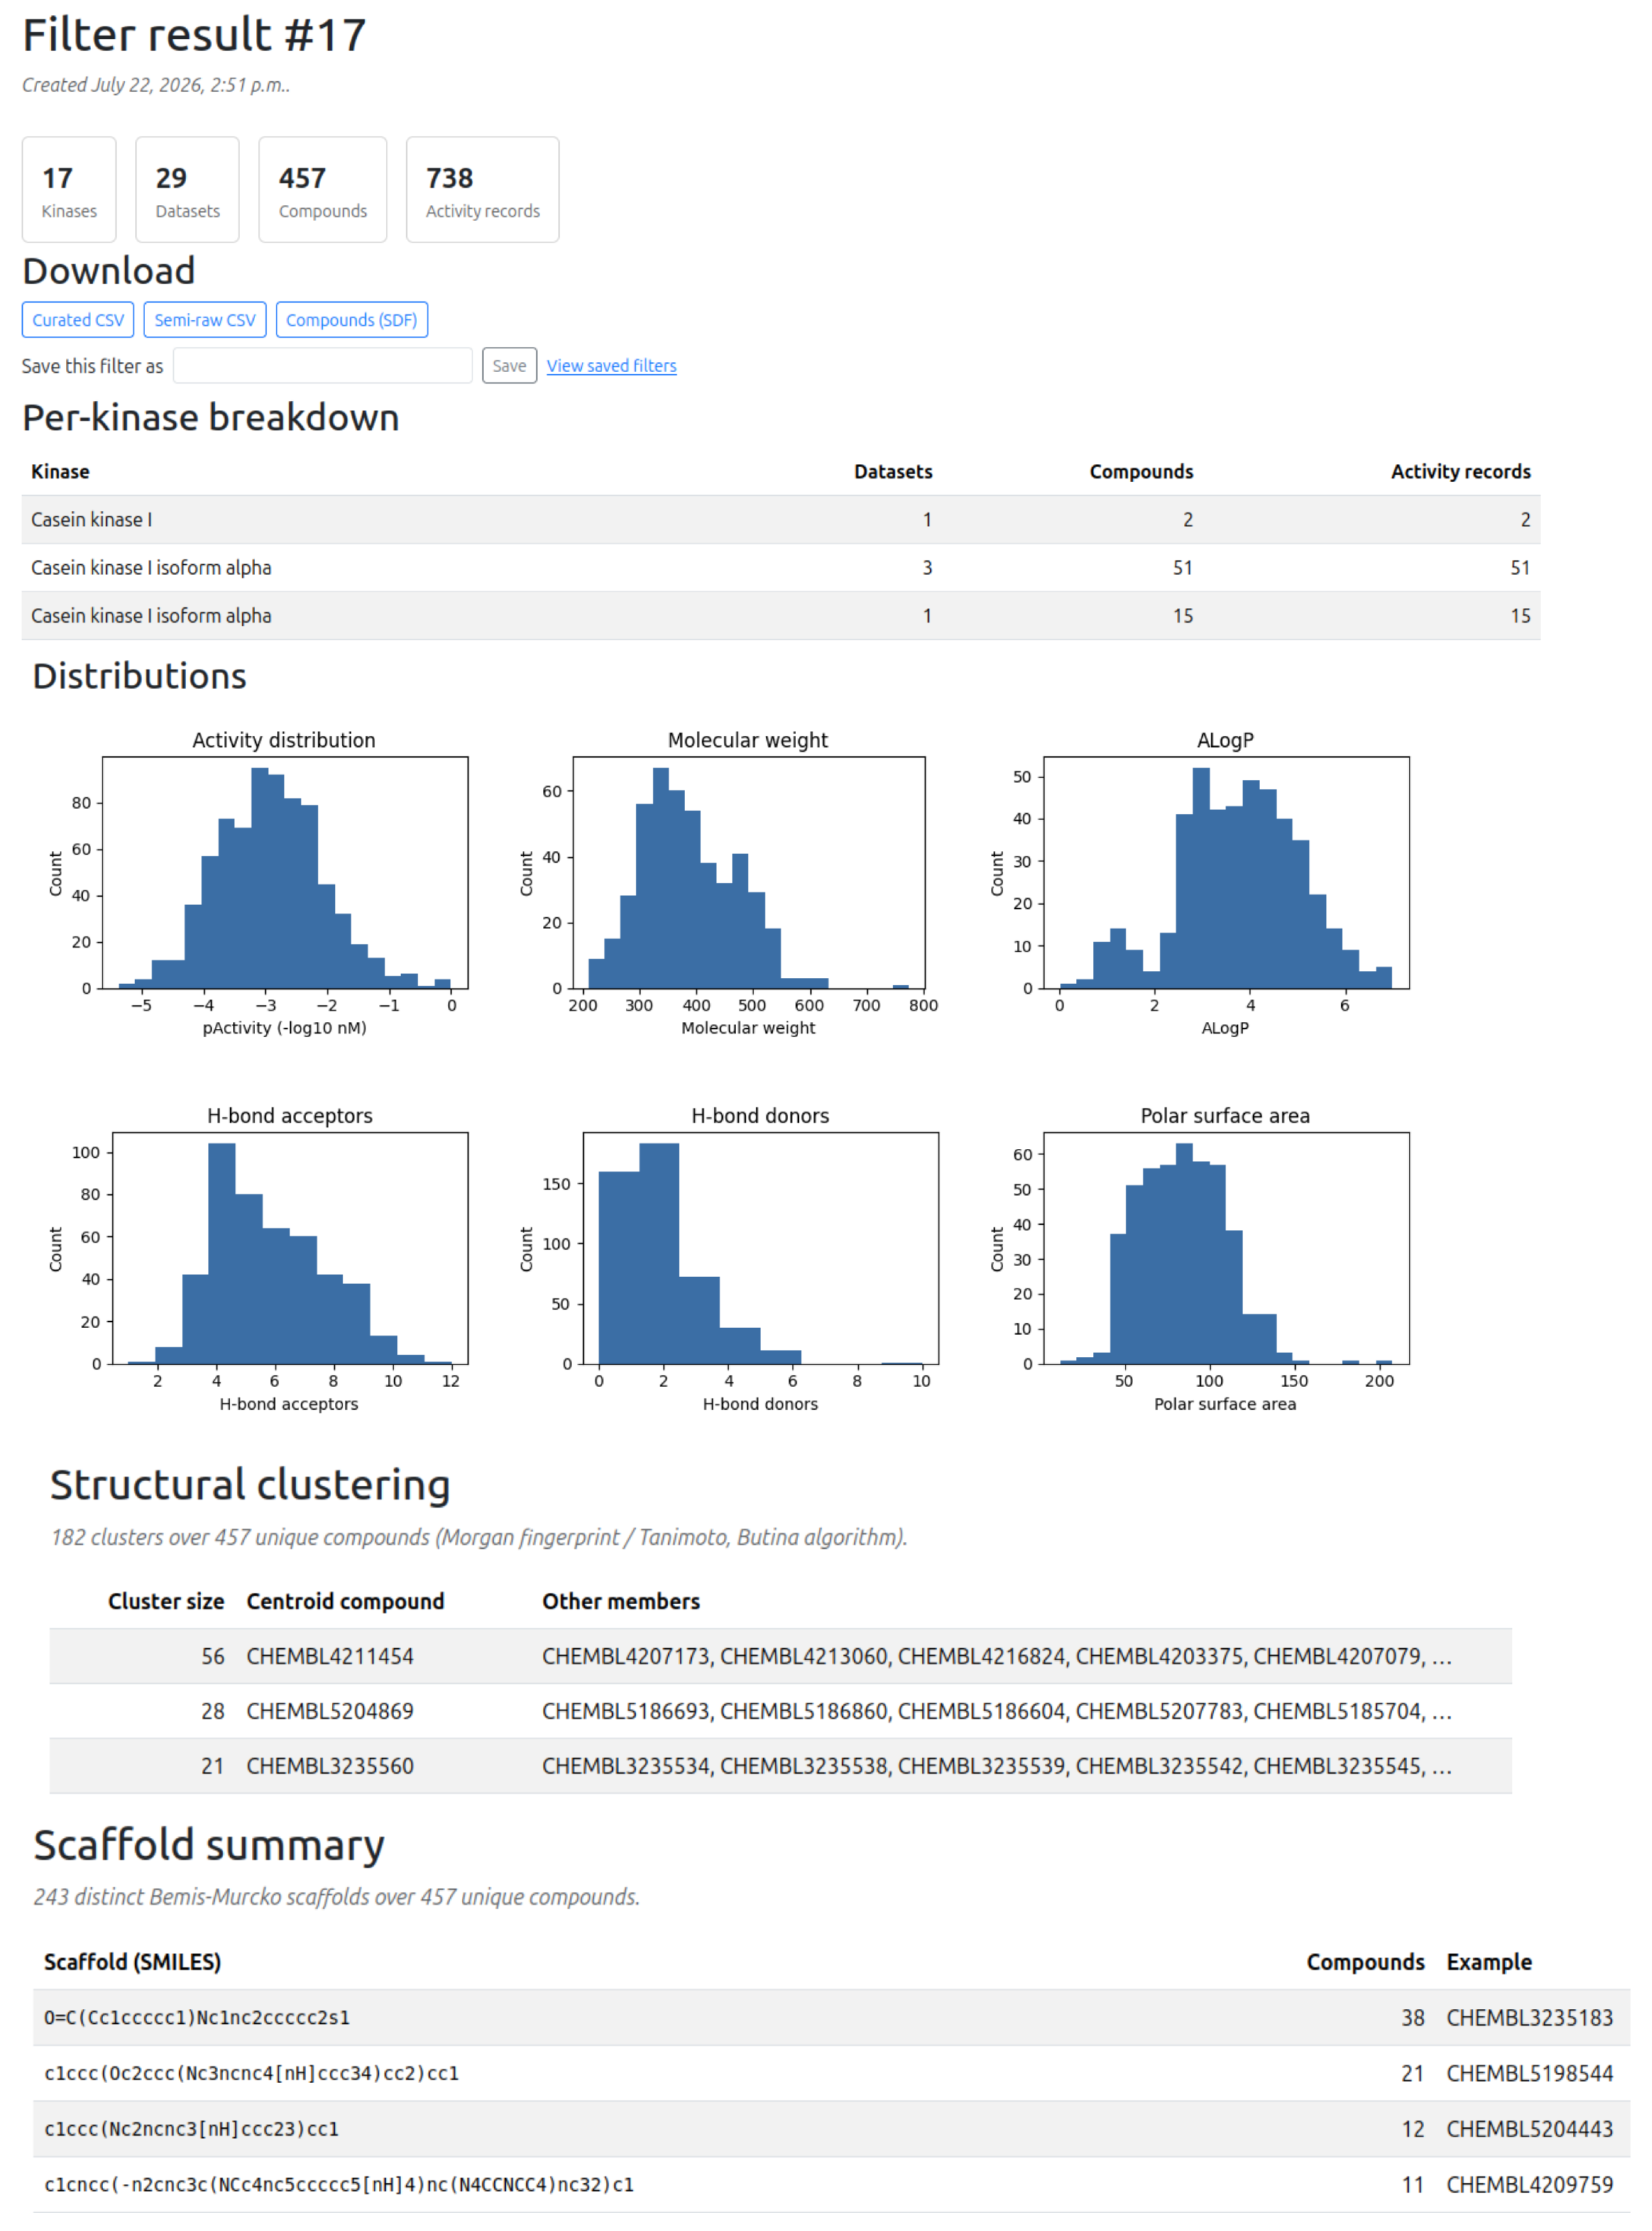
Once a result set has been produced, it can be inspected without leaving the database interface. Kinoteca reports summary statistics and per-kinase breakdowns, renders activity-distribution histograms, and groups the compounds structurally by Butina/Tanimoto clustering [9] and by Bemis–Murcko scaffolds [10] (Figure 3). These views let a user assess the size, potency profile, and chemical diversity of a candidate training set before committing to it. Structural clustering is computed on demand and is capped at 500 unique compounds to bound its quadratic cost, whereas scaffold grouping is applied without such a limit.
Figure 3.
Exploration of a Kinoteca result set, combining summary statistics, activity histograms and structure-based groupings. Adapted to fit page layout.
2.4. Data Export Formats
The same result set can be exported in four complementary forms, chosen to serve different downstream needs (Table 4). A curated CSV provides one row per fused activity value and is the most direct input for model training; a Semi-Raw CSV provides one row per individual pre-fusion measurement, retaining source and assay provenance for users who wish to apply their own reconciliation; a structure SDF provides one molblock per compound, tagged with physicochemical properties and activities, for cheminformatics tools that operate on molecular structures. Alternatively, a filter definition can be saved as a named, reusable object that stores only its criteria so that re-running it later re-executes the pipeline against whatever data exists at that time rather than returning a frozen snapshot; the results therefore track data updates automatically instead of going stale.
Table 4.
Export formats offered for a Kinoteca result set.
2.5. Kinase Detail Pages
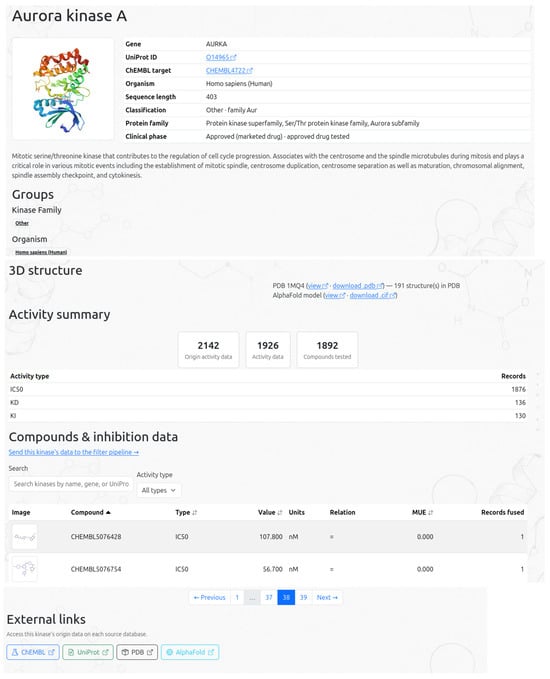
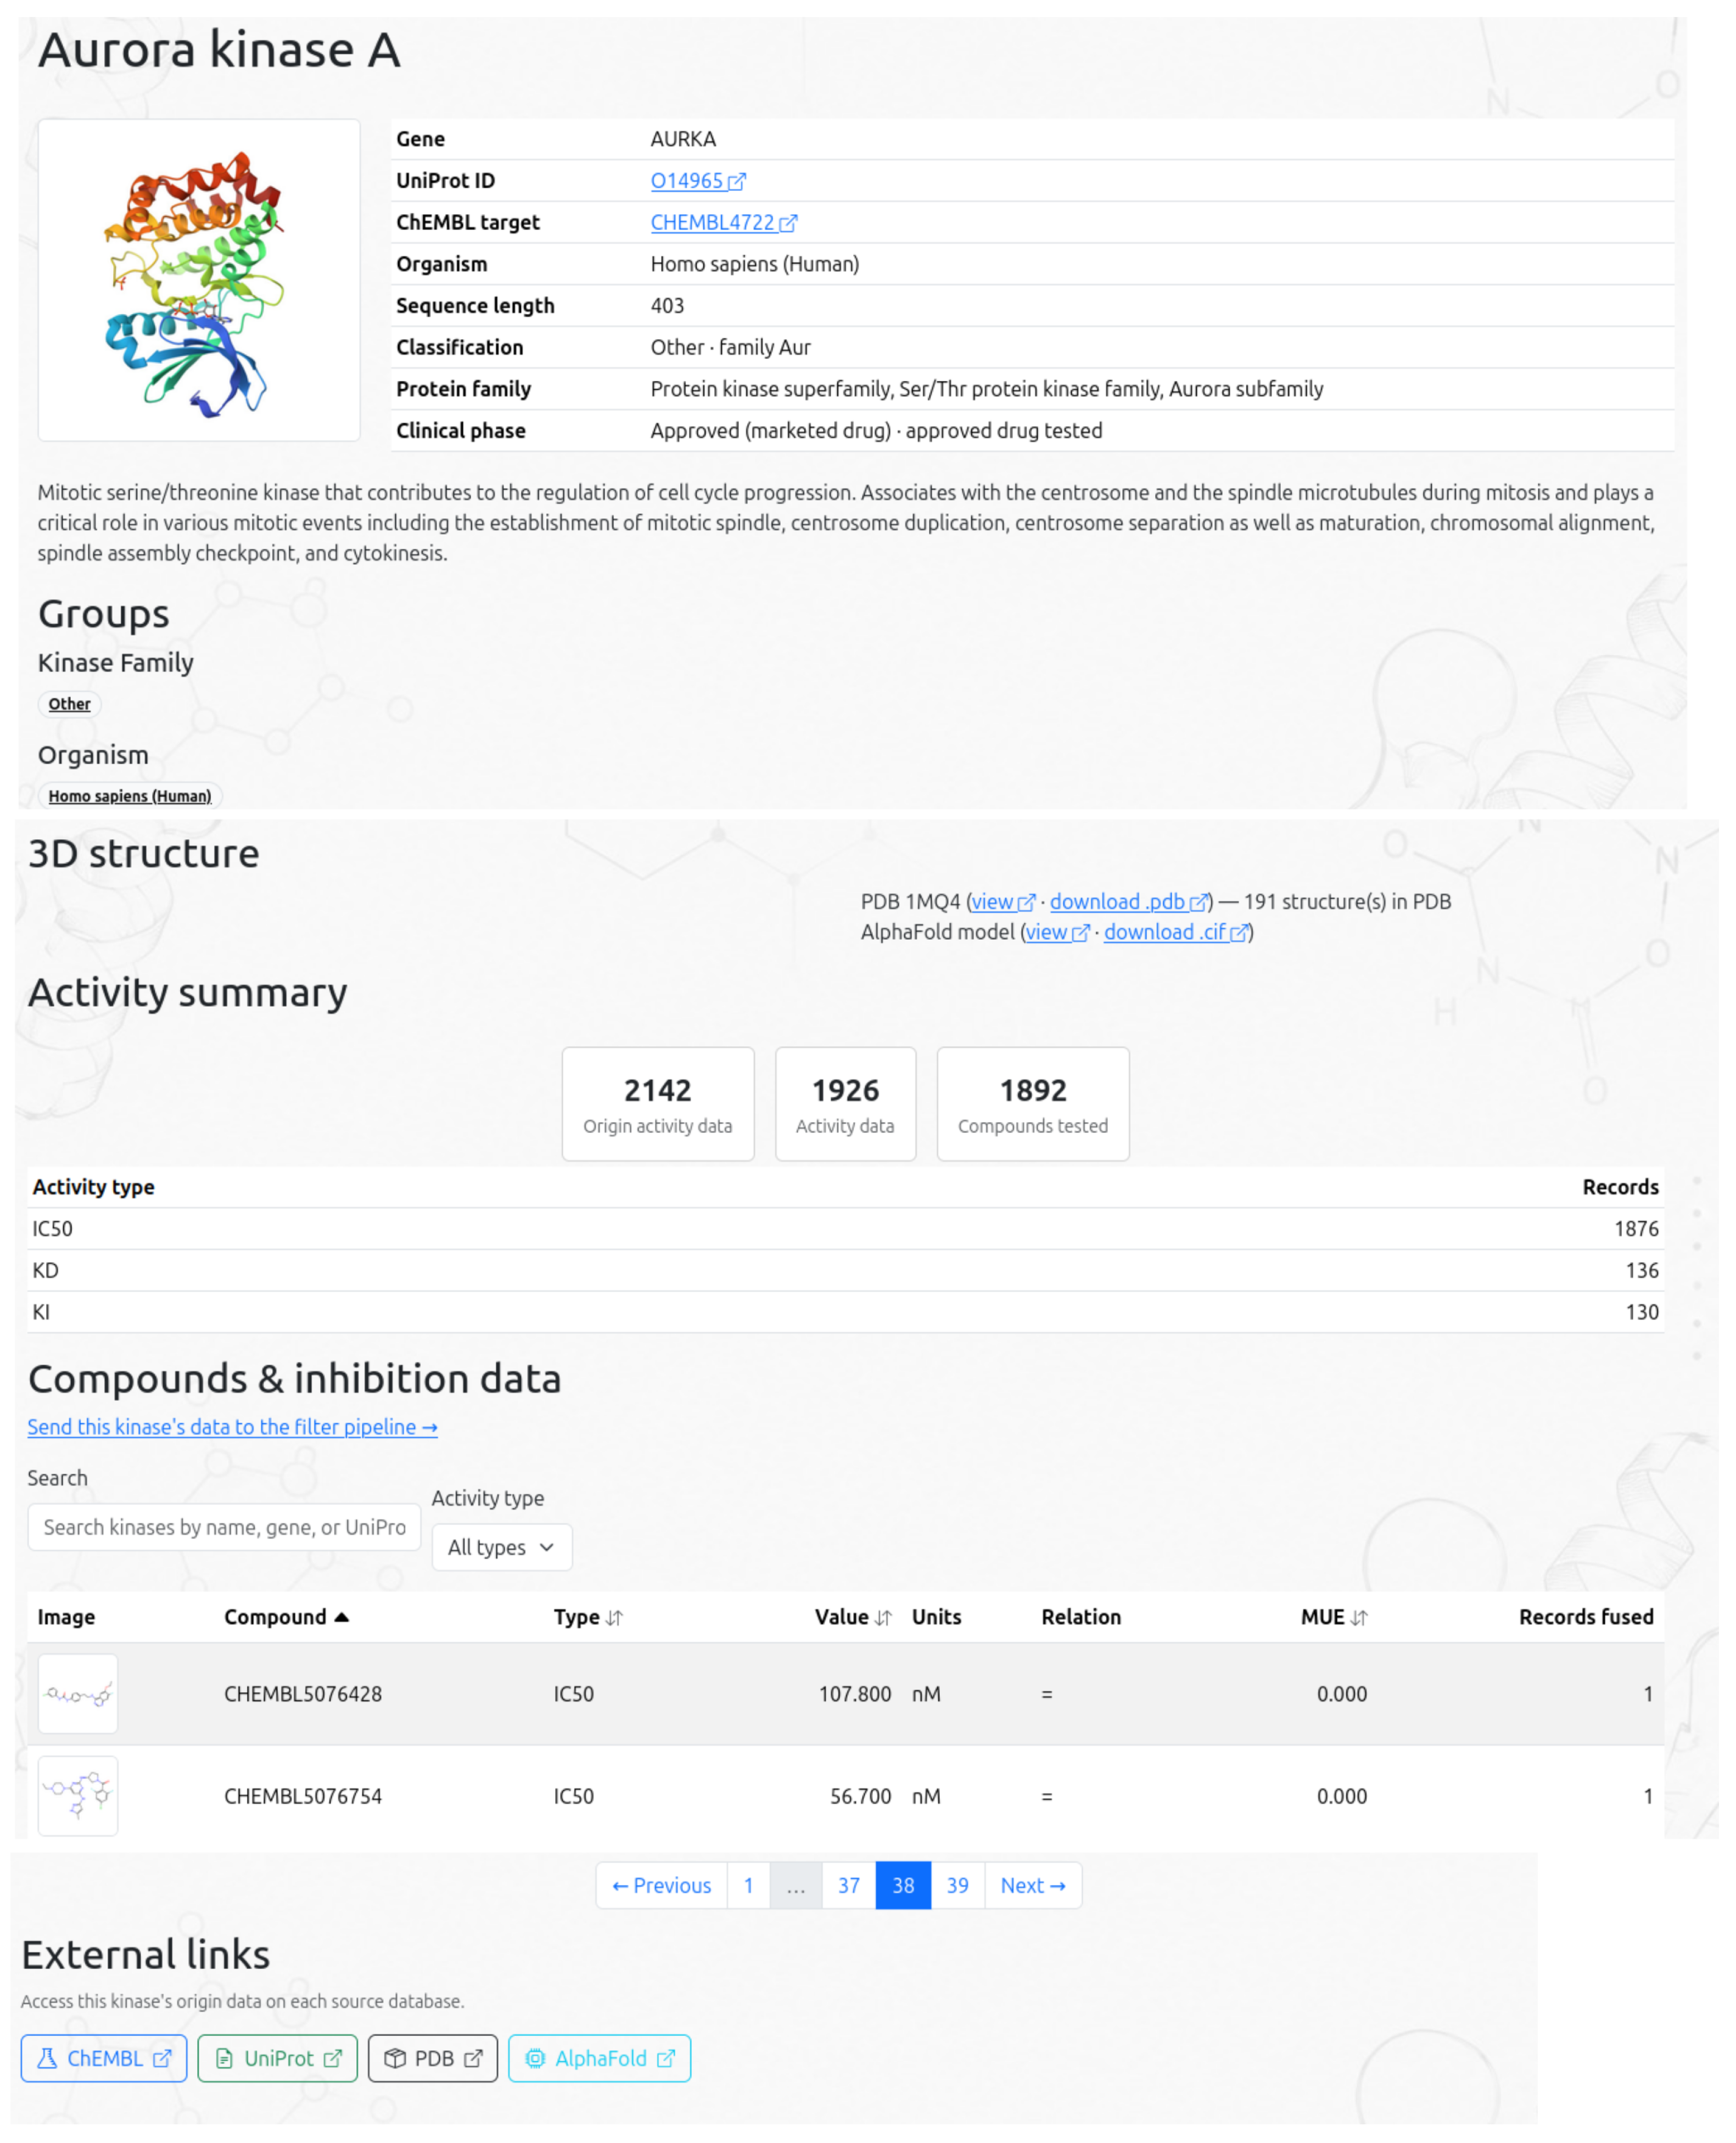
Independently of the filtering wizard, each kinase has a detail page that surfaces its classification, pharmacology summaries and external links (Figure 4). Where structural metadata is available (PDB and AlphaFold [11]), the page displays a 3D cartoon representation of the kinase structure.
Figure 4.
A Kinoteca kinase detail page, combining curated annotation with a 3D structure.
2.6. Kinase Activity Comparison
A particular objective in the development of kinase inhibitors is the search for kinase-specific bioactive molecules that omit off-target effects on other targets, mainly other kinases. In order to address this situation within Kinoteca, a kinase inhibitors comparison page was added to Kinoteca.
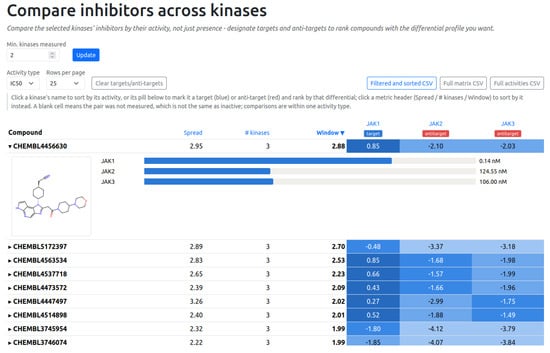
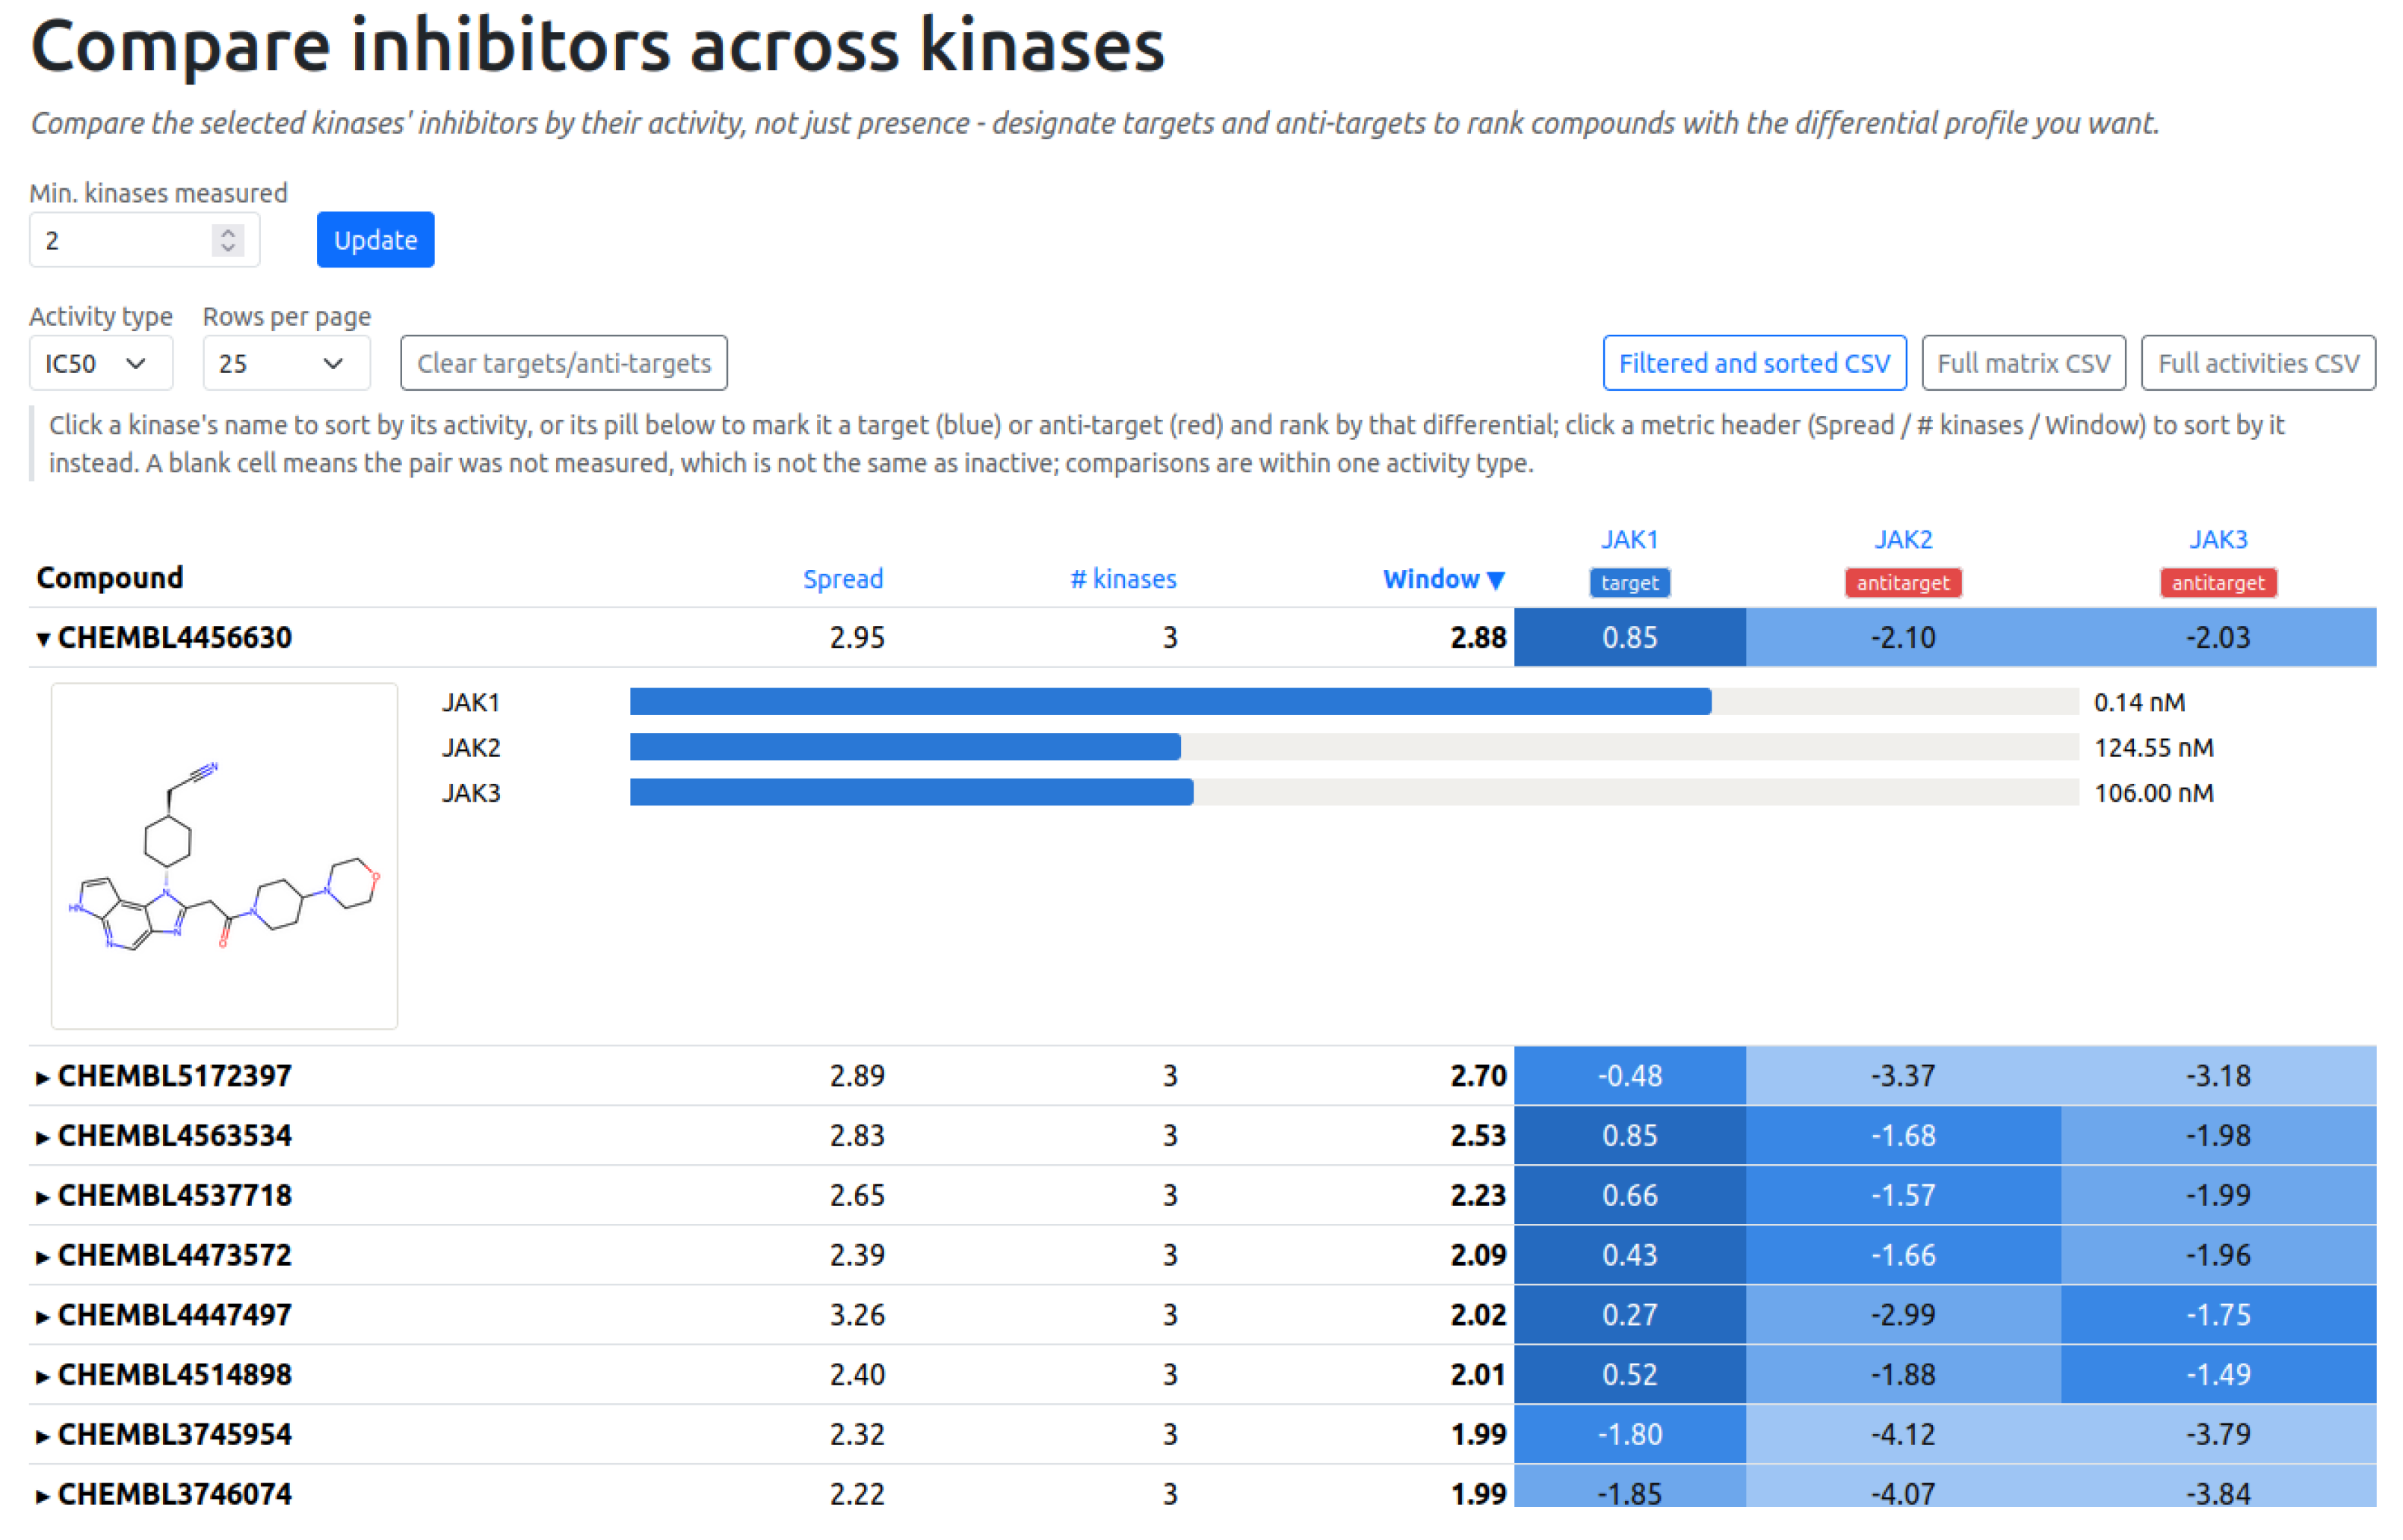
The comparison page includes a kinase selector similar to the first step of the filtering wizard, where kinases are selected to be compared. Next, an interactive comparison page is accessed for the selected kinases (Figure 5). The comparison is performed with an interactive table, where the activity data (in pAct units) for each compound present on the selected kinases is displayed, along with the spread of the activity values and the number of selected kinases for which activity data is available. By default, only compounds tested on at least two of the selected kinases are displayed, although this value can be configured from the web interface. Other configurable values include the activity type being compared and the table size.
Figure 5.
Kinoteca kinase activity comparison page, showcasing the use of target/antitarget labeling to identify selective inhibitors across kinases. A comparison of three different kinases (JAK1, JAK2 and JAK3) is made, setting JAK1 as target and the rest as antitargets. The compounds with reported activities are displayed, and sorted by greatest activity gap between targets and antitargets. The activities reported for each kinase are displayed in a table, color coded by potency.
Once the comparison is set up, each of the selected kinases can be given a role of ‘target’ or ‘antitarget’. When targets and antitargets are set, only compounds with reported activities on the selected targets/antitargets are displayed, and they are ordered by the biggest activity window between the target and antitargets. This way, compounds which have the most selective effect on targets against antitargets are easily identified and explored. A dropdown explorer is available for each compound to explore its structure and compare activity values across the selected kinases.
Once an analysis is done, filtered data, along with full records for the selected kinases, are available for download for further exploration.
2.7. Proof of Concept: Predictive Models Trained Directly on Kinoteca Exports
To verify that the exported datasets are usable without further preprocessing and to test whether the curation adds measurable value beyond convenience, we trained baseline classifiers directly on Kinoteca exports for two densely sampled human kinases of established therapeutic relevance: the epidermal growth factor receptor EGFR (UniProt P00533, ChEMBL203; tyrosine kinase, EGFR family) and the serine/threonine-protein kinase B-Raf (UniProt P15056, ChEMBL5145; tyrosine kinase-like, RAF family). Both are targets of marketed inhibitors, and both accumulate enough redundant IC50 measurements for reconciliation to be consequential. The exercise is minimal in scope by design: Its purpose is to establish that a file downloaded from the web interface can be taken to a trained model without intermediate curation, not to benchmark molecular representations or to propose a predictive method. The modelling protocol is described in Section 4.6.
Three exports were compared per target, differing only in how the underlying measurements were treated. The semi-raw export supplies every individual IC50 record as reported upstream, without fusion; the curated export at the full MUE range supplies one reconciled value per compound; and the curated export restricted to MUE ≤ 0.3 supplies the same, limited to the consensus values for which their measurements agree within the recommended operating point. Their composition is compared in Table 5, which quantifies what fusion removes and what it costs.
Table 5.
Composition of the three exports compared per target.
Two of the quantities reported there require definition, since they are what makes the semi-raw and curated datasets qualitatively and not merely quantitatively different. A compound is conflicting when the activity cut-off, applied independently to each of its own records, places some of them among the actives and others among the inactives; because all records of a compound share the same molecular representation, a classifier then receives several copies of one feature vector bearing opposite targets. Minority rows are the records carrying the less frequent of the two labels within such a compound. They are counted at the level of records rather than compounds, so a single conflicting compound contributes at least one and possibly many minority rows: A molecule reported three times as active and twice as inactive contributes two. Their number therefore exceeds the number of conflicting compounds, and it is this count, not the compound count, that bounds performance, since the majority label is the best any deterministic model can assign, and every minority row is necessarily misclassified. In EGFR, the 427 conflicting compounds yield 647 such records, comprising 8.5% of the export, capping attainable accuracy at 0.915; in B-Raf, the 198 conflicting compounds yield 215 records, comprising 7.1%, for a ceiling of 0.930. The distribution is markedly uneven in EGFR, where 350 conflicting compounds contribute a single minority record, but three of them contribute 25, 33, and 45, so the molecules that most distort the loss function through sheer replication are also the ones that the model cannot possibly get right. Fusion eliminates both quantities by construction: each compound appears exactly once, and no contradiction survives.
The results are reported in Table 6 and admit two distinct readings. First, all eight curated configurations yield models in the range expected for single-target kinase classifiers on circular fingerprints, with test AUC-ROC values between 0.89 and 0.90 and MCC values between 0.59 and 0.66, confirming that the exported data is directly trainable. Second, and more informatively, models trained on curated exports outperform their semi-raw counterparts consistently and by a wide margin: The test MCC rises from 0.529 to 0.657 for EGFR and from 0.494 to 0.634 for B-Raf with Random Forest, with equivalent gains for XGBoost, and the test AUC-ROC improves by 0.045–0.075 across the four comparisons. The gain cannot be attributed to the dataset size, since the curated sets are the smaller ones, and it is accompanied by a narrower in-sample-to-held-out gap: the MCC drop from training to test never exceeds 0.18 for the curated models but reaches 0.23 and 0.24 for the two raw B-Raf ones, indicating that the additional records mainly provide material to memorize.
Table 6.
Performance of baseline classifiers trained directly on Kinoteca exports. ECFP4 (2048 bits, radius 2); activity labels assigned at the mean pAct of each dataset; 80/20 split stratified by class and grouped by compound.
Beyond the contradictions already quantified in Table 5, the semi-raw datasets carry a second, subtler bias. The mean-pAct cut-off shifts by 0.21 log units for EGFR and 0.23 for B-Raf when computed over records rather than over compounds, since the most replicated molecules tend to be the potent members of well-studied series. The raw and curated models are therefore not solving quite the same classification problem, which is what produces the markedly asymmetric recall and specificity of the raw B-Raf models (0.656 vs. 0.836). Reconciling redundant records into a single consensus value per compound removes contradictions, replication weighting, and cut-off drift at once.
By contrast, restricting the curated export to MUE ≤ 0.3 produces no systematic change in performance at this scale. In both targets, Random Forest performs slightly better on the unrestricted export, while XGBoost performs slightly better on the restricted one, and no difference in test MCC exceeds 0.04. The direction of the effect therefore tracks the choice of the algorithm rather than the quality of the data, and its magnitude is comparable to the variation expected between runs, so the two curated exports are best regarded as equivalent here.
We read this as a useful negative result rather than a shortcoming. It indicates that the measurable benefit of curation on these datasets comes from the fusion step, which eliminates outright contradictions, rather than from discarding values for which their measurements merely disagree by more than the assay noise. This is precisely the reason for publishing the dispersion score as an inspectable, user-controlled attribute instead of enforcing a threshold at ingestion (Section 4.3): a criterion for which its benefit is not demonstrable in advance should be left to the user, alongside the evidence needed to judge it. Whether a stricter dispersion criterion becomes advantageous for targets with sparser or more heterogeneous data or under validation regimes that stress extrapolation is an open question that these two case studies cannot settle.
We stress that these are baseline models on two targets, evaluated under a single split, and they are not intended as a general claim about the performance attainable from Kinoteca data; a systematic benchmark across the kinome, including alternative molecular representations, repeated splits and scaffold-based partitioning, is beyond the scope of this database description.
3. Discussion
Kinoteca addresses a recurring gap between large public bioactivity repositories and the model-ready datasets that data-driven kinase drug discovery requires. General-purpose resources such as ChEMBL [5] are comprehensive and authoritative, but they expose data at the level of individual reported measurements, leaving each research group to repeat the same reconciliation, quality-filtering, and reshaping steps before the data can be used. Prior work has shown that both combining and cross-checking sources improves confidence in compound and bioactivity data, providing curated consensus datasets suitable for machine learning and chemogenomics [4]. Kinoteca applies this philosophy specifically to the kinase family: Rather than providing only raw measurements, it also offers a reconciled activity value for each compound–kinase–activity-type combination, with full traceability back to the raw records it was built from. No curated activity is withheld on the grounds of measurement dispersion; the MUE is stored, displayed and exported alongside every fused value, and the wizard exposes it as a filter spanning the entire range present in the data. The trade-off between dataset size and measurement reliability is therefore set by the user according to the demands of their modelling task rather than fixed in advance by the resource, and our recommended operating point of 0.3 log units is offered as a default that can be inspected and overridden.
Kinoteca is complementary to, rather than a replacement for, existing kinase and bioactivity resources, and it occupies a distinct niche among them (Table 1). General repositories such as ChEMBL [5] and BindingDB [6] maximize coverage across all target classes but do not reconcile the redundant measurements of a given target–compound pair into a single curated value. Structure-oriented kinase resources such as KLIFS [7] provide detailed, expertly annotated kinase–ligand interaction data derived from crystal structures, but their focus is structural rather than an aggregation of quantitative activity for model training. The most closely related resource is KLSD, which also derives kinase–ligand activities from ChEMBL and standardizes them for similarity and selectivity analyses [8]; Kinoteca is distinguished from it by its explicit fusion of redundant measurements into consensus values with a reported dispersion score, its preservation of full pre-fusion provenance in a parallel raw table, and its emphasis on directly exportable, analysis-ready datasets for predictive modelling. To our knowledge, no existing kinase-focused resource combines measurement reconciliation, an explicit per-record reliability score, and model-ready export in a single tool.
The most consequential boundary of the present pipeline is that fusion does not take into consideration experimental conditions. As detailed in Section 4.2, records are homogenized by the measured quantity, target identity, assay class and compound structure, but the finer parameters that modulate a reported potency, like ATP concentration relative to , protein construct and boundaries, activation state, and detection technology, are not systematically machine-readable upstream and therefore do not enter the grouping. A fused value should consequently be read as a consensus across the assay conditions actually represented in the literature for that pair, rather than as a condition-specific constant, and comparisons between kinases for which their assay conditions differ systematically deserve particular caution. The MUE score and the exportable pre-fusion layer are offered as mitigations, not as a solution: they make the residual heterogeneity visible and recoverable, but they do not remove it.
That mitigation is itself unavailable for part of the content, since the MUE quantifies agreement among repeated measurements and is undefined for the curated activities that derive from a single record. Of the 124,288 curated activity records currently in the database, 106,444 (85.64%) are supported by a single measurement, 13,596 (10.94%) by exactly two, and 4248 (3.42%) by three or more independent measurements, so dispersion is an informative quantity for only 14.36% of the curated content. The evidential support of every curated activity travels with the data itself: Each activity stores the number of raw records fused into it, and both this count and the corresponding MUE are carried through to the exported files, where a single-measurement entry is identifiable by a fused-record count of one and an empty MUE field. The same annotation is attached as a tag to each compound block in the SDF export and is displayed in the web interface alongside the activity value, so a user can separate consensus-supported values from single-source ones directly in the exported dataset at whatever point of their own workflow that distinction matters without reconstructing it from the semi-raw layer. The corollary of publishing dispersion instead of enforcing it is that a user is not restricted by the 0.3 MUE cut-off, a heuristic anchored on typical assay reproducibility, and the responsibility for that choice is deliberately placed on the user.
A second group of limitations concerns what the curated layer contains and what it omits. Excluding relative measurements (>, <, and ∼) removes a non-random portion of the evidence that is concentrated among weakly active compounds, so the curated datasets are enriched in potent molecules relative to the full body of reported results; this is why the proof of concept of Section 2.7 adopts a median-based rather than an absolute activity cut-off, and any modelling task that depends on a realistic active-to-inactive ratio should account for it. The content also derives from a single repository, ChEMBL release 33, and therefore inherits its coverage biases, its annotation errors, and its release cadence; kinases that have been explored through narrow chemical series are represented by correspondingly narrow chemical space, which bounds the applicability domain of anything trained on them. Finally, the structural-clustering view, capped at 500 unique compounds for performance reasons and complemented by scaffold grouping beyond that limit, is an interface constraint on exploration only and does not affect the data that is exported.
The central aim of Kinoteca is to bring together, in a single resource, the kinase inhibitory-activity data that is otherwise dispersed across the literature, accompanied by enough metadata to make it directly usable. Seen from this perspective most of the boundaries described above are matters of scope rather than fundamental obstacles, and they translate into a concrete roadmap. The immediate priority is broadening the evidence base. The flat data-source abstraction of the data model already accommodates additional providers, so incorporating repositories such as BindingDB [6] and PubChem is a direct next step and one for which its benefit compounds: Every additional independent measurement per compound–kinase pair strengthens the consensus value and reduces the fraction of records for which no dispersion can be assessed at all [4]. This will be accompanied by a scheduled migration to successive ChEMBL releases, with versioned snapshots so that a dataset cited in a publication remains retrievable after the underlying data has moved on. On the data side, censored measurements will be reintroduced as an explicitly flagged optional category so that users building classification models can recover the weakly active compounds currently excluded without contaminating the quantitative consensus layer, and parent-structure normalization will be offered as an export-time choice rather than imposed during curation, with the mapping between reported and normalized entities made explicit in the exported file.
The user interface was developed along an axis that kinase pharmacology makes unavoidable, namely selectivity. Because a compound’s value is often defined by the kinases it does not inhibit, a tool for comparing inhibitor sets between kinases was incorporated (Section 2.6); it goes beyond set overlap to compare the activity of shared compounds across targets so that molecules with a desired differential profile can be identified directly. Clearly, the comparison is done with reported activity values; that is, even in the ‘antitargets’, there is a measurable activity present. However, we think of this tool as a means to help identify and compare molecular patterns that enhance the activity towards one or several kinases of interest. Building on this, we plan to expose derived selectivity summaries at the compound level and to make those comparisons exportable with the same provenance guarantees as the single-target datasets. Programmatic access to the curated layer through the existing REST API is also planned as a documented, stable public endpoint, alongside per-kinase applicability-domain descriptors intended to help users judge how far a model trained on a given export can reasonably be extrapolated.
4. Materials and Methods
4.1. Data Sources and Provenance
The bioactivity content of Kinoteca is derived from ChEMBL (release 33) [5], a manually curated, open repository of bioactive molecules with drug-like properties. From this source, Kinoteca ingests individual kinase inhibitory-activity measurements, one record per reported measurement, together with the assay, document, and compound ChEMBL identifiers required to preserve provenance. Kinase inhibitory-activity data is redistributed under the Creative Commons license of the upstream source (CC BY-SA 3.0). Kinases are identified by their UniProt accession number (AC) [12], and compounds are identified by the standard InChIKey derived from their structure and, where available, their ChEMBL identifier.
Kinase Reference Set and Classification
Target identification and classification rely on an in-house kinase reference assembled from public resources rather than on a single upstream annotation, since no individual source covers simultaneously the taxonomic breadth, the kinome classification, and the cross-referencing to bioactivity identifiers that Kinoteca requires. The reference is built from the sources listed in Table 7 and is keyed on the UniProt accession number, which acts as the primary identifier throughout the database.
Table 7.
Public sources composing the in-house kinase reference set.
The assembly proceeds in three steps. First, a candidate set of protein kinases is retrieved from UniProt/Swiss-Prot [12] (release 2026_02, accessed 20 February 2026), and this is restricted to reviewed entries carrying protein-kinase domain annotation (Pfam PF00069 and related kinase-domain families) or the corresponding enzyme-class assignment; only manually reviewed entries are admitted, so unreviewed TrEMBL predictions do not enter the reference. Second, kinome classification (group, family and subfamily) is assigned from the Manning kinome nomenclature [1] as propagated by KinHub/KinBase (accessed 18 February 2026), with UniProt accessions used as the join key; entries for which no classification could be assigned by direct accession match were resolved manually by gene name and, where this was still ambiguous, left unclassified rather than assigned by similarity. Non-human kinases, which are not covered by the Manning classification, are annotated by orthology to their closest classified human counterpart where an unambiguous ortholog exists, and this provenance is flagged in the record. Third, the reference is cross-linked to ChEMBL target identifiers (release 33) [5] through the UniProt accession present in the ChEMBL target-component table, which is what allows an incoming bioactivity record to be recognized as kinase-directed. Structural metadata (PDB [13] entries and AlphaFold [11] model identifiers) and sequence length are attached from the same UniProt release.
A target is admitted into Kinoteca only if it satisfies all three conditions: a reviewed UniProt entry, an assignable kinase-domain annotation, and at least one curated activity record surviving the pipeline of Section 4.2. Atypical protein kinases lacking the canonical eukaryotic protein kinase fold are retained and flagged as such, whereas protein-kinase-like pseudokinases annotated as catalytically inactive or lipid kinases are outside the current scope. Applying these criteria to ChEMBL release 33 yields the 585 kinases described in Section 4.2, of which 414 are human.
4.2. Curation
Datasets were cleaned following the methodological principles of López-Ríos de Castro et al. [14]; we applied a three-stage curation pipeline designed to retain reliable bioactivity data for well-defined molecular targets, prioritizing biochemical assays that directly measure ligand–protein interactions. The number of records surviving each step is reported in Table 8. The first stage consisted of identifying and curating the kinase targets in ChEMBL 33 and subsequently using this curated kinase set to retrieve the corresponding bioactivity records. The kinases previously described in the preceding section were searched against the ChEMBL 33 database. No filters were initially applied based on assay type, protein preparation, or activity type, resulting in the identification of 626 kinases. The records associated with these targets were then subjected to an initial curation step that removed incomplete and non-quantitative entries records. Only IC50, Kd, and Ki measurements were retained, as these are the most common and reliable metrics for purified proteins. Records missing any essential field (compound ID, canonical SMILES, activity units and value, biological entity identifier, relationship operator, or confidence score) were discarded. SMILES strings were restricted to fewer than 512 characters. The SMILES length filter serves two purposes: first, it filters out large molecules that would be out of place in this small-molecule dataset, and second, this is a common limit for the application of embedding models, which generate molecular representations for training machine learning models.
Table 8.
Summary of the data curation pipeline.
The second stage enforced consistency and standardization. Inconsistent ChEMBL ID-SMILES mappings, SMILES shorter than 8 characters, chemical adducts, and free ions were removed, and all activity units were converted to nanomolar for storage and display. Relative measurements (>, <, and ∼) and values outside the experimentally plausible range of 1 pM–10 mM were excluded. The treatment of chemical structures at this stage is deliberately conservative and warrants an explicit statement, since it determines what a compound record represents. Structures are sanitized, and their SMILES canonicalized with RDKit, but no parent-structure normalization is applied: salts and counterions are not stripped from an otherwise valid record, charges are not neutralized, and tautomers are not enumerated onto a canonical form. Compound identity is therefore established on the InChIKey of the structure as reported upstream, with the consequence that a distinct protonation state and an alternative tautomeric depiction are stored as separate compound records and, when activity is reported against the same kinase, give rise to separate molecular subsets that are fused independently.
We adopted this convention because collapsing structures onto a common parent silently merges measurements that were, in the original report, made on entities that may differ in solubility, in effective concentration, and occasionally in the species actually assayed, and it does so on the basis of standardization rules that are themselves version-dependent and not universally agreed upon. Retaining the reported entity keeps the exported data in one-to-one correspondence with its source and leaves the decision to the user, who is generally better placed to judge whether a given pair of related forms should be treated as one compound for a specific modelling task. The trade-off of this approach is that related forms of the same molecule appear as distinct, unlinked entries in the current release, so a user aggregating over chemical series should be aware of it.
The third stage restricted the data to high-confidence kinase–ligand interactions. Only records with a ChEMBL confidence score of 9 were retained, a value assigned exclusively to assays measuring activity against a single, defined protein target. Compounds were then grouped by target and activity type into molecular subsets so that a single target could yield several subsets when multiple activity types were reported. Within each subset, duplicate records of the same experimental assay were removed, as were records for which their pAct values differed exactly by 3 or 6 units, a signature of erroneous unit annotation (nM vs. µM) rather than genuine biological variability [14].
The reconciliation implemented in Kinoteca is deliberately defined at the level of the (compound, kinase, and activity-type) triplet, and it is important to be explicit about what this does and does not control for. Records entering a given molecular subset are homogeneous with respect to the measured quantity (IC50, Ki or Kd); the target identity (a single, fully defined protein, with a ChEMBL confidence score of 9); the assay format (binding/biochemical assays on purified protein, excluding cell-based and phenotypic readouts); the reported relationship operator (exact “=” values only); and the exact chemical structure of the compound as reported. They are not, however, stratified by the finer experimental conditions under which each value was obtained. ATP concentrations relative to , protein construct and boundaries, phosphorylation and activation state, detection technology, incubation time, and preincubation protocol are not systematically and machine-readably annotated in the upstream source, and any attempt to condition the fusion on them would either discard the large majority of the records or rely on unreliable text mining of assay descriptions.
4.3. Scope and Granularity of the Fusion Step: Raw and Fused Activities
Rather than impose an incomplete stratification, Kinoteca treats this residual assay-level heterogeneity as an empirical quantity and reports it instead of acting on it. Its observable footprint is the MUE, computed pairwise over the measurements of a molecular subset (Equation (2)): For a subset with records, all unordered pairs are formed and their absolute pAct differences are averaged, with the factor rescaling a pairwise difference to the scale of an individual measurement, since the difference of two independent determinations, each carrying an error , has a dispersion of [4,15]. Subsets obtained under effectively comparable conditions therefore converge to a low MUE, whereas those aggregating incompatible assay setups exceed the ∼0.3 log-unit uncertainty typical of individual bioactivity measurements.
No record is removed from the database on the basis of its dispersion. Every molecular subset supported by more than one measurement is fused and materialized as a curated activity with its MUE and its record count stored alongside so that a fused value is presented not as a condition-independent constant but as a consensus estimate carrying its own reliability annotation, while the full pre-fusion provenance, including the upstream assay identifier of every contributing measurement, is preserved in the semi-raw export for users who need to reconstruct condition-matched subsets. Dispersion is instead exposed as a user-controlled criterion in the filtering wizard, where the MUE slider spans the full range present in the database from 0 to 3.02 units: At its maximum it returns the complete curated content, and any lower value trades coverage for internal consistency. We recommend 0.3 as an operating point for the same reason that motivates the metric itself, but as a default rather than as a curation decision imposed on the data.
The logarithmic transformation applied throughout the pipeline is the conventional molar-based definition (Equation (1)) computed on the activity expressed in mol L−1. Values on this scale are therefore identical in meaning and directly comparable to the pIC50, pKi and pKd values reported in ChEMBL and in the medicinal-chemistry literature, and they require no offset correction before being combined with external datasets. For readability, activity values themselves are stored and displayed in nanomolar throughout the web interface and in every exported file.
4.4. Data Model and Database Schema
The data model of the database is organized around seven core entities (Figure 1). A Kinase is identified by its UniProt AC and carries kinome classification (group, family and subfamily), an optional ChEMBL target identifier, sequence length, and free-form metadata for structural (PDB/AlphaFold) and external-link information. Kinases are additionally organized into KinaseGroups along independent, curator-managed dimensions (for example pathway, kinase family, associated disease, and source organism) through a many-to-many relationship so that a kinase may belong to several groups within a dimension and to groups across multiple dimensions simultaneously.
A Compound is identified by its InChIKey and, when available, a ChEMBL identifier, and stores its SMILES string for image generation and molecule depiction. Each compound has an associated Properties record holding the physicochemical descriptors used by the molecular-filter stage: molecular weight, ALogP, polar surface area, and hydrogen-bond donor and acceptor counts. An Activity is the curated result of the fusion pipeline, with one row per compound, kinase and activity-type combination, carrying the unique activity value, its unit, the MUE value for its origin data, and the number of raw records fused into it. A RawActivity is a single origin activity measurement from which fused activities are obtained. Each RawActivity is related to exactly one Activity and one Compound, and it carries its own value, units and relation plus provenance. Finally, each RawActivity record is related to a DataSource, which contains information of the data origin to keep data traceability.
4.5. Software Architecture
Kinoteca is architected as a data-exploration and access platform, explicitly decoupled from predictive-modeling tasks. From an informatics standpoint, the system is largely based on backend computing to perform data filtering and formatting for download, along with client-side data interaction for a fluid and interactive modification of filtering rules.
4.5.1. Backend Core and Cheminformatics Stack
The backend architecture is built on the Django web framework, leveraging class-based views and the native Django template engine as its structural base. Relational data is defined through the previously described Django Models and implemented using a PostgreSQL database. To handle specialized chemical domain requirements, the backend employs the RDKit library, including the RDKit Cartridge for PostgreSQL integration. RDKit is responsible for the processing and storage of chemical structures, managing SMILES strings, performing molecular clustering, and creating 2D molecular depictions. The Matplotlib v3.11.1 library was used to perform server-side graph creation to be served to users.
As explained below, a small internal API was developed to access simplified data from within the webpage, although no public, programmatic access API is yet available.
4.5.2. Hybrid Frontend and React Islands
The frontend is constructed partially using Django’s template system to create static webpages and access points, and React is used to produce particular sections in webpages where fluid user interaction is required. These pages request information from the backend and send them to the user, and the React implementation allows the user to examine and modify the data. To access backend data, an internal API was built using the Django REST Framework. Different pages make calls to the internal API to get simplified information to construct and display the webpages. As an example, molecular filtering by physicochemical properties is performed by a React island, where data is obtained from the backend via the internal API and displayed, and the amount of filtered compounds is dynamically updated.
Development of the frontend was additionally supported by AI-assisted coding tools (Claude Code with Opus 4.8, powered by Anthropic) for code review and syntax refinement.
4.5.3. Data Filter and Export
The application filters and narrows compound datasets through a sequential three-stage wizard (Kinases → Molecule Properties/MUE → Datasets). To protect the database from pollution or orphaned records caused by incomplete operations, the transient wizard state is retained entirely within the user’s session storage. Upon the final step, the pipeline applies the criteria to compile a unified MolFilterSet database entity, which stores a JSON snapshot of the filtering criteria and filtered curated activities.
The relationship between the two activity layers is many-to-one and total in both directions: Each RawActivity is an individual upstream measurement linked to exactly one Activity, the fused record for its (compound, kinase, and activity type) combination, and every Activity derives from at least one RawActivity and stores the count and dispersion. Since the MUE is published as an attribute rather than applied as a curation cut-off (Section 4.3), a strongly disagreeing molecular subset is fused and materialized like any other, simply carrying a high MUE: There is no category of rejected groups for which their raw data would become inaccessible. Filtering by MUE restricts the exported files of a given query, not the database, so the measurements underlying excluded activities are recovered by relaxing the selection and exporting again. Only the records removed during curation itself (Section 4.2) are absent from every export, as they are never ingested and remain accessible from the upstream source through its own identifiers.
Data retrieval is implemented via a decoupled export module that builds the required output and returns it as requested. The two tabular exports share the compound and target keys, namely compound_inchi_key, compound_chembl_id, kinase_uniprot_id, kinase_name and activity_type, which together constitute the fusion key, so the curated and semi-raw files of the same result set join on those columns without any additional identifier. The available data can be exported as
- Curated CSV: One row per fused Activity, carrying compound_smiles; the relation, value and units of the consensus estimate; and the two fields that qualify it, record_count and mue, with the latter left empty when a single measurement makes it undefined. This is the direct, analysis-ready input for model training.
- Semi-Raw CSV: One row per individual RawActivity of the same result set, preserving its relation, value and units as reported upstream, together with the source release, the record external_id, the literature reference, and the data_source_provider and data_source_identifier that identify the originating assay. The fusion performed by Kinoteca can therefore be reproduced, audited or replaced by a different reconciliation criterion without leaving the exported files; users requiring assay-condition-matched subsets should start here.
- Molecular Structure SDF: One molblock per unique compound, generated by RDKit, tagged with its identifiers (chembl_id, inchi_key) and precalculated descriptors (mw, logp, hba, hbd, and psa), plus a multi-line curated_activities tag listing every curated value of the compound within the result set, each annotated with its target, activity type, units, fused-record count and MUE.
4.6. Baseline Modelling Protocol
Regarding ML model training, the classifiers reported in Section 2.7 follow a deliberately conventional protocol, since the object of study is the dataset rather than the model. Molecules are described by ECFP4 circular fingerprints (Morgan, radius 2, 2048 bits) computed with RDKit directly from the SMILES field of the exported file; no additional descriptor, embedding or feature selection is applied. Activity labels are assigned by thresholding pAct at the mean of the dataset being trained on, which yields near-balanced classes without importing an absolute potency criterion from outside the data.
Two tree-ensemble classifiers were evaluated, Random Forest and XGBoost, both with class weighting proportional to the inverse class frequency. Hyperparameters were tuned by randomized search over 30 sampled configurations with 5-fold cross-validation on the training partition, selected by cross-validated AUC-ROC; the search spaces covered ensemble size, tree depth, leaf and split minima and feature subsampling for the Random Forest; and ensemble size, depth, learning rate, row and column subsampling, minimum child weight, and L1/L2 regularization for XGBoost. Fingerprints are used unscaled, as both algorithms are invariant to monotone feature transformations. All randomness is seeded.
Partitioning deserves particular emphasis, because it is what makes the curated vs.raw comparison meaningful. The 80/20 split and every cross-validation fold within it are stratified by class and grouped by compound identifier so that all records of a given molecule fall entirely within one partition. Since the raw export contains multiple records per molecule, an ungrouped split would place replicates of the same compound in both training and test sets, and the raw dataset would be scored partly on molecules it had already seen; its apparent performance would then reflect memorization rather than generalization, and the comparison would be void. The same grouped protocol is applied to the curated exports, where it is inconsequential because each compound contributes a single row so that all conditions are evaluated identically. Metrics are reported on the held-out partition, and their in-sample counterparts are reported alongside so that the degree of overfitting is visible.
5. Conclusions
Kinoteca is a curated database that turns heterogeneous, largely ChEMBL-derived kinase inhibitory-activity data into reconciled, provenance-preserving, analysis-ready datasets. By fusing multiple raw measurements into consensus activity values with an explicit dispersion score, organizing 585 kinases along biologically meaningful grouping dimensions, and providing a web interface with an interactive filtering wizard, structure-aware visualizations, and multiple export formats, it lets researchers move efficiently from a target-selection question to a dataset suitable for training predictive models of kinase inhibition. As a data-curation and data-exploration resource rather than a predictive-modeling product, Kinoteca is intended to complement, not replace, the primary repositories from which its data is drawn and to lower the barrier to reproducible, data-driven kinase drug discovery.
Author Contributions
Conceptualization, P.A.Q., J.D.G., E.M., L.M.H. and M.J.L.; methodology, L.M.H., P.A.Q., J.D.G., E.M. and M.J.L.; software, P.A.Q., J.D.G., L.M.H. and M.J.L.; formal analysis, P.A.Q., J.D.G. and L.M.H.; investigation, P.A.Q., J.D.G., E.M., L.M.H. and M.J.L.; resources, M.J.L.; data curation, P.A.Q., J.D.G. and L.M.H.; writing—original draft preparation, P.A.Q., J.D.G., E.M., L.M.H. and M.J.L.; visualization, P.A.Q., J.D.G., E.M., L.M.H. and M.J.L.; supervision, P.A.Q. and M.J.L.; project administration, M.J.L.; funding acquisition, L.M.H. and M.J.L. All authors have read and agreed to the published version of this manuscript.
Funding
This research was funded by NVIDIA, providing access to the Saturn computing resources used in this study. ‘Clementina XXI’ supercomputer (project PISCA 138) and computational resources provided by UNC Supercómputo (CCAD), Universidad Nacional de Córdoba, Argentina were utilized for the computational analyses. Additional financial support was provided by the Universidad Nacional de La Plata (UNLP) (SX006, 11/X958, Subsidios Jóvenes Investigadores en Formación 2025). P.A.Q., E.M., L.M.H., and J.D.G. are holders of a fellowship from CONICET. M.J.L. is a member of the Scientific Research Career of CONICET.
Informed Consent Statement
Not applicable.
Data Availability Statement
The original contributions presented in this study are included in the article. Further inquiries can be directed to the corresponding authors.
Acknowledgments
During the preparation of this manuscript, the authors used Claude (Anthropic, Opus 4.8) to assist with language editing, scientific writing refinement, and improvement of text clarity and readability. The authors have reviewed, verified, and edited all generated content and take full responsibility for the content of this publication.
Conflicts of Interest
The authors declare no conflicts of interest.
Abbreviations
The following abbreviations are used in this manuscript:
| ALogP | Calculated octanol–water partition coefficient (lipophilicity) |
| API | Application programming interface |
| CSV | Comma-separated values |
| IC50 | Half-maximal inhibitory concentration |
| InChIKey | Hashed International Chemical Identifier |
| Kd | Dissociation constant |
| Ki | Inhibition constant |
| Km,ATP | Michaelis constant of the kinase for ATP |
| MUE | Mean unsigned error |
| PSA | Polar surface area |
| SDF | Structure-data file |
| SMILES | Simplified Molecular-Input Line-Entry System |
| MCC | Matthews correlation coefficient |
| AUC-ROC | Area under the receiver operating characteristic curve |
| F1 | Harmonic mean of precision and recall |
| ECFP4 | Extended-connectivity fingerprint, diameter 4 |
| pAct | Negative base-10 logarithm of the molar activity value |
| RF | Random forest |
| XGB | Extreme Gradient Boosting |
| PDB | Protein Data Bank |
| UniProt AC | UNIPROT accession code |
Appendix A
Table A1.
Overview of publicly available kinase-related repositories and tools considered in this work. Source: Extracted from the respective publications.
Table A2.
Data curation approach, data availability and source-code access for the repositories in Table A1. Source: Extracted from the respective publications.
References
- Manning, G.; Whyte, D.B.; Martinez, R.; Hunter, T.; Sudarsanam, S. The Protein Kinase Complement of the Human Genome. Science 2002, 298, 1912–1934. [Google Scholar] [CrossRef] [Scilit]
- Cohen, P.; Cross, D.; Jänne, P.A. Kinase Drug Discovery 20 Years after Imatinib: Progress and Future Directions. Nat. Rev. Drug Discov. 2021, 20, 551–569. [Google Scholar] [CrossRef] [Scilit]
- Roskoski, R. Properties of FDA-Approved Small Molecule Protein Kinase Inhibitors: A 2026 Update. Pharmacol. Res. 2026, 224, 108107. [Google Scholar] [CrossRef] [Scilit]
- Kramer, C.; Kalliokoski, T.; Gedeck, P.; Vulpetti, A. The Experimental Uncertainty of Heterogeneous Public Ki Data. J. Med. Chem. 2012, 55, 5165–5173. [Google Scholar] [CrossRef] [Scilit]
- Zdrazil, B.; Felix, E.; Hunter, F.; Manners, E.J.; Blackshaw, J.; Corbett, S.; de Veij, M.; Ioannidis, H.; Mendez Lopez, D.; Mosquera, J.F.; et al. The ChEMBL Database in 2023: A Drug Discovery Platform Spanning Multiple Bioactivity Data Types and Time Periods. Nucleic Acids Res. 2024, 52, D1180–D1192. [Google Scholar] [CrossRef] [Scilit]
- Gilson, M.K.; Liu, T.; Baitaluk, M.; Nicola, G.; Hwang, L.; Chong, J. BindingDB in 2015: A Public Database for Medicinal Chemistry, Computational Chemistry and Systems Pharmacology. Nucleic Acids Res. 2016, 44, D1045–D1053. [Google Scholar] [CrossRef] [Scilit]
- Kooistra, A.J.; Kanev, G.K.; van Linden, O.P.J.; Leurs, R.; de Esch, I.J.P.; de Graaf, C. KLIFS: A Structural Kinase-Ligand Interaction Database. Nucleic Acids Res. 2016, 44, D365–D371. [Google Scholar] [CrossRef] [Scilit]
- Yuan, Y.; Tang, X.; Li, H.; Lang, X.; Li, C.; Song, Y.; Sun, S.; Yang, Y.; Zhou, Z. KLSD: A Kinase Database Focused on Ligand Similarity and Diversity. Front. Pharmacol. 2024, 15, 1400136. [Google Scholar] [CrossRef] [Scilit]
- Butina, D. Unsupervised Data Base Clustering Based on Daylight’s Fingerprint and Tanimoto Similarity: A Fast and Automated Way to Cluster Small and Large Data Sets. J. Chem. Inf. Comput. Sci. 1999, 39, 747–750. [Google Scholar] [CrossRef] [Scilit]
- Bemis, G.W.; Murcko, M.A. The Properties of Known Drugs. 1. Molecular Frameworks. J. Med. Chem. 1996, 39, 2887–2893. [Google Scholar] [CrossRef] [Scilit]
- Jumper, J.; Evans, R.; Pritzel, A.; Green, T.; Figurnov, M.; Ronneberger, O.; Tunyasuvunakool, K.; Bates, R.; Žídek, A.; Potapenko, A.; et al. Highly Accurate Protein Structure Prediction with AlphaFold. Nature 2021, 596, 583–589. [Google Scholar] [CrossRef] [Scilit]
- The UniProt Consortium. UniProt: The Universal Protein Knowledgebase in 2023. Nucleic Acids Res. 2023, 51, D523–D531. [Google Scholar] [CrossRef] [Scilit]
- Berman, H.M.; Westbrook, J.; Feng, Z.; Gilliland, G.; Bhat, T.N.; Weissig, H.; Shindyalov, I.N.; Bourne, P.E. The Protein Data Bank. Nucleic Acids Res. 2000, 28, 235–242. [Google Scholar] [CrossRef] [Scilit]
- López-Ríos de Castro, R.; Rodríguez-Guerra, J.; Schaller, D.; Kimber, T.B.; Taylor, C.; White, J.B.; Backenköhler, M.; Groß, J.; Payne, A.M.; Kaminow, B.; et al. The Journey of Data: Lessons Learned in Modeling Kinase Affinity, Selectivity, and Resistance [Article v1.0]. Living J. Comput. Mol. Sci. 2025, 6, 3875. [Google Scholar] [CrossRef] [Scilit]
- Kalliokoski, T.; Kramer, C.; Vulpetti, A.; Gedeck, P. Comparability of mixed IC50 data–a statistical analysis. PLoS ONE 2013, 8, e61007. [Google Scholar] [CrossRef] [Scilit]
- International Centre for Kinase Profiling, MRC Protein Phosphorylation and Ubiquitylation Unit, University of Dundee. Kinase Profiling Inhibitor Database. Available online: https://www.kinase-screen.mrc.ac.uk/kinase-inhibitors (accessed on 25 August 2026).
- Kumar, H.; Chen, Z.; Adegunlehin, A.; Trowbridge, L.; Aguilar, L.; Kim, P. KinaseFusionDB: An integrative knowledge of kinase fusion proteins in multi-scales. Briefings Bioinform. 2025, 26, bbaf259. [Google Scholar] [CrossRef] [Scilit]
- Eid, S.; Turk, S.; Volkamer, A.; Rippmann, F.; Fulle, S. KinMap: A web-based tool for interactive navigation through human kinome data. BMC Bioinform. 2017, 18, 16. [Google Scholar] [CrossRef] [Scilit]
- Kinexus Bioinformatics Corporation. KinaseNET: Human Protein Kinase Knowledgebase. Available online: http://www.kinasenet.ca/ (accessed on 30 June 2026).
- Kuleshov, M.V.; Xie, Z.; London, A.B.; Yang, J.; Evangelista, J.E.; Lachmann, A.; Ma’ayan, A. KEA3: Improved kinase enrichment analysis via data integration. Nucleic Acids Res. 2021, 49, W304–W316. [Google Scholar] [CrossRef] [Scilit]
- Kinexus Bioinformatics Corporation. DrugKiNET: An Open-Access KnowledgeBase for Protein Kinase Inhibitors. Available online: http://www.drugkinet.ca/ (accessed on 30 June 2026).
- Berginski, M.E.; Moret, N.; Liu, C.; Goldfarb, D.; Sorger, P.K.; Gomez, S.M. The Dark Kinase Knowledgebase: An online compendium of knowledge and experimental results of understudied kinases. Nucleic Acids Res. 2021, 49, D529–D535. [Google Scholar] [CrossRef] [Scilit]
- Eun, J.; Lee, Y.; Yang, S.; Choi, D.; Na, H.; Cho, H.; Nam, S.; Lee, J. DeepKinomeWeb: A quantitative, panel-level platform for kinase inhibitor screening and selectivity profiling. Nucleic Acids Res. 2026, 54, W246–W256. [Google Scholar] [CrossRef] [Scilit]
- Shen, Z.; Yan, Y.H.; Yang, S.; Zhu, S.; Yuan, Y.; Qiu, Z.; Jia, H.; Wang, R.; Li, G.B.; Li, H. ProfKin: A comprehensive web server for structure-based kinase profiling. Eur. J. Med. Chem. 2021, 225, 113772. [Google Scholar] [CrossRef] [Scilit]
- Sekar, J.A.P.; Li, Y.C.; Schlessinger, A.; Pandey, G. A web portal for exploring kinase-substrate interactions. npj Syst. Biol. Appl. 2024, 10, 113. [Google Scholar] [CrossRef] [Scilit]
- Hornbeck, P.V.; Zhang, B.; Murray, B.; Kornhauser, J.M.; Latham, V.; Skrzypek, E. PhosphoSitePlus, 2014: Mutations, PTMs and recalibrations. Nucleic Acids Res. 2015, 43, D512–D520. [Google Scholar] [CrossRef] [Scilit]

Disclaimer/Publisher’s Note: The statements, opinions and data contained in all publications are solely those of the individual author(s) and contributor(s) and not of MDPI and/or the editor(s). MDPI and/or the editor(s) disclaim responsibility for any injury to people or property resulting from any ideas, methods, instructions or products referred to in the content. |
© 2026 by the authors. Licensee MDPI, Basel, Switzerland. This article is an open access article distributed under the terms and conditions of the Creative Commons Attribution (CC BY) license.