


Abstract
Background/Objectives: Multi-target claims in computational studies of Alzheimer’s disease rest on docking scores compared across receptors, although receptor-specific baselines are rarely established. We asked whether such concordance reflects binding-site complementarity or the calculation. Methods: 264 flavonoids were filtered by predicted absorption, distribution, metabolism, excretion and toxicity (ADMET) and prioritized by predicted kinase activity (49 retained); network pharmacology identified eight Alzheimer-associated core targets. Glide extra-precision (XP) docking was validated at each receptor by re-docking the co-crystallized ligand, whose score served as a receptor-specific baseline. ATP pockets were compared structurally, and the analysis was repeated for 122 unrelated compounds. Results: Baselines spanned −2.515 to −10.920 kcal/mol, exceeding the differences between compounds; normalization reordered the campaign completely (Spearman ρ = 0.078). Scores correlated between all kinase pairs (mean r = 0.693) yet showed no detectable relationship with pocket sequence identity (Mantel p = 0.29) or any SiteMap descriptor, whereas free hydroxyl count—the dominant marker of a polarity axis—explained 50–80% of the variance, its removal collapsing the correlation to 0.080. The diverse library reproduced stronger agreement (mean r = 0.776) on one latent axis carrying 81.4% of the variance, again showing no relationship to pocket similarity (p = 0.86). Robinetin ranked first at AKT1 after normalization and stayed in the ATP cleft throughout two independent 100 ns trajectories (Molecular Mechanics/Generalized Born Surface Area, MM-GBSA, −137.2 ± 20.7 kcal/mol), although hydrogen-bond occupancies differed between runs. Conclusions: Concordant docking scores reflect the calculation rather than binding-site complementarity and cannot alone support a multi-target mechanism; receptor normalization and ligand-descriptor deconvolution are minimum requirements.
1. Introduction
Alzheimer’s disease (AD) is the most common cause of dementia and remains one of the largest unmet needs in clinical neurology [1]. It is characterized neuropathologically by extracellular deposition of amyloid-β (Aβ) peptides in senile plaques and by intracellular accumulation of hyperphosphorylated tau in neurofibrillary tangles, accompanied by synaptic loss, mitochondrial dysfunction, chronic neuroinflammation, oxidative injury and progressive neuronal death [2,3]. Clinically, the disease evolves over years, beginning with episodic memory impairment and progressing to global cognitive failure and loss of independence [1]. Because the ageing of the population is accelerating worldwide, the number of affected individuals is expected to increase substantially over the coming decades, together with the associated economic and caregiving burden [4]. Despite decades of research, pharmacological options remain limited. Acetylcholinesterase inhibitors and the N-methyl-D-aspartate (NMDA) receptor antagonist memantine provide modest and largely symptomatic benefit without altering the underlying degenerative process [5]. A recurring explanation for this limited success is the reliance on single-target intervention in a disease that is manifestly multifactorial [6]: amyloid processing [7], tau phosphorylation [8], insulin resistance [9], oxidative stress and inflammatory signaling are not independent pathways but an interconnected network [10]. Therapeutic strategies that address several nodes of this network simultaneously, or that target regulatory proteins positioned at the convergence of multiple pathways, are therefore increasingly favored [11]. AKT1 (RAC-alpha serine/threonine-protein kinase, UniProt P31749, also known as protein kinase B α) is the most compelling of these convergence points. It is a serine/threonine kinase of the AGC family and the predominant Akt isoform in the central nervous system, activated downstream of phosphoinositide 3-kinase by phosphorylation at Thr308 by PDK1 and at Ser473 by mTORC2 [12]. Its position places it at the intersection of almost every process implicated in Alzheimer’s disease [13]. AKT1 phosphorylates GSK-3β at Ser9 and thereby holds the principal tau kinase in an inactive state, so that any loss of Akt activity releases GSK-3β and permits the tau hyperphosphorylation that generates paired helical filaments [14]. GSK-3β is not the only kinase that acts on tau, and the case for targeting this class is not confined to it: cyclin-dependent kinase 5 has likewise been advanced both as a blood-based diagnostic marker and as a therapeutic target in Alzheimer’s disease [15], which illustrates the breadth of the tau-kinase axis within which the targets examined here sit. Through mTOR, it governs autophagic flux and hence the clearance of amyloid-β and of aggregated tau, and it participates through the same axis in the regulation of amyloid precursor protein processing [16]. It transmits the survival signal that suppresses apoptosis through BAD, FOXO and caspase-9, sustains long-term potentiation and synaptic plasticity, modulates glial inflammatory signaling through NF-κB, and stabilizes β-catenin indirectly by restraining GSK-3β [17,18]. Above all, AKT1 is the node at which the brain insulin resistance characteristic of Alzheimer’s disease is transduced: impaired IRS-1/PI3K/Akt signaling is among the earliest and most consistent biochemical abnormalities described in the disease [9,19]. AKT1 therefore occupies a genuinely upstream position, with GSK-3β, mTOR and the MAPK cascades distributed beneath it, and it is this position that makes it the natural anchor for a multi-target strategy [19]. Pharmacological engagement of this axis has nevertheless proved difficult, and for reasons that differ from those encountered at the kinases downstream of it [20,21]. Potent ATP-competitive Akt inhibitors have been developed for oncology [22], capivasertib [21] and ipatasertib among them, but their pharmacology is dominated by on-target metabolic toxicity [20]. Inhibition of GSK-3β has been pursued as an indirect route to the same end, but the clinical development of lithium and of the non-ATP-competitive inhibitor tideglusib has been constrained by tolerability, insufficient efficacy or unfavorable central exposure, in part because GSK-3β also governs glycogen metabolism, cell-cycle progression and transcriptional control in peripheral tissues [23]. There is a continuing need for chemically diverse, moderately potent, brain-penetrant scaffolds that engage this axis with acceptable pharmacokinetic and safety profiles, and preferably with activity distributed across several of its nodes rather than concentrated on one. Flavonoids are a natural product class that fits this specification unusually well [24]. Their planar chromen-4-one (benzo-γ-pyrone) core is structurally analogous to the adenine ring of ATP, allowing the hinge-region hydrogen bonding that characterizes ATP-competitive kinase inhibition, while the number and position of hydroxyl and methoxyl substituents modulate both affinity and physicochemical behavior [25]. Dietary flavonoids such as luteolin, apigenin, fisetin, kaempferol, morin, quercetin and their methylated derivatives have repeatedly been reported to exert neuroprotective [26], antioxidant and anti-inflammatory effects in experimental models of neurodegeneration [27]. Their principal limitations, such as variable intestinal absorption, extensive phase II metabolism and inconsistent blood–brain barrier penetration, are precisely the properties that in silico absorption, distribution, metabolism, excretion and toxicity (ADMET) prediction is able to filter at an early stage, which makes a large commercial flavonoid library an efficient starting point for computational prioritization [28]. Network pharmacology provides the conceptual framework required to exploit this chemistry rationally. Rather than evaluating a single ligand against a single protein, it constructs compound–target–disease relationships, assembles them into protein–protein interaction networks, and uses topological and functional criteria to identify the nodes through which a multi-target effect is most likely to be exerted. When combined with pharmacokinetic filtering, biological activity prediction, functional enrichment analysis, independent gene–disease association databases and structure-based docking, this strategy narrows a large chemical space to a small number of experimentally testable compound–target pairs and supplies a mechanistic hypothesis for each of them [29,30]. Kinase inhibitory activity was adopted as the primary prioritization criterion for two converging reasons [30]. Mechanistically, the principal molecular lesions of Alzheimer’s disease are kinase-dependent: tau hyperphosphorylation is driven by GSK-3β, CDK5 and the extracellular signal-regulated kinase (ERK)/c-Jun N-terminal kinase (JNK) cascades; amyloid precursor protein processing and clearance are modulated by PI3K-Akt-mTOR signaling; and the brain insulin resistance that accompanies the disease is itself a defect of kinase-mediated signal transduction [8,15,23]. Chemically, the chromen-4-one core of the flavonoid scaffold is a recognized ATP-mimetic, capable of hinge-region hydrogen bonding within the ATP-binding cleft, so kinases represent the target class for which this chemotype is a priori most likely to yield genuine binders [31]. A stringent PASS threshold (Pa > 0.90) was therefore applied, accepting a deliberate loss of chemical diversity in exchange for a candidate set enriched in compounds whose predicted mechanism is both structurally plausible and disease-relevant [30]. Despite this rationale, the existing computational literature on flavonoids in Alzheimer’s disease leaves a specific gap. Most published studies dock a small number of well-known dietary flavonoids, typically quercetin, luteolin, kaempferol or fisetin, against a single pre-selected protein, most often acetylcholinesterase, BACE1 or GSK-3β, so that the target is fixed before the chemistry is examined and any multi-target behavior is assumed rather than measured [32,33]. Studies that do apply network pharmacology, conversely, frequently stop at the enrichment stage and report hub genes without carrying them forward into structure-based screening, or they perform docking without demonstrating that the protocol reproduces the crystallographic binding mode of each receptor [34]. Pharmacokinetic filtering, in turn, is commonly applied at the end of the workflow as a post hoc description of compounds that have already been selected, rather than as a constraint imposed on the chemical space from the outset [35]. Three questions follow from this gap, and they organize the present work. The first is whether multi-target engagement within the Alzheimer kinase module is a genuine property of particular flavonoids or an artefact of comparing docking scores obtained at receptors whose scoring baselines differ. The second is which member of that module is best supported when topological centrality, module membership, pathway membership, independent gene–disease association and binding performance are weighed together rather than singly, given that these criteria are not interchangeable and need not converge on the same protein. The third is whether the compound–target pair so identified behaves as a stable bound state under explicit-solvent dynamics, and whether the contacts it maintains fall within the ATP-binding cleft, as the ATP-mimetic character long attributed to the chromen-4-one scaffold would predict but is seldom tested.
To address these questions, a commercially available library of 264 flavonoids was filtered for Lipinski compliance, prioritized by predicted kinase-related activity, mapped to their probable human protein targets and intersected with the Alzheimer’s disease gene set. The resulting common targets were analyzed topologically, functionally annotated, validated against an independent gene–disease association database and interrogated by hierarchical molecular docking under a protocol validated separately at each receptor by re-docking of the co-crystallized ligand, whose XP score was retained as the structure-specific baseline against which the flavonoid scores are read. The single compound–target complex carrying the strongest combined support was then examined over 100 ns of molecular dynamics simulation with MM-GBSA decomposition and analysis of the dominant collective motions. Predicted pharmacokinetic behavior is reported after the docking campaign, as a characterization of the leading candidates and a statement of the developmental constraint that applies to them, rather than as a selection filter.
2. Results
2.1. ADMET Filtering and Activity-Based Prioritization of the Flavonoid Library
Of the 264 flavonoid entries prepared from the Selleck Chemicals library, 160 compounds satisfied the predefined pkCSM pharmacokinetic and safety criteria and were carried forward. Subsequent prioritization with PASS Online, applied to the kinase-related activity spectrum, reduced this set to 49 compounds with a probability of activity (Pa) greater than 0.90 for kinase inhibition. These 49 prioritized compounds constituted the chemical space used for target prediction, network construction, and, after structure preparation, for the docking campaign against the validated core targets.
2.2. Target Prediction and Identification of Overlapping Targets
Target prediction of the prioritized flavonoids with SwissTargetPrediction returned 249 predicted human protein targets, which were consolidated into 224 unique gene targets after removal of duplicates and standardization of identifiers in UniProt. The intersection of these 224 compound-related targets with the 1045 Alzheimer’s disease-associated protein-coding genes retrieved from MalaCards identified 76 shared genes, corresponding to 6.4% of the combined gene space (Figure 1). These 76 genes represent the targets that are simultaneously reachable by the screened flavonoids and implicated in the disease, and they were therefore used as the input set for all subsequent network pharmacology analyses.
Figure 1.
Venn diagram of the intersection between Alzheimer’s disease-associated genes (List 1) and predicted flavonoid targets (List 2), showing 76 common targets.
2.3. Protein–Protein Interaction Network Analysis
The PPI network was constructed from the 76 common target genes, of which 75 genes formed the connected interaction network, while one gene showed no detected interactions under the applied STRING confidence threshold. The resulting connected network comprised 75 nodes and 725 edges, with an average node degree of 19.1 and an average local clustering coefficient of 0.628 (Figure 2). These parameters indicate a highly interconnected network characterized by extensive protein–protein associations and a relatively high degree of local connectivity among the identified targets. The observed number of interactions (725 edges) was substantially higher than the 275 interactions expected by chance. Consistently, the PPI enrichment analysis demonstrated a highly significant enrichment (p < 1.0 × 10⁻¹⁶), indicating that the target proteins interact with each other significantly more frequently than would be expected for a random set of proteins. This finding supports the presence of non-random functional associations among the common targets and suggests that these proteins may participate in coordinated biological processes related to Alzheimer’s disease.
Figure 2.
Protein–protein interaction (PPI) network of the common target genes (75 nodes, 725 edges). Node colours are arbitrary and carry no biological meaning; edge colours denote the type of supporting evidence.
The high connectivity and clustering of the network indicate that the identified targets are organized into an interconnected molecular network rather than functioning as independent components. Such network organization may reflect coordinated interactions among multiple signaling, regulatory, and disease-associated proteins. Accordingly, the connected PPI network was subsequently imported into Cytoscape software (version 3.10.4) for topological analysis, and the cytoHubba plugin was employed to identify highly connected and structurally important hub genes for subsequent functional enrichment, pathway analysis, and molecular investigation.
2.4. Topological Analysis and Identification of Hub Genes
The constructed PPI network was further analyzed in Cytoscape in order to investigate the topological importance of individual target proteins and to identify potential hub genes. The imported network consisted of 75 nodes and 725 edges, with an average number of neighbors of 19.333, indicating a highly interconnected protein interaction network. The network formed a single connected component, suggesting that the majority of the identified targets were functionally linked rather than existing as isolated proteins.
To identify the most influential proteins within the network, the cytoHubba plugin was applied using two complementary topological algorithms. The MCC analysis ranked the top 15 hub candidates as SRC, BCL2, AKT1, MAPK1, ESR1, MAPK3, BRAF, HSP90AA1, CTNNB1, MAPK8, GSK3B, MTOR, MMP9, PTGS2, and MAP2K1 (Figure 3a). These proteins exhibited high MCC values, indicating their involvement in highly interconnected regions of the PPI network and suggesting their potential structural importance within the network.
Figure 3.
(a) Top 15 genes ranked according to the Maximal Clique Centrality (MCC) calculation. (b) Top 15 genes ranked according to the Degree centrality calculation. (c) Overlapping genes between the MCC and Degree centrality rankings (12 consensus hub genes). In (a,b) the node colour encodes the rank of each gene within the top fifteen, from the highest-ranked to the lowest-ranked, and carries no meaning beyond rank. In (c) the red and blue circles represent the MCC and Degree top-fifteen lists respectively, and the twelve genes in their intersection are the consensus hub genes.
Degree centrality analysis identified the top 15 highly connected hub candidates as HSP90AA1, SRC, CTNNB1, AKT1, BCL2, ESR1, MAPK3, MAPT, MAPK1, GSK3B, APP, MAPK8, PIK3R1, MTOR and PTGS2 (Figure 3b). The Degree-based ranking reflects the number of direct interactions associated with each protein and therefore highlights the targets that serve as major connection points within the interaction network.
Comparison of the two topological analyses revealed 12 overlapping genes: SRC, BCL2, AKT1, MAPK1, ESR1, MAPK3, HSP90AA1, CTNNB1, MAPK8, GSK3B, MTOR and PTGS2 (Figure 3c). These overlapping genes were considered consensus hub genes, as they were consistently ranked among the top 15 targets by both MCC and Degree centrality. Their identification by two complementary topological approaches provides additional support for their central position and potential biological relevance within the PPI network. The consensus hub genes were subsequently used as candidate core targets for further analysis and validation, and their involvement in multiple interconnected regulatory processes may provide insight into the molecular mechanisms underlying Alzheimer’s disease.
2.5. Identification of a High-Density Functional Module (MCODE Cluster 1)
To identify highly interconnected functional modules within the PPI network, MCODE analysis was performed in Cytoscape. The analysis revealed a significant high-density cluster (Cluster 1) with an MCODE score of 15.25, consisting of 22 nodes (Figure 4). The MCODE score reflects the density and degree of interconnectivity among proteins within the identified cluster; a higher score therefore indicates a more densely connected module with stronger protein–protein associations and a greater likelihood of representing a functionally related protein module.
Figure 4.
MCODE analysis divided the network into three clusters; the constituent members of the highest-scoring Cluster 1 (MCODE score = 15.25; 22 nodes) are shown. MCODE, Molecular Complex Detection.
The identified cluster included several important regulatory targets: AKT1, BCL2, HSP90AA1, ESR1, CTNNB1, SRC, MMP9, PPARG, MTOR, PTGS2, MAPK1, MAPK3, MAPK8, MAP2K1, BRAF, GSK3B, IGF1R, AR, ESR2, PPARA, BCL2L1 and SLC2A1. The presence of multiple consensus hub genes within the same highly interconnected module suggests that these proteins may participate in coordinated biological processes rather than functioning as independent targets. The cluster contained key regulators of several important cellular processes, including apoptosis regulation (BCL2, BCL2L1), kinase-mediated signaling (AKT1, MTOR, MAPK1, MAPK3, MAPK8, MAP2K1, BRAF, GSK3B), transcriptional regulation (ESR1, ESR2, AR, PPARG, PPARA), and inflammatory and extracellular remodeling processes (PTGS2, MMP9).
The identification of this highly connected module suggests that Cluster 1 represents a functionally important component of the PPI network and may contribute to the molecular mechanisms underlying Alzheimer’s disease. The high clustering density and the extensive interactions among its constituent proteins further support its potential role as a central regulatory module, and the genes contained within it were therefore considered potential key functional components and were included in the subsequent functional enrichment and pathway analyses. Notably, all 12 consensus hub genes identified through the combined MCC and Degree centrality analyses were also present within the top-ranked MCODE cluster. This concordance between independent topological approaches provides additional support for their central position within the PPI network and strengthens their prioritization as potential core targets.
2.6. Gene Ontology Enrichment Analysis
Gene Ontology enrichment analysis revealed significant enrichment across the three major functional categories: Biological Process (BP), Molecular Function (MF), and Cellular Component (CC). The overall enrichment pattern is presented using complementary visualization approaches, with the bar chart highlighting the relative enrichment of the most prominent GO terms based on the calculated enrichment score (−log10 p-value) [36] (Figure 5) and the bubble plot providing an integrated visualization of the statistical significance of the enriched terms (Figure 6). All selected GO terms showed significant enrichment after Benjamini correction (adjusted p < 0.05) [37].
Figure 5.
Bar chart showing the most prominently enriched GO terms across Biological Process (BP), Molecular Function (MF) and Cellular Component (CC). The enrichment score was calculated as −log10 (p-value), with higher values indicating stronger statistical significance. GO, Gene Ontology.
Figure 6.
Bubble plot of the selected significantly enriched GO terms across BP, MF and CC. The x-axis represents the −log10-transformed Benjamini-adjusted p-value, providing a visualization of statistical significance after multiple-testing correction. GO, Gene Ontology; BP, Biological Process; MF, Molecular Function; CC, Cellular Component.
Within the Biological Process category, the strongest enrichment was observed for negative regulation of the apoptotic process, followed by the insulin receptor signaling pathway, response to oxidative stress, cellular response to hypoxia, and the stress-activated MAPK cascade. Other enriched processes included negative regulation of autophagy, phosphatidylinositol 3-kinase/protein kinase B signal transduction, cellular response to amyloid-beta, long-term synaptic potentiation and regulation of myelination (Figure 5 and Figure 6). These findings indicate that the target network is associated with apoptosis regulation, cellular stress responses, intracellular signaling and neuronal functional processes.
For Molecular Function, protein kinase activity showed the highest enrichment score, followed by protein serine kinase, protein serine/threonine kinase and protein tyrosine kinase activities. Notably, tau protein binding, phosphatidylinositol 3-kinase binding, nitric-oxide synthase regulator activity, protein phosphatase binding, MAP kinase activity and insulin receptor binding were also significantly enriched (Figure 5 and Figure 6). This pattern highlights the involvement of kinase-mediated signaling and protein-interaction functions, including molecular functions related to tau-associated mechanisms.
In the Cellular Component category, prominent enrichment was observed for axon, dendrite, mitochondrion, lysosome and protein-containing complex, with additional enrichment in glutamatergic synapses, postsynaptic, endosome, synapse and myelin sheath (Figure 5 and Figure 6). These findings indicate that the identified targets are associated with neuronal structures, synaptic compartments and intracellular organelles relevant to neuronal function and cellular homeostasis. Overall, the complementary GO visualizations demonstrate a coherent functional profile involving apoptotic regulation, oxidative and cellular stress, PI3K/AKT and MAPK signaling, kinase activity, tau-related molecular interactions and neuronal and synaptic compartments, supporting the functional relevance of the identified target network to the molecular mechanisms underlying Alzheimer’s disease.
2.7. KEGG Pathway Enrichment and Pathway-Based Prioritization
KEGG pathway enrichment analysis was performed in order to further investigate the biological pathways associated with the target network. The enriched pathways were distributed across four major functional categories: Environmental Information Processing, Cellular Processes, Organismal Systems and Human Diseases (Figure 7). Among the identified pathways, Human Diseases represented a prominent functional category, with Alzheimer disease showing the highest gene count (21 genes), followed by several cancer-related pathways including prostate cancer (17 genes), breast cancer (13 genes), colorectal cancer (11 genes) and pancreatic cancer (10 genes). The enrichment of Parkinson disease (9 genes) further indicated an association of the target network with neurodegenerative disease-related pathways.
Figure 7.
KEGG pathway enrichment of the target network: identification of genomic and metabolic networks associated with multi-target therapeutic responses in complex diseases. KEGG, Kyoto Encyclopedia of Genes and Genomes.
Within the Environmental Information Processing category, several major signaling pathways were enriched, including the PI3K-Akt signaling pathway (18 genes), MAPK signaling pathway (16 genes), mTOR signaling pathway (12 genes), FoxO signaling pathway (11 genes), HIF-1 signaling pathway (10 genes) and TNF signaling pathway (10 genes). These pathways are involved in diverse cellular processes related to signal transduction, cell survival, stress responses and metabolic regulation.
Among the Cellular Processes, apoptosis (13 genes) and autophagy–animal (12 genes) were prominently enriched, suggesting the involvement of regulatory mechanisms governing cell survival and cellular homeostasis. In the Organismal Systems category, the insulin signaling pathway (13 genes) was notably enriched together with neuronal and synaptic pathways, including cholinergic synapse (8 genes), dopaminergic synapse (7 genes) and long-term potentiation (6 genes). Collectively, the KEGG enrichment profile indicates that the target network is associated with interconnected signaling, cellular regulatory, metabolic and neurodegeneration-related pathways. The prominent representation of the Alzheimer disease pathway, in particular, provided a disease-relevant basis for the subsequent pathway-based prioritization of the hub genes (Figure 8).
Figure 8.
The eight core targets positioned on the Alzheimer-associated signaling axis identified in this study. The targets are arranged by their position in the cascade rather than by their position on any published pathway map: AKT1 lies downstream of impaired insulin and PI3K signaling and upstream of GSK-3β, mTOR, the ERK1/2 pair and MAPK8, while the two non-kinase targets enter through Wnt signaling (CTNNB1) and the inflammatory arm (PTGS2). Solid arrows denote activation or promotion, bar-ended connectors denote inhibitory phosphorylation, and dashed connectors denote indirect or modulatory relationships. The value beside each target is its DisGeNET gene–disease association score from Table 1, and the bar beneath it is the corresponding normalised score. The figure is original to this work; the pathway membership it depicts was obtained from the KEGG Alzheimer disease pathway (hsa05010) through KEGG Mapper. KEGG, Kyoto Encyclopedia of Genes and Genomes.
Table 1.
DisGeNET-based validation of the core targets associated with Alzheimer’s disease.
2.8. Intersection of the Hub Genes with the Alzheimer Disease Pathway
To further refine the candidate targets identified from the PPI network, a pathway-based prioritization step was performed by focusing on the Alzheimer disease pathway, which showed the highest gene count among the disease-related pathways with 21 target genes (Figure 7). These 21 pathway-associated genes were compared with the 12 consensus hub genes identified through the overlap of the MCC and Degree centrality analyses.
The intersection resulted in eight genes: GSK3B, PTGS2, MTOR, MAPK8, AKT1, MAPK1, CTNNB1 and MAPK3. These eight targets therefore demonstrated both high topological importance within the PPI network and direct involvement in the Alzheimer disease pathway, providing an additional layer of pathway-based support for their prioritization. The convergence of network topology and disease-specific pathway mapping identified these eight genes as the most strongly supported candidate targets within the constructed network, and they were accordingly prioritized for subsequent molecular investigation and target-based molecular docking analysis.
2.9. Gene–Disease Association Scores of the Core Targets
To further validate the core targets identified through the network pharmacology and pathway analyses, the eight selected genes were evaluated using the DisGeNET database. All eight targets showed documented associations with Alzheimer’s disease, providing independent database-based evidence supporting their potential relevance to the disease (Table 1).
Among the investigated targets, GSK3B exhibited the highest gene–disease association score (1.05) and normalized score (0.68), indicating the strongest database-supported association with Alzheimer’s disease among the selected targets. This finding is particularly important because GSK3B was also identified through the network and pathway analyses, demonstrating convergence between network-based prioritization and independent disease–gene association evidence, and further supporting its potential importance as a key molecular target in Alzheimer’s disease.
AKT1 showed the second-highest GDA score (0.60) and normalized score (0.39), followed by MTOR (0.55; 0.35) and PTGS2 (0.50; 0.32). These relatively high scores provide additional evidence supporting the involvement of these targets in Alzheimer’s disease. Notably, AKT1 and MTOR are functionally interconnected with major intracellular signaling processes involved in neuronal survival, cellular metabolism and synaptic regulation, whereas PTGS2 is associated with inflammatory processes that may contribute to neurodegenerative mechanisms.
The remaining targets—MAPK8, CTNNB1, MAPK1 and MAPK3—also demonstrated positive associations with Alzheimer’s disease, with GDA scores of 0.45, 0.40, 0.35 and 0.25 respectively and normalized scores of 0.29, 0.26, 0.23 and 0.16. Although these targets showed comparatively lower association scores than GSK3B, AKT1, MTOR and PTGS2, their documented disease associations provide additional support for their inclusion among the core targets, and the differences in GDA scores may reflect variation in the amount and strength of the available gene–disease evidence rather than an absence of biological relevance.
Overall, the targets were ranked according to their GDA scores as GSK3B > AKT1 > MTOR > PTGS2 > MAPK8 > CTNNB1 > MAPK1 > MAPK3. Importantly, the consistency between the initial PPI/network analysis, the identification of the targets within the Alzheimer’s disease pathway and the independent DisGeNET associations strengthens the reliability of the selected targets. This multi-level convergence provides a stronger rationale for their subsequent investigation using molecular docking, and the validated targets were therefore considered as candidate protein targets for the docking analysis, together with their ranking from the network pharmacology analysis and the other selection criteria.
2.10. Validation of the Docking Protocol
Before the flavonoid library was screened, the docking protocol was validated for each of the eight core targets by re-docking the corresponding co-crystallized ligand into its prepared receptor under the same XP settings. All eight targets reproduced the crystallographic binding mode with a heavy-atom RMSD below the conventional 2 Å acceptance threshold (Table 2). The closest agreement was obtained for PTGS2 (0.304 Å), followed by MAPK8 (0.366 Å), MTOR (0.377 Å), MAPK1 (0.482 Å), CTNNB1 (0.698 Å) and GSK3B (0.863 Å), while MAPK3 (1.034 Å) and AKT1 (1.046 Å) showed the largest deviations, both nevertheless well within the accepted range. These results indicate that the receptor preparation, grid definition and Glide extra-precision (XP) settings used in this study reproduce experimentally observed binding modes across the whole target panel, and the same settings were therefore applied without modification to the virtual screening described below.
Table 2.
Crystal structures, receptor grid parameters, re-docking validation and reference-ligand XP scores for the eight core targets.
The XP score obtained for each re-docked crystallographic ligand was retained as an internal, structure-specific baseline (Table 2). These baselines spanned a wide range, from −10.920 kcal/mol for the MAPK1 ligand 8XN to −2.515 kcal/mol for the CTNNB1 ligand R9Q, which confirms directly that Glide extra-precision (XP) scores are not comparable between different proteins and that each target must be interpreted against its own reference. Measured against these baselines, the best flavonoid outscored the crystallographic ligand at five of the eight targets: GSK3B (Diosmetin −9.60 against 7YG −4.599), MAPK8 (Isorhamnetin −10.19 against CFK −7.144), CTNNB1 (Morin −5.82 against R9Q −2.515), MTOR (Luteolin −11.76 against X6K −9.953) and AKT1 (Robinetin −8.83 against CQW −7.418). At the three remaining targets, the crystallographic ligand retained the advantage, marginally at MAPK1 (8XN −10.920 against Robinetin −10.043) and PTGS2 (FLF −10.697 against Primuletin −9.791), and more clearly at MAPK3 (38Z −10.124 against Kaempferol −7.76).
Two of these comparisons are particularly informative for the interpretation of the weaker targets. At CTNNB1, the co-crystallized ligand itself scored only −2.515 kcal/mol, below every flavonoid listed in Table 3, so the uniformly weak values obtained at this target reflect the properties of the binding surface rather than a deficiency of the flavonoid scaffold. At MAPK3, by contrast, the crystallographic ligand reached −10.124 kcal/mol, demonstrating that this site is capable of accommodating high-scoring ligands; the intermediate flavonoid values obtained there therefore indicate a genuinely less favorable fit. The contrast with MAPK1, where Robinetin came within 0.88 kcal/mol of its reference, separates the two ERK isoforms on structural rather than methodological grounds.
Table 3.
Top five compounds according to the Glide extra-precision (XP) docking scores for each core target (kcal/mol).
These comparisons are presented as an internal calibration and not as evidence of superior affinity. Glide extra-precision (XP) is an empirical scoring function whose values are influenced by ligand size, flexibility and polarity, and a score exceeding that of a crystallographic ligand does not establish that the compound binds more tightly than that ligand experimentally. The baselines are used here only to indicate whether the flavonoid scores obtained at each site fall within a range that the site itself is able to support.
2.11. Molecular Docking and Multi-Target Screening of the Candidate Flavonoids
Molecular docking was subsequently performed to investigate the potential interactions of the selected flavonoid compounds with the eight core targets identified through the network pharmacology and target-validation analyses, namely PTGS2, MAPK8, CTNNB1, MTOR, AKT1, MAPK3, MAPK1 and GSK3B. The XP docking results demonstrated that the investigated compounds exhibited different binding profiles across the selected targets, indicating a target-dependent pattern of predicted binding affinity (Table 3).
Several compounds showed favorable docking scores against individual targets. For PTGS2, Primuletin showed the most favorable predicted binding score (−9.791), followed by 7-hydroxyflavone (−9.703), β-naphthoflavone (−9.620), 6-methylflavone (−9.463) and 4′-methoxyflavone (−9.351). With the single exception of Primuletin, which also appeared among the top-ranked compounds for MAPK3, none of these ligands recurred among the leading binders of the kinase targets.
For MAPK8, Isorhamnetin showed the highest docking score (−10.19), followed by Morin (−9.49), Kaempferol (−9.45), Apigenin (−8.52) and Robinetin (−8.51). The presence of several compounds with favorable scores against MAPK8 suggests that this target may provide a suitable binding environment for multiple flavonoid structures.
The MTOR target produced the most favorable docking results of the entire panel. Luteolin gave the strongest score (−11.76), followed by Scutellarein (−11.50), Robinetin (−11.29), Diosmetin (−11.28) and Hydroxygenkwanin (−10.61). All five compounds scored below −10.5 kcal/mol and were separated by little more than 1 kcal/mol, indicating that the mTOR binding site accommodates the polyhydroxylated scaffold particularly well and that the ranking within this group should be regarded as provisional.
GSK3B also showed favorable interactions with several compounds. Diosmetin was the top-ranked compound (−9.60), followed by Hydroxygenkwanin (−9.33), 7,8-dihydroxyflavone (−8.81), 3,6-dihydroxyflavone (−8.65) and Fisetin (−8.55). These findings are particularly relevant because GSK3B was identified as one of the core targets in the network pharmacology analysis and carried the strongest independent disease-association evidence, providing a computational link between target prioritization and ligand-binding predictions.
For AKT1, Robinetin exhibited the strongest predicted binding (−8.83), followed by Isorhamnetin (−8.25), 5,4′-dihydroxyflavone (−7.95), Fisetin (−7.91) and Luteolin (−7.83). MAPK1 showed an even stronger overall docking profile, with Robinetin ranking first (−10.04), followed by Morin (−9.61), Luteolin (−9.43), Fisetin (−8.81) and Apigenin (−8.48).
The two remaining targets behaved differently from one another. For CTNNB1, the docking scores were uniformly weak, with Morin (−5.82), Luteolin (−5.68), Diosmetin (−5.65), Robinetin (−5.57) and 5,4′-dihydroxyflavone (−5.54) occupying the leading positions and Hydroxygenkwanin (−4.99) following them; the whole set spanned less than 1 kcal/mol, so the ranking discriminates poorly between compounds. MAPK3, by contrast, returned intermediate but internally consistent scores, with Kaempferol (−7.76), Diosmetin (−7.59), Oroxylin A (−7.383), Primuletin (−6.54) and 5,4′-dihydroxyflavone (−6.51) ranking highest. The CTNNB1 values therefore indicate limited ligand-binding compatibility under the docking conditions used here, whereas the MAPK3 values, although lower than those obtained against MTOR, MAPK1 and MAPK8, remain within a range compatible with genuine occupancy of the binding site.
2.11.1. Identification of Multi-Target Candidate Compounds
In addition to the absolute XP docking score, the recurrence of individual compounds across multiple targets was examined as an important criterion for prioritizing potential multi-target candidates. This approach is particularly relevant within a network pharmacology framework, in which compounds acting on multiple disease-associated targets may provide a more comprehensive mechanistic explanation of the predicted therapeutic effects.
Among the compounds investigated, Robinetin showed the most prominent multi-target profile. It was identified among the top-ranked compounds against MAPK8, CTNNB1, MTOR, AKT1 and MAPK1, with its strongest predicted interactions observed against MTOR (−11.29) and MAPK1 (−10.043). Robinetin was the only compound in the screen to reach five of the eight core targets, and it was also the best-ranked ligand of both AKT1 (−8.83) and MAPK1, which together make it the strongest candidate for further investigation.
Luteolin also demonstrated a broad multi-target profile, appearing among the top-ranked compounds against CTNNB1, MTOR, AKT1 and MAPK1. Its interaction with MTOR (−11.76) was the single strongest score recorded in the entire docking campaign, followed by MAPK1 (−9.43). Although its scores against CTNNB1 and AKT1 were weaker, its recurrence across four of the eight targets supports its consideration as a genuine multi-target compound.
Diosmetin was identified against four targets—CTNNB1, MTOR, MAPK3 and GSK3B—with especially favorable scores against MTOR (−11.28) and GSK3B (−9.60), the latter being the best score obtained against GSK3B in the wholescreen. Morin (MAPK8, CTNNB1, MAPK1), Fisetin (AKT1, MAPK1, GSK3B), Hydroxygenkwanin (CTNNB1, MTOR, GSK3B) and 5,4′-dihydroxyflavone (CTNNB1, AKT1, MAPK3) each recurred against three targets. Isorhamnetin reached only two targets, MAPK8 and AKT1, but produced the highest individual score recorded against MAPK8 (−10.19), illustrating that a high score against a single target and a broad multi-target profile are distinct properties that do not necessarily coincide.
2.11.2. Receptor-Normalized Ranking of the Docking Scores
The comparison made in the preceding section, and the multi-target counts derived from it, presuppose that an XP score obtained at one receptor is commensurable with a score obtained at another. The re-docking controls reported in Section 2.10 show that this presupposition does not hold. The XP score of the co-crystallized ligand ranged from −2.515 kcal/mol at CTNNB1 to −10.920 kcal/mol at MAPK1, a spread of 8.4 kcal/mol that exceeds the differences separating the screened flavonoids at any single receptor. Each receptor therefore carries its own scoring baseline, and a raw score reports the receptor as much as the ligand.
To separate the two contributions, every XP score was expressed as a ratio to the score obtained by the co-crystallized ligand of the same receptor, so that a value above 1.0 denotes a compound scoring better than the ligand resolved in that crystal structure and values obtained at different receptors are referred to a common structural standard. Because normalization divides by a receptor-specific constant, it leaves the ranking of compounds within any single receptor unchanged; what it alters is the comparison between receptors, which is precisely the comparison on which multi-target claims depend. Stated formally, the normalized score of compound i at receptor j is Sij(norm) = Sij/S(ref,j), where Sij is the Glide extra-precision (XP) score of the compound at that receptor and S(ref,j) is the XP score obtained by re-docking the co-crystallized ligand of the same receptor under identical grid and scoring settings. Both quantities are negative, so the ratio is positive, and a value above unity denotes a compound scoring better than the crystallographic reference. Two properties of this definition should be stated explicitly. It is appropriate for the purpose it serves, which is to remove the receptor-specific offset that makes raw Glide scores incommensurable between binding sites; because the divisor is a constant within a receptor, the transformation is a linear rescaling. It is not, however, a correction for the properties of the reference molecule. The reference ligands differ in size, chemistry and binding mode, and Glide scores scale with ligand size, so the divisor carries the character of that molecule as well as that of the site: a receptor whose crystallographic ligand is small or weakly bound returns inflated ratios, as is the case for CTNNB1 and GSK3B and as is set out below. The normalized values are therefore used here to compare orderings rather than as an absolute measure of fit, and the correlation analyses of Section 4.24 and Section 4.25 are unaffected by the choice, the Pearson coefficient being invariant to linear rescaling. Eighty compound–target pairs, comprising 37 distinct flavonoids and the ten highest-ranked compounds at each of the eight receptors, entered the analysis (Table 4).
Table 4.
Receptor-specific XP baselines and the effect of normalization on the docking results. The baseline is the XP score of the re-docked co-crystallized ligand of each receptor; n is the number of compounds reaching the XP stage at that receptor; the normalized score is the ratio of a compound’s XP score to that baseline, and values above 1.0 denote compounds scoring better than the crystallographic ligand.
The effect on the ranking was substantial. When the eighty pairs were ordered by raw XP score and then by normalized score, the two orderings proved unrelated (Spearman ρ = 0.078, p = 0.49); every pair changed position by a mean of 25.8 places and by as many as 70. Luteolin at MTOR, the strongest score of the entire campaign, fell to 26th place once referred to its baseline, with MTOR carrying the second most demanding reference of the set. Conversely, Kaempferide at CTNNB1, ranked 56th on the raw scale, returned the highest normalised value of the matrix (2.907). Thirteen of the 37 compounds changed the target against which they scored best.
Three receptors behaved differently from the remaining five. At MAPK1, MAPK3 and PTGS2, no compound reached the baseline of its own receptor, the highest normalized values being 0.923, 0.771 and 0.915 respectively, even though the raw scores obtained there were among the most favorable of the campaign. On the raw scale, these three receptors appear to be engaged; measured against their own crystallographic ligands, they are not. At AKT1, GSK3B, MTOR, MAPK8 and CTNNB1, by contrast, between seven and ten of the ten compounds exceeded the baseline.
The normalized values must nevertheless be read together with the absolute baseline from which they derive. CTNNB1 (−2.515 kcal/mol) and GSK3B (−4.599 kcal/mol) possess weak reference ligands, so that a moderate absolute score yields a high ratio: the leading normalized value of the matrix corresponds to a raw score of only −7.31 kcal/mol. A high ratio at such a receptor indicates that the compound is not inferior to the crystallographic ligand, not that the interaction is strong in absolute terms. Interpretation therefore requires both quantities together, and this requirement governs the target prioritization described in Section 2.11.5.
Among the leading compounds, Robinetin exceeded the baseline at four of its five receptors (MAPK8 1.197, AKT1 1.196, MTOR 1.138 and CTNNB1 2.211, against 0.923 at MAPK1), Diosmetin and Fisetin at four of five each, and Luteolin at three of its four. Of the receptors carrying a demanding baseline, AKT1 is the one at which Robinetin returned its highest normalized value, and Robinetin is in turn the best-normalized of the ten compounds docked against AKT1.
2.11.3. Selection of the Three Leading Compounds
Based on the combined evaluation of the XP docking scores and the recurrence of compounds across the core targets, three compounds were prioritized as the leading candidates for subsequent analysis: Robinetin, Luteolin and Diosmetin. Robinetin was prioritized because it occurred across five core targets while retaining consistently high scores, and because it was the best-ranked ligand of both AKT1 (−8.83) and MAPK1 (−10.043). Luteolin was selected because of its distribution across four targets and because it produced the strongest single score of the campaign against MTOR (−11.76). Diosmetin was selected because of its distribution across four targets and because it was the best-ranked binder of GSK3B (−9.60), the target carrying the strongest independent disease-association evidence. Isorhamnetin was retained as a secondary candidate based on its leading score against MAPK8 (−10.19), notwithstanding its narrower target coverage.
Importantly, the selection of these three compounds was based on a combined ranking strategy rather than on the docking score against a single protein. This approach reduces the possibility of selecting a compound solely because of an exceptionally favorable score against one target while disregarding its overall multi-target profile.
2.11.4. Target Prioritization for the Subsequent Molecular Dynamics Simulation
Following the identification of the three leading compounds, the next filtering step focused on determining the most strongly supported compound–target pairs. For each selected compound, the corresponding docking scores across the eight targets were compared, and priority was given to targets showing both high predicted binding affinity and repeated representation within the multi-target docking profile.
On this basis, MTOR emerged as a particularly important target because it returned the strongest docking scores of the entire panel with several of the leading compounds, including Luteolin (−11.76), Robinetin (−11.29) and Diosmetin (−11.28). MAPK1, MAPK8 and GSK3B also showed strong interactions with several of the leading compounds. The final compound–target pairs selected for molecular dynamics simulation were therefore determined after examination of the corresponding binding poses and protein–ligand interactions.
This additional filtering step is important because the strongest docking score alone does not necessarily represent the most biologically meaningful complex. Accordingly, the XP score, the recurrence of the compound across targets, the recurrence of the target among the leading compounds and the quality of the protein–ligand interactions were collectively considered before selecting the final complexes. Overall, the docking analysis demonstrated that several flavonoids possess predicted multi-target binding potential toward the core targets associated with Alzheimer’s disease, and the recurrence of Robinetin, Luteolin and Diosmetin across multiple targets is particularly noteworthy. The integration of docking affinity with multi-target recurrence provides a rational strategy for reducing the initial compound–target combinations to a smaller number of biologically relevant candidates.
2.11.5. Selection of the Priority Target for Molecular Dynamics Simulation
To prioritize the target for the subsequent molecular dynamics simulation, the eight validated core targets were comparatively evaluated by integrating their network centrality, disease-association evidence and molecular docking results alongside their enrichment profiles in the biological pathway analysis.
Among the targets investigated, AKT1 demonstrated a strong and consistent overall profile. As shown in Table 5, it exhibited a degree score of 48 (ranked fourth) and the third-highest MCC score (19,349). In addition, AKT1 showed a high MCODE score of 15.25296, supporting its importance within the identified protein–protein interaction network. The DisGeNET analysis further supported the disease relevance of AKT1, with a GDA score of 0.60 and a normalized score of 0.39. The selection of AKT1 was reinforced by the KEGG pathway enrichment analysis, which prominently identified the PI3K-Akt signaling pathway as a core regulatory network in which AKT acts as a central mediator governing cell survival, metabolism and disease-related processes.
Table 5.
Integrated selection criteria supporting the prioritization of AKT1 for molecular dynamics simulation.
The docking analysis provided additional support for the prioritization of AKT1. Among the screened flavonoids, Robinetin exhibited the most favorable predicted binding score against AKT1 (XP score = −8.83), followed by Isorhamnetin (−8.25), 5,4′-dihydroxyflavone (−7.95), Fisetin (−7.91) and Luteolin (−7.83). Therefore, the integration of network-based prioritization, pathway enrichment (specifically the PI3K-Akt signaling pathway), disease-association evidence and docking performance identified AKT1 as a promising target for further structural investigation, while Robinetin was identified as the leading ligand for this target.
Accordingly, the AKT1–Robinetin complex was prioritized for subsequent binding-interaction analysis and was considered a candidate complex for molecular dynamics simulation (Figure 9a,b). Final inclusion in the MD analysis was based on confirmation of favorable protein–ligand interactions and binding-pose quality. The two-dimensional interaction diagram shows the hydrogen-bonding and hydrophobic contacts formed by the ligand within the binding pocket, while the three-dimensional representation illustrates the accommodation of the flavonoid scaffold within the corresponding binding site.
Figure 9.
(a) Two-dimensional interaction diagram of the AKT1–Robinetin complex, showing the interacting amino acid residues within the binding pocket. Residues are coloured by type: green, hydrophobic; cyan, polar; orange, negatively charged; violet, positively charged. Magenta arrows denote hydrogen bonds and point towards the acceptor. (b) Three-dimensional binding pose of Robinetin within the AKT1 binding site, with the protein shown as a ribbon and the ligand as sticks; oxygen atoms are red and dashed lines denote hydrogen bonds.
2.11.6. ADMET and Pharmacokinetic Profiling of the Prioritized Flavonoids
The pharmacokinetic and toxicological behavior of the three leading compounds, Robinetin, Luteolin and Diosmetin, together with the secondary candidates Isorhamnetin and Hydroxygenkwanin, was subsequently examined to characterize the compounds that had emerged from the docking campaign. Donepezil, a clinically approved anti-Alzheimer agent, was profiled under identical settings and is reported alongside the flavonoids as a reference standard, so that the predicted values are interpreted comparatively rather than in absolute terms (Table 6). It should be emphasized that these descriptors were not used as an exclusion filter at any stage of the workflow; compound selection was governed by Lipinski compliance, predicted activity and docking performance, and the present analysis serves to characterize the leading candidates rather than to justify their selection.
Table 6.
Predicted ADMET and physicochemical profile of the three leading flavonoids and the two secondary candidates, compared with the reference drug donepezil, computed with the pkCSM server under identical settings.
All five flavonoids complied fully with Lipinski’s rule of five without any violation, whereas donepezil approached the lipophilicity limit with a calculated Log P of 4.36. Predicted human intestinal absorption was high across the entire set, ranging from 76.01% for Isorhamnetin to 84.88% for Hydroxygenkwanin, although consistently lower than the value obtained for donepezil (93.71%). The same ordering was reflected in the Caco-2 model: donepezil exceeded the threshold of 0.90 log Papp that denotes high permeability, whereas all five flavonoids fell below it, Robinetin being the lowest of the series (−0.563). All six molecules were predicted to be substrates of P-glycoprotein; donepezil, however, was additionally predicted to inhibit both P-glycoprotein isoforms, whereas none of the flavonoids did. The flavonoids therefore remain subject to intestinal and blood–brain barrier efflux without the compensating self-inhibition of the transporter that is predicted for the reference drug. The distribution parameters revealed the most pronounced divergence between the two groups. Donepezil returned a favorable central exposure profile (log BB 0.157; log PS −1.464), consistent with its clinical use in Alzheimer’s disease, whereas the flavonoids were uniformly predicted to distribute poorly to the brain, with log BB values between −0.907 and −1.403, all below the −0.3 threshold associated with poor blood–brain barrier penetration. Isorhamnetin (−3.188) and Robinetin (−3.288) fell below the log PS value of −3, which in the pkCSM framework denotes an inability to penetrate the central nervous system, while Luteolin, Diosmetin and Hydroxygenkwanin occupied the intermediate range between −2 and −3 in which penetration is regarded as uncertain. Conversely, the flavonoids displayed substantially higher predicted free fractions (0.068–0.201) than donepezil (0.000), indicating less extensive sequestration by plasma proteins and a correspondingly larger fraction available for distribution and elimination. The volumes of distribution were comparable for Luteolin (1.153) and Isorhamnetin (1.123) and those of donepezil (1.266), whereas Hydroxygenkwanin returned the most restricted value of the series (0.278).
With respect to metabolism, none of the flavonoids was predicted to be a substrate or an inhibitor of CYP2D6 or CYP3A4, in contrast to donepezil, which was predicted to be both a substrate and an inhibitor of the two isoforms, a recognized source of clinically relevant drug–drug interactions. The flavonoids instead shared a uniform inhibition of CYP1A2, with additional inhibition of CYP2C9 and CYP2C19 predicted for Diosmetin and Hydroxygenkwanin and of CYP2C9 alone for Luteolin. The interaction liability of the flavonoid series is therefore distinct from, and narrower than, that of the reference drug, although it is not absent. Predicted total clearance was lower for all five flavonoids (0.364–0.598 log mL/min/kg) than for donepezil (0.987), and none of them was predicted to be a substrate of the renal OCT2 transporter.
The toxicity endpoints favored the flavonoids consistently. All five were predicted to be AMES-negative, non-hepatotoxic and non-sensitizing, and none was predicted to inhibit either hERG I or hERG II, whereas donepezil was flagged both as hepatotoxic and as an hERG II inhibitor. Predicted chronic tolerability was likewise more favorable for the flavonoid series, with lowest-observed-adverse-effect-level (LOAEL) values between 2.271 and 2.723 log mg/kg/day compared with 0.991 for donepezil, and the acute oral LD50 values were of the same order for all six compounds (2.338–2.753 mol/kg). Luteolin, Isorhamnetin and Robinetin additionally exceeded the threshold of 0.477 log mg/kg/day that denotes a high maximum tolerated dose in humans. Taken together, the prioritized flavonoids present a cleaner predicted safety profile than the reference drug, but a markedly less favorable profile of delivery to the central compartment, and this contrast defines the principal developmental requirement for the series.
2.12. Molecular Dynamics Simulation of the AKT1–Robinetin Complex
The AKT1–Robinetin complex prioritized by the integrated analysis was simulated for 100 ns in explicit solvent in two independent replicates, and each production trajectory was examined with respect to conformational stability, residue flexibility, secondary-structure content, persistence of the protein–ligand interactions, MM-GBSA binding energetics and dominant collective motions.
2.12.1. Conformational Stability of the Complex (RMSD)
The RMSD profile showed that the protein underwent an initial structural adjustment, which was followed by comparatively smaller conformational changes throughout the remainder of the trajectory. The Cα RMSD increased rapidly during the early part of the simulation and converged to 2.0–2.2 Å after approximately 10 ns. Subsequent variation remained mostly within 2.0–3.3 Å, with occasional excursions to 3.5–3.7 Å in the later part of the trajectory, and the final segment was maintained at approximately 3.0–3.3 Å (Figure 10). The protein therefore did not remain identical to its starting geometry but explored a conformational space moderately displaced from it.
Figure 10.
RMSD profile of the AKT1–Robinetin complex over the 100 ns molecular dynamics simulation, showing the conformational stability of the protein and of the ligand. RMSD, root-mean-square deviation.
The ligand, in contrast, displayed markedly smaller internal deviation. The ligand RMSD remained mostly within 0.2–0.4 Å, with only occasional peaks in the region of 0.6–0.7 Å. Since this quantity is computed after fitting the ligand to its own reference conformation, these low values indicate that the internal geometry of Robinetin was essentially unchanged during the simulation and that the conformational adjustment of the protein was not transmitted to the ligand. It should be noted that the ligand RMSD reported in this way reflects the internal fluctuation of the ligand rather than its displacement from the binding site. That displacement was therefore measured separately, as the ligand RMSD computed after superposition of the protein backbone on the reference frame. It is 3.20 ± 0.43 Å over the whole production run and 3.22 ± 0.38 Å over the equilibrated segment, with 75.7% of frames between 3 and 4 Å, 22.1% between 2 and 3 Å and fewer than 1% beyond 4 Å. Robinetin did not therefore remain at the docked geometry: it moved approximately 3.2 Å during the early part of the trajectory and then held that displaced position, the dispersion about it over the last 25 ns being smaller than 0.4 Å. The two quantities should be read together. The internal RMSD of 0.28 ± 0.08 Å shows that the ligand itself did not change conformation, and the displacement of 3.2 ± 0.4 Å shows that the rigid molecule settled into a pose different from the one predicted by docking. That the new pose lies within the same site, and engages the same residues, is established by the contact analysis of Section 2.12.2: over the equilibrated segment the ligand engages 4.50 ± 0.74 distinct residues through 5.51 ± 0.75 hydrogen bonds per frame, every frame carries at least one, and the individual occupancies are Asp439 100.0%, Glu228 99.6%, Glu234 96.0%, Ala230 82.9% and Tyr437 58.6%. The accurate description of run 1 is that the docked pose relaxed, within the first part of the run, into a distinct and highly stable pose in the same ATP site; it is not that the docked geometry itself was reproduced over 100 ns. The replicate shows that this displacement is not a fixed property of the complex. In run 2, the same measurement gives 1.56 ± 0.44 Å over the whole trajectory and 1.39 ± 0.32 Å over the equilibrated segment, with 78.4% of frames between 1 and 2 Å and none beyond 4 Å, so the ligand stayed at the docked pose throughout. The two runs therefore bracket the behavior: starting from the same geometry, Robinetin either remains at the docked pose or relaxes about 3 Å within the same cleft, and in both cases the resulting pose is held with a dispersion below 0.5 Å for the rest of the run. What is reproduced is occupancy of the ATP site; the precise pose within it is not.
The approach to equilibrium was assessed quantitatively rather than by inspection. Non-overlapping 20 ns blocks gave Cα RMSD means of 2.05, 2.36, 2.82, 2.84 and 3.15 Å, and the within-block standard deviation fell from 0.40 Å in the first block to 0.16–0.21 Å from 40 ns onwards, so the frame-to-frame scatter had stabilized well before the end of the run. The block means themselves continued to rise slowly, the increments between the last three 10 ns blocks being 0.15 and 0.04 Å, and the running 10 ns mean first came within 0.3 Å of the mean of the final 20 ns for the window beginning at 44 ns. The trajectory therefore settles into a displaced but stationary basin rather than returning towards its starting geometry: over the last 25 ns the Cα RMSD was 3.12 ± 0.20 Å and over the last 10 ns 3.17 ± 0.21 Å, against 2.25 ± 0.36 Å over the first 44 ns, the backbone, side-chain and all-heavy-atom RMSD over the last 25 ns being 3.13 ± 0.18, 4.12 ± 0.19 and 3.62 ± 0.19 Å respectively. The interval from 75 to 100 ns, in which the scatter is smallest and the residual drift is least, was accordingly adopted as the equilibrated segment for the frame-resolved analyses reported below. Because the snapshots used for the MM-GBSA calculation lie on a 10 ns grid, the corresponding post-equilibration subset for that calculation is the set of six snapshots that follow the 44 ns onset, namely those at 50–100 ns.
The second replicate reproduced this behavior. In run 2 the Cα RMSD rose over the first third of the trajectory and then settled in the same manner, the 20 ns block means being 2.14, 2.23, 2.68, 2.68 and 2.85 Å against 2.05, 2.36, 2.82, 2.84 and 3.15 Å in run 1, and the running 10 ns mean first came within 0.3 Å of the mean of the final 20 ns at 36 ns against 44 ns in run 1. Over the equilibrated segment the two runs gave 2.84 ± 0.12 and 3.12 ± 0.20 Å for the Cα RMSD, 2.82 ± 0.11 and 3.13 ± 0.18 Å for the backbone, 4.05 ± 0.08 and 4.12 ± 0.19 Å for the side chains and 3.42 ± 0.09 and 3.62 ± 0.19 Å for all heavy atoms. The internal deviation of the ligand was equally small in both, 0.20 ± 0.06 Å in run 2 against 0.28 ± 0.07 Å in run 1 over the same segment. The displaced but stationary plateau, the time at which it is reached and the rigidity of the ligand are therefore properties of the complex rather than of a single trajectory. A complete run-to-run comparison of every quantity derived from the two trajectories is given in Supplementary Table S5.
2.12.2. Residue Flexibility (RMSF)
Analysis of the residue-wise RMSF profile showed that most regions of the protein fluctuated within a relatively narrow range of 0.6–1.5 Å, while a small number of regions were considerably more mobile. The most pronounced peaks, of approximately 5 Å, were in the C-terminal region (Figure 11). These localized maxima indicate flexibility confined to loops and terminal segments rather than a generalized mobility of the entire protein.
Figure 11.
Residue-wise root-mean-square fluctuation (RMSF) profile of AKT1 in complex with Robinetin. The trace shows the local flexibility of each residue over the trajectory, and the green vertical lines mark the residues that are in contact with the ligand. RMSF, root-mean-square fluctuation.
2.12.3. Secondary-Structure Analysis
The residues in contact with the ligand, indicated on the profile, were largely located within regions of low fluctuation. Mobility was therefore concentrated in peripheral regions that do not contribute directly to ligand recognition, so that a structurally organized binding environment was maintained throughout the simulation.
The replicate gave the same flexibility profile. The mean Cα fluctuation over the whole protein was 1.23 ± 0.95 Å in run 2 against 1.22 ± 0.89 Å in run 1, in both cases with the maximum in the C-terminal segment (9.70 and 7.91 Å respectively), and in both the residues in contact with the ligand fluctuated less than the protein as a whole (0.91 ± 0.37 Å over the 28 contact residues of run 2 and 0.86 ± 0.33 Å over the 21 of run 1). The partition of the structure into a comparatively rigid ligand-binding core and a mobile periphery is therefore reproducible.
The overall fold was examined further by secondary-structure analysis. Over the trajectory, the structure comprised 24.50% α-helix and 14.22% β-strand, corresponding to a total secondary-structure content of 38.72%. The time-resolved SSE profile remained mostly within the high-30% to low-40% range for the whole of the 100 ns trajectory and showed only small local variations (Figure 12). The absence of a substantial change in the content of the major helical and strand regions indicates that the conformational changes reflected in the RMSD profile were not accompanied by extensive disruption of the secondary structure or by global unfolding.
Figure 12.
Time-dependent secondary-structure elements (SSE) of AKT1 during the 100 ns simulation. The upper panel shows the total secondary-structure content (% SSE) as a function of simulation time. The lower panel shows the secondary-structure assignment of each residue over the trajectory, with red denoting α-helical and cyan β-strand regions. SSE, secondary-structure elements.
The replicate agreed. In run 2, the total secondary-structure content averaged approximately 37.5% over the trajectory, against 38.72% in run 1, and varied by only a few percent about that value, so the fold was preserved to the same extent in both runs.
2.12.4. Persistence of the Protein–Ligand Interactions
Contact analysis revealed a well-defined interaction network composed of hydrogen bonds, hydrophobic contacts and water-mediated interactions, each interaction being expressed as the fraction of the trajectory over which it was maintained. In run 1, the most prominent contacts involved Glu228, Ala230, Glu234, Tyr437, Phe438 and Asp439 (Figure 13). Glu228 and Ala230 lie in the hinge region of the AKT1 ATP-binding cleft, so that the persistence of these contacts indicates that, in this run, Robinetin remained within the site occupied by the co-crystallized ligand of the receptor structure used for docking. Whether the individual occupancies are themselves reproducible is examined against the replicate below.
Figure 13.
Profile of the protein–ligand contacts maintained during the simulation, expressed as the fraction of the trajectory over which each interaction is retained. Green denotes hydrogen bonds, light purple hydrophobic contacts and dark blue water-mediated contacts (water bridges). A value above 1.0 indicates that the residue forms more than one contact of that type with the ligand over the trajectory.
The interaction timeline showed that the complex maintained several simultaneous protein–ligand contacts at any given point of the trajectory, with short-term fluctuation in their identity. Continuous interaction patterns were observed in run 1 for Glu228, Glu234, Tyr437, Phe438 and Asp439. Retention of the ligand was thus not dependent on any single residue but on a sustained combination of direct and water-mediated interactions.
Restricting the analysis to the equilibrated segment did not alter the picture obtained from the whole trajectory. Over 75–100 ns, the ligand engaged 4.50 ± 0.74 distinct residues through 5.51 ± 0.75 hydrogen bonds per frame, against 4.51 ± 0.72 residues and 5.48 ± 0.77 hydrogen bonds over the full run, and every frame of the segment carried at least one hydrogen bond. The individual occupancies were preserved or improved: Asp439 100.0%, Glu228 99.6%, Glu234 96.0%, Ala230 82.9% and Tyr437 58.6% over 75–100 ns, against 97.4%, 98.9%, 97.8%, 86.9% and 55.0% respectively over the whole trajectory. The ligand descriptors were equally unaffected, the radius of gyration being 3.787 ± 0.025 Å over the segment against 3.786 ± 0.024 Å over the whole run, the molecular surface area 255.6 ± 1.4 Å2 against 255.7 ± 1.3 Å2, the polar surface area 282.3 ± 2.6 Å2 against 282.4 ± 2.6 Å2 and the internal RMSD 0.28 ± 0.07 Å against 0.28 ± 0.08 Å, while the solvent-accessible surface area of the ligand fell slightly, from 35.3 ± 11.8 Å2 to 30.7 ± 10.7 Å2, consistent with a marginally more enclosed pose in the equilibrated segment. The interaction network described above is therefore a property of the equilibrated segment of the trajectory and not an average dominated by the early relaxation.
The contact network, by contrast, did not reproduce, and this is the one respect in which the two trajectories differ materially. In run 2, the ligand engaged 2.98 ± 1.16 distinct residues through 3.10 ± 1.25 hydrogen bonds per frame, against 4.51 ± 0.72 residues and 5.48 ± 0.77 hydrogen bonds in run 1, and the identity of the partners changed. Of the five residues that dominated run 1, only Glu234 was preserved at comparable occupancy (83.1% against 97.8%); Glu228 fell from 98.9% to 46.2% and Ala230 from 86.9% to 25.5% as a hydrogen-bond partner, the latter being replaced in part by a water bridge of 47.1% occupancy; and Tyr437 and Asp439, which were maintained for 55.0% and 97.4% of run 1, formed no hydrogen bond at all in run 2, Asp439 persisting only as an 11.2% water-mediated contact and Tyr437 not appearing among the contact residues. Three partners that were negligible in run 1 became major ones in run 2: the catalytic Lys179 (60.0% against 11.2%), the Asp-Phe-Gly (DFG) motif aspartate Asp292 (46.0% against 1.2%) and Lys158 (34.1% against 0.9%). The hydrophobic environment was unchanged throughout—Val164 59.8%, Met281 39.5%, and Ala177 29.3%—and Phe293 of the DFG motif entered the contact set, so in run 2 the ligand engaged the catalytic machinery of the ATP cleft rather than leaving the cleft.
Read together, the two runs separate what is reproducible here from what is not. Occupancy of the ATP cleft is reproducible: in both trajectories the ligand remains in the site for the whole 100 ns, maintains a hydrogen bond to Glu234 and a contact at the hinge residue Glu228, and is surrounded by the same hydrophobic residues. The particular hydrogen-bond network is not reproducible: which polar residues are engaged, and for what fraction of the trajectory, differs between two runs that begin from the same geometry and differ only in their initial velocities. Occupancies quoted from a single trajectory to two significant figures, as is usual in this literature and as the submitted version of this work did, therefore characterize that trajectory rather than the complex. The contact analysis supports the conclusion that Robinetin occupies the ATP site of AKT1 and is retained there; it does not support a specific hydrogen-bonding model of how it is held, and none is advanced here.
2.12.5. MM-GBSA Binding-Energy Estimates
MM-GBSA binding-energy estimates were obtained for eleven snapshots taken at uniform 10 ns intervals over the whole production trajectory (Table 7; the per-snapshot values and the complete decomposition of each snapshot are given in Supplementary Table S4). All eleven estimates were strongly negative, and the quantity was stable across the sampled ensemble, with a mean ΔGbind of −148.47 ± 16.66 kcal/mol (range −172.32 to −113.15 kcal/mol), a relative standard deviation of 11.2% and a standard error of the mean of 5.02 kcal/mol. Restricting the average to the six snapshots that follow the onset of equilibration at 44 ns, those at 50–100 ns, gave −139.96 ± 16.20 kcal/mol, which lies within one standard deviation of the full-trajectory value and indicates that the estimate is not an artefact of the starting docked geometry. The energetic decomposition was likewise consistent from snapshot to snapshot. The van der Waals term provided the largest favorable contribution (−88.05 ± 10.08 kcal/mol) and was in relative terms the least variable of the attractive terms (11.4%), followed by the lipophilic (−53.87 ± 8.32 kcal/mol, 15.4%) and the Coulombic (−31.73 ± 30.33 kcal/mol) contributions, with a smaller but persistent hydrogen-bonding term (−7.38 ± 2.44 kcal/mol), while generalized-Born polar solvation opposed complex formation (+32.98 ± 25.19 kcal/mol). The frame-to-frame variability of ΔGbind originates almost entirely in the Coulombic and the polar-solvation terms, which are strongly anticorrelated with one another across the eleven snapshots (r = −0.96) and whose sum is nearly invariant (+1.25 ± 9.33 kcal/mol); the dispersive and lipophilic contributions, which together account for the majority of the favorable signal, vary by only 11–15%. The dominance of the dispersive and lipophilic terms over a near-cancelling electrostatic contribution is in agreement with the contact analysis and with the hydrogen-bonding and close-range interactions observed around Glu228, Glu234, Tyr437, Phe438 and Asp439.
Table 7.
MM-GBSA binding-energy estimates and individual energetic contributions of the AKT1–Robinetin complex, averaged over eleven snapshots taken at uniform 10 ns intervals across the 100 ns production trajectory. Values are mean ± standard deviation; the average restricted to the six snapshots that follow the equilibration onset at 44 ns (those at 50–100 ns) is given for comparison. Per-snapshot values are listed in Supplementary Table S4.
The replicate puts the magnitude of this estimate in perspective. The same calculation on eleven snapshots of run 2 gave a mean ΔGbind of −125.83 ± 18.34 kcal/mol (range −147.91 to −99.22 kcal/mol; −128.62 ± 14.53 kcal/mol over 50–100 ns), against −148.47 ± 16.66 kcal/mol in run 1. The difference between the two run means, 22.6 kcal/mol, exceeds the standard deviation within either run, so the between-run variance of this quantity is larger than its within-run variance, and the pooled estimate over both trajectories is −137.15 ± 20.66 kcal/mol across 22 snapshots. The decomposition, by contrast, is reproducible in both structure and sign: the van der Waals term is again the largest favorable contribution (−79.97 ± 10.75 kcal/mol in run 2 against −88.05 ± 10.08), the lipophilic term is essentially identical (−54.19 ± 6.51 against −53.87 ± 8.32), the hydrogen-bonding term is small and favorable in both (−5.63 ± 3.00 against −7.38 ± 2.44), and the Coulombic and polar-solvation terms are again strongly anticorrelated (r = −0.97 in run 2 against −0.96 in run 1) and again largely cancel. The absolute value of the MM-GBSA estimate is therefore not reproducible between replicates to better than about 20 kcal/mol, which is a further reason, independent of the methodological ones given in Section 4.18, for reading it as a relative rather than an absolute quantity. What is reproducible is the composition of the interaction: dispersive and lipophilic burial dominate, and electrostatics very nearly cancel against desolvation.
2.12.6. Principal Component Analysis
The dominant collective motions sampled along the trajectory were characterized by PCA, which reduced the multidimensional conformational space to a small number of principal components. PC1 accounted for 23.92% of the overall structural variance, PC2 for 14.79% and PC3 for 7.31%, so that the first three components together described 46.02% of the conformational variance (Figure 14). The conformational populations visible in the PC1–PC2 projection were partially distinct but connected: the trajectory progressed from negative to positive PC1 values, indicating a transition between two related conformational states, and the color gradient across the projected space shows that this progression was time-ordered rather than random.
Figure 14.
Principal component analysis (PCA) of the AKT1–Robinetin complex during the molecular dynamics simulation. The three scatter plots show the projection of the trajectory onto the first three principal components; each point is one frame, coloured by simulation time from red (start) to blue (end). The lower-right panel is the scree plot, with the cumulative percentage of variance labelled at selected ranks.
A comparable separation was observed in the PC1–PC3 projection, in which most points lay in the positive quadrant of PC1 while the remaining, more dispersed points occupied the negative quadrant. The PC2–PC3 projection showed considerably more overlap, indicating that these secondary modes correspond to more localized structural fluctuations than the principal mode of motion. The eigenvalue (scree) profile decreased steeply over the first few modes and then levelled off, showing that most of the structural motion was carried by a small number of collective modes.
2.12.7. Dynamic Cross-Correlation Analysis
The dynamic cross-correlation matrix showed that the residue motions were largely organized throughout the protein. The pronounced diagonal band corresponds to the expected self-correlation and to the coordinated motion of neighboring residues, while several off-diagonal regions indicate positively correlated motions between spatially distinct parts of the structure. Regions of anti-correlated motion were also present between blocks of residues located in the N-terminal, central and C-terminal regions, indicating that these segments moved in opposite directions (Figure 15). These anti-correlated regions were localized rather than global, and the remaining areas of the matrix showed weak or negligible correlation, as expected for regions that fluctuate independently. The complex therefore displayed coordinated global dynamics without extensive structural disruption.
Figure 15.
Dynamic cross-correlation matrix (DCCM) derived from the molecular dynamics trajectory of the AKT1–Robinetin complex. Each cell gives the correlation coefficient between the motions of a pair of residues, from +1.0 (fully correlated) through 0 (uncorrelated) to −1.0 (fully anti-correlated). The dark diagonal is the self-correlation of each residue with itself and is 1.0 by definition.
2.13. Structural and Ligand-Side Determinants of the Multi-Target Profile, and Their Generalization to an Unrelated Library
2.13.1. ATP Pockets Are More Conserved than the Overall Folds
Pocket definitions comprised 20 residues for AKT1, 21 for GSK3B, 23 for MTOR, 21 for MAPK8, 30 for MAPK1 and 31 for MAPK3. After superposition on AKT1, whole-protein RMSD values were 2.765 Å (GSK3B), 2.633 Å (MAPK8), 2.352 Å (MAPK1), 2.303 Å (MAPK3) and 4.414 Å (MTOR). Restricting the comparison to structurally equivalent pocket positions reduced these values to 0.97, 1.19, 0.99 and 1.08 Å, respectively, a mean reduction of 1.46 Å (Table 8). Coverage of pocket positions ranged from 62.7% to 82.9% among the five kinases, but reached only 9.1–15.1% for every MTOR pair, and MTOR was excluded on this basis.
Table 8.
Whole-protein and pocket-restricted RMSD relative to AKT1 (3CQW). Pocket RMSD is computed over structurally equivalent Cα pairs (<3.0 Å after superposition) within the 5 Å ATP-site definition. MTOR was excluded from pocket comparison (coverage < 20%).
Pairwise pocket sequence identity spanned 29.4% (GSK3B–MAPK8) to 95.2% (MAPK1–MAPK3), with the remaining eight pairs between 31.2% and 52.6% (Supplementary Table S1). The ATP site is therefore substantially better conserved than the fold that carries it, while still differing appreciably in composition between the more distant pairs.
2.13.2. The Pockets Are of Comparable Predicted Druggability
SiteMap returned a single site coincident with the crystallographic ligand for each receptor. SiteScore ranged narrowly from 1.028 (GSK3B) to 1.120 (AKT1) and Dscore from 1.029 (AKT1, MAPK1) to 1.090 (MAPK3), placing all six sites above the conventional threshold for a druggable site (Table 9). This uniformity was maintained despite a twofold spread in site volume, from 328.3 Å3 (MAPK8) to 653.8 Å3 (MAPK3), and a corresponding spread in physicochemical character, MAPK8 being the most hydrophobic site (phobic 1.386) and AKT1 the most hydrophilic (philic 1.342). The six ATP sites are thus functionally comparable as ligand-binding environments while differing in size and polarity.
Table 9.
SiteMap characterization of the ATP site of each receptor.
2.13.3. Score Patterns Agree Between All Kinase Pairs but Not with Pocket Similarity
Docking scores of the 49 compounds were available at all five kinases, and the pairwise Pearson correlation between receptors ranged from 0.475 (MAPK1–GSK3B) to 0.796 (MAPK3–AKT1), with a mean of 0.693 (Supplementary Table S2). Every pair was therefore strongly correlated, irrespective of how similar the two pockets were.
Regressing these ten coefficients on pocket sequence identity gave no evidence of a positive relationship (Pearson r = −0.335, nominal p = 0.34; Mantel p = 0.290; Supplementary Figure S1). The trend was stable under leave-one-pair-out recomputation (−0.25 to −0.45), so it is not driven by any single pair, including the near-identical MAPK1–MAPK3 pair. The two extremes make the point directly: MAPK1 and MAPK3, whose pockets are 95.2% identical, correlated at r = 0.637, whereas MAPK3 and AKT1, at 31.2% identity, correlated more strongly at r = 0.796. The absolute differences in each of the eight SiteMap descriptors were likewise not predictive of score-pattern agreement (all Mantel p ≥ 0.22).
2.13.4. Cross-Target Score Agreement Is an Effect of Ligand Hydroxylation
We then tested the ligand side of the same question. The number of free hydroxyl groups, which ranges from 0 to 5 across the series, was strongly and negatively correlated with the docking score at every receptor: r = −0.895 at AKT1, −0.848 at MAPK3, −0.847 at MAPK8, −0.798 at MAPK1 and −0.709 at GSK3B, corresponding to 50.2–80.1% of the score variance at a single target and to 88.9% of the variance of the target-averaged score (Table 10, Figure 16a). Polyhydroxylated compounds such as morin, robinetin, luteolin and kaempferol occupied the top of every ranking, and permethoxylated compounds such as nobiletin, sinensetin and tangeretin the bottom of every ranking. The hydroxyl count is not, however, an isolated descriptor. Across the 162 prepared compounds of the flavonoid library, it is appreciably correlated with the hydrogen-bond acceptor count (r = +0.672) and inversely with log P (r = −0.630), and more weakly with molecular weight (r = +0.397) and polar surface area (r = +0.327); only the rotatable-bond count is independent of it (r = −0.099). The shared variance with the most strongly associated descriptor is 45%, so the descriptors are correlated but not redundant, and the hydroxyl count carries information the others do not. What this analysis resolves is therefore a polarity axis, of which free hydroxyl count is the dominant and most readily interpretable marker in a congeneric flavone series, rather than an isolated cause of the cross-target agreement.
Table 10.
Correlation between Glide extra-precision (XP) docking score and the number of free hydroxyl groups of the ligand.
Figure 16.
Cross-target score agreement is an effect of ligand hydroxylation. (a) Glide XP docking score against the number of free hydroxyl groups for the 49 flavonoids at each of the five kinases; points are jittered horizontally for clarity and the lines are least-squares fits, with one colour per receptor as given in the legend. Hydroxyl count explains 50–80% of the score variance at every receptor. (b) Pearson correlation between receptors for each of the ten pairs, computed on the raw scores (dark blue bars) and on the residuals after regressing out hydroxyl count (orange bars). The mean coefficient falls from 0.693 to 0.080.
When the hydroxyl-count contribution was regressed out, and the inter-receptor correlations recomputed on the residuals, the mean coefficient fell from 0.693 to 0.080 (Figure 16b). Individual pairs lost 54–98% of their apparent agreement, and no pair retained a significant residual correlation after accounting for multiple comparisons. Essentially all of the cross-target agreements that would otherwise be read as evidence of shared binding determinants are therefore accounted for by a single ligand descriptor.
2.13.5. Score Agreement Is at Least as Strong in a Chemically Diverse Library
Across the 122 compounds of the diverse library, all fifteen receptor pairs were strongly correlated, from r = 0.690 (AKT1–MAPK3) to r = 0.863 (GSK3B–MAPK1 and GSK3B–MAPK8), with a mean of 0.776—higher than the 0.693 obtained for the flavonoids. Singular value decomposition of the standardized score matrix placed 81.4% of its total variance on the first principal component, against 75.7% for the flavonoids (Figure 17a). A single latent axis therefore governs docking scores across all six receptors in both libraries, irrespective of chemistry. The provenance of this library is given in full in Section 4.26 and is summarized here because the selection is central to the inference. The Selleck bioactive collection L1400 (3667 records, 3666 parsed) was sampled for 150 compounds at random under a fixed random seed of 42, with no filter on activity, structure or predicted property; one record proved unreadable, leaving 149; compounds above 600 Da were excluded as too large to be accommodated in an ATP site, leaving 127 compounds and 296 prepared structures; and of these, 122 returned complete score and descriptor data at all six receptors. No step of the selection was conditioned on a docking result, and the fixed seed makes the draw reproducible.
Figure 17.
Cross-target score agreement generalizes to an unrelated chemical library. (a) Variance of the column-standardized docking-score matrix carried by each principal component, for the 49 flavonoids at five kinases and for 122 compounds of a diverse bioactive library at six targets; a single axis carries 75.7% and 81.4% of the variance respectively. (b) Target-averaged docking score against hydrogen-bond donor count in both libraries (free hydroxyl count for the flavonoids); points are jittered horizontally, and lines are least-squares fits. (c) Mean inter-target Pearson correlation before and after regressing out ligand descriptors—one descriptor for the flavonoids, eight for the diverse library. The agreement is removed in the congeneric series and largely survives in the diverse one. Throughout, dark blue denotes the flavonoid series and orange the chemically diverse library; in (c) the paler shade of each colour is the mean correlation after regressing out the ligand descriptors.
As in the flavonoid series, this agreement showed no detectable relationship with how similar the pockets are. Regressing the ten kinase-pair coefficients on pocket sequence identity gave r = −0.110 (Mantel p = 0.86), and the contrast between the extremes was inverted: the near-identical MAPK1–MAPK3 pair (95.2% pocket identity) correlated at r = 0.773, whereas the least similar pair examined, GSK3B–MAPK8 (29.4% identity), was tied for the highest coefficient in the set at r = 0.863 (Supplementary Table S3).
2.13.6. Hydrogen-Bond Donor Capacity Is the Dominant Ligand-Side Determinant in Both Libraries
Of the eight descriptors tested, the count of hydrogen-bond donors showed the strongest association with the target-averaged score (r = −0.632, R2 = 0.400, p = 5.8 × 10⁻¹⁵), followed by polar surface area (r = −0.570), the combined nitrogen-and-oxygen count (r = −0.530) and hydrogen-bond acceptors (r = −0.495); molecular weight and molecular volume were weak (R2 = 0.070 and 0.031, Table 11). The donor association was uniform in both direction and magnitude across all six individual receptors, from r = −0.54 to −0.59.
Table 11.
Correlation of each QikProp descriptor with the docking score in the diverse library (n = 122 compounds, six receptors).
This identifies the same determinant as in the flavonoid series, in which the free hydroxyl count—which is the hydrogen-bond donor count for that scaffold—explained 50–80% of the score variance at individual targets and 89% of the target-averaged score. Donor capacity is therefore not a peculiarity of flavonoid hydroxylation but the leading ligand-side axis in both libraries (Figure 17b). The same caution applies here as in the flavonoid series. Across the 122 compounds, donor capacity is strongly correlated with polar surface area (r = +0.751) and appreciably with the acceptor count (r = +0.610), the combined nitrogen-and-oxygen count (r = +0.609), log P (r = −0.577) and the rotatable-bond count (r = +0.566), while remaining almost independent of molecular weight (r = +0.240) and molecular volume (r = +0.161). Donor capacity is accordingly read throughout as the strongest single marker of a correlated polarity cluster and not as an isolated determinant.
2.13.7. The Agreement Is Reducible in a Congeneric Series but Not in a Diverse One
The two libraries diverge on whether this determinant accounts for the whole effect. In the flavonoid series, regressing out a single descriptor reduced the mean inter-receptor correlation from 0.693 to 0.080, an 88% reduction. In the diverse library, a model containing all eight descriptors explained only 43–47% of the score variance at each receptor, and recomputing the pair correlations on its residuals reduced the mean coefficient from 0.776 to 0.655, leaving 84% of the original agreement intact (Figure 17c).
Cross-target score agreement is therefore a general property of the docking calculation rather than a scaffold-specific artefact, and it is only apparently correctable. In a congeneric series, where the compounds vary along essentially one structural axis, that axis absorbs the entire effect and the agreement appears to be the consequence of a single descriptor. In a chemically heterogeneous library, the same agreement is present, and stronger, but is not captured by standard physicochemical descriptors: a substantial component of it is attributable to no measured ligand property, and none of it is attributable to the similarity of the targets.
3. Discussion
3.1. Principal Findings
This study applied a sequential in silico pipeline in which each analytical layer was used to constrain the next, so that a commercial library of 264 flavonoids was reduced to a small number of experimentally testable compound–target pairs. Drug-likeness filtering removed 104 compounds, activity-based prioritization retained 49, and target prediction mapped these compounds onto 224 unique human proteins, of which 76 were shared with the Alzheimer’s disease gene set. The topology of the resulting interaction network was clearly non-random: 725 observed edges against 275 expected by chance, and a local clustering coefficient of 0.628 indicates that the flavonoid-reachable fraction of the disease proteome is organized as a functional module rather than as a collection of unrelated proteins. Two independent centrality measures converged on 12 hub genes, all of which were contained within the densest MCODE module, and intersection with the Alzheimer disease KEGG pathway reduced these to eight core targets. Every one of the eight was independently supported by DisGeNET, and the docking campaign identified both target-selective and multi-target flavonoids among them.
3.2. A Kinase-Centered Core Network Underlies the Predicted Effect
The composition of the final target set warrants explicit comment, since six of the eight core targets (AKT1, GSK3B, MTOR, MAPK1, MAPK3 and MAPK8) are protein kinases. This is in part a consequence of the Pa > 0.90 kinase filter applied at the prioritization stage and should not be presented as an unbiased discovery. What the filter does not explain, however, is the identity of the kinases retained, nor the survival of two non-kinase targets. Compound prioritization selected for kinase-directed chemistry in general; it exerted no pressure toward the tau-, insulin- and autophagy-associated kinases specifically, and none toward PTGS2 or CTNNB1, which entered and remained in the core set on network and pathway grounds alone. The convergence of the retained kinases on a single coherent signaling axis, and the concordance of that axis with the GO and KEGG signatures, therefore carries information beyond the selection criterion itself.
The composition of the eight core targets is informative in itself. Six of the eight are protein kinases (GSK3B, MTOR, AKT1, MAPK1, MAPK3, MAPK8), one is an inflammatory enzyme (PTGS2), and one is a transcriptional co-activator of the Wnt pathway (CTNNB1). This composition is consistent with the selection strategy, since kinase-related activity was the criterion used for compound prioritization, but it is also consistent with the pathology being modeled: the same kinases mediate tau phosphorylation, insulin signal transduction, autophagic control and stress-activated responses, all of which are dysregulated in Alzheimer’s disease.
Within this set, GSK3B carried the strongest independent evidence of disease association (GDA score 1.05; normalized score 0.68), well above AKT1 (0.60), MTOR (0.55) and PTGS2 (0.50). This ranking is biologically coherent rather than incidental. GSK-3β is the principal tau kinase in neurons, contributes to amyloid precursor protein processing, is held in check by Akt-mediated phosphorylation at Ser9, and links insulin resistance to tau pathology; the volume of published gene–disease evidence supporting it therefore exceeds that of the other core targets. The concordance between a purely topological ranking derived from the interaction network, a pathway-based ranking derived from KEGG, and a literature-derived ranking from DisGeNET is one of the more reassuring features of the present analysis, because the three ranking criteria are methodologically independent of one another.
The remaining core targets extend the mechanistic picture rather than duplicating it. MTOR and AKT1 lie on the same PI3K-Akt-mTOR axis that governs neuronal survival, autophagic clearance of aggregated proteins and metabolic control; MAPK8 (JNK1) mediates stress-activated signaling and apoptotic priming; MAPK1 and MAPK3 (ERK2 and ERK1) participate in synaptic plasticity and in tau phosphorylation at distinct epitopes; PTGS2 (COX-2) contributes to the neuroinflammatory component; and CTNNB1 connects the network to Wnt signaling, which is itself under GSK-3β control. The eight targets therefore describe a single interconnected axis rather than eight separable mechanisms, which is precisely the situation in which a multi-target ligand is expected to outperform a selective one.
3.3. The Functional Signature Is Disease-Consistent
The enrichment analyses provide an internal check on whether the network assembled from predicted targets actually resembles Alzheimer’s disease biology, and they do so without any information from the docking stage. Several of the enriched terms are difficult to explain as artefacts of the selection procedure: tau protein binding among molecular functions, cellular response to amyloid-beta and long-term synaptic potentiation among biological processes, and axon, dendrite, glutamatergic synapse, post synapse and myelin sheath among cellular components. Equally notable is the prominence of the insulin receptor signaling pathway and insulin receptor binding, which recovers the insulin-resistance component of the disease that is not captured by amyloid- or tau-centered models.
The KEGG profile points in the same direction. Alzheimer disease was the single most represented pathway (21 genes), ahead of the PI3K-Akt (18 genes) and MAPK (16 genes) signaling pathways, with autophagy, apoptosis, insulin signaling, cholinergic and dopaminergic synapse and long-term potentiation all significantly enriched. The parallel enrichment of several cancer pathways is expected rather than anomalous, since the kinases involved are shared regulators of proliferation and survival; it does, however, foreshadow a selectivity problem that any downstream chemistry will have to address.
3.4. AKT1 as the Prioritized Target, and How That Choice Should Be Interpreted
AKT1 was carried forward to molecular dynamics not because it was the highest-ranked target on any single criterion but because it was the only target that performed strongly on all of them simultaneously: fourth by degree centrality (48), third by MCC (19,349), a member of the highest-scoring MCODE module (15.25), second by DisGeNET association (0.60), the center of the most enriched signaling pathway in the KEGG analysis, and the target of the best-ranked multi-target ligand in the docking campaign (Robinetin, −8.83). Prioritizing by aggregate rather than by maximum is a deliberate methodological choice, and it explains the apparent tension with the DisGeNET ranking, in which GSK3B leads. The two results are not in conflict: GSK3B has the strongest literature support for disease involvement, whereas AKT1 has the strongest combined support within this particular network and ligand set.
One caveat deserves emphasis, because docking scores are silent on it. A favorable binding score indicates that a ligand can occupy a site; it does not indicate whether the consequence is inhibition, activation or allosteric modulation, nor whether that consequence is therapeutically desirable. In the case of AKT1, this distinction is not academic: Akt phosphorylates GSK-3β at Ser9 and thereby suppresses it, so an inhibitory interaction at AKT1 could in principle disinhibit GSK-3β and act against the intended effect, whereas a stabilizing or activating interaction would reinforce it. The predicted AKT1–Robinetin complex therefore requires functional characterization, minimally an enzymatic activity assay alongside the planned dynamics simulation, before the direction of the effect can be asserted. By the same argument, GSK-3β remains the more straightforward target from a mechanistic standpoint, since inhibition there has an unambiguous predicted direction [38] and Diosmetin (−9.60) and Hydroxygenkwanin (−9.33) are the logical ligands for that arm of the work. The experimental literature does not resolve this ambiguity in favour of either direction. A systematic appraisal of the PI3K/Akt axis in Alzheimer’s disease concludes that the sign of the therapeutic effect is conditional on cell type and disease stage: Akt activation is protective in neurons and neural stem cells, where it suppresses GSK-3β and limits tau hyperphosphorylation and apoptosis, whereas in microglia, and in the later stages of the disease when mTOR-dependent autophagy is already impaired, suppression of the same axis has been the more effective intervention in preclinical models [46]. The direction of the effect at AKT1 is therefore an empirical question about the cellular context in which the compound acts, and not one that any docking or simulation result reported here can settle.
3.5. Structure–Activity Observations Across the Target Panel
The docking matrix shows a consistent relationship between substitution pattern and target preference. The compounds that dominated the PTGS2 ranking, Primuletin, 7-hydroxyflavone, β-naphthoflavone, 6-methylflavone and 4′-methoxyflavone, are all sparsely substituted, comparatively lipophilic flavones, which is consistent with the long hydrophobic channel of the cyclooxygenase site and explains why none of them recurred against the kinase targets. Conversely, the compounds that recurred across the kinase panel, Robinetin, Luteolin, Diosmetin, Morin and Fisetin, all carry multiple free hydroxyl groups on the A and B rings, which are able to satisfy the hydrogen-bonding requirements of the hinge region and of the polar residues lining the ATP site. Robinetin and Luteolin, the most extensively hydroxylated of the leading compounds, produced the broadest profiles and the strongest individual scores [31] (MTOR −11.29 and −11.76; MAPK1 −10.043 and −9.43 respectively), while the mono-methoxylated derivatives behaved more selectively: Isorhamnetin favored MAPK8 (−10.19) and AKT1 (−8.25), and Diosmetin favored MTOR (−11.28), GSK3B (−9.60) and MAPK3 (−7.59). Direct structural evidence supports this reading of the substitution pattern. In the crystal structures of phosphoinositide 3-kinase γ in complex with quercetin and with myricetin, the ring hydroxyls make the hydrogen bonds to the backbone of residues 880–882 and to the side chain of Lys833 that anchor the ligand within the adenine pocket, and the two compounds bind in orientations related by an approximate 180° rotation, so it is the hydroxylation pattern rather than the scaffold that determines which polar contacts of the ATP site can be satisfied [31].
The uniformly weak scores obtained against CTNNB1 (−4.99 to −5.82) are best interpreted structurally rather than as evidence of irrelevance. β-catenin does not possess a conventional catalytic pocket; its armadillo repeat domain presents an extended, shallow protein–protein interaction surface that small planar ligands occupy poorly, and low scores are the expected outcome for any docking campaign directed at such a surface. This interpretation is supported directly by the reference-ligand baseline: the co-crystallized ligand R9Q, re-docked into its own site, reached only −2.515 kcal/mol, a weaker score than that of every flavonoid in Table 3, so the low values are a property of the site and not of the ligands. CTNNB1 therefore retains its network and pathway support but is, on present evidence, a poor candidate for direct small-molecule engagement by this chemotype, and would be better approached through GSK-3β, which lies upstream of it. MAPK3, by contrast, returned intermediate scores (−6.51 to −7.76) that are consistent with genuine occupancy of its ATP site; its lower ranking relative to MAPK1, its closest paralogue, reflects a comparatively less favorable fit rather than an absence of binding, and the two ERK isoforms were therefore not equally engaged by this chemotype despite their close structural similarity. The baselines are decisive on this point: the MAPK3 crystallographic ligand reached −10.124 kcal/mol and the MAPK1 ligand −10.920 kcal/mol, so both sites are capable of high scores, and the divergence between the flavonoid results at the two isoforms is attributable to the ligands rather than to the receptors.
3.6. Multi-Target Behavior
The recurrence criterion used here—counting how many core targets each compound reached among the top five—is a reasonable proxy for polypharmacology, and it identified Robinetin (five targets), Luteolin and Diosmetin (four each) and Morin, Fisetin, Hydroxygenkwanin, and 5,4′-dihydroxyflavone (three each). In a disease driven by several simultaneously active mechanisms, this distributed engagement is an advantage, since partial modulation of several nodes may achieve more than complete inhibition of one while requiring lower occupancy at each site.
Receptor normalization sharpens this picture before the interference question is reached. Counted on the raw scale, Robinetin reaches five core targets, Luteolin and Diosmetin four each; counted against the baseline of each receptor, Robinetin exceeds it at four of five, Diosmetin and Fisetin at four of five and Luteolin at three of four, while Fisetin, previously a secondary candidate, becomes indistinguishable from the leading compounds. More consequentially, three of the eight core targets—MAPK1, MAPK3 and PTGS2—are not engaged by any flavonoid at the level of their own crystallographic ligand, so the effective width of the multi-target profile is narrower than the raw counts suggest. A frequent-hitter pattern would be expected to produce indiscriminate engagement across all eight receptors; the observed pattern is instead selective for five of them, which weakens, though it does not eliminate that explanation.
The same property is the principal interpretive risk of the study, and the analyses in Section 2.13 were performed to address it directly. Polyhydroxylated flavonoids are recognized frequent hitters: their planar, electron-rich, multiply hydrogen-bonding scaffolds interact favourably with many binding sites; they are redox-active, and several fall within recognized classes of assay-interference compounds. A compound that scores well against five unrelated proteins may be genuinely polypharmacological, or it may simply be an indiscriminate binder. This is not a theoretical concern. When quercetin was screened experimentally against a panel of protein kinases, a 2 µM concentration—less than a tenth of its mean growth-inhibitory half-maximal inhibitory concentration (IC50) across eight cancer cell lines—reduced the activity of sixteen kinases by more than 80%, among them ABL1, the three Aurora isoforms, CLK1, FLT3, JAK3, MET, NEK4, NEK9, PAK3, PIM1, RET, FGFR2 and both PDGF receptors [47]. Measured promiscuity of that breadth, in a flavonol differing from the compounds examined here only in its hydroxylation pattern, is precisely the behavior that the cross-target agreement reported in Section 2.13 would be expected to reproduce in silico.
Two competing explanations for the observed cross-target agreement can be distinguished. If the agreement reflected genuine complementarity, kinase pairs with more similar ATP pockets should show more similar score patterns. If it reflected a ligand-intrinsic property, the agreement should be independent of pocket similarity and should disappear once that property is removed. The data support the second explanation. Score patterns agreed strongly between all ten kinase pairs (mean r = 0.693) but showed no evidence of a positive relationship with pocket sequence identity (Mantel p = 0.29) or with any SiteMap descriptor, whereas hydroxyl count, the leading marker of a correlated polarity axis, explained up to 80% of the score variance at a single receptor and its removal reduced the mean inter-receptor correlation to 0.080.
This has three consequences for how the present results, and comparable published campaigns, should be read. First, the recurrence of a compound across several targets in a docking campaign is not by itself evidence of polypharmacology; in a congeneric series it may simply reflect the position of that compound on a single physicochemical axis. Second, receptor normalization, which we show to be necessary for comparing scores between receptors, is not sufficient, because it corrects the receptor-side baseline while leaving the ligand-side gradient intact. Third, the conserved architecture of the ATP site, which is often invoked as the structural rationale for kinase polypharmacology, does not by itself predict which compounds will show correlated behavior: the pockets examined here were indeed highly conserved (pocket RMSD 0.97–1.19 Å) and uniformly druggable (SiteScore 1.03–1.12), yet that conservation carried no predictive information about score agreement.
The practical recommendation that follows is that a multi-target claim derived from docking should be accompanied by a demonstration that the cross-target pattern survives correction for the obvious ligand descriptors of the series and, ultimately, by counter-screening against unrelated proteins and confirmation in an orthogonal, non-optical assay format. For the present series, Robinetin remains the best-normalized ligand of AKT1, but its recurrence across five targets should be regarded as consistent with its hydroxylation state rather than as independent evidence of a multi-target mechanism.
It is worth setting the computational profile of Robinetin against what has actually been measured for the compound, since the two are not coextensive. Robinetin has been shown experimentally to inhibit HIV-1 integrase (IC50 1.6–5.9 µM), the multidrug-resistance transporters MRP1 and MRP2 (inhibition constant Ki 5.0 and 8.5 µM), receptor-interacting protein kinase 1 (IC50 43.8 µM) and acetylcholinesterase (IC50 456 ± 3 µM), and to suppress the aggregation of amyloid-β42 in vitro; in mice fed a Western diet it reduced hepatic lipid accumulation and lowered post-load blood glucose at dietary concentrations of 0.025–0.05%, and in rats a large oral dose was recovered in the urine largely unmetabolized [48]. Its only documented kinase activity, at RIPK1, lies in the tens of micromolar, and no assay of Robinetin against AKT1, against any other AGC-family kinase, or against GSK-3β has been reported. The anti-amyloid activity, moreover, is consistent with the mechanism described for polyphenols carrying adjacent phenolic hydroxyls, which autoxidize to ortho-quinones and form Michael adducts with Lys16 and Lys28 of monomeric amyloid-β42 [49], and is therefore mechanistically distinct from the ATP-site occupancy modeled here. The AKT1 interaction proposed in this work is accordingly a prediction without an experimental counterpart, and the enzymatic assay called for above is the specific measurement that would give it one.
The second library settles which of the two readings above is correct. Had the cross-target agreement in the flavonoid series been a scaffold-specific consequence of hydroxylation, it should have weakened or changed character in a library of steroids, alkaloids, antibiotics, statins and terpenoids. It did neither: the mean pair correlation rose from 0.693 to 0.776, the dominant latent axis accounted for 81.4% of the score variance instead of 75.7%, and pocket similarity again had no detectable explanatory value (Mantel p = 0.86). The same ligand property dominated in both libraries—hydrogen-bond donor capacity, which in the flavonoids takes the specific form of free hydroxyl count.
What changed is how completely that property accounts for the effect. In the congeneric series one descriptor removes it almost entirely; in the diverse library eight descriptors together remove only 16% of it. The implication is stronger than the flavonoid result alone suggested, and less comfortable: cross-target score agreement is not a correctable confounder that a well-designed campaign can adjust away. It is a structural feature of how docking scores are distributed across ligands, largely independent both of the target and of the measurable properties of the ligand. Reporting that a compound ranks highly at several targets therefore conveys very little beyond the fact that it ranks highly at one, and the practice of inferring polypharmacology from concordant docking scores finds no support in either of the two libraries examined here.
The limits of this conclusion should be stated. Both libraries were scored with a single program and scoring function, so a property of Glide extra-precision (XP) cannot be distinguished from a property of docking in general; six targets, five of them protein kinases, is a narrow structural sample; and a correlation that survives descriptor correction is not thereby shown to be meaningless, only unexplained. What the data do establish is that the concordance carries no information about target relatedness, which is the specific inference the multi-target literature draws from it. Two further qualifications belong with these, both statistical. First, the design is small: six receptors give at most fifteen pairs and five kinases only ten, so a permutation test on this layout has limited power. A Mantel p of 0.29 or 0.86 shows that these data provide no evidence of a relationship between pocket similarity and score-pattern similarity; it does not show that no such relationship exists, and the conclusion drawn here is correspondingly negative in form—that pocket similarity does not account for the observed concordance and cannot therefore be offered as its explanation. Second, the diverse library is one random draw of 122 compounds from one vendor collection, so its representativeness of chemical space as a whole is not established; the generalization supported by these data is that the behavior is not confined to the flavonoid scaffold, not that it holds for every compound class or every docking protocol.
3.7. Dynamic Behavior of the Prioritized AKT1–Robinetin Complex
The molecular dynamics simulation, the MM-GBSA decomposition and the collective-motion analyses provide complementary information about the complex selected by the docking campaign. The protein RMSD indicates that the system moved away from its starting geometry and ultimately sampled structures approximately 3 Å from the reference in both replicates (2.84 ± 0.12 and 3.12 ± 0.20 Å over the equilibrated segment). This behavior is expected for a docked model relaxing in explicit solvent and does not in itself denote instability, particularly since the secondary-structure content was maintained at 38.72% (24.50% α-helix and 14.22% β-strand). Over the same period, the very low ligand RMSD (0.2–0.4 Å) shows that the internal geometry of Robinetin was essentially unaffected.
The RMSF profile shows that structural mobility was not uniformly distributed but concentrated at loops and terminal segments, while most of the residues involved in ligand recognition remained comparatively rigid. This combination of a structured core with a flexible periphery is characteristic of proteins that explore alternative conformations without losing their fold, and it is consistent with the conformational populations resolved by the principal component analysis.
The contact analysis provides the most direct evidence of sustained molecular recognition. In both replicates, the ligand was retained by a network of interactions rather than by a single transient contact, and in both it remained in the ATP cleft for the whole 100 ns with a hydrogen bond to Glu234 and a contact at the hinge residue Glu228. Which further residues were engaged differed between the runs—Tyr437, Phe438 and Asp439 in run 1, the catalytic Lys179 and the Asp-Phe-Gly (DFG) motif aspartate Asp292 in run 2—so the site is reproducibly occupied while the detailed hydrogen-bond network is not. This is consistent with the binding mode predicted by docking and with the general observation, discussed in Section 3.5, that the chromen-4-one scaffold engages the hinge region and the polar residues lining the ATP site. The strongly negative MM-GBSA estimates support this interpretation but must be read with care. They were obtained from eleven snapshots sampled at 10 ns intervals across the production trajectory, so the reproducibility of the estimate over the sampled ensemble is established (relative standard deviation 11.2%), but the methodological limits of the approach remain: they are end-point estimates computed with an implicit solvation model and without an explicit configurational-entropy term, and their absolute magnitude (mean −148.47 kcal/mol) is considerably larger than the binding free energies measured experimentally for flavonoids. They are therefore informative about the relative contribution of the individual energetic terms: van der Waals, Coulombic, and lipophilic interactions dominate, with a smaller but favorable hydrogen-bonding contribution, while polar solvation opposes complex formation, but they should not be interpreted as predicted affinities.
Finally, the PCA and DCCM results show that the system was not confined to a single configuration. It adopted a small number of related conformational states, the first three modes accounting for 23.92%, 14.79% and 7.31% of the variance, respectively, and the residue motions were organized into localized correlated and anti-correlated blocks rather than into a globally disordered pattern. Taken together with the preservation of the secondary structure, the low internal deviation of the ligand and the persistence of the interaction network, these observations indicate that the complex behaved, in both replicates, as a dynamically stable bound state that adapts conformationally rather than as a rigid protein–ligand assembly.
3.8. Predicted Central Delivery Is the Principal Limitation of the Series
The ADMET analysis identifies a constraint that must be stated explicitly, since it bears directly on the therapeutic hypothesis examined here. The five compounds characterized in Section 2.11.6 were uniformly predicted to cross the blood–brain barrier poorly, and two of them, Isorhamnetin and Robinetin, fell below the log PS threshold of −3 that denotes an inability to reach the central nervous system. Robinetin is the compound taken forward to molecular dynamics simulation, and the target proposed for it is intracellular and predominantly neuronal, so the predicted pharmacokinetic profile does not currently support delivery of the free compound to the compartment in which the modeled interaction would have to occur. This is a genuine limitation of the series rather than an incidental observation, and it is not resolved by the docking or the simulation results, which address molecular recognition and not delivery.
Three considerations qualify this conclusion without removing it. First, the pkCSM predictions are derived from the unmodified free structures, and the extensive first-pass glucuronidation and sulfation that flavonoids undergo mean that the circulating species in vivo are conjugates whose distribution behavior is not represented by these models. Second, poor intrinsic penetration is a formulation and medicinal-chemistry problem for which established approaches exist, including prodrug derivatization of the phenolic hydroxyls, nanoparticulate and liposomal carriers, and co-administration with efflux-transporter inhibitors, all of which have been applied to flavonoids specifically. Third, several of the eight core targets identified here, notably PTGS2 and AKT1, are also expressed peripherally and participate in the systemic inflammatory and metabolic processes that contribute to Alzheimer’s pathology, so a peripheral contribution to the predicted effect cannot be excluded. Nevertheless, until permeability is demonstrated experimentally, whether in a validated in vitro barrier model or in vivo, the candidates reported here should be regarded as chemical starting points requiring optimization of their delivery properties rather than as compounds ready for evaluation in neuronal models. Nanoformulation offers the most direct route to that optimization. The liabilities predicted for this series—low aqueous solubility, extensive presystemic conjugation of the phenolic hydroxyls, p-glycoprotein-mediated efflux and poor passive partitioning across the blood–brain barrier—are precisely those that advanced delivery systems have been developed to address in flavonoids. Nanoparticle-based formulations, including solid lipid nanoparticles, nanostructured lipid carriers, polymeric PLGA nanoparticles and nanoemulsions, improve apparent solubility, protect the bioactive molecule from premature degradation and provide sustained release, while liposomes and phospholipid complexes (phytosomes) enhance cellular uptake and facilitate passage across the blood–brain barrier. Encapsulation additionally reduces recognition by efflux transporters, since the carrier rather than the free molecule is internalized. Surface modification, whether by PEGylation or by conjugation with transferrin or lactoferrin, has been reported to improve brain targeting and to reduce systemic clearance, and chitosan-based intranasal systems provide a route that bypasses the barrier altogether. Comparable strategies have already produced measurable increases in brain accumulation and neuroprotective efficacy for polyphenols in preclinical models of Alzheimer’s disease, which supports their translational relevance for the present series. The evidence for this is specific. A systematic review of fourteen controlled animal studies of quercetin in Alzheimer’s disease models found consistent improvement of spatial memory in the Morris water maze (p < 0.00001), together with reduced Aβ42 levels, lower Aβ immunoreactivity, diminished tau hyperphosphorylation and attenuated astrocytic and microglial activation, while attributing the failure to translate to an oral bioavailability of approximately 2% and to limited blood–brain barrier permeability [50]. Formulation addresses that constraint directly: quercetin-loaded solid lipid nanoparticles and nanostructured lipid carriers functionalized with the RVG29 peptide achieved entrapment efficiencies above 80%, increased apparent permeability across a human blood–brain barrier cell model approximately 1.5-fold relative to the unfunctionalized carriers and inhibited amyloid-β aggregation in a thioflavin T assay, although that work did not proceed to in vivo brain concentrations [51]. Both constraints apply to Robinetin, whose predicted human oral bioavailability is low and whose predicted half-life is under three hours [48]. Applying them to Robinetin, Luteolin and Diosmetin would address the specific liabilities identified in Table 6, and prodrug derivatization of the phenolic hydroxyls and co-administration with efflux-transporter inhibitors remain complementary options. No formulation was prepared, characterized or modeled in the present study; the development of flavonoid-loaded nanocarriers and their evaluation in validated barrier models and in vivo is proposed here as the logical continuation of this work rather than as one of its findings.
3.9. Contribution of the Present Work and What It Does Not Establish
Three results of the present analysis are not restatements of what was already known about flavonoids in Alzheimer’s disease. The first concerns the interpretation of docking scores across different receptors. Re-docking of the co-crystallized ligand returned XP scores ranging from −2.515 kcal/mol at CTNNB1 to −10.920 kcal/mol at MAPK1, a spread comparable in magnitude to the differences between the flavonoids themselves. When the eighty compound–target pairs of this screen were ranked by raw score and again after normalization to these baselines, the two orderings proved statistically unrelated (Spearman ρ = 0.078, p = 0.49); every pair moved by a mean of 25.8 places, and three of the eight core targets proved not to be engaged by any compound at the level of their own crystallographic ligand. A multi-target claim built on raw score comparison across receptors is therefore not interpretable, and the multi-target behavior reported here is defined relative to these per-receptor baselines rather than in absolute terms.
The second concerns the divergence between the criteria used to prioritize a target. Centrality, module membership, KEGG pathway membership, gene–disease association and docking performance did not select the same protein: GSK3B carried the strongest documented disease association of the set (GDA 1.05), mTOR received the single strongest score of the whole campaign (Luteolin, −11.76 kcal/mol), and AKT1 emerged only when the criteria were weighed jointly. The divergence is itself informative, since it shows that in studies of this design the target is determined by how the criteria are weighted and not by the data alone; the weighting applied here is set out explicitly in Table 5 rather than left implicit.
The crystallographic precedent is the complex of phosphoinositide 3-kinase γ with quercetin, in which the chromone carbonyl accepts a hydrogen bond from the backbone amide of the linker residue Val882, the position occupied by N1 of ATP, while the ligand fills the hydrophobic region delimited by Tyr867 and Ile879 without extending into the β- and γ-phosphate region [31]. The third concerns the binding mode, and it is qualified by the replicate. Across two independent 100 ns trajectories, the AKT1–Robinetin complex retained the ligand in the ATP-binding cleft throughout, with a hydrogen bond to Glu234 and a contact at the hinge residue Glu228 maintained in both. That much is consistent with the ATP-mimetic behavior long proposed for the chromen-4-one scaffold and rarely examined in flavonoid docking studies, and it is the observation on which further development of this series would usefully rest. The individual contact occupancies, however, did not survive replication: the residues engaged beyond Glu234 and Glu228, and the fractions of the trajectory for which they were engaged, differed between runs that started from the same geometry. A specific hydrogen-bonding model of this complex is therefore not supported by the present data, and the result generalizes beyond this study: contact occupancies read from one trajectory are not, on this evidence, a reliable description of a complex, which is the same caution this work applies to docking-score concordance.
What the study does not establish should be stated with equal clarity. The multi-target profile rests on predicted binding scores and not on measured affinities. The dynamic characterization covers a single complex in two replicates, so the selectivity of Robinetin among the eight core targets remains untested, and a comparative simulation against GSK3B or mTOR would be required to establish it. Persistence of hinge contacts is consistent with ATP-competitive binding but does not demonstrate it, which would require simulation in the presence of ATP or an enzymatic assay at varied ATP concentrations. Finally, the direction of the effect at AKT1, whether the ligand inhibits the kinase or modulates it otherwise, cannot be inferred from the calculations reported here.
A limitation remains in the sampling on which the dynamic characterization rests. Two independent 100 ns trajectories were computed, which is enough to show that a quantity varies between runs but not enough to estimate how much: with n = 2, the between-run spread is an observation, not a variance. What the duplicate establishes is therefore asymmetric. Where the two runs agree—the RMSD plateau and the time at which it is reached, the flexibility profile, the preservation of the fold, the rigidity of the ligand, retention of the ligand in the ATP cleft, and the composition of the MM-GBSA decomposition—the agreement is evidence that these are properties of the complex. Where they disagree—the identity and occupancy of the individual hydrogen bonds, and the absolute value of the MM-GBSA estimate—the disagreement shows that a single trajectory does not determine them, but two trajectories do not establish their true distribution either. Three or more independent runs of comparable length, and a comparative simulation against a second core target, remain the first priority for any computational continuation of this work. The simulation results are accordingly presented as a structural characterization of a binding event that has been checked for reproducibility, and not as converged ensemble averages.
4. Materials and Methods
4.1. Study Design and Analytical Workflow
The study was conducted entirely in silico and followed a sequential filtering strategy in which each stage reduced the candidate space for the next. The overall workflow is summarized below.
- Flavonoid compound library (264 compounds)
- ↓
- ADMET and drug-likeness screening (pkCSM)
- ↓
- Biological activity prediction (PASS Online, kinase inhibition, Pa > 0.90)
- ↓
- Target prediction (SwissTargetPrediction)
- ↓
- Collection of Alzheimer’s disease-associated genes (MalaCards)
- ↓
- Target intersection (compound targets ∩ disease targets)
- ↓
- PPI network construction and analysis (STRING + Cytoscape)
- ↓
- Hub target identification (cytoHubba: MCC and Degree; MCODE clustering)
- ↓
- Functional enrichment (GO and KEGG, DAVID)
- ↓
- Pathway-based prioritization and DisGeNET validation
- ↓
- Molecular docking (Glide HTVS → SP → XP)
- ↓
- Molecular dynamics simulation of the prioritized complex.
4.2. Selection and Preparation of the Bioactive Compound Library
The flavonoid compounds analyzed in this study were obtained from the Flavonoid Compound Library (catalogue number L7700; Selleck Chemicals: Houston, TX, USA) [52]. The selected compounds were retrieved from the commercially available library dataset and were included based on their defined chemical structures and the availability of molecular information. Only compounds with identifiable chemical structures, molecular formulas, and available PubChem records were considered for the subsequent ADMET, network pharmacology, and molecular docking analyses. This approach ensured that the analyzed dataset was based exclusively on structurally characterized flavonoid molecules obtained from a curated compound library rather than on predicted compounds collected from literature sources.
The selected dataset, comprising 264 compound entries, was prepared using the LigPrep module of the Schrödinger Suite (Schrödinger Release 2023-1; Schrödinger, LLC: New York, NY, USA, 2023). The Optimized Potentials for Liquid Simulations (OPLS4) force field was employed for energy minimization. Possible ionization states were generated at a target physiological pH of 7.0 ± 2.0 using Epik, with the inclusion of metal-binding states and retention of the original state. The structures were desalted, and possible tautomers were generated to ensure that the most stable forms were evaluated during docking (for example, accommodating stable keto tautomers). Stereoisomers were computed by retaining the specified chiralities while varying the remaining chiral centers, yielding a maximum of eight stereoisomers per ligand. The maximum ligand size was restricted to 500 atoms [53,54].
4.3. ADMET and Drug-Likeness Screening
The initial library of 264 flavonoid compounds was subjected to in silico ADMET profiling using the pkCSM web server (http://biosig.lab.uq.edu.au/pkcsm, accessed on 27 October 2026) [55]. The pharmacokinetic profile of every compound was computed comprehensively, covering absorption, distribution, metabolism, excretion and toxicity parameters. Absorption properties such as water solubility and human intestinal absorption were assessed together with distribution parameters including blood–brain barrier permeability (log BB), central nervous system permeability (llog PS) and volume of distribution (VDss). Metabolic and excretion characteristics, including cytochrome P450 inhibition and total clearance, were also predicted, and toxicity endpoints comprising AMES toxicity, hERG inhibition, oral rat acute toxicity (LD50) and hepatotoxicity were evaluated in parallel. These descriptors were retained as the pharmacokinetic reference profile of the library and were used descriptively in the interpretation of the prioritized compounds. Compound selection at this stage was based on drug-likeness: only compounds complying with Lipinski’s rule of five (molecular weight ≤ 500 Da, calculated log p ≤ 5, no more than five hydrogen-bond donors and no more than ten hydrogen-bond acceptors) were carried forward, with no violation of any of the four criteria being permitted, which reduced the library to 160 flavonoid compounds for subsequent pharmacology analyses. The remaining ADMET endpoints were not applied as exclusion criteria at this stage [56]. In addition, donepezil was submitted to the same pkCSM workflow under identical settings and was retained as a reference standard, so that the predicted pharmacokinetic and toxicological values of the prioritized compounds could be interpreted comparatively against a clinically approved anti-Alzheimer agent rather than against absolute thresholds alone.
4.4. Biological Activity Prediction and Compound Prioritization
To prioritize the screened flavonoids according to their predicted biological activity, the Prediction of Activity Spectra for Substances (PASS) Online server available through the Way2Drug platform (http://www.way2drug.com/passonline, accessed on 27 October 2026) was employed [57]. The Simplified Molecular Input Line Entry System (SMILES) notation for each of the 160 flavonoids retained after ADMET screening was retrieved from the PubChem database and submitted to the PASS Online server. The prediction focused on kinase inhibitory activity as the primary selection criterion. Compounds with a probability of activity (Pa) value greater than 0.90 for kinase inhibition were considered highly probable active candidates and were retained for subsequent target prediction and network pharmacology analyses, whereas compounds with lower Pa values were excluded. Since PASS predictions are derived from quantitative structure–activity relationship (QSAR) models, the predicted activities were used solely as a preliminary prioritization tool and were not regarded as definitive evidence of biological activity.
4.5. Target Prediction of the Selected Flavonoids
The 49 flavonoid compounds retained after ADMET screening and biological activity prediction were obtained from the Selleck Chemicals flavonoid library. Their structural information was provided in Structure Data File (SDF) format and converted into canonical SMILES notation using Open Babel (version 2.4.1; Open Babel Development Team, 2016; http://openbabel.org, accessed on 27 October 2026) [58]. The generated SMILES strings were individually submitted to the SwissTargetPrediction v23 web server (https://swisstargetprediction.ch, accessed on 27 October 2026) [59] to predict potential human protein targets (Homo sapiens). A total of 249 predicted protein targets were obtained from all compounds and integrated into a single dataset. After removal of duplicate entries and standardization of target identifiers using the UniProt database, 224 unique gene targets were retained. These standardized targets were subsequently used for target intersection analysis and network pharmacology investigations.
4.6. Identification of Disease-Associated Genes
Disease-associated genes were collected from the MalaCards database (https://www.malacards.org/, accessed on 27 October 2026) [60] using “Alzheimer’s disease” as the search term. A total of 1045 disease-related protein-coding genes were retrieved and used as the disease target dataset. These disease-associated genes were subsequently compared with the predicted flavonoid-related targets (224 genes) in order to identify common therapeutic targets through target intersection analysis.
4.7. Identification of Overlapping Targets
The predicted flavonoid-related targets (224 genes) were compared with the Alzheimer’s disease-associated gene dataset (1045 genes) using intersection analysis. The overlapping genes were identified and visualized with the Venny v2.1.0 online tool (https://bioinfogp.cnb.csic.es/tools/venny, accessed on 27 October 2026) [61]. A total of 76 common genes were identified as potential therapeutic targets and were selected for the subsequent network pharmacology analyses, including protein–protein interaction (PPI) network construction and enrichment analysis.
4.8. Protein–Protein Interaction (PPI) Network Analysis
The 76 common target genes were submitted to the STRING database (version 12.0; https://string-db.org, accessed on 27 October 2026) [62] for the construction of the protein–protein interaction network. Homo sapiens was selected as the reference organism, and the minimum required interaction score was set to 0.400 (medium confidence). All available active interaction sources were enabled, namely text mining, experiments, curated databases, co-expression, neighborhood, gene fusion and co-occurrence, and disconnected nodes were hidden from the displayed network. Network parameters including the number of nodes and edges, the average node degree, the average local clustering coefficient, the expected number of interactions, and the PPI enrichment p-value were recorded [29]. The connected network was subsequently exported and imported into Cytoscape for topological analysis and for the identification of highly connected and structurally important hub genes [63].
4.9. Topological Analysis and Hub Gene Identification
The PPI network was imported into Cytoscape (version 3.10.4; Cytoscape Consortium: San Diego, CA, USA, 2024; https://cytoscape.org, accessed on 27 October 2026) [64] for network visualization and topological analysis in order to identify key regulatory targets. The importance of individual nodes within the network was evaluated using centrality measures, including degree centrality and Maximal Clique Centrality (MCC) [63,65]. Degree centrality represents the number of direct interactions connected to each node, reflecting the connectivity level and identifying highly connected proteins within the network. MCC, in contrast, evaluates the participation of nodes in highly interconnected protein clusters (cliques), allowing the identification of proteins with strong structural importance within the network. The cytoHubba plugin was applied to rank the target proteins using these two complementary algorithms. The top 15 genes ranked by each algorithm were identified as candidate hub genes; the results generated by both approaches were compared, and genes overlapping between the two top 15 lists were considered consensus hub genes, reflecting consistent topological significance across two complementary centrality measures. These consensus hub genes were retained for further functional interpretation and downstream analysis.
4.10. MCODE Cluster Analysis
The Molecular Complex Detection (MCODE) [66] plugin (version 2.0.3) in Cytoscape was applied to identify highly interconnected modules within the PPI network. The analysis was performed using the following parameters: degree cutoff = 2, node score cutoff = 0.2, k-core = 2, and maximum depth = 100 [67]. Clusters were ranked according to their MCODE score, which reflects the density and connectivity of the identified modules, and the highest-scoring cluster was selected as the key functional module for further biological interpretation.
4.11. Gene Ontology (GO) and KEGG Pathway Enrichment Analysis
To elucidate the biological functions and molecular mechanisms associated with the identified target network, Gene Ontology (GO) functional annotation and Kyoto Encyclopedia of Genes and Genomes (KEGG) pathway [68] enrichment analyses were performed using the Database for Annotation, Visualization and Integrated Discovery (DAVID, version 2025) (https://davidbioinformatics.nih.gov, accessed on 27 October 2026) [69]. The 75 target genes constituting the PPI network were uploaded using their official gene symbols, with Homo sapiens selected as the reference organism. GO enrichment analysis was performed across the three main ontological categories: Biological Process (BP), Molecular Function (MF), and Cellular Component (CC) [70]. The resulting GO enrichment data were visualized graphically using the SRplot suite (https://www.bioinformatics.com.cn, accessed on 27 October 2026) [71]. KEGG pathway enrichment analysis was subsequently conducted to identify significantly enriched biological pathways associated with the target network, and the Alzheimer’s disease pathway was mapped, visualized and color-coded using KEGG Mapper (https://www.genome.jp/kegg/mapper, accessed on 27 October 2026) [72]. Enriched GO terms and KEGG pathways with a p-value < 0.05 and a Benjamini-adjusted false discovery rate (FDR) < 0.05 were considered statistically significant.
4.12. Pathway-Based Validation and Prioritization of Hub Genes
To further prioritize the consensus hub genes according to their disease-specific pathway relevance, a pathway-based validation step was performed. The genes mapped to the Alzheimer’s disease pathway in KEGG were identified from the target network using KEGG Mapper. The resulting Alzheimer’s disease-associated genes were subsequently compared with the 12 consensus hub genes identified from the overlap between the MCC and Degree centrality analyses. The intersection between these two gene sets was used to define pathway-supported hub genes, representing targets that demonstrated both high topological importance within the PPI network and direct involvement in the Alzheimer’s disease pathway. These overlapping genes were prioritized for subsequent molecular investigation and target selection.
4.13. Independent Validation of the Core Targets Using DisGeNET
To independently validate the association of the identified core targets with Alzheimer’s disease, the eight core genes (GSK3B, PTGS2, MTOR, MAPK8, AKT1, MAPK1, CTNNB1 and MAPK3) were evaluated using the DisGeNET database (https://disgenet.com/, accessed on 27 October 2026) [73]. Each gene was individually queried against Alzheimer’s disease and gene–disease association (GDA) data were retrieved. For each target, the corresponding GDA score and normalized score were recorded as indicators of the strength of the reported gene–disease association [74]. Only records corresponding specifically to Alzheimer’s disease and to the investigated gene were considered. The resulting evidence was used as an independent, database-based validation of the core targets identified through the network and pathway analyses.
4.14. Protein Structure Selection and Preparation
The eight validated core targets, GSK3B, PTGS2, MTOR, MAPK8, AKT1, MAPK1, CTNNB1 and MAPK3, were subjected to structure-based virtual screening with the Glide module of the Schrödinger molecular modeling suite (release 2023-1) [75]. The receptor structures used for this purpose were selected and prepared as follows. The three-dimensional structures of the eight validated core targets were retrieved from the Protein Data Bank (PDB; https://www.rcsb.org, accessed on 27 October 2026) [76]. For each target, the entry was selected on the basis of crystallographic resolution, completeness of the binding site, and the presence of a co-crystallized ligand suitable for definition of the docking site. No target was homology-modeled; all eight receptors were experimentally determined structures. The selected entries, their resolution, the chain used, and the co-crystallized ligand are summarized in Table 2. Each structure was prepared with the Protein Preparation Wizard of the Schrödinger Suite (release 2023-1) using the default protocol. Bond orders were assigned, hydrogen atoms were added, disulfide bonds were created, and missing side chains and missing loops were completed with Prime. The chain termini generated by truncation of the crystallographic construct were capped with N-terminal acetyl and C-terminal N-methyl amide groups in order to avoid artificial charges at the ends of the chains [77]. Co-crystallized solvent molecules, ions, and cryoprotectants were removed, with the exception of four structural water molecules located within the binding site of the MAPK3 structure (HOH 1017, HOH 834, HOH 517, and HOH 715) as a result of the crystal structure binding mode, which were retained during docking; for the remaining seven targets, all water molecules were removed. Het-group ionization and tautomeric states were generated with Epik at pH 7.0 ± 2.0, the hydrogen-bonding network was optimized at pH 7.0, and the prepared complexes were subjected to restrained minimization with The Optimized Potentials for Liquid Simulations (OPLS4) force field, with the heavy atoms being converged to a root-mean-square deviation of 0.30 Å [78]
4.15. Receptor Grid Generation and Validation of the Docking Protocol
Receptor grids were generated with the Receptor Grid Generation panel of Glide. For each prepared receptor, the grid box was centered on the centroid of the co-crystallized ligand; the resulting box center coordinates are given in Table 2. The default Glide box dimensions were used, with an inner box of 10 × 10 × 10 Å, and no positional, hydrogen-bond, or metal constraints were applied [79].
The docking protocol was validated for every target by extracting the co-crystallized ligand from the prepared complex and re-docking it into the same receptor under the Extra Precision (XP) settings subsequently used for virtual screening. The heavy-atom root-mean-square deviation (RMSD) between the best-scoring re-docked pose and the crystallographic pose was calculated for each target and is reported in Table 2; an RMSD below 2 Å was taken as the acceptance criterion [80]. The XP score obtained for the re-docked crystallographic ligand was also recorded and retained as an internal, structure-specific baseline against which the scores of the flavonoids at the same site could be interpreted (Table 2). No clinically validated external inhibitor was docked as an additional positive control.
4.16. Molecular Docking and Virtual Screening
Molecular docking and virtual screening were performed using the Glide module of the Schrödinger molecular modeling suite (release 2023-1) [81,82,83]. The eight validated core targets—GSK3B, PTGS2, MTOR, MAPK8, AKT1, MAPK1, CTNNB1 and MAPK3—were subjected to structure-based virtual screening using the receptors and grids described above.
A total of 49 candidate compounds obtained from the network pharmacology analysis were initially subjected to High-Throughput Virtual Screening (HTVS) against each protein target. The top 20% of compounds according to the HTVS docking scores were retained, corresponding to approximately ten compounds per target, and were subsequently subjected to Standard Precision (SP) docking. Following SP docking, the five best-ranked compounds for each protein target were selected for Extra Precision (XP) docking [84]. Docking was performed with a rigid receptor and flexible ligand sampling, followed by post-docking minimization of the retained poses; induced-fit docking was not performed, so receptor side-chain rearrangement was not sampled explicitly. XP docking was then performed on the selected compounds to obtain more accurate docking scores and binding poses. Finally, the XP docking results were ranked according to the XP docking score, and the top-performing ligand–protein complexes were subjected to detailed interaction analysis, in which the binding modes and the interactions with key amino acid residues within the respective binding pockets were examined in order to identify the most promising compounds and their potential interactions with the selected core targets. The hierarchical funnel described above was the selection campaign, and it was used to identify the leading compounds. It was not the source of the scores analyzed in Section 4.24 and Section 4.25. Because the question addressed there is why particular compounds recur across receptors, which cannot be answered from a set of scores that has itself been filtered, all 49 compounds were subsequently re-docked at every receptor in extra precision, using the same grids and the same XP settings, with no filtering and no score threshold at any stage. The cross-target correlation analysis, the receptor-normalized ranking and the ligand-descriptor deconvolution are therefore based throughout on a complete 49 × 6 matrix of XP scores, on the same footing as the XP re-docking baselines and as the chemically diverse library of Section 4.26.
4.17. Molecular Dynamics Simulation of the Prioritized Complex
The AKT1–Robinetin complex retained from the extra-precision docking stage (receptor PDB 3CQW; XP score −8.83 kcal/mol) was submitted to an all-atom molecular dynamics (MD) simulation in order to examine the conformational stability, the structural flexibility and the persistence of the protein–ligand interactions predicted by docking. The simulation was carried out in duplicate. Two independent production runs of 100 ns were computed from the same docked pose, each from a separately assembled solvated system and an independent set of initial velocities, so that the two trajectories differ only in the stochastic elements of system construction and thermalization. They are referred to below as run 1 and run 2, and every quantity derived from the dynamics is reported for both. The simulation was performed with Desmond (Desmond Molecular Dynamics System; D. E. Shaw Research: New York, NY, USA, 2023; Maestro–Desmond Interoperability Tools, Schrödinger, LLC: New York, NY, USA, 2023), and the docked pose was used, without further modification, as the initial structure for system construction [85]. The receptor was taken from PDB 3CQW together with the co-crystallized GSK-3β-derived substrate peptide (chain C, sequence GRPRTTSFAE), which was retained in the simulated system. The assembled complex therefore comprised 333 residues in two chains: the AKT1 kinase domain (chain A, residues 144–478, acetyl- and N-methylamide-capped) and the ten-residue substrate peptide. The peptide binds the substrate groove on the C-lobe, remote from the ATP cleft occupied by Robinetin, and it was retained rather than deleted because it forms part of the crystallographic model from which the receptor was prepared. Its presence does not affect the flexibility analysis reported below: the mean Cα RMSF is 1.22 Å over the kinase domain alone and 1.22 Å over both chains together.
The complex was solvated with the three-site transferable intermolecular potential (TIP3P) explicit water model in an orthorhombic box, and Na+ and Cl− ions were added in order to neutralize the net charge of the system and to reproduce a physiological ionic environment [86]. The assembled systems comprised 14,544 atoms in run 1 and 14,541 in run 2, including 3039 and 3038 water molecules, respectively, and, in each case, eight Na+ and eight Cl− ions (approximately 47.9 mM), with a net charge of zero. The OPLS_2005 force field was used to describe the system, and the pressure was maintained at 1 atm, while periodic boundary conditions were applied in order to mimic bulk-solvent conditions.
The system was relaxed before production with the default Desmond relaxation protocol, which applies Brownian dynamics followed by successive restrained stages in the canonical (NVT) and isothermal–isobaric (NPT) ensembles at low temperature and then unrestrained equilibration in the NPT ensemble at the target temperature, each stage being preceded by energy minimization. The 100 ns production run was then carried out in the NPT ensemble at 310 K and 1 atm, integrated with a reversible reference system propagator algorithm (RESPA) multiple-time-step scheme using a 2.0 fs inner and a 6.0 fs outer time step, with the temperature controlled by a Nosé–Hoover chain thermostat and the pressure by a Martyna–Tobias–Klein barostat under isotropic coupling. Short-range Coulomb interactions were truncated at 9.0 Å, the long-range electrostatics were treated by the smooth particle-mesh Ewald method, and bonds involving hydrogen atoms were constrained with the M-SHAKE algorithm. Coordinates were written to the trajectory every 100 ps, so that the production run yielded 1001 frames for the analyses reported below. All parameters not stated here were left at the Desmond defaults for release 2023-1.
The production trajectory was subsequently analyzed with respect to the root-mean-square deviation (RMSD) of the protein and of the ligand, the root-mean-square fluctuation (RMSF) of the individual residues, the secondary-structure elements (SSE), and the protein–ligand interaction profile. The RMSD was computed after superposition of each frame on the reference structure, whereas the RMSF was used to quantify the flexibility of each residue along the trajectory [87].
Because the quantities derived from a trajectory depend on whether the early relaxation is included in the average, the approach to equilibrium was assessed explicitly before any time-averaged property was computed. The Cα RMSD was divided into non-overlapping 10 ns and 20 ns blocks, the block means and within-block standard deviations were compared, and a running 10 ns mean was compared with the mean of the final 20 ns of the run. On this basis, the interval from 75 to 100 ns was defined as the equilibrated segment, and every property that is sensitive to the approach to equilibrium—the protein and ligand RMSD, the ligand descriptors, the hydrogen-bond occupancies and the MM-GBSA estimates—is reported both for the whole production trajectory and for that segment.
4.18. MM-GBSA Binding Free Energy Calculations
The binding energetics of the prioritized complex were estimated using the molecular mechanics/generalized Born surface area (MM-GBSA) approach, in which the free energy of binding is expressed as [88]
ΔGbind = Gcomplex − (Gprotein + Gligand).
The calculated binding energy was decomposed into its individual energetic components, namely the Coulomb, van der Waals, lipophilic, hydrogen-bonding, packing, covalent, and generalized-Born solvation terms. In this scoring model, more negative contributions are more favorable to complex formation, whereas more positive contributions are unfavorable. The calculation was performed on eleven snapshots extracted at uniform 10 ns intervals across the entire production trajectory (0, 10, 20, …, 100 ns), and the results are reported as the mean of the eleven values together with their standard deviation, so that the dispersion of the estimate over the sampled conformational ensemble is stated explicitly. The mean restricted to the six snapshots that fall after the onset of equilibration identified in Section 2.12.1, namely those at 50–100 ns, is reported in parallel as a test of the sensitivity of the estimate to the inclusion of the pre-equilibration frames. The quantities reported here remain end-point binding-energy estimates computed with an implicit solvation model and without an explicit configurational-entropy term, and are therefore not rigorously converged binding free energies.
4.19. Principal Component and Dynamic Cross-Correlation Analyses
To characterize the dominant collective motions sampled during the simulation, principal component analysis (PCA) was applied to the Cα coordinates of the production trajectory after superposition of all frames on the initial structure. The covariance matrix of the atomic fluctuations was diagonalized, the eigenvectors were ranked according to their eigenvalues, and the conformational space was projected onto the first three principal components (PC1–PC3). In parallel, the correlation of the residue motions was examined by computing the dynamic cross-correlation matrix (DCCM) of the Cα fluctuations over the same trajectory, positive values denoting correlated and negative values anti-correlated displacements. Both analyses were performed with the trajectory-analysis utilities of the Schrödinger suite (release 2023-1).
4.20. Comparative Analysis of the ATP-Binding Pockets
Because the eight core targets included two non-kinases (PTGS2 and CTNNB1) that possess no ATP site, this analysis was restricted to the six kinases. The prepared receptor structures used for docking were taken without further modification so that the pocket definitions remained consistent with the docking campaign reported above.
For every receptor, the ATP pocket was defined operationally as the set of protein residues with at least one atom within 5.0 Å of the co-crystallized ligand, extracted in Maestro (Schrödinger 2023-1) with the atom-selection expression (protein) AND (fillres within 5.0 (ligand)). Complete residues were retained and the ligand itself was excluded. For AKT1 (3CQW), one residue contributed by a neighboring chain of the asymmetric unit was removed as a crystal-packing contact. Pocket sizes ranged from 20 to 31 residues.
4.21. Structural Superposition and Pocket-Restricted RMSD
Whole-protein structural alignment was performed with the Protein Structure Alignment tool using AKT1 (3CQW) as the reference and all residues as the alignment selection. Because residue numbering is independent between kinases, pocket residues cannot be compared by residue number; equivalence was therefore established geometrically. After superposition, each pocket residue of one structure was matched to the nearest pocket Cα of the partner structure, and the two positions were treated as structurally equivalent when their Cα atoms lay within 3.0 Å. Pocket-restricted RMSD was computed over the matched Cα pairs only, and coverage was reported as the proportion of pocket positions that found a partner. The procedure was implemented in Python using the Schrödinger structure application programming interface.
MTOR (4JT6) was excluded from all pairwise pocket comparisons. Its crystallized construct spans residues 1385–2542 and comprises extensive non-catalytic HEAT and FRB regions, so whole-protein superposition on the conventional protein-kinase fold placed the catalytic domain incorrectly and pocket coverage did not exceed 20% in any pair. All subsequent pocket analyses therefore involve five kinases and ten pairs; MTOR docking scores were retained elsewhere in the study.
4.22. Pocket Sequence Identity
For each pair, percent identity was calculated over the structurally equivalent pocket positions defined above, as the number of matched positions carrying the same amino acid divided by the number of matched positions. This yields a 5 × 5 similarity matrix that is independent of the residue numbering of the individual structures.
4.23. Binding-Site Characterization by SiteMap
Each receptor was analyzed with SiteMap in single-site evaluation mode [89], with the site defined by the co-crystallized ligand and a 6 Å buffer, a minimum of 15 site points, the standard grid and the less restrictive definition of hydrophobicity. SiteScore, Dscore, volume, exposure, enclosure, hydrophobic and hydrophilic character and the donor/acceptor ratio were recorded for the site containing the crystallographic ligand.
4.24. Relationship Between Target Similarity and Score-Pattern Similarity
For every kinase pair, the Pearson correlation coefficient between the docking scores of the 49 compounds at the two receptors was computed over compounds scored at both receptors. The scores used here are the extra-precision scores obtained for all 49 compounds in the unfiltered re-docking described in Section 4.16, not the scores retained at the intermediate stages of the selection funnel. These coefficients were then regressed against pocket sequence identity and, separately, against the absolute difference in each SiteMap descriptor. Because the pairwise values are not mutually independent, significance was assessed by a Mantel permutation test (9999 permutations) in addition to the nominal parametric p-value [90,91], and the stability of each relationship was checked by leave-one-pair-out recomputation. Pearson correlation is invariant to linear rescaling, so per-receptor normalization of the scores does not affect these coefficients. The Mantel test was applied to the two matrices directly rather than to the vector of pairwise values. The matrix of inter-receptor score correlations was held fixed; the rows and columns of the pocket sequence-identity matrix were permuted together at random 9999 times, the Pearson correlation between corresponding off-diagonal elements was recomputed at each permutation; and the reported p-value is the proportion of permutations yielding a coefficient at least as extreme as the observed one. Permuting the matrix rather than the pair list preserves the dependence that arises because each receptor appears in several pairs, which a test applied to the pairwise values as if independent would ignore.
4.25. Deconvolution of the Ligand Contribution to Cross-Target Correlation
The number of free (non-etherified, non-glycosylated) hydroxyl groups was counted for each of the 49 flavonoids from its structure. The docking score at each receptor was regressed on this count by ordinary least squares, and the residuals were retained. Partial correlations between receptors were then computed on these residuals, so that any inter-receptor agreement attributable to hydroxylation alone is removed. Because a single descriptor can act as a proxy for a correlated group of properties, the collinearity of the hydroxyl count with the other physicochemical descriptors available for each library was quantified before this deconvolution was interpreted: the pkCSM descriptors for the flavonoid series (molecular weight, log P, rotatable bonds, hydrogen-bond acceptors and donors, and polar surface area) and the QikProp descriptors listed in Section 4.26 for the diverse library. All statistical analyses were performed in Python (version 3.11; Python Software Foundation: Wilmington, DE, USA, 2023) with the NumPy, pandas, SciPy and Matplotlib libraries.
4.26. Independent Validation in a Chemically Diverse Library
To test whether the relationships observed in the flavonoid series are specific to that scaffold, a second, structurally unrelated library was profiled under an identical protocol. The Selleck bioactive compound library (L1400, 3667 records) was obtained in SDF format, of which 3666 could be parsed. One hundred and fifty compounds were drawn at random using a fixed random seed (42), with no filter on activity, structure or predicted property, so that the selection is reproducible by any reader. One record was unreadable, leaving 149 compounds, which were prepared with LigPrep under exactly the settings used for the flavonoid library (OPLS4; Epik ionization states at pH 7.0 ± 2.0 with metal-binding states and retention of the original state; desalting; tautomer generation; up to eight stereoisomers per ligand; maximum ligand size 500 atoms). Compounds with a molecular weight above 600 Da were then excluded as too large to be accommodated in the ATP site, leaving 127 compounds and 296 prepared structures.
These were docked into the same six prepared receptors using the same Glide grids and the same Glide extra-precision (XP) settings as the main campaign, with no filtering and no score threshold at any stage. Between 290 and 296 of the 296 structures were docked successfully at each receptor; the few failures were reported by Glide as grid-energy minimization failures. For each compound, the best (most negative) score at each receptor was retained. QikProp descriptors were computed on the same prepared structures [92]. After merging scores with descriptors, 122 compounds had complete data at all six receptors and were used in the analyses below. The library composition was deliberately heterogeneous, spanning steroids, alkaloids, antibiotics, statins, coumarins, terpenoids and amino acids.
Docking scores were analyzed exactly as in Section 4.24 and Section 4.25, with two additions. First, the six-column score matrix was column-standardized and decomposed by singular value decomposition to quantify how much of its variance lies on a single latent axis. Second, the residual analysis was extended from one descriptor to a multiple linear model containing molecular weight, hydrogen-bond donor and acceptor counts, log P, rotatable bonds, polar surface area, molecular volume and the combined count of nitrogen and oxygen atoms; inter-receptor correlations were then recomputed on the residuals of this model.
5. Conclusions
This study set out to test whether the multi-target profiles that computational screens routinely report for flavonoids withstand two forms of scrutiny: correction for the scoring baseline of each receptor, and examination of the structural and ligand-side basis of the cross-target signal.
Receptor normalization proved necessary. Baseline XP scores of the co-crystallized ligands spanned more than eight kcal/mol across the eight core targets, a range wider than the differences between the screened compounds, and expressing each compound–target pair relative to its own baseline reordered the campaign entirely (Spearman ρ = 0.078, p = 0.49). Any comparison of docking scores across receptors that omits this step is comparing receptors rather than compounds.
Normalization alone, however, is not sufficient. Restricting attention to the five protein kinases, the ATP pockets were substantially more conserved than the folds carrying them (pocket RMSD 0.97–1.19 Å against 2.30–2.77 Å) and were of uniformly high predicted druggability (SiteScore 1.028–1.120) despite a twofold spread in volume. Docking scores were correlated between every kinase pair (r = 0.475–0.796), yet no relationship was detected between this agreement and pocket sequence identity (Mantel p = 0.29) or any binding-site descriptor examined. It was instead accounted for almost entirely by the number of free hydroxyl groups on the ligand, which explained 50–80% of the score variance at each individual receptor and whose removal collapsed the mean inter-receptor correlation from 0.693 to 0.080.
The apparent polypharmacology of this flavonoid series is therefore a property of the ligands rather than a reflection of complementarity to related binding sites. This does not exclude genuine multi-target activity, which docking cannot establish in either direction, but it does remove cross-target score agreement from the evidence that can be offered in its support. We propose that receptor normalization and ligand-descriptor deconvolution together constitute a minimum standard for multi-target claims derived from docking, and note that both are inexpensive additions to an existing campaign.
Within these limits, Robinetin exceeded its receptor baseline at four of five targets and was the best-normalized ligand of AKT1, the receptor with the strongest combined network, pathway and disease-association support. The AKT1–Robinetin complex was stable throughout two independent 100 ns trajectories (RMSD 2.0–3.3 Å; secondary-structure content 38.72%; mean MOLECULAR MECHANICS/GENERALIZED BORN SURFACE AREA, MM-GBSA, −137.2 ± 20.7 kcal/mol over 22 snapshots from two independent runs). Robinetin is accordingly nominated as an AKT1-directed flavonoid candidate for experimental evaluation, with the explicit caveat that its recurrence across several kinases is consistent with its hydroxylation state and requires orthogonal confirmation before being interpreted as multi-target engagement. One distinction should be drawn without ambiguity, because the language of computational screening invites its collapse. Every result reported in this work is a prediction. Robinetin has not been shown to inhibit AKT1, to activate it, or to modulate it in any direction; no affinity, no enzyme activity and no cellular or animal response were measured here, and none is reported for this compound at this target anywhere in the literature. What has been established is that Robinetin occupies the ATP site of AKT1 with a favorable calculated score relative to that receptor’s own crystallographic reference, and that the complex so formed remained dynamically stable in simulation. Neither observation is evidence of biological activity, and neither supports any statement that Robinetin inhibits AKT1 or treats Alzheimer’s disease. The measurement that would convert the prediction into a finding is an enzymatic assay against recombinant AKT1, followed by a cellular readout of the pathway; it has not been performed.
The generality of this behavior was tested in a second library of 122 compounds drawn at random from a bioactive collection spanning steroids, alkaloids, antibiotics, statins and terpenoids, and docked into the same six receptors under the same protocol. Cross-target agreement was reproduced and was slightly stronger than in the flavonoids (mean r = 0.776 against 0.693); a single latent axis again dominated the score matrix (81.4% of its variance); pocket similarity was again not predictive (Mantel p = 0.86); and hydrogen-bond donor capacity was again the leading ligand-side determinant. The two libraries differed only in reducibility: one descriptor removes the effect in the congeneric flavonoid series, whereas eight descriptors remove only 16% of it in the diverse library. Concordant docking scores across targets are therefore a general and largely irreducible feature of the method, not evidence of shared binding determinants.
This rationale is nevertheless qualified by the pharmacokinetic predictions obtained for the same compounds: all five characterized flavonoids were predicted to penetrate the blood–brain barrier poorly, with Isorhamnetin and Robinetin falling below the log PS threshold for central nervous system access, notwithstanding a predicted safety profile more favorable than that of donepezil. Optimization of central delivery, whether by structural modification or by formulation, is therefore a prerequisite for the therapeutic development of this series.
Supplementary Materials
The following supporting information can be downloaded at: https://www.mdpi.com/article/10.3390/ddc5040059/s1, Figure S1: Pairwise docking-score correlation versus ATP-pocket sequence identity for the ten kinase pairs; Table S1: pairwise ATP-pocket similarity (identity, RMSD, coverage) for the six kinases; Table S2: pairwise docking-score correlations for the flavonoid library; Table S3: pairwise docking-score correlations for the chemically unrelated validation library; Table S4: per-snapshot MM-GBSA decomposition of the AKT1–Robinetin complex; Table S5: run-to-run comparison of the two independent molecular-dynamics replicates.
Author Contributions
H.R.F.: conceptualization, methodology, investigation, formal analysis, visualization, data curation, validation, writing—original draft, writing—review and editing. Y.A.S.: supervision, investigation, data curation, visualization, writing—review and editing, project administration. M.H.: methodology, investigation, formal analysis, visualization, writing—original draft. F.A.K.: methodology, investigation, formal analysis, visualization, writing—original draft. M.F.M.-K.: methodology, investigation, formal analysis, visualization, writing—original draft. R.A.B.: methodology, investigation, formal analysis, writing—original draft. M.A.-A.: conceptualization, methodology, investigation, formal analysis, visualization, data curation, validation, writing—original draft, writing—review and editing. A.R.S.: methodology, investigation, formal analysis, writing—original draft. All authors have read and agreed to the published version of the manuscript.
Funding
This research received no external funding.
Institutional Review Board Statement
Not applicable. This study involved neither human participants nor animals.
Informed Consent Statement
Not applicable.
Data Availability Statement
All data generated or analyzed during this study are included in this article. The flavonoid library is commercially available from Selleck Chemicals, and the receptor structures used are publicly available from the Protein Data Bank under the accession codes listed in Table 2. The molecular dynamics trajectory and the associated analysis output files are available from the corresponding author upon reasonable request.
Acknowledgments
During the preparation of this manuscript, the authors used a generative artificial intelligence assistant for language editing, organization and formatting of author-written text, and for preparing Figure 8 from data and descriptions provided by the authors. All scientific work, including study design, data generation, molecular docking and molecular dynamics calculations, data analysis, and scientific interpretation, was performed by the authors. All other figures were prepared by the authors. The authors reviewed and verified all AI-assisted output and take full responsibility for the content and integrity of the manuscript.
Conflicts of Interest
The authors declare no conflicts of interest.
References
- Kim, A.Y.; Al Jerdi, S.; MacDonald, R.; Triggle, C.R. Alzheimer’s disease and its treatment–yesterday, today, and tomorrow. Front. Pharmacol. 2024, 15, 1399121. [Google Scholar] [CrossRef] [Scilit]
- Abdulkhaliq, A.A.; Kim, B.; Almoghrabi, Y.M.; Khan, J.; Ajoolabady, A.; Ren, J.; Bahijri, S.; Tuomilehto, J.; Borai, A.; Pratico, D. Amyloid-β and Tau in Alzheimer’s disease: Pathogenesis, mechanisms, and interplay. Cell Death Dis. 2026, 17, 21. [Google Scholar] [CrossRef] [Scilit]
- Abyadeh, M.; Gupta, V.; Paulo, J.A.; Mahmoudabad, A.G.; Shadfar, S.; Mirshahvaladi, S.; Gupta, V.; Nguyen, C.T.; Finkelstein, D.I.; You, Y.; et al. Amyloid-beta and tau protein beyond Alzheimer’s disease. Neural Regen. Res. 2024, 19, 1262–1276. [Google Scholar] [CrossRef] [Scilit]
- Grinin, L.; Grinin, A.; Korotayev, A. Global Aging: An Integral Problem of the Future. How to Turn a Problem into a Development Driver? In Reconsidering the Limits to Growth: A Report to the Russian Association of the Club of Rome; Springer: Berlin/Heidelberg, Germany, 2023; pp. 117–135. [Google Scholar] [CrossRef] [Scilit]
- Shukla, A.K.; Nilgirwar, P.S.; Bali, S.D. Current pharmacological treatments for neurodegenerative diseases. In The Neurodegeneration Revolution; Elsevier: Amsterdam, The Netherlands, 2025; pp. 117–126. [Google Scholar] [CrossRef] [Scilit]
- Maity, S.; Srinivas, M.G.; Nayak, G.; Ismail, M.; Mahadev, M.; Prabhu, P.P.; Nair, A. Multi-target Agents in Complex Diseases: From Design Principles to Therapeutic Applications. Curr. Drug Targets 2026, 27, 2953. [Google Scholar] [CrossRef] [Scilit]
- Castellani, R.J.; Jamshidi, P.; Plascencia-Villa, G.; Perry, G. The Amyloid Cascade Hypothesis. Am. J. Pathol. 2025, 195, 1988–1997. [Google Scholar] [CrossRef] [Scilit]
- Donison, N.; Palik, J.; Volkening, K.; Strong, M.J. Cellular and molecular mechanisms of pathological tau phosphorylation in traumatic brain injury: Implications for chronic traumatic encephalopathy. Mol. Neurodegener. 2025, 20, 56. [Google Scholar] [CrossRef] [Scilit]
- Kim, A.B.; Arvanitakis, Z. Insulin resistance, cognition, and Alzheimer disease. Obesity 2023, 31, 1486–1498. [Google Scholar] [CrossRef] [Scilit]
- Zhang, Y.; Kiryu, H. Identification of oxidative stress-related genes differentially expressed in Alzheimer’s disease and construction of a hub gene-based diagnostic model. Sci. Rep. 2023, 13, 6817. [Google Scholar] [CrossRef] [Scilit]
- Zhao, Z.; Le, J.; Fu, Z.; Yang, S.; Chen, Y. Cancer network pharmacology: Multi-network regulatory mechanisms and future directions. Med. Oncol. 2025, 42, 255. [Google Scholar] [CrossRef] [Scilit]
- Yang, S.; Du, Y.; Zhao, X.; Wu, C.; Yu, P. Reducing PDK1/Akt Activity: An Effective Therapeutic Target in the Treatment of Alzheimer’s Disease. Cells 2022, 11, 1735. [Google Scholar] [CrossRef] [Scilit]
- Fu, C.; Guo, K.; Liu, T.; Gong, J.; Dong, H. Unveiling AKT1 as a key target of β-asarone in Alzheimer’s disease through network pharmacology and molecular dynamics simulations. Pak. J. Pharm. Sci. 2026, 39, 1340. [Google Scholar] [CrossRef] [Scilit]
- Soni, S.; Kaur, G. Emerging therapeutics targeting the PI3K/Akt/GSK-3β in calcium dysregulation in Alzheimer’s disease. Cell Calcium 2026, 133, 103107. [Google Scholar] [CrossRef] [Scilit]
- Kumari, S.; Singh, A.K.; Kumar, M.; Pradhan, R.; Rao, A.R.; Yadav, Y.; Kumar, P.; Haldar, P.; Kaur, P.; Dey, S. Targeting a Tau Kinase Cdk5, Cyclin-Dependent Kinase: A Blood-Based Diagnostic Marker and Therapeutic Earmark for Alzheimer’s Disease. Biomolecules 2025, 15, 1365. [Google Scholar] [CrossRef] [Scilit]
- Bloom, G.S.; Norambuena, A. Dysregulation of mTOR by tau in Alzheimer’s disease. Cytoskeleton 2024, 81, 30–34. [Google Scholar] [CrossRef] [Scilit]
- Singh, L.; Bhatti, R. Signaling Pathways Involved in the Neuroprotective Effect of Osthole: Evidence and Mechanisms. Mol. Neurobiol. 2024, 61, 1100–1118. [Google Scholar] [CrossRef] [Scilit]
- Yang, W.; Yang, Q.; Wang, Z.; Zhao, X.; Deng, J.; Xia, X.; Wang, J.; Xia, L.; Wang, Y.; Cui, F.; et al. PI3K-Akt signaling network crosstalk in cerebral ischemia/reperfusion injury: Mechanisms and therapeutic implications. Chin. Med. J. 2026, 139, 2721–2740. [Google Scholar] [CrossRef] [Scilit]
- Ramasubbu, K.; Devi Rajeswari, V. Impairment of insulin signaling pathway PI3K/Akt/mTOR and insulin resistance induced AGEs on diabetes mellitus and neurodegenerative diseases: A perspective review. Mol. Cell. Biochem. 2023, 478, 1307–1324. [Google Scholar] [CrossRef] [Scilit]
- Vasan, N.; Cantley, L.C. At a crossroads: How to translate the roles of PI3K in oncogenic and metabolic signalling into improvements in cancer therapy. Nat. Rev. Clin. Oncol. 2022, 19, 471–485. [Google Scholar] [CrossRef] [Scilit]
- Zhang, H.-L.; Lin, Z.; Zhang, Y. Developments in research and commercialization of PI3K and AKT targets: A patent-based landscape. Pharm. Pat. Anal. 2024, 13, 217–224. [Google Scholar] [CrossRef] [Scilit]
- Davies, B.R.; Greenwood, H.; Dudley, P.; Crafter, C.; Yu, D.-H.; Zhang, J.; Li, J.; Gao, B.; Ji, Q.; Maynard, J.; et al. Preclinical Pharmacology of AZD5363, an Inhibitor of AKT: Pharmacodynamics, Antitumor Activity, and Correlation of Monotherapy Activity with Genetic Background. Mol. Cancer Ther. 2012, 11, 873–887. [Google Scholar] [CrossRef] [Scilit]
- Shri, S.R.; Manandhar, S.; Nayak, Y.; Pai, K.S.R. Role of GSK-3β Inhibitors: New Promises and Opportunities for Alzheimer’s Disease. Adv. Pharm. Bull. 2023, 13, 688–700. [Google Scholar] [CrossRef] [Scilit]
- Shawky, E.; Nahar, L.; Sarker, S.D.; Selim, D.A. Fit-for-purpose analytics for cannabis: Identification, quantification, and standardization of cannabinoids, flavonoids and terpenes. Crit. Rev. Anal. Chem. 2026, 1–22. [Google Scholar] [CrossRef] [Scilit]
- Kumar, S.; Arora, A.; Maikhuri, V.K.; Chaudhary, A.; Kumar, R.; Parmar, V.S.; Singh, B.K.; Mathur, D. Advances in chromone-based copper(ii) Schiff base complexes: Synthesis, characterization, and versatile applications in pharmacology and biomimetic catalysis. RSC Adv. 2024, 14, 17102–17139. [Google Scholar] [CrossRef] [Scilit]
- Hasan, S.; Khatri, N.; Rahman, Z.N.; Menezes, A.A.; Martini, J.; Shehjar, F.; Mujeeb, N.; Shah, Z.A. Neuroprotective Potential of Flavonoids in Brain Disorders. Brain Sci. 2023, 13, 1258. [Google Scholar] [CrossRef] [Scilit]
- Piva, M.; Martelossi-Cebinelli, G.; Mendes-Pierotti, S.; Chinen, W.H.; Cardines, P.H.F.; Martinez, R.M.; Georgetti, S.R.; Baracat, M.M.; Vicentini, F.T.M.C.; Verri, W.A.; et al. Flavonoids as Nutraceuticals to Treat Inflammatory Diseases: Focusing on Quercetin, Kaempferol, Luteolin, Apigenin, Epicatechin and Their Effects on Hepatic, Nervous, and Pulmonary Systems. Foods 2026, 15, 2159. [Google Scholar] [CrossRef] [Scilit]
- Encinar, J.A.; Yang, C.; Fernández-Ginés, R.; Tang, Y.; Cuadrado, A. ADMET-Driven Chemical Navigability Rules for Early-Stage Virtual Compound Prioritization. J. Chem. Inf. Model. 2026, 66, 9429–9447. [Google Scholar] [CrossRef] [Scilit]
- Rout, T.; Mohapatra, A.; Kar, M. A systematic review of graph-based explorations of PPI networks: Methods, resources, and best practices. Netw. Model. Anal. Health Inform. Bioinform. 2024, 13, 29. [Google Scholar] [CrossRef] [Scilit]
- Thombre, K.R.; Gabhane, V.; Gupta, K.R.; Umekar, M.J. Network pharmacology in the multi-omics era: Uncovering novel therapeutic strategies. Discov. Chem. 2026, 3, 111. [Google Scholar] [CrossRef] [Scilit]
- Walker, E.H.; Pacold, M.E.; Perisic, O.; Stephens, L.; Hawkins, P.T.; Wymann, M.P.; Williams, R.L. Structural Determinants of Phosphoinositide 3-Kinase Inhibition by Wortmannin, LY294002, Quercetin, Myricetin, and Staurosporine. Mol. Cell 2000, 6, 909–919. [Google Scholar] [CrossRef]
- Ahmad, V.; Alotibi, I.; Alghamdi, A.A.; Ahmad, A.; Jamal, Q.M.S.; Srivastava, S. Computational Approaches to Evaluate the Acetylcholinesterase Binding Interaction with Taxifolin for the Management of Alzheimer’s Disease. Molecules 2024, 29, 674. [Google Scholar] [CrossRef] [Scilit]
- Iqbal, D.; Rehman, M.T.; Alajmi, M.F.; Alsaweed, M.; Jamal, Q.M.S.; Alasiry, S.M.; Albaker, A.B.; Hamed, M.; Kamal, M.; Albadrani, H.M. Multitargeted Virtual Screening and Molecular Simulation of Natural Product-like Compounds against GSK3β, NMDA-Receptor, and BACE-1 for the Management of Alzheimer’s Disease. Pharmaceuticals 2023, 16, 622. [Google Scholar] [CrossRef] [Scilit]
- Das, S.S.; Rathore, R.; Singh, H.; Sharma, S.; Ramkumar, M. Network Pharmacology and Molecular Docking for Natural Product-Based Therapies in Gallbladder and Biliary Tract Cancers: Workflows, Pitfalls, and Translational Opportunities. Cureus 2026, 18, e110851. [Google Scholar] [CrossRef] [Scilit]
- Bala, L.; Jeyabalan, S.; Veeraraghavan, G.; Kaliaperumal, K.; Ashok, C.; Pandiyan, D.D. Exploring flavonoids as multi-target therapeutic agents in Alzheimer’s disease: Insights from Network Pharmacology, Molecular Docking, and Dynamics. J. Appl. Pharm. Sci. 2025, 15, 136–153. [Google Scholar] [CrossRef] [Scilit]
- Huang, F.; Fu, M.; Li, J.; Chen, L.; Feng, K.; Huang, T.; Cai, Y.-D. Analysis and prediction of protein stability based on interaction network, gene ontology, and KEGG pathway enrichment scores. Biochim. Biophys. Acta (BBA) Proteins Proteom. 2023, 1871, 140889. [Google Scholar] [CrossRef] [Scilit]
- Benjamini, Y.; Hochberg, Y. Controlling the False Discovery Rate: A Practical and Powerful Approach to Multiple Testing. J. R. Stat. Soc. Ser. B Stat. Methodol. 1995, 57, 289–300. [Google Scholar] [CrossRef] [Scilit]
- Berg, S.; Bergh, M.; Hellberg, S.; Högdin, K.; Lo-Alfredsson, Y.; Söderman, P.; von Berg, S.; Weigelt, T.; Ormö, M.; Xue, Y.; et al. Discovery of Novel Potent and Highly Selective Glycogen Synthase Kinase-3β (GSK3β) Inhibitors for Alzheimer’s Disease: Design, Synthesis, and Characterization of Pyrazines. J. Med. Chem. 2012, 55, 9107–9119. [Google Scholar] [CrossRef] [Scilit]
- Orlando, B.J.; Malkowski, M.G. Substrate-selective Inhibition of Cyclooxygenase-2 by Fenamic Acid Derivatives Is Dependent on Peroxide Tone. J. Biol. Chem. 2016, 291, 15069–15081. [Google Scholar] [CrossRef] [Scilit]
- Yang, H.; Rudge, D.G.; Koos, J.D.; Vaidialingam, B.; Yang, H.J.; Pavletich, N.P. mTOR kinase structure, mechanism and regulation. Nature 2013, 497, 217–223. [Google Scholar] [CrossRef] [Scilit]
- Oza, V.; Ashwell, S.; Almeida, L.; Brassil, P.; Breed, J.; Deng, C.; Gero, T.; Grondine, M.; Horn, C.; Ioannidis, S.; et al. Discovery of Checkpoint Kinase Inhibitor (S)-5-(3-Fluorophenyl)-N-(piperidin-3-yl)-3-ureidothiophene-2-carboxamide (AZD7762) by Structure-Based Design and Optimization of Thiophenecarboxamide Ureas. J. Med. Chem. 2012, 55, 5130–5142. [Google Scholar] [CrossRef] [Scilit]
- Lippa, B.; Pan, G.; Corbett, M.; Li, C.; Kauffman, G.S.; Pandit, J.; Robinson, S.; Wei, L.; Kozina, E.; Marr, E.S.; et al. Synthesis and structure based optimization of novel Akt inhibitors. Bioorg. Med. Chem. Lett. 2008, 18, 3359–3363. [Google Scholar] [CrossRef] [Scilit]
- Ward, R.A.; Bethel, P.; Cook, C.; Davies, E.; Debreczeni, J.E.; Fairley, G.; Feron, L.; Flemington, V.; Graham, M.A.; Greenwood, R.; et al. Structure-Guided Discovery of Potent and Selective Inhibitors of ERK1/2 from a Modestly Active and Promiscuous Chemical Start Point. J. Med. Chem. 2017, 60, 3438–3450. [Google Scholar] [CrossRef] [Scilit]
- Kessler, D.; Mayer, M.; Zahn, S.K.; Zeeb, M.; Wöhrle, S.; Bergner, A.; Bruchhaus, J.; Ciftci, T.; Dahmann, G.; Dettling, M.; et al. Getting a Grip on the Undrugged: Targeting β-Catenin with Fragment-Based Methods. ChemMedChem 2021, 16, 1420–1424. [Google Scholar] [CrossRef] [Scilit]
- Chaikuad, A.; Tacconi, E.M.C.; Zimmer, J.; Liang, Y.; Gray, N.S.; Tarsounas, M.; Knapp, S. A unique inhibitor binding site in ERK1/2 is associated with slow binding kinetics. Nat. Chem. Biol. 2014, 10, 853–860. [Google Scholar] [CrossRef] [Scilit]
- Razani, E.; Pourbagheri-Sigaroodi, A.; Safaroghli-Azar, A.; Zoghi, A.; Shanaki-Bavarsad, M.; Bashash, D. The PI3K/Akt Signaling Axis in Alzheimer’s Disease: A Valuable Target to Stimulate or Suppress? Cell Stress Chaperones 2021, 26, 871–887. [Google Scholar] [CrossRef] [Scilit]
- Boly, R.; Gras, T.; Lamkami, T.; Guissou, P.; Serteyn, D.; Kiss, R.; Dubois, J. Quercetin Inhibits a Large Panel of Kinases Implicated in Cancer Cell Biology. Int. J. Oncol. 2011, 38, 833–842. [Google Scholar] [CrossRef] [Scilit]
- Jakimiuk, K. A Comprehensive Review of Robinetin: Distribution, Biological Activity and Pharmacokinetic Parameters. Int. J. Mol. Sci. 2025, 26, 9546. [Google Scholar] [CrossRef] [Scilit]
- Murakami, K.; Irie, K. Three Structural Features of Functional Food Components and Herbal Medicine with Amyloid β42 Anti-Aggregation Properties. Molecules 2019, 24, 2125. [Google Scholar] [CrossRef] [Scilit]
- Zhang, X.-W.; Chen, J.-Y.; Ouyang, D.; Lu, J.-H. Quercetin in Animal Models of Alzheimer’s Disease: A Systematic Review of Preclinical Studies. Int. J. Mol. Sci. 2020, 21, 493. [Google Scholar] [CrossRef] [Scilit]
- Pinheiro, R.G.R.; Granja, A.; Loureiro, J.A.; Pereira, M.C.; Pinheiro, M.; Neves, A.R.; Reis, S. RVG29-Functionalized Lipid Nanoparticles for Quercetin Brain Delivery and Alzheimer’s Disease. Pharm. Res. 2020, 37, 139. [Google Scholar] [CrossRef] [Scilit]
- Selleck Chemicals. Flavonoid Compound Library, Catalog No. L7700; Selleck Chemicals: Houston, TX, USA; Available online: https://www.selleckchem.com/ (accessed on 27 October 2026).
- Ganai, S.A.; Mohan, S. Structure similarity based screening coupled to integrated structural biochemistry approach for exploring the high affinity inhibitors against histone deacetylase (HDAC)-6. Silico Pharmacol. 2025, 13, 8. [Google Scholar] [CrossRef] [Scilit]
- Almufarriji, F.M.; Alotaibi, B.S.; Alamri, A.S.; Alkhorayef, N.; Alnomasy, S.F.; Alqahtani, M.; Alenazy, R. Probing the multitargeted potency of FDA-approved Amifostine against MRSA and control comparison with sulfamethoxazole to establish alternative medications. Microb. Pathog. 2025, 203, 107485. [Google Scholar] [CrossRef] [Scilit]
- Pires, D.E.V.; Blundell, T.L.; Ascher, D.B. pkCSM: Predicting small-molecule pharmacokinetic and toxicity properties using graph-based signatures. J. Med. Chem. 2015, 58, 4066–4072. [Google Scholar] [CrossRef] [Scilit]
- da Silva, C.P.M.; das Neves, G.M.; Poser, G.L.; Eifler-Lima, V.L.; Rates, S.M.K. In silico Prediction of ADMET/Drug-likeness Properties of Bioactive Phloroglucinols from Hypericum Genus. Med. Chem. 2023, 19, 1002–1017. [Google Scholar] [CrossRef] [Scilit]
- Filimonov, D.A.; Lagunin, A.A.; Gloriozova, T.A.; Rudik, A.V.; Druzhilovskii, D.S.; Pogodin, P.V.; Poroikov, V.V. Prediction of the Biological Activity Spectra of Organic Compounds Using the PASS Online Web Resource. Chem. Heterocycl. Compd. 2014, 50, 444–457. [Google Scholar] [CrossRef] [Scilit]
- O’Boyle, N.M.; Banck, M.; James, C.A.; Morley, C.; Vandermeersch, T.; Hutchison, G.R. Open Babel: An Open Chemical Toolbox. J. Cheminform. 2011, 3, 33. [Google Scholar] [CrossRef] [Scilit]
- Daina, A.; Michielin, O.; Zoete, V. SwissTargetPrediction: Updated Data and New Features for Efficient Prediction of Protein Targets of Small Molecules. Nucleic Acids Res. 2019, 47, W357–W364. [Google Scholar] [CrossRef] [Scilit]
- Rappaport, N.; Nativ, N.; Stelzer, G.; Twik, M.; Guan-Golan, Y.; Iny Stein, T.; Bahir, I.; Belinky, F.; Morrey, C.P.; Safran, M.; et al. MalaCards: An integrated compendium for diseases and their annotation. Database 2013, 2013, bat018. [Google Scholar] [CrossRef] [Scilit]
- Oliveros, J.C. Venny. An Interactive Tool for Comparing Lists with Venn’s Diagrams, 2007–2015. Available online: https://bioinfogp.cnb.csic.es/tools/venny/index.html (accessed on 27 October 2026).
- Szklarczyk, D.; Nastou, K.; Koutrouli, M.; Kirsch, R.; Mehryary, F.; Hachilif, R.; Hu, D.; Peluso, M.E.; Huang, Q.; Fang, T.; et al. The STRING database in 2025: Protein networks with directionality of regulation. Nucleic Acids Res. 2025, 53, D730–D737. [Google Scholar] [CrossRef] [Scilit]
- Chin, C.-H.; Chen, S.-H.; Wu, H.-H.; Ho, C.-W.; Ko, M.-T.; Lin, C.-Y. cytoHubba: Identifying hub objects and sub-networks from complex interactome. BMC Syst. Biol. 2014, 8, S11. [Google Scholar] [CrossRef] [Scilit]
- Shannon, P.; Markiel, A.; Ozier, O.; Baliga, N.S.; Wang, J.T.; Ramage, D.; Amin, N.; Schwikowski, B.; Ideker, T. Cytoscape: A Software Environment for Integrated Models of Biomolecular Interaction Networks. Genome Res. 2003, 13, 2498–2504. [Google Scholar] [CrossRef] [Scilit]
- Freeman, L.C. Centrality in social networks conceptual clarification. Soc. Netw. 1978, 1, 215–239. [Google Scholar] [CrossRef] [Scilit]
- Bader, G.D.; Hogue, C.W.V. An automated method for finding molecular complexes in large protein interaction networks. BMC Bioinform. 2003, 4, 2. [Google Scholar] [CrossRef] [Scilit]
- Zhou, S.; Zhang, H.; Li, J.; Li, W.; Su, M.; Ren, Y.; Ge, F.; Zhang, H.; Shang, H. Potential anti-liver cancer targets and mechanisms of kaempferitrin based on network pharmacology, molecular docking and experimental verification. Comput. Biol. Med. 2024, 178, 108693. [Google Scholar] [CrossRef] [Scilit]
- Kanehisa, M.; Goto, S. KEGG: Kyoto Encyclopedia of Genes and Genomes. Nucleic Acids Res. 2000, 28, 27–30. [Google Scholar] [CrossRef] [Scilit]
- Sherman, B.T.; Panzade, G.; Dotrang, T.; Hao, M.; Xu, L.; Li, X.; Baseler, M.W.; Lane, H.C.; Imamichi, T.; Chang, W. DAVID: A web server for functional annotation and functional enrichment analysis of gene lists (2025 update). Nucleic Acids Res. 2026, 54, W367–W373. [Google Scholar] [CrossRef] [Scilit]
- Ashburner, M.; Ball, C.A.; Blake, J.A.; Botstein, D.; Butler, H.; Cherry, J.M.; Davis, A.P.; Dolinski, K.; Dwight, S.S.; Eppig, J.T.; et al. Gene Ontology: Tool for the unification of biology. Nat. Genet. 2000, 25, 25–29. [Google Scholar] [CrossRef] [Scilit]
- Tang, D.; Chen, M.; Huang, X.; Zhang, G.; Zeng, L.; Zhang, G.; Wu, S.; Wang, Y. SRplot: A free online platform for data visualization and graphing. PLoS ONE 2023, 18, e0294236. [Google Scholar] [CrossRef] [Scilit]
- Kanehisa, M.; Sato, Y.; Kawashima, M. KEGG mapping tools for uncovering hidden features in biological data. Protein Sci. 2022, 31, 47–53. [Google Scholar] [CrossRef] [Scilit]
- Piñero, J.; Ramírez-Anguita, J.M.; Saüch-Pitarch, J.; Ronzano, F.; Centeno, E.; Sanz, F.; Furlong, L.I. The DisGeNET knowledge platform for disease genomics: 2019 update. Nucleic Acids Res. 2020, 48, D845–D855. [Google Scholar] [CrossRef] [Scilit]
- Hoed, A.G.; Prieto-Santamaría, L.; Rodríguez-González, A. Evaluating the Influence of Disease-Gene Associations in the Significance of Disease Modules Through the Lens of Network Medicine. In Proceedings of the 2025 IEEE 38th International Symposium on Computer-Based Medical Systems (CBMS), Madrid, Spain, 18–20 June 2025; pp. 357–362. [Google Scholar] [CrossRef] [Scilit]
- Dey, D.; Kumar, A. Structural-based Study to Identify the Repurposed Candidates against Bacterial Infections. Curr. Med. Chem. 2025, 32, 3693–3718. [Google Scholar] [CrossRef] [Scilit]
- Burley, S.K.; Bhatt, R.; Bhikadiya, C.; Bi, C.; Biester, A.; Biswas, P.; Bittrich, S.; Blaumann, S.; Brown, R.; Chao, H.; et al. Updated resources for exploring experimentally-determined PDB structures and Computed Structure Models at the RCSB Protein Data Bank. Nucleic Acids Res. 2025, 53, D564–D574. [Google Scholar] [CrossRef] [Scilit]
- Sastry, G.M.; Adzhigirey, M.; Day, T.; Annabhimoju, R.; Sherman, W. Protein and Ligand Preparation: Parameters, Protocols, and Influence on Virtual Screening Enrichments. J. Comput. Aided Mol. Des. 2013, 27, 221–234. [Google Scholar] [CrossRef] [Scilit]
- Mohan, G.; Padmam, A.S.; Kumar, A.; Prasanna, S.J. Designing novel adenine clamp-CD73 mutants delineating surface expression and enzyme activity through in silico and in vitro engineering. Sci. Rep. 2026, 16, 32586. [Google Scholar] [CrossRef] [Scilit]
- Sencanski, M.; Perovic, V.; Milicevic, J.; Todorovic, T.; Prodanovic, R.; Veljkovic, V.; Paessler, S.; Glisic, S. Identification of SARS-CoV-2 Papain-like protease (PLpro) inhibitors using combined computational approach. ChemistryOpen 2022, 11, e202100248. [Google Scholar] [CrossRef] [Scilit]
- da Fonseca, A.M.; Caluaco, B.J.; Madureira, J.M.C.; Cabongo, S.Q.; Gaieta, E.M.; Djata, F.; Colares, R.P.; Neto, M.M.; Fernandes, C.F.C.; Marinho, G.S.; et al. Screening of Potential Inhibitors Targeting the Main Protease Structure of SARS-CoV-2 via Molecular Docking, and Approach with Molecular Dynamics, RMSD, RMSF, H-Bond, SASA and MMGBSA. Mol. Biotechnol. 2024, 66, 1919–1933. [Google Scholar] [CrossRef] [Scilit]
- Friesner, R.A.; Banks, J.L.; Murphy, R.B.; Halgren, T.A.; Klicic, J.J.; Mainz, D.T.; Repasky, M.P.; Knoll, E.H.; Shelley, M.; Perry, J.K.; et al. Glide: A New Approach for Rapid, Accurate Docking and Scoring. 1. Method and Assessment of Docking Accuracy. J. Med. Chem. 2004, 47, 1739–1749. [Google Scholar] [CrossRef] [Scilit]
- Halgren, T.A.; Murphy, R.B.; Friesner, R.A.; Beard, H.S.; Frye, L.L.; Pollard, W.T.; Banks, J.L. Glide: A New Approach for Rapid, Accurate Docking and Scoring. 2. Enrichment Factors in Database Screening. J. Med. Chem. 2004, 47, 1750–1759. [Google Scholar] [CrossRef] [Scilit]
- Friesner, R.A.; Murphy, R.B.; Repasky, M.P.; Frye, L.L.; Greenwood, J.R.; Halgren, T.A.; Sanschagrin, P.C.; Mainz, D.T. Extra Precision Glide: Docking and Scoring Incorporating a Model of Hydrophobic Enclosure for Protein−Ligand Complexes. J. Med. Chem. 2006, 49, 6177–6196. [Google Scholar] [CrossRef] [Scilit]
- Wang, S.; Xu, X.; Pan, C.; Guo, Q.; Li, Q.; Wan, S.; Li, Z.; Zhang, J.; Wu, X. Identification of New EGFR Inhibitors by Structure-Based Virtual Screening and Biological Evaluation. Int. J. Mol. Sci. 2024, 25, 1887. [Google Scholar] [CrossRef] [Scilit]
- Bowers, K.J.; Chow, E.; Xu, H.; Dror, R.O.; Eastwood, M.P.; Gregersen, B.A.; Klepeis, J.L.; Kolossvary, I.; Moraes, M.A.; Sacerdoti, F.D.; et al. Scalable Algorithms for Molecular Dynamics Simulations on Commodity Clusters. In Proceedings of the ACM/IEEE Conference on Supercomputing (SC’06), Tampa, FL, USA, 11–17 November 2006. [Google Scholar] [CrossRef] [Scilit]
- Othman, B.; Beigh, S.; Albanghali, M.A.; Sindi, A.A.A.; Shanawaz, M.A.; Ibahim, M.A.E.M.; Marghani, D.; Kofiah, Y.; Iqbal, N.; Rashid, H. Comprehensive pharmacokinetic profiling and molecular docking analysis of natural bioactive compounds targeting oncogenic biomarkers in breast cancer. Sci. Rep. 2025, 15, 5426. [Google Scholar] [CrossRef] [Scilit]
- Mbock, M.A.; Kamkumo, R.G.; Iqbal, N.; Feudjou Fouatio, W.; Shukla, R.; Chandra, A.; Tsouh Fokou, P.V.; Ngueguim Tsofack, F.; Bibi, I.; Fekam Boyom, F.; et al. Safety assessment of Detarium microcarpum Guil. & Perr. (Leguminosae) root bark extract in rats: Acute, sub-acute toxicity, ADMET, molecular docking, and molecular dynamics simulations approach. Fitoterapia 2025, 184, 106635. [Google Scholar] [CrossRef] [Scilit]
- Li, J.; Abel, R.; Zhu, K.; Cao, Y.; Zhao, S.; Friesner, R.A. The VSGB 2.0 Model: A Next Generation Energy Model for High Resolution Protein Structure Modeling. Proteins 2011, 79, 2794–2812. [Google Scholar] [CrossRef] [Scilit]
- Halgren, T.A. Identifying and Characterizing Binding Sites and Assessing Druggability. J. Chem. Inf. Model. 2009, 49, 377–389. [Google Scholar] [CrossRef] [Scilit]
- Mantel, N. The Detection of Disease Clustering and a Generalized Regression Approach. Cancer Res. 1967, 27, 209–220. [Google Scholar]
- Legendre, P.; Fortin, M.-J.; Borcard, D. Should the Mantel Test Be Used in Spatial Analysis? Methods Ecol. Evol. 2015, 6, 1239–1247. [Google Scholar] [CrossRef] [Scilit]
- Jorgensen, W.L.; Duffy, E.M. Prediction of Drug Solubility from Structure. Adv. Drug Deliv. Rev. 2002, 54, 355–366. [Google Scholar] [CrossRef] [Scilit]
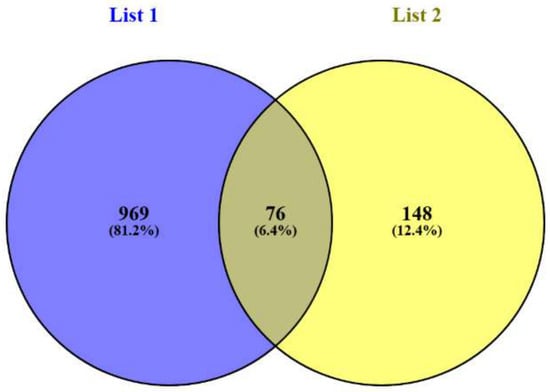
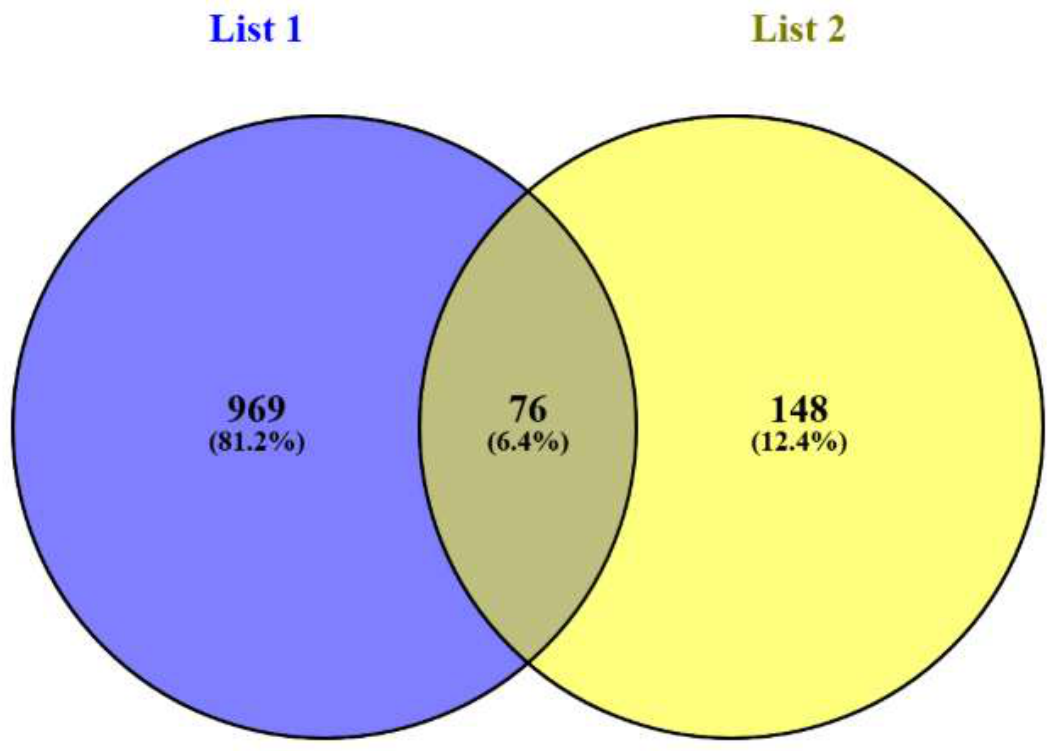
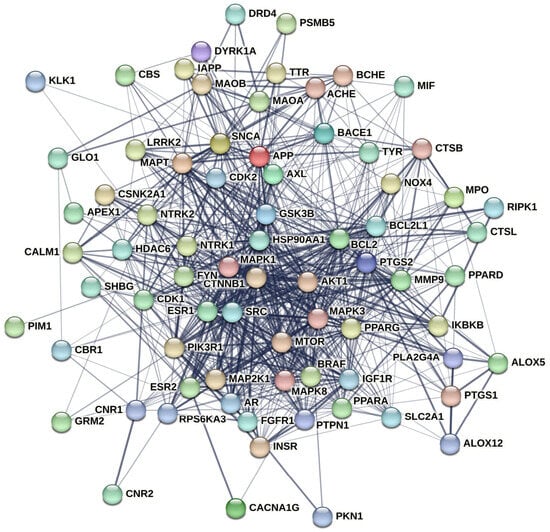
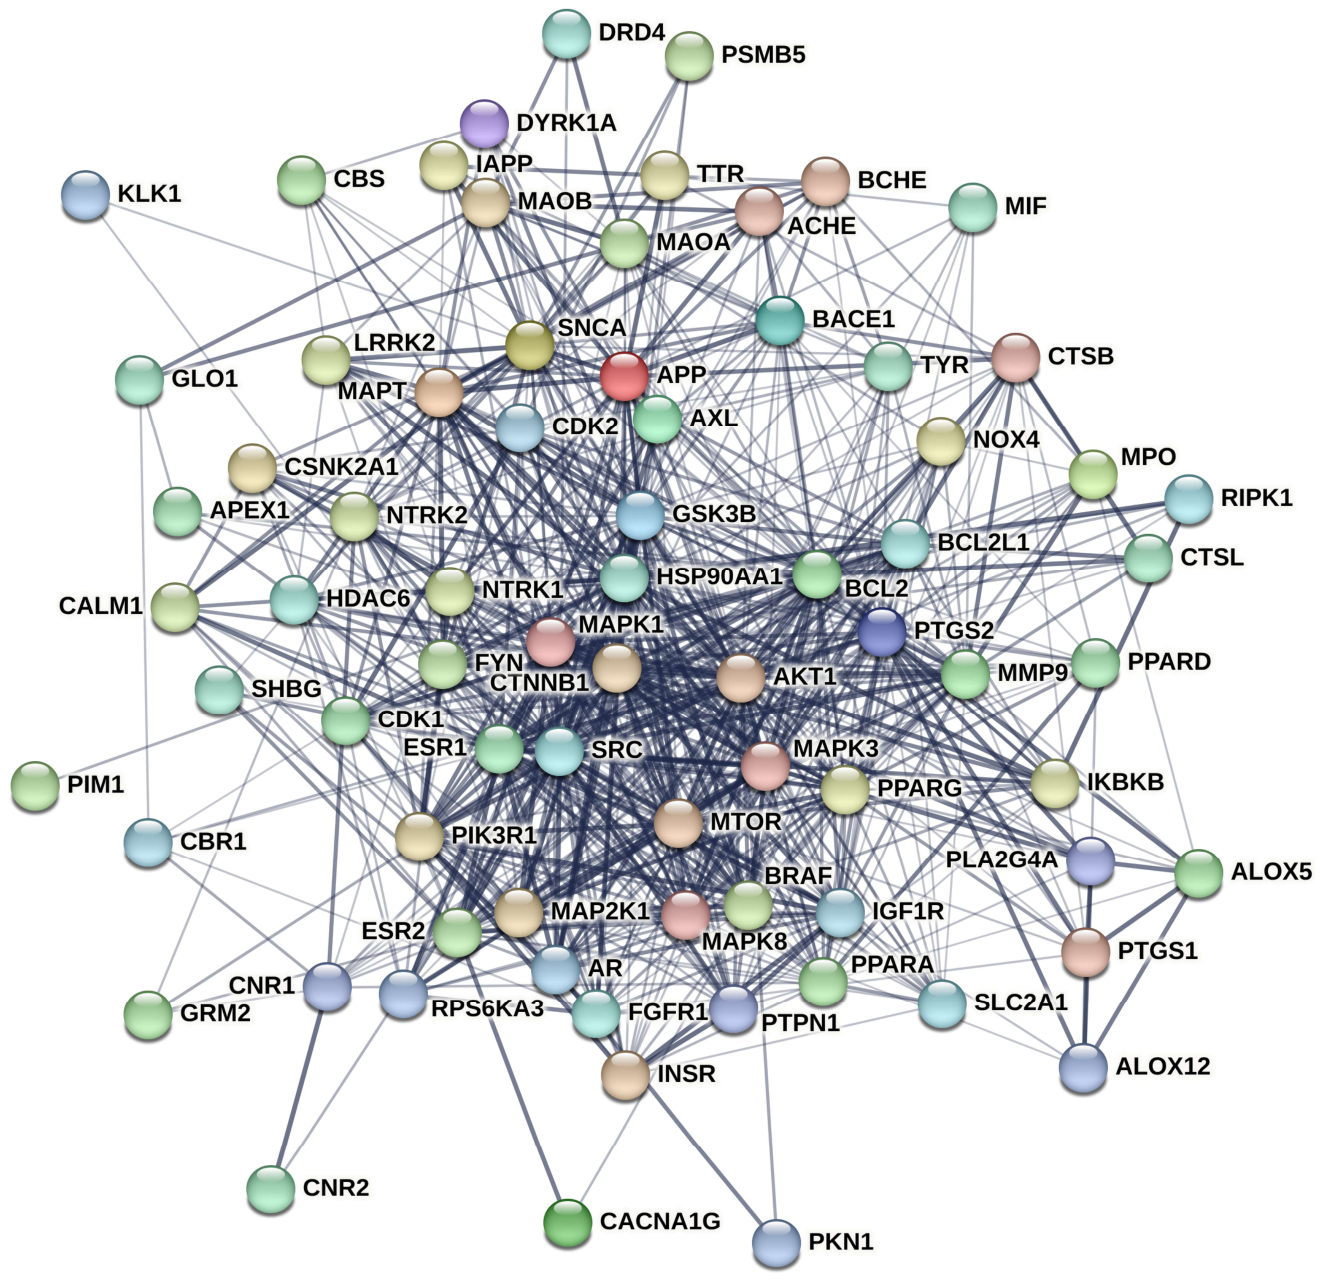
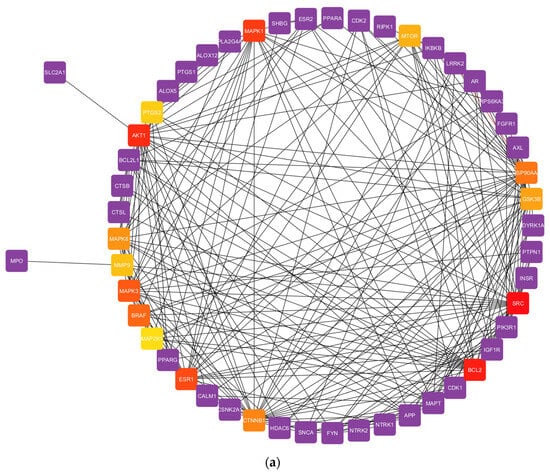
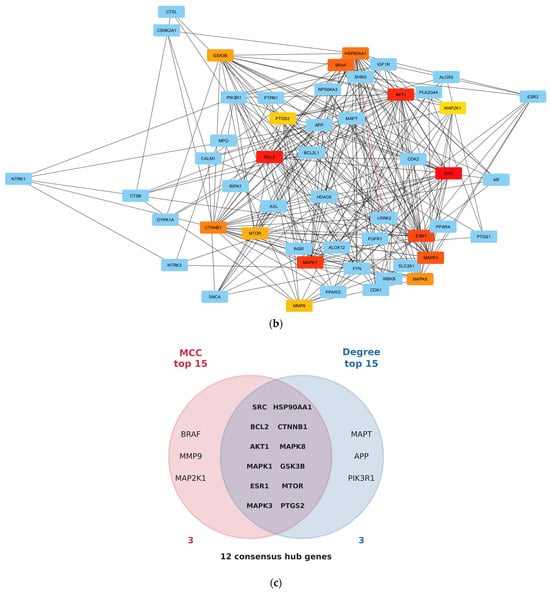
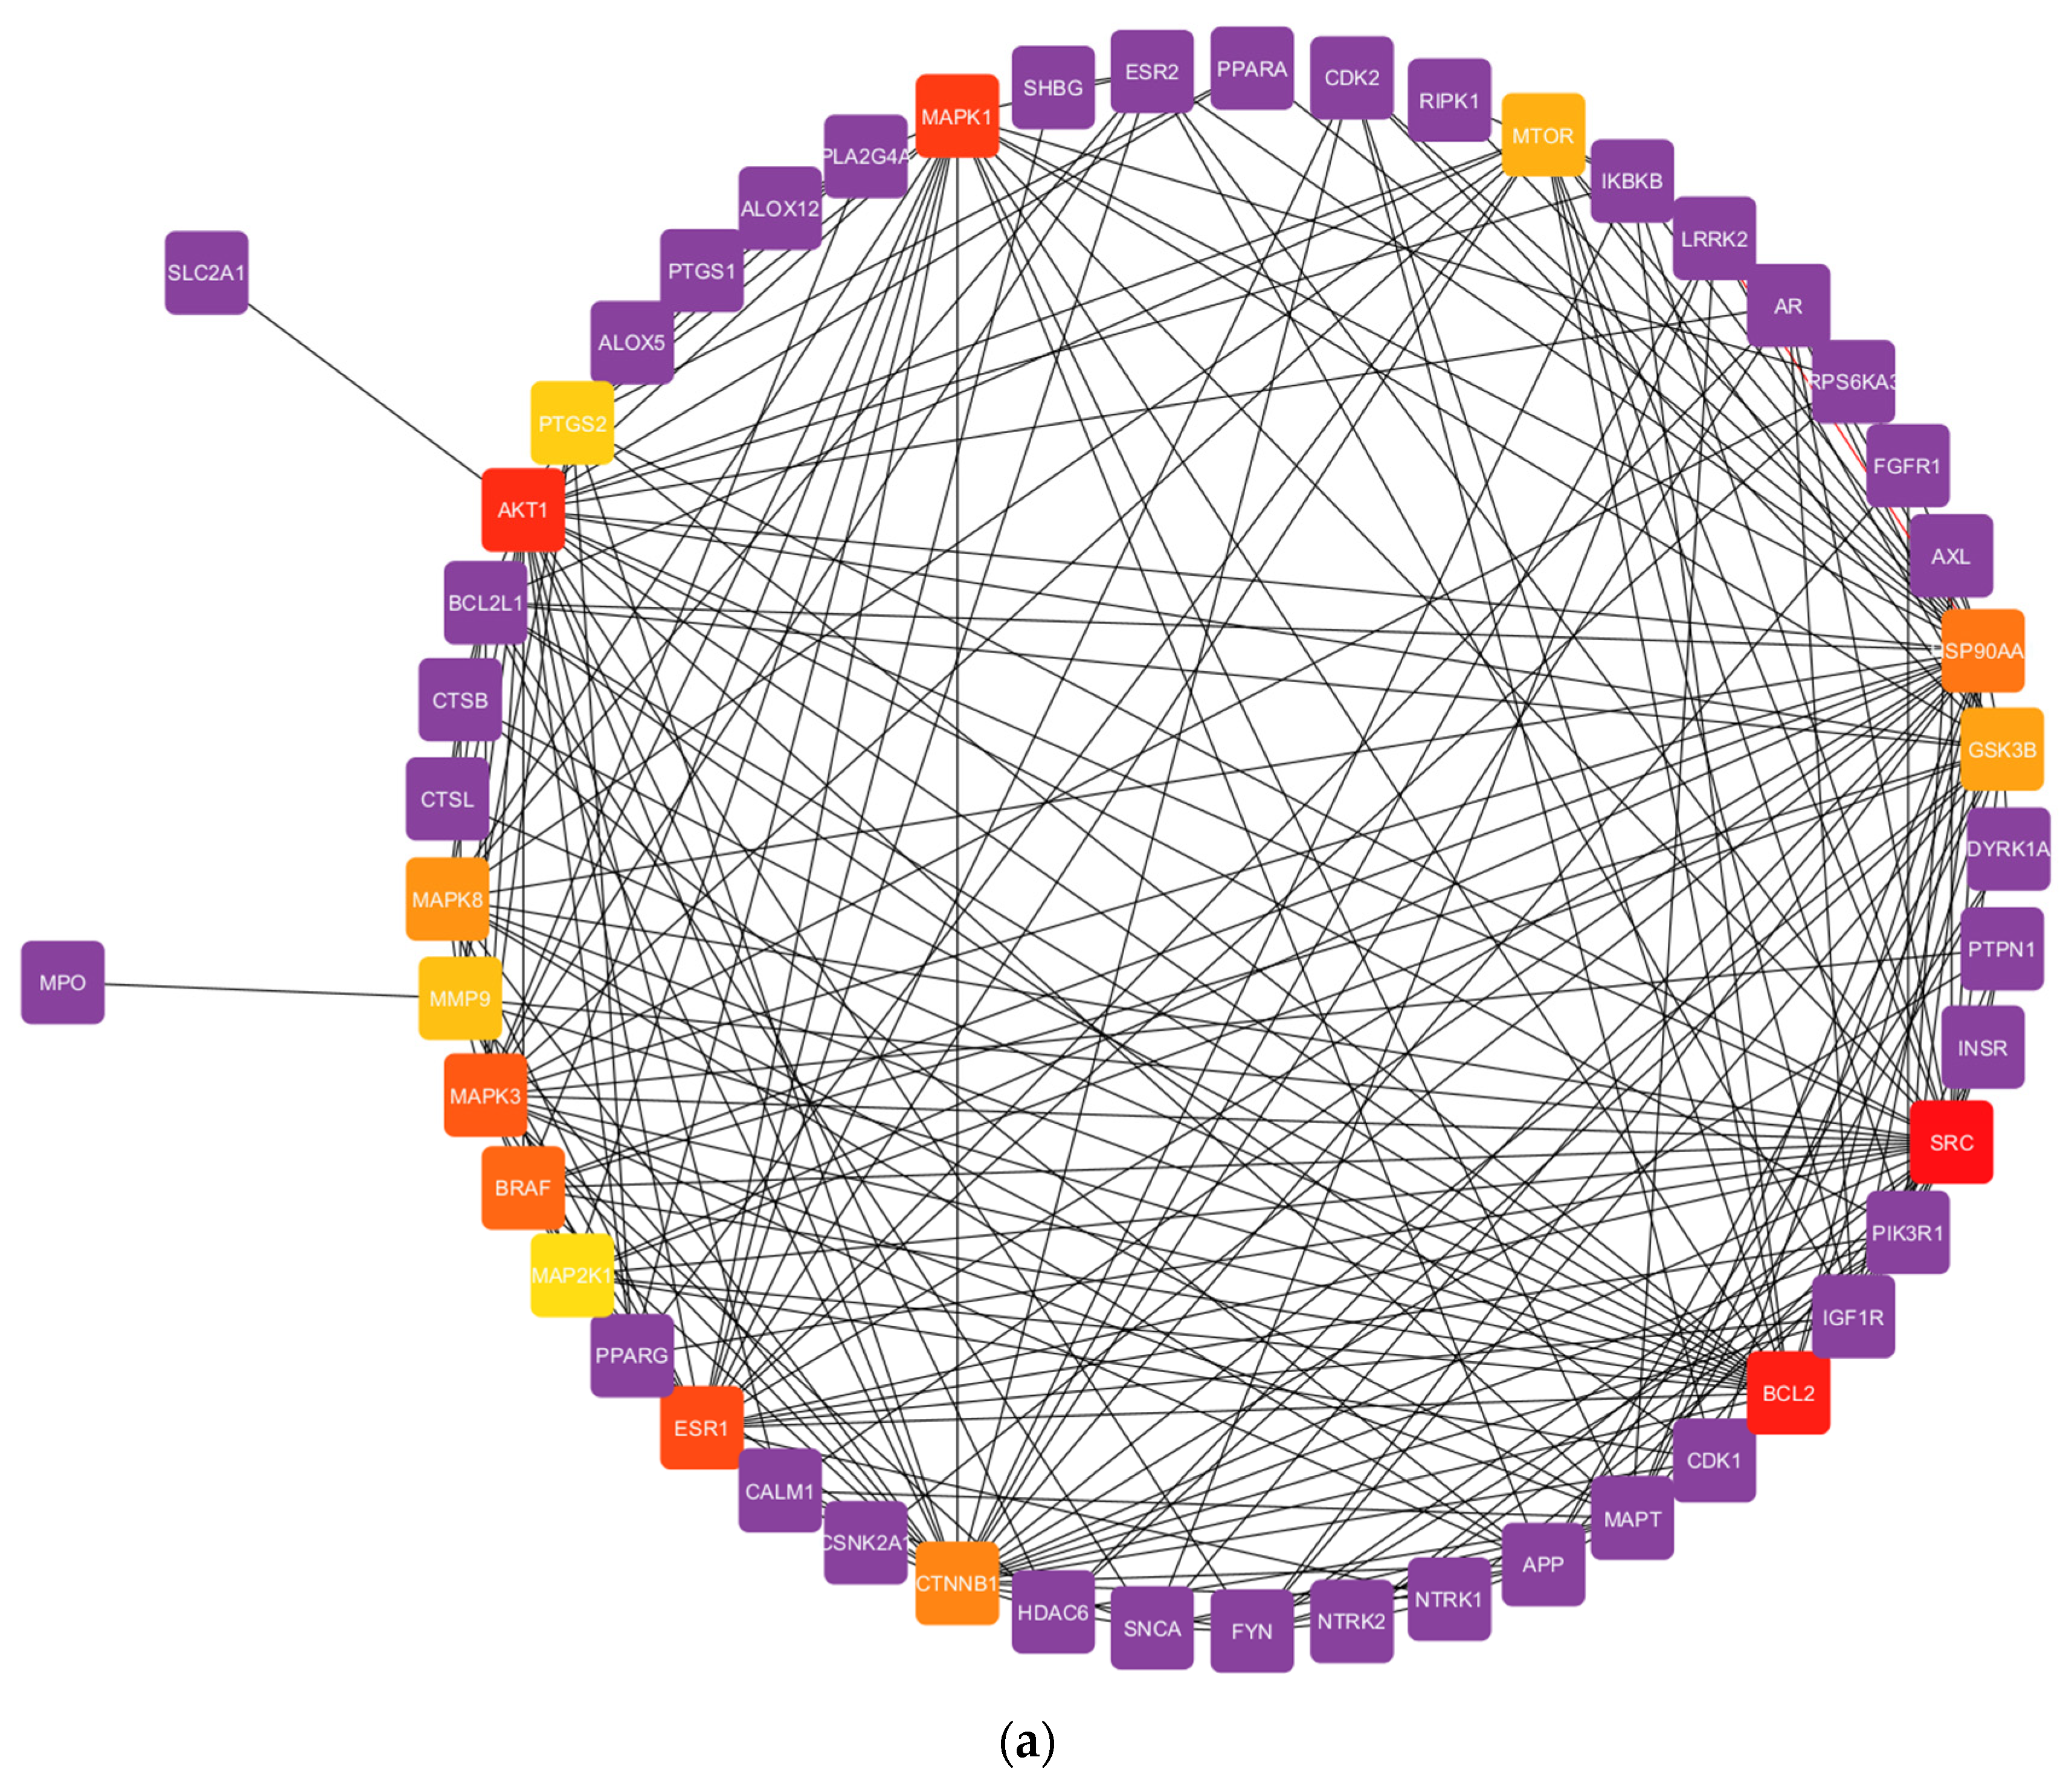
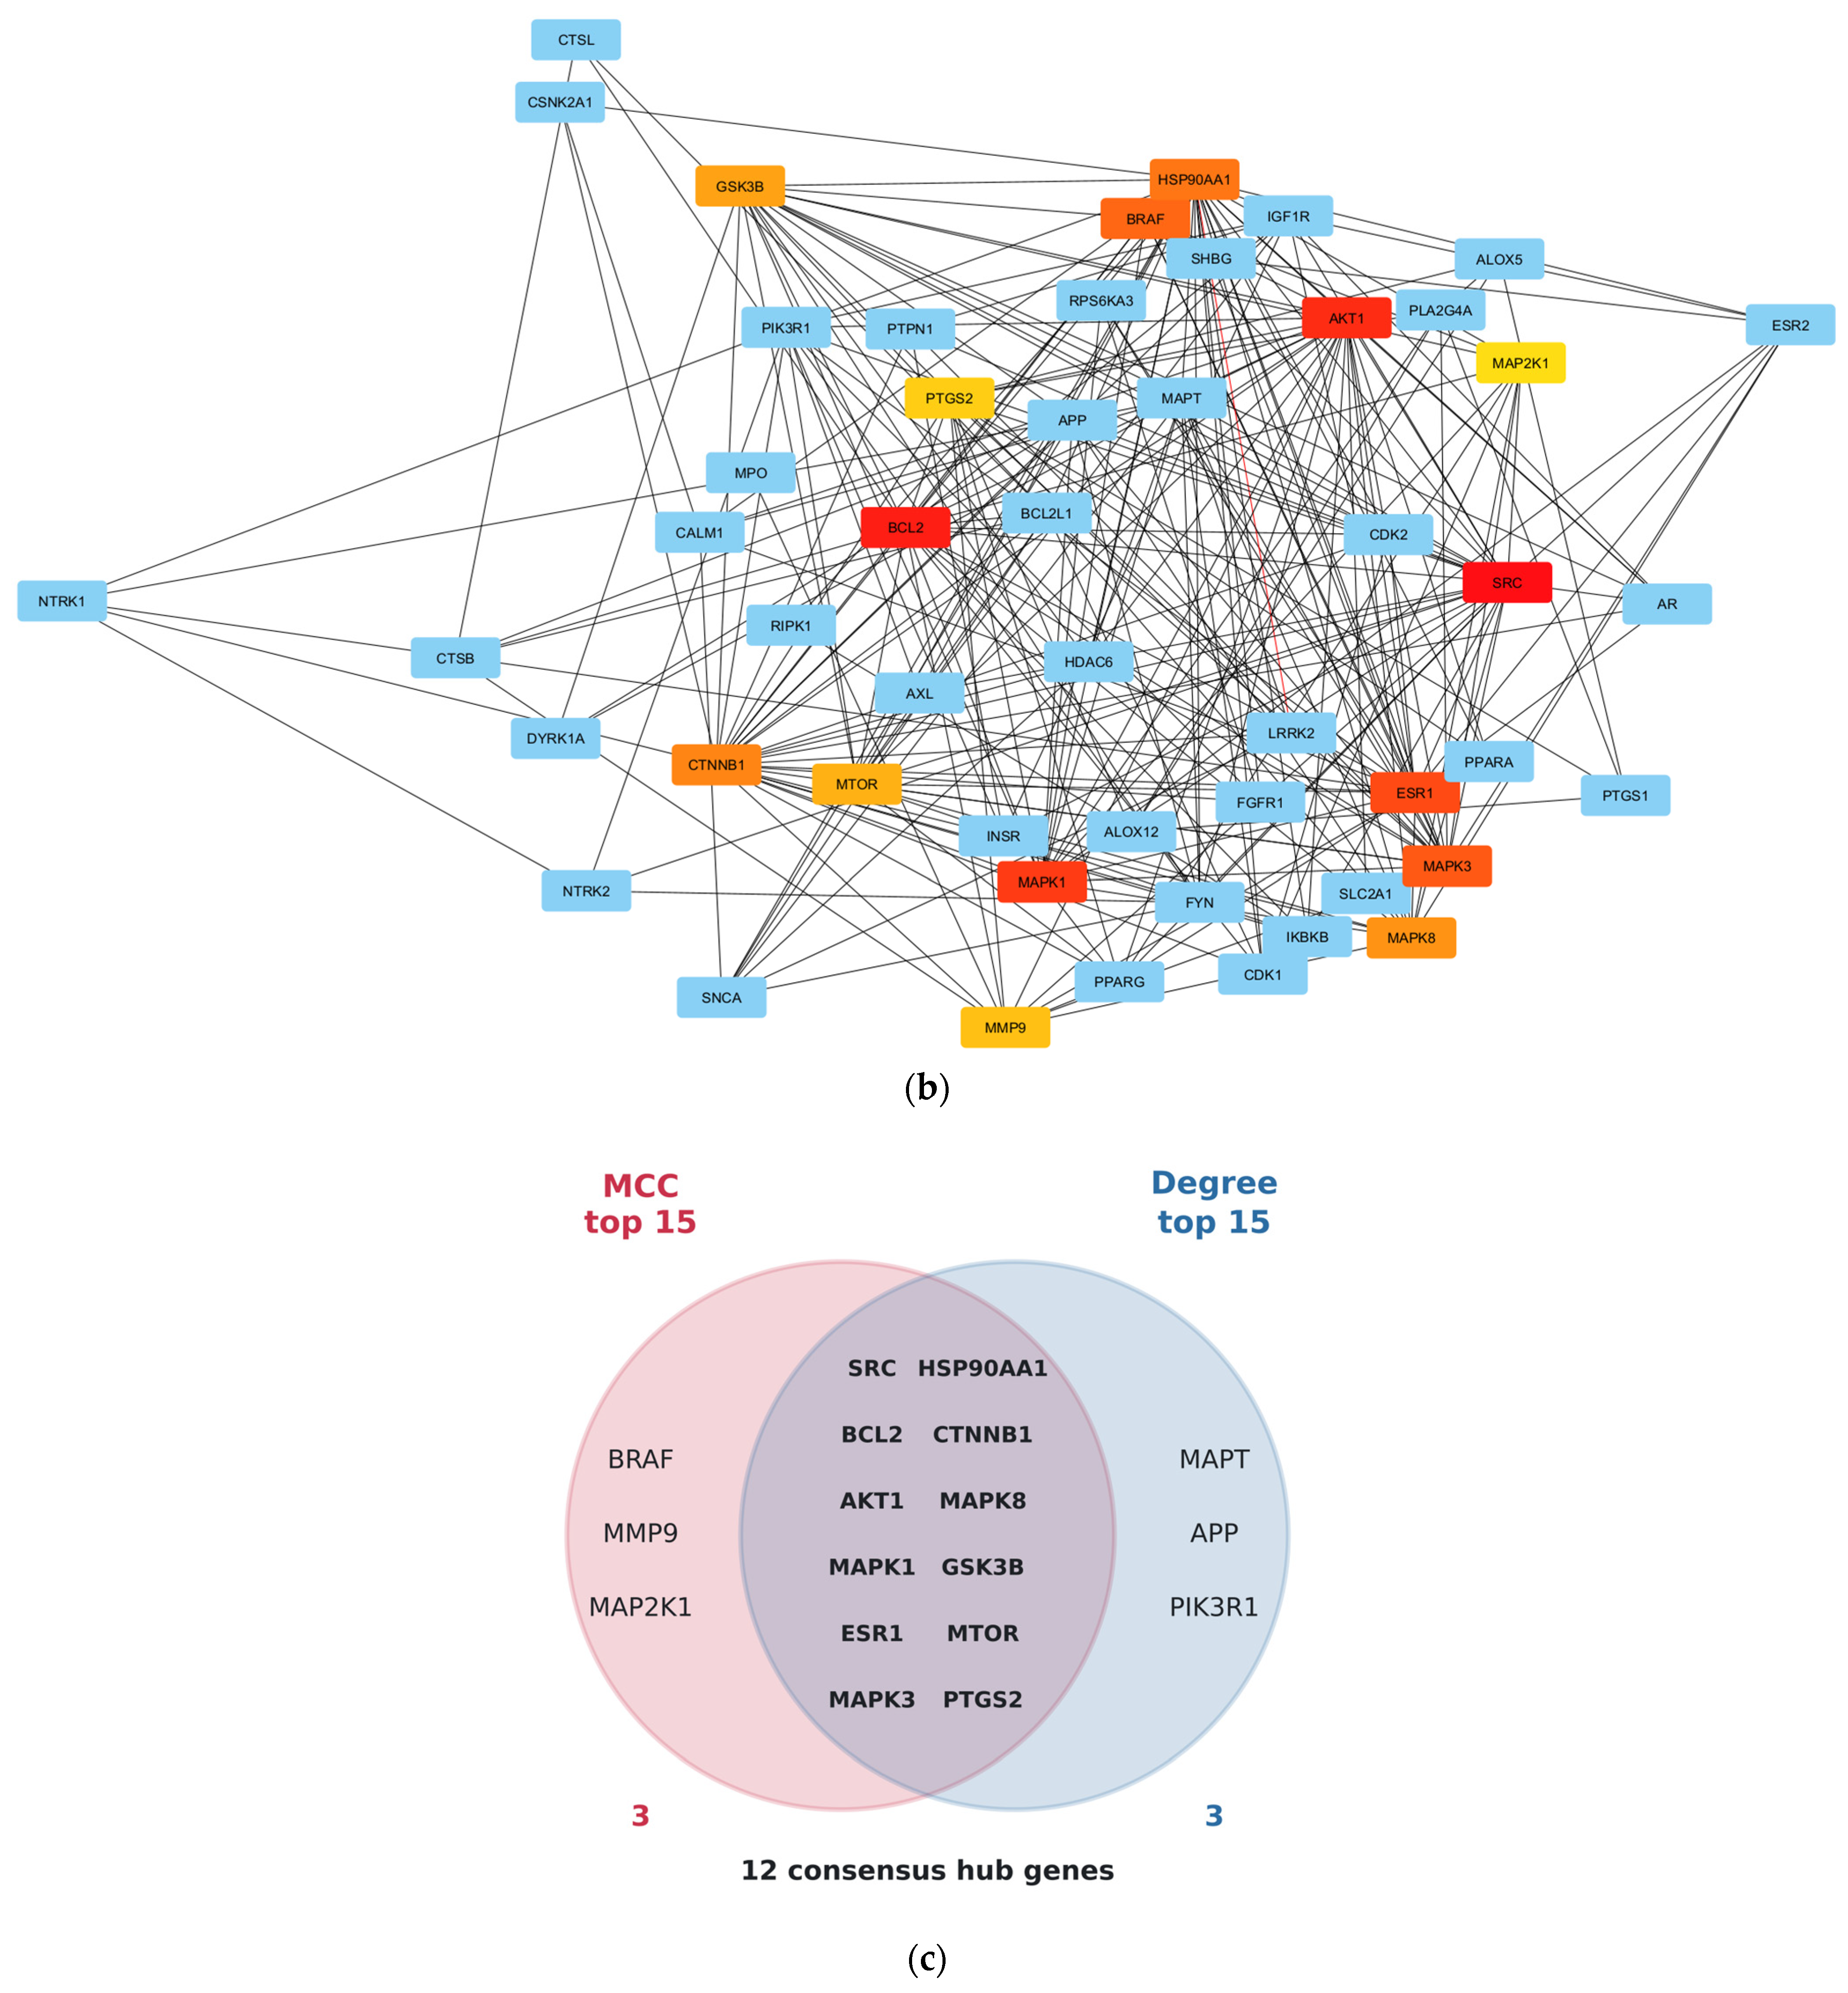
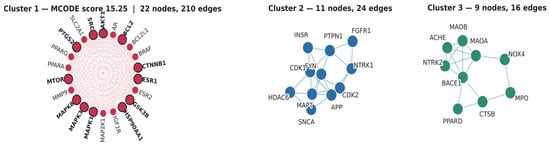
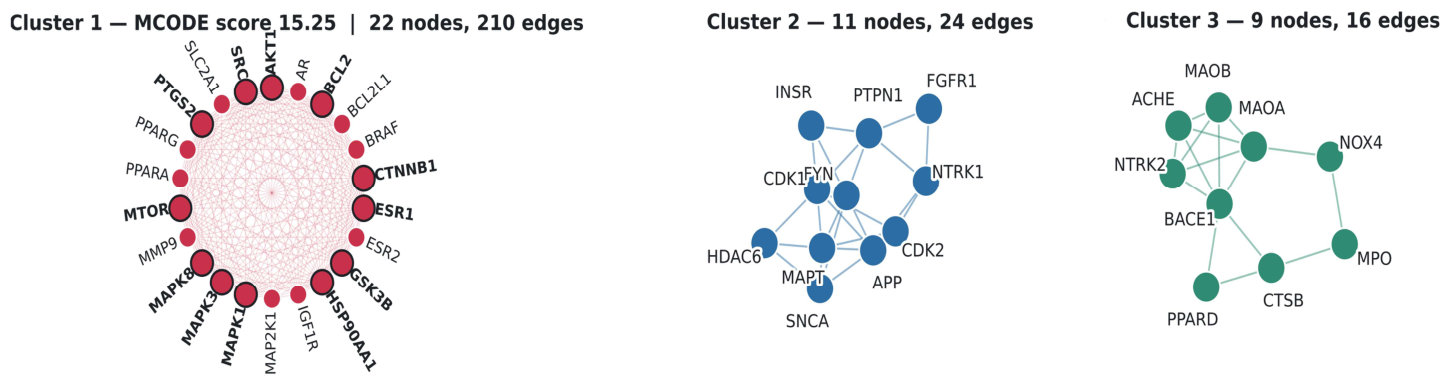
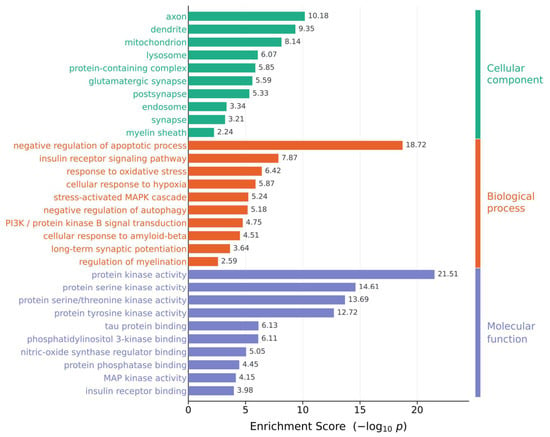
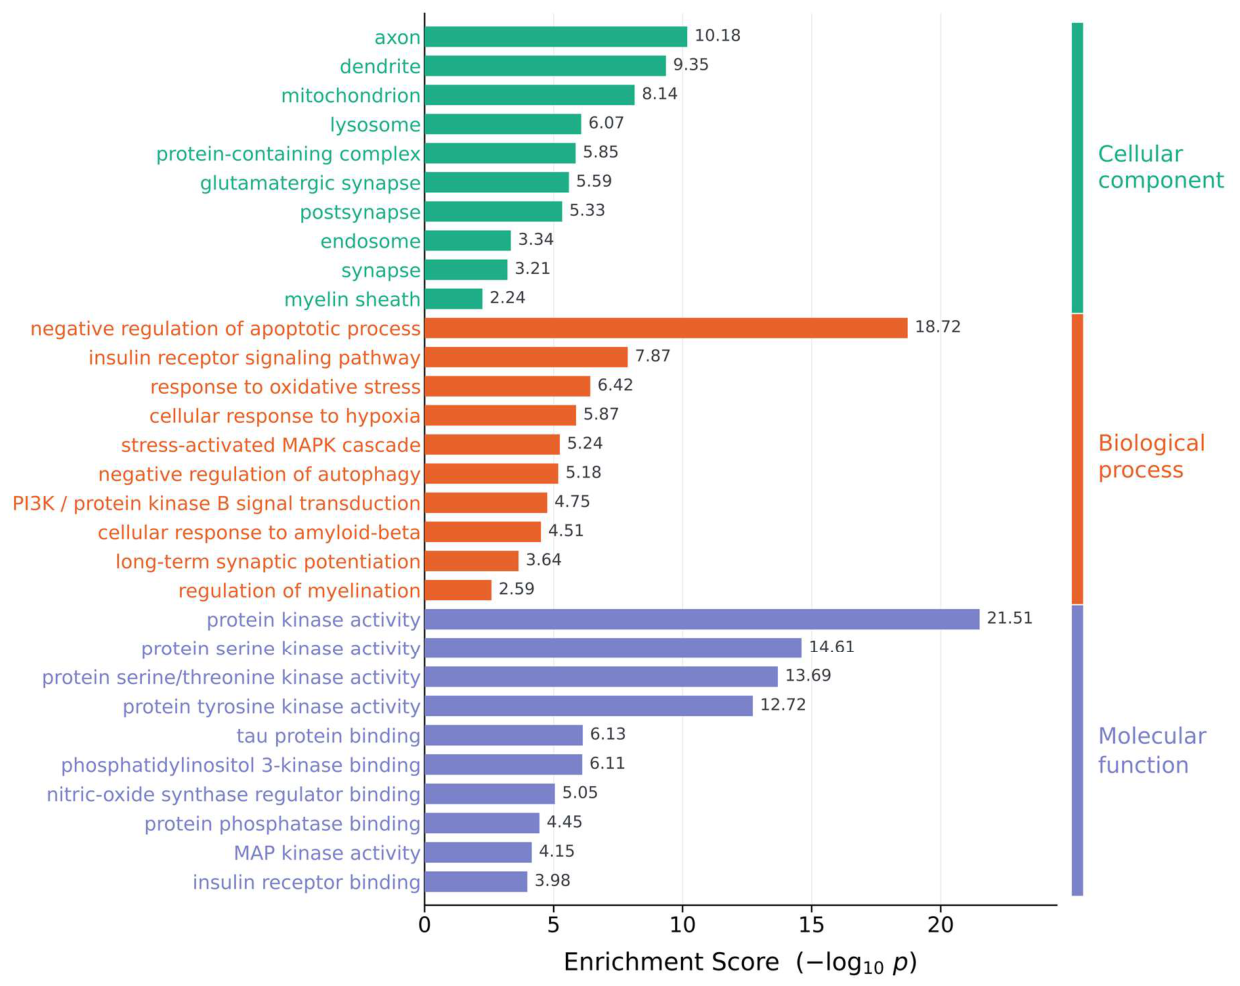
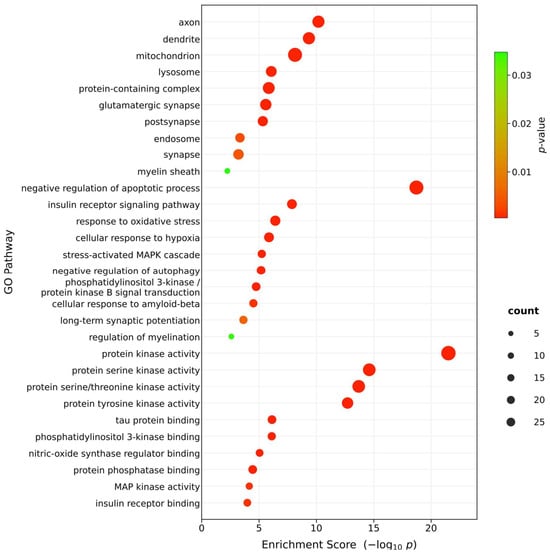
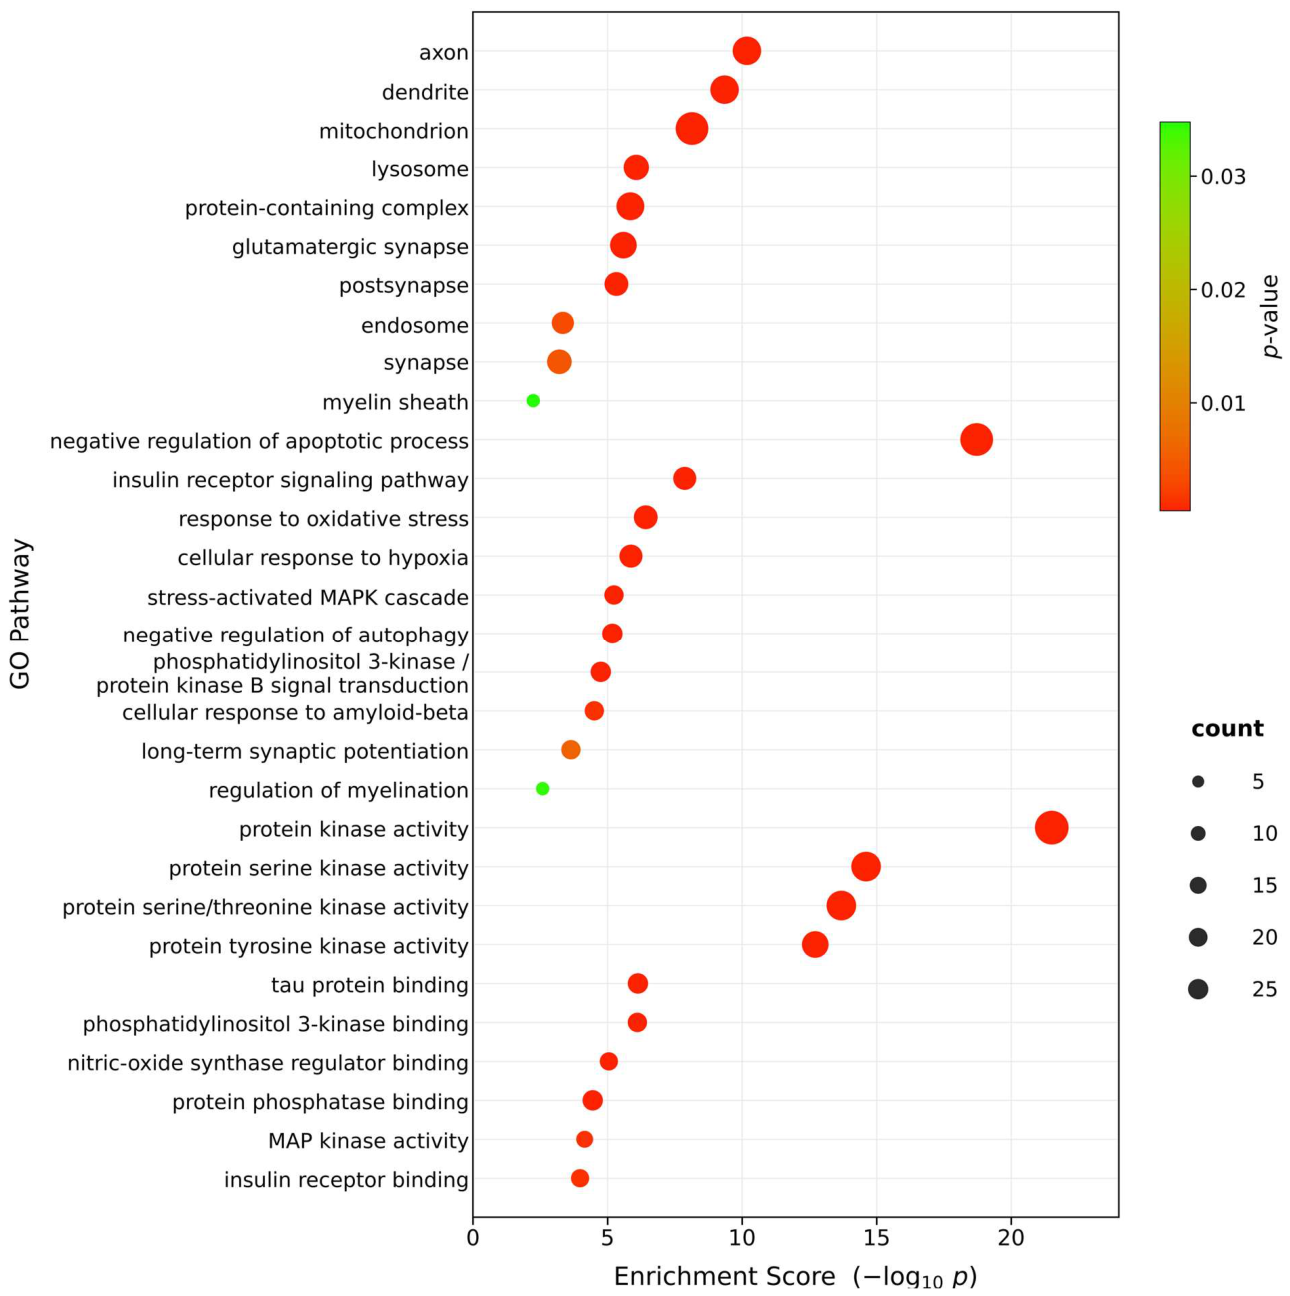
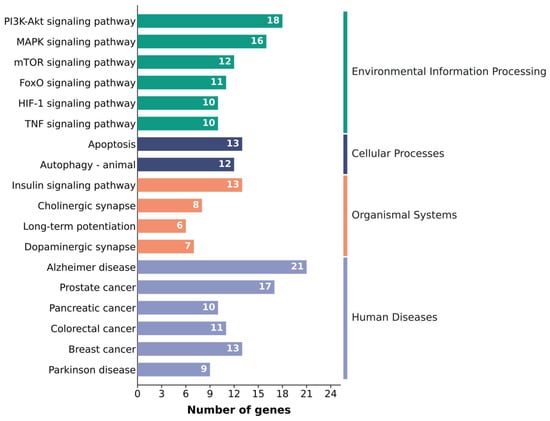
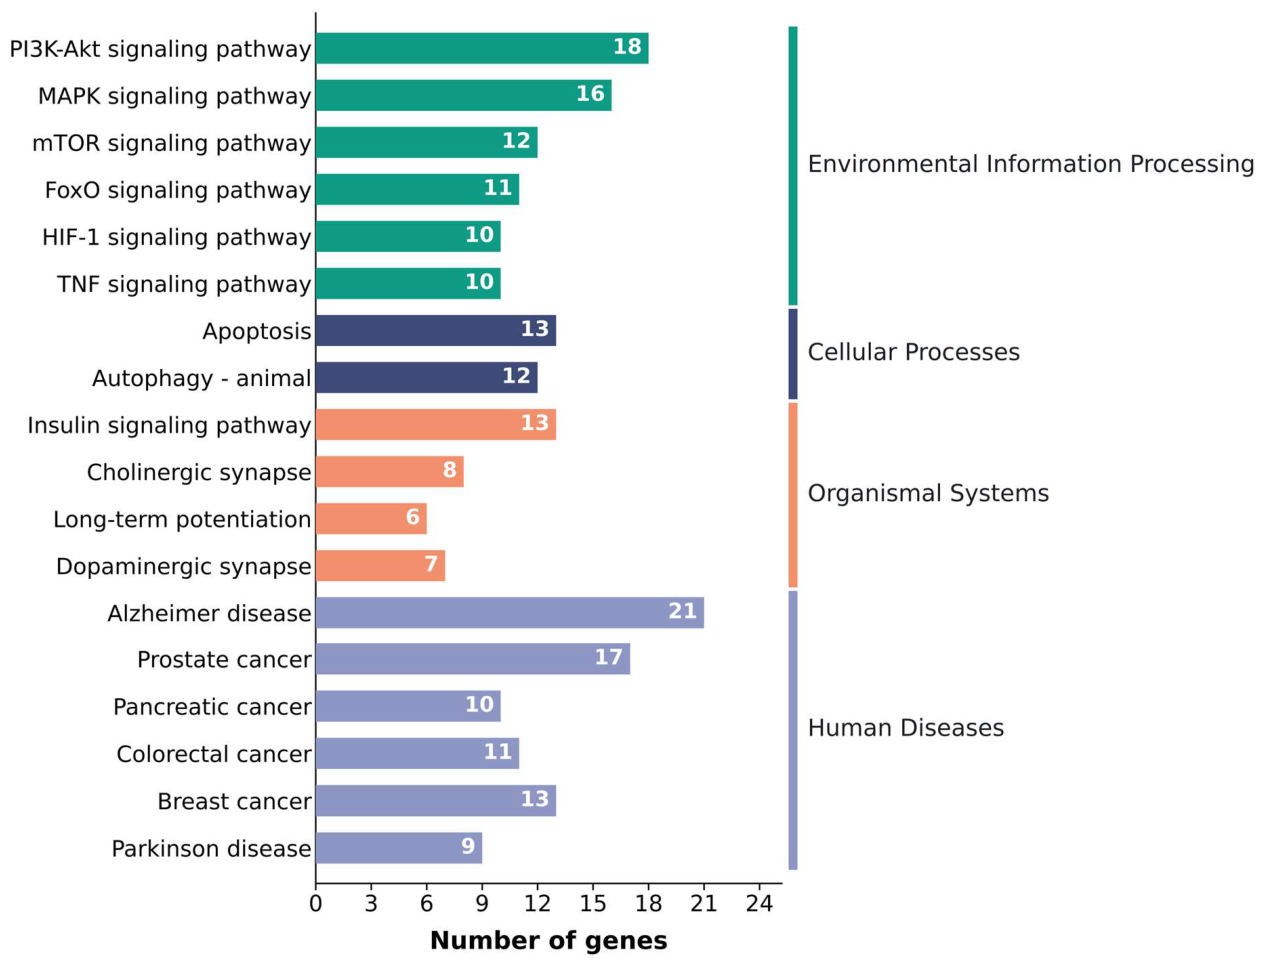
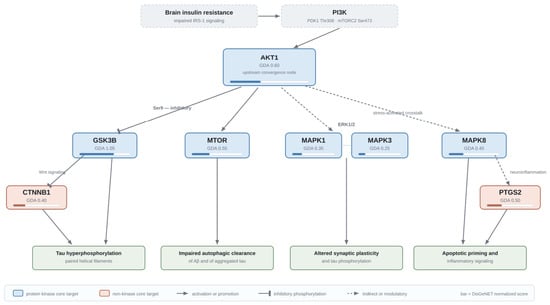
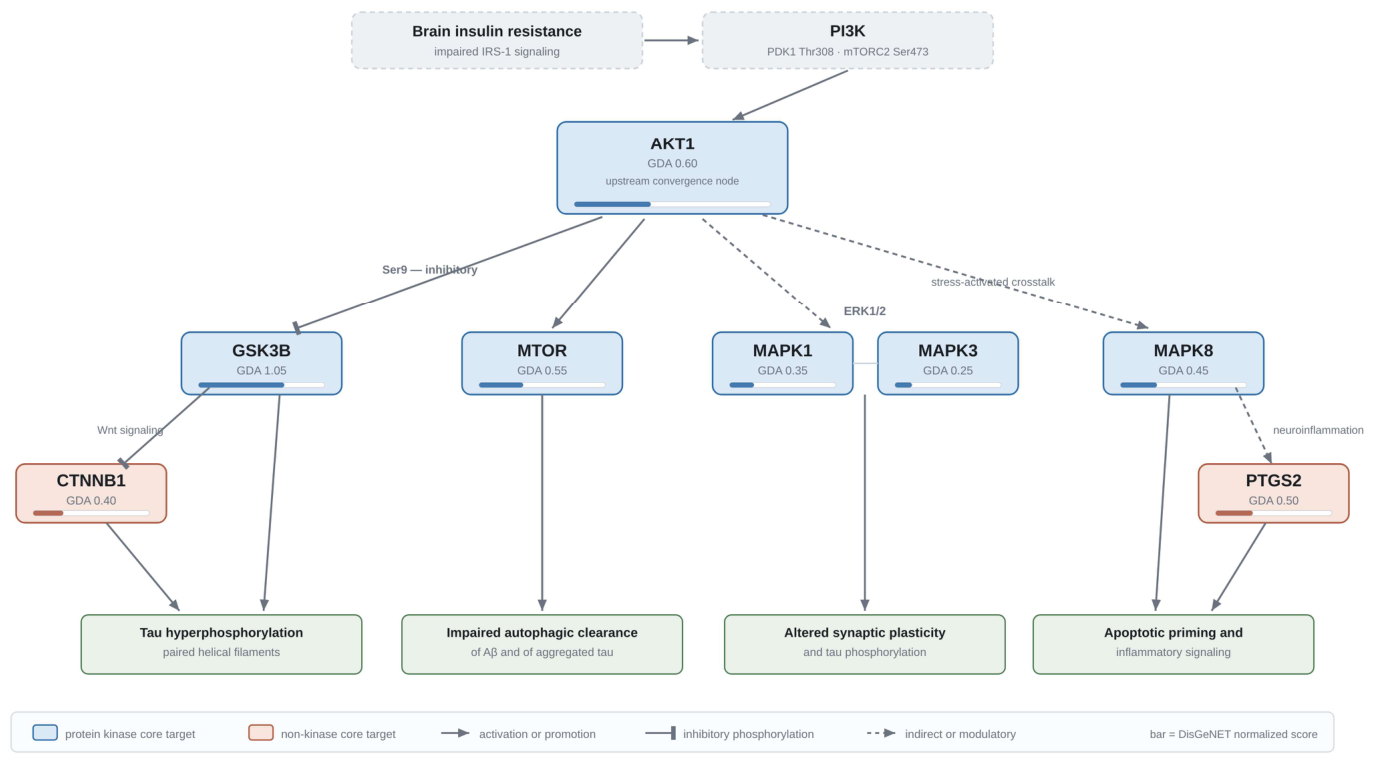
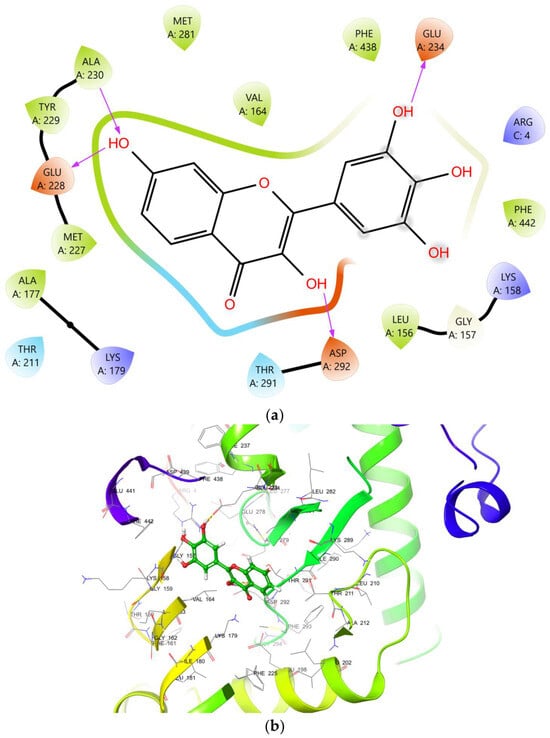
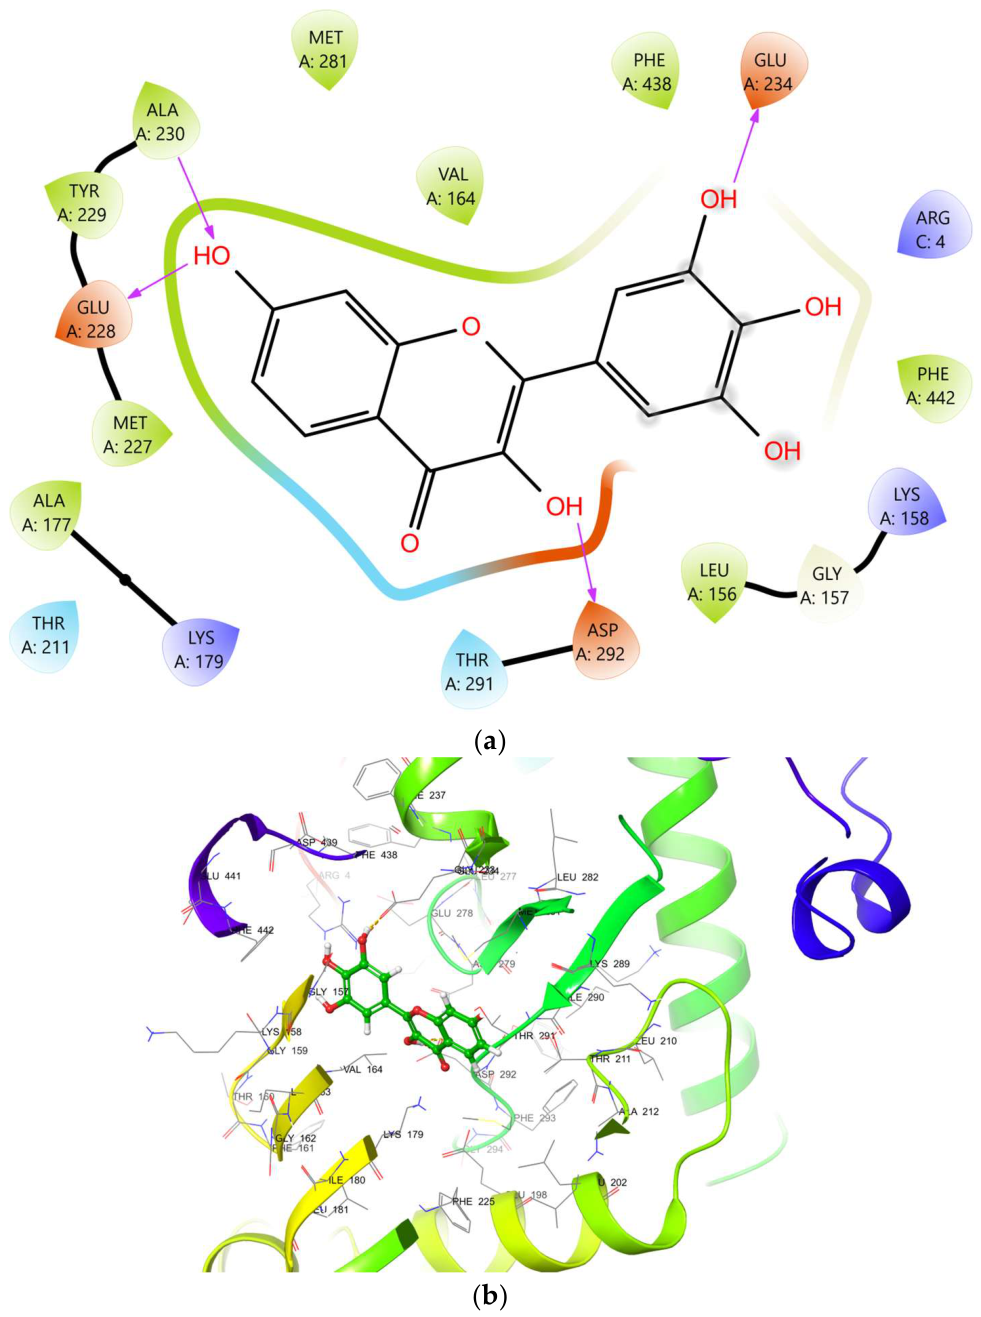
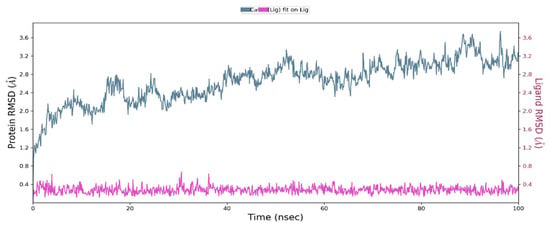
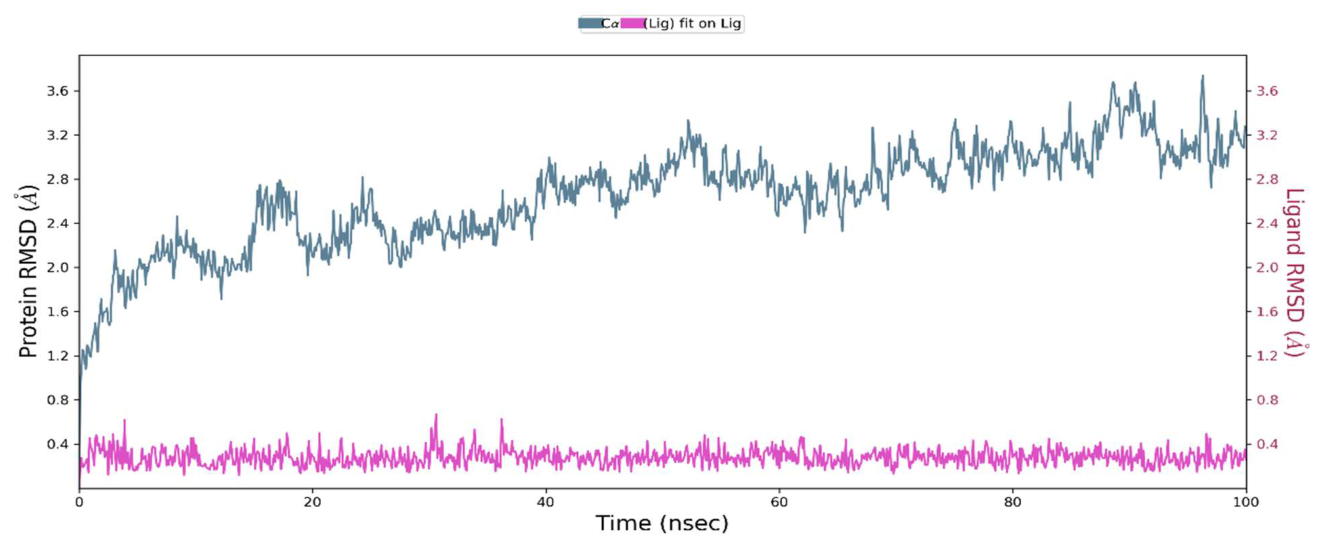
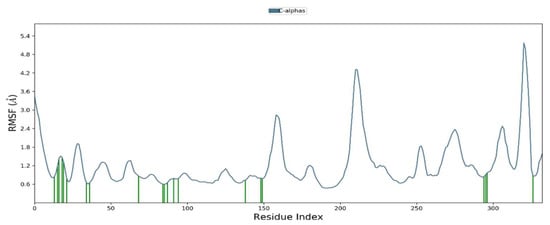
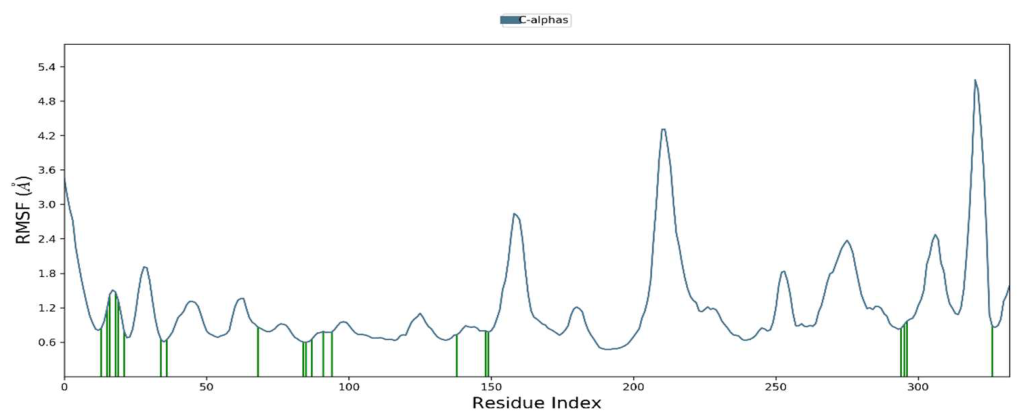
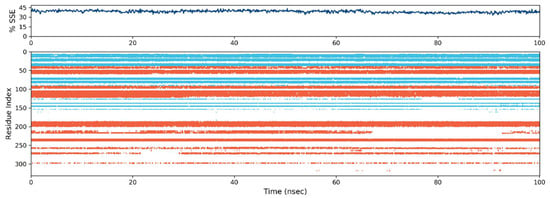
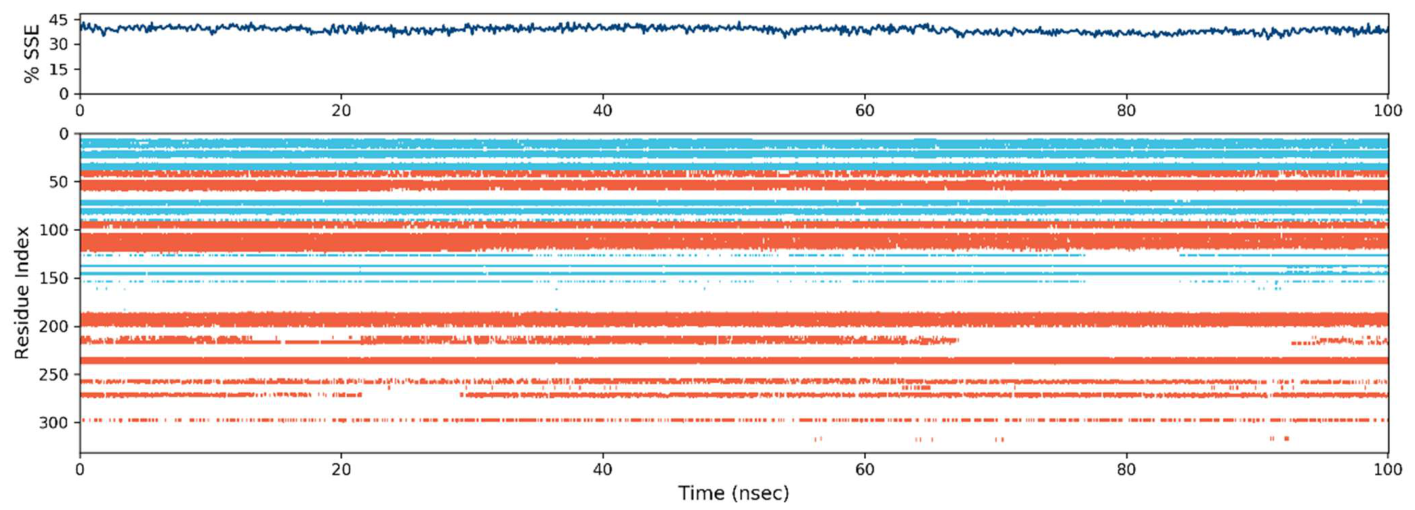
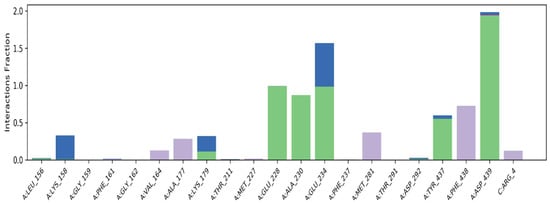
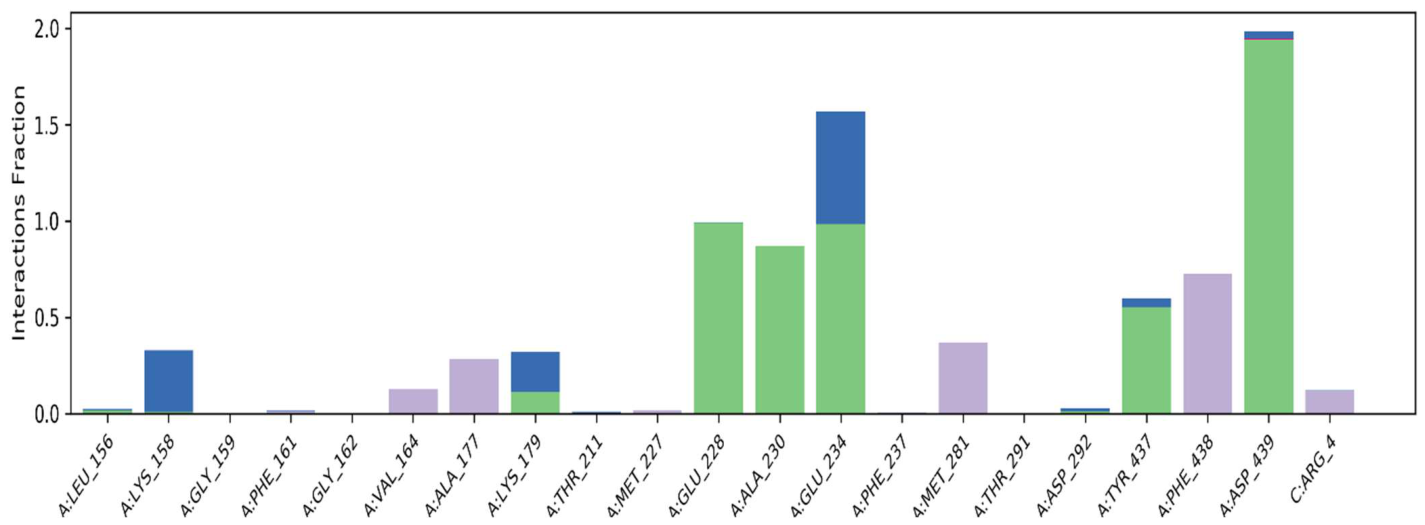
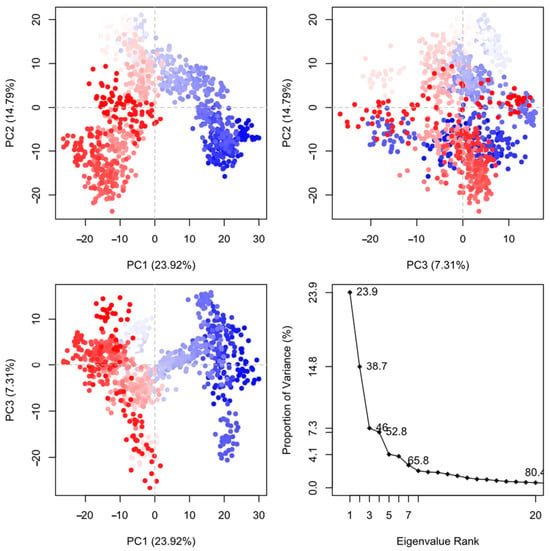
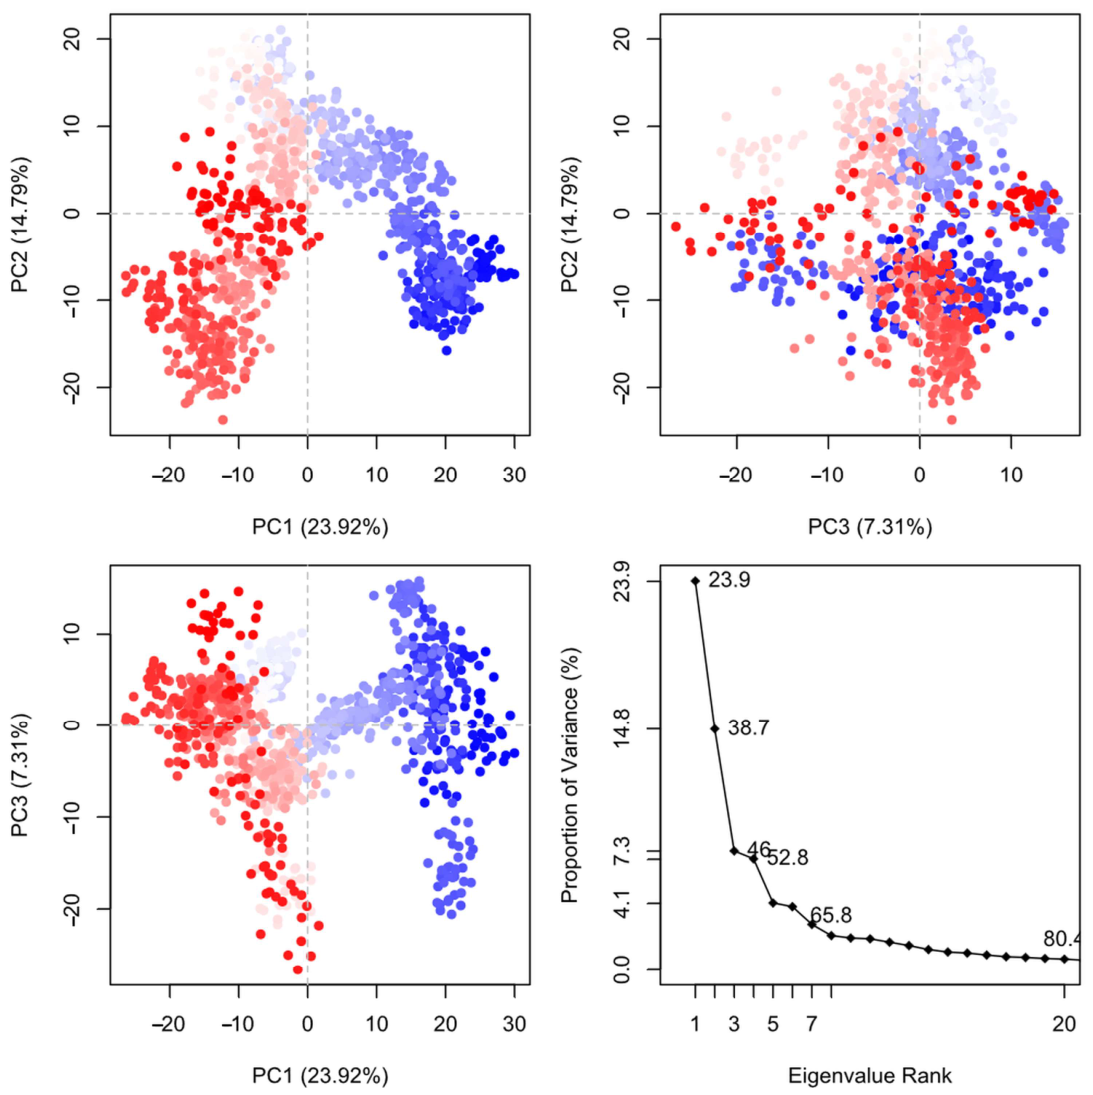
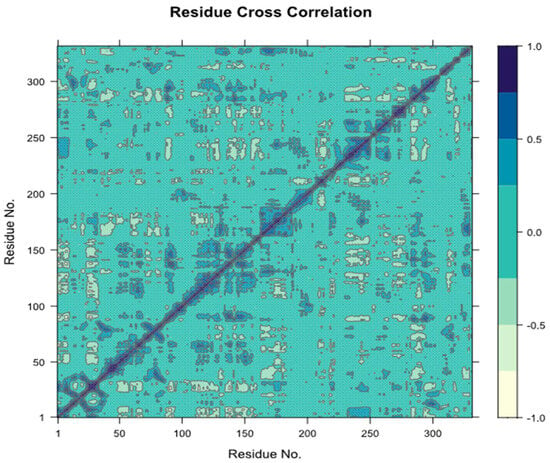
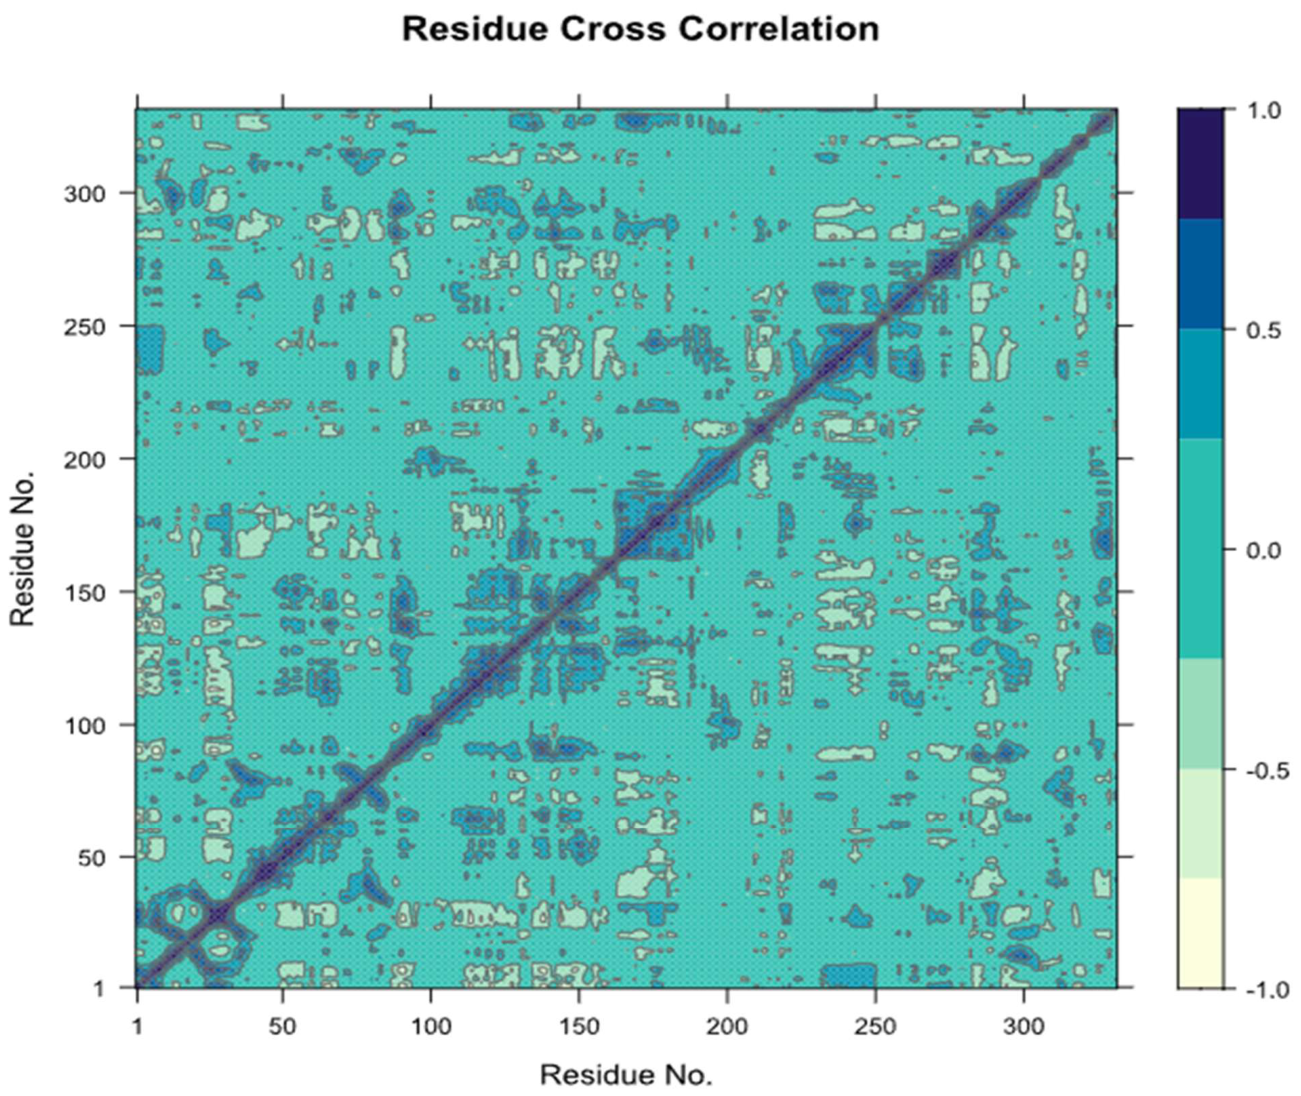
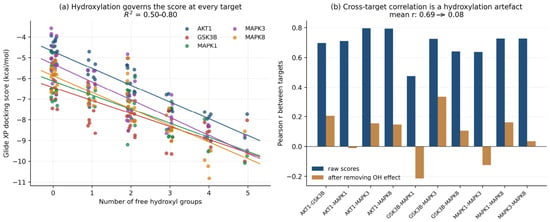
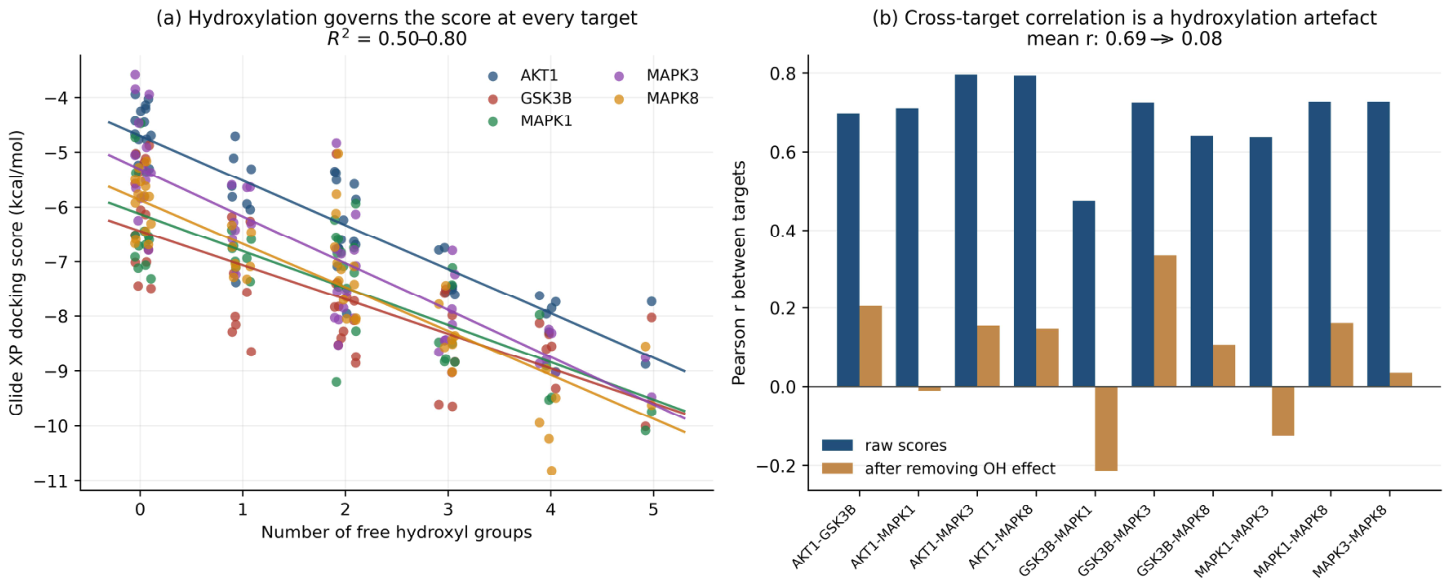
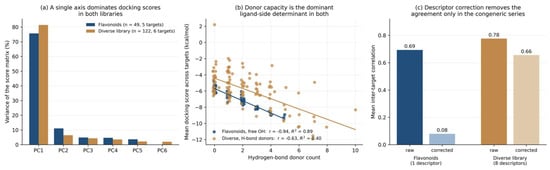
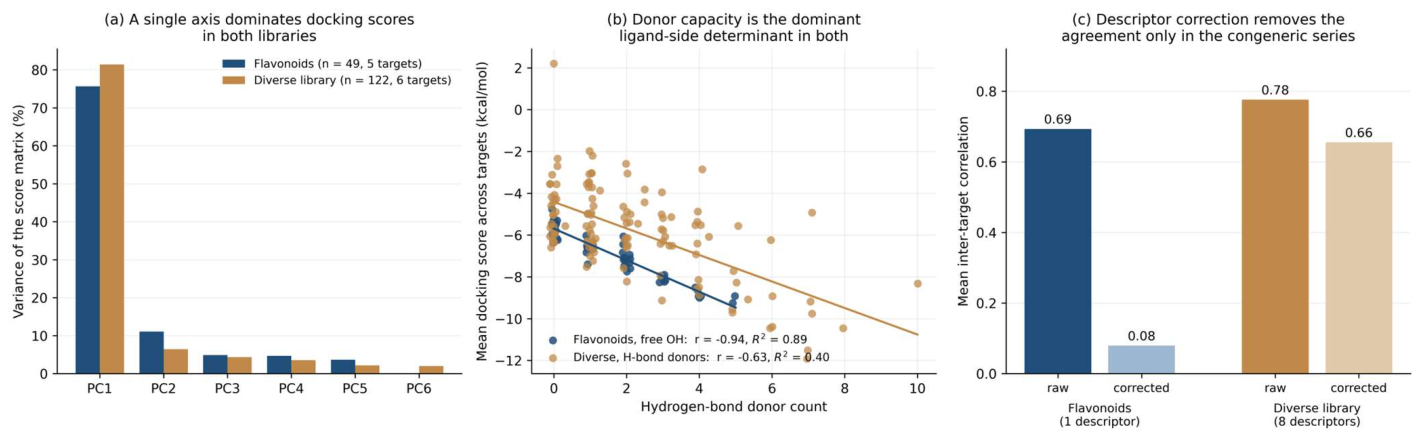

Disclaimer/Publisher’s Note: The statements, opinions and data contained in all publications are solely those of the individual author(s) and contributor(s) and not of MDPI and/or the editor(s). MDPI and/or the editor(s) disclaim responsibility for any injury to people or property resulting from any ideas, methods, instructions or products referred to in the content. |
© 2026 by the authors. Licensee MDPI, Basel, Switzerland. This article is an open access article distributed under the terms and conditions of the Creative Commons Attribution (CC BY) license.