


Abstract
Background: Cardiovascular disease (CVD) remains the leading cause of death and disability worldwide. Among its subtypes, coronary artery disease (CAD) is the most common and often develops silently, without noticeable symptoms. CAD-related murmurs typically fall below the human hearing threshold, limiting the effectiveness of traditional stethoscope-based auscultation. Currently, the gold standard for CAD diagnosis is coronary angiography, an invasive and expensive procedure usually reserved for symptomatic patients. This highlights the global need for a non-invasive, cost-effective pre-screening tool for asymptomatic CAD detection. Objectives: This study investigates the effectiveness of a wearable vest equipped with multiple digital stethoscopes to detect CAD. By applying signal processing and machine learning to multichannel phonocardiogram (PCG) data, we aim to evaluate the accuracy of CAD detection. We further assess the impact of incorporating patient metadata to enhance model performance. Methods: Data were collected from 40 CAD patients and 40 non-CAD individuals using a wearable vest with seven embedded PCG sensors. Subjects performed 10 s breath-hold recordings in a clinical setting. Linear-frequency cepstral coefficients were extracted from the PCG signals and classified using a support vector machine. Metadata, including body mass index, blood pressure, type 2 diabetes, and hypertension, were integrated to assess performance gains. Results: A combination of four channels achieved an accuracy of 80.44%, a 7% improvement over the best single-channel result. Incorporating metadata increased accuracy to 82.08%. Conclusions: The wearable vest demonstrated promising clinical potential, exceeding a 75% sensitivity-specificity average, and may support accessible, automated CAD screening in future validated settings.
1. Introduction
Heart auscultation traditionally involves subjective listening to heart sounds through a stethoscope to detect abnormalities [1]. Coronary artery disease (CAD) arises from the accumulation of plaque in at least one large epicardial coronary artery, resulting in decreased blood flow to the heart muscles [2,3] and the gradual death of myocardial cells [4]. A partially occluded vessel creates turbulence, generating murmurs that are significantly lower in intensity compared to primary heart sounds [5]. Thus, appreciating these murmurs using a stethoscope can be challenging. As a result, CAD is not routinely diagnosed using cardiac auscultation, even with electronic stethoscopes, and definitive diagnosis relies on imaging-based modalities.
The gold standard diagnostic tool for CAD is angiography, where blockages can be visualised [6,7]. This procedure involves catheter-based injection of contrast dye into the coronary arteries under X-ray imaging. While angiography provides a definitive diagnosis, it is invasive and carries procedural risks, including bleeding, vascular injury, contrast-induced nephropathy, and infection [8]. It is generally reserved for symptomatic patients, even though CAD can manifest in asymptomatic individuals, where myocardial infarction or stroke may be the first sign of the disease [9]. Additionally, its high cost makes it infeasible for marginalised populations in developing countries [10]. Thus, there is a global need for an effective, non-invasive, and affordable pre-screening tool for CAD.
Well-established clinical risk factors, including body mass index (BMI), blood pressure, hypertension, and type 2 diabetes, substantially contribute to CAD incidence. Elevated BMI reflects increased adiposity, which has a robust correlation with cardiovascular disease [11]. Hypertension, associated with high blood pressure, accelerates atherosclerosis and remains one of the strongest modifiable predictors of CAD, as shown in the Framingham and INTERHEART studies [12,13,14]. Type 2 diabetes further amplifies CAD risk through vascular damage and is frequently accompanied by coexisting hypertension or dyslipidemia [15,16]. These metadata variables were used in this study and are routinely available in clinical practice.
In this study, we investigate whether multichannel phonocardiogram (PCG) signals, recorded simultaneously from a wearable vest, can be used to detect CAD, and whether incorporating routinely collected metadata improves diagnostic performance. Building on our previous report of PCG-only classification using the same dataset [17], we now re-analyse the dataset by developing a metadata-only model and implementing score-level fusion with the PCG classifier. This allows us to quantify the incremental value of metadata, including BMI, blood pressure, hypertension, and type 2 diabetes, and to discuss clinical implications.
2. Materials and Methods
2.1. Study Design
This was a single-centre, prospective diagnostic-accuracy pilot study conducted at Fortis Hospital, Kolkata, India (May–June 2023). Eighty adult male subjects were enrolled: 40 with angiographically confirmed CAD and 40 without CAD. CAD was defined as ≥50% luminal stenosis in a major epicardial vessel (right coronary artery, left anterior descending artery, or left circumflex artery) or in the left main coronary artery, in line with standard guidelines [7]. Coronary angiography served as the reference standard, ensuring that the diagnostic labels used for model training and evaluation reflected the presence or absence of significant coronary stenosis. Inclusion criteria were the ability to undergo a 10 s breath-hold recording and having scheduled or recent coronary angiography. Exclusion criteria included prior coronary revascularisation (Percutaneous Coronary Intervention or Coronary Artery Bypass Grafting) and clinically diagnosed valvular disorders. This was an exploratory pilot, and no formal a priori sample size calculation was performed; a convenience sample of 80 subjects was used to demonstrate feasibility and to generate hypotheses rather than to provide confirmatory evidence. Accordingly, the results should be interpreted as preliminary and intended to inform the design of future studies.
2.2. Data Collection
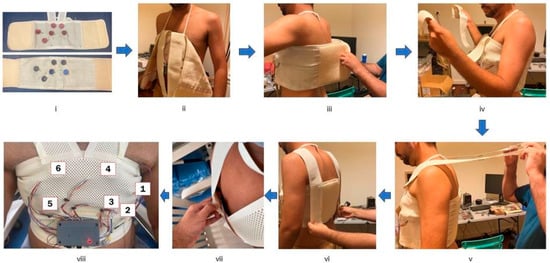
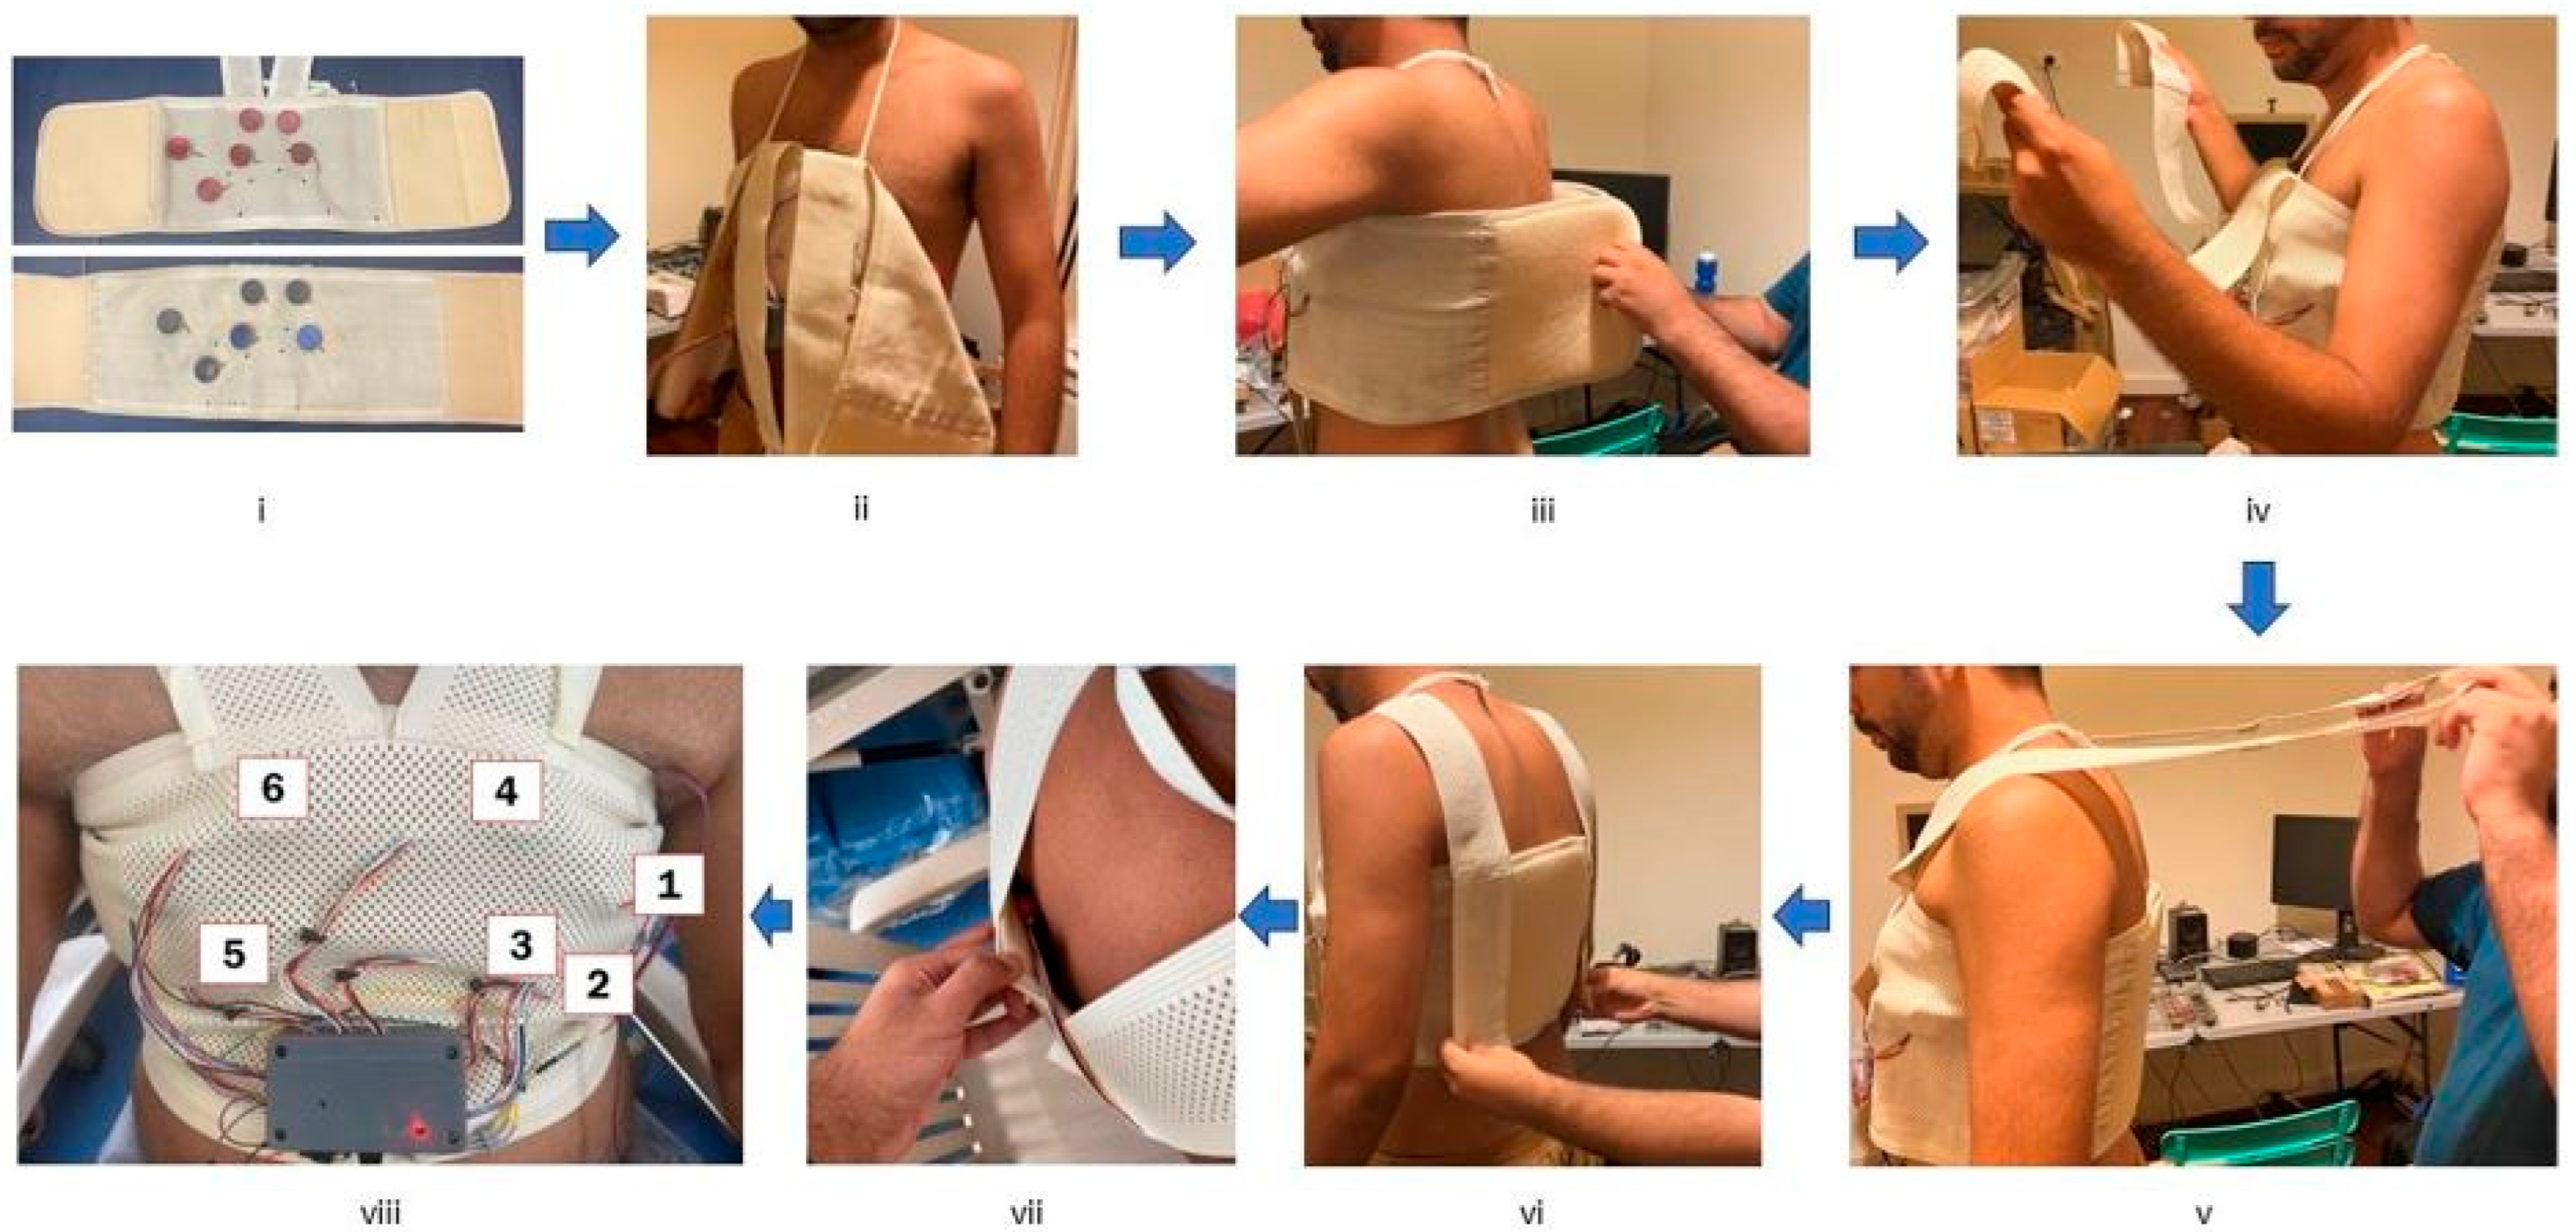
Between May and June 2023, 40 CAD and 40 non-CAD subjects participated in this study at Fortis Hospital, Kolkata. Each subject was fitted with a wearable vest equipped with up to seven integrated electronic stethoscopes, as shown in Figure 1. These stethoscopes were designed and manufactured by a private company. Six PCG signals were captured from the chest, and one from a posterior location. Each stethoscope (Ticking Hearty Pty Ltd., Perth, Australia) contains a microphone under a plastic diaphragm that captures heart sounds as they permeate through the chest wall. Since the stethoscopes are attached to the vest, their positioning may vary slightly based on the subject’s body shape. This design prioritises ease and convenience during data collection.
Figure 1.
Steps undertaken to fit the vest onto a subject: (i) Select appropriate vest size, (ii) Place neck strap to ensure vest is in line with sternum, (iii) Wrap vest around subject and firmly close with Velcro, (iv) gather the shoulder straps, (v) pull the straps directly over the shoulders, (vi) Tighten shoulder straps and connect to the rear via Velcro, (vii) Place back stethoscope in position, (viii) Subject is ready for signal acquisition.
The signals captured by the stethoscopes are routed to a central data collection board for synchronous sampling via custom-made cables. The sampling frequency is initially 7.812 kHz, which is later down sampled to 2 kHz post-data collection. The multi-channel stethoscope data is saved as a wav file, and the entire system is powered by a USB connection.
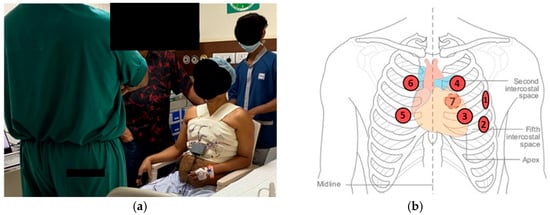
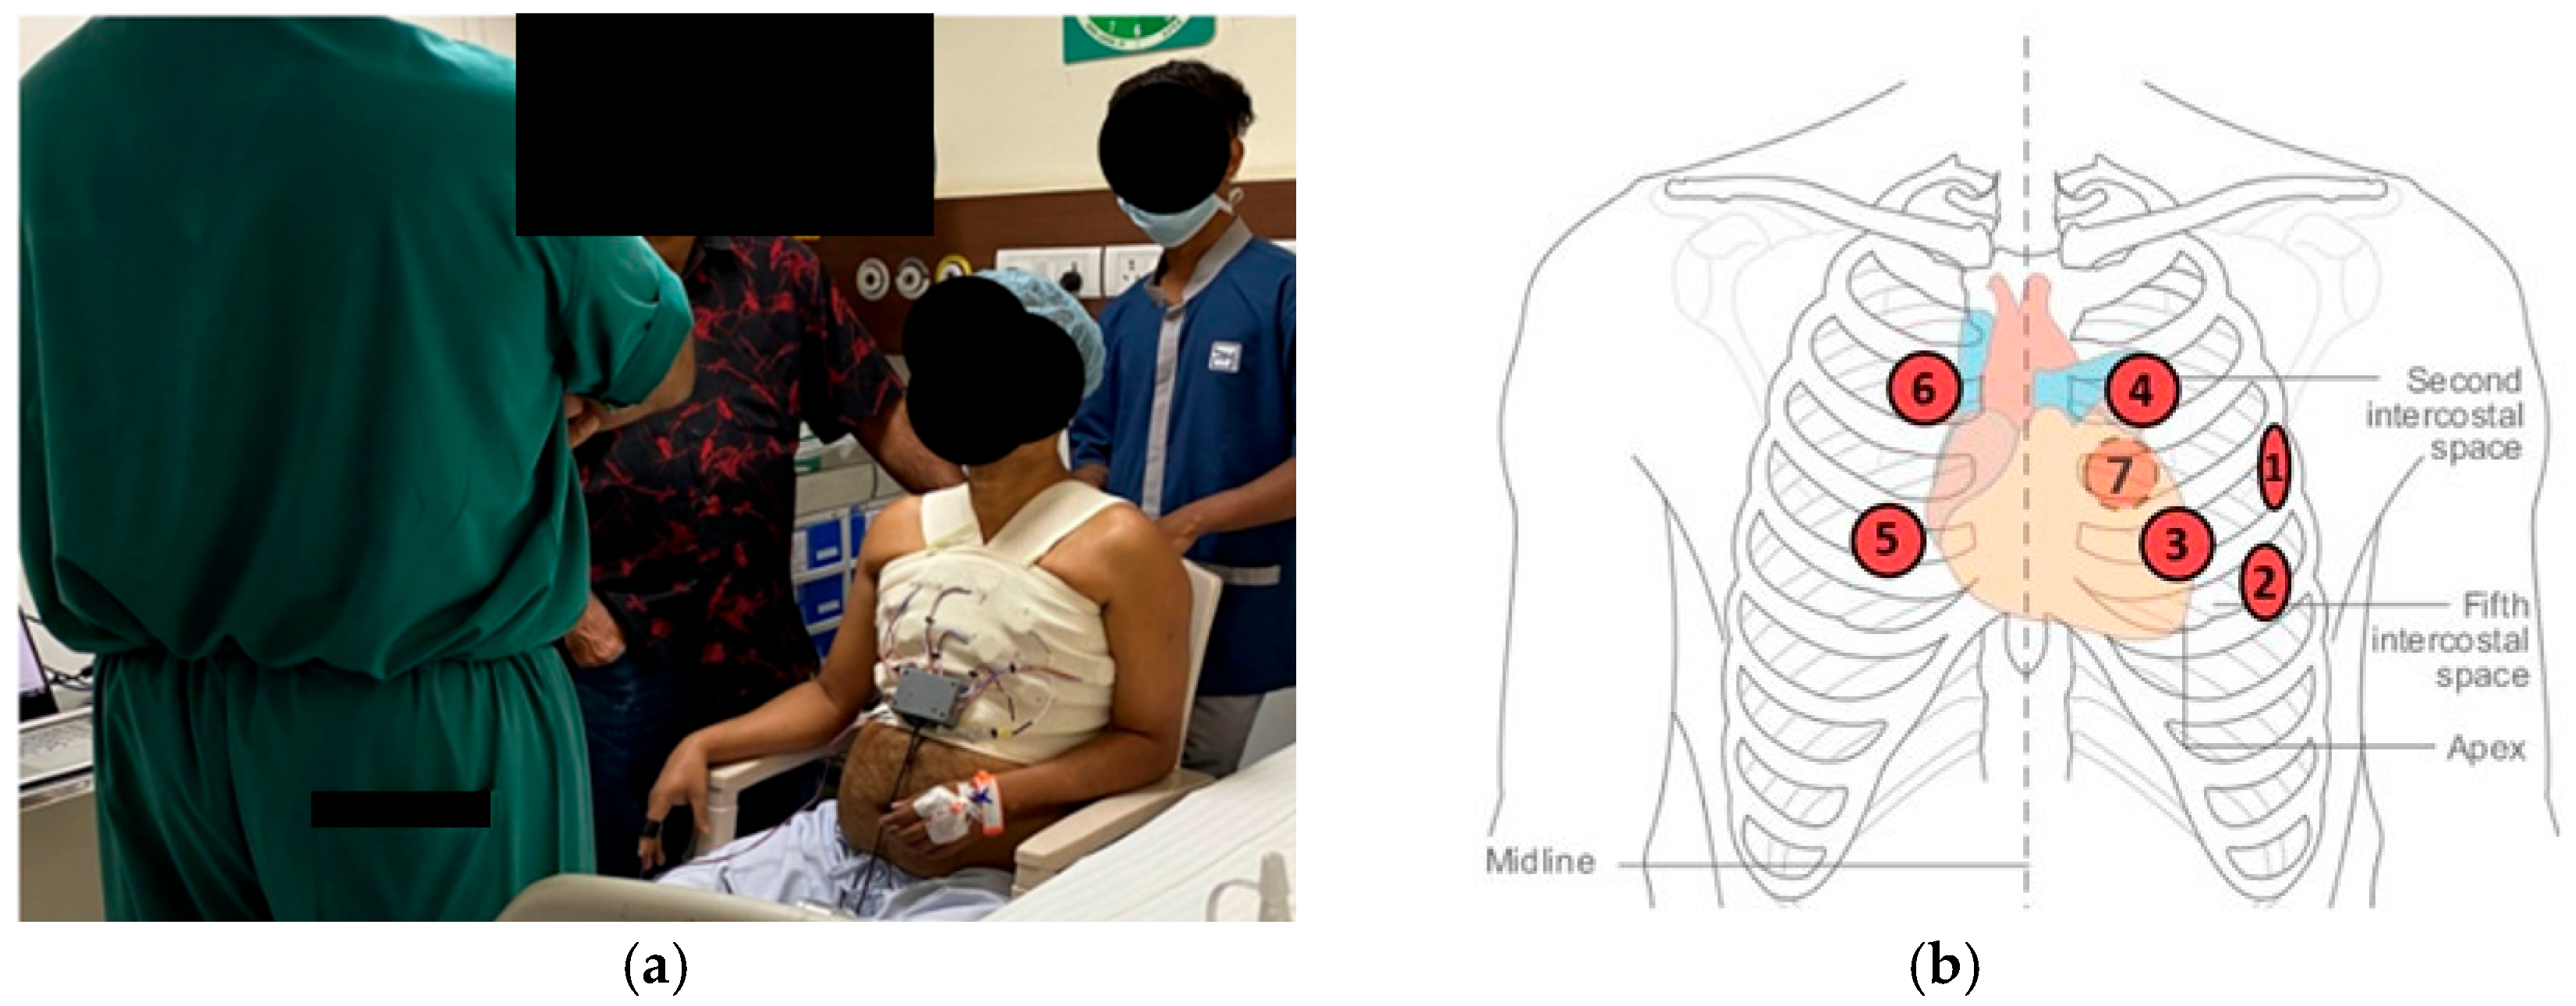
The process of fitting the vest, acquiring signals, and removing the vest took less than two minutes, underscoring the system’s practicality and ease of use. Figure 2 shows a subject seated during data collection alongside a diagram indicating the approximate stethoscope placement. Breath-held measurements were taken for 10 s in the angiography ward of Fortis Hospital, introducing real clinical noise into the system. This included ambient sounds such as conversations, privacy curtains moving, doors opening and closing, electric shavers, ringing phones, and water flowing into a metal basin. Subjects were seated during signal acquisition, eliminating the need for a hospital bed. This data collection environment is unique compared to most PCG-based CAD detection studies, which often rely on quiet, controlled settings with precisely located sensors and highly prepared subjects (e.g., waiting in a temperature-controlled room for 15 min). Such conditions may contribute to high classification performance that is unlikely to generalise to practical clinical settings [18,19,20].
Figure 2.
(a) Signal Acquisition (b) Approximate PCG sensor positioning (7 is at back). Adapted from [21].
Informed consent was obtained from all subjects, and the data collection process adhered to the ethical guidelines for research on human subjects in accordance with the Helsinki Declaration.
2.3. Patients
Angiography results served as the reference standard for group assignment, as defined in Section 2.1. To broaden the non-CAD cohort, eight healthy male nurse staff aged 21–29 years were also included as controls, since the likelihood of CAD in this demographic is extremely low [22]. These volunteers were grouped with the non-CAD patients to balance sample sizes between groups. Table 1 summarises the demographic and clinical characteristics of the study population. All participants in this study were male, which limits the generalisability of the findings to female populations and should be considered a major limitation of the present work.
Table 1.
Demographic and clinical characteristics of the study population. Continuous variables presented as mean (std).
2.4. Handcrafted Feature Extraction and Machine Learning Model
Each 10 s multichannel signal was divided into three epochs, each containing two full heart cycles. Each epoch commenced at the start of S1 of the first cycle and concluded at the end of diastole of the second cycle. Linear Frequency Cepstral Coefficients (LFCC) were extracted from each epoch. LFCCs are like Mel Frequency Cepstral Coefficients (MFCC), which are widely used in various fields, with the key difference being that LFCCs use a linear filter bank instead of the Mel filter bank used in MFCCs. For a more detailed mathematical explanation of MFCC and LFCC formulation, the reader is referred to [23]. In this study, a filter bank of 12 linearly spaced filters up to 1 kHz was utilised, allowing 12 LFCCs to be extracted.
Initially, each epoch was divided into small frames, and LFCCs were extracted from each frame using MATLAB R2024b. Various numbers of frames (20–64 and 100–112 in steps of 2) and Different LFCC subsets ([0–1], [0–2], …, [0–11], [1–2], [1–3], …, [10–11]) were tested to determine the optimal configuration for each channel. The LFCCs from each frame of the epoch were merged into a single feature vector and fed into a Support Vector Machine (SVM) with a radial basis function kernel for classification. When combining channels, the LFCC features from each channel were concatenated; a process called feature-level fusion. The LFCC features were ranked utilising the ReliefF algorithm; a feature selection method that ranks the features by assessing their ability to distinguish between instances of differing classes [24]. An incremental search approach was utilised to realise the best subset of highest-ranked features. Model evaluation methodology is described in Section 2.6.
An SVM classifier was selected in combination with handcrafted LFCC features to balance classification performance, robustness, and interpretability. Although simpler linear models such as logistic regression can offer coefficient-level interpretability, this advantage is limited in the present setting due to the high dimensionality and non-linear separability of LFCC-based representations. In such cases, individual linear coefficients are difficult to interpret meaningfully and may be unstable across cross-validation folds. The use of handcrafted spectral features provides a transparent and physically grounded signal representation, while the SVM enables non-linear decision boundaries that are better suited to this feature space and small sample size.
2.5. Metadata
The metadata variables included in this study were BMI, systolic and diastolic blood pressure (and their ratio), hypertension, and type 2 diabetes. These were extracted from patient records and analysed separately using an SVM. For the control volunteers, metadata values were measured and recorded at the time of data collection. Metadata statistics are displayed in Table 1. Continuous variables included BMI, systolic blood pressure, diastolic blood pressure, and the systolic/diastolic ratio; binary variables included hypertension and type 2 diabetes. All continuous variables were z-normalised prior to analysis. Score-level fusion was then implemented between the predictions of the metadata model and the LFCC PCG model to assess their combined effect on classification performance.
2.6. Statistical Analysis
All analysis was performed at the subject level. To evaluate model performance, we implemented 5-fold cross-validation repeated over 20 iterations. Repeated cross-validation was chosen to maximise use of the available dataset and reduce variance in performance estimates, which is appropriate for a study with a modest sample size. At each iteration, subjects were randomly partitioned into mutually exclusive training and testing folds to prevent data leakage. Feature selection and model optimisation were carried out using only the training folds. Predictions were aggregated at the epoch level and combined by majority voting to generate subject-level outcomes. For example, if a subject had two or more epochs predicting CAD, that subject was classified as having CAD. Diagnostic performance was reported using accuracy, sensitivity, and specificity. Outputs from the metadata-based classifier and the PCG-based classifier were combined using score-level fusion (simple averaging of posterior probabilities). Paired Wilcoxon signed-rank tests were used to statistically compare subject-level performance metrics across the 20 repeated cross-validation iterations between the PCG-only and PCG + metadata models.
The use of high-dimensional feature representations relative to sample size is a recognised consideration in machine-learning–based biomedical studies. In the present work, this was explicitly addressed through subject-level cross-validation, repeated random splits, and strict isolation of feature selection and model training within the training folds. As no independent external validation cohort was available, all performance estimates are based on internal cross-validation. To assess potential age-related confounding, an additional sensitivity analysis was performed in which age was evaluated under the same repeated subject-level cross-validation protocol.
3. Results
3.1. Synchronised Data
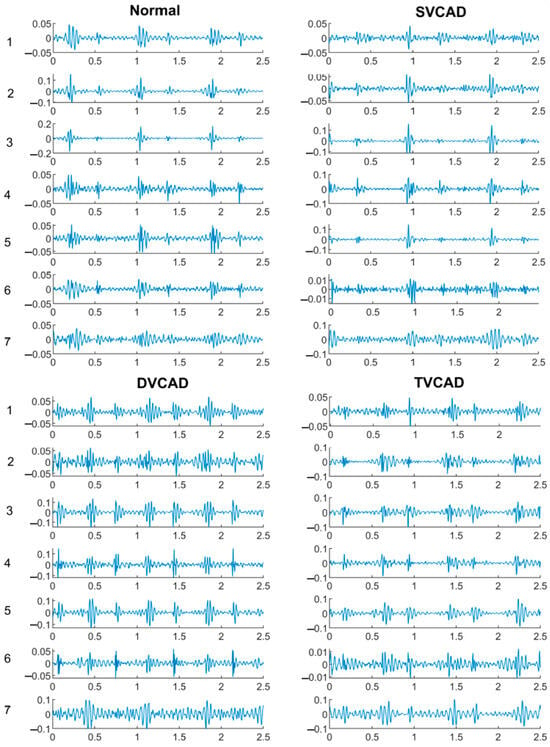
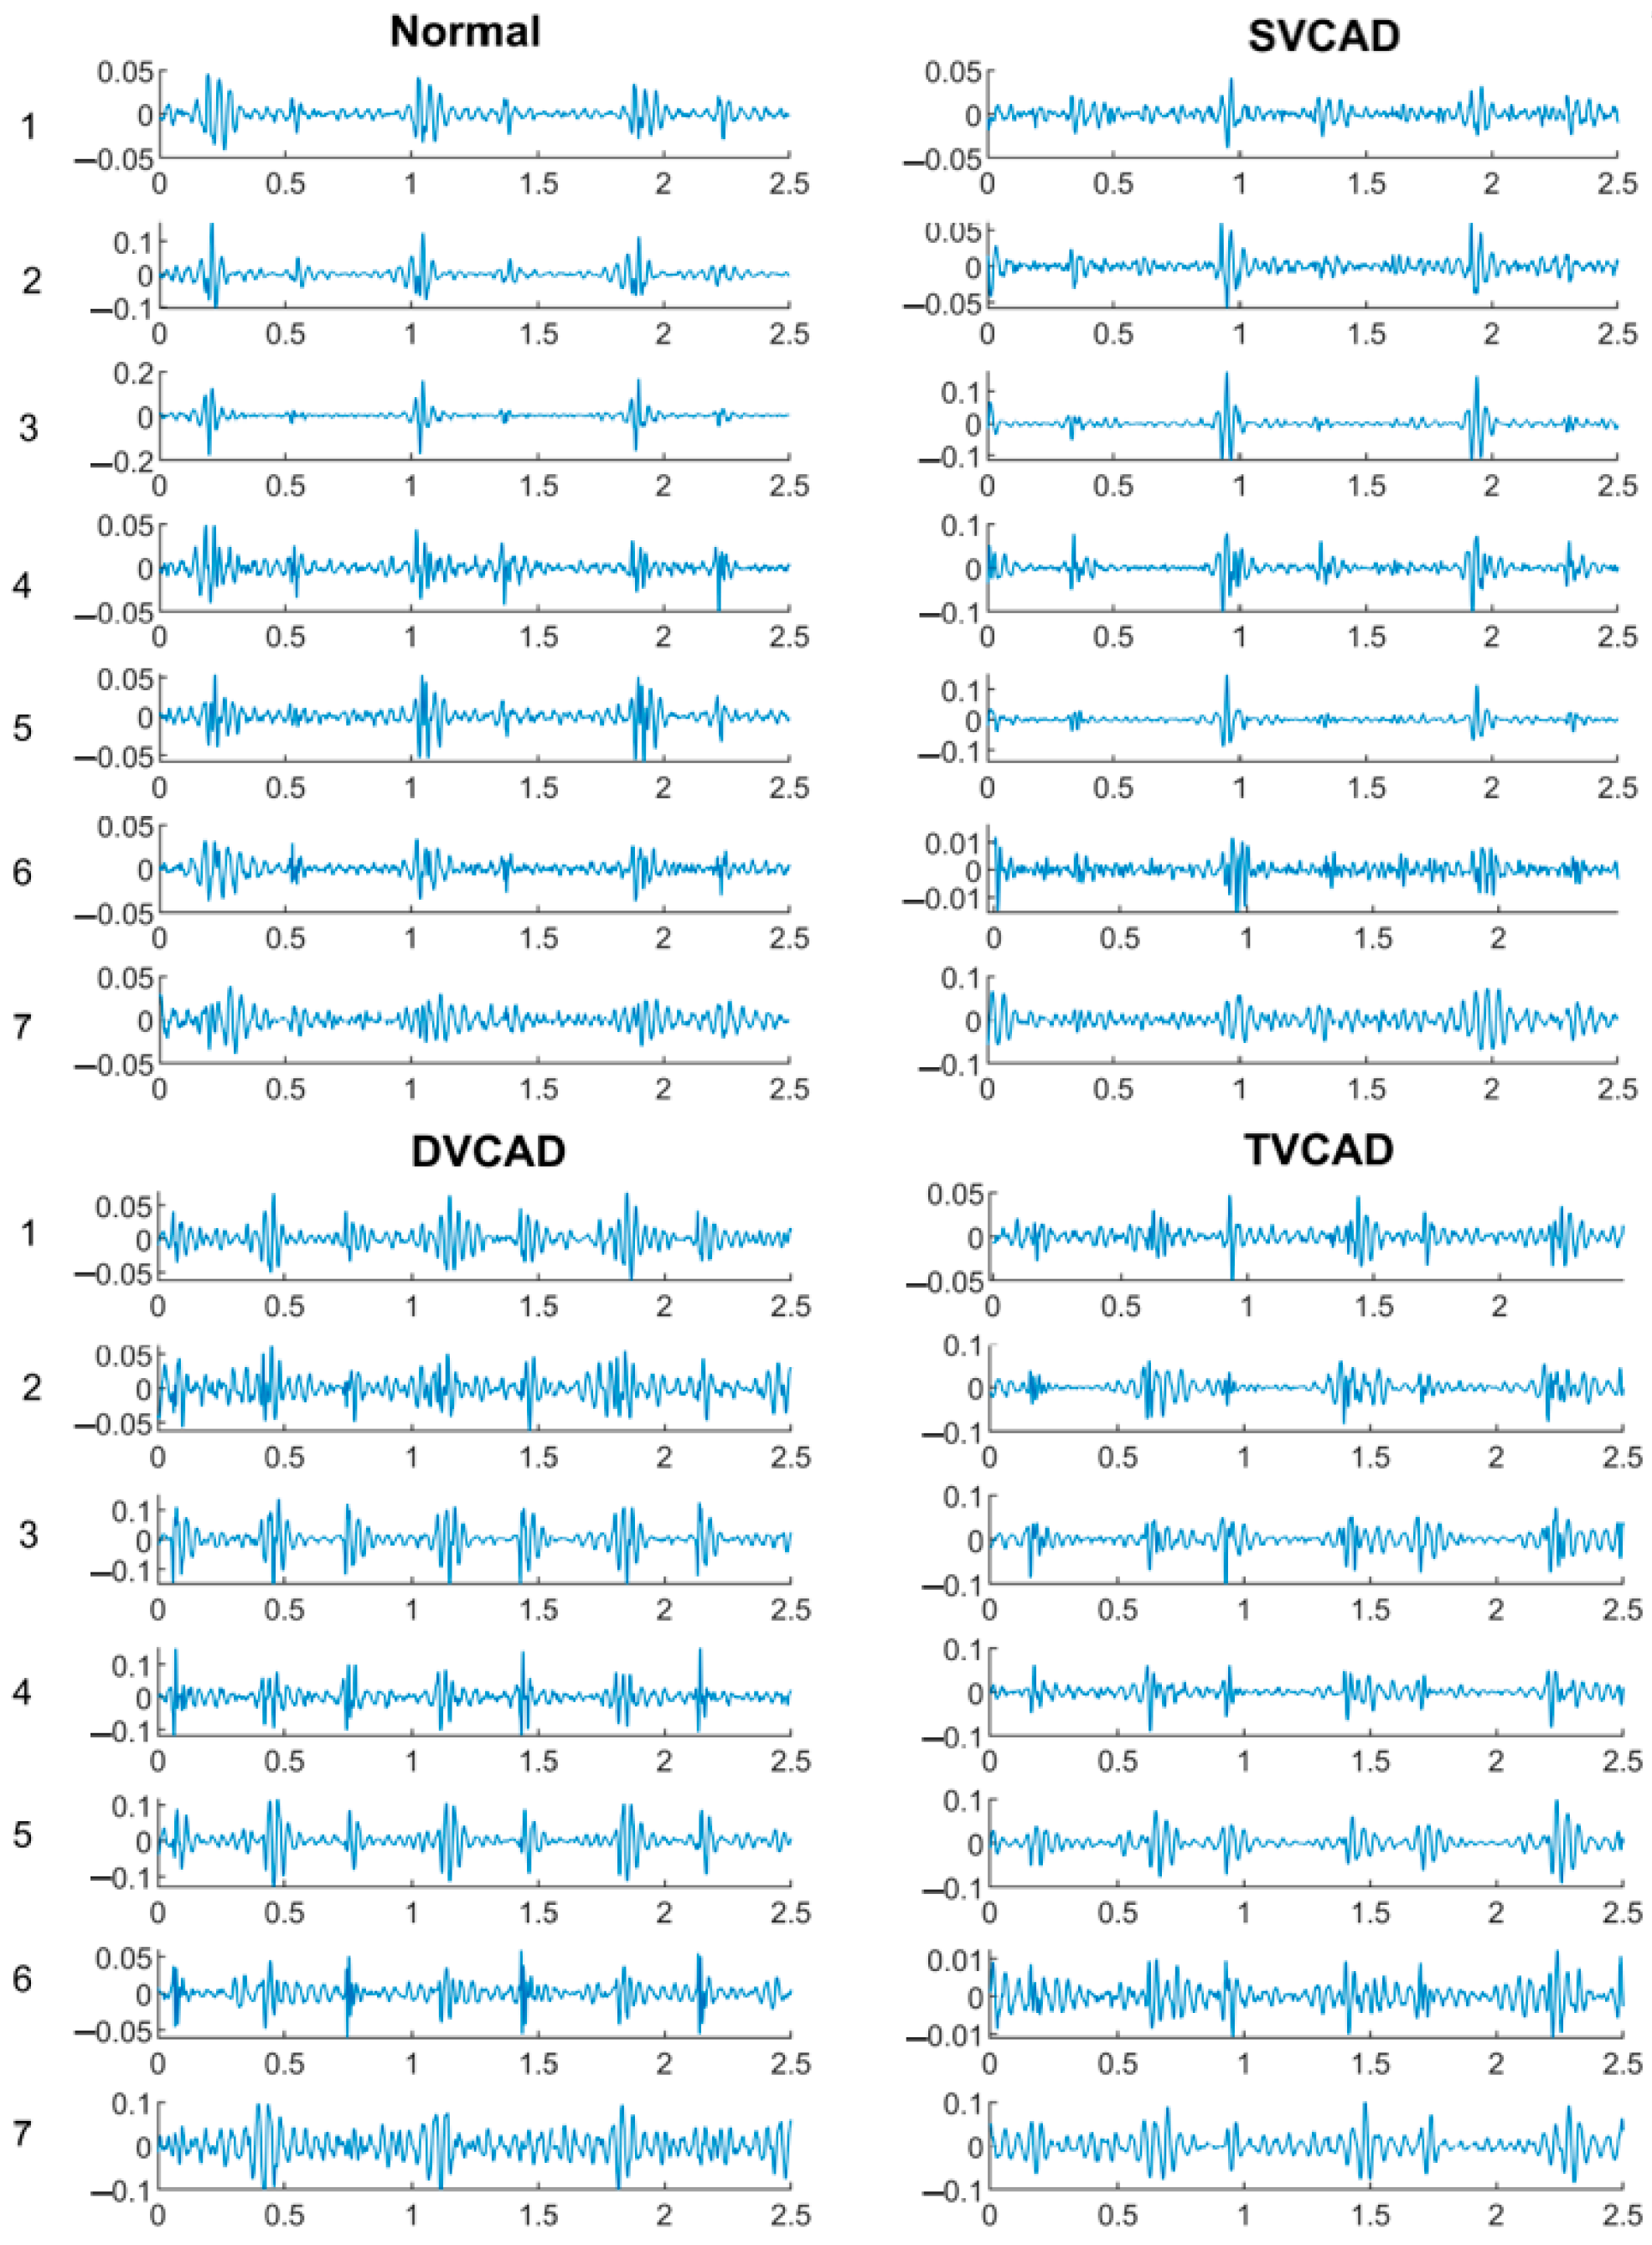
Figure 3 displays a segment recording from a normal, single vessel, double vessel and triple vessel CAD subject. The recordings are not easily distinguishable from audio listening and visual inspection, hence, the motivation for implementing machine learning based classification is realised.
Figure 3.
Synchronised signals obtained from Normal, SVCAD, DVCAD and TVCAD subject.
3.2. Standalone Vest
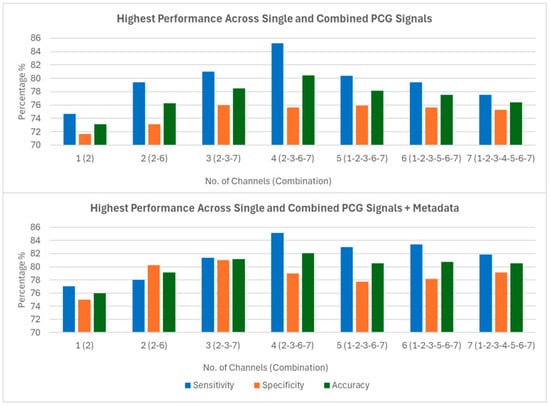
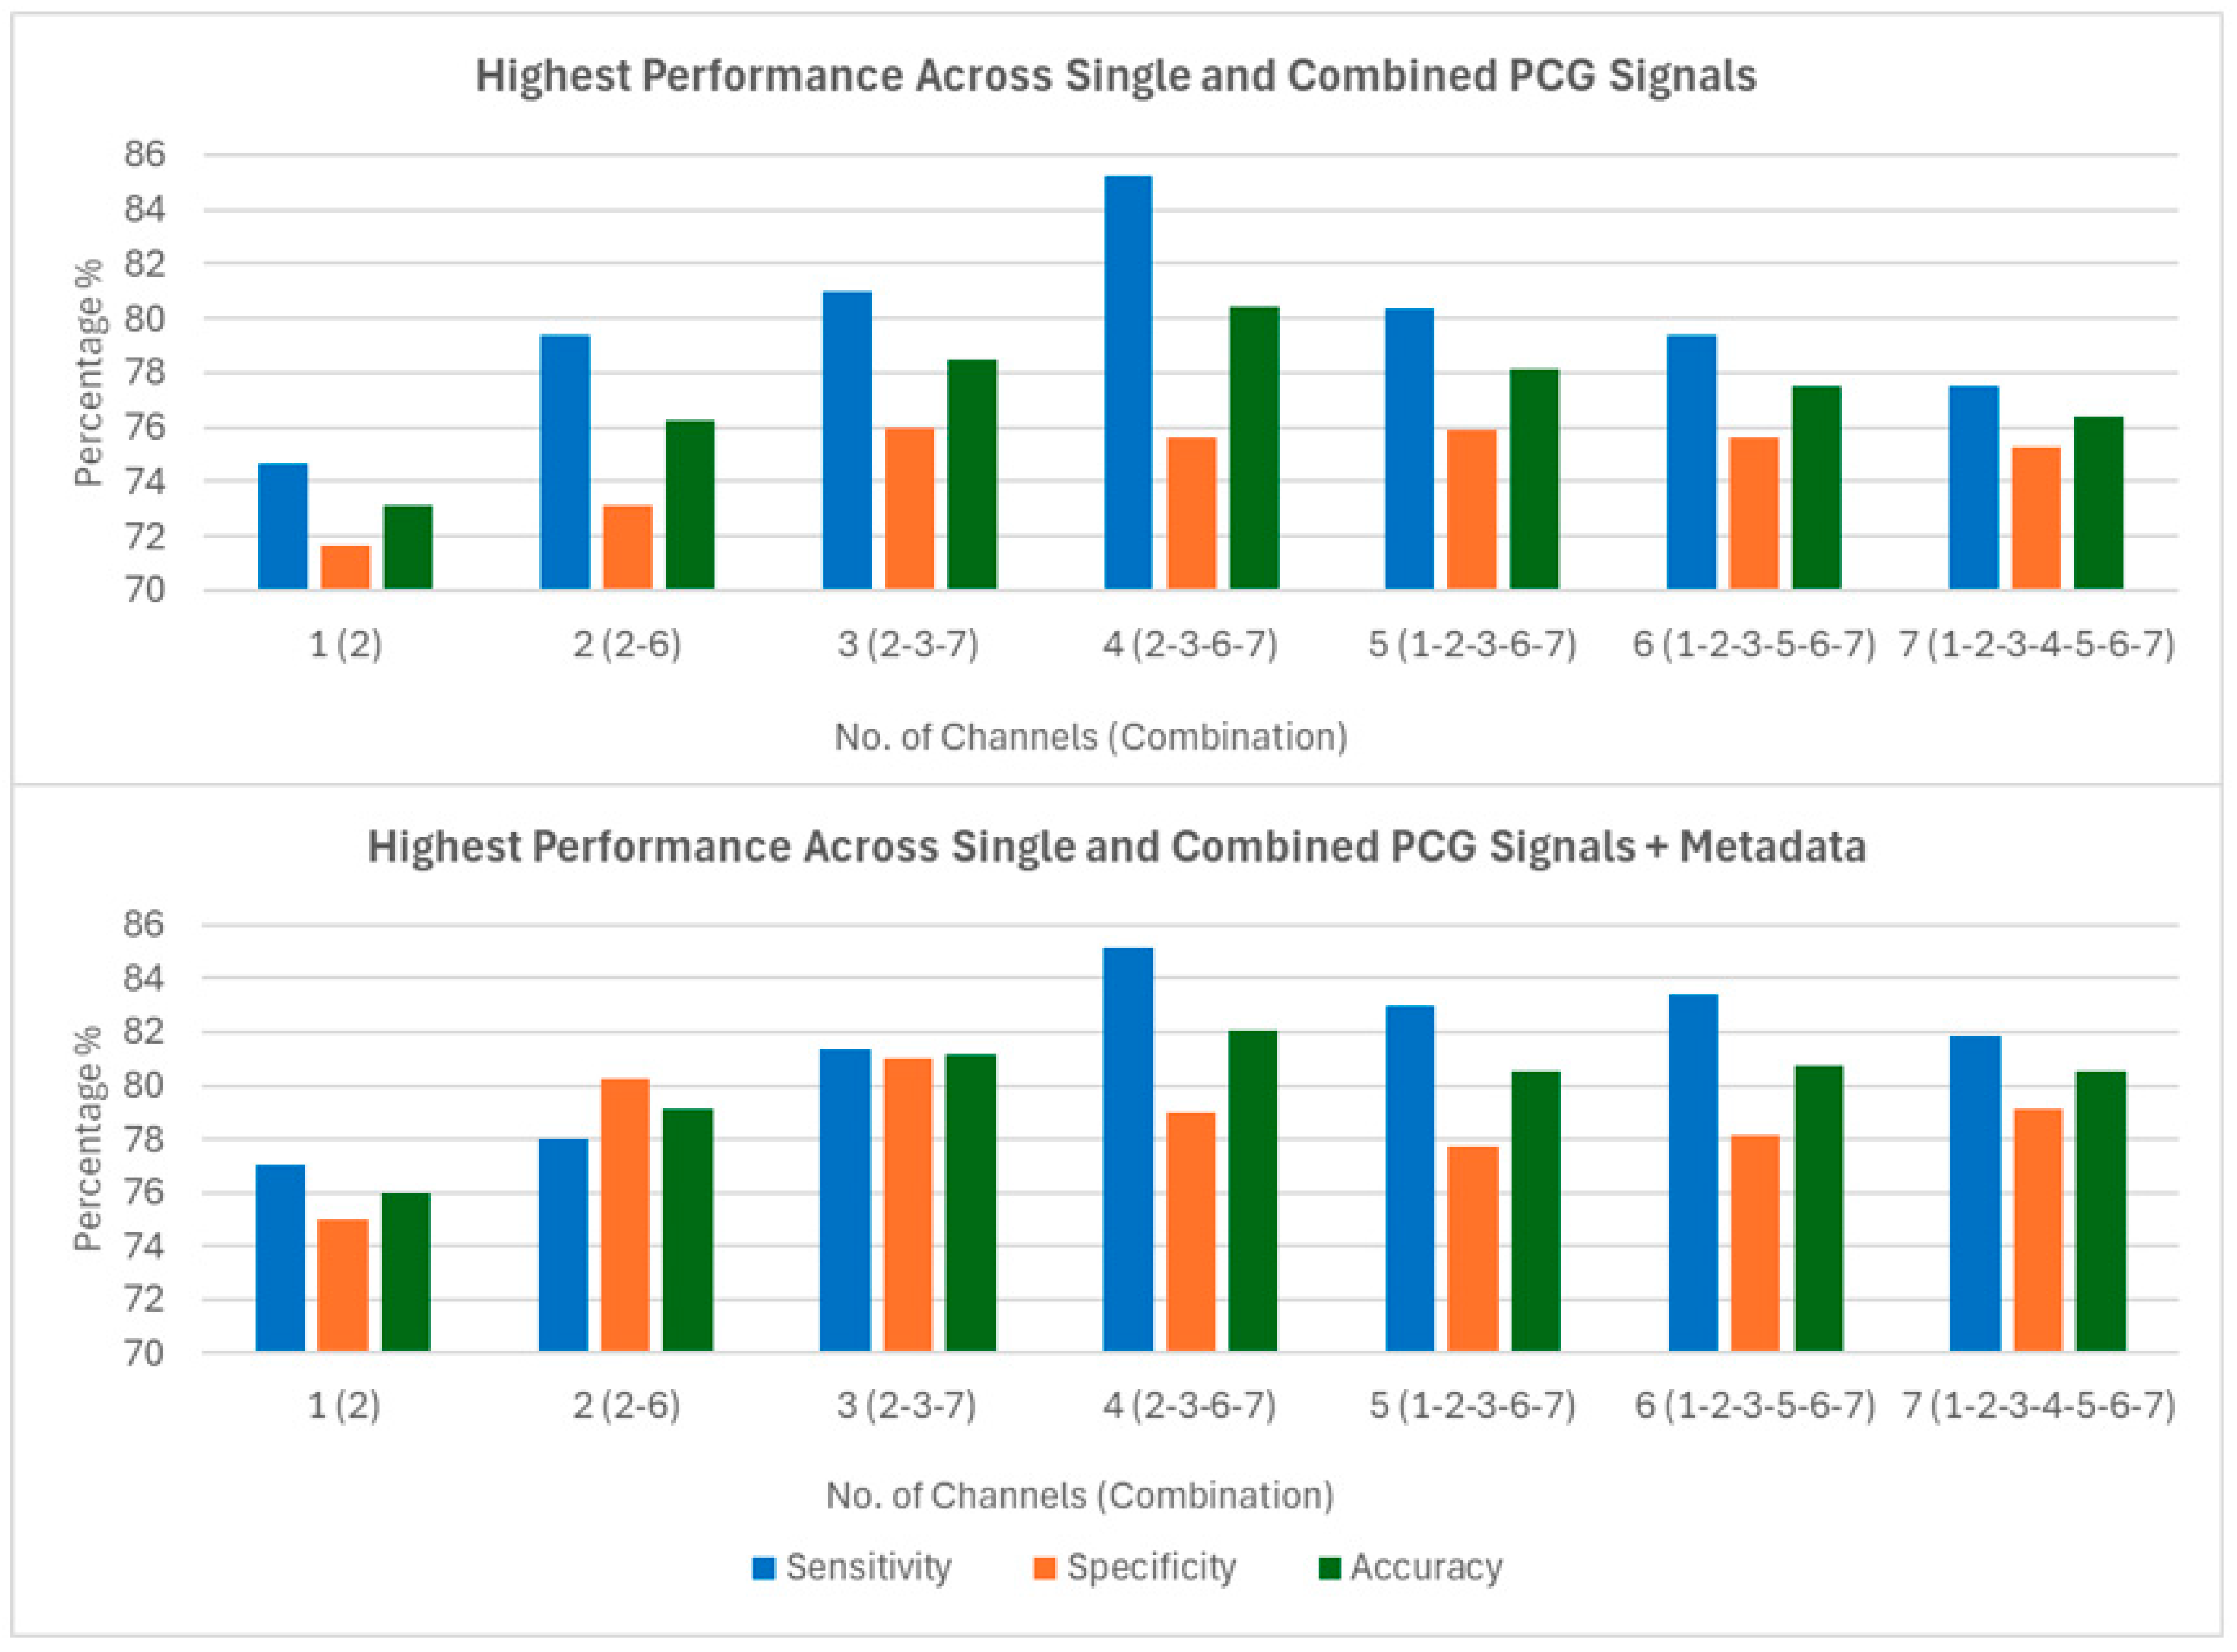
The subject-level results for the top-performing channel combinations, corresponding to each total number of channels, are displayed in Figure 4. These results consider only the handcrafted LFCC features in the SVM model. A four-channel combination (channels 2-3-6-7) produces the highest accuracy at 80.44% (95% CI: 79.33–81.55), with sensitivity and specificity of 85.25% (95% CI: 83.27–87.23) and 75.62% (95% CI: 74.34–76.90), respectively. The feature dimension for this scenario was 1681 after feature-level fusion from the four channels and ReliefF feature selection. These results were reported in [17], where the wearable vest was found to produce clinically significant results, surpassing a sensitivity-specificity average threshold of 75% as suggested by prior clinical guidance [25]. The best-performing channel combinations for each total number of channels are clinically significant, allowing trade-offs between hardware costs and classification performance. For example, using just two sensors (channels 2 and 6) is more cost-effective than implementing a four-channel setup, but this would result in nearly a 4% reduction in classification accuracy. In all scenarios, sensitivity outweighs specificity. While high sensitivity is desirable, low specificity could lead to too many referrals for the gold standard coronary angiography, which would incur economic costs
Figure 4.
Performance of standalone PCG LFCC features of the top performing channel combinations (Top) and with Metadata features fused (Bottom).
3.3. Vest with Metadata
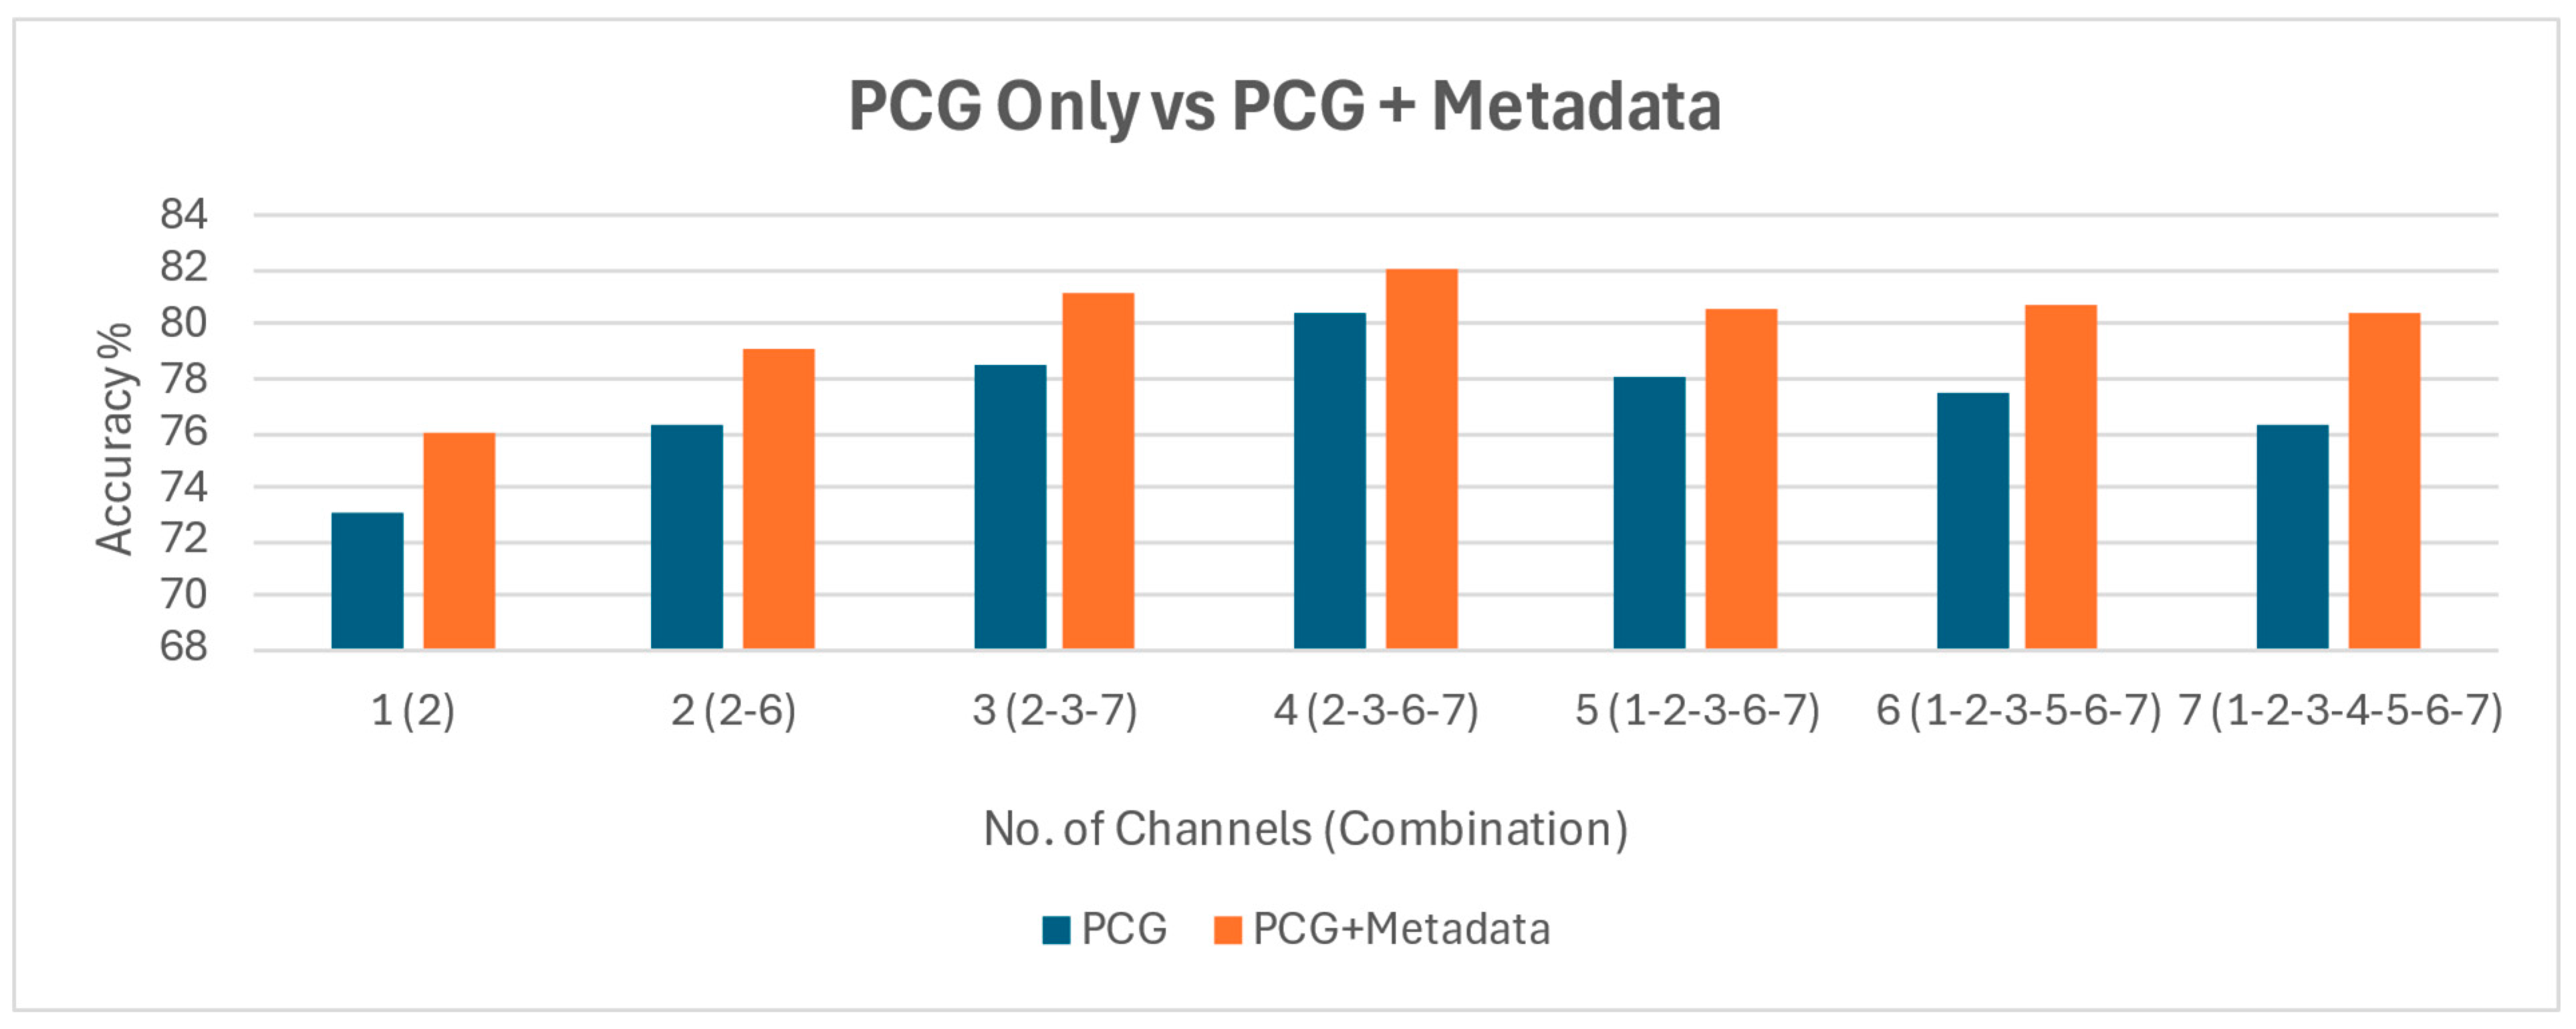
A contribution of this study is the analysis of metadata and its impact on classification performance. By fusing the predictive probabilities from the SVM model using only metadata with those using only the handcrafted LFCC features, we observed an improvement in classification performance across all channel combinations. As shown in Figure 4, the 2-3-6-7 channel combination exhibited an increase in accuracy from 80.44% (95% CI: 79.33–81.55) to 82.06% (95% CI: 80.83–83.29) following metadata fusion. Specificity improved from 75.62% (95% CI: 74.34–76.90) to 78.90% (95% CI: 78.02–79.78), while sensitivity remained comparable, changing marginally from 85.25% (95% CI: 83.27–87.23) to 85.23% (95% CI: 83.00–87.50). Paired statistical comparisons across the 20 repeated cross-validation runs showed that metadata fusion resulted in a statistically significant improvement in specificity (p = 6.10 × 10⁻⁴) and overall accuracy (p = 0.024), while sensitivity did not change significantly (p = 0.75). These results indicate that metadata integration primarily reduces false-positive classifications without increasing missed CAD cases. Higher specificity reduces unnecessary referrals for the gold standard angiography, thereby decreasing both the economic burden and patient inconvenience
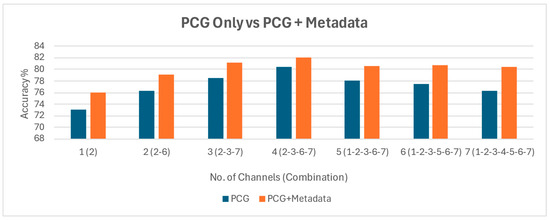
A direct comparison of classification accuracy, with and without metadata, is presented in Figure 5. While a performance increase is observed across all channel combinations, obtaining metadata requires patient input. Additional tests may be necessary to gather variables such as BMI and blood pressure. Therefore, although including metadata offers a potential avenue for improvement, achieving desirable performance is also possible without patient interaction, relying solely on the vest.
Figure 5.
Performance comparison between PCG only and PCG fused with Metadata.
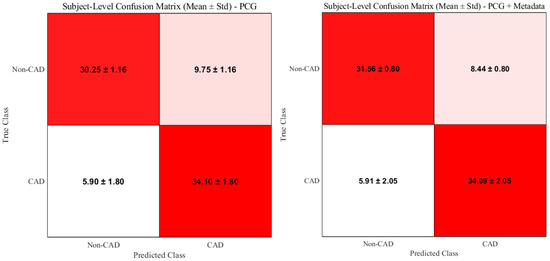
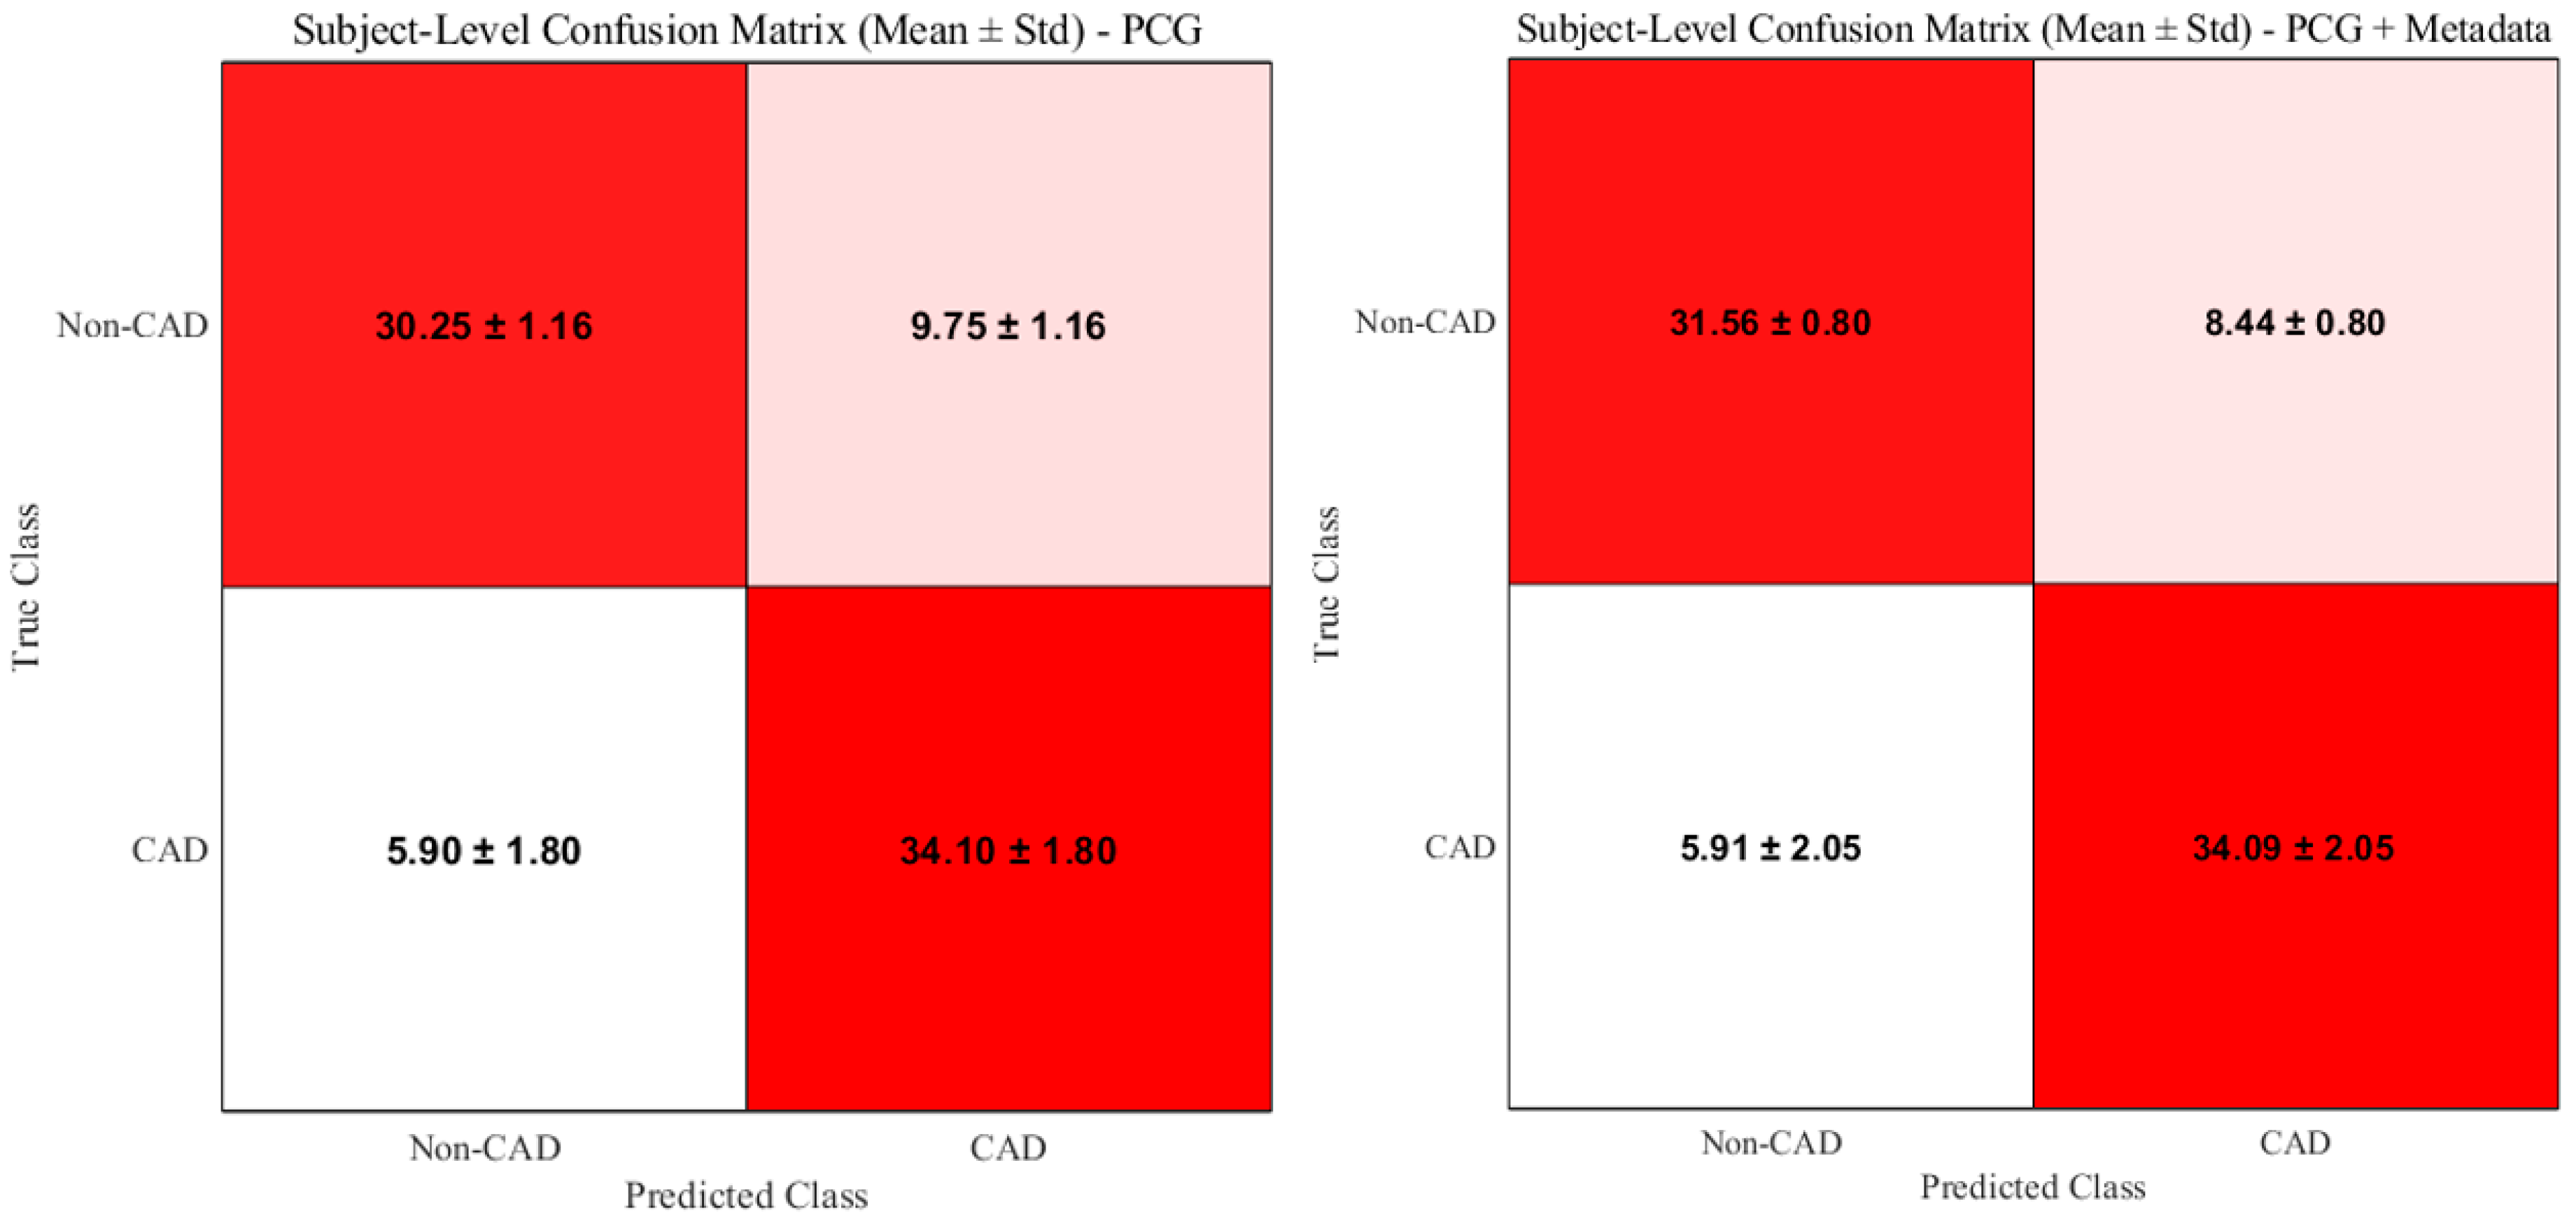
Figure 6 presents the subject-level confusion matrices for the PCG-only (channels 2-3-6-7) and PCG + metadata cases, averaged across 20 cross-fold validation iterations. An increase in true negative classifications is observed when metadata is fused, which is consistent with the corresponding increase in specificity.
Figure 6.
Subject-level confusion matrices for the PCG-only (channels 2-3-6-7) and PCG + metadata classification cases.
Sensitivity analysis excluding the eight control volunteers resulted in a lower overall accuracy in the PCG-only model (78.04%), consistent with removal of low-risk controls and a more clinically representative non-CAD cohort. Importantly, metadata fusion continued to improve performance in this setting, increasing accuracy to 80.84%, indicating that the benefit of metadata integration is not driven by inclusion of the volunteer subgroup.
4. Discussion
4.1. Key Findings
In this study, a wearable vest with integrated multi-channel PCG sensors achieved clinically meaningful discrimination between CAD and non-CAD subjects. Using LFCC features with an SVM classifier, the best four-channel combination (2-3-6-7) reached 80.44% accuracy, with sensitivity of 85.25% and specificity of 75.62%. Incorporating metadata (BMI, systolic and diastolic blood pressure and their ratio, hypertension and type-2 diabetes) provided a modest performance gain, improving accuracy to 82.08% and increasing specificity by approximately 3% while maintaining sensitivity. Across all models, sensitivity consistently exceeded specificity, highlighting the system’s potential to minimise missed CAD cases
4.2. Interpretation of Results
The improved specificity observed with metadata fusion likely reflects the contribution of long-term cardiovascular risk factors that are not captured by brief acoustic recordings. While PCG features capture acoustic patterns associated with angiography-defined CAD, metadata variables add contextual information about vascular risk, thereby reducing false-positive classifications. The trade-off between the number of vest channels and diagnostic accuracy is also clinically relevant: although four-channel fusion provided the highest performance, two-channel combinations still exceeded the 75% sensitivity-specificity threshold while offering a more cost-effective hardware configuration. This balance between accuracy and feasibility is critical for real-world implementation.
The observation that the four-channel combination (2-3-6-7) yielded the highest performance does not imply that other channels produced poor-quality signals. All PCG sensors acquired valid heart sound recordings; however, CAD-related acoustic signatures can vary spatially across the chest due to anatomical differences in cardiac position, chest wall thickness, and vascular orientation. As a result, certain sensor location combinations provide more discriminative information than others. In this configuration, channels 2 and 3 collect heart sounds from the left side of the chest, directly overlying the heart. The heart slightly overlaps the sternum, with a small area extending toward the right side of the chest, where channel 6 is positioned. Due to the rotational position of the heart, a portion of the right coronary artery is oriented posteriorly, which may explain the contribution of channel 7 located on the back. Importantly, the observed performance differences are unlikely to be driven by overfitting, as subject-level cross-validation, repeated random splits, and feature selection were performed exclusively within the training folds.
The design of the wearable vest emphasises practicality and user-friendliness, aiming to make CAD pre-screening more accessible and less reliant on expensive or invasive procedures. Additionally, the system is designed to operate without specialist interpretation, supporting its potential use in future at-home or community-based screening following further validation.
It is important to clarify that coronary artery disease cannot be reliably detected by clinicians using stethoscopes or PCG signals alone, as CAD-related murmurs are typically low in both intensity and frequency and fall below the threshold of human hearing. In this study, signal processing techniques are used to extract subtle acoustic patterns from PCG recordings that are not accessible to human listeners, after which machine learning methods are applied to differentiate between CAD and non-CAD patterns. Clinical metadata does not improve acoustic detectability but instead provides contextual cardiovascular risk information that influences referral thresholds for further testing. Accordingly, metadata integration in this study primarily improved model specificity, reducing false-positive classifications and enabling more informed triage decisions without increasing missed CAD cases.
4.3. Comparison with Existing Evidence
Our findings are consistent with prior work demonstrating that acoustic analysis can discriminate between CAD and non-CAD subjects based on PCG recordings. For example, Thomas et al. showed that CAD murmurs, although often inaudible to clinicians, can be identified using computer-based methods [5]. Several PCG-based CAD studies have reported higher classification scores than those achieved in our work [18,19,20]. However, many of these were conducted in highly controlled environments with quiet surroundings, precise sensor placement, and subjects carefully prepared in advance. While such conditions are valuable for proof-of-concept, they do not reflect typical outpatient or community settings. In contrast, our recordings were acquired in a busy angiography ward with ambient clinical noise and variable sensor positioning, yet the system still achieved over 80% classification accuracy. This suggests that our results may provide a more realistic indication of performance in practical use. Importantly, our results extend the literature by quantifying the incremental value of metadata integration. These findings indicate that although absolute accuracy may be lower than in controlled studies, the robustness of our approach in a real-world environment, combined with the added value of metadata, underscores its potential for practical screening and triage applications.
4.4. Clinical Implications
Our results suggest that a wearable vest could function as a non-invasive triage tool for CAD, suitable for use in community or outpatient settings where access to angiography is limited. High sensitivity makes it well suited for screening, while metadata fusion offers improved specificity to reduce unnecessary referrals. In scenarios where patient information is unavailable or difficult to obtain, the vest alone still provides clinically significant performance. The ability to balance channel count with diagnostic performance further increases flexibility for different healthcare environments.
Beyond community screening, one potential application is in pre-operative risk assessment, where undiagnosed CAD substantially increases perioperative complications [26]. While our study did not evaluate surgical cohorts directly, the vest’s ability to provide rapid, non-invasive detection with over 80% accuracy suggests it may serve as a useful tool in pre-operative settings. Future studies in surgical populations are required to confirm this role.
4.5. Limitations and Future Scope
A major limitation of this study is that the study population consisted exclusively of male participants. Sex-specific anatomical differences, including variations in chest wall composition, breast tissue interposition, and sensor-skin coupling, may influence acoustic signal propagation and the quality of phonocardiogram recordings. These factors could potentially affect feature extraction and classification performance. Accordingly, the present findings cannot be assumed to generalise directly to female populations. Larger multicentre studies including female participants are required to determine whether model retraining, sensor repositioning strategies, or sex-specific calibration may be necessary. Additionally, data will be collected from other countries to broaden the scope of the research. Physiological differences in the heart exist between different ethnicities. For example, the average diameter of the coronary arteries in the South Asian population is smaller compared to that of the Caucasian population [27], which can result in different acoustic characteristics arising from CAD. Whether the same machine learning model can be used across ethnic groups or if different models are required remains an open research question. The single-centre design and recruitment from a single geographic region limit the external validity of the findings. Model performance may be influenced by centre-specific patient characteristics and recording conditions. Additional multicentre studies including diverse populations are required to evaluate generalisability across different healthcare settings.
A statistically significant age difference existed between groups. Although resting systolic ventricular performance and cardiac output are generally preserved with advancing age in healthy individuals [28], age-related changes in thoracic tissue properties may still influence acoustic recordings. Therefore, age-related confounding cannot be entirely excluded, and age-matched validation cohorts are required in future investigations.
Another important limitation lies in data acquisition constraints. Although the wearable vest is designed for ease of use, the quality of the recorded signals can be affected by incorrect sensor placement, variations in body dimensions, and movement artifacts. These factors may compromise the consistency and reliability of the phonocardiogram recordings.
The relatively small sample size (n = 80) is an important limitation and may contribute to increased variability in performance estimates and potential optimistic bias, even when repeated cross-validation is employed. Accordingly, the present findings should be interpreted as preliminary and hypothesis-generating, and require confirmation in larger, independent, multicentre populations before clinical translation can be considered.
An additional limitation is the uncertainty regarding the exact vascular source of the murmurs. The thorax contains multiple vascular structures, and turbulent flow from non-coronary vessels could contribute to the recorded signals. However, in this study, coronary angiography provided definitive ground truth for CAD status, ensuring that the labels used for model training corresponded specifically to the presence or absence of significant coronary stenosis. Furthermore, the use of multiple PCG sensors across different chest locations increases the likelihood that the models captured acoustic differences associated with angiography-defined CAD rather than unrelated vascular or extracardiac sounds. PCG sensor positions were selected on the recommendation of cardiologists and corresponded to the standard auscultation sites (aortic, pulmonic, tricuspid, and mitral areas), which are widely recognised as optimal for capturing heart sounds. While we cannot prove the anatomic origin of the signal components, the consistent discrimination between angiography-defined CAD and non-CAD suggests that the classifiers were detecting acoustic signatures associated with angiography-defined CAD status. Additionally, subjects were in a breath-held state, confirming that the acoustic recordings were not affected by respiratory sounds. Although breath-hold recordings minimise respiratory noise, pulmonary disease may alter acoustic transmission. Future studies should systematically document respiratory comorbidities to confirm robustness.
Another consideration is the use of a balanced dataset, which does not reflect the true prevalence of CAD in real-world populations. This design was intentionally chosen to enable fair evaluation of model discrimination performance, ensuring that metrics such as sensitivity and specificity were not biased by class imbalance. However, the positive and negative predictive values derived from this study may not directly translate to clinical settings. Future work should therefore evaluate model performance under realistic prevalence conditions and assess the impact on predictive values.
CAD was defined anatomically as ≥50% luminal stenosis on coronary angiography, without stratification by lesion location or functional significance. As the vest is intended as a screening tool to detect the presence of anatomical CAD and prompt referral for definitive testing, this endpoint was considered appropriate. Detailed plaque composition was not available in this cohort. Although acoustic turbulence is primarily driven by luminal narrowing, different plaque morphologies may theoretically influence flow dynamics and signal characteristics. Future studies incorporating plaque characterisation may help determine whether plaque composition affects PCG-based detection performance.
The study did not include direct comparison with established imaging modalities such as coronary CT angiography or stress testing. As the vest is intended as an initial screening tool rather than a replacement for imaging, future studies may explore comparative evaluation within clinical diagnostic pathways. Additionally, as this study was designed to evaluate diagnostic discrimination rather than causal effect estimation, formal propensity score matching or multivariable causal adjustment was not performed. Nonetheless, residual confounding related to demographic imbalance cannot be entirely excluded.
5. Conclusions
In this single-centre study, a wearable vest with integrated multi-channel PCG sensors demonstrated clinically significant accuracy for discriminating CAD from non-CAD subjects. Incorporating routinely available clinical metadata improved classification performance. These findings support the potential of PCG-based acoustic analysis, with or without metadata, as a fast and non-invasive tool for CAD pre-screening pending validation in independent external cohorts. Larger, multicentre studies including female participants and diverse populations with realistic class representations are required to validate generalisability and to further assess clinical utility in community and perioperative settings.
Author Contributions
Conceptualization, M.F.; Methodology, M.F.; Software, M.F.; Validation, M.F. and M.M.; Formal analysis, M.F.; Investigation, M.F. and J.R.; Data curation, K.M.; Writing—original draft preparation, M.F.; Writing—review and editing, M.F., M.M., J.R., K.M., Y.R. and G.S.; Supervision, Y.R. and G.S.; Resources, Y.R. and G.S.; Project administration, Y.R. and G.S. All authors have read and agreed to the published version of the manuscript.
Funding
This research received no external funding.
Institutional Review Board Statement
This study received approval from the ethics committee of Fortis Hospital, Kolkata, India, where the data collection took place (ECR/240/Inst/WB/2013/RR-19, Date of approval: 13 January 2023).
Informed Consent Statement
Informed consent was obtained from all subjects involved in the study.
Data Availability Statement
The data are not publicly available due to ethical and privacy restrictions associated with human subject data. The datasets are also being used in ongoing and future research projects. Data may be made available from the authors upon reasonable request and with appropriate approvals.
Acknowledgments
We thank Ticking Hearty Pty Ltd. for providing their wearable vest design for data collection.
Conflicts of Interest
The authors declare no conflicts of interest.
Abbreviations
The following abbreviations are used in this manuscript:
| CAD | Coronary Artery Disease |
| PCG | Phonocardiogram |
| BMI | Body Mass Index |
| LFCC | Linear Frequency Cepstral Coefficients |
| SVM | Support Vector Machine |
References
- Karnath, B.; Thornton, W. Auscultation of the heart. Hosp. Physician 2002, 38, 39–45. [Google Scholar]
- Cassar, A.; Holmes, D.R., Jr.; Rihal, C.S.; Gersh, B.J. Chronic Coronary Artery Disease: Diagnosis and Management; Elsevier: Amsterdam, The Netherlands, 2009. [Google Scholar]
- Virani, S.S.; Alonso, A.; Aparicio, H.J.; Benjamin, E.J.; Bittencourt, M.S.; Callaway, C.W.; Carson, A.P.; Chamberlain, A.M.; Cheng, S.; Delling, F.N.; et al. Heart disease and stroke statistics—2021 update. Circulation 2021, 143, e146–e603. [Google Scholar] [CrossRef] [Scilit]
- Smit, M.; Coetzee, A.; Lochner, A. The pathophysiology of myocardial ischemia and perioperative myocardial infarction. J. Cardiothorac. Vasc. Anesth. 2020, 34, 2501–2512. [Google Scholar] [CrossRef] [Scilit]
- Thomas, J.L.; Winther, S.; Wilson, R.F.; Bøttcher, M. A novel approach to diagnosing coronary artery disease: Acoustic detection of coronary turbulence. Int. J. Cardiovasc. Imaging 2017, 33, 129–136. [Google Scholar] [CrossRef] [Scilit]
- Lim, M.J.; White, C.J. Coronary angiography is the gold standard for patients with significant left ventricular dysfunction. Prog. Cardiovasc. Dis. 2013, 55, 504–508. [Google Scholar] [CrossRef] [Scilit]
- Gibbons, R.J.; Chatterjee, K.; Daley, J.; Douglas, J.S.; Fihn, S.D.; Gardin, J.M.; Grunwald, M.A.; Levy, D.; Lytle, B.W.; O’rOurke, R.A.; et al. ACC/AHA/ACP-ASIM guidelines for the management of patients with chronic stable angina. J. Am. Coll. Cardiol. 1999, 33, 2092–2197. [Google Scholar] [CrossRef] [Scilit]
- Ahmed, O.; Hanley, M.; Bennett, S.J.; Chandra, A.; Desjardins, B.; Gage, K.L.; Gerhard-Herman, M.D.; Ginsburg, M.; Gornik, H.L.; Oliva, I.B.; et al. ACR appropriateness criteria® vascular claudication—Assessment for revascularization. J. Am. Coll. Radiol. 2017, 14, S372–S379. [Google Scholar] [CrossRef] [Scilit]
- Zaid, G.; Yehudai, D.; Rosenschein, U.; Zeina, A.-R. Coronary artery disease in an asymptomatic population undergoing MDCT coronary angiography. Open Cardiovasc. Med. J. 2010, 4, 7. [Google Scholar] [CrossRef] [Scilit]
- Gorenoi, V.; Schönermark, M.P.; Hagen, A. CT coronary angiography vs. invasive coronary angiography in CHD. GMS Health Technol. Assess. 2012, 8, Doc02. [Google Scholar]
- Blüher, M. Obesity: Global epidemiology and pathogenesis. Nat. Rev. Endocrinol. 2019, 15, 288–298. [Google Scholar] [CrossRef] [Scilit]
- Mahmood, S.S.; Levy, D.; Vasan, R.S.; Wang, T.J. The Framingham Heart Study and the epidemiology of cardiovascular disease: A historical perspective. Lancet 2014, 383, 999–1008. [Google Scholar] [CrossRef] [Scilit] [PubMed]
- Unger, T.; Borghi, C.; Charchar, F.; Khan, N.A.; Poulter, N.R.; Prabhakaran, D.; Ramirez, A.; Schlaich, M.; Stergiou, G.S.; Tomaszewski, M.; et al. 2020 International Society of Hypertension global hypertension practice guidelines. Hypertension 2020, 75, 1334–1357. [Google Scholar] [CrossRef] [Scilit]
- Williams, B.; Mancia, G.; Spiering, W.; Agabiti Rosei, E.; Azizi, M.; Burnier, M.; Clement, D.L.; Coca, A.; de Simone, G.; Dominiczak, A.; et al. 2018 ESC/ESH guidelines for the management of arterial hypertension. Eur. Heart J. 2018, 39, 3021–3104. [Google Scholar] [CrossRef] [Scilit] [PubMed]
- Rawshani, A.; Rawshani, A.; Franzén, S.; Eliasson, B.; Svensson, A.-M.; Miftaraj, M.; McGuire, D.K.; Sattar, N.; Rosengren, A.; Gudbjörnsdottir, S. Mortality and cardiovascular disease in type 1 and type 2 diabetes. N. Engl. J. Med. 2017, 376, 1407–1418. [Google Scholar] [CrossRef] [Scilit] [PubMed]
- Petrie, J.R.; Guzik, T.J.; Touyz, R.M. Diabetes, hypertension, and cardiovascular disease: Clinical insights and vascular mechanisms. Can. J. Cardiol. 2018, 34, 575–584. [Google Scholar] [CrossRef] [Scilit]
- Fynn, M.; Mandana, K.; Rashid, J.; Marocchi, M.; Nordholm, S.; Rong, Y.; Saha, G. Practicality meets precision: Wearable vest with integrated multi-channel PCG sensors for effective coronary artery disease pre-screening. Comput. Biol. Med. 2025, 189, 109904. [Google Scholar] [CrossRef] [Scilit]
- Li, H.; Wang, X.; Liu, C.; Zeng, Q.; Zheng, Y.; Chu, X.; Yao, L.; Wang, J.; Jiao, Y.; Karmakar, C. A fusion framework based on multi-domain features and deep learning features of phonocardiogram for coronary artery disease detection. Comput. Biol. Med. 2020, 120, 103733. [Google Scholar] [CrossRef] [Scilit]
- Huang, Y.; Li, H.; Tao, R.; Han, W.; Zhang, P.; Yu, X.; Wu, R. A customized framework for coronary artery disease detection using phonocardiogram signals. Biomed. Signal Process. Control 2022, 78, 103982. [Google Scholar] [CrossRef] [Scilit]
- Pathak, A.; Samanta, P.; Mandana, K.; Saha, G. Detection of coronary artery atherosclerotic disease using novel features from synchrosqueezing transform of phonocardiogram. Biomed. Signal Process. Control 2020, 62, 102055. [Google Scholar] [CrossRef] [Scilit]
- University of Nottingham. Cardiology Teaching Package. Available online: https://www.nottingham.ac.uk/nursing/practice/resources/cardiology/function/chest_leads.php (accessed on 16 June 2025).
- Hajar, R. Risk factors for coronary artery disease: Historical perspectives. Heart Views 2017, 18, 109–114. [Google Scholar] [CrossRef] [Scilit]
- Abdul, Z.K.; Al-Talabani, A.K. Mel frequency cepstral coefficient and its applications: A review. IEEE Access 2022, 10, 122136–122158. [Google Scholar] [CrossRef] [Scilit]
- Robnik-Šikonja, M.; Kononenko, I. Theoretical and empirical analysis of ReliefF and RReliefF. Mach. Learn. 2003, 53, 23–69. [Google Scholar] [CrossRef] [Scilit]
- Power, M.; Fell, G.; Wright, M. Principles for high-quality, high-value testing. BMJ Evid.-Based Med. 2013, 18, 5–10. [Google Scholar] [CrossRef] [Scilit]
- Chassot, P.G.; Delabays, A.; Spahn, D. Preoperative evaluation of patients with, or at risk of, coronary artery disease undergoing non-cardiac surgery. Br. J. Anaesth. 2002, 89, 747–759. [Google Scholar] [CrossRef]
- Zindrou, D.; Taylor, K.M.; Bagger, J.P. Coronary artery size and disease in UK South Asian and Caucasian men. Eur. J. Cardiothorac. Surg. 2006, 29, 492–495. [Google Scholar] [CrossRef] [Scilit] [PubMed]
- Rodeheffer, R.J.; Gerstenblith, G.; Becker, L.C.; Fleg, J.L.; Weisfeldt, M.L.; Lakatta, E.G. Exercise cardiac output is maintained with advancing age in healthy human subjects: Cardiac dilatation and increased stroke volume compensate for a diminished heart rate. Circulation 1984, 69, 203–213. [Google Scholar] [CrossRef] [Scilit] [PubMed]

Disclaimer/Publisher’s Note: The statements, opinions and data contained in all publications are solely those of the individual author(s) and contributor(s) and not of MDPI and/or the editor(s). MDPI and/or the editor(s) disclaim responsibility for any injury to people or property resulting from any ideas, methods, instructions or products referred to in the content. |
© 2026 by the authors. Licensee MDPI, Basel, Switzerland. This article is an open access article distributed under the terms and conditions of the Creative Commons Attribution (CC BY) license.