


Abstract
Retrofitting houses for energy efficiency has become a key priority in government policies, including in the UK. Sustainability improvements can increase property values, which are coined as “Green Premiums”. This is the “Brown Discount”, when low energy-efficient properties are sold below the general price. The existence and dynamics of green premiums or brown discounts are contextual and uncertain. This study has projected potential scenarios in the year 2050, together with expected house prices. The estimation has been conducted separately for the UK nations: England, Wales, Scotland and Northern Ireland. Further, the housing stock was evaluated under four categories: terraced, semi-detached, detached and flats. The green premiums were discounted back to the year 2025 for present value. First, the findings revealed that there is a strong case for retrofitting houses today under the illustrated scenarios in 2050. Secondly, if the house is not retrofitted, it will be sold at a brown discount in 2050 in our assumed scenarios. Thirdly, the energy bill savings, better health, comfort, and well-being due to retrofitting have not been considered in this analysis. They are highly significant justifications for retrofitting houses. The limitations of the study lie with the estimations and assumptions of the data, where the green premium and other commodity statistics can be highly sensitive to a range of socio-economic factors. The full paper provides all the information related to limitations, scope, and assumptions of the analysis.
1. Introduction
Retrofitting houses is not just about improving the energy efficiency of a building, which is viewed from the point of building construction. It also includes improving the health, comfort, and well-being of the residents, which needs to be viewed from the social perspective (Brown et al., 2025; BSI, 2023; Panakaduwa et al., 2026a). Apart from the technical and social aspects of housing retrofit, we can note the financial aspect of housing retrofit as well. When it comes to decision-making related to retrofit, financial factors can be highly prominent. Whether we like it or not, both technical decision-making and client decision-making are highly influenced by financial factors such as upfront costs and payback periods (BSI, 2023; Panakaduwa et al., 2026b).
Looking at retrofitting through the lens of real estate, the value increase in the house due to retrofit can be considered as one of the key criteria in retrofit decision-making (Gholamzadehmir et al., 2025). Retrofitting a house can be considered as a long-term investment that reduces exposure to future energy commodity costs and volatility of energy prices.
A “Green Premium” is the price that house buyers are willing to pay for their higher energy efficiency in addition to the normal price of a house. The opposite is the “Brown Discount”, when buyers are willing to pay less due to lower energy efficiency (McCord et al., 2024). Although it is rational to assume that more energy-efficient houses are valued more than less energy-efficient houses in the same range, research shows that this is not the case (Wei & Peiser, 2025). The existence of “Green Premium” or “Brown Discount” is highly contextual and subject to fluctuation from time to time.
There is a growing body of literature with regard to the green premium and the brown discount. We referred to the study conducted by Wei and Peiser (2025) with regard to the evolution of the green premium of the London housing stock. The study has presented the trends of the green premium over time from 2013 to 2021 (Wei & Peiser, 2025). We also referred to the UK government targets for Net Zero 2050 and the related housing retrofit strategies such as the Warm Homes Plan (DESNZ, 2026; UK Parliament, 2019). According to the recommendation by the Climate Change Committee, the UK aims for a balanced pathway to energy efficiency in the housing stock (CCC, 2020). As a continuation of the Wei and Peiser (2025) study and the UK government’s strategy for housing retrofit, we focused on modelling the scenario in 2050 to understand the nature of the “Green Premium” in 2050. Then we discounted the Green Premium to 2025 to see whether a financial rationality exists for the case of housing retrofit today. We would also like to emphasise that the purpose of the analysis is to examine the potential capitalisation of retrofit-related green premiums into future house prices, rather than to estimate the economic return on retrofit investment.
Resident engagement in housing retrofit has been identified as a key challenge in promoting housing retrofit in the UK (Panakaduwa et al., 2026b). Further, retrofit decision-making by homeowners does not always follow rational justifications (Ebrahimigharehbaghi et al., 2022). However, we believe that reasonably discussing the present value of the 2050 “Green Premium” can help homeowners as well as policymakers to arrive at better decisions for housing retrofits. The research gap is presented as follows: The absence of forward-looking financial modelling of future buyer willingness to pay for residential energy efficiency. Existing research has examined green premiums in housing markets. However, limited attention has been paid to how green premiums may influence energy-efficiency retrofitting of houses today.
The significance of this study lies in the practical utility of the findings. If there is a positive present value of future “Green Premium” due to retrofitting housing today, that can be a strong catalyst to motivate homeowners to retrofit their houses. In other words, by investing in retrofitting, one may enable the house to generate a positive return on investment when it is sold in future. If this is negative, it means the retrofit does not add value to the property price, and the homeowners are losing the value of the property by retrofitting (although they can enjoy other benefits such as lower energy bills, better health and comfort, etc.). In this scenario, the government can extend grants to bridge the negative value and make it financially attractive to the homeowners.
Research question: How will green premiums in 2050 inform retrofit investment decisions in today’s UK housing market?
The scope of this study is limited to the UK. However, the methodology is easily transferable to any other context. Further, the study is a simulation for the next two and a half decades, which is based on a range of assumptions. This hypothetical nature is a limitation of the study.
2. Materials and Methods
The purpose of the study is to identify how future house values (through green premiums) inform the justification for retrofitting houses today. For this purpose, we have selected the year 2050, since this is the time the UK government is legally required to achieve net zero emissions. The current policies are aimed at this target. The green premium indicates the additional price that buyers are willing to pay for comparatively energy-efficient properties. We linked green premium calculations to the SAP points (DCLG, 2017). The SAP is the calculation method for the residential energy performance certificate in the UK.
- ∆Vj: Green premium value attributable to the assumed efficiency improvement.
- B: Common reference house price without the assumed green premium.
- g: Green premium coefficient (0.0047).
- ∆sj: SAP improvement under the particular scenario j.
- PH: Projected 2050 house price.
- ∆sH: Assumed SAP improvement under the given scenario.
First, we estimated the house prices in 2050 for four types of houses (terraced, semi-detached, detached and flats) in the four nations of the UK (England, Wales, Scotland and Northern Ireland). The house prices in 2050 were projected using the AAA Exponential Triple Smoothing (ETS) algorithm implemented through Excel’s FORECAST.ETS function. We used the monthly average house prices (UKHPI—UK House Price Index) from January 2010 to December 2025, published by the UK government. The seasonality was automatically detected using the function, and the resulting monthly projections were extended from January 2026 to December 2050. Excel’s FORECAST.ETS.CONFINT function was used to calculate the 95% confidence interval.
The green premium is on average 0.25% per SAP point in the European context in a 2025 study (Ou et al., 2025). Another study related to the UK context in 2025 corresponds to a green premium of 0.20% and brown discount of 0.70% per SAP point (Braakmann et al., 2026). However, looking at the study’s scope, limitations and generalisability, we have resorted to using the green premium estimated by Wei and Peiser (2025). This study used a more specific context, a broader and more comprehensive database, robust analysis and a longer scoping period (Wei & Peiser, 2025). They focused on sales data of residential properties from 2013 to 2021 for the London housing stock. This is a 0.47% price increase per SAP point (Wei & Peiser, 2025). In China, the green premium is estimated at 0.583% per 1% increase in energy efficiency (Zhang et al., 2023), which is in line with the 0.47% green premium per one SAP point (0.0047 green premium coefficient) estimated for the London housing stock. We would also like to emphasise that the use of this green premium is the closest figure, but not the exact figure. In this situation, the 0.0047 green premium coefficient is illustrative, not factual.
We hypothesised three energy efficiency levels: same energy efficiency, moderate energy efficiency, and predicted energy efficiency. These scenarios were calculated by considering the average energy efficiency levels of house types according to SAP points at the aggregate level. The same energy efficiency means the same SAP level continues up to 2050. Predicted energy efficiency means the projected SAP level to 2050, based on historical data. This corresponds to a higher energy efficiency level, signposting EPC A or B bands. Moderate energy efficiency is the middle ground between the same (current) energy-efficiency level and the predicted energy-efficiency level. These are assumed reference scenarios at the aggregate level. They are not estimates of energy-efficiency levels achievable by retrofitting a single house.
We also like to highlight that the increase in energy efficiency at the aggregate level will not be purely due to retrofitting. We use the average SAP ratings to inform the energy efficiency of a property. Average SAP ratings can fluctuate for several reasons, including the addition of new-build properties with higher energy efficiency, the demolition of existing properties with lower energy performance, and reductions in energy efficiency over time due to the degradation of building fabric. However, if we consider an individual house, energy efficiency level increases due to retrofit interventions.
Once the energy efficiency levels were determined, we calculated the changes in SAP points from one level to the next (∆ SAP Points). Then we calculated the green premium amounts for each type of house for each UK country. Since the calculation is based on the change in SAP points (∆ SAP Points), there is no calculation for the current energy efficiency level (lowest). Green premium amounts were calculated for moderate and predicted levels of energy efficiency.
- P∆Vj: Present value of the calculated green premium.
- ∆Vj: Green premium value attributable to the assumed efficiency improvement.
- r: Discount rate.
- ∆t: Number of years considered.
Once the green premiums were calculated for the year 2050, we discounted them to the year 2025, using the average discount factor for the past one and a half decades with reference to the Bank of England (2026). This helped us to estimate the present value (PV) of the 2050 green premium for the year 2025.
The interested parties can estimate the financial profit or loss using the above equation. We did not estimate the retrofit cost for today, as this would be highly contextual. Instead, we left that to the reader. Accordingly, they can have an idea of the level at which it is financially favourable to invest in retrofitting. This interpretation is practically valid for a homeowner only if they consider the future value increase in the house, which may not be a common purpose. However, this will also help someone to have an idea of potential value increase by retrofitting, although they need not plan to sell their house at some point in the future. Further, we have not considered the energy bill savings throughout the period, better health and comfort, or the opportunity cost of the retrofit. The calculations are based on assumed scenarios of house price and green premium from 2025 to 2050. Despite these limitations, the findings are highly important to make a rational decision to retrofit a house or not from a financial perspective.
3. Results
3.1. Behaviour of the UK Average House Prices
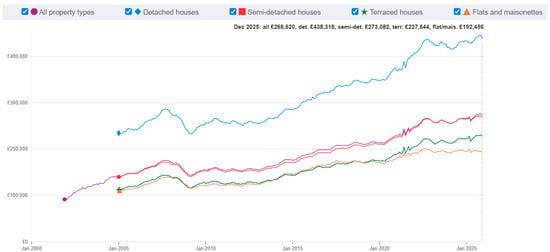
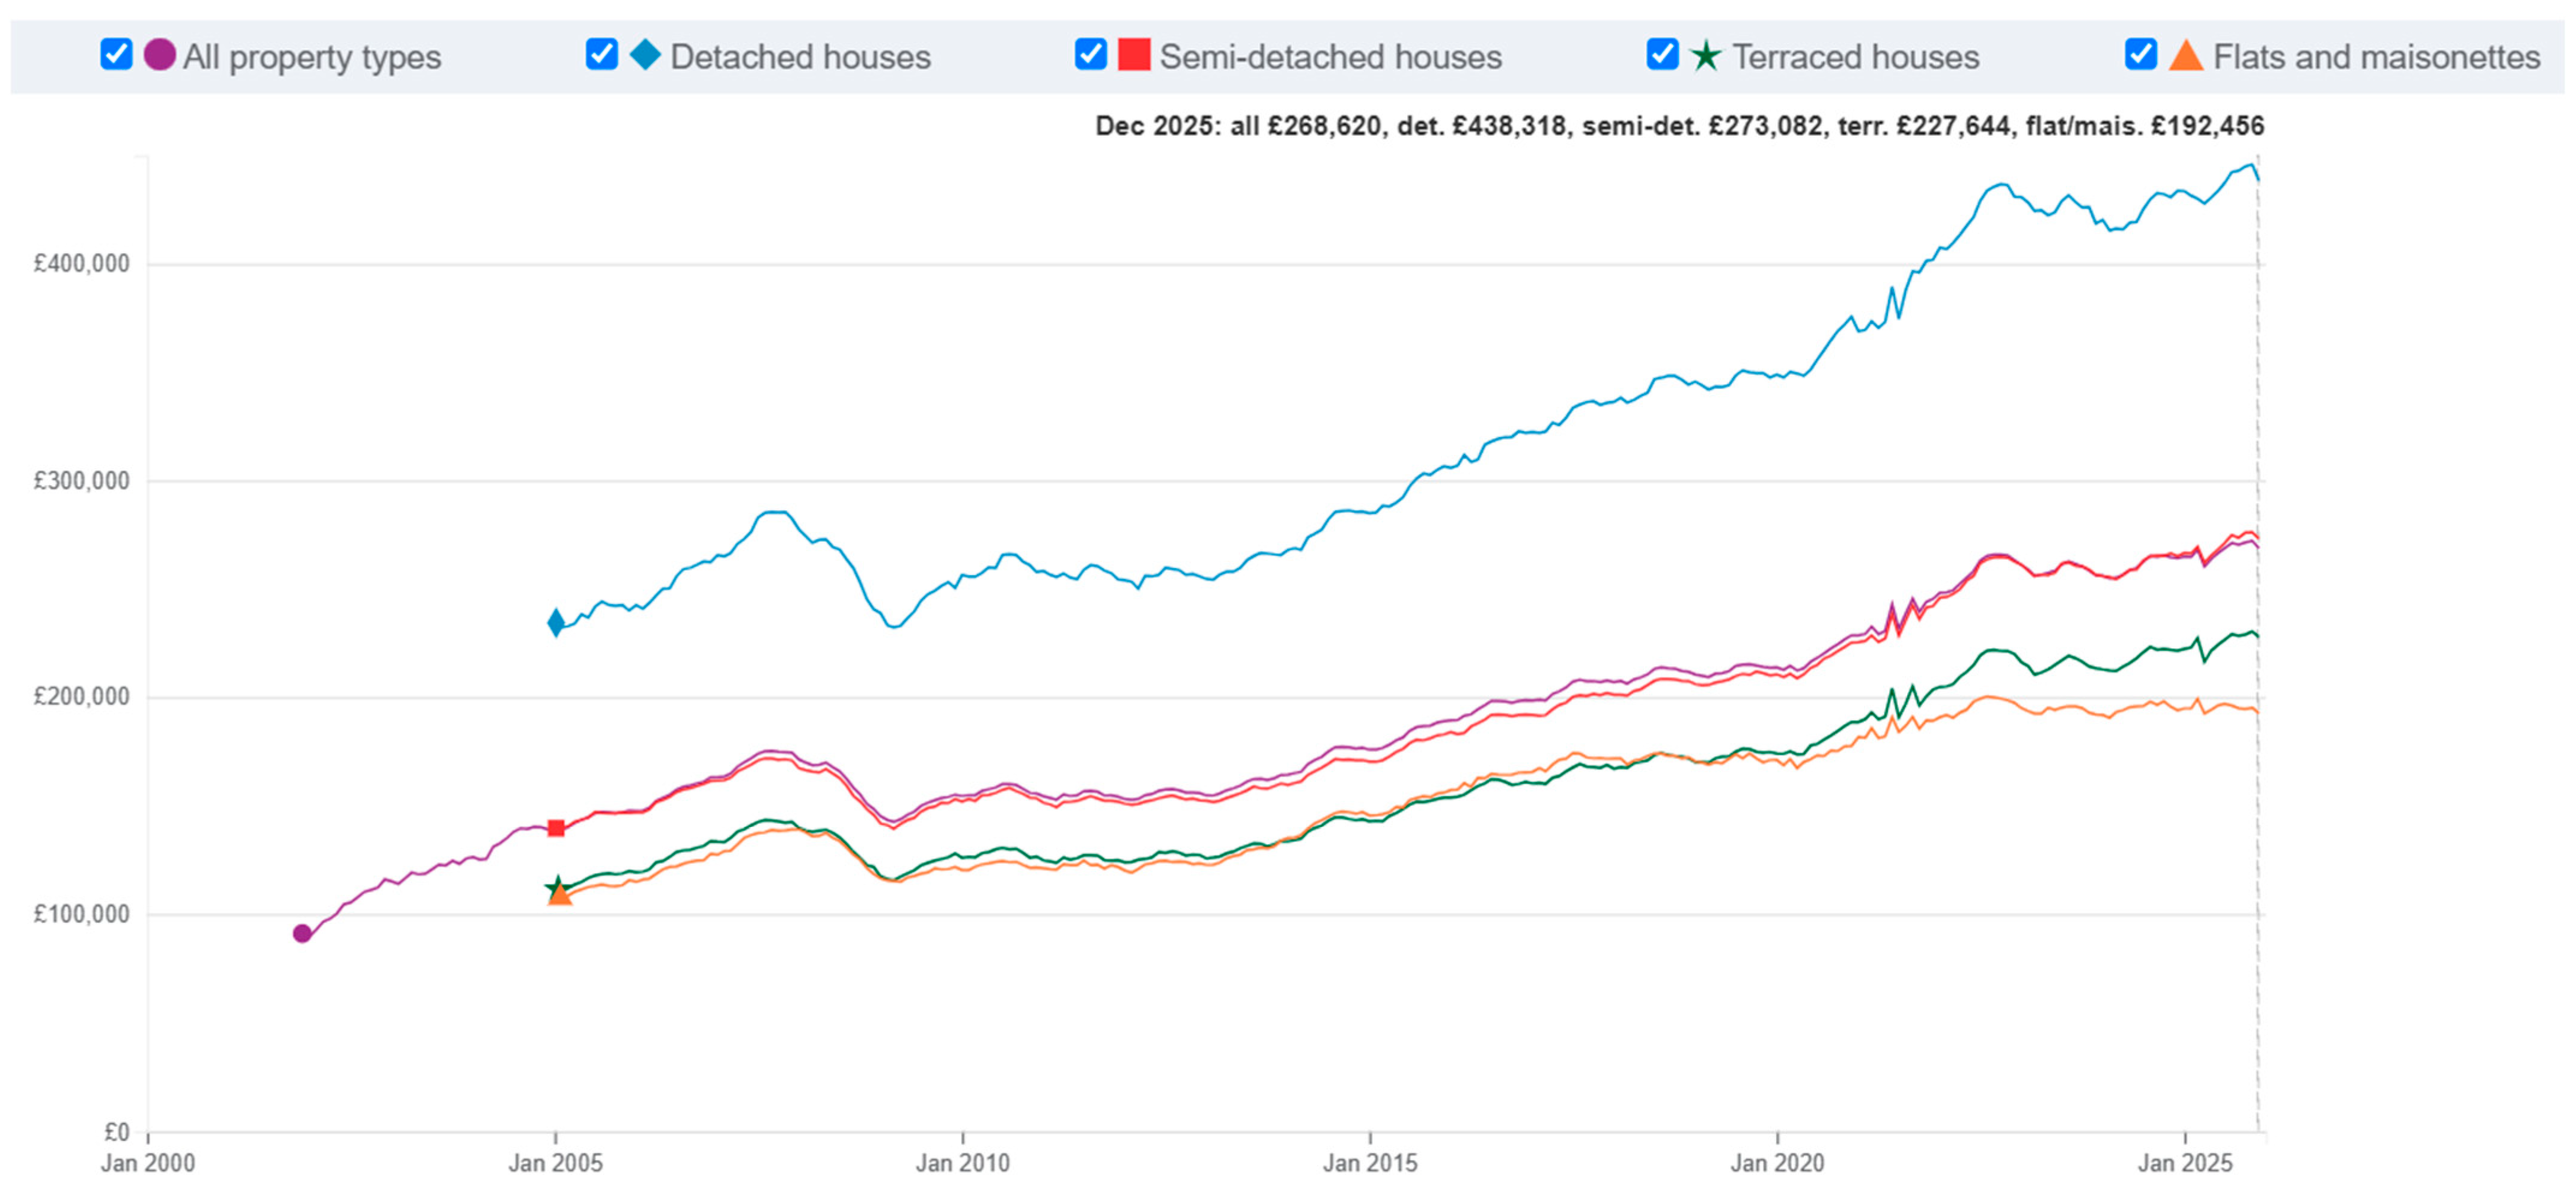
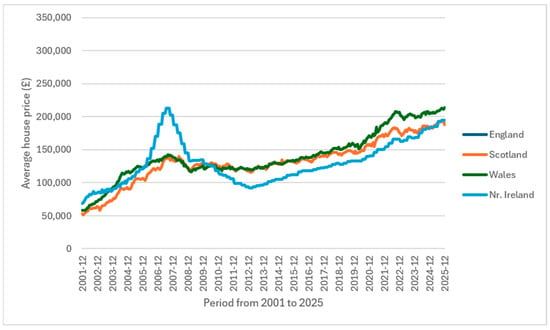
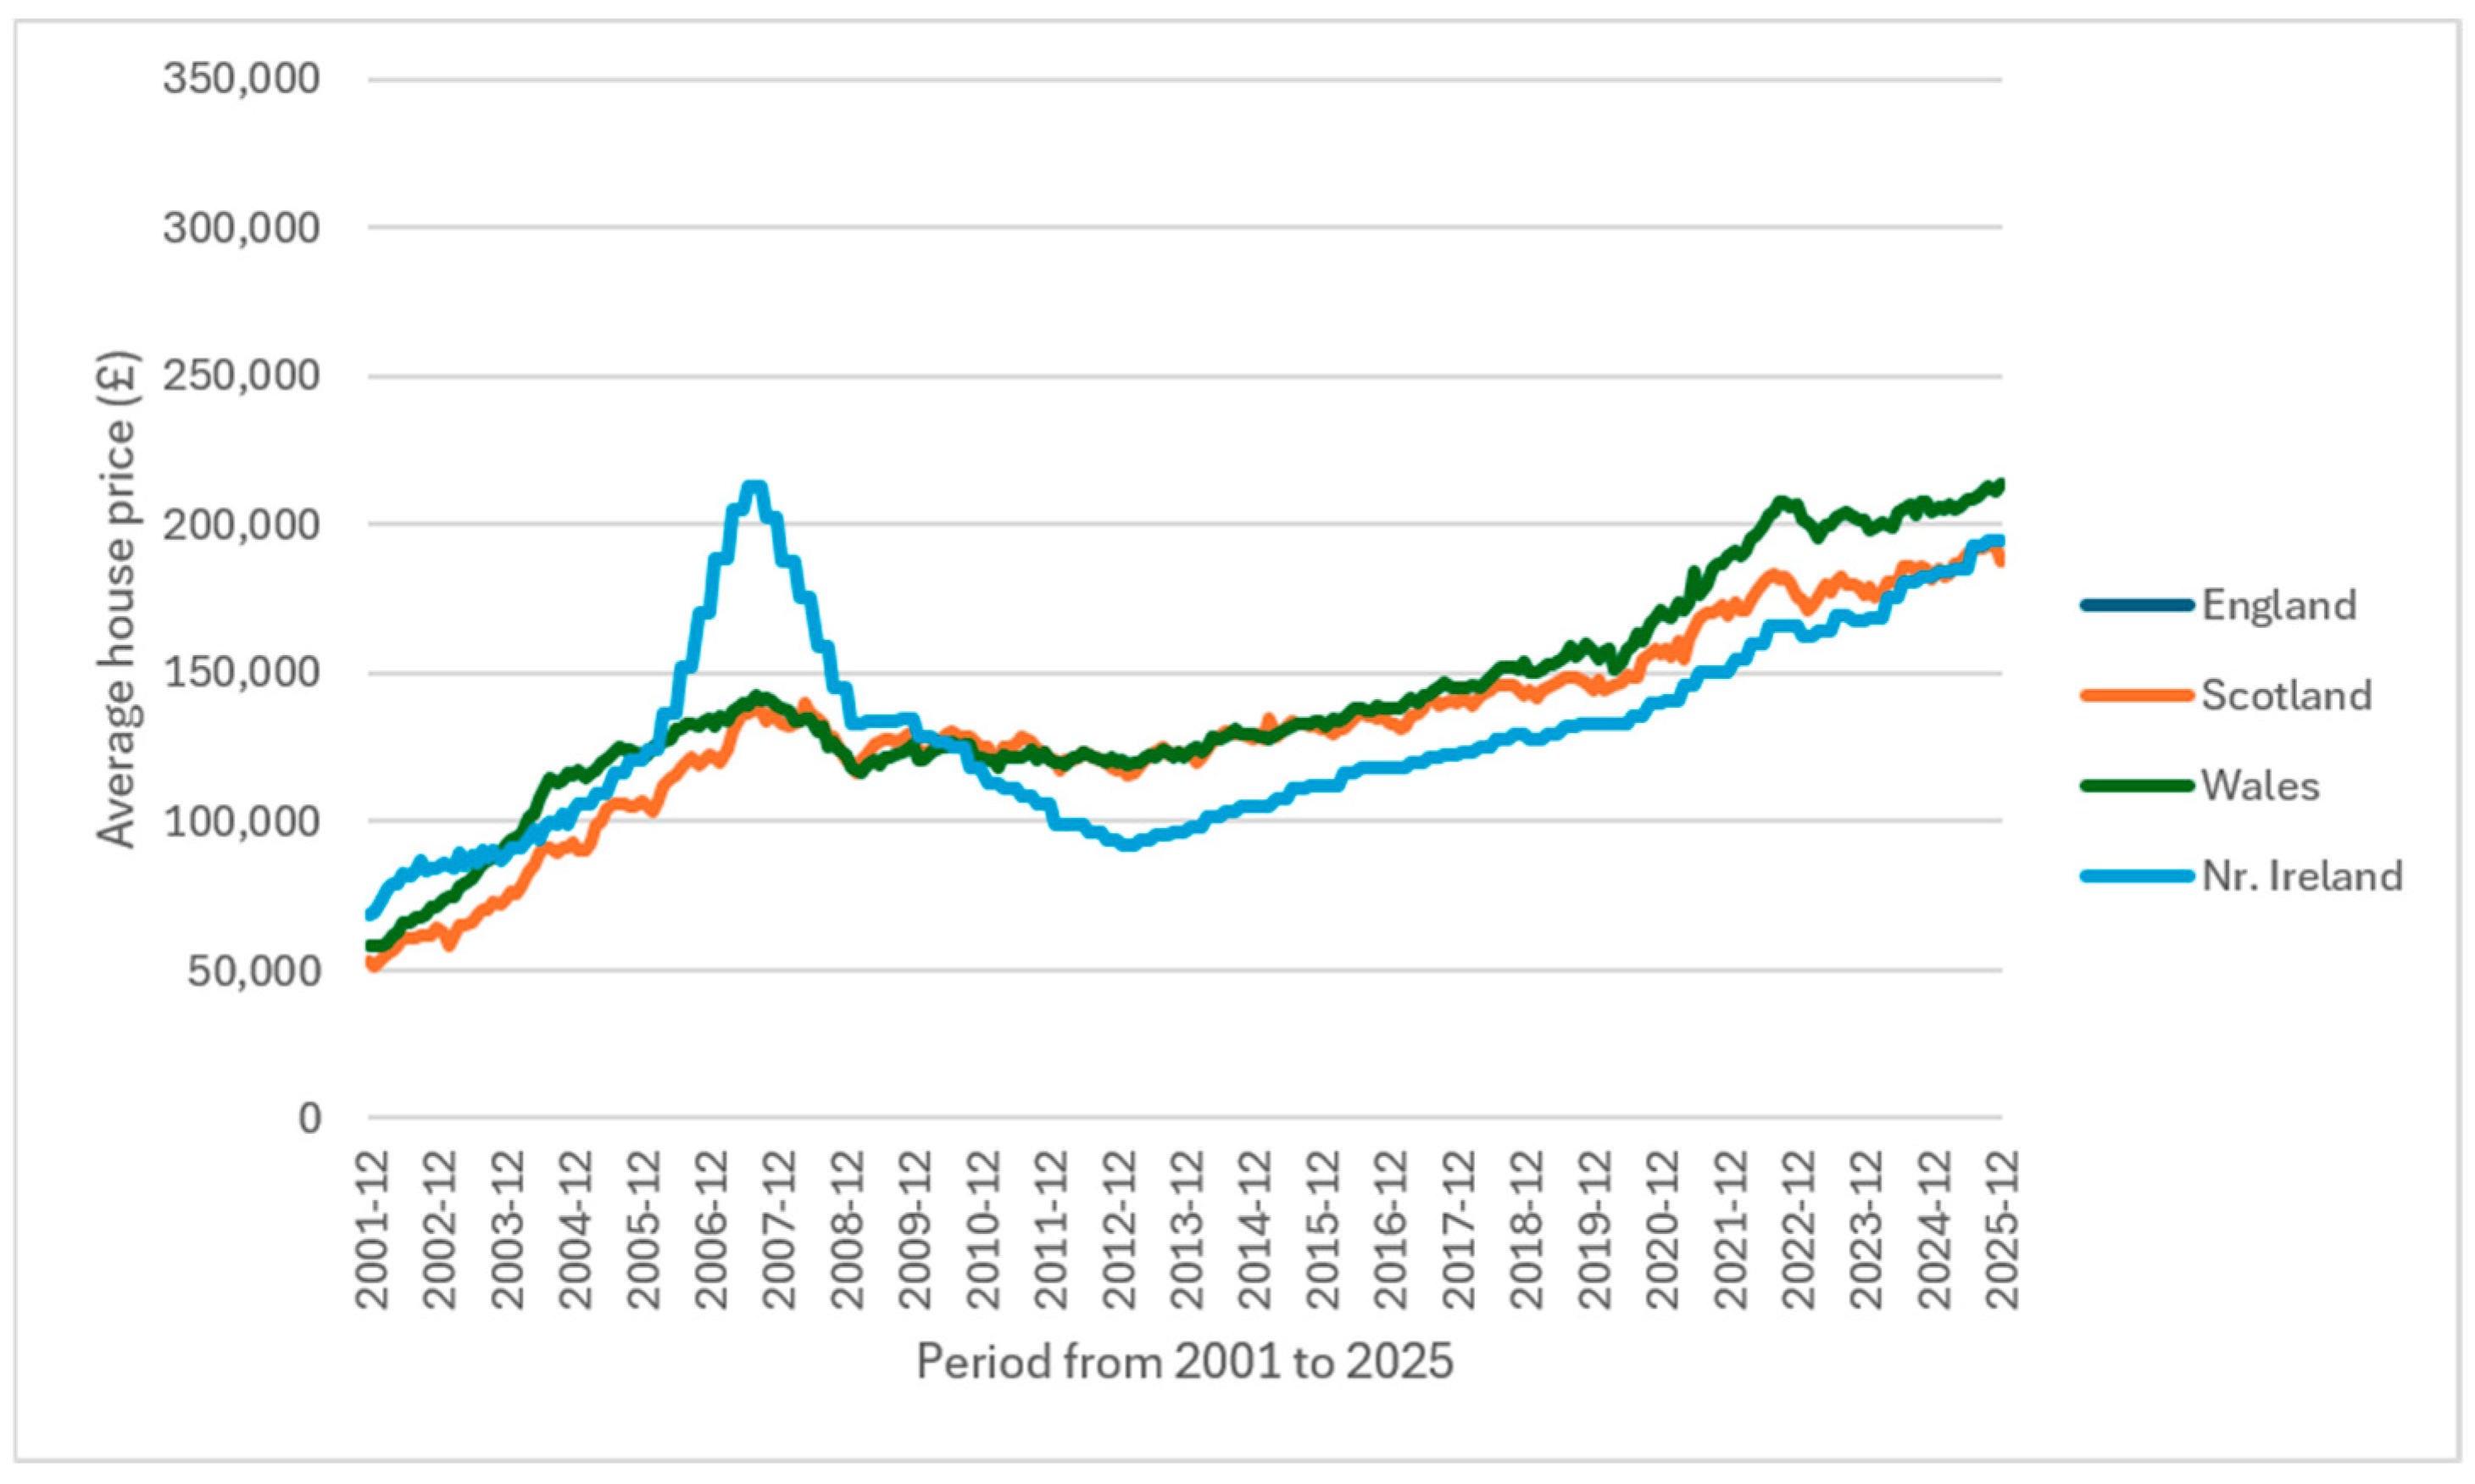
As far as the average house prices are concerned, a steady growth in prices can be observed. The 2008 economic recession is clear in this graph, which has had a substantial impact on the housing market (Duca et al., 2010). The average UK house price is mainly in line with the semi-detached house prices. Detached house prices are observed to follow the trends but have a clear price gap. Figure 1 and Figure 2 show the UK average house price changes under different house types and for different UK nations.
Figure 1.
UK Average house price changes for different house types from 2001 to 2025 (UKHPI, 2026).
Figure 2.
UK average house price changes for UK nations from 2001 to 2025 (UKHPI, 2026).
The house prices seem to be consistent across England, Wales and Scotland, while Northern Ireland shows considerable deviations from the pattern. Although the 2008 recession had a clear impact on the housing bubble during the period, the prices have now started to regularise with the average UK housing market trends. The following Table 1 shows a prediction of house prices by the year 2050 under different house types for different UK nations.
Table 1.
Prediction of house prices by 2050 for different types of houses.
The house prices were projected to the year 2050, using the historical figures from 2010 to 2025. Due to the effect of the 2008 economic recession (Duca et al., 2010), the calculation only considered the figures from 2010 onwards. Using the figures before 2010 made the prediction less rigorous, with higher variations. In order to make the projection more detailed and comprehensive, the calculation was carried out for four types of houses in the four nations of the UK. The house price projection is a conditional input based on the historical data.
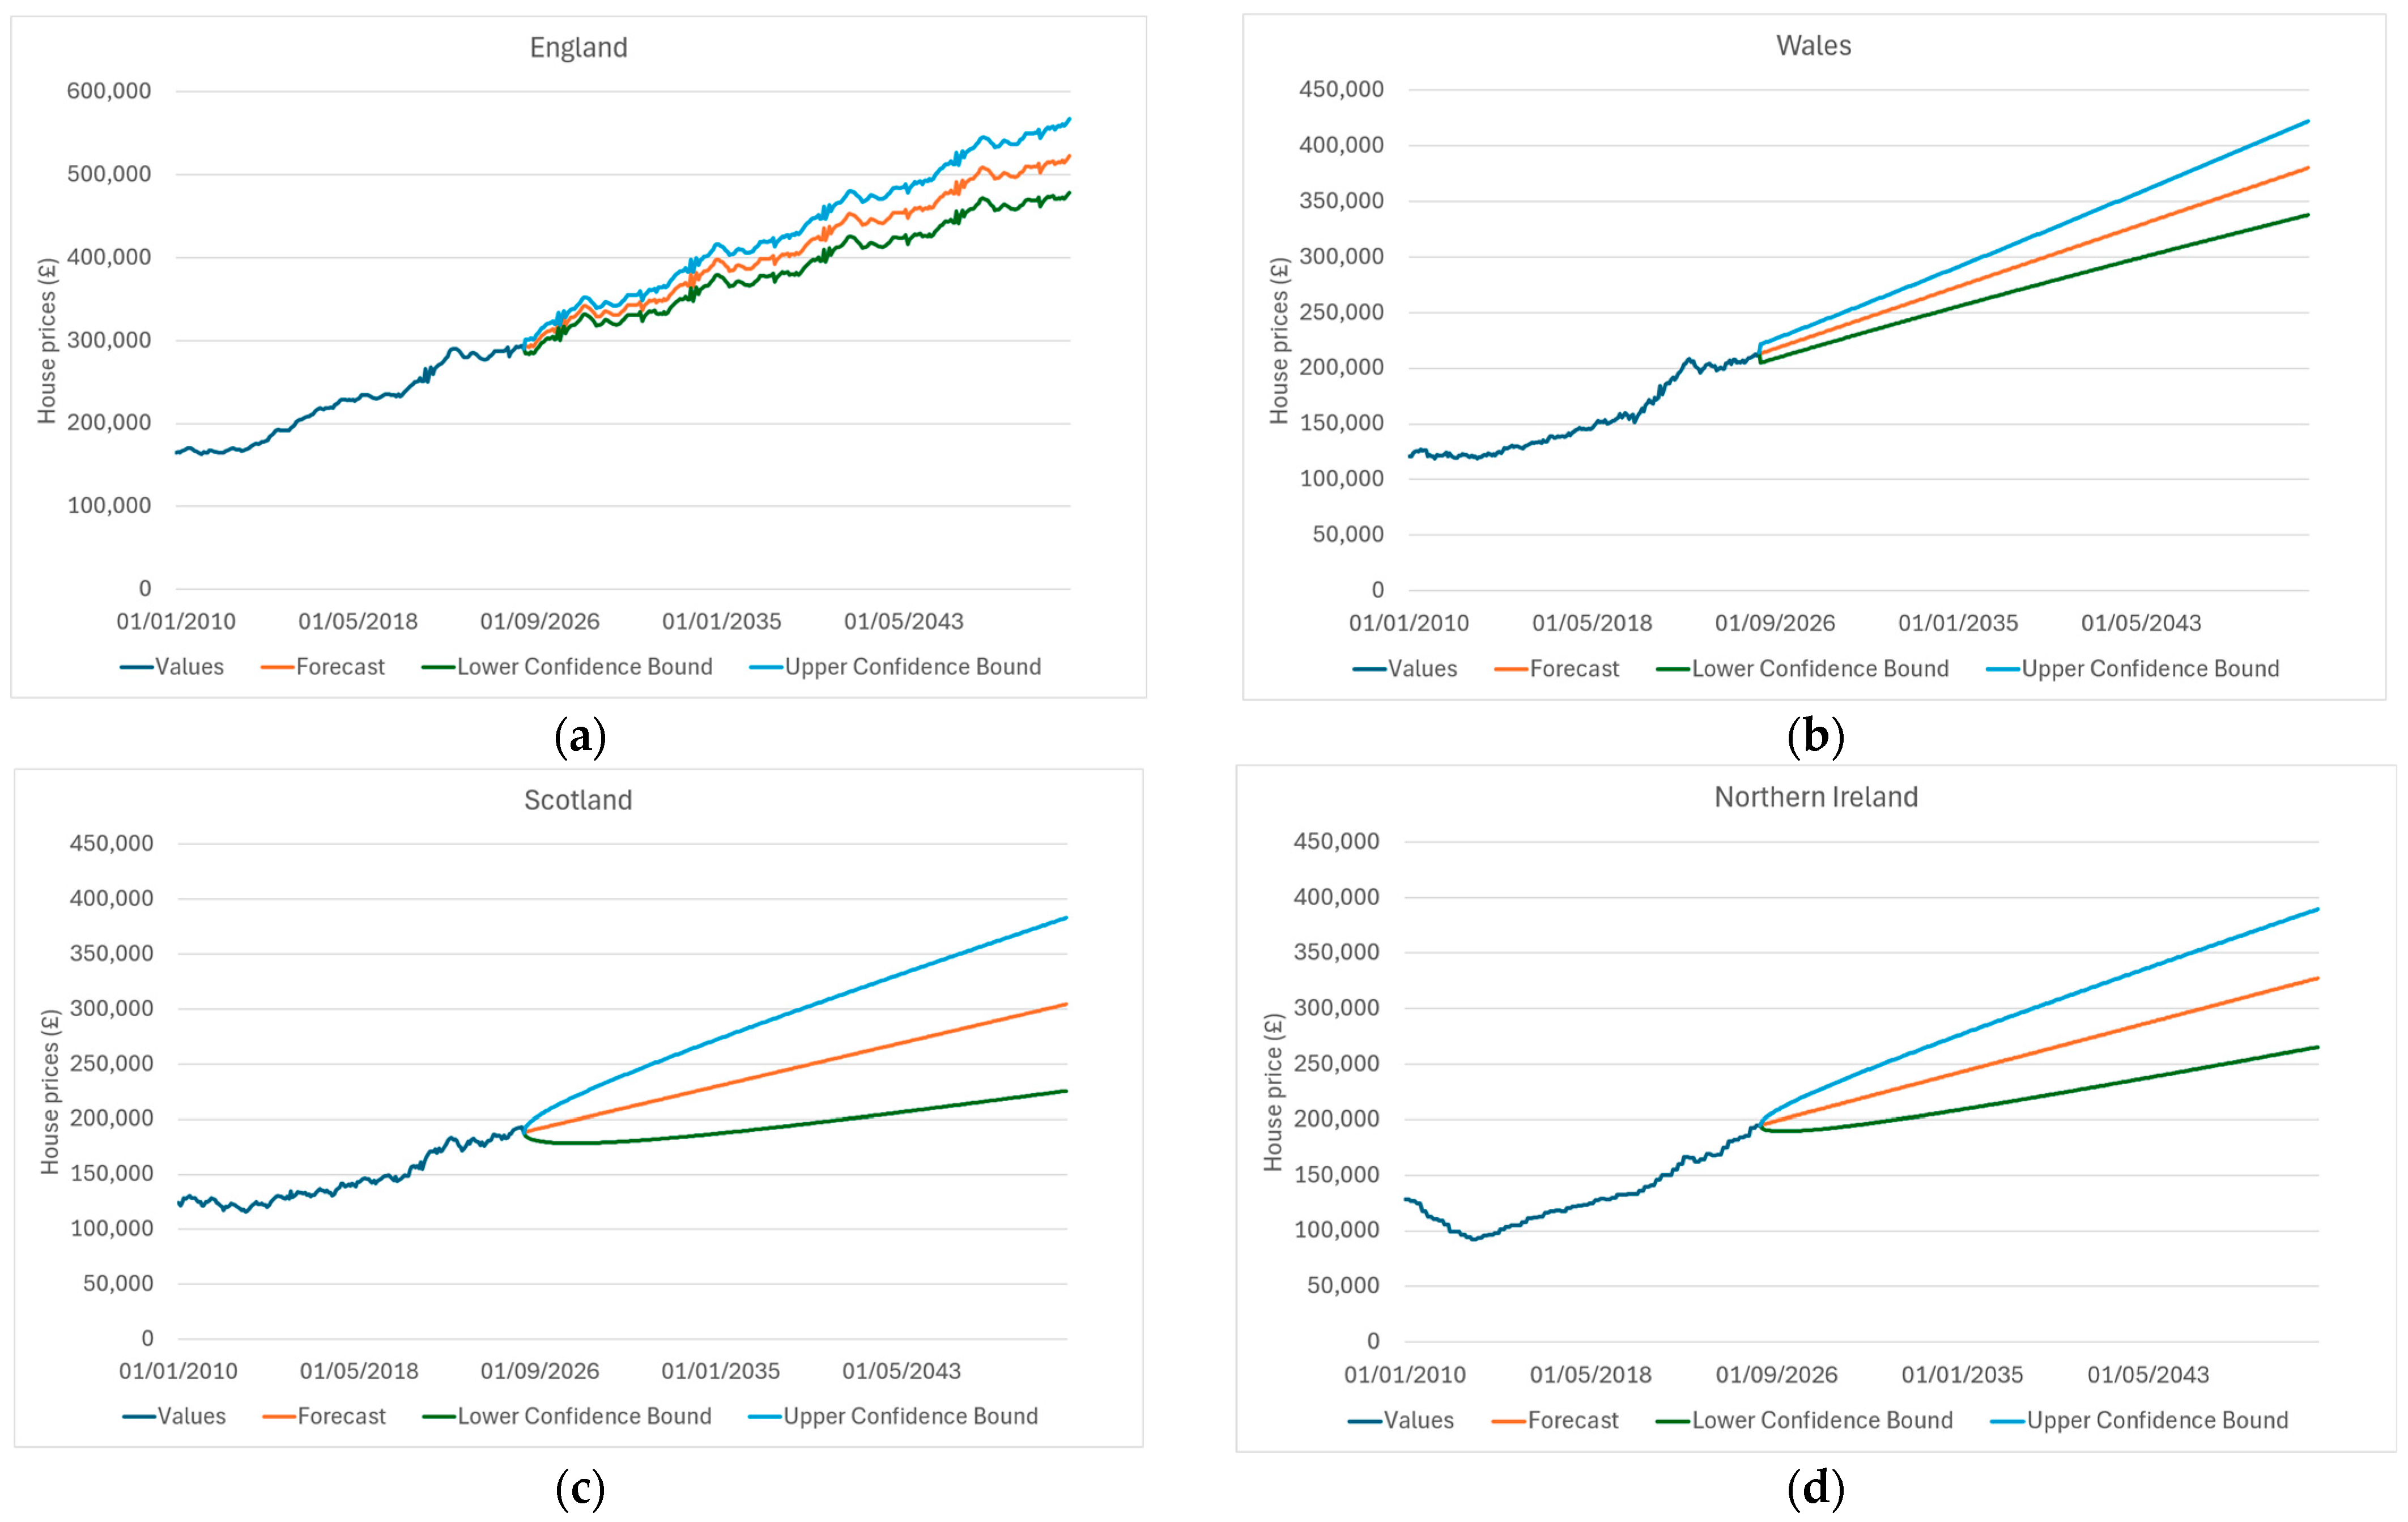
Figure 3 shows an illustration of the projected house prices for the four nations of the UK. In general, all the nations have shown a steady growth in their house prices. Now that we have an idea of the behaviour of house prices in the UK for different archetypes, the next section will focus on the energy efficiency of the UK housing stock.
Figure 3.
Projections of house prices to 2050: (a) England; (b) Wales; (c) Scotland; (d) Northern Ireland.
3.2. Energy Efficiency of the UK Housing Stock
We have reviewed the average energy efficiency of the UK housing stock with reference to the Energy Performance Certificate (EPC) registers of the particular countries (DCLG, 2017). Although there are slight differences in the calculation methodology and these countries maintain their own EPC registers, the assessments are based on the same Standard Assessment Procedure (SAP) developed by the Building Research Establishment (BRE, 2026). In this situation, although there can be slight differences, we have disregarded these and assumed there are no differences among the SAP calculations of all four UK nations.
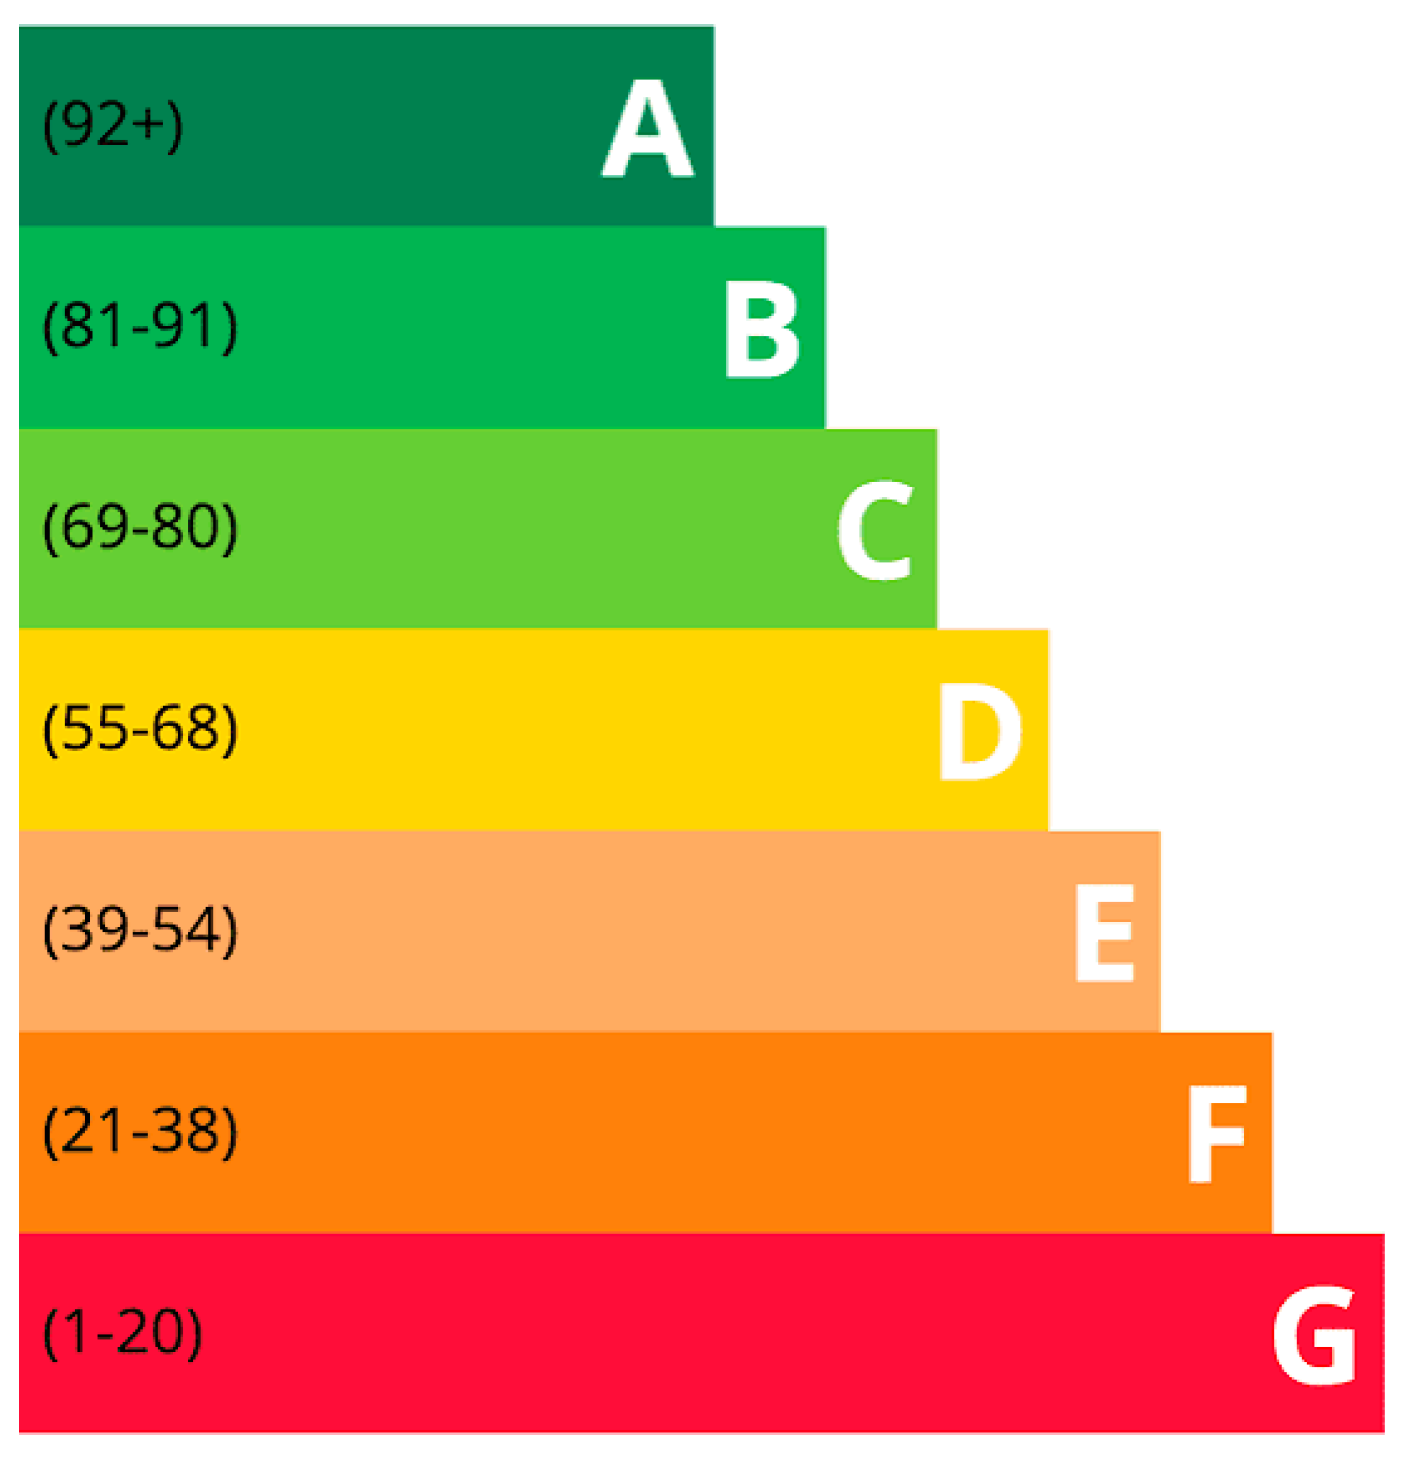
Figure 4 shows the SAP point bands and their corresponding EPC bands. According to the SAP methodology, the energy efficiency of a house is rated in SAP points from 1 to 100; 1 is the least energy efficient and 100 is the most energy efficient. The energy performance certification shows a rating for a property from G to A, according to its SAP rating, with G being the least energy efficient and A being the most energy efficient. We will mainly focus on the SAP rating for this analysis. The EPC bands are more user-friendly for discussion. However, they are not assigned at similar distances to the SAP points (not interval data). We needed the differences in SAP points (∆ SAP Points) for calculation of green premium in 2050 under the expected energy efficiency levels of the housing stock.
Figure 4.
SAP points and the corresponding EPC bands (DCLG, 2017).
Table 2 shows the prediction of 2050 average energy efficiency levels of residential buildings using historical data. We could find reliable data related to England, Wales, and Scotland for this estimation. However, we could not locate proper data to calculate energy efficiency projections for Northern Ireland. In this situation, we assumed these figures were in line with the national statistics. Finally, we calculated the changes in SAP points required for the calculation of green premiums.
Table 2.
Average SAP ratings of residential buildings.
The availability of historical figures related to the average SAP ratings and their evolution is not as robust as the historical house prices. However, the general expectation of the SAP level increase is in line with the predictions. The current average SAP level corresponds to EPC band “C” in general, marginally above the “D” band according to our analysis. The majority of the new-build houses have either EPC band “A” (20.3%) or “B” (67.7%) for England and Wales in 2025 Q4 (MHCLG, 2025). It is estimated that 20% of the housing stock in 2050 would be built after 2025 (LETI, 2021). The government is also planning to totally phase out gas heating before 2050 (DBEIS, 2021), which would add further points to the SAP calculation. Considering the gradual retrofitting of the existing houses and all other factors, our projection of the average SAP rating by 2050 being either “A” or “B” can be a realistic assumption. (According to our projection, the average SAP level is from 86.2 to 94.9. This corresponds to EPC bands A and B.)
3.3. Estimation of Green Premiums
It is important to highlight that these calculations are done assuming the aggregate levels of energy efficiency changes in the housing stock, not by assuming a case study of a single house. At an aggregate level, we can assume green premiums for different energy efficiency levels, which may not be true if we focus on individual houses. Further, it could be more theoretical if we use the term “brown discount” for the illustrations mentioned below. To keep things simple and avoid confusion, we decided to keep using the term “green premium”.
We first projected an average future house value based on historical data. Then, we presented the breakdown of the house price (reference price + green premium). The reference house price is the value of a non-retrofitted house in a housing stock of increased energy efficiency. For example, if the England terraced house average energy efficiency is increased by SAP 25.9 points from 2025 to 2050, a non-retrofitted house will be sold for £35,288 less than the predicted price of £325,170, which is equal to £289,883. Accordingly, £35,288 is a brown discount.
Table 3, Table 4, Table 5 and Table 6 show the estimated green premiums for England, Wales, Scotland and Northern Ireland, according to the chosen levels of energy efficiency. If the energy efficiency level is the same, there is no green premium as the increase in SAP points is zero. We assume the green premium increases linearly as the energy efficiency level increases.
Table 3.
Green premium for an average house in England.
Table 4.
Green premium for an average house in Wales.
Table 5.
Green premium for an average house in Scotland.
Table 6.
Green premium for an average house in Northern Ireland.
3.4. Illustrating Different Energy Efficiency Levels and Their Selling Prices
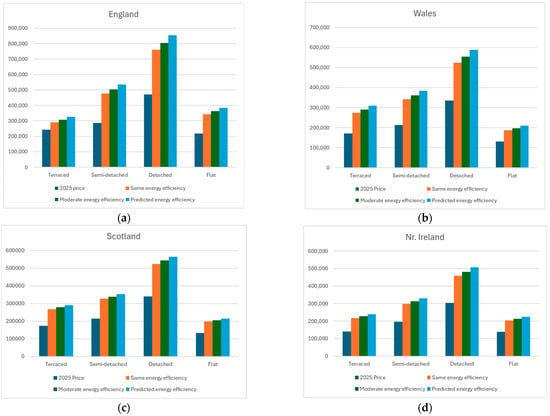
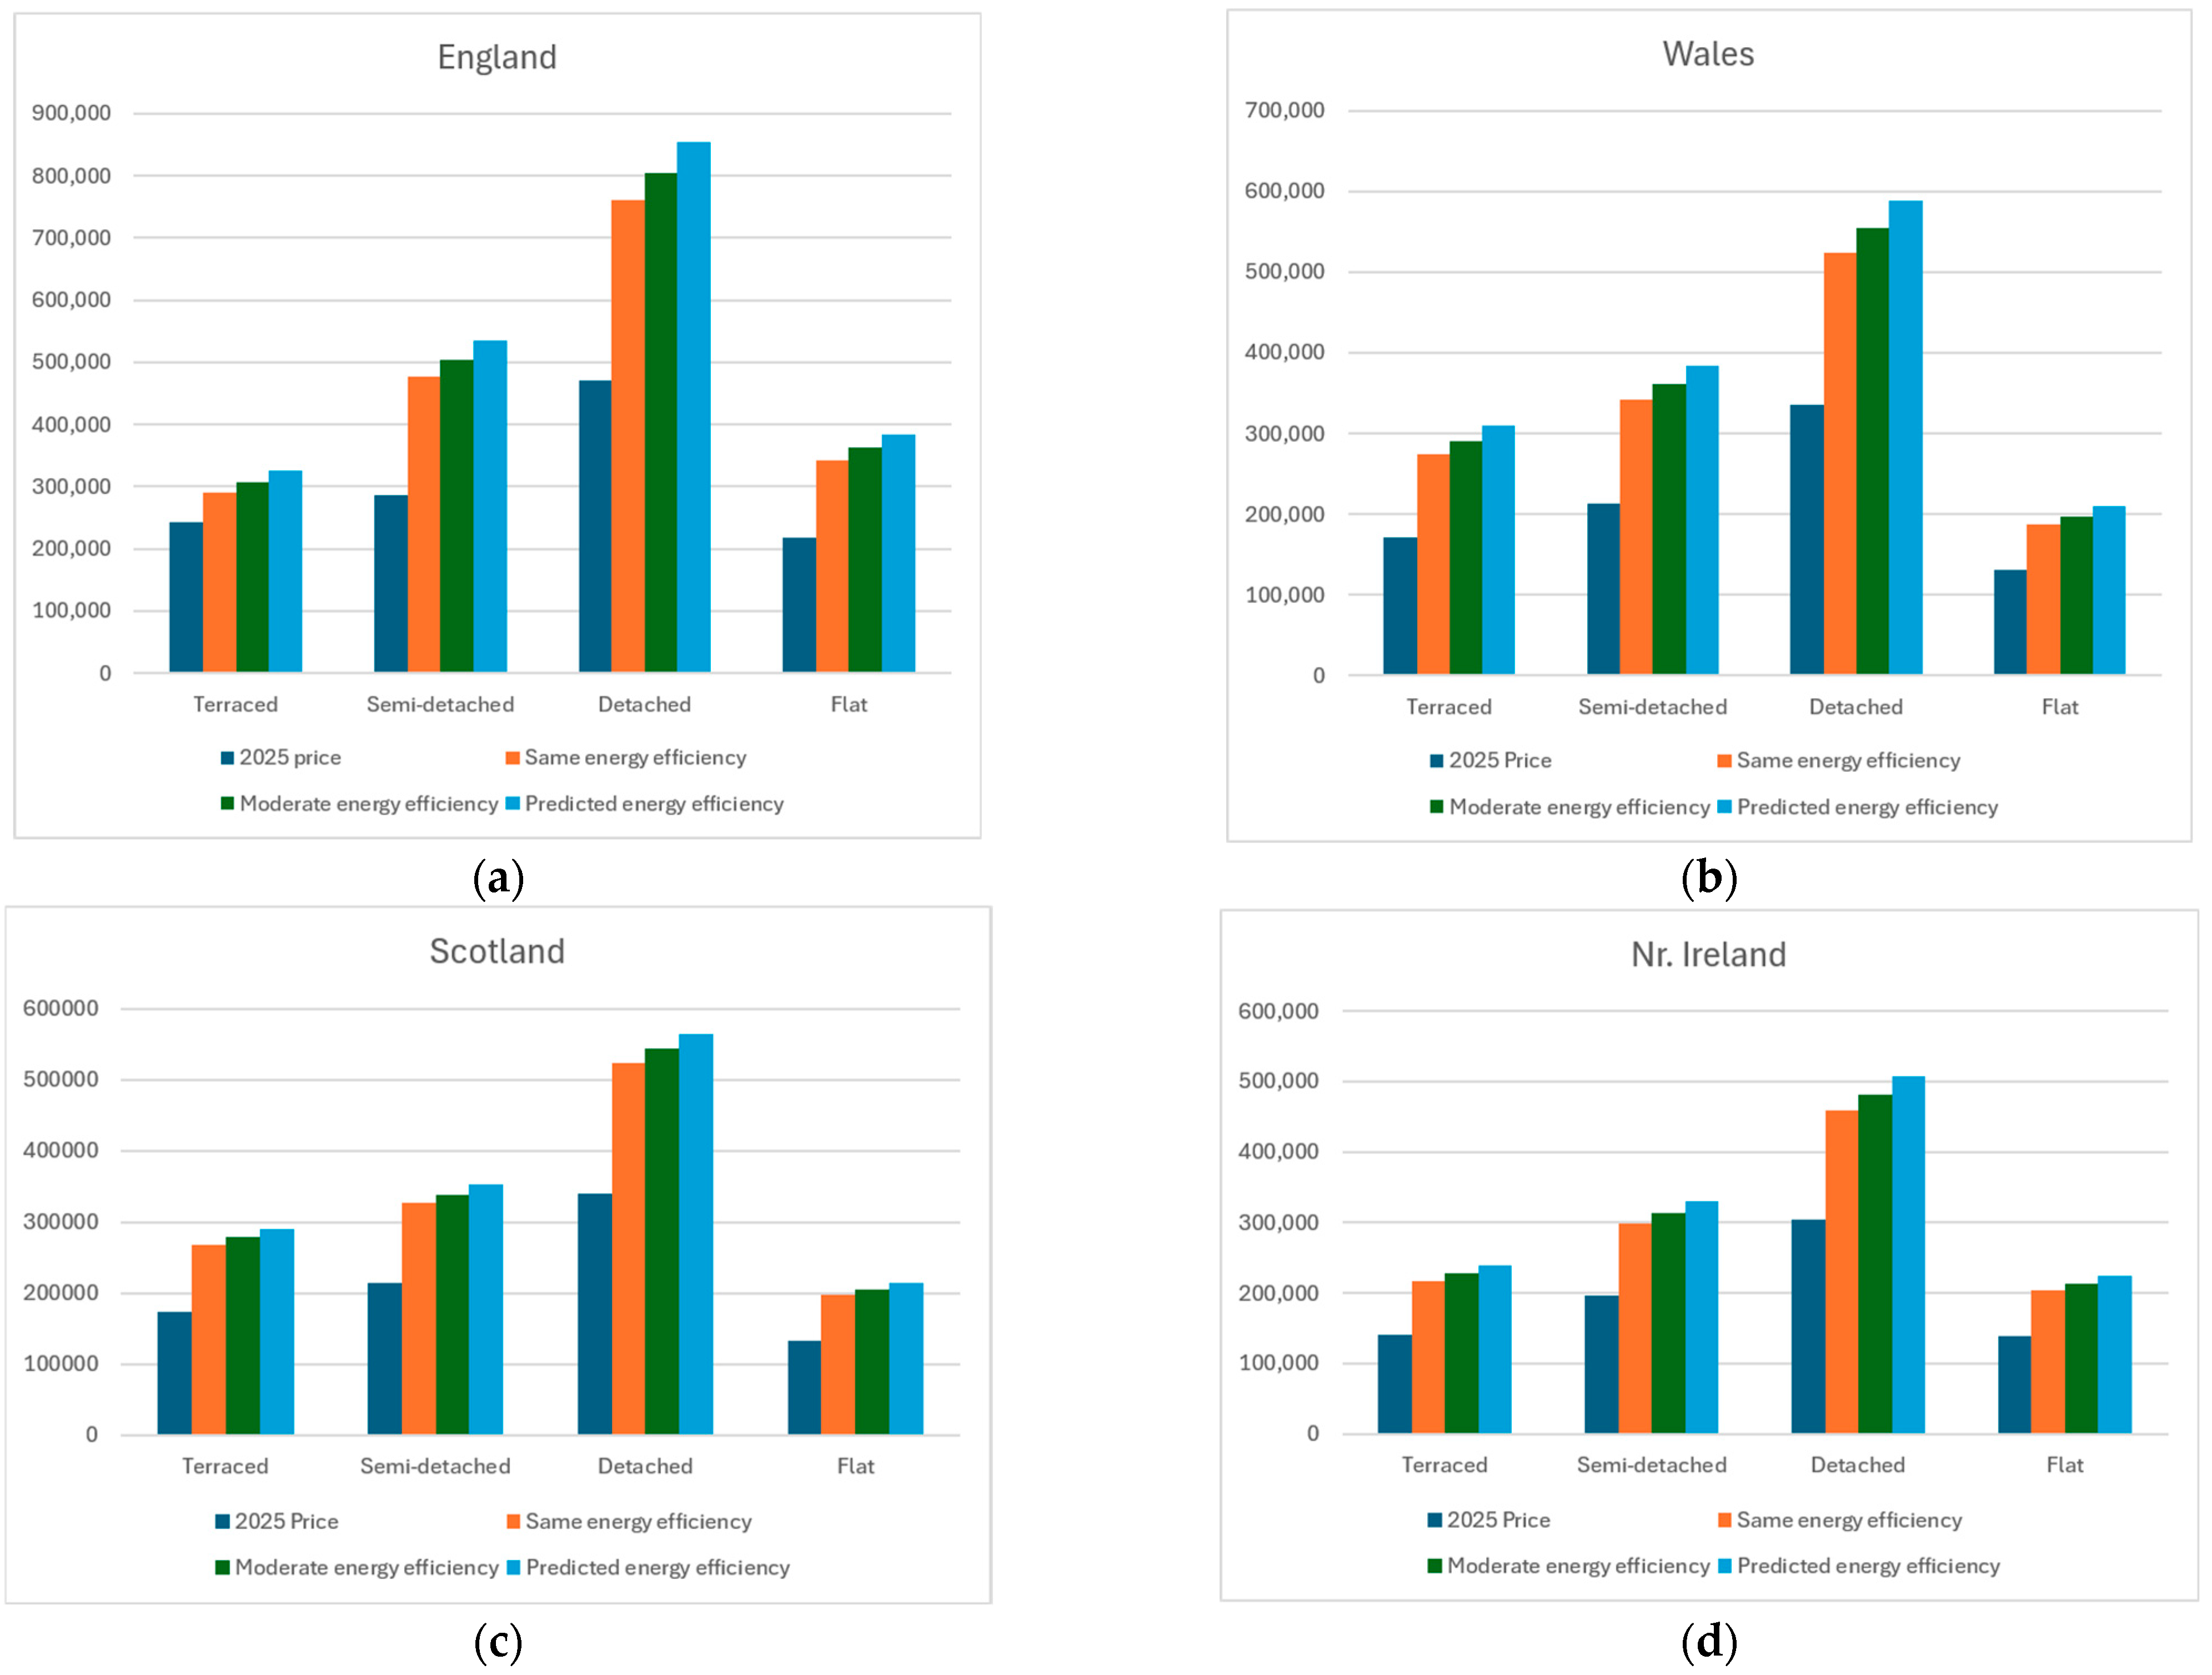
We showed the projected green premiums in 2050 in the previous section. In these presentations, we assumed that projected sales prices of the houses are the same and are irrelevant to the existence of a green premium. This was because we projected the house prices by referring to the historical house price fluctuations. This means the house prices remain the same, irrespective of the amount of green premium included in the selling price. This is a calculation at the aggregate level. Now we are focusing on the scenarios for individual houses and their level of energy efficiency.
According to the illustrations in Figure 5, if we consider a single house, there will be a price increase from 2025 to 2050. First, this can be due to inflation and a number of other reasons under the hedonic price model. Secondly, there will be a price increase due to the additional green premium or brown discount based on the property’s energy efficiency, influenced by the aggregate energy efficiency of the housing stock.
Figure 5.
House price illustration between 2025 and 2050: (a) England; (b) Wales; (c) Scotland; (d) Northern Ireland.
3.5. Application of Discount Rates to Green Premium Calculations
Once the green premiums in 2050 are calculated, we now discount them to the year 2025. We used the average maximum deposit rate from 2011 to 2025 as the discount rate. Referring to the Bank of England’s published figures, sterling one-year fixed-rate cash ISA deposits carry the highest potential deposit rates. We considered the opportunity cost of a prospective homeowner investing in this low-risk investment, rather than investing that money in retrofitting their house. The average (January 2011–December 2025) maximum potential interest rate for savings is 2.04% (Bank of England, 2026). We used the monthly average figures published by the Bank of England for the given period and averaged them. Please refer to the Supplementary Data for the calculation. The rationale is that the homeowner with savings (sufficient to retrofit their house) can either save them in a bank to earn interest or retrofit their house to enjoy the benefits of retrofitting, including the future green premiums. However, we would like to emphasise that while the use of the aforesaid rate is the most rational, it is treated as an illustrative opportunity-cost figure, rather than a factual discount rate.
Table 7, Table 8, Table 9 and Table 10 depict the green premiums of 2050, discounted to 2025 at the rate of 2.04% annually. These calculations are given for four archetypes of houses and for four nations of the UK. Furthermore, the present value is given as a percentage of the current value of the house.
Table 7.
England 2050 green premiums discounted to 2025.
Table 8.
Wales 2050 green premiums discounted to 2025.
Table 9.
Scotland 2050 green premiums discounted to 2025.
Table 10.
Northern Ireland 2050 green premiums discounted to 2025.
4. Discussion
4.1. Factors Affecting the Green Premiums
A study carried out in 2017 argues that there is no green premium unless there are green rating systems. In order for the buyers to differentiate between green and non-green buildings, there should be a rating mechanism (Oyedokun, 2017). Another study has endorsed the existence of a green premium in London in relation to BREEAM-certified green buildings. Higher BREEAM ratings correspond to higher price premiums and rental premiums (Addae-Dapaah & Wilkinson, 2020). While there is an energy rating system already available, there can be numerous factors affecting the existence of green premiums in 2050. One factor can be identified as future energy prices.
In a situation where energy prices are a key household expenditure, people will be seeking to buy more energy-efficient houses. As of 2025, 11% of households in England, 14% in Wales, 34% in Scotland, and 24% in Northern Ireland are classified as fuel poor (Paul & Suzanna, 2025). This means millions of households in the UK cannot afford to heat their houses to the recommended levels. People will seek to buy fuel-efficient houses in this scenario. If fuel poverty is reduced, either by reducing fuel prices, finding alternative cheaper fuels, or increasing household income, people will have less willingness to pay for energy efficiency. Considering the rising energy costs since the COVID-19 pandemic, energy-efficient houses can become increasingly attractive. However, we did not model any future energy price changes or their influence on house prices in this study.
Another factor is buyer awareness. The green premium can increase when people become aware of either energy costs or environmental issues (Ou et al., 2026). It is a question of whether people’s awareness will increase or decrease by the year 2050. Government policies will also be a key factor in determining the green premium in the year 2050. From one point of view, they will influence energy prices as well as energy efficiency through building regulations, as well as policies such as Minimum Energy Efficiency Standards (Gov.uk, 2017). They also influence affordability for homeowners to go for green retrofit measures. For example, the Warm Homes retrofit grant scheme is currently available in England (DESNZ, 2026). However, there are criticisms of the government policies due to their negative influence on the energy efficiency of the building sector (Panakaduwa et al., 2024).
The projection of house prices is based on the historical figures. These historical figures are directly from the Land Registry (UKHPI, 2026) and represent all the transactions in the given period. There are incidents such as the 2008 economic recession (Duca et al., 2010) that can influence the price projections. One potential cause of house prices decreasing more than expected is government policies related to the housing supply. The UK government expects a supply of at least 300,000 new houses per year in England (MHCLG, 2018). However, the current supply is around 170,000 (MHCLG, 2026). If the government puts radical measures in place to increase the supply, house prices can decrease due to the law of demand and supply.
4.2. The Role of Green Premium
Our purpose is to examine the potential capitalisation of retrofit-related green premiums into future house prices, rather than to estimate the economic return on retrofit investment. We assume the existence of a 0.0047 green premium coefficient per SAP point, linearly distributed across all SAP bands. We evaluated scenarios related to energy efficiency levels of the houses. There are three scenarios in 2050; same energy efficiency, moderate energy efficiency and predicted energy efficiency. Predicted energy efficiency is when the average energy efficiency of the housing stock is in line with the projections, reaching the higher EPC bands such as A or B. This is detailed in Table 2.
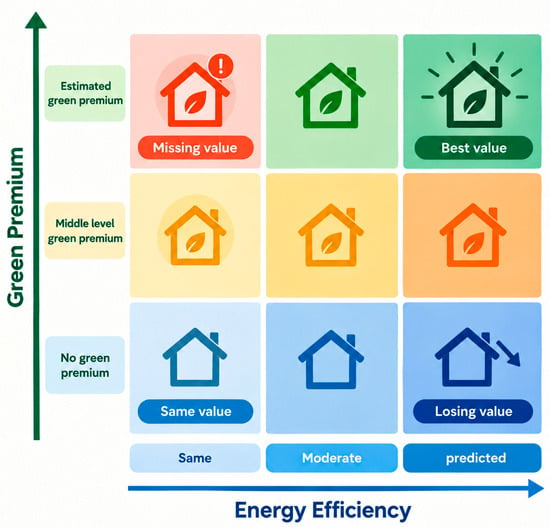
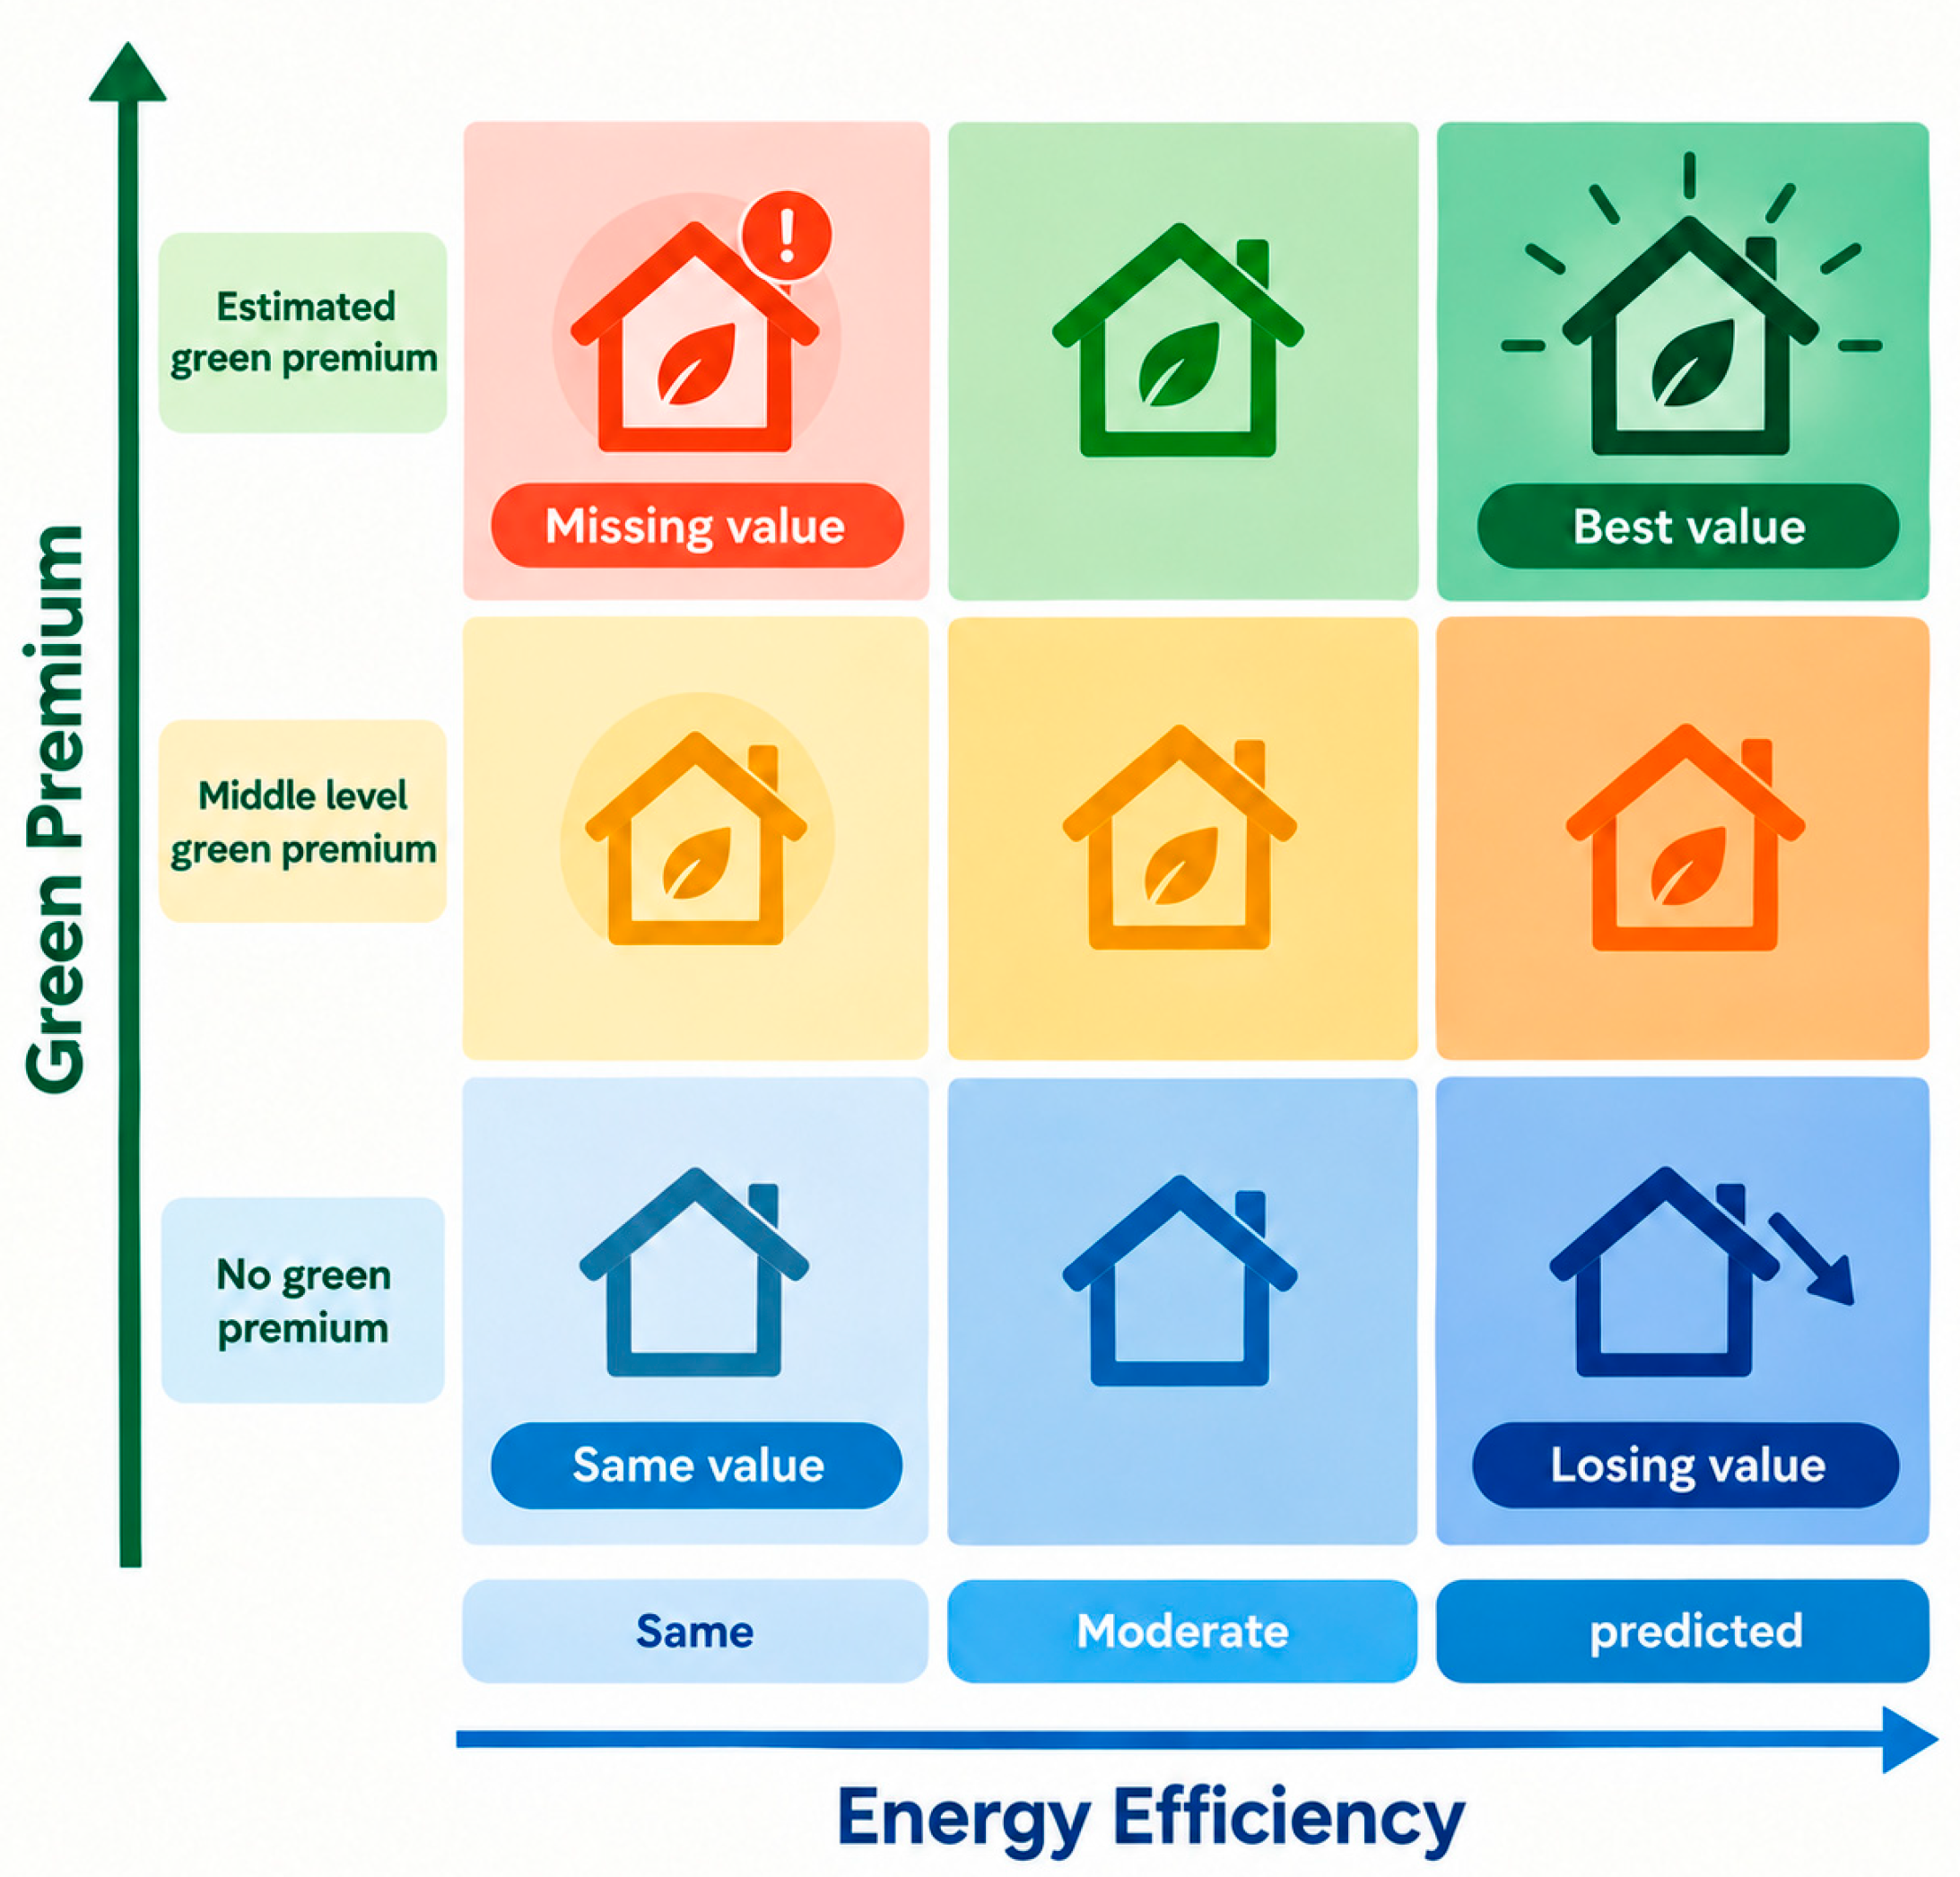
We also assumed three scenarios of future green premiums for discussion purposes. No calculations were made to prevent the study from being overly complex. The first is the scenario in which there is no green premium. This means there will not be any green premium in 2050. Then, we assume the current level of green premium, which is a 0.0047 green premium coefficient per SAP point. We also assume a middle level of green premium scenario for comparison purposes. Taking these three scenarios for energy efficiency and the other three scenarios for green premiums, we developed a matrix.
According to the matrix shown in Figure 6, we can assume four potential scenarios for a homeowner. The first scenario is no green premium and the same energy efficiency. This is when no green premium exists in 2050, and the homeowner has not retrofitted their house (which existed in 2025). In such a scenario, the homeowner is in an indifferent situation. They have not accumulated any value, and there was no expense. Although this situation is financially neutral, the homeowner has lost the benefits of retrofitting, such as energy bill savings, better health or comfort.
Figure 6.
Green premium and energy efficiency matrix.
The second scenario is the estimated green premium and predicted energy efficiency. This is when the existing 0.0047 green premium coefficient per SAP point continues and the homeowner has retrofitted their existing house (in 2025) to a higher level of energy efficiency. Since the homeowner has retrofitted the house, they can sell the house at a higher price, and they can also enjoy other benefits such as energy bill savings, better health or comfort.
The third scenario is in which there is no green premium but energy efficiency is predicted. The homeowner has retrofitted their existing house to a higher level of energy efficiency. However, since there is no green premium, they will not be able to secure an additional premium in their house selling price. Buyers will not differentiate between energy-efficient and non-energy-efficient houses. Retrofitting the house is not financially favourable in this scenario from the point of view off the real estate industry. The homeowner can still enjoy the retrofit benefits such as energy bill savings, better health or comfort.
Finally, there is a scenario of an estimated green premium but the same energy efficiency. Although the green premium exists, the homeowner has lost a potential investment opportunity due to not retrofitting the house. Furthermore, the homeowner has lost the retrofit benefits, which could have been enjoyed alongside the house price increases. We have not reviewed the other parts of the matrix to keep the discussion succinct.
4.3. Illustrative Sensitivity Analysis
We conducted an illustrative sensitivity analysis for an average England terraced house for discussion purposes. An average terraced house in England is estimated to be valued at £ 243,230 as of 2025. We assumed four green premium levels: zero, half baseline, baseline (London 2021) and double the baseline. The reference house price is the value after deducting the green premium from the projected 2050 house price. We also assumed two discount factors: first, the estimated 2.04% according to the analysis and second, a representative 5% discount factor.
In Table 11, the green premium fluctuates significantly based on the coefficient. This can significantly change the decision-making of the homeowner to retrofit or not to retrofit the house, since a lower coefficient leaves a marginal green premium for a property. When these green premiums (future value) are discounted to the present day (present value), they may not leave a considerable value to stimulate a retrofit decision for discount levels below a half baseline. However, the current baseline green premium level provides a considerable value at the estimated 2.04% discount rate. In general, lower discount rates (below the estimated 2.04%) and green premium rates over the current baseline (0.0047 or higher) may provide a considerable financial incentive to the homeowner to retrofit their house.
Table 11.
Illustrative example of sensitivity analysis for an average England terraced house.
4.4. Recommendations for Decision-Making
Importantly, the present value of the green premium in 2050 matters to make retrofit decisions today. We have discounted the green premiums to 2025 for this purpose. Then we presented them as a percentage of the current value of the house. If a homeowner can spend less than this percentage to retrofit their house to the predicted energy efficiency level according to SAP calculations, that investment is financially viable. If the retrofit cost is more than this percentage, it could be financially favourable to earn interest by depositing the money in a bank, where the risk is lower. For example, an English homeowner living in an average terraced house shall invest a maximum of £21,300 to retrofit their house from SAP points 69 to 94.9 (EPC band C to A) in 2025. We would also like to point out that this is only an illustration. It is not guaranteed that a house can be retrofitted as per these illustrations. Each retrofit scenario needs to be evaluated case by case.
If the energy efficiency of an existing house is lower than the projected level, it may not be sold at the projected price in 2050. Instead, it is most likely to be sold at the projected price minus the estimated green premium (termed as the brown discount (McCord et al., 2024)). The existence of a brown discount is validated in the literature. Munir et al. (2026) identified a negative interaction between CO2 emissions and house prices across 18 European countries. This can be interpreted as evidence of a brown discount in high-emission economies (Munir et al., 2026). Another study has shown that the effect of the brown discount is amplified at lower energy efficiency levels. This effect is more apparent in high-value properties (Geske, 2022; McCord et al., 2020). Furthermore, evidence suggests that the capitalisation of energy efficiency into residential property values is heterogeneous and non-linear, with the value effects depending on the level of energy efficiency, property characteristics and buyer willingness to pay (Geske, 2022).
5. Conclusions
The case for retrofitting houses today is justified from different points of view. While most of these justifications are based on the financial payback analysis and investment focus (BSI, 2023), some researchers argue that the retrofit justifications should be based on non-financial factors such as better health or comfort (Panakaduwa et al., 2026b). In this paper, we have focused on the green premiums due to energy-efficient retrofits in the UK housing market. Our key question is how green premiums in 2050 will inform retrofit investment decisions in today’s UK housing market.
By focusing on the results and the discussion, we can come to several important conclusions. First, all the present values of 2050 green premiums for all the house types in all four UK nations are substantial for the predicted level of retrofit. This is an average of 11% in England, 12% in Wales, 7% in Scotland, and 10% in Northern Ireland, presented as a percentage of the current house price. According to our assumed scenarios of house price and green premium, there is a strong case to spend on retrofitting the house up to these given percentages to EPC’s “A” or “B” level (this study did not calculate whether these percentages are sufficient or not for the proposed retrofit levels). Secondly, homeowners may not be able to sell their house at the predicted average price if they did not retrofit their house under the assumed scenarios. This does not apply to someone who does not want to sell their house in 2050. The third conclusion is the most important. Irrespective of whether the house is sold or occupied, the residents of a retrofitted house will enjoy the energy bill savings, better health, comfort and well-being, compared to a non-retrofitted house. The homeowners will enjoy these benefits apart from the green premium.
Future housing markets may increasingly penalise inefficient homes and reward efficient ones, meaning retrofit investments today can preserve or enhance long-term asset value. Unless there are radical changes (which are not present today in the UK housing market), retrofitting houses can be a rational choice, both financially and non-financially, under the current circumstances in the UK. This study is subject to the assumptions of the current circumstances and trends observed in the previous 25 years. Predictions are subject to change due to unforeseeable circumstances in the future.
Supplementary Materials
The calculations and projections supporting the data analysis can be found at https://doi.org/10.6084/m9.figshare.33027710 (accessed on 23 June 2026).
Author Contributions
Conceptualisation, C.P.; methodology, C.P., N.M. and D.W.; software, C.P.; validation, N.M. and D.W.; formal analysis, C.P.; investigation, C.P., N.M. and D.W.; resources, C.P.; data curation, C.P., N.M. and D.W.; writing—original draft preparation, C.P.; writing—review and editing, C.P., N.M. and D.W.; visualisation, C.P. and N.M.; supervision, C.P.; project administration, C.P. and D.W.; funding acquisition, C.P. All authors have read and agreed to the published version of the manuscript.
Funding
This research received no external funding.
Data Availability Statement
The original contributions presented in this study are included in the article/Supplementary Materials. Further inquiries can be directed to the corresponding author.
Conflicts of Interest
The authors declare no conflicts of interest.
References
- Addae-Dapaah, K., & Wilkinson, J. (2020). Green premium: What is the implied prognosis for sustainability? Journal of Sustainable Real Estate, 12(1), 16–33. [Google Scholar] [CrossRef] [Scilit]
- Bank of England. (2026). Quoted interest rates. Bank of England. Available online: https://www.bankofengland.co.uk/statistics/ (accessed on 24 June 2026).
- Braakmann, N., Dursun, B., & Pickard, H. (2026). Energy price shocks and the demand for energy-efficient housing: Evidence from Russia’s invasion of Ukraine. Economica, 93(369), 30–51. [Google Scholar] [CrossRef] [Scilit]
- BRE. (2026). Standard assessment procedure. Building Research Establishment (BRE). Available online: https://bregroup.com/expertise/energy/sap (accessed on 25 June 2026).
- Brown, D., Middlemiss, L., Davis, M., Bookbinder, R., Cairns, I., Hannon, M., Mininni, G., Brisbois, M. C., Owen, A., & Hall, S. (2025). Rethinking retrofit: Relational insights for the design of residential energy efficiency policy. Energy Research & Social Science, 120, 103863. [Google Scholar] [CrossRef] [Scilit]
- BSI. (2023). PAS 2035:2023 Retrofitting dwellings for improved energy efficiency: Specification and guidance. British Standards Institution (BSI). Available online: https://www.bsigroup.com/en-GB/insights-and-media/insights/brochures/pas-2035-retrofitting-dwellings-for-improved-energy-efficiency/ (accessed on 23 June 2026).
- CCC. (2020). The sixth carbon budget: The UK’s path to net zero. Climate Change Committee (CCC). Available online: https://www.theccc.org.uk/publication/sixth-carbon-budget/ (accessed on 23 June 2026).
- DBEIS. (2021). Heat and buildings strategy. Department for Business, Energy & Industrial Strategy (DBEIS). Available online: https://www.gov.uk/government/publications/heat-and-buildings-strategy (accessed on 25 June 2026).
- DCLG. (2011). Progress towards the sustainability of the building stock in England and Wales: Third parliamentary report. Department for Communities and Local Government (DCLG); UK Government. Available online: https://www.gov.uk/government/publications/progress-towards-environmentally-sustainable-buildings-third-parliamentary-report (accessed on 23 June 2026).
- DCLG. (2017). A guide to energy performance certificates for the marketing, sale and let of dwellings: Improving the energy efficiency of our buildings. Department for Communities and Local Government (DCLG). Available online: https://www.gov.uk/government/publications/energy-performance-certificates-for-the-construction-sale-and-let-of-dwellings/a-guide-to-energy-performance-certificates-for-the-marketing-sale-and-let-of-dwellings (accessed on 22 June 2026).
- DESNZ. (2026). Warm homes plan. Department for Energy Security and Net Zero (DESNZ). Available online: https://www.gov.uk/government/publications/warm-homes-plan/ (accessed on 24 June 2026).
- Duca, J. V., Muellbauer, J., & Murphy, A. (2010). Housing markets and the financial crisis of 2007–2009: Lessons for the future. Journal of Financial Stability, 6(4), 203–217. [Google Scholar] [CrossRef] [Scilit]
- Ebrahimigharehbaghi, S., Qian, Q. K., de Vries, G., & Visscher, H. J. (2022). Identification of the behavioural factors in the decision-making processes of the energy efficiency renovations: Dutch homeowners. Building Research & Information, 50(4), 369–393. [Google Scholar] [CrossRef] [Scilit]
- Geske, J. (2022). The value of energy efficiency in residential buildings—A matter of heterogeneity?! Energy Economics, 113, 106173. [Google Scholar] [CrossRef] [Scilit]
- Gholamzadehmir, M., Pandolfi, A. M., Del Pero, C., Leonforte, F., & Sdino, L. (2025). Increasing the market value of buildings through energy retrofitting: A comparison of actual retrofit costs and perceived values. Buildings, 15(3), 376. [Google Scholar] [CrossRef] [Scilit]
- Gov.uk. (2017). Domestic private rented property: Minimum energy efficiency standard—Landlord guidance. UK Government. Available online: https://www.gov.uk/guidance/domestic-private-rented-property-minimum-energy-efficiency-standard-landlord-guidance (accessed on 23 June 2026).
- LETI. (2021). LETI climate emergency retrofit guide. London Energy Transformation Initiative (LETI). Available online: https://www.leti.uk/retrofit (accessed on 22 June 2026).
- McCord, M., Haran, M., Davis, P., & McCord, J. (2020). Energy performance certificates and house prices: A quantile regression approach. Journal of European Real Estate Research, 13(3), 409–434. [Google Scholar] [CrossRef] [Scilit]
- McCord, M., McCord, J., Davis, P., Haran, M., & Squires, G. (2024). Do private rental tenants pay for energy efficiency?: The dynamics of green premiums and brown discounts. Journal of Property Research, 41(3), 251–275. [Google Scholar] [CrossRef] [Scilit]
- MHCLG. (2018). Government announces new housing measures. Ministry of Housing, Communities and Local Government. Available online: https://www.gov.uk/government/news/government-announces-new-housing-measures (accessed on 22 June 2026).
- MHCLG. (2025). Live tables on energy performance of buildings certificates. Ministry of Housing, Communities and Local Government. Available online: https://www.gov.uk/government/statistical-data-sets/live-tables-on-energy-performance-of-buildings-certificates (accessed on 21 July 2026).
- MHCLG. (2026). Housing supply: Indicators of new supply, England: January to march 2026. Ministry of Housing, Communities and Local Government. Available online: https://www.gov.uk/government/statistics/housing-supply-indicators-of-new-supply-england-january-to-march-2026 (accessed on 23 June 2026).
- Munir, S., Rashid, M., & Rashid, K. (2026). Green premiums and brown discounts: Asymmetric housing wealth effects in Europe under climate transition risk and institutional constraints. SN Business & Economics, 6(5), 131. [Google Scholar] [CrossRef] [Scilit]
- ONS. (2026). Median energy efficiency score, England and Wales. Office for National Statistics (ONS). Available online: https://www.ons.gov.uk/peoplepopulationandcommunity/housing/datasets/medianenergyefficiencyscoreenglandandwales (accessed on 23 June 2026).
- Ou, Y., Bailey, N., McArthur, D. P., & Zhao, Q. (2025). The price premium of residential energy performance certificates: A scoping review of the European literature. Energy and Buildings, 332, 115377. [Google Scholar] [CrossRef] [Scilit]
- Ou, Y., Bailey, N., McArthur, D. P., & Zhao, Q. (2026). Willingness-to-pay for energy efficient homes: New insights from the 2022 energy crisis in the United Kingdom. Energy Research & Social Science, 135, 104700. [Google Scholar] [CrossRef] [Scilit]
- Oyedokun, T. B. (2017). Green premium as a driver of green-labelled commercial buildings in the developing countries: Lessons from the UK and US. International Journal of Sustainable Built Environment, 6(2), 723–733. [Google Scholar] [CrossRef] [Scilit]
- Panakaduwa, C., Coates, P., Mallikarachchi, N., Bamunuachchige, H., & Samansiri, S. (2026a). Housing retrofit at scale: A diffusion of innovations perspective for planetary health and human well-being. Challenges, 17(1), 4. [Google Scholar] [CrossRef] [Scilit]
- Panakaduwa, C., Coates, P., & Munir, M. (2024). Evaluation of government actions discouraging housing energy retrofit in the UK: A critical review. In Proceedings of the 2024 20th international conference on the european energy market (EEM) (pp. 1–6). IEEE. [Google Scholar] [CrossRef] [Scilit]
- Panakaduwa, C., Coates, P., & Munir, M. (2026b). Understanding homeowner decision-making through demographics: Barriers to housing retrofit at scale. PLoS ONE, 20(12), e0338740. [Google Scholar] [CrossRef] [Scilit] [PubMed]
- Paul, B., & Suzanna, H. (2025). Fuel poverty in the UK. House of Commons Library. Available online: https://commonslibrary.parliament.uk/research-briefings/cbp-8730/ (accessed on 23 June 2026).
- Scottish Government. (2026). Scottish house condition survey: 2024 key findings. Scottish Government. Available online: https://www.gov.scot/publications/scottish-house-condition-survey-2024-key-findings/ (accessed on 23 June 2026).
- UKHPI. (2026). House price statistics for United Kingdom from December 2001 to December 2025. HM Land Registry. Available online: https://www.gov.uk/government/statistical-data-sets/uk-house-price-index-data-downloads-december-2025 (accessed on 23 June 2026).
- UK Parliament. (2019). Climate change act 2008. UK Parliament. Available online: https://bills.parliament.uk/bills/195/ (accessed on 23 June 2026).
- Wei, J., & Peiser, R. (2025). Evolving green premiums: The impact of energy efficiency on London housing prices over time. Land, 14(10), 2053. [Google Scholar] [CrossRef] [Scilit]
- Zhang, B., Zhang, Y., Li, J., Song, Y., & Wang, Z. (2023). Does the energy efficiency of buildings bring price premiums? Evidence from urban micro-level energy data. Renewable and Sustainable Energy Reviews, 181, 113315. [Google Scholar] [CrossRef] [Scilit]

Disclaimer/Publisher’s Note: The statements, opinions and data contained in all publications are solely those of the individual author(s) and contributor(s) and not of MDPI and/or the editor(s). MDPI and/or the editor(s) disclaim responsibility for any injury to people or property resulting from any ideas, methods, instructions or products referred to in the content. |
© 2026 by the authors. Licensee MDPI, Basel, Switzerland. This article is an open access article distributed under the terms and conditions of the Creative Commons Attribution (CC BY) license.