


Abstract
This study develops a reproducible synthetic stress-testing framework for examining regime-sensitive price fragility across three strategic-mineral exposure classes: boron, chromium, and a rare-earth-linked system. Four latent drivers, supply disruption, processing concentration, substitution rigidity, and logistics friction, are combined through disclosed mineral-specific weights to generate a composite stress index and threshold-dependent return regimes. The final Monte Carlo design contains 3000 monthly return paths of 240 observations for each of nine mineral–scenario cells, producing 27,000 paths in total. A Chow-type sup-F procedure screens the full simulation grid for a single candidate mean shift, while a two-state Gaussian hidden Markov model is estimated for a fixed subsample of 400 paths per cell. Additional diagnostics include a standardized regression of the path-level QLR statistic on mean realized stress and two-sample Kolmogorov–Smirnov comparisons of scenario-specific QLR distributions. Under the disclosed calibration, the rare-earth-linked system generally produces the strongest screening and stress-sensitivity signals, chromium occupies an intermediate position, and boron produces the weakest. These results establish internal diagnostic consistency across complementary summaries of a common synthetic data-generating process rather than independent empirical validation of actual mineral-market fragility. H1 is demonstrated only within the calibrated threshold design, H2 receives partial calibration-conditional support, and H3 is not directly tested in its strong entry-versus-recovery form. The framework provides a transparent methodological foundation for future empirical calibration, counterfactual sensitivity analysis, and mineral-risk decision-support applications.
1. Introduction
The governance of critical and strategic minerals has migrated from the periphery of resource policy to the analytical core of financial and industrial risk management. Critical-mineral security assessments have traditionally relied on reserve availability, geographic concentration, import dependence, and substitutability indicators. These measures remain useful, but they provide limited information about how price and supply risks change when geopolitical and logistical pressures intensify. This study develops a scenario-based framework for examining structural-break signals and regime persistence under progressively stronger synthetic stress conditions (Leal Filho et al., 2023). This evolution mirrors, almost precisely, the intellectual trajectory that reshaped financial risk management after successive currency, banking, and commodity crises: static exposure metrics gave way to regime-conditional, scenario-based architectures capable of distinguishing the ordinary noise of a market from the onset of a structurally altered state (Liu et al., 2025). Critical minerals, whose extraction and processing are concentrated within a small number of jurisdictions and whose substitution options are frequently rigid in the short run, now confront the same analytical demand that once reshaped sovereign-debt and energy-market risk assessment: the need to move from descriptive vulnerability narratives toward quantitatively falsifiable stress-testing frameworks (Whittle & Yellishetty, 2023).
Yet, the methodological migration from finance to mineral economics remains incomplete. Structural-break detection and Markov regime-switching models were developed and refined almost entirely within monetary economics, exchange-rate analysis, and energy-commodity risk research, where they have become the standard idiom for describing how volatility states persist, decay, or transition under stress (Korley & Giouvris, 2021). Their application to strategic minerals, by contrast, has lagged conspicuously behind their conceptual relevance. The bulk of the mineral-security literature remains anchored in reserve accounting, geological characterization, and qualitative supply-chain mapping (valuable exercises), but ones that treat price and risk dynamics as an afterthought rather than as the object of formal inference (J. Zhou & Månberger, 2024). Where regime-sensitive methods have entered the commodity-risk literature, they have overwhelmingly targeted oil, gold, and broad industrial-metal indices (Sari et al., 2026), leaving the class of geopolitically concentrated strategic minerals boron, chromium, and rare-earth-linked systems among them, without a dedicated, internally consistent stress-testing architecture (P. Zhou et al., 2026).
This methodological gap also has a defense and alliance-policy dimension. Recent research on defense-critical minerals connects mineral dependence to military readiness, acquisition continuity, weapon-system sustainment, and scenario-based national-security planning (Amoah et al., 2026). A related literature shows that critical-mineral supply is increasingly shaped by geopolitical trade blocs, strategic partnerships, friend-shoring arrangements, and competing producer coalitions rather than by a politically neutral global market (Vivoda et al., 2025). These developments strengthen the case for continuous and auditable stress monitoring. In the present framework, the escalation and criticality scenarios should therefore be interpreted as stylized representations of supply fragmentation, export controls, alliance realignment, and disruption of defense-relevant value chains, not as forecasts of a particular geopolitical confrontation (Vivoda et al., 2024).
Türkiye offers an unusually disciplined laboratory for closing this gap, not because it is unique in possessing critical minerals, but because it embodies, within a single national frontier, three structurally distinct forms of mineral exposure that most stress-testing frameworks must otherwise assemble from disparate countries (Aslan & Ari, 2026). Its globally recognized primacy in boron reserves constitutes a case of entrenched strategic strength; its metallurgically embedded chromium position represents an industrial-input exposure bound to global processing cycles; and its emergent stake in the rare-earth-linked policy discourse represents a forward-looking, midstream-constrained exposure whose risk profile has yet to be empirically disciplined (Dursun & Erhan Bulut, 2025). Analytically, this triad functions as a natural cross-section for testing whether disruption sensitivity is governed by mineral identity or more fundamentally, by the underlying architecture of exposure: processing concentration, substitution rigidity, and logistics dependency. The three Turkish mineral systems are used as contrasting exposure archetypes for calibrating and evaluating a common stress-testing framework (Pirajno et al., 2019).
Three unresolved tensions motivate the present study. First, the geopolitical-risk–commodity literature demonstrates that structural-break detection and regime-switching models are well suited to systems exhibiting nonlinearity and threshold-dependent persistence (Sultana, 2026), yet no study has integrated these two diagnostic layers with a Monte Carlo shock-propagation engine into a single, mineral-specific architecture (Ahemd et al., 2026). Second, the strategic-minerals literature has yet to formalize the intuition, widespread in policy discourse but rarely tested, that midstream processing concentration and substitution rigidity, rather than raw reserve scarcity, are the primary determinants of regime fragility (Nate et al., 2021). Third, no framework currently permits a within-country, cross-mineral comparison of disruption sensitivity under a common synthetic stress-testing protocol, a comparison that is indispensable for prioritizing strategic-stockpiling and industrial-policy resources under conditions of empirical-data scarcity (Bae & Yoon, 2026).
Accordingly, the study advances three testable propositions. H1; within the disclosed synthetic design, movement from the baseline to the escalation and criticality scenarios will increase turbulent-state occupancy and will be summarized by the regime-estimation layer as greater turbulent-state persistence and longer implied duration relative to the mineral-specific calibrated threshold. H2; under the joint mineral-specific calibrations, the rare-earth-linked system will exhibit stronger structural-break screening signals, greater standardized QLR stress sensitivity, and greater cross-scenario QLR distributional separation than boron, with chromium generally occupying an intermediate position. H3; the simulated return paths may exhibit asymmetric normal- and turbulent-state durations; the homogeneous two-state Gaussian HMM will be used to assess whether the fitted average state-persistence pattern is descriptively consistent with such asymmetry. This constitutes an exploratory duration-based assessment rather than a direct test of time-varying entry and recovery hazards.
Correspondingly, the study pursues four interlocking objectives: (i) to construct a transparent, fully disclosed synthetic-data architecture that reproduces the stylized statistical properties of strategic-mineral price systems under varying disruption intensities; (ii) to detect endogenous structural-break conditions arising under simulated geopolitical stress; (iii) to estimate the Markov regime-transition dynamics governing volatility-state migration across boron, chromium, and rare-earth-linked exposure classes; and (iv) to translate these diagnostics into a portfolio-style criticality-ranking logic suitable for strategic-mineral policy prioritization and future empirical extension. The remainder of this article is organized as follows. Section 2 situates Türkiye’s strategic mineral profile within the broader critical-minerals policy landscape and justifies the boron–chromium–rare-earth triad as an exposure-based cross-section. Section 3 details the synthetic data-generation process and the three-layer analytical architecture, structural-break detection, Markov regime-switching, and Monte Carlo scenario propagation. Section 4 reports the simulation results across the baseline, escalation, and criticality scenarios. Section 5 discusses the findings in relation to the financial-econometric and mineral-security literatures, and Section 6 concludes with implications for strategic-mineral risk governance.
2. Strategic Mineral Context of Türkiye
Türkiye occupies a position in the global critical-minerals architecture that is difficult to replicate through any single-mineral case study, because it combines three distinct evolutionary stages of strategic exposure within one national frontier. It is, first, an incumbent power in the narrowest sense of the term: it holds what independent surveys place at roughly seventy percent of the world’s proven boron reserves (Kılıç et al., 2018), a concentration so pronounced that global boron supply security is, in practice, inseparable from Turkish industrial and export policy (Taşcı, 2026). It is, second, an established mid-tier industrial exporter in chromium, ranking among the world’s leading chromite-ore producers and supplying ferrochrome value chains that remain structurally exposed to processing bottlenecks abroad (Akmaz et al., 2025). It is, third, an emergent and still analytically undisciplined claimant in the rare-earth-linked domain, anchored principally around the Kızılcaören bastnäsite-fluorite deposit in Eskişehir province, whose resource base is frequently cited in policy literature as among the largest undeveloped rare-earth-oxide occurrences globally, yet whose extraction and separation capacity remains at a pre-commercial stage (Gültekin et al., 2003). No other single jurisdiction offers this precise sequencing, entrenched dominance, industrial maturity, and unrealized strategic potential, within one coherent national boundary, which is precisely what recommends Türkiye as the empirical anchor for a cross-mineral stress-testing exercise rather than as a mere illustrative example.
2.1. Exposure Archetypes
The boron system, extracted principally from the Kırka, Bigadiç, and Emet basins, exemplifies what may be termed entrenched strategic strength: reserve concentration is extreme, but downstream demand is diversified across glass, ceramics, detergents, and agricultural applications, and Turkish state enterprise exercises a degree of vertical integration that dampens (without eliminating) exposure to external processing shocks (Şensöz et al., 2021). The chromium system, drawing on chromite bodies in the Elazığ–Guleman and Fethiye–Köyceğiz districts, exemplifies industrial-input exposure: Türkiye’s role is significant at the ore-production stage (Uçurum et al., 2006), but ferrochrome refining and stainless-steel-linked demand are governed by cyclical, globally dispersed midstream capacity over which domestic policy has limited leverage (Engin et al., 1981). The rare-earth-linked system exemplifies a third and structurally more precarious archetype, midstream-constrained emergence: geological potential is documented, but separation technology, environmental permitting, and refining capacity remain concentrated overwhelmingly outside Türkiye, so that any attempt to translate reserve potential into strategic leverage is mediated by actors and infrastructure the country does not control (Koroleva et al., 2026).
These three archetypes are not offered as a geological inventory; they are offered as a mapping onto the four latent stress drivers formalized in Section 3, disruption intensity (Dt), processing concentration (Ct), substitution rigidity (St), and logistics friction (Lt). In this study, logistics friction denotes the delays, costs, and reliability losses involved in moving ores, intermediate products, and refined materials through transport networks, ports, customs, and border crossings, including exposure to route concentration, infrastructure bottlenecks, and trade restrictions. Table 1 summarizes this mapping and constitutes the qualitative bridge between the present section and the calibration choices introduced in Section 3.2. Boron has defense and advanced-industrial relevance through boron-containing ceramics, specialty glasses, high-performance materials, and selected shielding and energetic-material applications, while Türkiye’s established production position also supports export and industrial-policy capacity. Chromium is indispensable to stainless and high-performance alloy production, including corrosion- and heat-resistant materials used in aerospace, transport, energy infrastructure, and defense manufacturing. Türkiye’s rare-earth-linked resources are strategically relevant because separated rare-earth inputs support permanent magnets, sensors, guidance and communication systems, electric drives, and other dual-use technologies, although their domestic strategic value depends on commercially viable separation, refining, and component-manufacturing capacity.
Table 1.
Comparative exposure profile of Türkiye’s three strategic-mineral systems.
2.2. From Strategic Narrative to Calibration Logic
The purpose of this exposure-based taxonomy is not rhetorical but architectural: it licenses the differentiated weighting vector ω1, ω2, ω3, ω4 used to construct the latent stress index Rt in Equation (1).
Because the rare-earth-linked system combines the lowest substitution elasticity with the most externally concentrated processing dependence, it is calibrated in Section 3.2 to carry disproportionate weight on Ct and St, a modeling choice that operationalizes, rather than merely asserts, the proposition embedded in H2. Chromium, by contrast, is calibrated toward a more balanced exposure across Ct and Lt, consistent with its status as an industrially mature but midstream-dependent system, while boron, whose downstream diversification and partial vertical integration attenuate transmission, is assigned the most balanced weighting vector of the three. A schematic map of the three basin clusters (Figure 1) accompanies this section to orient readers unfamiliar with Türkiye’s mineral geography (Basin locations are approximate and schematic; not to be used for cadastral or exploration purposes). In this sense, Section 2 does not merely describe a country; it derives the calibration logic that Section 3 formalizes and Section 4 tests.
Figure 1.
Schematic distribution of Türkiye’s three strategic-mineral exposure clusters (basin locations are approximate and schematic and should not be interpreted as cadastral or exploration boundaries).
3. Materials and Methods
3.1. Research Design, Epistemic Positioning
The present study is designed as a simulation-methodology contribution rather than a historical causal-inference exercise, and this distinction governs every subsequent choice reported in this section. The architecture is organized as a four-stage analytical pipeline: a synthetic data-generating process constructs stylized return paths under a known and disclosed stochastic mechanism; a structural-break detection layer screens each simulated path for statistically identifiable discontinuities; a two-state regime-estimation layer characterizes the latent volatility-state dynamics; and an aggregation layer synthesizes the resulting diagnostics into the criticality metrics reported in Section 4. The structural-break analysis is conducted across three-thousand Monte Carlo replications for each mineral–scenario cell, while the computationally more intensive regime-estimation layer is applied to a fixed subsample of four hundred paths per cell. This sequencing is deliberate: because the true regime-generating rule is retained internally during simulation, even though it is withheld from the estimation stage, the framework permits an internal validation exercise absent from purely empirical stress-testing studies, namely an assessment of how faithfully the estimated Markov chain recovers a regime structure whose ground truth is known by construction (Section 3.5).
This design choice is not incidental to the study’s identity as a contribution to economic mineral-resource risk assessment situated at its intersection with financial-risk econometrics. The logic of constructing a controlled, disclosed synthetic environment in which a risk-diagnostic apparatus can be evaluated against a known generating process is the same logic that underlies stress-testing protocols in banking supervision, where regulators evaluate a bank’s internal risk models against scenario-conditioned synthetic-loss distributions rather than waiting for a crisis to test them empirically (Aldasoro et al., 2025). The present framework transplants that epistemic posture into the mineral-security domain: rather than asking whether a historical crisis can be explained retrospectively, it asks whether a disciplined diagnostic architecture can detect and characterize regime fragility under conditions that are, by construction, analytically tractable and fully reproducible (Zhang & Wang, 2026).
Three distinct forms of validation must therefore be separated. First, computational and reproducibility validation concerns whether the disclosed code, parameters, random-number protocol, and calibration files reproduce the reported simulation outputs. Second, internal statistical validation concerns whether the structural-break and regime-classification procedures recover properties of the known simulated data-generating process when the generating states and thresholds are withheld from the estimation stage. Third, external empirical validation would require calibration and testing against observed mineral prices, trade flows, processing capacity, disruption events, and other market data. The present study undertakes the first two forms of validation but not the third. Accordingly, all cross-mineral rankings reported below are model-implied and conditional on the stated calibration; they should not be interpreted as independently estimated rankings of actual historical mineral-market fragility.
3.2. Synthetic Data-Generating Process
This sequencing is deliberate. Because the true regime-generating rule is retained internally during simulation, even though it is withheld from the estimation stage, the framework permits an internal validation exercise absent from purely empirical stress-testing studies, namely an assessment of how faithfully the estimated Markov chain recovers a regime structure whose ground truth is known by construction (Section 3.5). For each of the three mineral systems introduced in Section 2, boron, chromium, and the rare-earth-linked exposure class, the simulation constructs monthly synthetic return paths of T = 240 periods (twenty years of monthly observations), replicated across N = 3000 Monte Carlo iterations for each of the three scenario families defined in Section 3.6. This yields a full simulation grid of 3 × 3 × 3000 = 27,000 synthetic return paths, each internally consistent with the calibration logic derived in Section 2.2. The structural-break diagnostics are calculated over the full grid, whereas the two-state regime model is estimated using a fixed subsample of n = 400 paths from each mineral–scenario cell for computational tractability.
The four latent stress drivers introduced in Section 2.2, disruption intensity Dt, processing concentration Ct, substitution rigidity St, and logistics friction Lt, are each generated as a bounded autoregressive process on the unit interval. For driver k under scenario s, denotes the underlying unbounded Gaussian state, ck,s denotes its scenario-specific target level, ρk is the first-order autoregressive coefficient, and ηk,t is a Gaussian innovation with standard deviation σk. The target level is defined as ck,s = log[mk,s/(1 − mk,s)], where mk,s is the scenario-specific target reported in Section 3.6. The calibration sets ρk = 0.85 and σk = 0.60 for all four drivers. Equation (3) applies a logistic transformation to map the unbounded state onto the bounded driver Xk,t ∈ (0,1), avoiding the boundary clustering produced by direct truncation.
3.3. Latent Stress Index, True Regime Path, Return Generation
The latent stress index Rt, defined in Equation (1), determines the true underlying regime path according to Equation (4). This generating regime is retained for internal validation but withheld from the estimation layer described in Section 3.5. The mineral-specific threshold τ is calibrated so that, under the baseline scenario, the turbulent state occupies approximately fifteen percent of simulated periods, reflecting the relative rarity of acute disruption episodes compared with ordinary market operation in commodity-risk research (Saduov et al., 2026).
The superscript asterisk identifies as the known generating regime used for internal validation; is unrelated to St, which denotes the substitution-rigidity driver. Monthly synthetic returns are then generated conditionally on according to Equation (5).
Here, rt is the synthetic return at time t; j ∈ {1,2} indexes the normal and turbulent generating regimes; μj is the regime-specific return intercept; ϕj is the autoregressive persistence coefficient; βj is the loading of the current latent stress index on returns; σj is the regime-specific innovation standard deviation; and εt is a standard normal innovation. For clarity, the notation follows a consistent sequence throughout the analytical pipeline. The unbounded latent state is transformed into the bounded driver Xk,t; the four bounded drivers are combined into the composite stress index Rt; and Rt determines the known generating regime , which in turn governs the synthetic return rt. The superscript asterisk distinguishes the known generating regime retained for internal validation from the latent regime st subsequently inferred by the Gaussian hidden Markov model in Section 3.5.
Because is a deterministic function of the latent stress index rather than an independently drawn Markov chain, the return-generating process embeds a threshold-triggered, rather than purely stochastic, regime mechanism, a design choice intended to emulate the way geopolitical disruption plausibly operates, not as an exogenous coinflip between calm and turbulent states, but as an endogenous consequence of accumulated structural pressure crossing a critical zone. Table 2 reports the calibrated values of μj, ϕj, βj, σj, and the weighting vector (ω1, ω2, ω3, ω4) for each of the three mineral systems. The mineral-specific weights and regime parameters reported in Table 2 are theory-informed scenario parameters rather than econometrically estimated coefficients. The point calibrations are not claimed to be unique. Because the present study evaluates the internal operation of the diagnostic architecture rather than estimating a structural mineral-market model, it does not identify a data-supported probability distribution for the calibration parameters. The reported cross-mineral ordering should therefore be interpreted as conditional on the disclosed parameter set rather than as evidence that the same ordering would necessarily survive all plausible alternative calibrations. Their purpose is to encode transparent, contestable, and reproducible exposure architectures for a controlled methodological experiment. The selection of the four stress dimensions is grounded in the multidimensional criticality literature (Graedel et al., 2015), which distinguishes supply risk from vulnerability to supply restriction and shows that mineral criticality cannot be reduced to geological availability alone (Whittle & Yellishetty, 2023). Related research further identifies processing and refining concentration, substitution constraints, project-development barriers, trade-policy exposure, logistics conditions (Vespignani & Smyth, 2024), and non-technical risks as interacting determinants of mineral-supply vulnerability (Chepeliev et al., 2026). The calibration consequently represents a structured translation of these mechanisms into the synthetic data-generating process; it should not be interpreted as an externally validated estimate of the causal contribution or economically optimal weight of any individual driver. The reported cross-mineral ordering is therefore conditional on the joint calibration and does not independently establish that processing concentration, substitution rigidity, or any other single component governs observed mineral-market fragility.
Table 2.
Calibration parameters by mineral system 1.
3.4. Structural-Break Detection Layer
The structural-break layer departs deliberately from the original draft’s reference to Zivot–Andrews-type procedures (Abi Morshed et al., 2018; Muthuramu & Uma Maheswari, 2019), which are unit-root tests designed for series with a plausible stochastic trend and are therefore methodologically mismatched to the stationary return-generating environment specified in Equation (5). The implemented procedure instead uses a Chow-type sup-F screening statistic, expressed in its QLR form, to identify a single shift in the unconditional mean at an unknown date. For each simulated return path, the restricted model imposes a constant mean over the full sample, whereas the unrestricted model permits distinct means before and after each candidate break date τ. Candidate dates are evaluated over the symmetrically trimmed interval [0.15T, 0.85T] to avoid poorly identified segment estimates near the sample boundaries. The statistic is calculated as shown in Equation (6), where SSR0 denotes the restricted sum of squared residuals, SSR1(τ) denotes the combined within-segment sum of squared residuals associated with candidate date τ, and k = 1 because the implemented specification permits one parameter—the mean—to shift. The estimated break date is , and a break is classified as detected when the resulting QLR statistic exceeds the five-percent critical value of 8.85 used in the simulation protocol. PELT constitutes a recognized alternative for multiple-changepoint detection (Gachomo et al., 2015), but it was not included in the computational implementation underlying the results reported in Section 4. This procedure is applied as a mean-shift diagnostic; changes in realized variance are summarized separately through the variance-amplification measure defined in Section 3.8.
3.5. Two-State Regime-Switching Layer
The second diagnostic layer estimates a two-state Gaussian hidden Markov model in which the conditional mean and variance of the simulated return are allowed to differ between the normal and turbulent states (Zhao et al., 2026). Although the return-generating process in Equation (5) contains a regime-dependent autoregressive component, the diagnostic model intentionally adopts a more parsimonious Gaussian emission specification and therefore estimates the latent states without directly imposing the generating AR(1) structure. This distinction allows the internal-validation exercise to evaluate whether a simplified state-based diagnostic can recover the known generating regimes from the simulated returns. The conditional observation model is given in Equation (7), together with the homogeneous first-order transition matrix in Equation (8).
Model parameters are estimated separately for a fixed subsample of n = 400 simulated paths from each mineral–scenario cell using a scaled forward–backward implementation of the Baum–Welch expectation–maximization algorithm. The algorithm updates the initial-state probabilities, transition probabilities, regime-specific means, and regime-specific variances iteratively, using a convergence tolerance of 10−6 and a maximum of 35 iterations. Initialization is based on the empirical location and dispersion of each return path, with initial transition probabilities favoring state persistence. To maintain a consistent economic interpretation across estimations, the state with the larger estimated standard deviation is labeled as state 2, the turbulent state. The resulting smoothed probability P(st = 2∣r1, …, rT) is converted into a classified regime path using a threshold of 0.5. Because the true generating regime from Equation (4) is retained internally, classification performance is summarized using Cohen’s κ (Ren & Niu, 2025), calculated between the classified and known regime paths. The estimated diagonal transition probabilities p11 and p22 are averaged across the 400-path subsample, and the expected duration of the turbulent state is calculated as 1/(1 − p22).
3.6. Scenario Design, Parameter Grid
Three scenario families govern the central tendency of the latent AR(1) processes underlying Dt, Ct, St, and Lt. The baseline scenario represents ordinary operating conditions; the escalation scenario introduces a temporary but pronounced elevation in disruption intensity accompanied by moderate processing bottlenecks; and the criticality scenario combines elevated values across all four drivers, approximating a compound strategic-mineral emergency. Table 3 reports the scenario-specific calibration targets mk,s used to center the latent driver processes. Each target is mapped to the unbounded Gaussian scale through in Equation (2). Because the bounded driver Xk,t is obtained through a nonlinear logistic transformation in Equation (3) and is subject to stochastic innovations, the reported targets should not be interpreted as realized sample means of the simulated Xk,t series.
Table 3.
Scenario-specific calibration targets for the latent driver processes.
3.7. Simulation Protocol
All simulations and statistical analyses were implemented in Python 3.13.15. NumPy 2.5.3 was used for pseudo-random-number generation, vectorized simulation, array computation, structural-break screening, and the custom implementation of the two-state Gaussian hidden Markov model. SciPy was used for the linear-regression calculations underlying the standardized stress-sensitivity coefficient and for the two-sample Kolmogorov–Smirnov tests. Neither the structural-break procedure nor the regime-estimation layer relies on an external specialist package: the Chow-type sup-F screening procedure and the scaled forward–backward/Baum–Welch algorithm were implemented directly in the accompanying source code. For each mineral–scenario cell, structural-break statistics were calculated over all N = 3000 simulated paths, while the regime-estimation procedure was applied to a fixed subsample of n = 400 paths. The latent driver processes were initialized with a 50-period burn-in, which was discarded before retaining the T = 240 monthly observations used in the analysis. Random-number generation uses NumPy’s default_rng interface with a fixed base seed of 20260101. Separate deterministic offsets, defined by explicit mineral and scenario identifiers, are used for the latent-driver and return-innovation streams, thereby allowing the complete simulation to be reproduced without dependence on Python’s session-specific hash randomization. The complete numerical output is exported in machine-readable JSON format, and the source code, raw sample data, dataset-generation summary, and Section 4 results are supplied as Supplementary Materials.
3.8. Output Metrics
The reporting architecture distinguishes between metrics calculated over the full Monte Carlo grid and those obtained from the regime-estimation subsample. For each mineral–scenario cell, the full set of N = 3000 simulated paths is used to calculate the true turbulent-state share retained for internal validation, the structural-break detection rate, the mean QLR statistic, and the mean estimated break month conditional on the QLR statistic exceeding the five-percent critical value of 8.85. Variance amplification is calculated separately as the ratio of the sample variance after the first true turbulent-state onset to the sample variance preceding that onset. This calculation uses the generating regime retained for internal validation rather than the estimated break date and is restricted to paths containing at least ten observations on either side of the onset and at least five turbulent observations. When the criticality scenario places almost the entire retained path in the turbulent state, the ratio is reported as not available because a sufficiently long pre-onset segment does not exist. For the fixed n = 400 regime-estimation subsample, the reported metrics are the cell-average transition probabilities p11 and p22, the implied expected turbulent-state duration 1/(1 − p22), and Cohen’s κ between the estimated and known generating regimes.
The standardized stress-sensitivity coefficient, SSCm, is estimated separately for each mineral system. The path-level QLR statistic is regressed on the standardized path-level mean-realized stress index, zi,m,s, after pooling the baseline, escalation, and criticality paths. Here, denotes the time-series mean of the realized latent-stress index for path i under scenario s, while and denote its pooled mineral-specific mean and standard deviation. The coefficient SSCm measures the expected change in the QLR statistic associated with a one-standard-deviation increase in mean realized stress. Because the dependent variable is expressed in QLR-statistic units rather than logarithmic or percentage changes, SSCm is an association-based standardized sensitivity coefficient and not a conventional economic elasticity. Its magnitude is conditional on the construction and normalization of the latent-stress index and should therefore be compared across mineral systems only within the disclosed simulation design. The corresponding R2 and slope-test p-value are reported as descriptive diagnostics of this pooled simulation relationship.
Cross-scenario distributional separation is evaluated using two-sample Kolmogorov–Smirnov tests applied to the path-level QLR distributions. For each mineral system, the baseline–escalation, escalation–criticality, and baseline–criticality pairs are compared, producing nine tests in total. To control the family-wise error rate, the nominal five-percent significance level is Bonferroni-adjusted to 0.05/9 = 0.0056. The current implementation does not calculate percentile confidence bands for all reported metrics; accordingly, the results are presented as Monte Carlo distribution summaries and cross-scenario discrimination diagnostics rather than as simulation-based confidence intervals.
4. Results
The results reported below are based on a fixed Monte Carlo design comprising N = 3000 simulated return paths for each of the nine mineral–scenario cells, yielding 27,000 paths in total. The structural-break diagnostics and path-level stress-sensitivity calculations use the full simulation grid. Because repeated estimation of the two-state Gaussian hidden Markov model is substantially more computationally intensive, the regime-estimation and classification metrics are calculated using a fixed subsample of n = 400 paths from each cell, yielding 3600 regime-model estimations in total. These sample sizes constitute the final computational design used for the reported analysis rather than an interim drafting run. All results should be interpreted as Monte Carlo summaries conditional on the disclosed data-generating process and calibration parameters. They assess the internal behavior and recoverability of the simulated regime structure; they do not constitute estimates of actual historical mineral-market fragility.
4.1. Chow-Type Sup-F Screening Outcomes
Table 4 reports the results of the Chow-type sup-F screening procedure described in Section 3.4 across the complete nine-cell mineral–scenario grid. For every simulated return path, the procedure searches over the symmetrically trimmed candidate dates and retains the maximum statistic and its associated candidate break month. The reported threshold-exceedance rate is the proportion of paths for which the maximum statistic exceeds the fixed screening threshold of 8.85. Three features of the results merit attention.
Table 4.
Chow-type sup-F screening results by mineral system and scenario (N = 3000 paths per cell).
First, both the average sup-F statistic and the share of paths exceeding the screening threshold increase with scenario severity for every mineral system in the reported simulation. This pattern indicates that the screening statistic responds to the progressively stronger mean separation embedded in the calibrated return-generating process. It should not, however, be interpreted as an empirical power assessment or as independent confirmation of mineral-market structural breaks, because scenario severity and regime separation are imposed ex ante within the synthetic design. Second, the threshold-exceedance rate and average sup-F statistic follow the same model-implied ordering across the reported scenarios: boron produces the weakest screening signal, chromium occupies an intermediate position, and the rare-earth-linked system produces the strongest signal. This ordering is a joint consequence of the mineral-specific calibration embedded in Table 2, including the stress-driver weights, regime-conditional means and volatilities, autoregressive parameters, and stress loadings. It therefore demonstrates that the screening procedure reflects the vulnerability differences encoded in the data-generating process; it does not isolate the causal contribution of processing concentration, substitution rigidity, or any individual calibration parameter. Third, the mean maximizing month is located close to the midpoint of the 240-month horizon across the reported cells. This statistic must be interpreted cautiously. The generating regime is defined by whether the latent stress index lies above or below a calibrated threshold and may therefore switch more than once within a path, whereas the Chow-type screening procedure approximates the return sequence using a single candidate mean shift. The maximizing month consequently identifies the split that produces the strongest two-segment fit; it does not estimate the first turbulent-state onset or establish that disruption occurs systematically near the middle of the horizon. Its concentration near the midpoint is a feature of the present synthetic design and screening rule rather than evidence about the timing of real mineral-market disruptions.
4.2. Two-State Gaussian HMM Estimates and Internal Classification Diagnostics
Table 5 reports the transition-probability estimates obtained from the two-state Gaussian hidden Markov model described in Section 3.5. The model is estimated separately for a fixed subsample of n = 400 simulated return paths from each mineral–scenario cell using the scaled forward–backward/Baum–Welch algorithm. After estimation, the state labels are ordered by their estimated conditional standard deviations so that state 1 denotes the lower-volatility state and state 2 denotes the turbulent, higher-volatility state. The table reports the averages of the path-specific and estimates, the turbulent-state duration implied by the cell-average p22, and Cohen’s κ calculated from the pooled classified and known generating states within each cell. These comparisons provide internal classification diagnostics within the synthetic environment; they do not validate the regime model against observed mineral-market states.
Table 5.
Two-state Gaussian HMM transition estimates and agreement with the known generating states (fixed subsample of n = 400 paths per mineral–scenario cell).
Under the baseline scenario, where the generating turbulent state occupies approximately fifteen percent of the simulated observations, the pooled Cohen’s κ statistic follows the model-implied ordering from boron through chromium to the rare-earth-linked system. This pattern is consistent with the progressively larger separation between the normal- and turbulent-state return distributions embedded in the mineral-specific calibration. The same calibration differences also affect the sup-F screening results in Table 4, so the alignment between the two diagnostics should be interpreted as internal consistency across complementary transformations of a common data-generating process. It is not independent evidence that the rare-earth-linked system is empirically easier to classify in observed markets, nor does it isolate the effect of any single exposure driver. The estimated turbulent-state persistence, , is higher under escalation and criticality than under baseline conditions in the reported simulation, producing correspondingly longer implied turbulent-state durations. These estimates show that the parsimonious Gaussian HMM summarizes the more persistent high-variance patterns generated under the more severe calibrated scenarios. They should not be interpreted as evidence that actual mineral-security disruptions necessarily self-reinforce or persist for the same number of months, because the transition estimates are obtained from synthetic returns whose regime occupancy and conditional distributions are imposed by the disclosed data-generating process. The criticality-scenario duration estimates must also be read together with the near-degenerate true-state shares and the resulting limitations of κ.
4.3. Standardized Stress Sensitivity and Cross-Scenario QLR Discrimination
Table 6 reports the mineral-specific standardized stress-sensitivity coefficient, SSCm, defined in Equation (9). For each mineral system, the path-level QLR statistics from the baseline, escalation, and criticality scenarios are pooled and regressed on the standardized path-level mean-realized stress index, yielding 9000 observations per regression. The reported SSCm coefficient is therefore the expected change in the QLR statistic associated with a one-standard-deviation increase in mean realized stress. It is an association-based standardized sensitivity coefficient rather than a conventional percentage-to-percentage elasticity. Table 7 complements this pooled regression analysis with two-sample Kolmogorov–Smirnov tests comparing the complete path-level QLR distributions across the three scenario pairs for each mineral system.
Table 6.
Mineral-specific standardized QLR stress-sensitivity regressions (N = 9000 simulated paths per mineral).
Table 7.
Two-sample Kolmogorov–Smirnov comparisons of path-level QLR distributions across scenario pairs (nine tests; Bonferroni-adjusted α = 0.05/9 ≈ 0.0056) 1.
The standardized stress-sensitivity coefficients in Table 6 preserve the calibration-implied ordering across the three mineral systems: the coefficient is smallest for boron, intermediate for chromium, and largest for the rare-earth-linked system. Within the simulated design, this means that a one-standard-deviation increase in path-level mean realized stress is associated with the largest expected increase in the QLR statistic for the rare-earth-linked calibration. The result provides an operational summary of the sensitivity differences embedded jointly in the mineral-specific stress weights, regime-conditional means, autoregressive parameters, volatilities, and stress loadings. It does not identify the independent causal effect of processing concentration or substitution rigidity, because these calibration dimensions vary simultaneously across mineral systems and were not subjected to a parameter-by-parameter counterfactual decomposition. The relatively low R2 values further indicate that mean realized stress explains only a limited proportion of the path-level variation in QLR, despite the statistical significance of the estimated slopes. In the currently reported simulation output, the escalation and criticality QLR distributions for boron are the only scenario pair for which the equal-distribution null is not rejected at the Bonferroni-adjusted threshold. The corresponding KS statistic is also smaller than the baseline–escalation and baseline–criticality statistics for boron, indicating comparatively limited distributional separation between the two more severe simulated scenarios. This pattern is consistent with a flattening of the QLR response under the boron calibration, but the KS test alone does not establish saturation, identify a structural threshold, or attribute the pattern specifically to downstream diversification or the weighting vector. Such interpretations would require targeted counterfactual simulations in which individual calibration parameters are varied while the remaining parameters are held constant. For chromium and the rare-earth-linked system, the currently reported output rejects the equal-distribution null for all three scenario pairs at the adjusted threshold. The baseline–criticality KS statistic is largest for the rare-earth-linked calibration, followed by chromium and boron, indicating the greatest overall QLR distributional separation across the endpoints of the simulated stress gradient for the rare-earth-linked system. This ordering is conditional on the complete calibration architecture and should not be interpreted as evidence that any single exposure characteristic independently prevents or produces response flattening. Moreover, because the KS statistic summarizes the maximum distance between empirical distribution functions, comparisons of D across mineral systems describe relative distributional separation rather than a directly comparable economic effect size.
4.4. Cross-Mineral Synthesis and Internal Diagnostic Consistency
Taken together, Table 4, Table 5, Table 6 and Table 7 indicate that the mineral ordering embedded in the disclosed calibration is broadly preserved across the analytical outputs. Under the stated parameterization, boron generally produces the weakest sup-F screening and standardized stress-sensitivity signals, chromium occupies an intermediate position, and the rare-earth-linked calibration produces the strongest signals. The transition and classification metrics in Table 5 add information about how the parsimonious Gaussian HMM summarizes the corresponding state-dependent return patterns, although their interpretation varies with regime prevalence and becomes especially limited under the near-degenerate criticality scenario. These results should be understood as internal diagnostic consistency rather than as several independent tests of an external economic proposition. The sup-F statistics, HMM estimates, standardized stress-sensitivity coefficients, and KS comparisons are mathematically distinct, but all are calculated from return paths generated by the same scenario structure and mineral-specific calibration. Their alignment therefore shows that the analytical pipeline can summarize selected differences embedded in the synthetic data-generating process. It does not establish that the same ranking characterizes observed boron, chromium, or rare-earth-linked markets.
Two additional observations clarify the methodological contribution. First, Section 4.2 compares HMM-based state classifications with the known generating states retained inside the simulation. This provides a controlled internal diagnostic that would ordinarily be unavailable in an empirical application, but its interpretation requires explicit consideration of class prevalence alongside the chance-corrected Cohen’s κ statistic, fitted transition probabilities, and implied state durations, particularly under the near-degenerate criticality scenario. Second, the analytical layers summarize different features of the same simulated return process: the Chow-type sup-F procedure screens for a single candidate mean shift, the Gaussian HMM summarizes latent state-dependent means and variances, the standardized stress regression measures the association between mean realized stress and QLR, and the KS tests assess cross-scenario separation of the complete QLR distributions. Using these complementary outputs reduces dependence on any single summary statistic, but it does not make their evidence statistically independent. Figure 2 provides a descriptive visual summary of the standardized stress-sensitivity coefficients and sup-F threshold-exceedance rates, while Figure 3 illustrates the Gaussian HMM state probabilities for selected rare-earth-linked simulation paths.
Figure 2.
Standardized QLR stress sensitivity and sup-F threshold-exceedance rates under the simulated calibration (Panel A reports the mineral-specific SSC obtained from the pooled path-level regression in Equation (9). Panel B reports the proportion of simulated paths in each mineral–scenario cell for which the Chow-type sup-F statistic exceeds the fixed screening threshold of 8.85. All values are conditional on the disclosed synthetic calibration).
Figure 3.
Illustrative Gaussian HMM turbulent-state probabilities across the three simulated stress scenarios.
Panel (A) displays the mineral-specific standardized stress-sensitivity coefficient, , obtained from the pooled path-level regression defined in Equation (9) and reported in Table 6. Panel (B) displays, for each mineral–scenario cell, the proportion of simulated paths for which the Chow-type sup-F statistic exceeds the fixed screening threshold of 8.85, as reported in Table 4. The figure summarizes results conditional on the disclosed calibration and should not be interpreted as an empirically estimated ranking of actual mineral-market fragility.
The figure displays, for one illustrative rare-earth-linked simulation path under each scenario, the simulated return series (grey line, left axis), the smoothed probability of the higher-volatility state obtained from the two-state Gaussian HMM (maroon line, right axis), and the known generating turbulent state (shaded intervals). The panels illustrate how the fitted HMM assigns state probabilities as the calibrated stress environment changes from baseline to escalation and criticality. Because the figure represents only one path per scenario, it is illustrative rather than a separate validation result; the cell-level transition and classification diagnostics are reported in Table 5.
5. Discussion
5.1. The Central Contribution Restated at a Higher Level of Abstraction
The results in Section 4 should be interpreted as evidence about the behavior of the proposed analytical pipeline under a disclosed synthetic data-generating process, not as direct evidence about the historical behavior of boron, chromium, or rare-earth-linked markets. The Chow-type sup-F screening procedure, two-state Gaussian hidden Markov model, standardized stress-sensitivity regression, and Kolmogorov–Smirnov comparisons summarize different features of return paths generated from the same scenario architecture and mineral-specific calibration. Their broad alignment establishes computational reproducibility and internal diagnostic consistency, but it does not provide independent empirical confirmation of the assumed cross-mineral ordering or causal identification of the individual stress drivers. The discussion therefore evaluates H1–H3 according to the evidentiary limits of the current design: whether each proposition is demonstrated within the synthetic architecture, merely consistent with the reported outputs, or not directly tested by the implemented model. External empirical validation remains dependent on future calibration and testing with observed price, trade, processing-capacity, substitutability, logistics, and disruption data.
Recent empirical evidence provides a contextual benchmark for the framework’s emphasis on heterogeneous stress transmission. Using constant-parameter and time-varying-parameter local projections for six critical minerals, Saadaoui et al. show that mineral-price responses to geopolitical risk differ across minerals, vary over time, and depend partly on whether geopolitical risk takes the form of threats or realized acts (Saadaoui et al., 2025). This evidence supports the general economic premise that a common geopolitical disturbance need not generate uniform price dynamics across mineral systems. It does not, however, validate the numerical weights, regime parameters, threshold values, simulated break frequencies, HMM transition estimates, or standardized stress coefficients reported in the present study. The comparison should therefore be understood as a literature-based external plausibility benchmark rather than as parameter-level empirical validation. Direct external validation would require applying the proposed structural-break, regime-classification, and stress-sensitivity procedures to observed mineral-price series together with consistently measured supply-chain covariates.
5.2. H1: Designed Threshold Dynamics and Regime Persistence
H1 proposed that, within the disclosed synthetic design, turbulent-state occupancy and fitted persistence would increase as the latent stress index crossed the mineral-specific calibrated threshold. The present design requires an important qualification to that proposition. The mineral-specific threshold in Equation (4) is not estimated endogenously by the structural-break or HMM layers; it is calibrated before return generation so that the turbulent state occupies approximately fifteen percent of simulated periods under the baseline scenario. The baseline, escalation, and criticality environments then alter the distribution of the latent stress index relative to this fixed calibrated threshold. Consequently, the simulation cannot independently establish the existence or location of a nonlinear threshold in observed mineral markets. Within this controlled design, the reported HMM estimates generally summarize greater turbulent-state persistence and longer implied turbulent-state durations as the calibrated stress environment becomes more severe. The sharpest change appears between the baseline and escalation scenarios, while the additional change between escalation and criticality is more limited in several cells. This pattern is compatible with a threshold-based transition from relatively infrequent to widespread turbulent-state occupation. However, it is partly induced by the scenario construction itself, and the criticality scenario places the known generating state close to a degenerate all-turbulent configuration. Persistence estimates in that scenario should therefore be interpreted together with the true-state share, fitted transition probabilities, implied state durations, and the prevalence sensitivity of Cohen’s κ. H1 is therefore demonstrated only in a methodological and calibration-conditional sense: the analytical pipeline can summarize state-dependent persistence patterns generated by a disclosed threshold rule without being given the true regime labels during estimation. The study does not provide external empirical support for the proposition that actual mineral markets possess the same threshold, that the threshold is endogenous, or that persistence necessarily follows the same nonlinear response. A direct empirical test would require estimating the threshold and regime dynamics from observed mineral-market data or comparing the threshold specification against competing linear and nonlinear transition mechanisms.
5.3. H2: Calibration-Conditional Cross-Mineral Ordering
H2 proposed that mineral systems characterized by greater midstream processing concentration and lower substitution flexibility would exhibit earlier structural breaks and more persistent turbulent regimes than a comparatively integrated system such as boron. The results provide only partial and calibration-conditional consistency with this proposition. The rare-earth-linked calibration generally produces the largest mean sup-F statistics, threshold-exceedance rates, standardized stress coefficients, and baseline-to-criticality QLR-distributional separation, while boron generally produces the weakest values and chromium occupies an intermediate position. These outputs show that the analytical pipeline preserves important differences embedded in the disclosed mineral-specific parameterization. The results do not, however, support every component of H2. The mean maximizing month remains close to the sample midpoint across the mineral–scenario cells and therefore does not show that the rare-earth-linked system experiences systematically earlier structural breaks. Moreover, the HMM persistence estimates do not reproduce an identical boron–chromium–rare-earth ordering in every scenario. The mineral calibrations also differ simultaneously in stress-driver weights, regime-conditional means, autoregressive parameters, conditional volatilities, and stress loadings. The current design consequently cannot isolate the causal effects of processing concentration or substitution rigidity from the effects of these other calibration differences. H2 should therefore be characterized as receiving partial, calibration-conditional support within the simulation rather than empirical confirmation. The strongest defensible result is that the joint rare-earth-linked calibration generates greater simulated stress sensitivity and QLR distributional separation than the joint boron calibration under the stated scenario architecture. Establishing whether processing concentration or substitution rigidity independently drives that ordering would require a factorial sensitivity design or controlled counterfactual simulations in which the relevant weights are varied while the regime parameters and all remaining calibration dimensions are held constant. External validation would additionally require observed mineral-market and supply-chain data.
5.4. H3′s Qualified Support and the Limits of a Homogeneous Transition Matrix
H3 proposed that entry into the turbulent state would occur more rapidly than recovery to the normal state, implying asymmetric adjustment or hysteresis. The implemented two-state Gaussian HMM does not directly test this proposition. Its homogeneous transition matrix assigns one time-invariant transition probability to each direction of movement and summarizes the fitted average persistence of the two latent states. The resulting probabilities and implied durations can describe average sojourn asymmetry, but they cannot determine whether entry responds more rapidly than exit to an evolving stress shock, whether recovery decelerates over time, or whether the transition hazards vary with the contemporaneous latent stress index. A further distinction arises from the data-generating process. The known generating states are not drawn from the homogeneous transition matrix estimated by the HMM; they are determined by whether the latent stress index lies above or below the calibrated threshold in Equation (4). The HMM is therefore a parsimonious diagnostic approximation to the simulated return process rather than a correctly specified estimate of the state-generation rule. Differences between and their implied durations may be descriptively consistent with asymmetric state occupancy, but they do not identify structural hysteresis or the relative velocity of shock entry and recovery. H3 is consequently not tested in its strong form by the present implementation. At most, the reported outputs are consistent with a weaker duration-based interpretation under the selected synthetic calibration. A direct test would require a time-varying-transition-probability model in which the transition hazards are functions of contemporaneous or lagged stress, or an event-duration framework that separately estimates entry and recovery hazards around identified stress episodes. Until such an extension is implemented, the study should report H3 as an open hypothesis rather than as a confirmed or partially confirmed empirical result. Table 8 summarizes the evidentiary status of the three hypotheses under the implemented synthetic design, distinguishing between methodological demonstration, calibration-conditional consistency, and propositions that remain untested in their strong form.
Table 8.
Evidentiary status of the study hypotheses under the implemented synthetic design.
5.5. Economic Mineral-Resource Risk Assessment Through Financial-Risk Econometrics
The preceding three subsections evaluate the study’s hypotheses; the present subsection asks a more fundamental question—what, precisely, is gained by conducting this exercise through the analytical vocabulary of financial risk engineering rather than through the vocabulary native to resource economics or industrial geology. The answer bears directly on the paper’s claim to occupy an unoccupied position within the literature. Financial risk management, over the four decades separating the Bretton Woods collapse from the present, developed a specific epistemic habit that resource economics, for institutional and disciplinary reasons, did not: the habit of treating a market’s state, not merely its level or its trend, as the primary object of inference. A bond portfolio manager does not ask only what a yield curve currently reads; she asks whether the regime generating that curve has shifted, whether the shift is likely to persist, and how a plausible future shock would propagate through the portfolio’s exposure structure under the new regime. This habit of mind, formalized through structural-break detection, Markov regime-switching, and Monte Carlo scenario propagation, is precisely what the strategic-minerals literature has lacked, not for want of relevant data, and not for want of policy urgency, both of which are amply documented (Emery et al., 2006), but for want of a disciplinary bridge connecting the mineral-security research community to the econometric toolkit that financial risk management has spent decades refining. The present study functions as that bridge, and its contribution should be read less as a novel finding about three specific minerals and more as a simulation-based methodological proof of concept: within the stated calibration, the state-based epistemology of financial risk management can be transferred to strategic-mineral systems while preserving the intended diagnostic structure and providing greater analytical resolution than qualitative exposure narratives alone. Whether this diagnostic performance is retained when the framework is calibrated with observed mineral-market data remains a question for external empirical validation.
There is a second, adjacent contribution that merits explicit articulation because it is easily overlooked amid the density of the structural-break and regime-switching results: the study’s information-technology architecture is itself part of its theoretical claim, not merely an implementation detail relegated to Section 3.7. A synthetic-data-generating process whose every parameter is disclosed, whose random seed is fixed and reported, and whose estimation pipeline is fully reproducible from a single seed value is not an incidental convenience; it is the methodological precondition for exactly the kind of internal validation exercise reported in Section 4.2 (comparing an estimated regime path against a known generating truth) that no empirical study of historical commodity prices could ever perform, because no empirical study possesses a verified ground truth against which to check its own regime classifier. In this sense, the paper’s contribution sits as comfortably within the domain of computational risk-modeling infrastructure as within mineral economics proper: it demonstrates that a disciplined, version-controlled, seed-reproducible simulation architecture, the kind of infrastructure increasingly expected of quantitative risk functions within regulated financial institutions (Rodríguez-Espíndola et al., 2022), can and should be imported wholesale into a policy domain that has, to date, largely done without it.
These policy implications are architectural rather than directly prescriptive. The present simulation shows how heterogeneous supply-chain exposures can be translated into a transparent stress-testing workflow, but it does not estimate current disruption probabilities, forecast mineral prices, or rank actual policy interventions. Any operational use would require the latent drivers, thresholds, regime parameters, and decision criteria to be estimated or externally calibrated from observed data and validated against historical or subsequently observed disruption episodes.
5.6. Positioning Relative to the Structural-Break and Regime-Switching
The financial-econometrics literature on structural breaks and regime-switching is vast, and the present study’s positioning within it must be stated with precision rather than gestured at broadly. Two threads within that literature bear most directly on the present study: first, applications of Markov-switching models to energy and industrial-commodity prices, which provide a benchmark for interpreting turbulent-state persistence (Deng et al., 2026); and second, applications of Quandt–Andrews and Bai–Perron procedures to exchange-rate and sovereign-spread series, which document the sensitivity of break-detection power to signal-to-noise conditions (Phoong et al., 2020).
What the present study adds to this literature is not a new estimator, the Chow-type sup-F screening procedure and the two-state Gaussian HMM are established methods, but a new application domain in which the internal-validation exercise described in Section 5.5 becomes possible in a way that is uncommon in empirical settings. Energy-price regime-switching studies, almost without exception, estimate their transition matrices against historical series whose true regime path is unobserved and must itself be inferred, meaning that model validation in that literature typically proceeds through in-sample fit statistics, out-of-sample forecast accuracy, or comparison against narrative crisis chronologies, none of which constitutes a direct test of classification accuracy against a known ground truth (Pavlík & Bereš, 2025). The present framework’s synthetic design permits a direct internal comparison between estimated and known generating states. An application to observed mineral-price data could use the synthetic exercise as an implementation and interpretive benchmark; however, departures could reflect model misspecification, measurement error, greater structural complexity, unobserved regime labels, or estimator limitations and should not be attributed a priori solely to violations of the idealized assumptions in Equations (2)–(5).
5.7. Positioning Relative to the Critical and Strategic Minerals
The strategic-minerals literature, considered on its own terms, has advanced a genuinely mature qualitative and semi-quantitative apparatus for characterizing exposure: Herfindahl-style concentration indices applied to producer and refiner geography (Bucciarelli et al., 2024), criticality matrices plotting economic importance against supply risk, and reserve-to-production ratios computed at the national and global level all constitute serious analytical instruments (de la Torre de Palacios & Espí Rodríguez, 2026), and the present study does not seek to displace them (Mayer & Gleich, 2015). What that literature has not yet produced, and what the present study contributes to its place, is a dynamic companion to these fundamentally static or comparative-static instruments, an architecture capable of answering not only how concentrated is this mineral’s supply chain but how would this mineral’s price and volatility behave, and for how long, were that concentration to be tested by a disruption of specified severity.
This dynamic extension is not disciplinarily unprecedented so much as disciplinarily incomplete in its prior applications (Cáceres et al., 2025). Monte Carlo simulation is itself a familiar instrument within mineral-resource economics (Ronyastra et al., 2024), where it has long been deployed to characterize the risk profile of individual extraction and processing projects (Kıral, 2025), propagating uncertainty in ore grade, capital cost, and commodity price into a distribution of project net-present-value outcomes (Del Castillo & Dimitrakopoulos, 2014). What that established practice has not yet done is apply the same simulation logic to the regime structure of the price and disruption process itself, rather than to a single project’s cash-flow uncertainty; the present framework’s contribution, read against this precedent, is therefore an extension in scope, from project-level risk quantification to market-regime risk quantification, rather than an importation of a technique wholly foreign to the mineral-resource economics tradition.
The distinction is not cosmetic. A concentration index, however, carefully constructed, is a snapshot; it cannot, by its own mathematical form, speak to regime persistence, recovery velocity, or the sensitivity of break severity to incremental stress, the very quantities Section 4.1, Section 4.2, Section 4.3 and Section 4.4 report. Where the existing literature has occasionally gestured toward dynamic characterization, it has typically done so through scenario narratives rather than through formally estimated stochastic processes, a distinction that matters enormously for the kind of quantitative prioritization exercise that stockpiling and industrial-policy budgets ultimately require (Das, 2026). The present framework’s Table 1 taxonomy, entrenched strategic strength, industrial-input exposure, midstream-constrained emergence, is deliberately constructed to be legible to a reader trained in the existing criticality-matrix tradition, while its Table 4, Table 5, Table 6 and Table 7 are deliberately constructed to supply exactly the dynamic layer that tradition has lacked. The paper’s positioning, in short, is not oppositional to the strategic-minerals literature but complementary to it in the precise sense that a volatility model is complementary to, rather than a substitute for, a balance-sheet analysis: each answers a question the other cannot.
5.8. Implications for Portfolio-Style Strategic-Mineral Allocation
The framework’s most direct practical extension lies in the construction of portfolio-style strategic-mineral risk registries analogous to the credit-risk and market-risk dashboards long used within regulated financial institutions. A standardized stress-sensitivity coefficient of the kind reported in Table 6, if subsequently calibrated and externally validated using observed price and disruption-indicator data, could function within a sovereign or corporate risk unit as a continuously updated decision-support indicator. Rather than automatically triggering policy action, the score could inform escalation protocols, stockpile-release assessments, substitution-supplier activation, or forward-contract hedging when a predefined and empirically validated threshold is approached or crossed. The Table 4, Table 5, Table 6 and Table 7 architecture therefore provides a conceptual template for the diagnostic layer of a future production risk-monitoring system, while the operational thresholds and associated policy rules would need to be estimated, validated, and governed independently using observed data.
This implication carries a specific information-technology dimension that a finance-and-ICT-literate reading of the framework brings into focus and that a purely geological or industrial-policy reading would not. A live version of the stress-sensitivity dashboard described above requires exactly the data infrastructure this paper’s Section 3.7 disclosed for its synthetic counterpart: versioned, provenance-tracked price and disruption-indicator feeds; a reproducible, auditable estimation pipeline; and a governance layer capable of distinguishing a genuine regime shift from a data artifact or reporting discontinuity. Distributed-ledger and smart-contract architectures, already deployed in supply-chain provenance tracking for conflict minerals and increasingly proposed for critical-mineral chain-of-custody verification, offer a natural technical substrate for the kind of tamper-evident, cross-jurisdictionally auditable data feed that a stress-sensitivity dashboard of institutional quality would require (Díaz et al., 2026). The present paper does not implement such an infrastructure (lies well beyond its synthetic-simulation scope) but its diagnostic architecture is precisely the analytical layer such an infrastructure would need to sit beneath, and the connection between the two is offered here as a concrete direction for applied development rather than as speculative embellishment. For portfolio managers and sovereign-wealth allocators holding direct or indirect exposure to mineral-processing equities, the standardized stress-sensitivity ordering reported in Table 6 may be interpreted as a calibration-conditional illustration of how externally validated regime metrics could contribute to hedging prioritization. Within the present synthetic environment, the rare-earth-linked exposure class is characterized by longer turbulent-state persistence and greater sensitivity to compounding stress than the boron-linked exposure class. This model-implied ordering does not establish that observed rare-earth-linked equities require more conservative position sizing or a more active monitoring overlay. If a comparable ordering were subsequently recovered from observed asset-return and supply-chain data and remained robust across alternative calibrations and model specifications, the resulting metrics could be incorporated—alongside valuation, liquidity, covariance, regulatory, and institution-specific risk considerations—into position-sizing, hedging, and regime-monitoring decisions. Table 6 should therefore be understood as a proof-of-concept input for prospective portfolio-risk governance rather than as a standalone investment recommendation (Panazan & Gheorghe, 2025).
5.9. Implications for Turkish and Comparative Industrial Policy
Türkiye’s position within the framework—combining established strength in boron, industrial-input exposure in chromium, and midstream-constrained emergence in the rare-earth-linked system—illustrates how reserve-based indicators and regime-sensitive stress metrics could provide different but potentially complementary inputs to industrial-policy assessment. Under the stated synthetic calibration, Table 6 assigns the largest stress sensitivity to the rare-earth-linked exposure class, the smallest to boron, and an intermediate value to chromium. This ordering should not be read as a direct resource-allocation rule or as evidence that the rare-earth-linked system necessarily warrants greater stockpiling or public investment than the other two systems. Rather, it demonstrates how a future empirically calibrated application might supplement reserve magnitude with information on processing concentration, substitution rigidity, logistics exposure, and simulated regime persistence. Any operational prioritization among export development, strategic stockpiling, midstream investment, and crisis-contingency planning would additionally require observed production and trade data, processing-capacity assessments, disruption histories, cost-effectiveness analysis, technological feasibility, and explicit policy objectives.
In an operational application, the framework would support a tiered warning protocol rather than a universal SSC cutoff. A national raw-materials or security authority could define mineral-specific alert levels by jointly monitoring an externally calibrated stress index, repeated sup-F threshold exceedance, and the estimated probability and expected duration of the turbulent state. An initial watch level could require simultaneous increases in stress and turbulent-state probability, whereas higher intervention levels could require persistent signals across consecutive reporting periods together with evidence on inventory coverage, import concentration, procurement lead times, and substitution feasibility. Possible responses could then progress from enhanced monitoring and supplier engagement to accelerated procurement, inventory release, supplier diversification, or emergency substitution measures. The synthetic values reported here do not define operational numerical cutoffs; those cutoffs would require back testing against observed disruption episodes and explicit assessment of the costs of false alarms and missed events.
Chromium’s intermediate position across the diagnostics in Section 4.1, Section 4.2 and Section 4.3 provides a useful illustration of this decision-support role. Within the present calibration, its standardized stress-sensitivity coefficient of 1.89 lies between boron’s 1.57 and the rare-earth-linked system’s 2.89, indicating a model-implied exposure profile that is neither as muted as the boron archetype nor as stress-sensitive as the rare-earth-linked archetype. This result is consistent with examining midstream capacity and ferrochrome-refining dependence as relevant policy dimensions, but it does not determine the appropriate scale, timing, or urgency of investment. Those decisions would require external empirical calibration and comparison with alternative policy uses of a constrained industrial-policy budget. Accordingly, the three-system ordering is best interpreted as a transparent scenario-based screening device that can identify questions for further policy analysis, rather than as a prescriptive ranking of actual investment or stockpiling priorities.
5.10. Limitations and Threats
The study has six principal limitations. First, the analysis is entirely synthetic. The latent stress drivers, mineral-specific weights, regime-conditional return parameters, and scenario shifts are informed by the exposure logic developed in Section 2 but are not estimated jointly from observed mineral-price and supply-chain data. The results therefore establish the behavior of the proposed analytical architecture under a disclosed calibration; they do not estimate the historical fragility, current disruption probability, or future price distribution of any mineral market. Second, the cross-mineral calibration varies several dimensions simultaneously, including stress-driver weights, regime-conditional means, autoregressive parameters, conditional volatilities, and stress loadings. The resulting boron–chromium–rare-earth-linked ordering cannot be attributed causally to processing concentration, substitution rigidity, logistics exposure, or any other individual component. Isolating these effects would require factorial sensitivity analysis or controlled counterfactual simulations that vary one calibration dimension at a time. Third, the generating regime is determined by a calibrated threshold applied to the latent stress index, whereas the diagnostic regime layer is a parsimonious two-state Gaussian HMM with state-dependent means and variances. The HMM does not impose the regime-dependent autoregressive structure used to generate returns, and its homogeneous transition matrix is not the mechanism that generates the known states. The comparison between estimated and known states is therefore a test of classification under deliberate model simplification rather than a demonstration of correct structural specification. In addition, the near-degenerate turbulent-state prevalence under the criticality scenario limits the informativeness of Cohen’s κ and requires joint interpretation with the known state shares. Fourth, the Chow-type sup-F procedure screens each return path for a single candidate mean shift. It does not jointly estimate mean and variance breaks, accommodate multiple structural breaks, or recover the complete sequence of threshold-induced regime transitions. The maximizing month should therefore be interpreted as the strongest two-segment approximation within the trimmed search region rather than as the first true turbulent-state onset. The fixed threshold of 8.85 is used as a screening rule and is not re-estimated through a simulation-specific finite-sample null distribution. Fifth, the full-path diagnostics are based on N = 3000 simulated paths per mineral–scenario cell, while the computationally intensive HMM estimates use a fixed subsample of n = 400 paths per cell. These sample sizes constitute the final design used in the study, but no separate Monte Carlo convergence experiment is reported to establish the sensitivity of every metric to larger replication counts or alternative HMM subsamples. The implementation also does not calculate percentile confidence intervals for all reported summary metrics. The reported outputs should accordingly be interpreted as reproducible Monte Carlo summaries and distributional diagnostics conditional on the selected computational design. Sixth, the standardized stress-sensitivity regression pools the three scenarios and uses path-level mean realized stress as a single explanatory variable for QLR. Its slope summarizes association within the simulated design rather than a structural economic elasticity, and the relatively low R2 values indicate that substantial path-level QLR variation remains unexplained by this regressor. Likewise, the KS tests establish cross-scenario differences in simulated QLR distributions but do not identify whether those differences arise from location, dispersion, tail behavior, or a particular economic mechanism. These limitations define the boundary between the paper’s methodological contribution and the empirical claims that remain for future research. The study also does not implement a global variance-based sensitivity decomposition or an exhaustive perturbed-parameter grid. Consequently, it cannot determine whether the reported mineral ordering is robust to all plausible joint changes in the stress weights and regime parameters. This limitation does not affect the internal reproducibility of the disclosed calibration, but it restricts generalization beyond that calibration.
5.11. Directions for Future Research
Future research should extend the framework along five complementary directions. The priority is external empirical calibration. Mineral-price series should be combined with observed measures of production and processing concentration, trade dependence, substitution possibilities, inventories, freight conditions, sanctions, export restrictions, and documented disruption events (Higgins & Ofori-Acheampong, 2018). This would permit estimation or disciplined external calibration of the latent drivers and thresholds and would allow the simulated ordering to be compared with observed market behavior. Second, the calibration architecture should be evaluated using systematic sensitivity and identification designs. Global sensitivity analysis, factorial experiments, and one-factor-at-a-time counterfactuals could distinguish the contributions of concentration, substitution rigidity, logistics friction, regime means, volatility, persistence, and stress loading. Such designs would determine whether the reported cross-mineral ordering is robust or dependent on combinations of parameters. Third, the statistical layers should be expanded. A priority for further work is a prespecified global sensitivity analysis that varies the stress weights, regime means, persistence parameters, volatilities, and stress loadings jointly. Sobol indices or a structured perturbed-parameter grid could then quantify which calibration dimensions drive each diagnostic and whether the boron–chromium–rare-earth-linked ordering survives plausible alternative parameter combinations. Structural-break analysis could incorporate multiple-break procedures, changes in both mean and variance, simulation-derived critical values, and comparisons with alternative change-point algorithms. The regime layer could be extended to Markov-switching autoregressions, hidden semi-Markov models, time-varying transition probabilities, or duration models. These extensions would permit direct evaluation of state-duration dependence, stress-conditioned transition hazards, and the entry–recovery asymmetry proposed in H3. Fourth, computational uncertainty should be assessed explicitly. Future implementations should report replication-count convergence experiments, alternative random seeds, HMM subsample sensitivity, initialization sensitivity, and interval estimates for the principal simulation summaries. Comparative performance across alternative numbers of latent states and emission specifications should also be evaluated using appropriate out-of-sample or simulation-based criteria rather than relying solely on in-sample fit. Fifth, the framework could be developed into a prospective decision-support system after empirical validation. Such an extension would require continuously updated data, transparent model-governance procedures, predetermined alert thresholds, back testing against historical disruptions, and evaluation of false-positive and false-negative costs (Billio et al., 2006). Only after these stages would it be appropriate to assess whether the architecture improves inventory, procurement, hedging, diversification, or strategic-stockpiling decisions.
6. Conclusions
This study examined whether a quantitative risk-assessment architecture combining structural-break detection, Markov regime-switching, and Monte Carlo scenario propagation could be implemented as a reproducible methodological framework for strategic-mineral stress testing, and whether its diagnostic outputs could recover exposure differences embedded in an explicitly stated synthetic calibration. Türkiye’s boron, chromium, and rare-earth-linked mineral systems were represented as a single-jurisdiction cross-section of contrasting exposure archetypes within a fully disclosed, seed-reproducible data-generating environment. The conclusions that follow therefore concern the framework’s computational reproducibility, internal statistical behavior, and calibration-conditional outputs. They do not establish its external empirical validity for observed mineral markets, which remains to be evaluated using historical price, trade, processing-capacity, logistics, and disruption data.
- The integrated architecture provides a reproducible proof of concept for regime-sensitive strategic-mineral stress testing: Within the controlled synthetic environment, the pipeline of Section 3 (synthetic data generation, structural-break detection, Markov regime-switching, and scenario-based aggregation) operated coherently across the three exposure archetypes. Detection statistics generally increased with scenario severity, estimated turbulent-state persistence rose between the baseline and escalation environments before approaching a plateau, and the stress-sensitivity measure preserved the ordering embedded in the calibration. These results demonstrate that the diagnostic architecture can recover and summarize selected properties of the specified data-generating process without receiving the latent regime labels during estimation. They do not demonstrate that the methods require no domain-specific adaptation, that they outperform alternative approaches on observed mineral data, or that the reported cross-mineral ordering characterizes actual markets. The principal methodological contribution is therefore a transparent and testable architecture that establishes the conditions for subsequent empirical calibration, robustness analysis, and external validation.
- H1 is recovered within the designed simulation environment, but it is not empirically confirmed for observed mineral markets. Under the stated calibration, estimated turbulent-state persistence increases markedly between the baseline and escalation scenarios and then approaches a plateau between escalation and criticality. For the boron archetype, the expected duration of the turbulent state also exceeds that of the calm state under compound stress. Because the threshold rule and regime-dependent parameters are specified ex ante in the data-generating process, these results demonstrate that the estimation architecture can recover the designed nonlinear persistence pattern without observing the generating regime labels. They do not establish that an equivalent threshold, plateau, or duration reversal exists in historical mineral-market data.
- H2 is conditionally reproduced by the diagnostics within the calibrated simulation. The sup-F threshold-exceedance rates, standardized stress-sensitivity coefficients, and Kolmogorov–Smirnov comparisons broadly preserve the model-implied ordering of boron, chromium, and the rare-earth-linked exposure class, whereas the HMM persistence estimates do not reproduce an identical ordering in every scenario. However, these diagnostics are complementary transformations of observations produced by a common data-generating process whose exposure weights and regime parameters were specified in advance. Their convergence therefore indicates internal diagnostic consistency and successful recovery of calibration-implied differences, rather than independent empirical confirmation of the ordering. The results show how stronger assumed processing concentration and substitution rigidity can be translated into greater simulated fragility; determining whether those factors dominate geological scarcity or other drivers in observed markets requires external empirical estimation and robustness testing.
- H3 remains untested in its strongest entry-versus-exit formulation. The homogeneous transition matrix can summarize differences in expected regime duration, and the simulations show that turbulent-state sojourns generally lengthen as the calibrated stress environment intensifies. It cannot determine whether the instantaneous hazard of entering turbulence differs systematically from the hazard or speed of recovery after controlling for duration. The reported results are therefore consistent with a weaker duration-asymmetry interpretation, but they neither confirm nor reject asymmetric transition velocity. A time-varying-transition-probability specification, in which transition probabilities respond directly to contemporaneous or lagged stress, is required for a direct test of that hypothesis.
- The synthetic design permits internal classification assessment against known generating states. Within the controlled simulation, Cohen’s κ provides a chance-corrected summary of agreement between the classified and known regime paths, although its interpretation becomes limited when one state dominates the marginal distribution. The classification results should therefore be interpreted jointly with the known state prevalence, fitted transition probabilities, and implied state durations rather than as stand-alone evidence of estimator accuracy. Raw agreement and Matthews-correlation coefficients were not retained as primary outputs of the finalized simulation archive and are therefore not reported retrospectively. External applications would require evaluation through out-of-sample forecasting, event-based comparison, alternative regime definitions, sensitivity analysis, and robustness to model misspecification.
- The Türkiye triad provides a common-jurisdiction illustration of contrasting calibrated exposure archetypes. Representing boron, chromium, and the rare-earth-linked system within the same national setting reduces some descriptive heterogeneity that would arise from comparing unrelated jurisdictions and helps organize the scenario design around different supply-chain structures. It does not isolate exposure architecture from mineral identity in a causal sense, because the archetype definitions, driver weights, and regime parameters are jointly calibrated and are not estimated from observed cross-mineral variation. The ordering in Section 4 should consequently be attributed to the complete specified calibration rather than to independently identified effects of processing concentration, substitution rigidity, or logistics friction. Separating these effects empirically would require observed multi-mineral or multi-country data and a research design capable of controlling for institutional, technological, market, and jurisdictional confounders.
- The findings illustrate how a differentiated policy posture could be evaluated after empirical calibration. Reserve-based indicators may inform export and trade planning, whereas externally validated regime-fragility metrics could complement stockpiling, crisis-contingency, and midstream-capacity assessments. Under the present synthetic calibration, the rare-earth-linked system produces the strongest stress-sensitivity signal, chromium occupies an intermediate position, and boron produces the weakest. These model-implied differences do not establish actual policy priorities or investment requirements.
- The study’s findings should be read as an internally evaluated methodological proof of concept requiring external empirical application and validation, not as an empirical claim about historical mineral-market behavior. Every quantitative result reported in Section 4 was produced from a disclosed synthetic construction rather than observed price histories. The appropriate inference is that the diagnostic architecture is computationally capable of recovering and summarizing selected calibration-implied features of the disclosed synthetic data-generating process. Empirical calibration against observed commodity-price and supply-chain data remains a necessary next stage of the research program.
- The study’s contribution is primarily architectural and methodological. It provides a transparent factor-based structure through which disruption intensity, processing concentration, substitution rigidity, and logistics friction can be mapped into synthetic-stress indices, break diagnostics, and regime metrics under explicitly disclosed assumptions. The architecture is auditable and reproducible within its simulated environment and allows the estimators to be assessed against known generating states. It does not establish that the selected factors explain actual mineral-market fragility or that the current parameterization can be transferred unchanged across minerals and jurisdictions. Subject to subsequent empirical calibration, sensitivity analysis, comparison with alternative models, and external validation, the framework could develop into a reusable decision-support architecture connecting geological information, supply-chain structure, and financial-risk diagnostics.
Strategic-mineral assessment need not treat geological description, supply-chain analysis, and quantitative risk diagnostics as separate analytical domains. The present study provides a reproducible proof of concept for integrating these perspectives within a common simulation architecture while preserving a clear distinction between assumptions, internally generated results, and externally validated claims. Its immediate contribution is therefore not a definitive ranking of Türkiye’s mineral systems or a ready-to-deploy policy instrument, but a transparent methodological platform through which such rankings and applications can subsequently be tested using observed data.
Supplementary Materials
The following supporting information can be downloaded at: https://www.mdpi.com/article/10.3390/commodities5040024/s1. Supplementary File S1: dataset_generation_summary.csv. Summary of the dataset-generation procedure, including the relevant generation settings and dataset-level summary information; Supplementary File S2: dataset_raw_sample.csv. Raw sample dataset used to illustrate and support the empirical/simulation analysis; Supplementary File S3: section4_results.json. Machine-readable output file containing the complete numerical results reported and used in Section 4; Supplementary File S4: sim_section4.py. Python source code used to generate the dataset, conduct the analyses/simulations, and reproduce the results presented in Section 4.
Author Contributions
Conceptualization, H.T.Ü. and A.F.M.; methodology, H.T.Ü., A.F.M. and Ö.U.V.; software, H.T.Ü. and Ö.U.V.; validation, H.T.Ü., A.F.M., Ö.U.V., G.G. and M.A.N.; formal analysis, A.F.M. and M.A.N.; investigation, H.T.Ü., A.F.M. and G.G.; resources, A.F.M. and G.G.; data curation, H.T.Ü. and Ö.U.V.; writing—original draft preparation, H.T.Ü.; writing—review and editing, H.T.Ü., A.F.M., Ö.U.V. and G.G.; visualization, H.T.Ü. and G.G.; supervision, A.F.M. and M.A.N.; project administration, A.F.M. and M.A.N. All authors have read and agreed to the published version of the manuscript.
Funding
This research received no external funding.
Data Availability Statement
A representative raw data sample, a dataset-generation summary, machine-readable analytical outputs, and the Python code used to generate and analyze the data are available in the Supplementary Materials. Specifically, Supplementary Files S1–S4 include the dataset-generation summary, a raw data sample, the results file, and the corresponding Python script, respectively. The complete underlying dataset is not publicly available because it is computationally generated at scale; however, the provided code, generation summary, raw sample, and reported outputs enable inspection of the data structure and reproduction of the computational workflow. The complete dataset can be regenerated by executing the Python code provided in Supplementary File S4 using the parameters documented in Supplementary File S1.
Acknowledgments
The authors gratefully acknowledge the support of colleagues and institutions that contributed to the development of this research.
Conflicts of Interest
Authors Hasan Tolga Ünal, Arif Furkan Mendi, Özgür Umut Vurgun and Mehmet Akif Nacar were employed by the company HAVELSAN Inc. The remaining authors declare that the research was conducted in the absence of any commercial or financial relationships that could be construed as a potential conflict of interest.
Abbreviations
The following abbreviations are used in this manuscript:
| AR | Autoregressive |
| AR(1) | First-Order Autoregressive Process |
| BIC | Bayesian Information Criterion |
| EM | Expectation–Maximization |
| HHI | Herfindahl–Hirschman Index |
| ICT | Information and Communication Technology |
| KS | Kolmogorov–Smirnov |
| MLE | Maximum Likelihood Estimation |
| MS | Markov Switching |
| PELT | Pruned Exact Linear Time |
| QLR | Quandt Likelihood Ratio |
| QLR/sup-Wald | Quandt Likelihood Ratio/supremum Wald Test |
| REE | Rare Earth Elements |
| SSC | Standardized Stress-Sensitivity Coefficient |
| SSR | Sum of Squared Residuals |
| TVTP | Time-Varying Transition Probabilities |
References
- Abi Morshed, A., Andreou, E., & Boldea, O. (2018). Structural break tests robust to regression misspecification. Econometrics, 6(2), 27. [Google Scholar] [CrossRef] [Scilit]
- Ahemd, R., Manik, K. H., Habib, M. A., Nirob, M. A. R., Nath, A., Hossen, M. S., Mim, J. J., & Hossain, N. (2026). Multiscale modeling and simulation of composite materials: Methods, AI integration, and challenges. Materials Today Communications, 51, 114884. [Google Scholar] [CrossRef] [Scilit]
- Akmaz, R. M., Bilen, M., & Özarslan, A. (2025). A review of chromite residues secondary raw material potential in Türkiye. Recep Tayyip Erdogan University Journal of Science and Engineering, 6(1), 476–490. [Google Scholar] [CrossRef] [Scilit]
- Aldasoro, I., Gambacorta, L., Korinek, A., Shreeti, V., & Stein, M. (2025). Intelligent financial system: How AI is transforming finance. Journal of Financial Stability, 81, 101472. [Google Scholar] [CrossRef] [Scilit]
- Amoah, M., Bazilian, M., & Matisek, J. (2026). Strategy at the source: A scenario-based network analysis of defense critical minerals (DCMs) in U.S. national security doctrine. Comparative Strategy, 45, 504–531. [Google Scholar] [CrossRef] [Scilit]
- Aslan, Y., & Ari, I. (2026). Strategic review of critical minerals policies in Türkiye: Lessons from the US, China and the EU. Resources Policy, 118, 105951. [Google Scholar] [CrossRef] [Scilit]
- Bae, J., & Yoon, S. (2026). Advancing sustainable mining: A comparative analysis of research trends and knowledge spillover in critical mineral exploration. Sustainability, 18(1), 424. [Google Scholar] [CrossRef] [Scilit]
- Billio, M., Caporin, M., & Gobbo, M. (2006). Flexible dynamic conditional correlation multivariate GARCH models for asset allocation. Applied Financial Economics Letters, 2(2), 123–130. [Google Scholar] [CrossRef] [Scilit]
- Bucciarelli, P., Hache, E., & Mignon, V. (2024). Evaluating criticality of strategic metals: Are the Herfindahl–Hirschman Index and usual concentration thresholds still relevant? (EconomiX Working Paper No. 2024-3). EconomiX, Université Paris Nanterre. Available online: https://economix.fr/pdf/dt/2024/WP_EcoX_2024-3.pdf (accessed on 31 August 2026).
- Cáceres, A., Emery, X., Ibarra, F., Pérez, J., Seguel, S., Fuster, G., Pérez, A., & Riquelme, R. (2025). A stochastic framework for mineral resource uncertainty quantification and management at Compañía Minera Doña Inés de Collahuasi. Minerals, 15(8), 855. [Google Scholar] [CrossRef] [Scilit]
- Chepeliev, M., Bekkers, E., Iyer, G., Qiu, Y., Wojtowicz, K., Yarlagadda, B., & Yilmaz, A. N. (2026). Critical minerals and the global supply chain. Annual Review of Resource Economics, 18, 135–163. [Google Scholar] [CrossRef] [Scilit]
- Çakmak, İ. (2006). Elazığ–Guleman yöresi kromit cevheri yataklarının analizi ve analiz sonuçlarına göre kullanım alanlarının araştırılması [Analysis of chromite ore deposits in the Elazığ–Guleman region and investigation of their application areas based on the analysis results]. Fırat Üniversitesi Doğu Araştırmaları Dergisi, 4(2), 20–24. [Google Scholar]
- Çimen, O., & Dönmez, C. (2026, April 13–17). Geological formation environments of rare earth element deposits: A global review with examples from Türkiye. 78th Geological Congress of Türkiye with International Participation, Ankara, Türkiye. [Google Scholar]
- Das, R. C. (2026). Strategic financial management: Navigating success in a dynamic business world. SSRN. [Google Scholar] [CrossRef] [Scilit]
- de la Torre de Palacios, L., & Espí Rodríguez, J. A. (2026). Analysis of the risk of disruption to the supply of phosphate rock. Commodities, 5(3), 18. [Google Scholar] [CrossRef] [Scilit]
- Del Castillo, F., & Dimitrakopoulos, R. (2014). Joint effect of commodity price and geological uncertainty over the life of mine and ultimate pit limit. Mining Technology, 123(4), 207–219. [Google Scholar] [CrossRef] [Scilit]
- Deng, X., Aruga, K., & Tang, C. (2026). Crisis-regime dynamic volatility spillovers in U.S. commodity markets: A Bayesian mixture-identified SVAR approach. Risks, 14(4), 75. [Google Scholar] [CrossRef] [Scilit]
- Díaz, F., Cerna, N., Liza, R., & Motta, B. (2026). Blockchain in mining and mineral supply chains: A systematic mapping review of traceability, governance, and operational coordination. Logistics, 10(5), 118. [Google Scholar] [CrossRef] [Scilit]
- Dursun, C., & Erhan Bulut, Z. (2025). Kritik mineraller, mineral güvenlik ortaklığı ve Türkiye [Critical minerals, minerals security partnership and Türkiye]. Necmettin Erbakan Üniversitesi Hukuk Fakültesi Dergisi, 8(2), 540–599. [Google Scholar] [CrossRef] [Scilit]
- Emery, X., Ortiz, J. M., & Rodríguez, J. J. (2006). Quantifying uncertainty in mineral resources by use of classification schemes and conditional simulations. Mathematical Geology, 38, 445–464. [Google Scholar] [CrossRef] [Scilit]
- Engin, T., Balcı, M., Sümer, Y., & Özkan, Y. Z. (1981). General geological setting and the structural features of the Guleman peridotite unit and the chromite deposits (Elazığ, Eastern Turkey). Bulletin of the Mineral Research and Exploration, 95–96, 77–101. [Google Scholar]
- Etimine USA Inc. (2026). Boron as the rising value of Turkey. Available online: https://etimineusa.com/boron-in-turkey/ (accessed on 4 September 2026).
- Gachomo, D. W., Gichuhi, A. W., & Wanjoya, A. (2015). The power of the pruned exact linear time (PELT) test in multiple changepoint detection. American Journal of Theoretical and Applied Statistics, 4(6), 581–586. [Google Scholar] [CrossRef] [Scilit]
- Graedel, T. E., Harper, E. M., Nassar, N. T., Nuss, P., & Reck, B. K. (2015). Criticality of metals and metalloids. Proceedings of the National Academy of Sciences, 112(14), 4257–4262. [Google Scholar] [CrossRef] [Scilit] [PubMed]
- Gültekin, A. H., Örgün, Y., & Suner, F. (2003). Geology, mineralogy and fluid inclusion data of the Kızılcaören fluorite–barite–REE deposit, Eskişehir, Turkey. Journal of Asian Earth Sciences, 21, 365–376. [Google Scholar] [CrossRef] [Scilit]
- Higgins, M., & Ofori-Acheampong, F. (2018). A Markov regime-switching model with time-varying transition probabilities for identifying asset price bubbles. International Journal of Economics and Finance, 10(4), 1–11. [Google Scholar] [CrossRef] [Scilit][Green Version]
- Kılıç, A. M., Kahraman, E., & Kılıç, Ö. (2018, November 14–16). Place of Turkey in the world boron production and importance. International Congress on Engineering and Architecture (ENAR-2018), Alanya, Turkey. [Google Scholar]
- Kıral, I. A. (2025). Contextual evaluation of risk identification techniques for construction projects: Comparative insights and a decision-support model. Buildings, 15(20), 3806. [Google Scholar] [CrossRef] [Scilit]
- Korley, M., & Giouvris, E. (2021). The regime-switching behaviour of exchange rates and frontier stock market prices in Sub-Saharan Africa. Journal of Risk and Financial Management, 14(3), 122. [Google Scholar] [CrossRef] [Scilit]
- Koroleva, A., Portnov, V., Cheskidov, V., Mynbaev, M., & Urazbekov, A. (2026). Resource potential of rare earth metals in the context of green production and circular economy of energy systems. E3S Web of Conferences, 733, 03002. [Google Scholar] [CrossRef] [Scilit]
- Leal Filho, W., Kotter, R., Özuyar, P. G., Abubakar, I. R., Eustachio, J. H. P. P., & Matandirotya, N. R. (2023). Understanding rare earth elements as critical raw materials. Sustainability, 15(3), 1919. [Google Scholar] [CrossRef] [Scilit]
- Liu, J., Liu, Y., Ren, L., Li, X., & Wang, S. (2025). Trends and trajectories: A bibliometric analysis of financial risk (2015–2024). International Journal of Financial Studies, 13(3), 132. [Google Scholar] [CrossRef] [Scilit]
- Mayer, H., & Gleich, B. (2015). Measuring criticality of raw materials: An empirical approach assessing the supply risk dimension of commodity criticality. Natural Resources, 6(1), 56–78. [Google Scholar] [CrossRef]
- Muthuramu, P., & Uma Maheswari, T. (2019). Tests for structural breaks in time series analysis: A review of recent development. Shanlax International Journal of Economics, 7(4), 66–79. [Google Scholar] [CrossRef] [Scilit]
- Nate, S., Bilan, Y., Kurylo, M., Lyashenko, O., Napieralski, P., & Kharlamova, G. (2021). Mineral policy within the framework of limited critical resources and a green energy transition. Energies, 14(9), 2688. [Google Scholar] [CrossRef] [Scilit]
- Panazan, O., & Gheorghe, C. (2025). Strategic risk spillovers from rare earth markets to critical industrial sectors. International Journal of Financial Studies, 13(3), 156. [Google Scholar] [CrossRef] [Scilit]
- Pavlík, M., & Bereš, M. (2025). Effects of electricity price volatility, energy mix and training interval on prediction accuracy: An investigation of adaptive and static regression models for Germany, France and the Czech Republic. Energies, 18(15), 3893. [Google Scholar] [CrossRef] [Scilit]
- Phoong, S. W., Phoong, S. Y., & Phoong, K. H. (2020). Analysis of structural changes in financial datasets using the breakpoint test and the Markov switching model. Symmetry, 12(3), 401. [Google Scholar] [CrossRef] [Scilit]
- Pirajno, F., Ünlü, T., Dönmez, C., & Şahin, M. B. (Eds.). (2019). Mineral resources of Turkey. Springer. [Google Scholar] [CrossRef] [Scilit]
- Ren, J., & Niu, Z. (2025). CMCPS: A model copyright protection scheme based on Cohen’s kappa statistic. Results in Engineering, 27, 106775. [Google Scholar] [CrossRef] [Scilit]
- Rodríguez-Espíndola, O., Chowdhury, S., Dey, P. K., Albores, P., & Emrouznejad, A. (2022). Analysis of the adoption of emergent technologies for risk management in the era of digital manufacturing. Technological Forecasting and Social Change, 178, 121562. [Google Scholar] [CrossRef] [Scilit]
- Ronyastra, I. M., Saw, L. H., & Low, F. S. (2024). Monte Carlo simulation-based financial risk identification for industrial estate as post-mining land usage in Indonesia. Resources Policy, 89, 104639. [Google Scholar] [CrossRef] [Scilit]
- Saadaoui, J., Smyth, R., & Vespignani, J. (2025). Ensuring the security of the clean energy transition: Examining the impact of geopolitical risk on the price of critical minerals. Energy Economics, 142, 108195. [Google Scholar] [CrossRef] [Scilit]
- Saduov, A., Zholtayev, G., Togizov, K., Umarbekova, Z., Zhumabay, N., & Amangeldi, N. (2026). AOA-constrained, calibrated random-forest prospectivity mapping for Au-Ag in Nevada Great Basin: Spatially independent validation, uncertainty, and decision-focused top-k targets. Minerals, 16(9), 886. [Google Scholar] [CrossRef] [Scilit]
- Sari, L. K., Bachtiar, M., Achsani, N. A., & Lestari, R. (2026). Dynamic interlinkages between energy, food and metal prices under the geopolitical tension. Resources, 15(5), 61. [Google Scholar] [CrossRef] [Scilit]
- Sultana, N. (2026). Volatility regimes and structural shifts in geopolitical risk: Evidence from GARCH and breakpoint analysis. International Review of Economics & Finance, 105, 104803. [Google Scholar] [CrossRef] [Scilit]
- Şensöz, H., Sayın, Z. E., Savaş, M., & Erdoğan, Y. (2021). Emet bor üretim tesisleri atıklarının lityum içeriğinin incelenmesi [Investigation of the lithium content of wastes from Emet boron production facilities]. Afyon Kocatepe Üniversitesi Fen ve Mühendislik Bilimleri Dergisi, 21(6), 1460–1469. [Google Scholar] [CrossRef] [Scilit]
- Taşcı, H. (2026). Borun enerji güvenliği ve çevresel sürdürülebilirlik üzerindeki etkileri [The effects of boron on energy security and environmental sustainability]. Bor Dergisi, 11(2), 79–95. [Google Scholar] [CrossRef] [Scilit]
- Uçurum, A., Koptagel, O., & Lechler, P. (2006). Main-component geochemistry and platinum-group-element potential of Turkish chromite deposits, with emphasis on the Muğla area. International Geology Review, 48(3), 241–254. [Google Scholar] [CrossRef] [Scilit]
- Vespignani, J., & Smyth, R. (2024). Artificial intelligence investments reduce risks to critical mineral supply. Nature Communications, 15, 7304. [Google Scholar] [CrossRef] [Scilit] [PubMed]
- Vivoda, V., Matthews, R., & Andresen, J. (2025). Securing defense critical minerals: Challenges and U.S. strategic responses in an evolving geopolitical landscape. Comparative Strategy, 44(2), 281–315. [Google Scholar] [CrossRef] [Scilit]
- Vivoda, V., Matthews, R., & McGregor, N. (2024). A critical minerals perspective on the emergence of geopolitical trade blocs. Resources Policy, 89, 104587. [Google Scholar] [CrossRef] [Scilit]
- Whittle, D., & Yellishetty, M. (2023). Critical minerals: A criticality assessment approach. In A. Işıldar, E. D. van Hullebusch, & D. Huisingh (Eds.), Critical materials and sustainability transition (pp. 102–130). CRC Press. [Google Scholar] [CrossRef] [Scilit]
- Zhang, L., & Wang, C. (2026). Reframing historical GIS: From tools and infrastructure toward value-oriented knowledge production. ISPRS International Journal of Geo-Information, 15(8), 362. [Google Scholar] [CrossRef] [Scilit]
- Zhao, Y., Liu, X., & Cheng, R. (2026). Dynamic feature selection with distributional Markov chain error correction for financial time series forecasting. Applied Soft Computing, 194, 114906. [Google Scholar] [CrossRef] [Scilit]
- Zhou, J., & Månberger, A. (2024). Critical minerals and great power competition: An overview. Stockholm International Peace Research Institute. [Google Scholar] [CrossRef] [Scilit]
- Zhou, P., Shen, H., Zhou, Q., Shao, L., Zheng, J., Zou, Y., Sun, L., Xiao, X., Liang, J., Wang, Y., Fan, X., & Chen, L. (2026). Transformative discovery of rare-earth functional materials for energy and electronics via machine learning. eScience Energy, 2(2), 100061. [Google Scholar] [CrossRef] [Scilit]
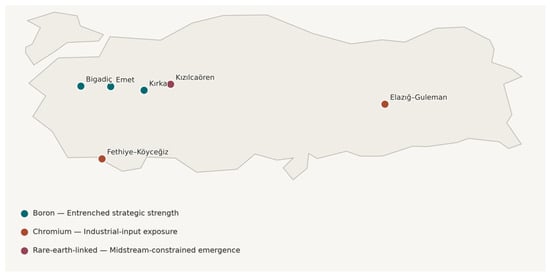
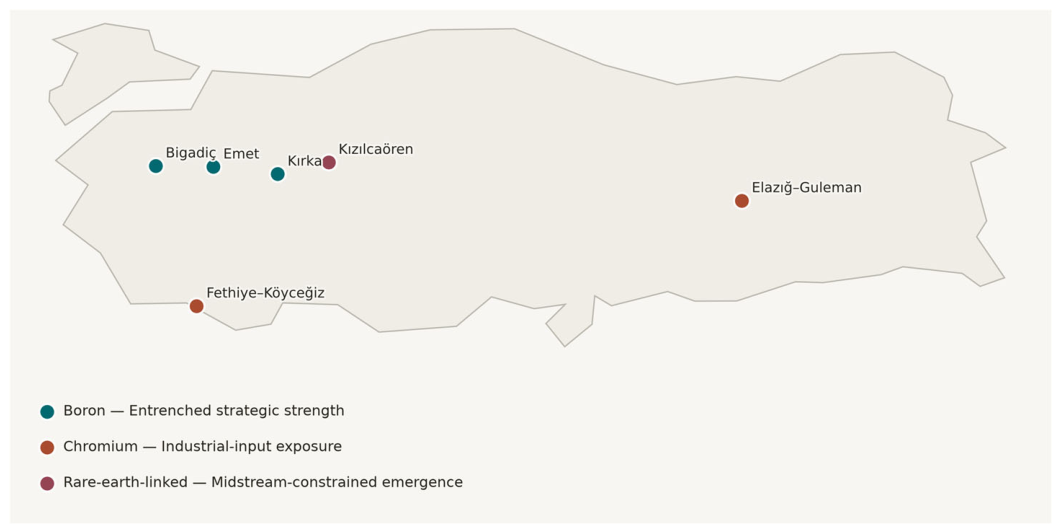
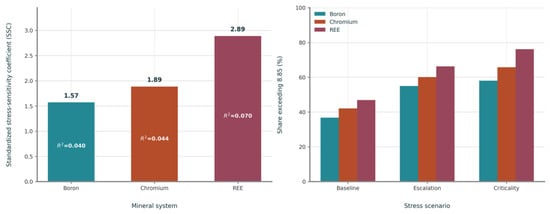
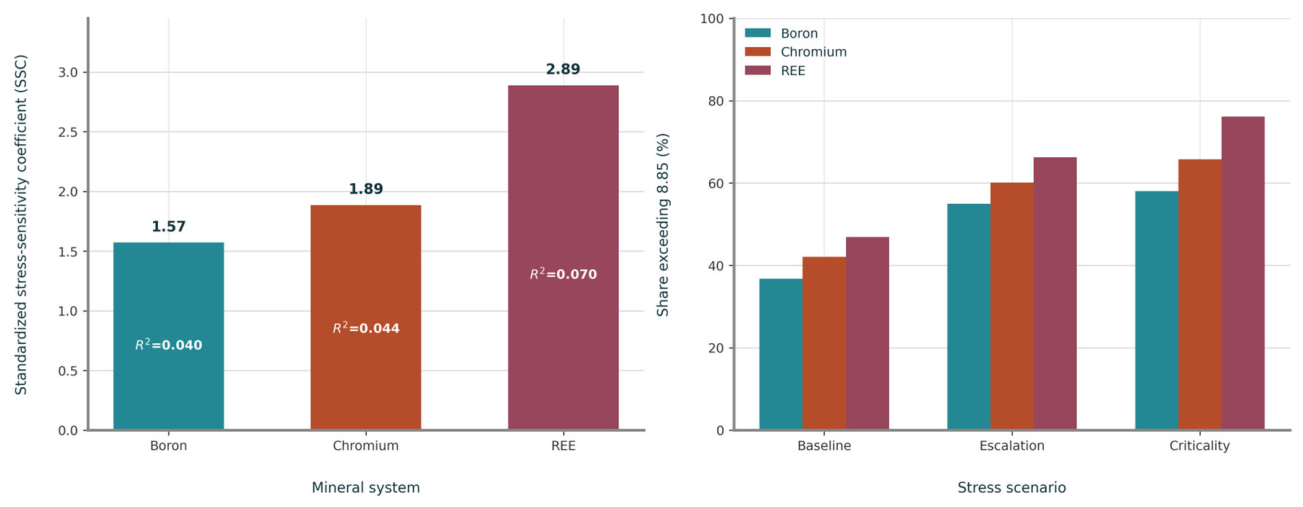
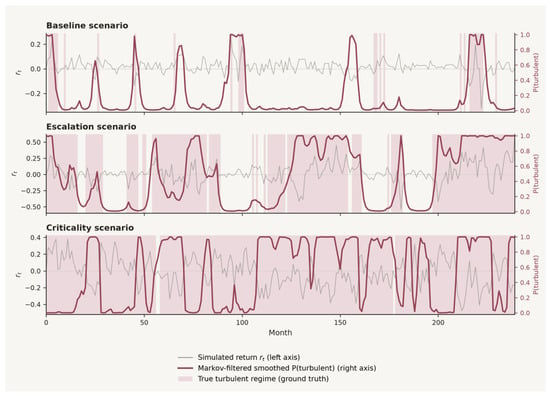
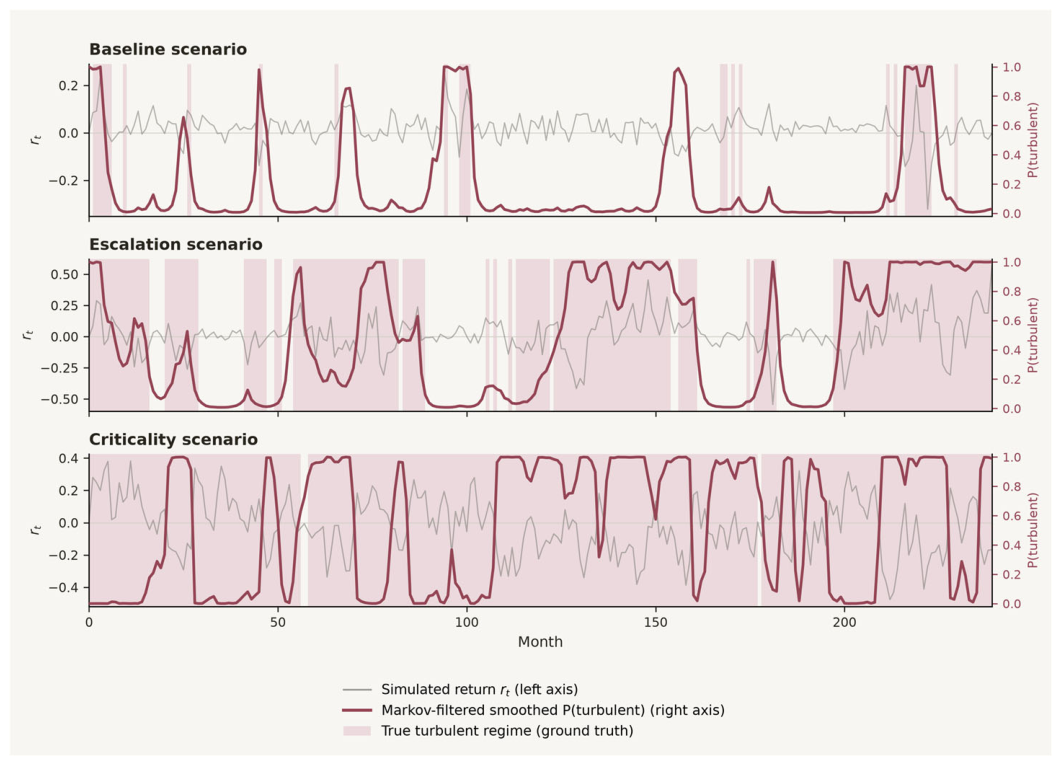

Disclaimer/Publisher’s Note: The statements, opinions and data contained in all publications are solely those of the individual author(s) and contributor(s) and not of MDPI and/or the editor(s). MDPI and/or the editor(s) disclaim responsibility for any injury to people or property resulting from any ideas, methods, instructions or products referred to in the content. |
© 2026 by the authors. Licensee MDPI, Basel, Switzerland. This article is an open access article distributed under the terms and conditions of the Creative Commons Attribution (CC BY) license.