


Abstract
This study investigates the flow and economic valuation of recyclable materials across fifteen Secondary Transfer Stations (STSs) in Dhaka North City Corporation (DNCC), Bangladesh, with the aim of understanding how market dynamics influence material recovery and circular economy potential. Primary data were collected through field surveys, structured questionnaires administered to 50 waste workers, five waste dealers and five local traders. Recovered materials were classified into six major categories, paper, plastic, metal, glass, electronic waste (e-waste), and other materials with further sub-categorization, to capture price variations and material characteristics. The results reveal a highly differentiated recycling market, with prices varying by more than an order of magnitude across materials. High-value materials, including copper wire, scrap aluminum, scrap metal, and electrical wire, are consistently recovered, whereas medium-value materials such as HDPE, PET, polypropylene, PVC, LDPE, Styrofoam, plastic crates, and mixed plastics are recovered selectively depending on market demand. In contrast, low-value materials, including packaging cartons, white paper, glass items, mixed LDPE, damaged LED lights, and mixed wastepaper, are frequently discarded due to weak economic incentives. Despite spatial and socioeconomic differences across STSs, price variability remains relatively low, indicating an integrated city-wide recycling market driven by active trader networks and broader commodity trends. To the best of our knowledge, this is one of the first studies to integrate recyclable material flow with economic valuation across multiple STSs in Dhaka. The findings highlight that recovery efficiency is strongly governed by economic value and informal practices, with limited segregation efficiency and inadequate occupational safety conditions. Enhancing source segregation, improving storage infrastructure, and introducing targeted market and policy interventions for low-value materials are critical for advancing Dhaka’s transition toward a circular and resource-efficient urban waste management system.
1. Introduction
Solid waste management (SWM) is a global challenge at this time, especially in developing countries due to rapid population growth, unplanned urban expansion, increasing living standards, and large-scale rural–urban migration [1]. In Bangladesh, this problem is particularly severe in Dhaka, which is the most densely populated city in the world, with a population density is approximately 23,234 people per square kilometer within a total area of about 300 square kilometers [2]. The city also faces a waste management crisis which has become a major environmental challenge, causing significant risks to human health and the sustainability of the urban environment [3]. Dhaka City currently generates approximately 6500 tons of waste per day, and this figure is projected to increase to around 8500 tons by 2032 [4]. The waste management system of Dhaka is primarily managed by Dhaka City Corporation (DCC). In most areas, a door-to-door waste collection system is practiced but the waste is generally collected without segregation. The collected waste is transported STSs, where untrained workers manually separate valuable materials for sale in the informal recycling market. The remaining waste is then carried by municipal trucks to the final disposal sites mainly the Amin Bazar and Matuail landfills [5].
STSs serve as intermediate facilities in municipal waste management systems. They help to reduce transportation costs, enable waste volume reduction, increase collection frequency, and provide greater flexibility in final disposal facilities [6]. STSs facilitate the recovery of valuable recyclable materials, including plastics, paper, metals, glass, and e-waste, which play a significant role in reducing environmental degradation and promoting a circular economy. However, in Dhaka, STSs are not well developed, and recycling largely depends on informal segregation practices [7]. This limits the effective recovery of low-value recyclable materials such as mixed wastepaper, mixed LDPE, broken glass materials, etc., which reduces the overall contribution of STSs to a circular waste management system. At this time, plastics, metals, glass, paper, and various organic and inorganic materials from MSW and megacities globally are facing significant challenges in management [8]. The improper management of these materials, particularly single-use plastics, has resulted in severe environmental consequences, including soil contamination, river pollution, and finally the accumulation of waste in oceans [9]. These issues not only threaten ecosystems but also undermine economic development and human health [10]. Though some of these solid wastes like glass, aluminum, and metal have a high recycling rate, plastic is being recycled at a much lower rate [11]. Some plastics, such as polyethylene terephthalate (PET) and high-density polyethylene (HDPE), are relatively easy to recycle, whereas others require more complex and costly processing [12]. Therefore, understanding the types, composition, and market value of recyclable waste is essential, as these factors determine whether materials are recovered or end up in landfills [13]. While several studies (as summarized in Table S1) have examined general waste generation and household waste composition in Dhaka, very few have focused specifically on recyclable materials found at STSs, which play a crucial role in the waste flow system. Existing studies provide limited information on the economic value of recyclables, despite their importance for resource recovery and circular economy planning. Additionally, price variations of recyclable materials across STSs have not been systematically analyzed. As a result, policymakers and waste management authorities lack updated, location-specific data that can support improved recycling strategies. By integrating spatial price variability with material recovery patterns, this study provides novel insights into the economic drivers of recycling efficiency and offers a data-driven foundation for advancing circular waste management strategies in rapidly urbanizing cities. It also offers practical guidance for improving recycling performance in Dhaka through effective segregation, improved storage and handling conditions, and targeted market and policy support for low valuable recyclable fractions.
2. Methodology
2.1. Study Design
This study used a mixed-method design that brought together field observation, quantitative price data, and qualitative insights from people working inside the system. The aim was not only to see what recyclable materials pass through STSs in Dhaka, but also to understand how the market assigns value to those materials. The work was carried out under the jurisdictions of DNCC which is responsible for operating the selected STSs included in this study and disposing of municipal waste at the Amin Bazar landfill. Within this setting, the study followed two complementary lines of inquiry. The first focused on material flow, tracing how recyclables enter, move through, and leave the STSs. The second looked at market dynamics, examining how prices are set, how buyers and sellers negotiate, and how factors such as purity, color, and polymer type influence what traders are willing to pay. Fifteen STSs were selected purposively rather than randomly to ensure representation of the diversity of waste management conditions across DNCC. The selected STSs represented different geographic zones, surrounding population densities, and land-use characteristics. The selection criteria included (i) geographic distribution across DNCC, (ii) variation in surrounding land-use and socioeconomic characteristics, (iii) accessibility for repeated field visits and stakeholder interviews, and (iv) the presence of active recyclable material recovery activities. The names and locations of the selected STSs are presented in Supporting Information Table S2. Data collection took place in two distinct periods, June–July 2024 and December 2024–January 2025, so that any seasonal changes in waste generation or pricing could be observed.
2.2. Study Area
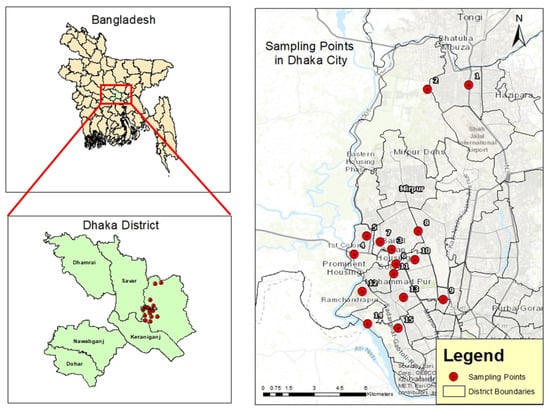
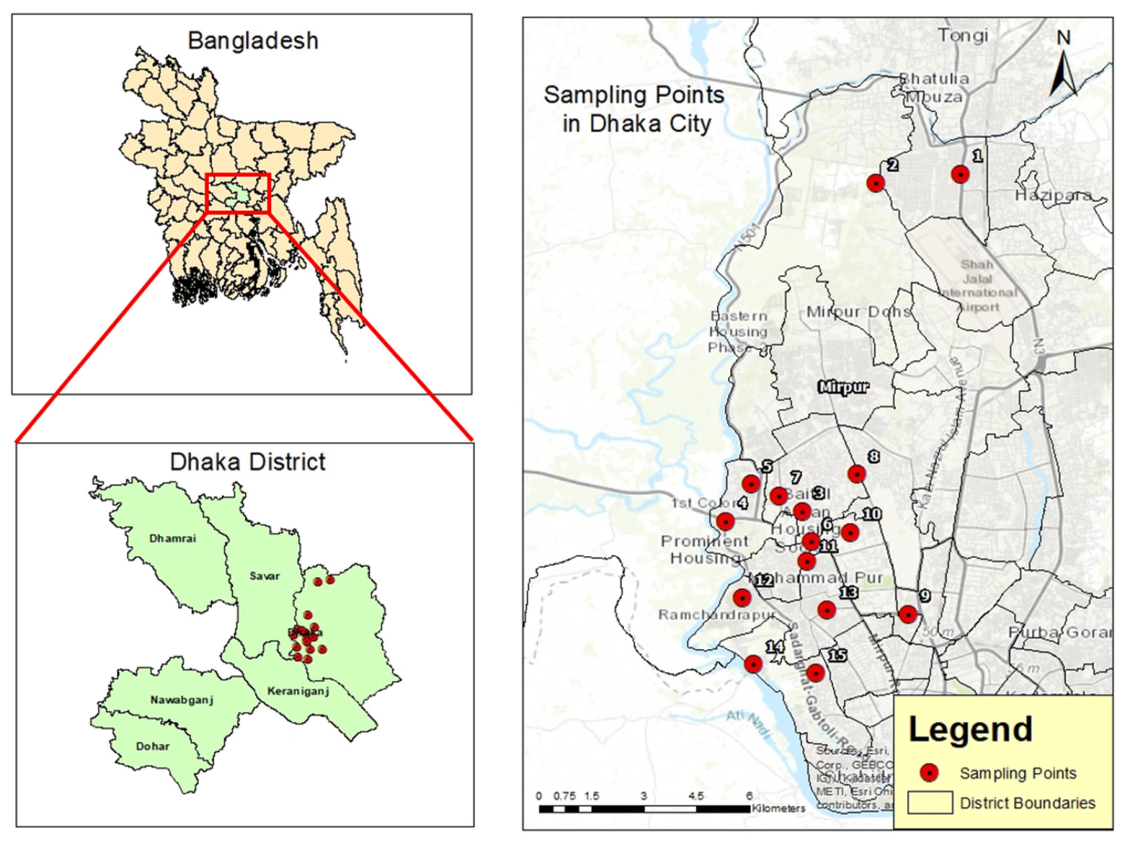
Dhaka is one of the fastest-growing cities in South Asia, posing a wide range of challenges for urban planning and waste management [14]. The selected 15 STSs distributed across DNCC include high-density residential neighborhoods such as Uttara and Shewrapara (Figure 1), busy commercial hubs like Khamar Bari and Mohammadpur Town Hall, and more peri-urban areas around Bosila Bridge and Rayer Bazar. At each of these stations, mixed municipal waste from surrounding wards is unloaded, roughly sorted, and then reloaded for transport to the landfills. In practice, STSs operate quite differently from one another: some receive a relatively clean, packaging-rich stream from higher-income residential areas, while others handle more mixed market and street sweepings. These differences in catchment areas and waste profiles allowed the study to capture variation in both recyclable composition and the prices offered by buyers.
Figure 1.
Location of the study area Dhaka, Bangladesh.
2.3. Material Identification and Categorization
To ensure consistency in waste characterization across the selected STSs, recyclable materials were classified using a material-based classification adapted from previous waste characterization studies, including the Bangladesh Waste Database, and the waste classification approach described by Alamgir and Ahsan (2007) [15]. Accordingly, the recovered materials were classified into six major categories: paper, plastic, metal, glass, electronic waste (e-waste), and other materials (Table 1). Plastic waste was further classified into PET, HDPE, LDPE, PP, PVC, PS, and mixed plastic waste based on polymer type and the materials identified during field sorting, using standard polymer terminology consistent with ASTM D7611/D7611M-21. PET was separated into white, colored, and brown bottles, while HDPE included black and brown HDPE containers and rigid plastic crates. LDPE comprised fresh, black, and mixed LDPE films. Polypropylene included water bottle caps, single-use food containers, and straws, whereas PVC consisted primarily of pipe offcuts and PS included polystyrene foam (Styrofoam) products. Metal waste mainly comprised scrap aluminum and mixed metal, while the e-waste category included electrical wires, copper wires, electric switches, and damaged LED lights. The other category consisted of shoes (rexine), kitchen waste, sanitary napkins, cotton, and miscellaneous materials that could not be assigned to the primary material categories. The material sorting process was conducted manually based on material type and physical characteristics, reflecting the existing practices of waste workers, who generally rely on visual identification rather than standardized polymer classification [16]. This level of sub-classification was essential because recyclable materials in Dhaka are traded based on material type, color, purity, and ease of processing, all of which substantially influence their market value. Organic waste, textiles, and other non-recyclable municipal solid waste fractions were excluded from the economic analysis because they were either absent or present only in negligible quantities within the recyclable stream and therefore did not contribute significantly to the economic assessment of recyclable materials.
Table 1.
Waste composition categories and corresponding waste components.
2.4. Questionnaire Survey
The study focused on primary data surveys. At fifteen STSs spread throughout DNCC, a structured questionnaire (Text S1) was created and distributed. A total of 50 waste workers were interviewed, comprising 38 men and 12 women. In addition, 10 Key Informant Interviews (KIIs) were conducted, including five waste dealers and five local traders from the DNCC. These interviews complemented the worker survey by providing deeper insights into recycling practices and market dynamics beyond the STS level. Purposive sampling was used to select the respondents, targeting workers who were directly involved in waste sorting and material recovery activities and had at least one year of work experience at the respective STS. Workers with regular involvement in identifying, separating, and selling recyclable materials were prioritized to ensure that the collected information reflected routine operational practices. The questionnaire included information on typical daily quantities of recovered materials, prices per kilogram of recyclable materials, seasonal changes in quantities and prices, contamination levels and factors affecting material purity, sales channels, transportation methods, and perceptions of market demand, including periods of price instability. Respondents were also asked to recall changes in material prices over the previous three to twelve months to capture short- and medium-term market trends. While recall is imperfect, these responses helped to sketch short- and medium-term price trends.
2.5. Data Analysis
Quantitative data from the questionnaires were analyzed using descriptive statistics. For each material and subcategory, the mean price, minimum and maximum observed values, and measures of variability were calculated. Standard deviation was used to describe how tightly clustered prices were around the average.
For population standard deviation,
where σ is the standard deviation
- xi = Each individual data point in the set,
- µ = Population mean,
- N = The total number of data points.
For sample standard deviation,
Here,
- xi = Individual data values
- x = Sample mean,
- n = Total number of data points in the sample.
A smaller standard deviation value indicates that the values are close to the mean, whereas a larger value means the dataset is spread out further from the mean.
3. Result and Discussion
3.1. Price Patterns Across Recyclable Materials
The price survey across 15 STSs at DNCC reveals a highly differentiated market for post-consumer recyclables. Average prices per kilogram vary by more than an order of magnitude between the lowest- and highest-valued materials. For the discussion of this study, the prices of waste per kg is converted to USD from BDT. At the time of this study, 1 USD is equivalent to 123.106 BDT. At one end of the spectrum, mixed wastepaper and low-grade contaminated fractions such as mixed polythene and damaged LED lights are traded at only 2–6 BDT/kg. At the other end, metals and high-value plastics such as mixed HDPE rigid plastics and Styrofoam reach average prices above 35 BDT/kg, with ferrous metal scrap attaining nearly 84 BDT/kg on average. Despite this widespread, the standard deviations for most materials remain relatively small (generally below 3 BDT/kg), indicating that prices are fairly consistent across the 15 STSs. This suggests an integrated city-wide market where buyers and intermediaries actively arbitrage between locations, keeping local price differences within a narrow band. Only a few items such as PVC pipes, mixed plastic waste, shoes (rexine), plastic crates, and white paper show somewhat higher variability, reflecting sensitivity to quality, contamination, or irregular demand. These price patterns are important because they ultimately shape which materials are actively recovered at STSs and which are more likely to remain in mixed waste and end up in landfills. High-value categories attract more intensive sorting effort from informal workers, while low-value items tend to be ignored unless quantities are large or contamination is low.
3.2. Plastic Waste
In Bangladesh from 2005 to 2020, annual plastic consumption per capita more than tripled from 3 kg to 9 kg worldwide; in Dhaka alone, it jumped from an average of 9.2 kg per capita to the higher figures of 22.25 kg per capita over that same period [17]. Dhaka produced 9488.78 tons/day in 2021, which includes 28.26% of the national urban waste as per the report. The average total waste generation per capita of DCC was 0.57 kg/person/day. 0.60 kg/day in the year 2020, with a total population of 10 million, and waste generated was 6400 tons/day, of which ten percent was plastic waste [16]. The growing plastic waste generation is a result of factors including economic growth, urbanization, industrialization, and overpopulation [18].
3.3. PET
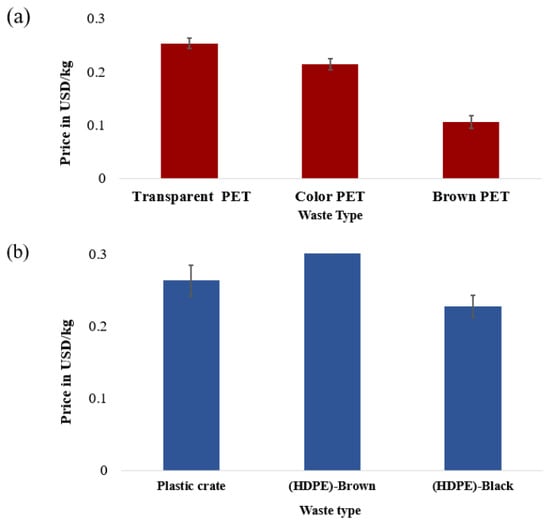
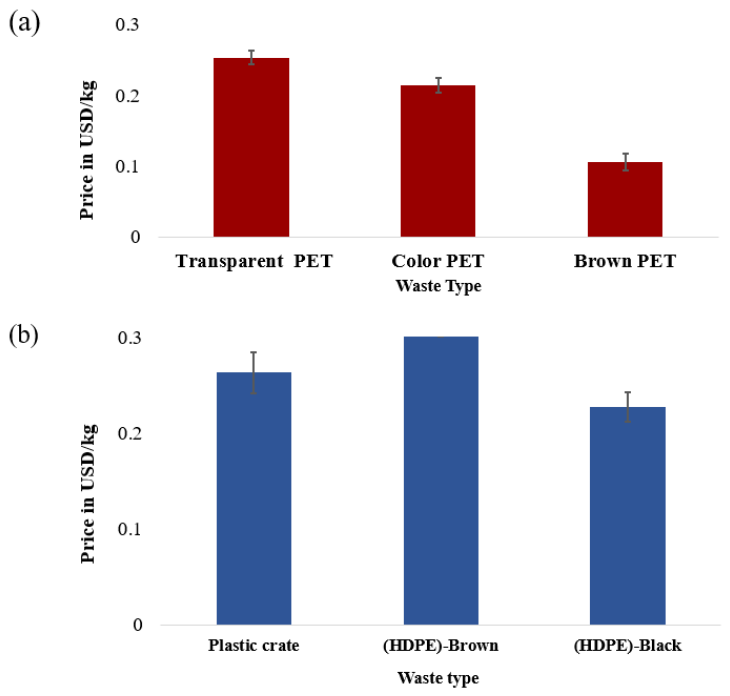
PET waste can be categorized into three subtypes: transparent PET, colored PET, and brown PET. PET are a widely used thermoplastic polymer found in water bottles, beverage containers, clothing fibers, ropes, medicine pots, and food packaging materials [19]. Figure 2a shows the average prices of these PET subcategories collected from various STSs in Dhaka. The results indicate that transparent PET has the highest average market price at approximately 0.25 USD/kg and color PET at around 0.21 USD/kg. Brown PET occupies the lowest price, only 0.10 USD/kg. The higher value of transparent PET can be attributed to its greater purity, higher recovery yield, and lower processing cost, as it does not contain dyes or pigments. Transparent PET is also in higher demand for producing high-quality recycled PET pellets, which increases its market price. In contrast, brown PET typically contains more impurities and additives, requiring additional sorting and cleaning, which reduces its recycling efficiency and overall value [20]. Similar pricing patterns have been reported in previous research, which emphasizes that color contamination and impurity levels significantly affect PET recyclability and market demand in South Asian recycling chains [21]. Moreover, informal waste pickers often prioritize transparent PET due to their higher resale value, influencing collection behavior in Dhaka’s recycling sector. These findings highlight the important role of PET recycling in supporting a circular economy, particularly if segregation at the source and improved material recovery practices can be implemented effectively.
Figure 2.
Post-consumer (a) PET waste and (b) HDPE waste at STSs in USD/Kg.
3.4. HDPE
HDPE waste comprises three subtypes: plastic crates, brown HDPE, and black HDPE. As shown in Figure 2b, brown HDPE commands the highest average price (≈0.30 USD/kg), followed by plastic crates (≈0.25 USD/kg), while black HDPE has the lowest value (≈0.22 USD/kg). HDPE generally exhibits a high recyclability rate, making it one of the most valuable plastics in the secondary recycling market [22]. Brown HDPE has a higher price due to its relatively uniform composition and higher demand for recycled pellets. In contrast, black HDPE has a lower economic value because the black pigment hinders recycling and limits end-use applications [23]. Plastic crates typically contain mixed additives, making the production of high-quality recycled pellets more challenging and reducing their market value. These findings indicate that both physical properties and additive content significantly affect HDPE recyclability and market demand. Understanding these dynamics can inform collection strategies, optimize material recovery, and support circular economy initiatives in urban waste management systems.
3.5. LDPE and Other Plastic Waste
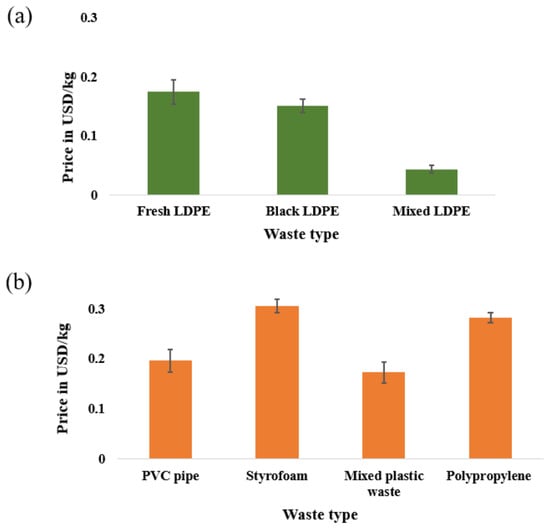
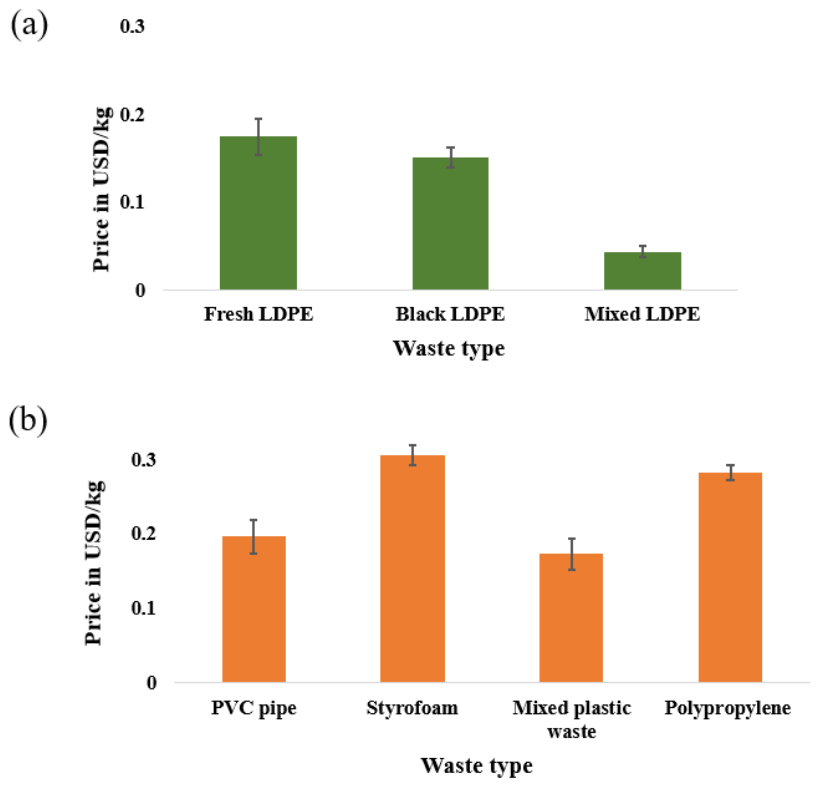
LDPE and other recovered plastic materials exhibit notable price variability across STSs in Dhaka, reflecting differences in quality, contamination level, and recyclability. LDPE is categorized into fresh (comparatively clean) LDPE, black LDPE, and mixed LDPE. According to Figure 3a, fresh LDPE has the highest market value at around 0.17 USD/Kg, with black LDPE at approximately 0.14 USD/kg, and mixed LDPE has the lowest value which is nearly 0.04 USD/Kg. This disparity is primarily driven by purity, color clarity, and the relative ease of recycling [24]. Fresh LDPE is comparatively clean and easier to recycle, so it holds the highest market value, whereas black LDPE commonly used for waste handling has the lowest value due to its pigmentation and the risk of discoloring recycled products [18]. Mixed LDPE often includes food residue, dirt, colored layers, and non-recyclable fragments, demanding labor-intensive sorting and washing, which increases recycling costs and lowers market demand. Figure 3b presents the price variation of other recovered plastic materials, including polypropylene (PP) products (e.g., single-use food containers, water bottle caps, and straws), polystyrene (PS) foam (Styrofoam), PVC pipes, and mixed plastic waste. Among these, Styrofoam commands the highest average price (≈0.30 USD/kg), reflecting its lightweight nature, high reuse potential, and the relatively clean condition of many recovered items, which can be easily cleaned and recycled, while PVC pipes (≈0.20 USD/kg) and polypropylene (≈0.282 USD/kg) maintain moderate value due to their rigid structure and steady demand in informal recycling markets. In contrast, mixed plastic waste (≈0.17 USD/kg) falls within the lower-value range, as these items commonly contain dyes, additives, or multilayer components that complicate processing.
Figure 3.
Post-consumer (a) LDPE waste and (b) other recovered plastic materials at STSs in USD/Kg.
3.6. Paper Waste
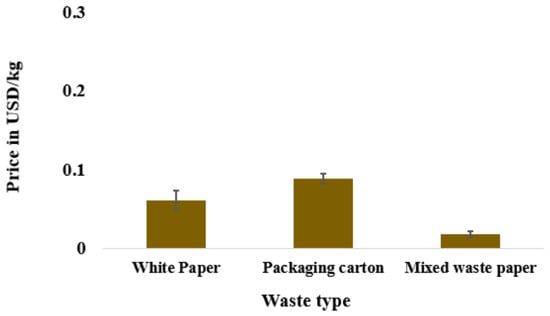
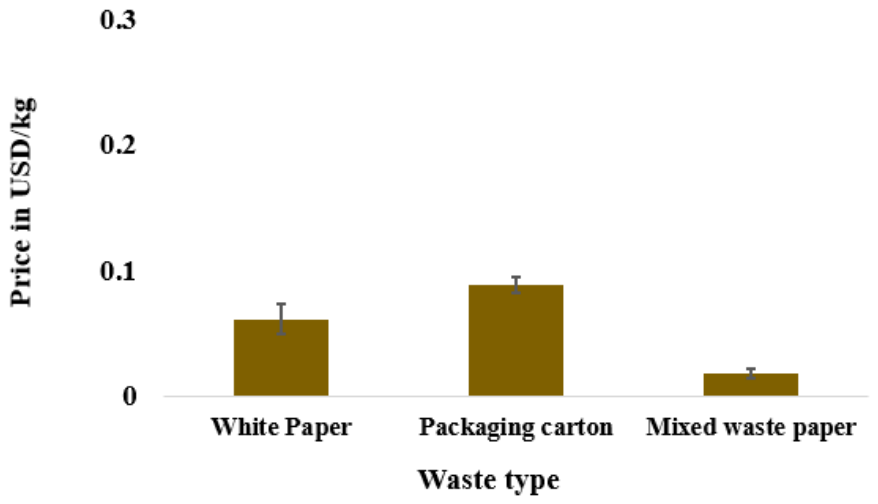
Paper waste constitutes a traditional recyclable fraction, yet their economic role in Dhaka’s STSs appears limited compared with plastics and metals. Packaging cartons, mostly corrugated cardboard, have an average price of 0.08 USD/kg, with very low variability (0.08–0.09 USD/kg). White paper averages 0.06 USD/kg but shows relatively high variation (standard deviation ~0.01 USD/kg, with prices ranging from 0.04 to 0.08 USD/kg). Mixed wastepaper is the least valuable recorded item, traded at only 0.01 USD/kg on average, which is shown in Figure 4. The relatively low price levels and the thin margins for paper explain why some STSs do not prioritize careful segregation of paper beyond high-volume sources such as market cartons or office waste. Informal workers reported that paper is often picked only when it is already separated or when traders arrive with specific demand. Moreover, paper quality deteriorates quickly when exposed to moisture at open STSs, further limiting its economic potential.
Figure 4.
Post-consumer paper waste at STSs in USD/Kg.
3.7. Metals and E-Waste
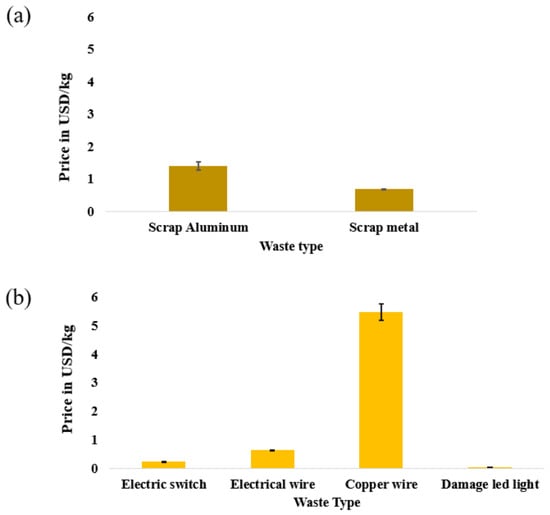
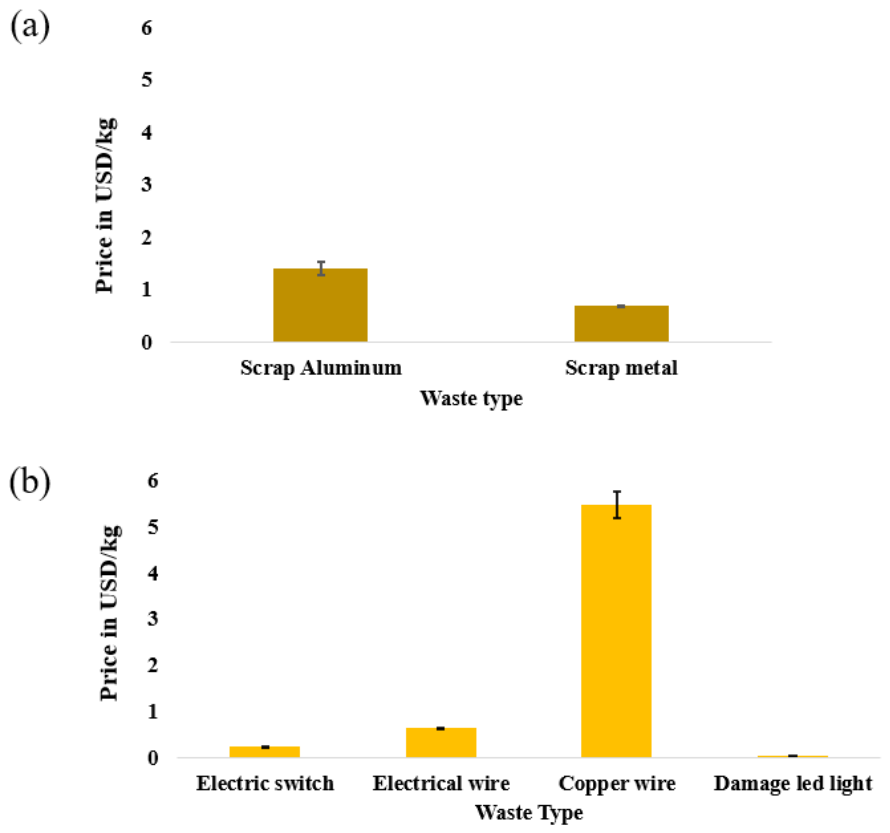
Metal waste includes scrap metal and scrap aluminum. Figure 5a shows that scrap aluminum has a comparably higher price of approximately 1.38 USD/kg while scrap metal is priced at 0.06 USD/kg. According to market research by New Vision Solutions Ltd., in Bangladesh, both scrap aluminum and metal are exported to other countries, which includes household scrap metal and aluminum [25]. Despite that, there is a difference in price variation which depends on factors such as metal being clean and uncorroded. Scrap aluminum is comparatively cleaner, highly recyclable, and less corroded than scrap metal, which includes ferrous metals that corrode quickly in open air. Moreover, the recycling process of aluminum increases its price [26]. Scrap metals can be recycled for new materials, including steel products, tin cans, copper wiring and pipes, and more [19].
Figure 5.
Post-consumer (a) metal waste and (b) electrical waste at STSs in USD/Kg.
This study analyzed several e-waste-related items such electrical wire, copper wire, and damaged LED lights. Among these, copper wires show the highest market value of 5.45 USD/kg. Electrical wires hold a comparatively moderate value, approximately 0.62 USD/kg, driven by steady industrial demand and relatively easier recovery. Electrical switches have a lower value of 0.21 USD/kg. On the other hand, damaged LED lights from discarded electronic goods exhibit the lowest market price, nearly 0.04 USD/kg, as their purity often varies, and recovery involves additional processing costs. The variation in prices reflects both the metal composition and the efficiency of local recycling systems in Bangladesh, where informal sectors dominate the market chain. These results show that metals and certain e-waste components are already effectively captured by market forces, but low-value and hazardous e-waste fractions may require regulatory or extended producer-responsibility mechanisms to prevent improper disposal. With Bangladesh developing from a least developed country, individual income growth has surged, which leads to a rise in the generation of e-waste. But there is no organized information available on e-waste generation. According to a study based on surveys carried out in 2021, the average waste generation was about 5.4 kg/person. Dhaka City produces nearly 118 kT of waste with a rate of 5.409 kg/capita [27].
3.8. Glass Materials
Across the 15 STSs, with little variation, glass waste had the lowest market value among all recovered materials in this study, with an average value of 0.04–0.05 USD/kg. This comparatively low price is mainly attributed to its high transportation cost and low market value [28]. This makes collection and processing less profitable for informal recyclers in Bangladesh. Despite these challenges, glass remains one of the few materials that can be recycled indefinitely without losing its physical or chemical properties. Recycling glass also conserves raw materials, reduces landfill demand, lowers energy consumption, and decreases greenhouse gas emissions associated with virgin glass production. In Bangladesh, glass recycling remains underexplored, and glass ends up in landfills due to inadequate source segregation, the absence of organized collection systems, and the limited capacity of the domestic glass recycling industry [29]. Consequently, intact bottles are more likely to retain market value, whereas broken or contaminated glass is often discarded despite its considerable recycling potential.
3.9. Other Waste Materials
The other waste category comprised shoes (rexine), kitchen waste, sanitary napkins, cotton, and miscellaneous waste. These materials were grouped under this because they occurred infrequently and could not be readily assigned to the primary material categories. Among these materials, only shoes (rexine) had a recoverable market value, with an average price of 0.168 USD/kg. In contrast, kitchen waste, sanitary napkins, cotton, and other miscellaneous materials were rarely recovered for recycling and were generally discarded as residual waste. Consequently, these materials accumulated at the STSs before being transported to landfill, contributing to unpleasant odors and poor sanitary conditions around the facilities. The limited recovery of these materials highlights the need for improved segregation and appropriate treatment strategies to reduce environmental and operational impacts at STSs.
3.10. Spatial Consistency and Implications for Material Flow
Across the 15 STSs, price variation for most materials is remarkably modest. For example, prices for color PET and mixed HDPE vary by only 0.03–0.04 USD/kg between the lowest and highest STSs; metals vary by 0.05 USD/kg. This suggests that Dhaka functions as a relatively unified recycling market, with traders moving between stations and equalizing prices over time. Local variations that do occur, for instance, in PVC pipes, mixed plastics, or white paper are likely driven by short-term fluctuations in demand, buyer specialization, and differences in contamination levels. Because price signals are broadly consistent across the city, differences in material flow between STSs are more likely to be driven by upstream waste composition and local sorting practices than by differences in the prices on offer. STSs situated near higher-income or commercial areas may receive more high-value plastics and metals, whereas those serving low-income or peri-urban neighborhoods see a larger share of mixed and organic waste. However, once recyclables appear in the sorting area, the market encourages similar prioritization everywhere. Metals, HDPE, PET, and copper-rich e-waste are recovered first, and low-value, contaminated paper, glass, and mixed polythene are often left behind. This pattern has two implications. First, informal workers play a critical role in extracting economic value from the waste stream, but their efforts are naturally concentrated on high-value materials. Second, without interventions that raise the value of low-grade fractions through better segregation, subsidies, or new processing technologies, significant volumes of plastic, paper, and glass will continue to flow past the STSs and into landfills or open environments.
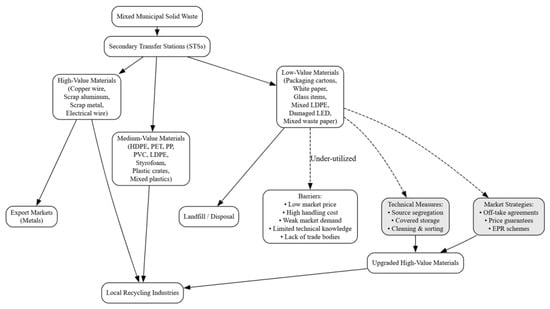
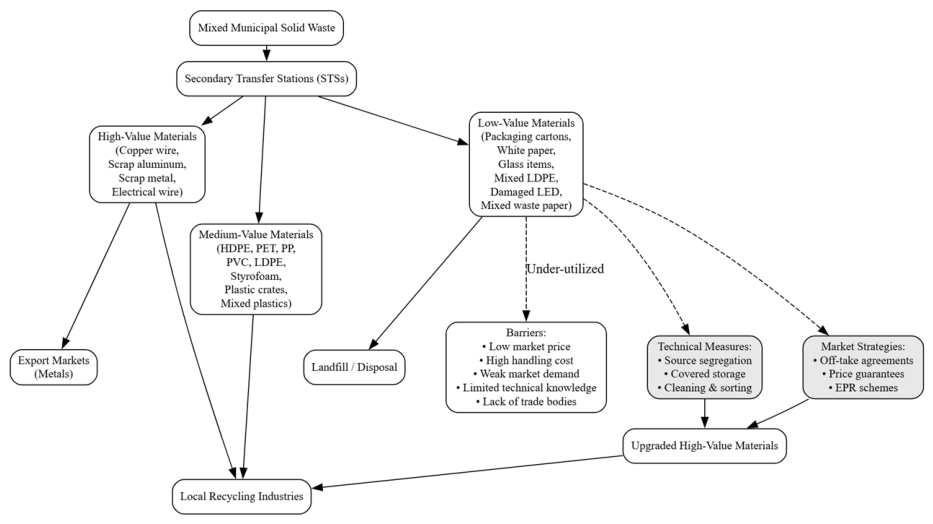
3.11. Linking Price Dynamics to Circular-Economy Potential
The survey results show that Dhaka’s STSs already function as important market nodes in a city-wide recycling value chain. They channel high-value recyclables toward local industries and, in the case of metals, possibly export markets. Yet they also reveal missed opportunities; large quantities of low-value plastics, paper, damaged LED, and glass remain under-utilized because their current market prices do not justify the labor and handling costs required for recovery. This happens because of issues like weak business management, limited technical knowledge, absence of trade bodies or support mechanisms [30]. Strengthening Dhaka’s transition toward a circular economy therefore requires both technical measures and market-oriented strategies as illustrated in Figure 6. On the technical side, improved source segregation, provision of covered storage space at STSs, and basic cleaning/sorting infrastructure could upgrade a portion of mixed and contaminated waste into higher-value streams (for example, moving material from mixed polythene to fresh polythene, or from mixed wastepaper to packaging carton). On the market side, stable offtake agreements, minimum price guarantees for low-value recyclables, or producer responsibility schemes for problematic items such as multilayer plastics and LEDs could create new incentives for recovery. The analysis presented here demonstrates that even without detailed quantity data, price patterns across 15 STSs provide a powerful lens on how recyclable materials flow through Dhaka’s waste system and how economic forces shape that flow. Future work could combine these price data with measured tonnages to estimate the total economic value of recyclables recovered at STSs and the potential gains from improved segregation [31]. The current findings already highlight that enhancing the economic environment for recyclables, especially low-value plastics, paper, and glass, is central to reducing landfill dependence and mitigating pollution in Dhaka’s rapidly growing megacity.
Figure 6.
Framework of material flow, market constraints, and recovery strategies at Secondary Transfer Stations (STSs) in DNCC.
3.12. Sankey Representation of Recyclable Material Flow and Recovery Pathways
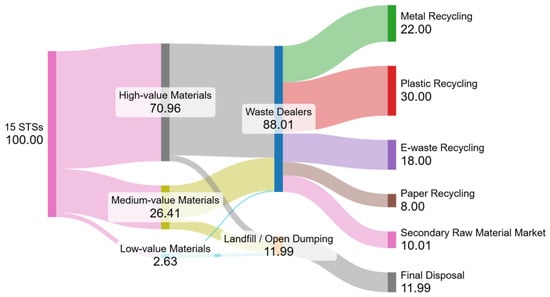
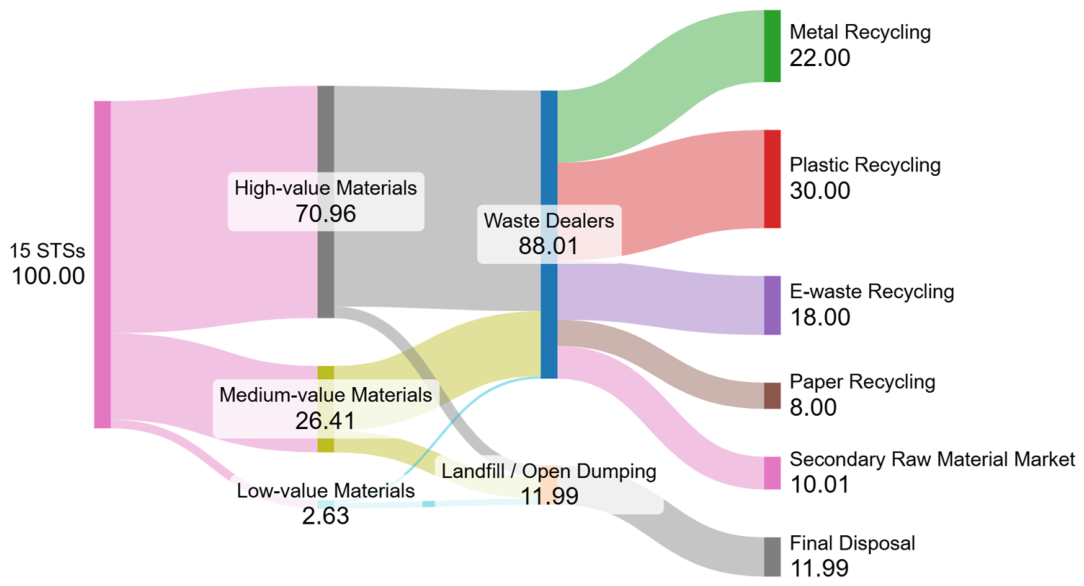
The Sankey diagram (Figure 7) shows the economic value-based recovery pathways of recyclable municipal solid waste generated from the 15 STSs of DNCC. It begins with the classification of recyclable materials into three economic value groups based on their market value: high-value materials (70.96%), medium-value materials (26.41%), and low-value materials (2.63%). These proportions were derived from the aggregated market values of the constituent recyclable materials and represent their relative economic significance within the recyclable waste stream. The detailed process is provided in the SI Table S4. High-value materials, including copper wire, scrap aluminum, scrap metal, and electrical wire, account for the largest share of the economic value. According to Figure 7, almost 67.41% of these materials are recovered by waste dealers and subsequently supplied to recycling industries, while only 3.55% remain unrecovered and ultimately disposed of through landfill or open dumping, which reflects the strong economic incentive associated with high-value recyclable materials. Medium-value materials contribute 26.41% and consist of mainly plastic-based recyclables such as HDPE, PET, LDPE, polypropylene, PVC, plastic crates, mixed plastic waste, and electric switches. These materials possess moderate market value, and the recovery rate is approximately 19.81% of the total recyclable stream being collected by waste dealers, whereas the remaining 6.60% is disposed of through landfill or open dumping. Low-value materials represent only 2.63% of the total normalized economic value and include packaging cartons, white paper, glass items, mixed LDPE, damaged LED lights, and mixed wastepaper. Due to their comparatively low market prices and limited economic attractiveness, only 30.79% of these materials are recovered, while the majority (1.84%) is directed to landfill or open dumping. Their low recovery reflects weak market incentives and the higher costs associated with collection, sorting, and transportation relative to their economic value. The recovered recyclable materials (88.01%) are aggregated through waste dealers and subsequently distributed to downstream recycling pathways, including metal recycling (22.00%), plastic recycling (30.00%), e-waste recycling (18.00%), paper recycling (8.00%), and the secondary raw material market (10.01%), while the remaining 11.99% is directed to landfill or open dumping and ultimately reaches final disposal. The diagram demonstrates that the efficiency of material recovery within the DNCC recycling chain is strongly influenced by economic value. Consequently, the Sankey diagram highlights the important role of market value in determining recycling performance and emphasizes the need for targeted interventions to enhance the recovery of lower-value recyclable materials and support a more circular urban waste management system.
Figure 7.
Sankey diagram illustrating the economic value-based recovery pathways of recyclable materials in 15 DNCC Secondary Transfer Stations (STSs).
4. Conclusions
This study examined the movement and economic value of recyclable materials across fifteen STSs in DNCC, revealing a rapidly changing market with waste recovery performance closely restricted by market price. This research was successful in its aim of understanding how market mechanisms affect material recovery, showing that high-value materials were consistently recovered through the informal recycling sector, whereas medium-value materials were recovered selectively depending on market demand and material quality. In contrast, low-value materials were frequently discarded because their limited economic value provided little incentive for recovery. Although the city exhibits significant spatial differences, results reveal an integrated city-wide recycling market that is characterized by low price variability, indicating that flows of material are driven more by upstream waste composition and informal sorting practices than by localized price variation. In conclusion, the results demonstrate that the transition to the Dhaka circular economy cannot be achieved without bridging the gap between technical infrastructure and more market-oriented interventions like price guarantees for low-grade materials. While this research provides a spatial analysis of economic drivers, it is limited by the lack of precisely measured tonnages for each material, suggesting that future studies should integrate longitudinal quantity data with these price patterns to fully estimate the total economic potential of the city’s resource recovery system.
Supplementary Materials
The following supporting information can be downloaded at: https://www.mdpi.com/article/10.3390/waste4030028/s1. Table S1: Summary of previous studies on recyclable waste generation, composition, and recycling in Bangladesh; Table S2: Location of Study Area; Table S3: Wokers per station; Table S4: Calculation framework for the economic value-based Sankey diagram; Text S1: Questionnaire for survey.
Author Contributions
Conceptualization, A.K.I.K., F.A. and M.A.T.M.T.R.; Methodology, A.K.I.K., F.A., S.P., S.Z. and M.A.T.M.T.R.; Validation, A.K.I.K., F.A. and M.R.; Formal Analysis, A.K.I.K., F.A., S.P., S.Z. and P.K.M.; Investigation, A.K.I.K., F.A., S.P. and S.Z.; Resources, A.K.I.K., F.A. and P.K.M.; Data Curation, F.A.; Writing—Original Draft, S.P., S.Z. and P.K.M.; Writing—Review and Editing, A.K.I.K., F.A., M.R. and M.A.T.M.T.R.; Visualization, M.R., S.P., S.Z. and M.A.T.M.T.R.; Supervision, A.K.I.K., F.A. and M.A.T.M.T.R.; Project Administration, A.K.I.K. All authors have read and agreed to the published version of the manuscript.
Funding
This research received no external funding.
Informed Consent Statement
Not applicable.
Data Availability Statement
The original contributions presented in this study are included in the article. Further inquiries can be directed to the corresponding author.
Conflicts of Interest
The authors declare that they have no known competing financial interests or personal relationships that could have appeared to influence the work reported in this paper.
References
- Kumari, T.; Raghubanshi, A.S. Waste management practices in the developing nations: Challenges and opportunities. In Waste Management and Resource Recycling in the Developing World; Elsevier: Amsterdam, The Netherlands, 2023; pp. 773–797. [Google Scholar] [CrossRef] [Scilit]
- World Population Review. Dhaka Population 2026. 2026. Available online: https://worldpopulationreview.com/cities/bangladesh/dhaka (accessed on 15 July 2026).
- Akther, S.; Evans, J.; Millington, N. Solid waste management in Dhaka: Understanding the evolution of a waste regime. Geoforum 2025, 165, 104364. [Google Scholar] [CrossRef] [Scilit]
- Islam, S. Sirajul ISLAM. 2021. Available online: https://sisu.ut.ee/waste/book/11-definition-and-classification-waste (accessed on 15 July 2026).
- Yasmin, S.; Rahman, M.I. A Review of Solid Waste Management Practice in Dhaka City, Bangladesh. Int. J. Environ. Prot. Policy 2017, 5, 19. [Google Scholar] [CrossRef] [Scilit]
- Tanvir Ahmad, M.; Nawrin Karim, F.; Mim, A.; Jannatun Naiem, M.; Jahan Monica, N.; Humaira Khatun, M.; Niamul Bari, M. Comprehensive Assessment of Secondary Transfer Stations in Rajshahi City Corporation. ICCESD 2024. 2024. Available online: https://www.researchgate.net/publication/381671818 (accessed on 15 July 2026).
- Tabassum, S. Performance Assessment of Secondary Transfer Station for Solid Waste Management in Dhaka North City Corporation (DNCC). ICACE 2018. 2018. Available online: https://www.researchgate.net/publication/340390387 (accessed on 15 July 2026).
- Masud, M.H.; Mourshed, M.; Hossain, M.S.; Ahmed, N.U.; Dabnichki, P. Generation of waste: Problem to possible solution in developing and underdeveloped nations. In Waste Management and Resource Recycling in the Developing World; Elsevier: Amsterdam, The Netherlands, 2023; pp. 21–59. [Google Scholar] [CrossRef] [Scilit]
- Kibria, M.G.; Masuk, N.I.; Safayet, R.; Nguyen, H.Q.; Mourshed, M. Plastic Waste: Challenges and Opportunities to Mitigate Pollution and Effective Management. Int. J. Environ. Res. 2023, 17, 20. [Google Scholar] [CrossRef] [Scilit] [PubMed]
- Rahman, M.S.; Ahmed, S. Health consequences of inadequate solid waste management in Bangladesh: Pollution disease contamination risks. Int. J. Sci. Res. Arch. 2024, 12, 2260–2277. [Google Scholar] [CrossRef] [Scilit]
- World Economic Forum. World Recycling Facts for 2022: Plastic, Paper and More|World Economic Forum. June 2022. Available online: https://www.weforum.org/stories/2022/06/recycling-global-statistics-facts-plastic-paper/ (accessed on 15 July 2026).
- Moniruzzaman, S.M.; Bari, Q.H.; Rahman, M.A.T.F. Recycling Approach of Waste Paper and Plastic in Khulna City of Bangladesh Museum of Bangladesh. J. Eng. Sci. 2012, 3, 170–179. [Google Scholar] [CrossRef] [Scilit]
- Brahme, R.; Krishnan, P.; Tiwari, K. Economics of waste management. In 360-Degree Waste Management, Volume 1: Fundamentals, Agricultural and Domestic Waste, and Remediation; Elsevier: Amsterdam, The Netherlands, 2023; pp. 239–264. [Google Scholar] [CrossRef] [Scilit]
- Brouwer, R.; Sharmin, D.F.; Elliott, S.; Liu, J.; Khan, M.R. Costs and benefits of improving water and sanitation in slums and non-slum neighborhoods in Dhaka, a fast-growing mega-city. Ecol. Econ. 2023, 207, 107763. [Google Scholar] [CrossRef] [Scilit]
- Alamgir, M.; Ahsan, A. Municipal Solid Waste and Recovery Potential: Bangladesh Perspective. J. Environ. Health Sci. Eng. 2007, 4, 67–76. [Google Scholar]
- Kadir, A.; Kamal, I.; Latif, A.; Rahman, A.T.M.T. Identifying the Value Chain of Different Types of Recyclable Waste Plastics: Case Study on Selected Small and Medium-sized Enterprises (SMEs) of Dhaka city. Bangladesh J. Environ. Res. 2023, 14, 13–26. [Google Scholar] [CrossRef] [Scilit]
- Shariful Islam, M.; Jakaria, M.; Masum Rabbi Mim, M.; Raihan, J.; Khan, A.; Shafiur Rahman, G.M. Application of Nanotechnology in Plastic Waste Management and Recycling: Bangladesh Perspective. Biosens. Nanotheranostics 2024, 3, 1–10. [Google Scholar] [CrossRef] [Scilit]
- Abdullah, M.; Abedin, M.Z. Assessment of plastic waste management in Bangladesh: A comprehensive perspective on sorting, production, separation, and recycling. Results Surf. Interfaces 2024, 15, 100221. [Google Scholar] [CrossRef] [Scilit]
- Mehedi Hasan, M.; Fairooz Adnan, H.M.; Tasnuva Dhara, F.; Alamgir, M.; Islam, S.; Saju, J.A.; Atik Fayshal, M. The single-use plastic waste problem in Bangladesh: Finding sustainable alternatives in local and global context. In Proceedings of the Waste Safe 2023—8th International Conference on Integrated Solid Waste and Faecal Sludge Management, Khulna, Bangladesh, 25–26 February 2023. [Google Scholar] [CrossRef]
- Muringayil Joseph, T.; Azat, S.; Ahmadi, Z.; Moini Jazani, O.; Esmaeili, A.; Kianfar, E.; Haponiuk, J.; Thomas, S. Polyethylene terephthalate (PET) recycling: A review. Case Stud. Chem. Environ. Eng. 2024, 9, 100673. [Google Scholar] [CrossRef] [Scilit]
- Safayet, M.; Prodhan, U.; Kaeser, A. Municipal Solid Waste Management in Dhaka City: Present Status, Problems and Probable Solutions SEE PROFILE. 2019. Available online: https://www.researchgate.net/publication/340581725 (accessed on 15 July 2026).
- Otitoju, M.A.; Olawoye, T.; Abiola, S.S.; Ahmed, S.; Okoma, O. Plastic waste management and recycling: A review. J. Glob. Soc. Sci. 2023, 4, 60–71. [Google Scholar] [CrossRef] [Scilit]
- Gabriel, D.S.; Maulana, J. Impact of plastic labelling, coloring and printing on material value conservation in the products of secondary recycling. Key Eng. Mater. 2018, 773, 384–389. [Google Scholar] [CrossRef] [Scilit]
- Friedrich, K.; Möllnitz, S.; Holzschuster, S.; Pomberger, R.; Vollprecht, D.; Sarc, R. Benchmark analysis for plastic recyclates in Austrian waste management. Detritus 2020, 9, 105–112. [Google Scholar] [CrossRef] [Scilit]
- NewVision Solutions Ltd. Market Research on Steel, Aluminum, Zinc, and Other Metal Scrap in Bangladesh. NewVision Solutions Ltd. 2022. Available online: https://newvision-bd.com/market-research-on-steel-aluminum-zinc-and-other-metal-scrap-in-bangladesh/ (accessed on 15 July 2026).
- Villada, C.; Navarrete, N.; Rawson, A.; Kolbe, M.; Stahl, V.; Kraft, W.; Kargl, F. Recycling of aluminium scrap into phase change materials for high-temperature storage applications: Thermophysical properties and microstructural characterisation. J. Energy Storage 2023, 72, 108822. [Google Scholar] [CrossRef] [Scilit]
- Chakraborty, P.; Rex.R., K.; Syed, J.H.; Chandra, S.; Hande, S.; Pokhrel, B.; Islam, E.; Miah, M.A.H. Electronic waste recycling in South Asia: Overview of associated risks from a cocktail of micro-pollutants and recommendations for sustainable e-waste management. J. Hazard. Mater. Adv. 2025, 18, 100715. [Google Scholar] [CrossRef] [Scilit]
- Davis, J.M.; Bauza-Mora, J.; Cain, D.; Harnisch-Weidauer, L.; Matthews, C.; Sunil, P. An economically sustainable glass recycling business model in Puerto Rico: A conceptual solution for regions without government recycling programs. Sustainability 2024, 16, 9916. [Google Scholar] [CrossRef] [Scilit]
- Silva, R.V.; de Brito, J.; Dhir, R.K. Availability and processing of recycled aggregates within the construction and demolition supply chain: A review. J. Clean. Prod. 2017, 143, 598–614. [Google Scholar] [CrossRef] [Scilit]
- Muntasir, M.; Orpa, S.; Islam, M. Identifying the Value Chain of Different Types of Recyclable Waste Plastics: Case Study on Selected SMEs of Dhaka City. Am. J. Environ. Sci. Eng. 2025, 9, 115–124. [Google Scholar] [CrossRef] [Scilit]
- Abdella Ahmed, A.K.; Ibraheem, A.M.; Abd-Ellah, M.K. Forecasting of municipal solid waste multi-classification by using time-series deep learning depending on the living standard. Results Eng. 2022, 16, 100655. [Google Scholar] [CrossRef] [Scilit]

Disclaimer/Publisher’s Note: The statements, opinions and data contained in all publications are solely those of the individual author(s) and contributor(s) and not of MDPI and/or the editor(s). MDPI and/or the editor(s) disclaim responsibility for any injury to people or property resulting from any ideas, methods, instructions or products referred to in the content. |
© 2026 by the authors. Licensee MDPI, Basel, Switzerland. This article is an open access article distributed under the terms and conditions of the Creative Commons Attribution (CC BY) license.