1. Introduction
Municipal solid waste generation has risen steadily worldwide, placing increasing pressure on waste management systems and threatening climate and resource efficiency goals. Municipal waste recycling remains central to many cities’ ambitions for a circular economy and sustainable resource management [
1]. Recycling and composting play a crucial role in waste diversion and mitigating environmental impacts while reducing the demand for new raw materials, a foundational concept to a circular economy [
2].
The Municipality of São Paulo has consolidated itself as the largest city in Brazil, with 11,904,961 inhabitants in 2025 [
3], and the largest gross domestic product (GDP) in the country [
4]. The generation of municipal solid waste (MSW) follows this demographic and economic magnitude, demanding complex, challenging, multifaceted, and systemic management, given the socioeconomic dynamism and physical limits of the urban territory. Despite clear policy directives, recycling performance remains very low and substantial divergences persist among neighborhoods. These disparities highlight the need to better understand the conditions that enable efficient recycling systems. Identifying the determinants of recycling—economic, institutional, fiscal, educational, and sociodemographic domains—is directly relevant to policymakers striving to close performance gaps and meet sustainability targets [
1].
The objective of this article was to verify the progress on the recycling of household solid waste in the Municipality of São Paulo, in the period from 2006 to 2024, in order to evaluate the results of the management of instruments, laws, and public policies approved and put into practice. To date, no studies or technical reports are available from the São Paulo municipal administration that evaluate the 19-year evolution of the selective waste collection rate for recyclables in relation to household waste.
The study period of 2006–2024 is adequate as it encompasses both the enactment of the National Solid Waste Policy of Brazil, other critical municipal policies, and a phase of accelerating circular economy efforts. The present study aims to fill a research gap by calculating the recycling rates in a long time-frame for the municipality as a whole, and by administrative regions, pointing to selected explanatory determinants of municipal waste recycling outcomes. Empirical research underscored the relevance of understanding the determinants in shaping municipal waste recycling performance. The novelty of this manuscript is that it deals with intra-urban determinants of unequal environmental issues. Many articles have explored differences in recycling performance among countries [
1] or among cities [
5], but intra-urban differences and their determinants have been scarcely explored in the scientific literature.
Legally and operationally, the requirements for the management of MSW in São Paulo are dictated by an overlapping of norms: the National Solid Waste Policy (NSWP)—(Law No. 12305/2010) [
6], and at the local level, the Municipal Integrated Solid Waste Management Plan (MISWMP), approved and consolidated by Municipal Decree No. 54991/2014 [
7] and by the regulation of the current Governance and Institutional Transition (Municipal Decree No. 63113/2024) [
8].
The services of collection, transportation, transshipment, treatment, and final disposal of MSW are delegated to concessionaire companies [
3]. This logistics operation encompasses an expressive infrastructure, mobilizing a fleet of more than 800 collection trucks and a workforce that exceeds 6000 professionals to ensure the maintenance of the urban network [
3].
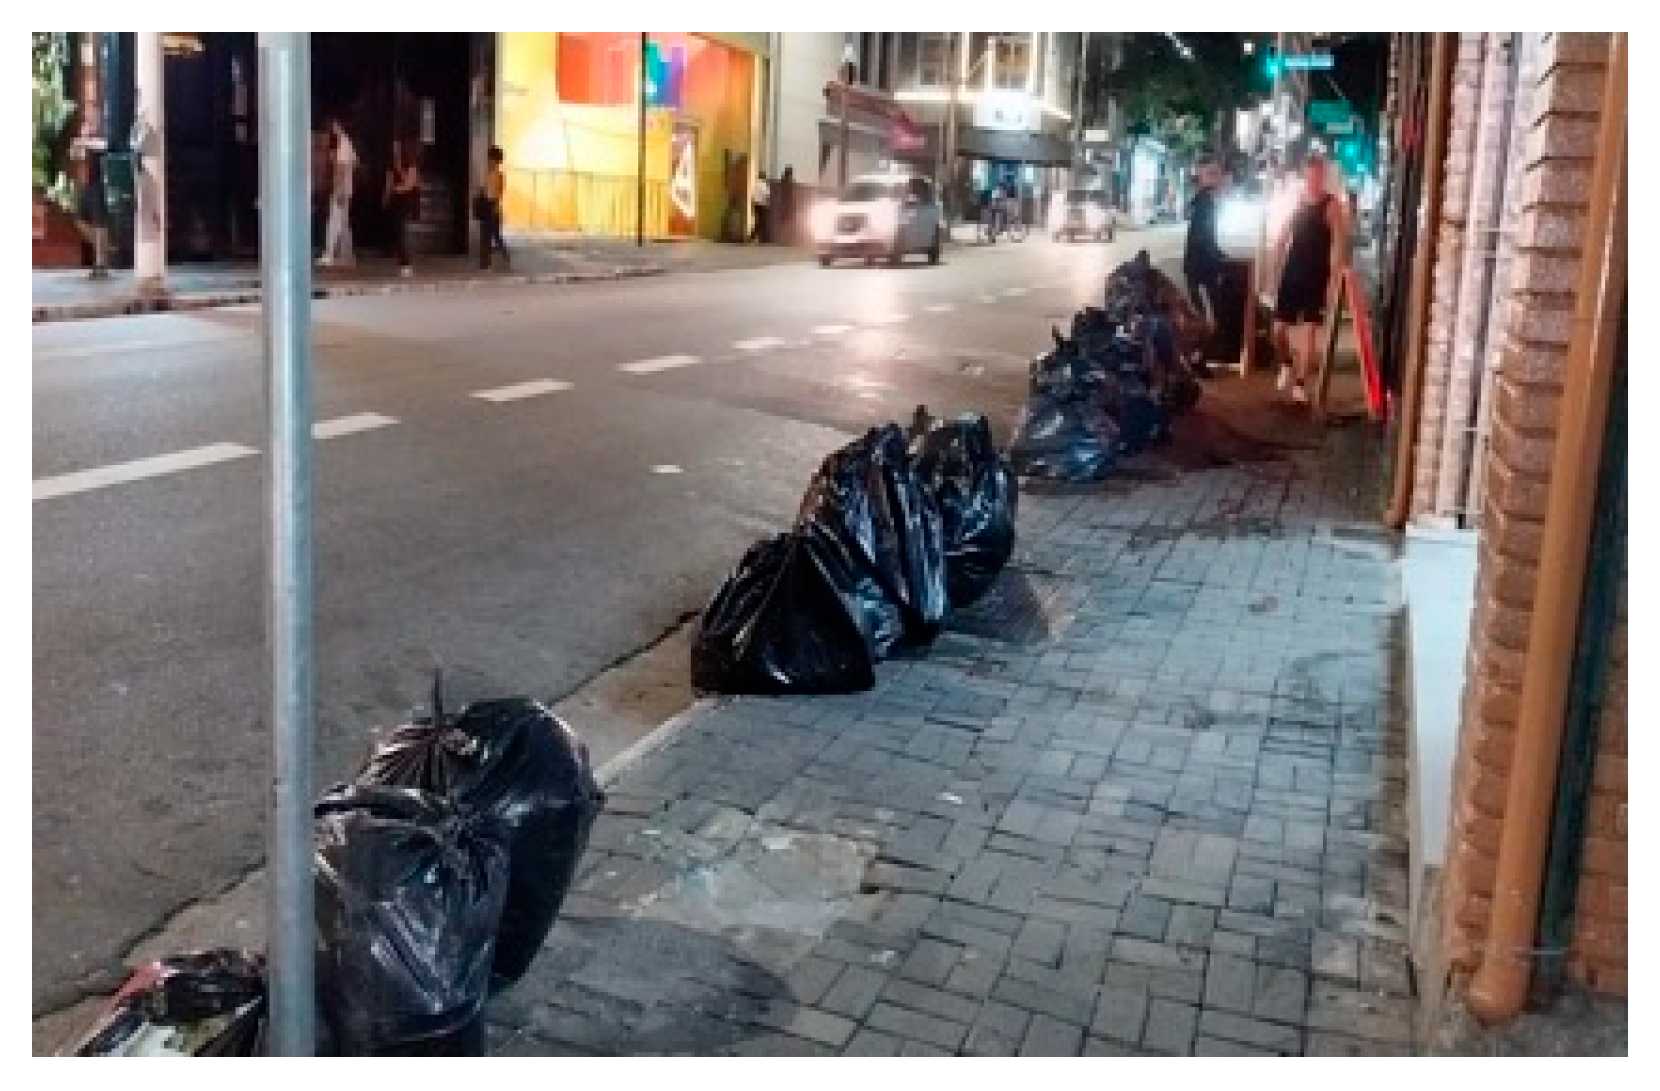
The household waste (HW) collection service in the city of São Paulo adopts a binary model, segmented into: (i) undifferentiated (or regular) collection (
Figure 1) and (ii) differentiated (selective) collection. The undifferentiated modality serves small generators—with a volume limited to 200 L/day—through the door-to-door collection of plastic bags arranged in public places at predetermined times.
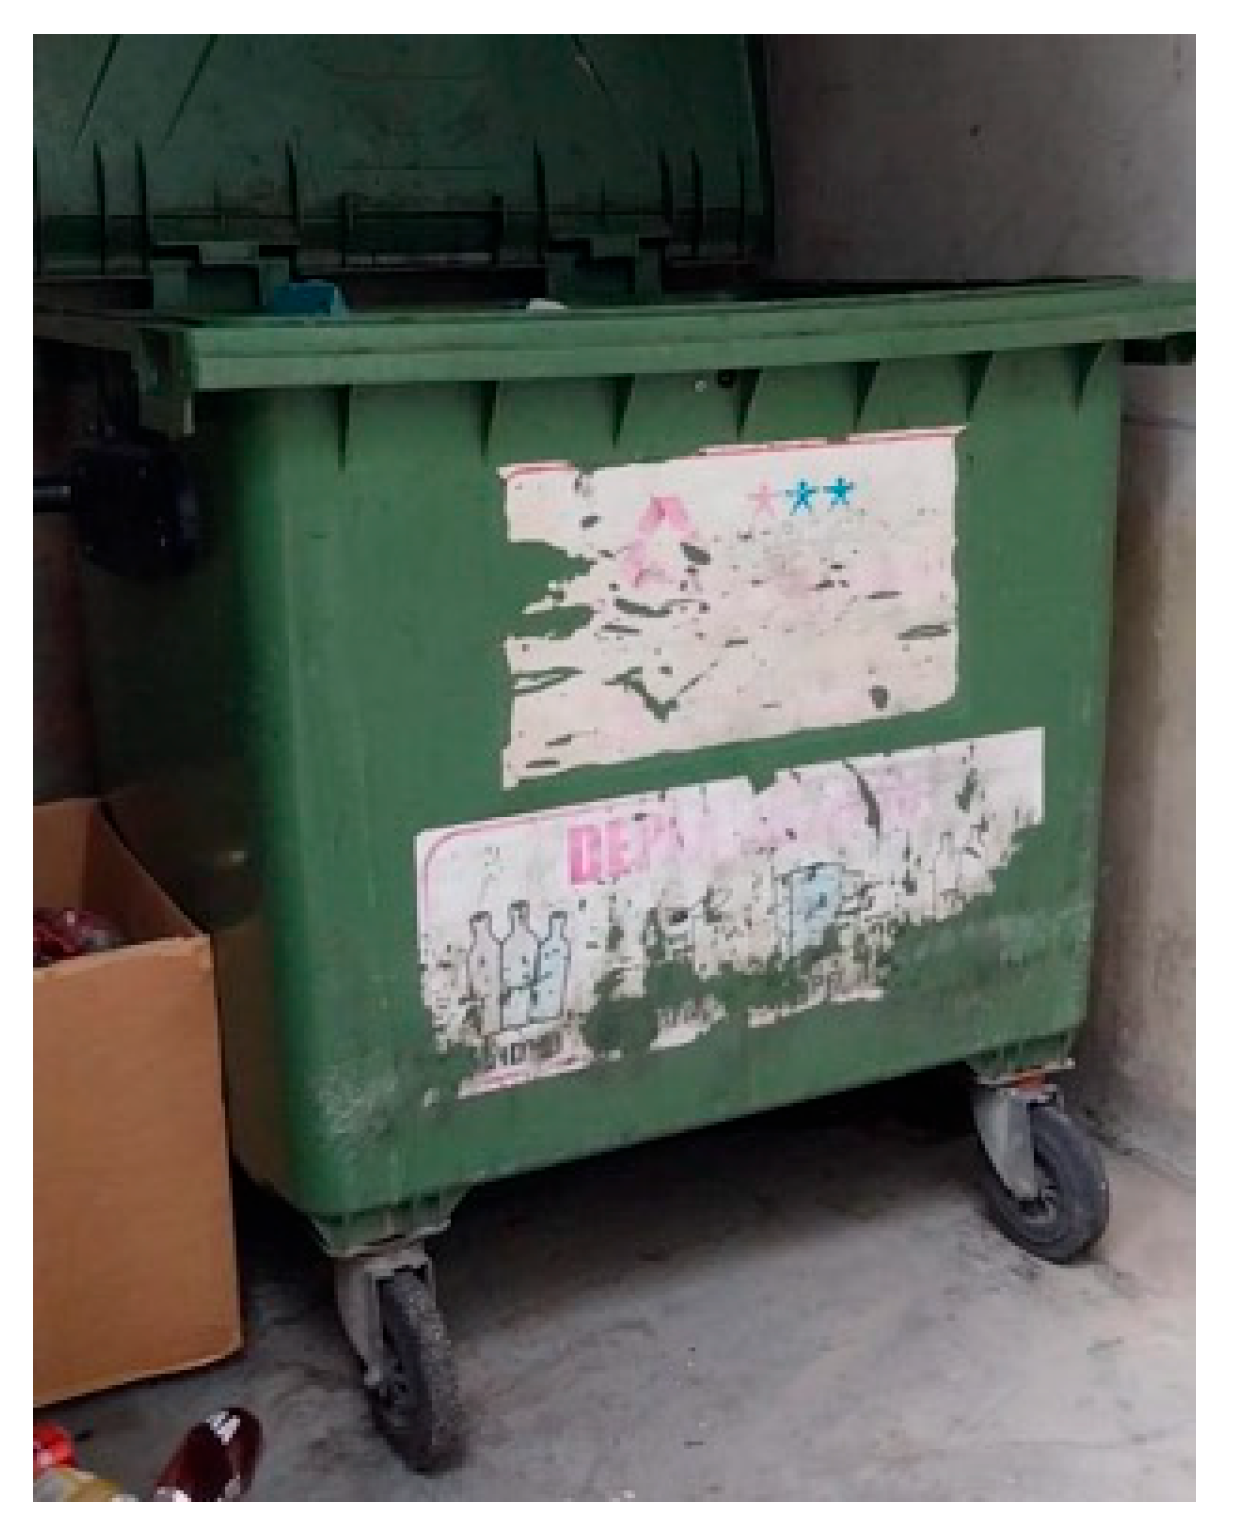
Separate collection of dry recyclables (SCDR) occurs through a hybrid arrangement that involves concessionaire companies, cooperatives and associations of recyclable material collectors, as well as autonomous collectors. The waste pickers’ organizations work in the processing of fractions sorted by the concessionaires and in the execution of the regular door-to-door collection of recyclables in condominiums, educational institutions, and large generators (with a volume greater than 200 L/day) (
Figure 2).
At the institutional level, the municipality has 29 cooperatives registered with the public administration [
9]. In 2025, the flow destined for these organizations totaled 28,200 tons for sorting and processing, evidencing a strong spatial and operational concentration, where only four cooperatives absorbed 43% of this amount [
9]. Regarding operational efficiency, 65% of the entities recorded that the tailings rate oscillates between 30% and 40% [
9]. The sociodemographic profile of the workers reveals a mostly female sector, in which about 60% of the cooperative members are women, and a monthly income range concentrated between 1 and 3 minimum wages for 53% of the contingent analyzed [
9].
In addition, the municipal infrastructure provides residential generators with drop-off point recycling, structures for the disposal of recyclable fractions strategically distributed in high-traffic public places [
10], and Eco points for limited volumes of construction and demolition waste, vegetation pruning waste, and bulky unusable goods.
With regard to the specific flow of glass waste, a pilot project aimed at the segregated collection of this material was established in July 2023 with exclusive receptors for the voluntary disposal of packaging and glass fragments by the population [
11].
The gravimetric diagnosis of household waste in São Paulo in the period between 2014 and 2024 shows a generation profile concentrated in organic matter (46.90%) [
9]. The fractions traditionally eligible for selective collection systems add up to a significant portion of the mass flow, led by plastics (17.56%) and the pulp segment (paper, cardboard and newspaper, with 10.36%), while glass and ferrous metals register 2.71% and 1.45%, respectively. In addition, absorbent sanitary waste makes up 7.58% of the gravimetric load, fabrics and rags represent 5.75%, and the residual mixed fraction (‘others’) consolidates the remaining 8.72% [
9].
The comparative analysis of the infrastructure, focused on the management of household solid waste between the years 2017 and 2025, reveals an asymmetry between the stability of the macro infrastructure and the dynamics of the capillary collection networks. Regarding the transshipment-final disposal binomial, the installed capacity remained static. The system kept the same three disposal units operating in line with the three regulated transshipment stations (Vergueiro, Santo Amaro and Ponte Pequena) [
9,
12,
13]. Likewise, the two automated sorting subsystems remained unchanged in the period, with a capacity of 500 tons/day [
9].
The 2014 Municipal Integrated Solid Waste Management Plan (MISWMP), updated in 2025, had already failed to meet its targets up to 2018 [
5]. From 2018 to 2025, the goals that required investments in infrastructure for the transshipment, separation, and treatment of urban solid waste were not implemented. Of the six main goals for household waste, only one has been partially achieved.
Specific actions have not yet been initiated for the collection of the organic fraction of household waste, which represents almost half by weight of this waste. In recent years, the municipal administration has expanded the collection of organic waste for street markets and markets for processing in six composting yards installed in the municipality [
9].
On the other hand, there was an expansion of Eco points, from 100 to 129 units, accompanied by the strengthening of assisted cooperatives. This increase in public infrastructure and social fabric contrasts, however, with a drastic retraction of more than 60% in the coverage of drop-off point recycling, declining from 3811 to 1500 installed points, which denotes an evident change in the strategy [
9].
According to the guidelines and data consolidated in the MISWMP Diagnosis [
10], the cost of the solid waste management and urban cleaning system in 2024 required a financial contribution of USD
$ 0.7 billion, which represented approximately 3.5% of the municipality’s total budget execution. The collection resulting from the Inspection Fee for Urban Cleaning Services (FISLURB) totaled USD 0.48 billion. However, there is still a regulatory and financial asymmetry in the actors’ remuneration model: while the concessionaire companies—although contractually burdened by investments in expansionary infrastructure—receive regular consideration for the services performed [
9], the collectors’ cooperatives lack direct remuneration for the provision of the public collection and sorting service. The income of these organizations is based on the sale of recovered recyclable materials, and the support of the municipal government is restricted to the granting of indirect subsidies, embodied in the cost of fixed operating expenses, such as the rental of warehouses, the promotion of equipment, and the payment of tariffs for essential public services.
2. Materials and Methods
A case study was carried out, based on bibliographic search, documents, legislation, institutional sites, field observation, data collection, data treatment, and analysis.
Documentary and bibliographic research was carried out based on the analysis of federal and municipal legislation, as well as specific reports [
9] in the IBGE [
14] and SP REGULA [
15] databases.
The primary data collection was obtained through a request to SP REGULA, from August to November 2025, and received through electronic file spreadsheets containing the totals of household solid waste collected from regular collection and selective collection for the period from 2006 to 2024.
The data were organized into a database with the objective of calculating the indicator of recyclable waste for the municipality by year and by administrative regions. To estimate the selective collection rate of household waste in São Paulo, the total of household solid waste divided by the total of selectively collected solid waste was considered.
The definition of the primary data period, from 2006 to 2024, was based on the intent to capture the results of three public policies that influenced the topic in Brazil and in the Municipality of São Paulo: (i) the National Solid Waste Policy (2010); (ii) the National New Legal Framework for Basic Sanitation (2020); and (iii) the Municipal Integrated Solid Waste Management Plan (MISWMP) (2014).
Data on SARS-CoV-2 (COVID-19) pandemic cases were obtained from the website of the São Paulo Health Secretary, COVID-19 Panel, for 2021 and 2022.
The georeferenced geographic databases were obtained from the official website of the Municipality of São Paulo (GeoSampa geospatial data portal).
Additional data used were obtained from official databases and institutional reports for describing the solid waste infrastructure, gravimetric composition and other information, the Municipal Integrated Solid Waste Management Plan (MISWMP from 2014), Integrated Waste Management Plan of the Municipality of São Paulo 2025, and official websites of the São Paulo Municipality and concessionaire companies. All of the legislation was consulted from official websites.
To test the statistical significance of the time trend in the municipal selective collection rate (2006–2024), a simple linear regression was employed [
16], using year as the independent variable and rate as the dependent variable (
Table 1).
For an exploratory analysis between the rates of the selective collection of household waste and the socioeconomic conditions of the city, the 2024 Map of Inequality of the Municipality of São Paulo [
17] was used, as it points to the inequalities between the districts. A set of districts form the regional administration, thus allowing for a spatial analysis. The ranking of indicators of the Inequality Map (2024) by districts was prepared by Rede Nossa São Paulo. This mapping was based on official information from public agencies and the formulation of indicators (population, housing, mobility, digital infrastructure, work and income, health, education, culture, sports, human rights, public safety and environment). The district received a score, with 96 points for the highest and 1 (one) for the lowest evaluation [
17].
The spatial autocorrelation between two variables: inequalities and Selective collection rate of dry recyclables was assessed using Global Moran’s I statistics, based on a queen-contiguity spatial weights matrix derived for verifying the significant spatial autocorrelation between the variables. Both variables exhibited positive and statistically significant spatial autocorrelation (
p < 0.01) [
18]. Regional administrations with similar selective collection rates for dry recyclables tended to cluster geographically, just as regional administrations with similar positions in the inequality ranking tended to be spatially grouped (
Table 2).
Statistical analyses, including simple linear regression, global and local Moran’s I spatial autocorrelation, and interrupted time series regression, were developed with preliminary analytical support from Claude (Anthropic), an AI language model. Statistical analyses (linear regression, Moran’s I spatial autocorrelation, and interrupted time series regression) were performed using Microsoft Excel (version 2021/365, Microsoft Corporation, Redmond, WA, USA). All formulas, outputs, and interpretations were independently verified and validated by the authors.
Specifically, in the analysis of household waste and recyclable waste under the two governance arrangements (AMLURB and SP Regula), no significant evidence was found that the change in management caused the increase in separate collection or the reduction in household waste [
19]. Rather, it was largely the continuation of a trend that was already underway before 2020 (recyclable waste had been increasing since 2006, while household waste had already shown signs of stabilization or a slight decline since the mid-2010s) (
Table 3).
Appendix A provides the primary data collected (household and separate collection of dry recyclables) for each regional administration and year, reported in tons.
3. Results
The timeframe analysis of the total mass of household waste (HW) collected in the city of São Paulo between 2006 and 2024 revealed fluctuations that went beyond the traditional macroeconomic and demographic variables, but did not reflect the influence of the governance and institutional arrangements of the sector. Between 2006 and 2015, under the management of the Municipal Authority for Urban Cleaning (AMLURB), there was a sustained growth trend, in which the annual mass of HW expanded from 3.35 million to the level of 3.80 million tons, probably driven by factors such as the increased purchasing power of families. In the subsequent period (2016–2019), still under the aegis of AMLURB, the system experienced stabilization and a slight retraction (average of 3.67 million tons per year), in line with the national economic recession scenario.
From 2020 onward, the time series registered a rupture, marked by the concomitance of the outbreak of the COVID-19 pandemic. In the biennium of greatest epidemiological severity of the COVID-19 pandemic (2021–2022) [
20], the mass collected declined to 3.42 million and 3.37 million tons, respectively. Although social isolation and sectoral economic crises justify part of this decrease, reduced HW levels persisted in the post-pandemic years of 2023–2024 (around 3.45 and 3.51 million tons, lower than the average of the previous decade).
A statistically significant upward trend in the collection of dry recyclables was found (b = 0.109 pp/year, 95% CI [0.086, 0.132], R
2 = 0.85,
p < 0.001), indicating that the increase over the study period is unlikely to be due to random variation (
Table 4).
During the period under AMLURB’s coordination, the physical expansion of recyclable collection was significant in absolute terms—reaching 87.9 thousand tons in 2017. The creation of SP Regula in 2020 coincides with an inflection in operational indicators. In the first year of the new administration, the registration of recyclable materials increased to 94.4 thousand tons, raising the rate to 2.61%. However, the 2021–2022 biennium saw retractions in the recovered tonnage of recyclables (falling back to the 70-thousand-ton range) and in the efficiency index (2.08% in 2022) due to illness of the workforce and biosecurity restrictions at the peak of the pandemic.
In the 2023–2024 biennium, under the institutional consolidation of SP Regula, the mass recovered culminated in 100,142.58 tons per year. This absolute increase, associated with the reduction in the denominator (the total mass of HW recorded), caused a positive rebound in the selective collection rate, which reached 2.85% in 2024.
Although a naïve comparison of periods might suggest differences between AMLURB and SP Regula management (household waste: p = 0.011; recyclables: p = 0.008), a time series regression, controlling for the pre-existing temporal trend, indicated no statistically significant level shift (p = 0.70 and p = 0.78, respectively) or trend change (p = 0.36 and p = 0.48) attributable to the governance transition. The observed changes are more consistent with the continuation of a pre-existing trend than with a causal effect of the administrative model change. The 2020 transition also coincides with the COVID-19 pandemic, limiting causal attribution.
Notwithstanding the progressive increase in household selective dry recyclables collection throughout the time series (evolving from 0.69% in 2006 to 2.85% in 2024), the absolute results reveal a distance from the goals recommended by the Integrated Solid Waste Management Plan (MISWMP) of 2014. The municipal planning stipulated that, as of 2017, the municipality should process 3000 tons/day of sorted dry waste, a goal conditioned to the installation of new mechanized sorting centers and the universalization of the service in the 96 districts (São Paulo districts are the basic territorial units into which the municipality is divided for the purposes of planning, public administration, statistical data production, and administrative organization. They constitute the smallest official political-administrative division of the municipality and are grouped into regional administrations (Municipal Law 13399/2002)) of São Paulo. However, data from 2024 showed that 100,142.58 tons of recyclable waste from household sources were diverted from landfill, which is equivalent to an average of only 274.36 tons/day—corresponding to less than 10% of the goal originally projected for the plan’s horizon.
As for the fulfillment of the goals established by the MISWMP of 2014, there is a marked deficit of infrastructural implementation in the analytical horizon to 2026 [
5]. An absolute lack of processing and biological treatment is evident. This deficit is aggravated by the noncompliance to the schedule of new facilities: by February 2026, there was no implementation of the mechanical-biological treatment (TMB) units—whose goal was 4 regionalized units with a capacity of 1300 tons/day—as well as the non-implementation of projects to expand the production capacity of 10 small sorting centers in public spaces (390 tons/day together) and the non-implementation of the installation of 4 plants for regional dry goods processing (1000 tons/day) [
5].
The goals associated with territorial coverage and social engagement were partially met, although under a paradoxical bias between declared coverage and material efficiency. Data from the regulatory agency SP Regula (2024) indicate that the separated collection service has been extended to the 96 districts of the municipality, reaching a formal coverage of 75% of residential households. However, the mismatch between this wide spatialized coverage (75%) and the low rate of deviation of effectively processed mass (274.36 tons/day) denotes bottlenecks in population adherence and in the performance of the reverse logistics network. Finally, the regionalized mechanized sorting infrastructure has been consolidated in a fragmented way: of the originally planned arrangement of four strategic plants (South, East, North, and West Zones), only two structures had been commissioned and integrated into the urban system by 2026—Materials Recovery Facilities Carolina Maria de Jesus and Ponte Pequena.
Municipal inspection linked to the separation of household solid waste is insufficient for the entire municipal territory, despite Federal Decree No. 6514/2008 [
21] and changes made by Federal Decree No. 10936/22 [
22] article 62, item XIII, which provides sanctions for those residents who do not segregate recyclable materials at the generating source when separated collection is instituted by the holder of the public urban cleaning service.
3.1. Evolution of the Separate Collection of Dry Recyclables
The time series (2006–2024) of the recycling rate in the city of São Paulo reveals a trajectory of timid discontinuous growth, characterized by gradual changes in operational levels. In the first five-year period (2006–2010), the indicator was stagnant below the threshold of 1.0%. Between 2011 and 2014, there was a positive inflection in the curve, reaching an average of 1.73% in 2013 and 2014. This initial increase is associated, territorially, with the expansion of the coverage of the separated collection service to peripheral areas of the east and south zones, specifically in the regional administrations of São Miguel Paulista, Ermelino Matarazzo, and M’Boi Mirim. As of 2015, the indicator consolidated above 2.0%, coinciding with the entry into operation of the two Materials Recovery Facilities and the expansion of the collection route to the regional administrations of Guaianases and Parelheiros. Between 2020 and 2022, the upward trend was interrupted due to the impacts of the COVID-19 pandemic on urban services and public health (
Table 1). The post-pandemic phase marked a recovery to 2.64% in 2023, and 2.85% in 2024.
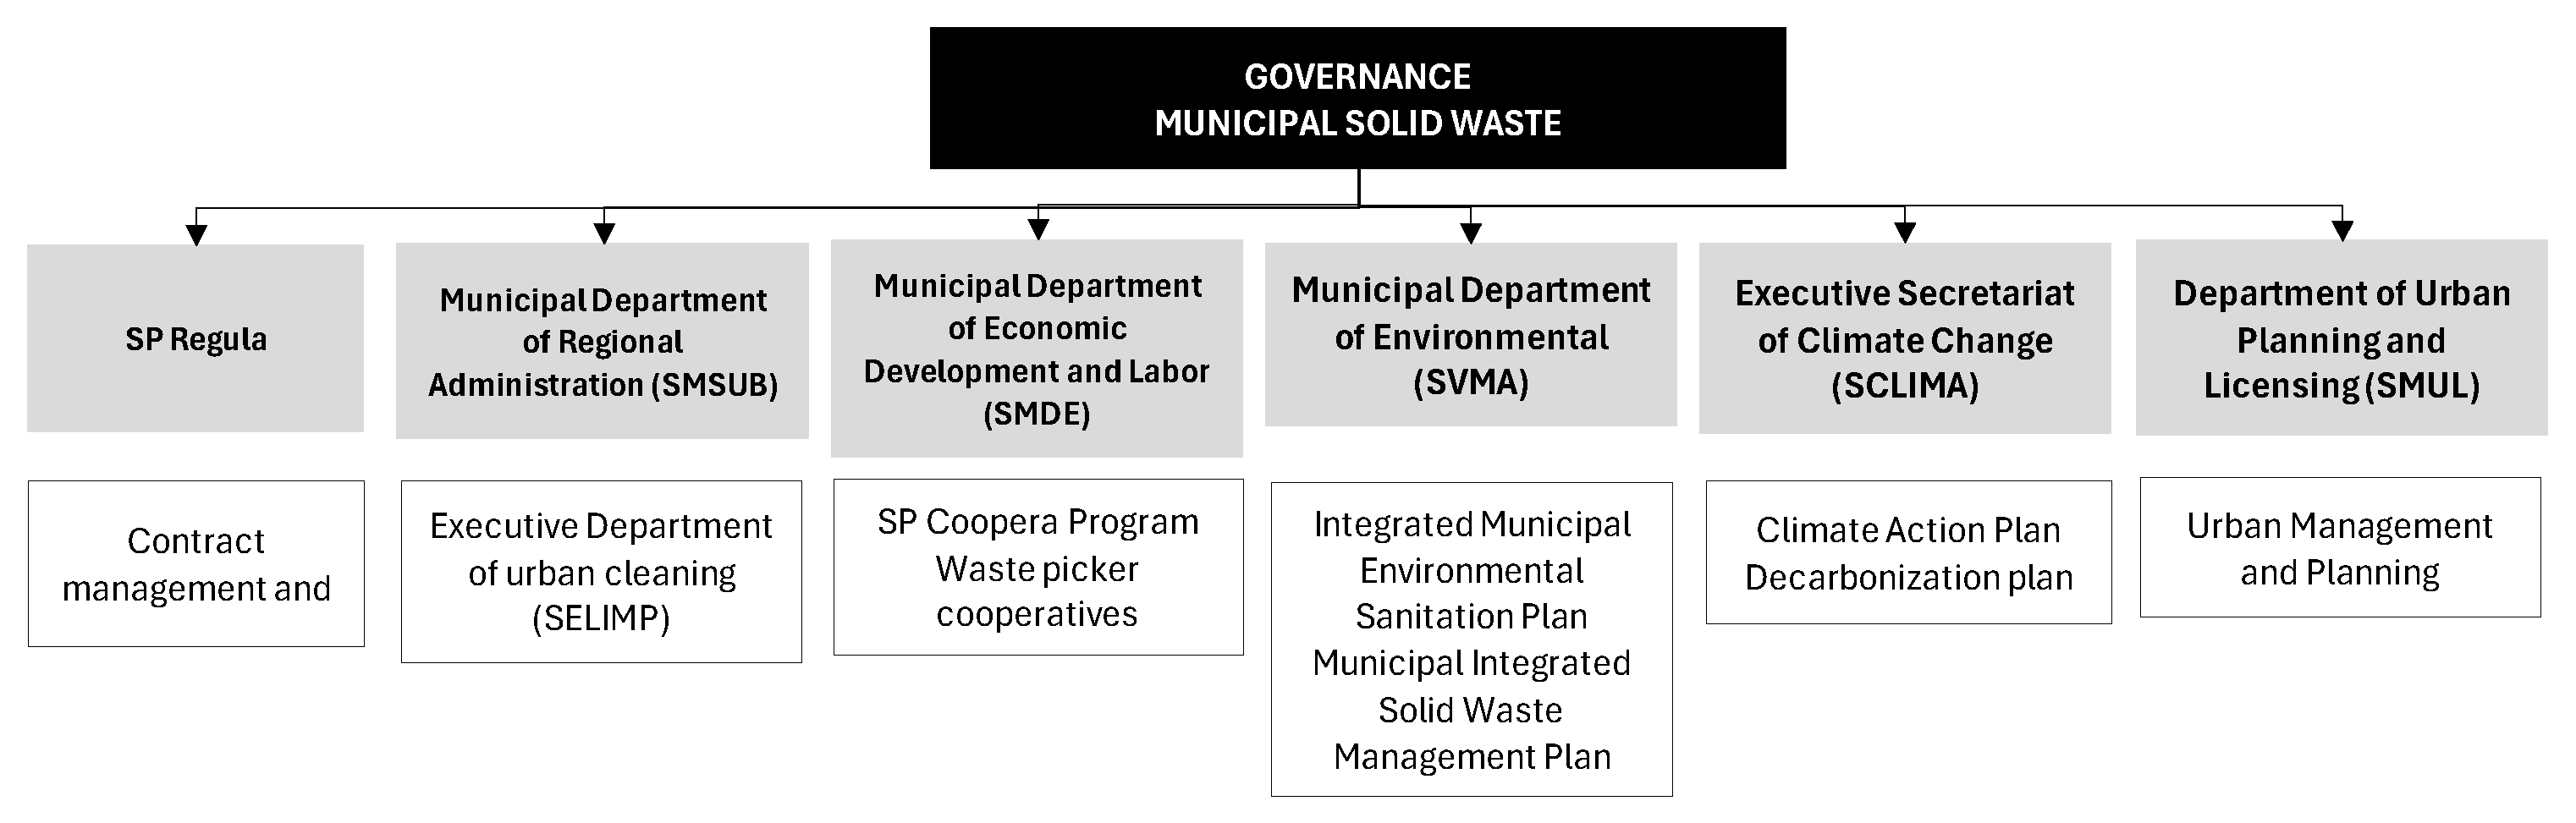
At the same time, the institutional arrangement that subsidizes the governance of solid waste in the city of São Paulo has undergone structural transformations. The centralized model, historically coordinated by a specialized and centralizing municipal authority (AMLURB), was transitioned to a decentralized model and dispersed among different municipal secretariats and agencies (
Figure 3), whose sectoral competencies are organized as follows:
The decentralization has pulverized the actions among several actors: the inspection of the contracts is under the command of SP Regula; the operationalization is concentrated in the SMSUB and SEMLIP; the development of the actions associated with the waste pickers’ cooperatives with the SMDE; the monitoring of the new MISWMP with the SVMA; the SMUL with the territorial compatibility of sectoral plans for the planning of urban policy; and SCLIMA with the mission of promoting the decarbonization (
Figure 3).
The advance of the indicator verified at the end of the time series should be interpreted as a result of the maturation of investments in the physical screening infrastructure.
3.2. Geography of Separate Collection of Dry Recyclables from Household Waste
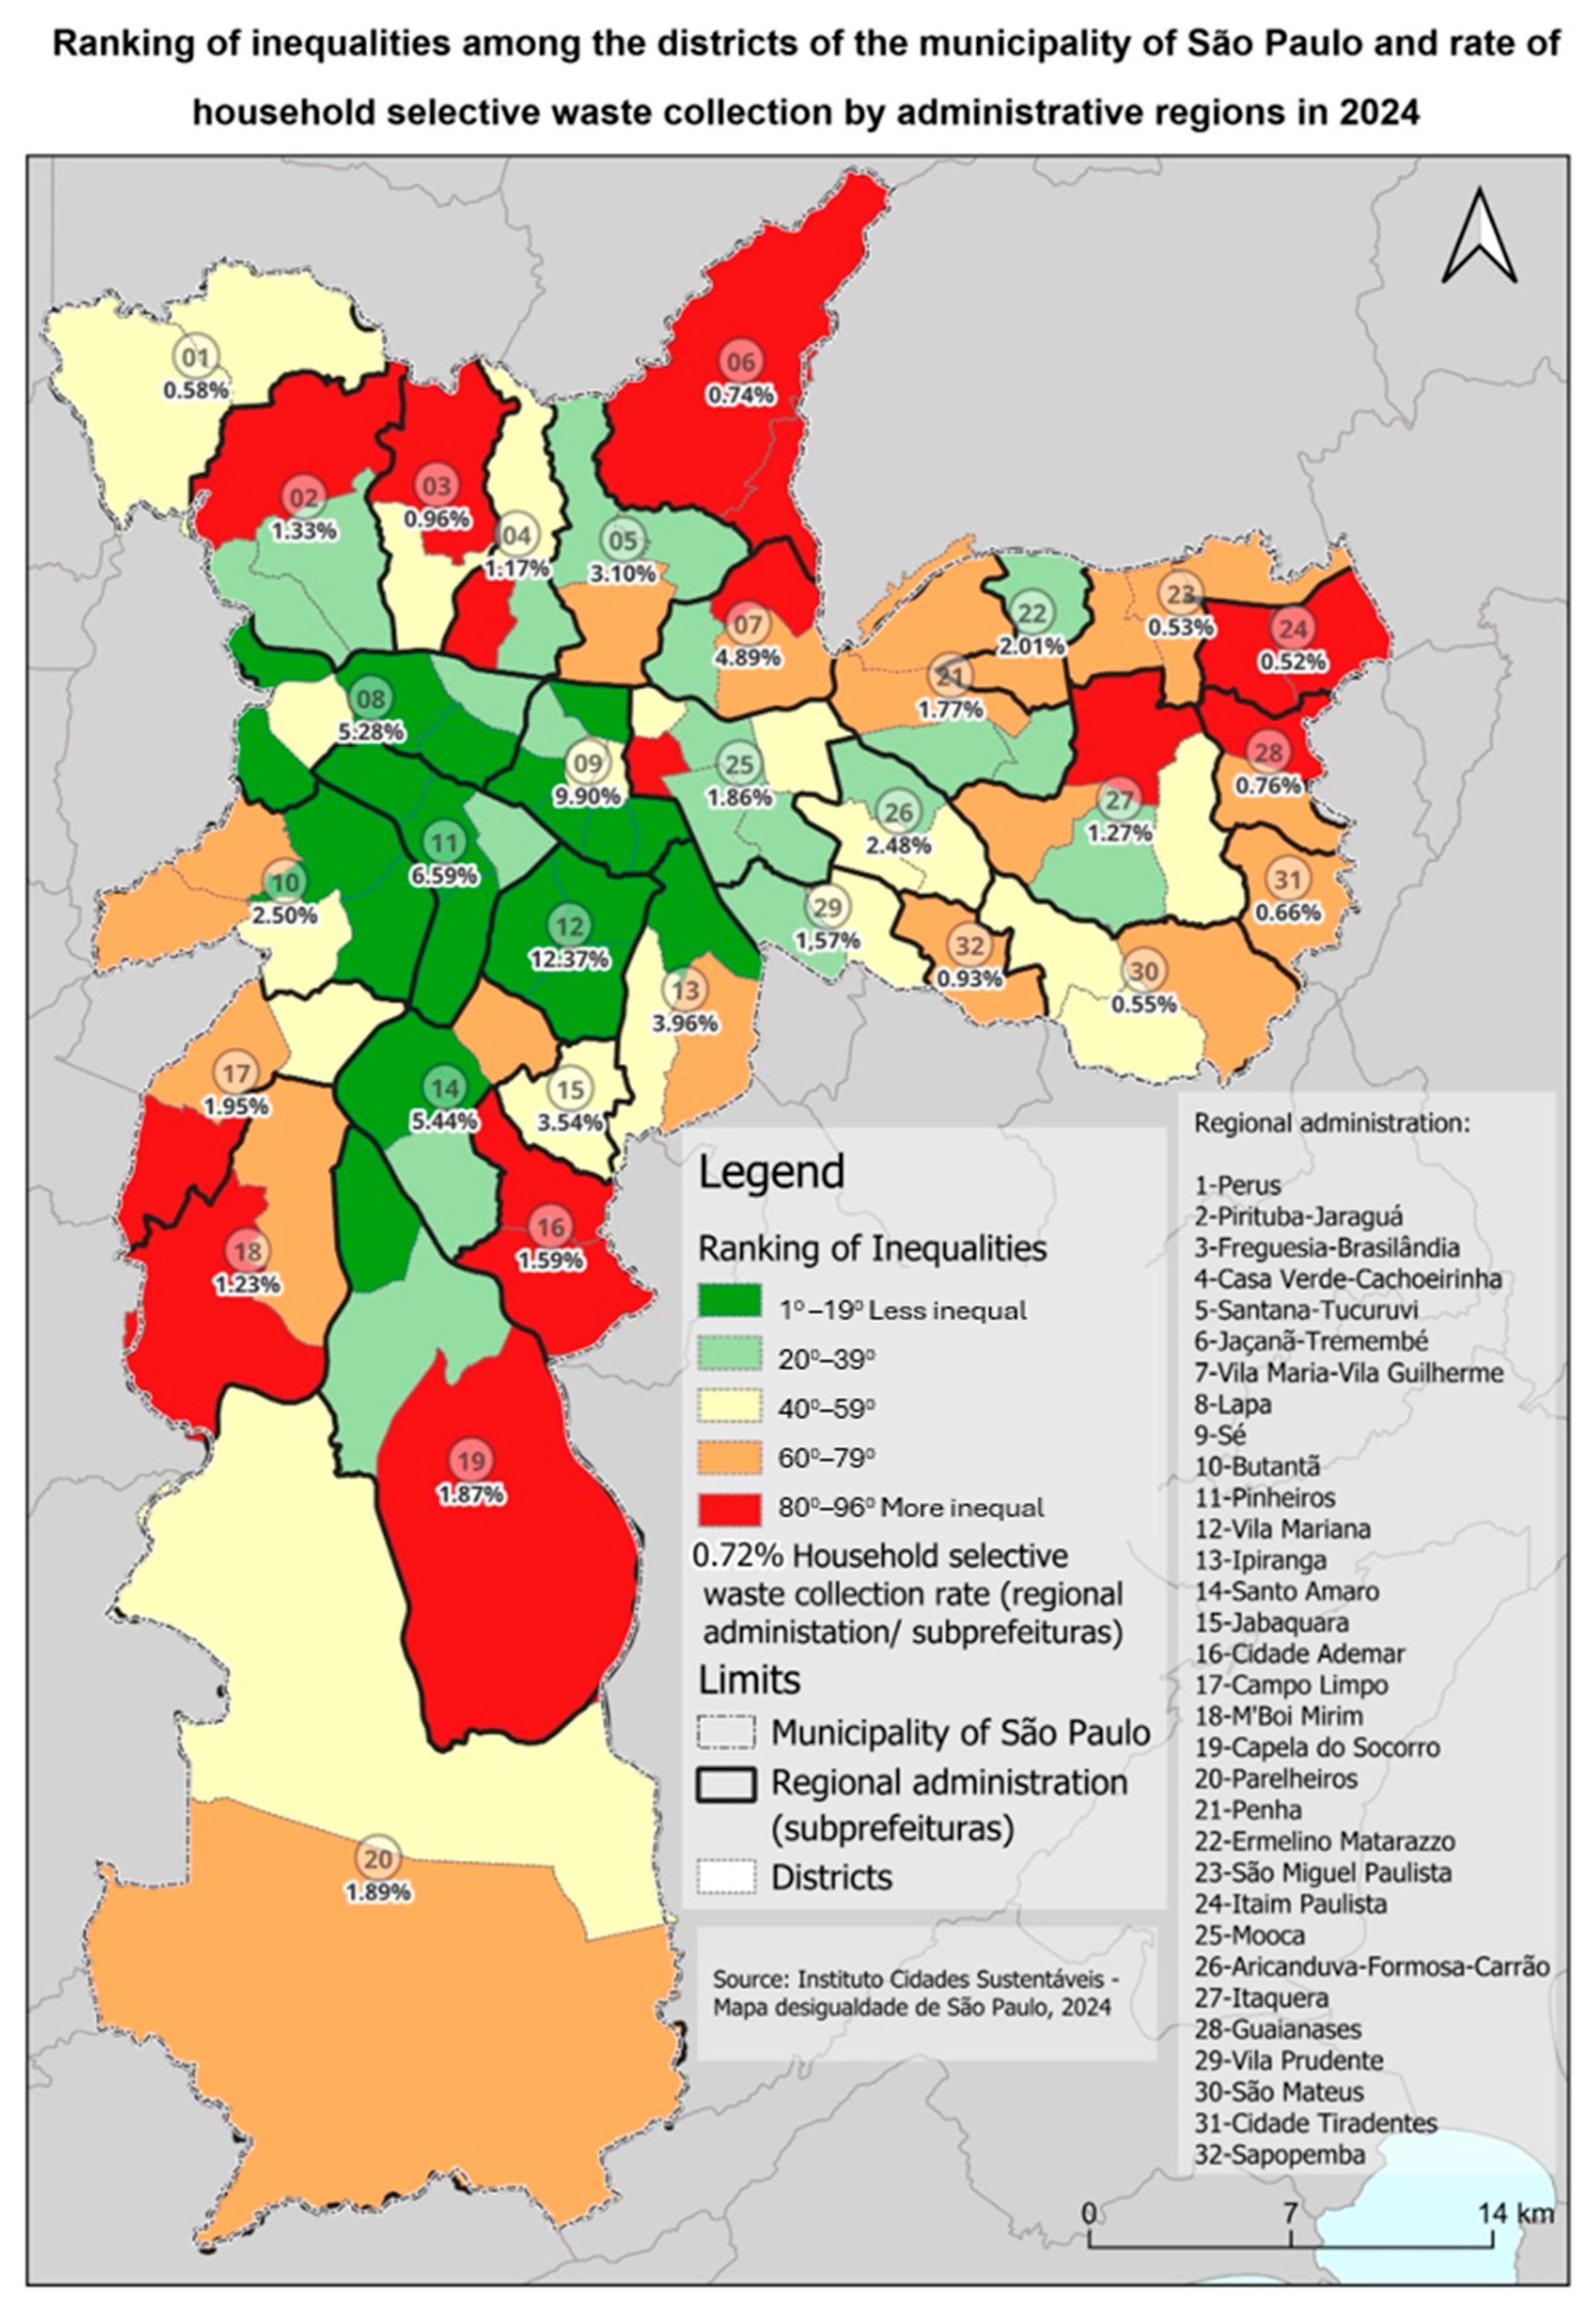
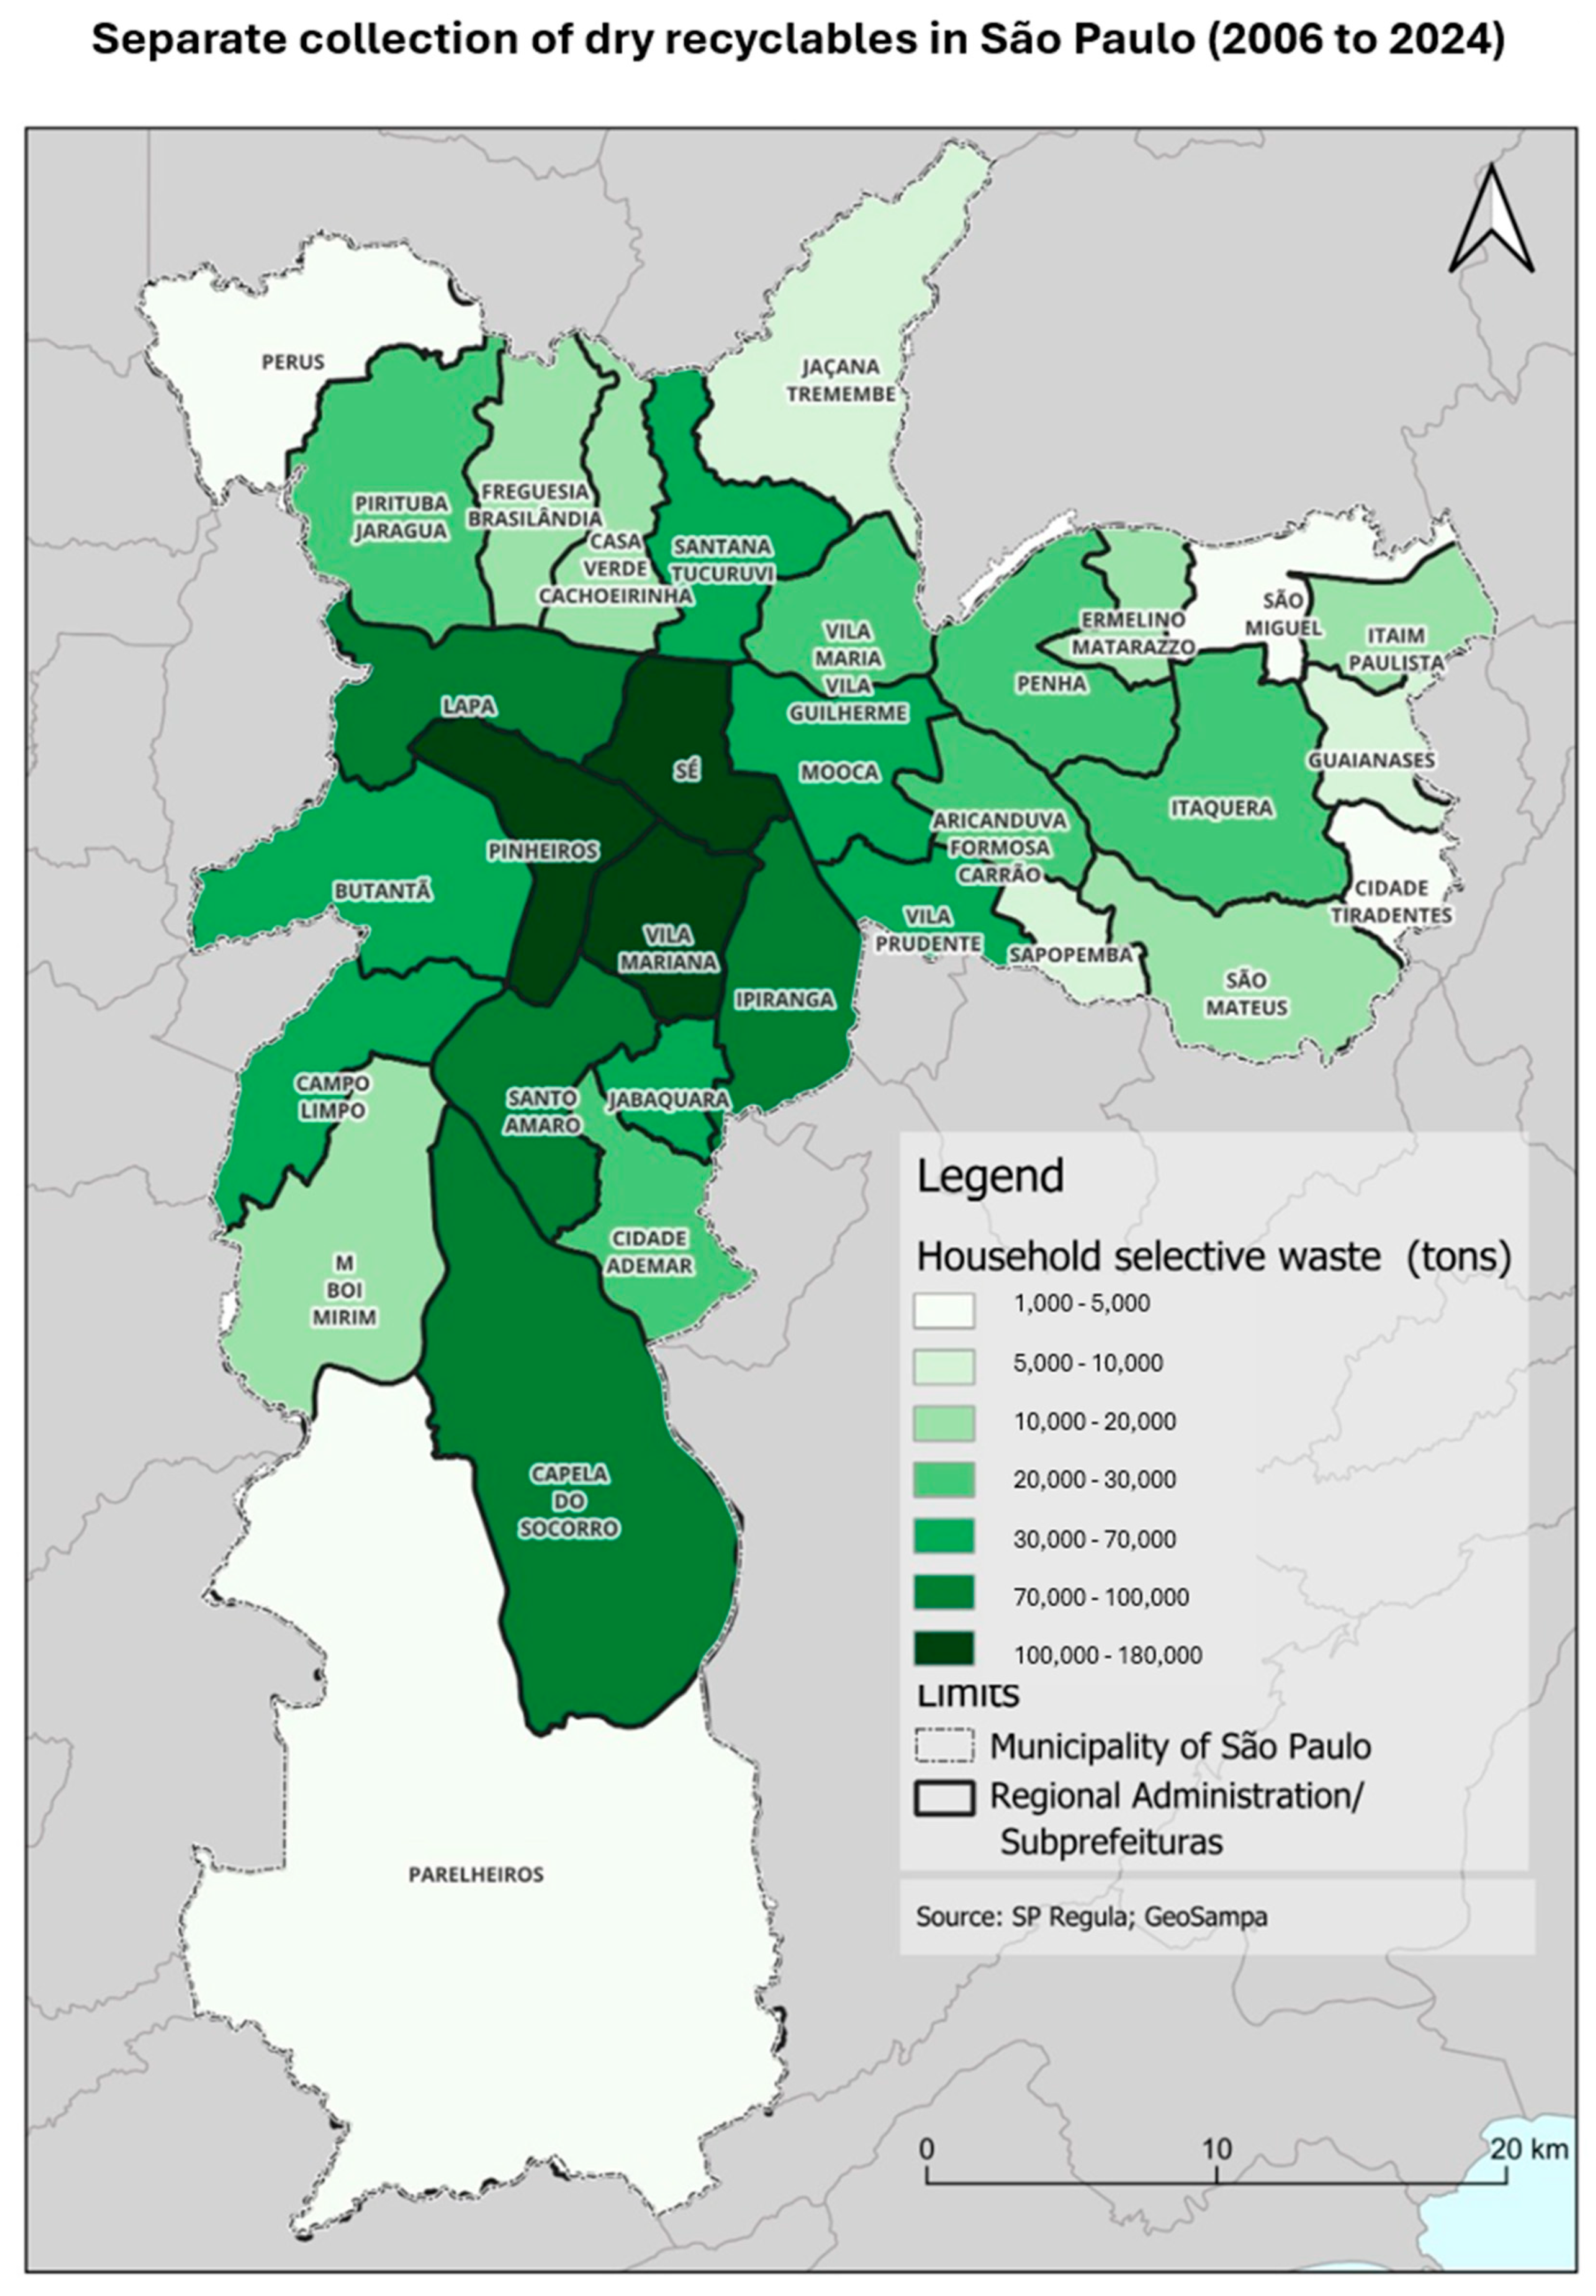
The spatial distribution (
Figure 4) of the separate collection of dry recyclables (SCDR) in the city of São Paulo did not occur homogeneously over the analyzed period in consonance with the socioeconomic asymmetries and infrastructure indicators that characterize the municipal territory.
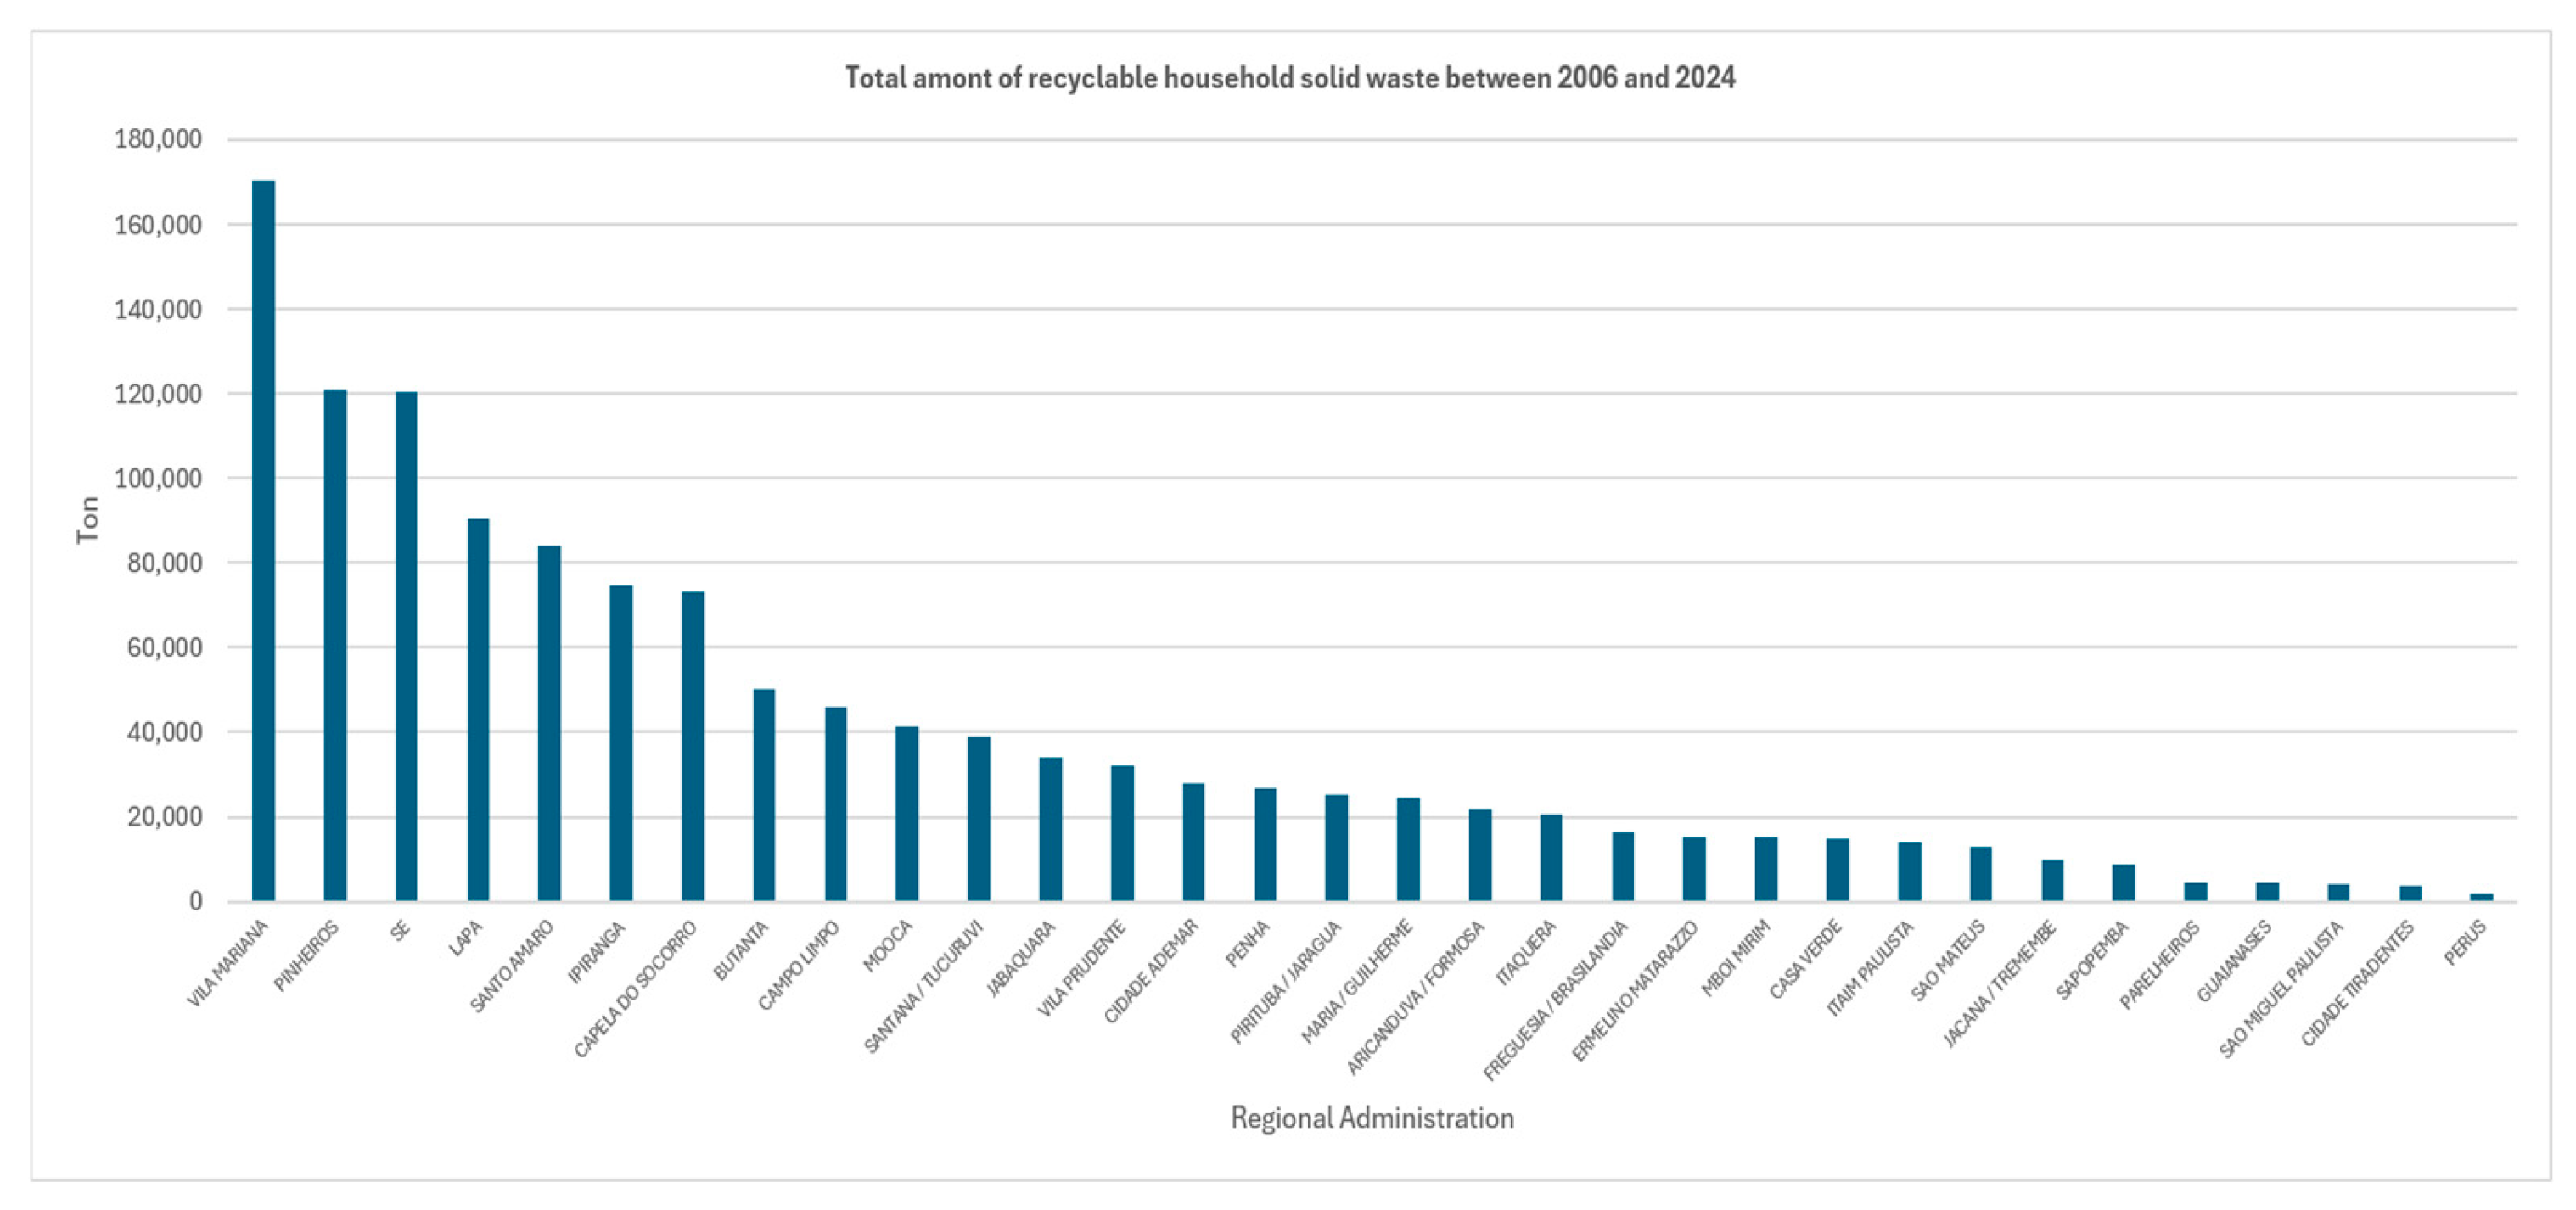
There was an overlap between the indices of social vulnerability and the inefficiency of the separated collection service. The regional administrations located in the expanded center and in the southwest vector (notably Vila Mariana, Butantã, Pinheiros, Lapa, and Sé), characterized by the lowest levels of social exclusion and greater urban consolidation, presented the best performances of the SCDR. On the other hand, the regional administrations located on the fringes of the urban fabric, such as Cidade Tiradentes, Perus, São Mateus, São Miguel Paulista and Itaim Paulista—regions historically marked by infrastructure deprivation and high levels of inequality—recorded the lowest rates of recycling (
Figure 4 and
Figure 5).
The map (
Figure 6) shows a spatial center-periphery pattern, where the ineffectiveness of the separate collection of dry recyclables (SCDR) is revealed. Central and southwestern vectors of the municipality, delimited in the map legend by the bands of least multidimensional inequality (stratum from 1st to 19th in the Ranking of Inequalities), showed more positive rates of recycling. Regional administrations with high-density infrastructure and demographic strata with higher purchasing power registered better operational performances than the municipal average, such as Vila Mariana (12.37%), Sé (9.90%), and Pinheiros (6.59%).
Conversely, strata from the 60th to 96th of inequality, toward the fringes of the urban fabric, highlight the inequality in the effectiveness of solid waste services. As observed in
Figure 6, the regional administrations located in the extreme east and north (Itaim Paulista: 0.52%. São Miguel Paulista: 0.53%. Cidade Tiradentes: 0.66%) had the lowest rates of SCDR, below the threshold of 1.0% in 2024. This chronic underperformance in the peripheries does not reflect a mere community inertia, but rather intermittent or deficient separated collection routes, the scarcity of drop-off points for recycling, and a gravimetric composition of predominantly organic waste—a reflection of a lower-income economy with less potential to generate discarded dry packaging.
These spatialized indicators reveal that 15 years after the enactment of the NSWP, the household recycling rate in São Paulo operates under the logic of socio-spatial segregation. The institutional design implemented reinforces a geography in which the ecological benefits and socio-productive inclusion of the sorting centers prioritize some territories of the city, relegating the most vulnerable portions to environmental liabilities.
A significant positive spatial autocorrelation was found for the separated collection rate (Moran’s I = 0.465, p = 0.0006) and for the socioeconomic inequality ranking (Moran’s I = 0.360, p = 0.0022), indicating that both variables are spatially clustered rather than randomly distributed across the municipality.
4. Discussion
Despite the avant-garde normative guidelines established by the Brazilian National Solid Waste Policy, the macro-operational arrangement of the city of São Paulo relies on landfills as the main technological route. The SCDR rate of 2.85% recorded in 2024 explains the abyss between the capacity to divert the mass flow of the landfill and the totality of household solid waste generated.
In fact, São Paulo, in spite of its economic and demographic importance, shows a situation that is not far from the country’s situation as a whole. In Brazil, in 2022, of the approximate 81.8 million tons of MSW generated, 76.1 million tons were collected (93.0%), and of the collected, 46.4 million tons (61%) were deposited in sanitary landfills, about 29.7 million tons (39%) were sent to dumps, and 1.12 million tons (or 1.47%) were for recycling activities [
23].
This dynamic corroborates the thesis that the practical effects of structural and normative interventions in solid waste management do not manifest themselves immediately [
24].
Econometric models applied to environmental management confirm that public policies aimed at recycling processes have statistically more robust and significant impacts in the long-term when compared to the immediate short-term effects [
25].
Economic resources, family income, educational level, and operational infrastructure—characteristics of richer and more central areas in São Paulo—are predictors of better rates of success in the recovery of recyclables [
26,
27,
28]. Economic growth and regional wealth drive the production of MSW in some regions of Brazil (including the southeast region, where the Municipality of São Paulo is located).
The main challenge of São Paulo’s governance lies in overcoming this residual level of recycling through investments in physical infrastructure and differentiated territorial intelligence. A promising executive strategy consists of the spatialization of operational goals based on the vulnerabilities evidenced in the Inequality Map.
A study among households in Bogotá, Colombia, identified factors that shape the attitudes toward source-separated recycling. In general, results showed that the higher the household’s socioeconomic class, the greater its effort for separating solid wastes. At lower socioeconomic classes, the attitudes toward solid waste separation were influenced by the use of the Internet, the membership to an environmentalist organization, the level of education of the head of household, and homeownership. The authors pointed out that increasing the education levels within the poorest segment of the population, promoting affordable housing policies, and facilitating Internet access for the vulnerable population could reinforce households’ attitudes toward a greater source-separated recycling effort [
29].
In England and Wales, where the recycling rates are over 50%, Wilansky and Cao recommended the implementation of targeted recycling marketing campaigns designed to improve rates, prioritizing areas with lower tertiary education attainment, higher percentages of single-person households or student populations, and higher unemployment—all of which exhibit lower recycling rates [
30].
From a perspective of equity, the regional administrations of São Paulo, located in the regions of higher socioeconomic strata, whose recycling rates and sorting infrastructure are better consolidated, should be the target of assertive social communication and environmental education campaigns, focusing on the refinement of segregation at the generating source. The peripheral regions of greater social vulnerability require structuring interventions: universalization and expansion of the separated collection routes, ostensible dissemination of operational schedules, physical implementation of drop-off point recycling, and socio-productive promotion of local cooperatives. In addition, economic mechanisms of direct incentive, such as payment for segregated recyclable material delivered, could be implemented. This strategy has been successfully adopted in middle-income cities, such as Cape Town, South Africa. There, residents pay fees proportional to waste collection services, which directly influences source separation practices. Additionally, small private collectors receive authorization from the local government to collect recyclables, and there are programs that exchange recyclable waste for credits in a card that can be used like cash. As a result, the city achieved a household solid waste recycling rate of 27% in 2017 [
31].
A gradual transition of the disposal of plastic bags directly on the sidewalks to a three-phase containerization system (organic, recyclable and waste fractions), as adopted in San Francisco, California [
32], could also be trialed. This physical restructuring paves the way for the application of tariff systems based on the polluter-pays principle, notably the international models known as pay-as-you-throw. The charge proportional to the volume or mass made available by the generating unit confers greater tax justice and discourages the excessive generation of waste. From the perspective of urban automation, the incorporation of radio frequency identification devices and telemetry in containers would enable real-time monitoring of the unloading frequency and the logistical optimization of concessionaire fleets—surpassing the current analog and free model of supplying large containers to vertical condominiums, devoid of any electronic audit mechanism.
Containerization can play a crucial role as an adaptation strategy in the face of the dynamics of climate change and urban hydrometeorological risk. In the city fringes, marked by the dense occupation of floodplains and valleys, vulnerability to extreme precipitation events is often enhanced by the dynamics of waste carried to water resources with the hydraulic drag of waste bags, contributing to obstruct micro and macro drainage networks, and aggravating flooding in the watersheds of the Tietê and Pinheiros Rivers.
Finally, there is a serious operational gap in the management of the household organic fraction, the largest gravimetric portion of the waste generated in the city. The institution of pilot projects to sort household waste into three fractions in regions that combine the highest indices of cultural capital, lower socio-spatial inequality, and consolidated performance in the SCDR has been proposed to test the technical feasibility and social acceptability as well as measure the rate of adherence to this new technological route that will contribute to urban decarbonization.
Despite the pioneering spirit of the 2014 MISWMP and its current update process (2025 and 2026), the significant time gap in the fulfillment of the original goals reflects a historical fragility in the political prioritization of the theme, compromising the local sustainable development goals [
29]. To date, the governance transition from AMLURB to SP Regula has not directly influenced the separated collection rates of recyclable materials in the Municipality of São Paulo. Therefore, this may represent an important variable to monitor in the coming years.
It is recommended that governments make waste and recycling data transparent and publicly available. The lack of accessible, centralized data on waste management in many regions poses a significant barrier to research and the development of effective recycling strategies [
30].
Although routes and schedules for separated collection are informed through institutional and concessionaire digital platforms, strategic monitoring data remain characterized by institutional pulverization.
There has been progress on the information diffusion of basic operations. At the Secretaria Municipal Department of Economic Development and Labor (SMDET), one can find the terms of cooperation between the municipal government and the scavengers ‘associations/cooperatives’. However, there are no public reports for monitoring and evaluating the impact of these actions. It is indispensable to measure them in order to verify their efficiency.
The social and environmental sustainability of the system demands continuous support to scavenger cooperatives. The operating capacity of cooperatives included in agreements with the local government represented 27.8% of the total amount of recyclables processed in the municipality in 2024, representing a central focus of the solidary economy as it employs 938 workers [
9]. The payment for their environmental services could be justified by the volume of dry waste avoided in sanitary landfills [
26,
27].
Despite the diffusion of content on the logistics of separated collection, municipal investments in social mobilization and environmental education remain below the demographic scale of São Paulo. Separated collection strategies must be implemented in line with integrated environmental policies to reduce tailings at the generating source, which directly reverts to the optimization of the system’s logistics costs [
24].
Consolidated platforms such as Recicla Sampa constitute underexplored strategic tools. The pedagogical and operational potential of its sections—which include segregation guides, voluntary delivery point mapping, guidelines for residential condominiums, and collection schedules—associated with its capillarity in digital social networks, should be enhanced by the government to increase the rate of household adherence. At the same time, private initiatives based on technological innovation have emerged in urban scenarios, such as the startup Green Mining and the “Estação Preço de Fábrica” project, which operate under the logic of immediate financial incentive to the population, acting as inducers of engagement in recycling [
33].
A unified digital platform of open data aimed at the management of urban solid waste is essential to provide transparency to civil society, subsidize future studies and independent audits, and provide robust empirical data for the continuous improvement of environmental sanitation policies.
5. Conclusions
This study, based on the retrospective evaluation of the management of household waste (HW) and the operational logistics of formal separated collection in the city of São Paulo, highlighted that 15 years after the enactment of the National Solid Waste Policy (NSWP), there has been an incremental, but markedly timid advance on the absolute growth of the mass diverted from landfills. The municipal system operates under severe structural limitations. Despite the central role played by waste picker cooperatives in the sorting and marketing of recyclable materials and the technical support of mechanized sorting centers (CMTs), there was a scenario of stagnation in the municipality’s physical processing capacity between 2017 and 2025, establishing a technological-operational ceiling that is difficult to overcome without new capital contributions, technology, and governance.
The most important result of the research was revealing that the geography of separated collection acts as a mirror of the socioeconomic inequities and spatial segregation in the city of São Paulo. It points out that recycling success cannot depend only on legislation, and is also correlated to demographic factors such as educational level and to the need for targeted policies that might lead to a progressive increase in source-separated recycling.
Data provided by official agencies utilized and analyzed in this paper were crucial for the results obtained, which represent an innovative and example approach for cities in Brazil and other low- and middle-income countries where waste recycling is a worrisome issue and the separation of SW is seldom practiced. However, a limitation of this study was the lack of interviews with household owners/heads of family to better identify factors shaping attitudes toward source-separated recycling in São Paulo. This might be an important issue for future studies regarding household waste recycling.
The findings of this study reveal that for the Municipality of São Paulo to align its municipal solid waste (MSW) management with sustainable development goals and decarbonization targets, a transition from incremental operational changes to a systemic structural transformation is required. Firstly, the observed stagnation in recycling rates despite normative overlaps suggests that institutional strengthening and the establishment of fiscal sustainability mechanisms are foundational to overcome current investment ceilings. Secondly, the significant gap in treating the organic fraction and the persistent socio-spatial inequalities underscore the necessity of diversifying technological routes and scaling the solidarity economy to mitigate the environmental externalities that disproportionately affect vulnerable territories. Thirdly, the correlation between socioeconomic determinants and recycling performance implies that environmental communication must evolve from homogenized approaches to territory-specific strategies. Finally, the institutional fragmentation observed during the transition to SP Regula highlights that data transparency and intersectoral governance are not merely administrative goals, but scientific prerequisites for the auditability and continuous improvement of urban sanitation policies in complex metropolitan contexts.