


Abstract
Financial institutions face an escalating volume of cybersecurity threats, yet existing decision frameworks rarely link predictive analytics to operational security priorities. Drawing on Task-Technology Fit theory, this study develops a machine learning-based decision-support framework to classify cybersecurity breach types in financial institutions and to identify the organizational risk factors that determine them. Analyzing 935 publicly disclosed incidents from the VERIS Community Database (VCDB, NAICS 52), we compare XGBoost against Random Forest, Logistic Regression, and Decision Tree. XGBoost achieves the most balanced performance (accuracy: 95.19%; weighted F1: 0.9519; 5-fold CV: 96.68% ± 0.21%). Feature importance analysis reveals ATM/kiosk infrastructure and breach pattern as the strongest predictors, translating into concrete SOC monitoring priorities. This framework supports UN/SDG 9 (Industry, Innovation and Infrastructure) and UN/SDG 16 (Peace, Justice and Strong Institutions) by strengthening the cyber resilience of financial institutions through open, replicable, data-driven methods. The open-data framework is replicable without commercial threat intelligence licenses.
Keywords:
cybersecurity risk management; decision support systems; XGBoost; financial institutions; organizational information security; breach classification JEL Classification:
G21; C53; G32
1. Introduction
The digital transformation of financial services has rendered cybersecurity a board-level priority. According to IBM Security (2024), the average cost of a data breach in the financial sector reached USD 6.08 million—the second highest of any industry—while the World Economic Forum (2024) ranks widespread cybercrime among the top five global risks by expected severity over the next decade [1,2]. This transformation spans payments, lending, investments, and risk management, as comprehensively surveyed in [3]. Beyond direct financial losses, breaches carry systemic risk: a single large-scale incident can trigger counterparty contagion, regulatory sanctions, and reputational damage that persists for years [4]. Financial institutions process vast quantities of sensitive customer data and execute high-value transactions, making them prime targets for cyber threat actors. Verizon’s 2024 Data Breach Investigations Report identifies the Finance and Insurance sector (NAICS 52) as experiencing 1378 security incidents and 1220 confirmed breaches, all of which were financially motivated [5]. However, the sheer volume of security alerts generated by traditional rule-based systems—intrusion detection systems (IDSs), firewalls, and endpoint protection tools—has created a secondary crisis: alert fatigue [6].
A Security Operations Center (SOC) is the organizational unit responsible for the continuous monitoring, detection, analysis, and response to cybersecurity threats. Staffed by security analysts operating around the clock, a SOC serves as the operational nerve center connecting technical threat intelligence to organizational risk management decisions. It interfaces upward with the Chief Information Security Officer (CISO) and risk committees, outward with external regulators and auditors, and inward with IT infrastructure teams. In regulated financial institutions, SOC outputs directly inform risk appetite statements, operational risk capital calculations under Basel III, and mandatory incident reporting under frameworks such as the EU Digital Operational Resilience Act and the SEC cybersecurity disclosure rules 2023. Security operations center (SOC) analysts are inundated with thousands of daily notifications, many of which are false positives or low-severity events. This cognitive overload impedes timely threat identification and increases the risk that critical incidents escape detection until significant damage has occurred [7]. For executives and risk managers, the problem is not merely technical; it is fundamentally organizational. The question is no longer “can we detect threats?” but rather “which threats demand our immediate attention, and how should we allocate limited security resources to address them?”
Existing research on cybersecurity analytics has largely focused on two streams. The first stream—rooted in computer science and engineering—employs machine learning algorithms on synthetic network traffic datasets (e.g., NSL-KDD, UNSW-NB15) to achieve high detection rates for known attack patterns [8,9]. While technically robust, these studies often overlook the organizational context in which security decisions are made. The second stream—rooted in risk management and finance—estimates the frequency, severity, and economic impact of data breaches using statistical models [10]. However, these approaches rarely provide granular, actionable guidance on which types of breaches are most likely to occur given specific organizational assets or threat actor profiles. Crucially, neither stream adequately addresses the decision-support needs of financial sector security managers who must translate predictive outputs into operational protocols, resource allocation, and incident response strategies. This study occupies the intersection of these streams: we apply a robust machine learning classifier (XGBoost) to real-world historical breach data, but our primary contribution is organizational—offering a replicable framework that transforms classification outputs into prioritization heuristics for SOC teams and risk committees.
Enterprise risk management frameworks such as COSO ERM (2017) and ISO 31000 require organizations to assess threats, rank them by likelihood and impact, and allocate finite resources accordingly [11]. For SOC teams, this translates into a daily prioritization challenge: which of the thousands of alerts warrants immediate escalation, and which can be safely deferred? Existing research provides limited guidance here. Technical ML studies optimize detection accuracy but rarely specify how outputs should inform organizational protocols or resource allocation [12]. Statistical risk-modeling studies quantify aggregate breach costs but do not classify breach type with the granularity needed to drive operational decisions [13]. Neither stream bridges predictive output and organizational action—this is the gap our study addresses. To address this gap, this study poses three research questions that bridge technical prediction and organizational action:
- RQ1: Which organizational assets and breach patterns are the most decisive predictors of breach type in financial institutions, and what does this imply for security monitoring priorities?
- RQ2: Can a machine learning classifier based on XGBoost provide superior and balanced classification of breach types compared to alternative algorithms, enabling reliable automated triage?
- RQ3: How can the outputs of such a model be operationalized as a decision-support tool that assists SOC analysts and risk managers in prioritizing responses and allocating resources?
By answering these questions, we aim to contribute a practical framework that leverages publicly available, real-world breach data (the VERIS Community Database) to enhance organizational cybersecurity resilience. Our approach is particularly relevant for mid-sized financial institutions that may lack the capacity to license commercial threat intelligence feeds, demonstrating how open data and accessible machine learning methods can democratize predictive security analytics. The remainder of this study is organized as follows: Section 2 reviews the relevant literature across both technical and organizational domains. Section 3 describes the research methodology, data source, and modeling approach. Section 4 presents the empirical findings. Section 5 discusses the implications of our findings for organizational decision-making and security operations. Section 5 concludes with practical implementation guidelines and directions for future research.
2. Materials and Methods
2.1. Literature Review
2.1.1. Applications of Machine Learning in Cybersecurity
The application of machine learning methods to cybersecurity has constituted a rapidly expanding line of research over the past decade. In 2016, researchers extensively examined the use of machine learning algorithms in fundamental security tasks such as intrusion detection and malware classification, and found that Support Vector Machines (SVM), Decision Trees, and Artificial Neural Networks achieved high detection rates [8]. However, that study focused on network traffic data and did not address patterns derived from sector-specific historical breach records.
Ensemble learning methods, particularly Random Forest and Gradient Boosting-based algorithms, have produced noteworthy results in cybersecurity classification tasks. In a 2012 study classifying different types of network attacks, researchers found that the Gradient Boosting method provided 12% higher accuracy than decision trees used alone [14]. Similarly, a meta-analysis comparing deep learning and conventional ML algorithms, determined that the clear advantage of deep-learning-based methods emerges only under large-data conditions, whereas ensemble methods such as XGBoost remain competitive on medium-sized datasets [9].
The integration of explainable artificial intelligence (XAI) has emerged as an important research direction aimed at enhancing the interpretability of security models. In 2024, researchers demonstrated that integrating SHAP (SHapley Additive Explanations) into XGBoost and Random Forest models provided actionable insights for security analysts while maintaining model accuracy [7]. This interpretability feature suggests that XGBoost can be regarded not merely as a technical classification tool but as an analytical framework supporting security decision-making.
Organizational and Behavioral Dimensions of Information Security
While technical detection capabilities are essential, information security management scholars have long emphasized that cybersecurity is fundamentally an organizational and behavioral challenge [15]. Research in this stream highlights that a significant proportion of security incidents stem from employee errors, policy violations, and misuse of authorized access—factors that cannot be addressed by technical controls alone [16]. In 2013 argue that behavioral information security research has largely focused on individual compliance with security policies, yet the translation of security analytics into organizational routines remains underexplored [12]. More recently, researchers conducted a comprehensive meta-analysis of 95 empirical studies and found that organizational culture, management commitment, and safety training are stronger determinants of safety behavior than technical awareness [17]. This literature underscores a critical gap: while predictive models can identify what is likely to happen, they provide limited guidance on how organizations should operationalize these predictions. Our study directly addresses this gap by linking predictive classification outputs to specific organizational actions—such as asset prioritization, resource allocation, and response automation—thereby contributing to the emerging intersection of data-driven analytics and organizational security management.
In 1995, the five fundamental dimensions of mission-technology fit were defined as follows: (1) mission characteristics, (2) technology characteristics, (3) mission-technology fit, (4) utilization, and (5) performance outcomes [18]. In our context, task characteristics correspond to the SOC analyst’s need to rapidly prioritize alerts, identify breach types, and allocate response resources under time pressure. Technology characteristics are captured by the XGBoost classifier’s outputs—specifically, its ability to produce probabilistic predictions, feature importance rankings, and class labels. Task-technology fit is achieved when these outputs are translated into an interpretable dashboard and automated escalation rules, aligning the technology’s predictive capabilities with the analyst’s decision-making workflow. This fit, in turn, is expected to improve performance outcomes—measured as reduced mean time to response (MTTR), decreased false positive overload, and more efficient resource allocation. Our proposed framework (detailed in the Section 5) operationalizes each of these TTF dimensions, providing a theoretically grounded pathway from predictive analytics to organizational action.
2.1.2. Information Security and Data Breaches in the Financial Sector
Financial institutions are among the primary targets of cyberattacks due to the intensive processing of both customer assets and personal data. In 2018 researchers using a statistical modeling framework built on large-scale cyber-breach data, found that breaches of financial data are associated with longer detection and response times relative to other sectors [13]. This finding strongly justifies the need for real-time or early-warning automated classification models tailored to the financial sector.
Financial institutions operate within a multi-layered governance and risk management architecture that directly shapes how cybersecurity incidents must be identified, classified, and reported. Under the Basel III/IV operational risk framework, banks must maintain systematic approaches to quantifying cyber-related operational risk. The EU Digital Operational Resilience Act (DORA, effective January 2025) introduces binding ICT risk management requirements, including mandatory classification and reporting of ICT-related incidents. Similarly, the SEC cybersecurity disclosure rules (2023) require U.S.-listed firms to report material cybersecurity incidents within four business days. In this regulatory environment, SOCs must produce documented, auditable, and defensible classifications of each incident—our model directly supports this requirement. A systematic review of 68 academic studies conducted in 2022 found that XGBoost and Random Forest were the most commonly used algorithms for detecting financial fraud and produced the highest F1 scores [19]. However, these studies primarily work with transaction-level fraud data and do not aim to classify organization-level breach types.
In the domain of cyber-risk modeling, Ref. [13] estimated the frequency and severity distributions of cyber breaches using parametric statistical models. Similarly, situated data breaches within a catastrophic-risk framework from an insurance perspective, showing that the magnitude of breaches across sectors follows a heavy-tailed distribution [10]. While these studies contribute to the statistical characterization of cyber risk, they do not employ machine-learning-based classification approaches.
2.1.3. Studies Using the VERIS Framework and the VCDB
The VERIS (Vocabulary for Event Recording and Incident Sharing) framework was developed by the Verizon RISK Team to describe security incidents in a structured and repeatable manner. The VCDB, built on this framework, converts publicly disclosed security-incident reports into a standardized format for use by researchers [20]. Verizon’s annual DBIR reports are based on VCDB data and make a substantial contribution to understanding the cyber threat landscape [5]. Among the studies that have used VCDB data analytically, the HALOCK Security Labs study stands out for combining VCDB data with the CIS RAM 2.1 framework to conduct sector-specific risk assessment, finding that sector-level probability estimates diverge substantially from general public data [21]. This finding supports the necessity of a classification model specialized for the financial sector. On the other hand, studies that directly process VCDB data with machine learning algorithms remain quite limited in the literature; this gap defines the central niche occupied by the present research.
2.1.4. The XGBoost Algorithm and Technical Background
Developed in 2016, XGBoost (Extreme Gradient Boosting), a gradient boosting framework, is an ensemble learning algorithm that exhibits superior performance, especially on structured/tabulated data [22]. Based on a sequential error-correction logic, each new tree in the method aims to minimize the residual errors of the preceding tree, thereby achieving a balance between low bias and low variance. L1 (Lasso) and L2 (Ridge) regularization parameters prevent overfitting, while parallel processing support significantly reduces computation time on large datasets.
Comparative studies in the literature consistently show that XGBoost produces competitive or superior results relative to Random Forest and standard Gradient Boosting methods in structured-data classification. In 2022, researchers reported that by working with unstable IoT network traffic data, XGBoost achieved the best performance in terms of weighted F1 score and exhibited strong detection rates for minority groups [18]. Similarly, it has been noted that the integration of XGBoost and SHAP simultaneously improves interpretability and classification accuracy in network intrusion detection [7].
Taken together, the studies reviewed above point to three principal gaps. First, the vast majority of existing ML-based cybersecurity research relies on synthetic network traffic datasets (such as NSL-KDD and UNSW-NB15); real historical breach data are rarely used. Second, ML-based breach-type classification studies specific to the financial sector are exceedingly scarce. Third, research that combines rich, openly accessible databases such as the VCDB with machine learning algorithms remains quite limited. By addressing these three gaps simultaneously, the present study constitutes an original contribution of high value to these underexplored areas.
2.1.5. Theoretical Synthesis: From Detection to Decision Support
The literature reviewed above traces a coherent knowledge-building trajectory that this study seeks to advance. The first generation of cybersecurity analytics focused on rule-based and statistical detection—establishing that automated systems could identify known threat signatures faster than human analysts. The second generation introduced machine learning classifiers trained on synthetic network traffic data, demonstrating that unknown threat patterns could also be identified through pattern recognition. The third generation—to which this study belongs—extends this progress in two directions: first, by grounding classification in real, historical, sector-specific breach records rather than synthetic benchmarks; and second, by coupling predictive outputs with organizational decision-making frameworks (TTF, ERM, RegTech) to ensure that what the model predicts translates into what organizations do.
For a reader new to this field, the practical implication is straightforward: prior research has told us that machines can detect threats, and that financial institutions are particularly exposed. What remains underexplored is how detection outputs are transformed into organizational action—which is precisely what this study addresses. By bridging the technical and organizational streams identified above, our framework offers a replicable, theory-grounded pathway from breach data to security governance decisions.
2.2. Method
2.2.1. Research Design
This research is a quantitative, descriptive classification study. Its purpose is to identify, through ML algorithms, the factors that determine the type of security breaches affecting financial institutions, and to evaluate the comparative classification performance of these algorithms. This study does not involve primary data collection; it uses the publicly available and unlicensed VCDB dataset. As the data are secondary and publicly available, and do not involve the collection of primary data from human participants or the processing of personal data, ethics committee approval was not required for this study.
2.2.2. Data Source: The VERIS Community Database (VCDB)
The data used in this study were obtained from the VERIS Community Database (VCDB), made openly available by the Verizon RISK Team via GitHub https://github.com/vz-risk/VCDB(accessed on 10 July 2026). The VCDB converts publicly disclosed security incidents into a standardized format under the VERIS framework. As of February 2025, the dataset comprises a total of 10,586 security incidents and 2683 variables. The data can be downloaded in CSV format and used freely without any additional registration or authentication requirement.
Incidents falling under NAICS sector code 52 (Finance and Insurance) were filtered for this study; this filtering process yielded 980 incidents. Observations with missing values on the variables indicating breach type were excluded from the dataset, leaving 935 observations for analysis. The 935 incidents span the period 1995–2025, with 95.7% concentrated in 2010 or later and 93.3% within 2010–2023. By financial institution sub-sector (NAICS 3-digit), credit intermediation and banking (NAICS 522) accounts for 51.2% of incidents; insurance carriers (NAICS 524) for 32.0%; securities and investment services (NAICS 523) for 8.7%; funds and trusts (NAICS 525) for 4.2%; and other financial activities for 3.8%. Geographically, 73.7% of incidents involve U.S.-based institutions and approximately 10.6% European institutions (United Kingdom: 6.1%, other EU: ~4.5%), with the remainder from other regions. This distribution reflects the VCDB’s reliance on publicly disclosed incidents, which are more prevalent in jurisdictions with mandatory breach notification laws. Organizational size is recorded as ‘Small’ (<1000 employees) or ‘Large’ (≥1000 employees); however, 84.0% of records carry an ‘Unknown’ size flag, reflecting a significant disclosure gap. Total-asset data are not available in the VCDB, which we acknowledge as a limitation addressed in Section 4.4.
2.2.3. Variables and Feature Engineering
The dependent variable is the dominant breach type for each security incident. The VERIS framework classifies attack actions into six main categories: (1) Hacking—unauthorized system access and technical exploitation, (2) Physical—physical access and theft, (3) Error—unintentional human error, (4) Misuse—abuse of authorized access, (5) Malware—breaches caused by malicious software, and (6) Social—social engineering attacks. Although more than one action category may potentially apply to a given incident, only the dominant category was assigned as the label.
The independent variables were constructed from all binary (Boolean) columns observed to have a value count between 20 and 900, together with the year of the incident. Columns lacking informational value or consisting entirely of empty/constant values (e.g., asset.cloud.Unknown) were removed during the pre-screening process. As a result of this pre-screening, 155 features were included in the analysis. These features are grouped under the following headings: type of affected asset (server, user device, ATM, web application, etc.), confidentiality/integrity/availability attributes, breach pattern, actor type (internal/external/partner) and motive, value-chain components, and the year in which the incident occurred.
2.2.4. Modeling Approach
We selected four algorithms representing different complexity levels and theoretical foundations: Logistic Regression (a linear, interpretable baseline), Decision Tree (a single, rule-based classifier), Random Forest (a bagging ensemble for variance reduction), and XGBoost (a boosting ensemble for bias reduction). This selection enables a systematic comparison of interpretability versus predictive performance, which is a key concern for organizational decision-makers who require both accuracy and explainability.
The dataset was split into 80% training and 20% test sets using stratified sampling, which ensures that the original proportion of each class is preserved in both subsets. To assess the risk of overfitting, five-fold stratified cross-validation (Stratified K-Fold, k = 5) was applied to the XGBoost model. Hyperparameter tuning was conducted using a standard grid search strategy with cross-validation on the training set to balance model complexity and generalizability. Final hyperparameter configurations are reported in Appendix A.
The trade-off between interpretability and predictive performance is particularly salient in organizational contexts. While Logistic Regression offers high interpretability—enabling managers to understand the linear relationship between each feature and the outcome—it sacrifices predictive power for complex, non-linear interactions. Conversely, XGBoost delivers superior predictive accuracy but operates as a “black box” unless coupled with explainability tools such as SHAP [15]. Our selection of four algorithms spanning this spectrum allows us to empirically demonstrate this trade-off and to provide guidance for organizations that may prioritize interpretability over raw accuracy (e.g., for regulatory compliance) versus those that prioritize predictive power (e.g., for automated triage). This analysis is presented in Section 4.2 and discussed in Section 4.3.
3. Results
3.1. Descriptive Statistics of the Dataset
The dataset, comprising 935 observations from the finance and insurance sector, exhibits a pronounced imbalance in the distribution of breach types. Table 1 summarizes the class distribution.
Table 1.
Distribution of breach types in the financial sector (N = 935).
Hacking (32.83%) and physical breaches (28.34%) together account for 61.17% of all observations. The Malware and Social Engineering categories constitute minority classes (3.21% combined), which makes the use of the weighted F1 score as the primary evaluation criterion necessary for model assessment.
3.2. Model Performance Comparison
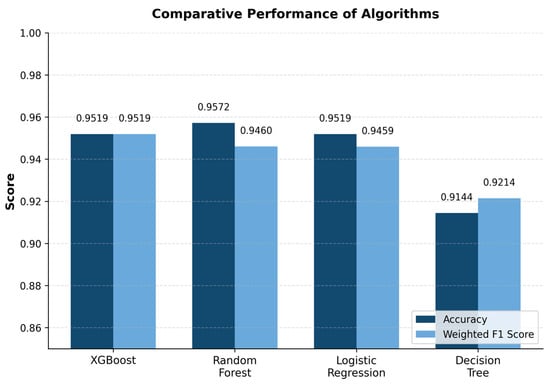
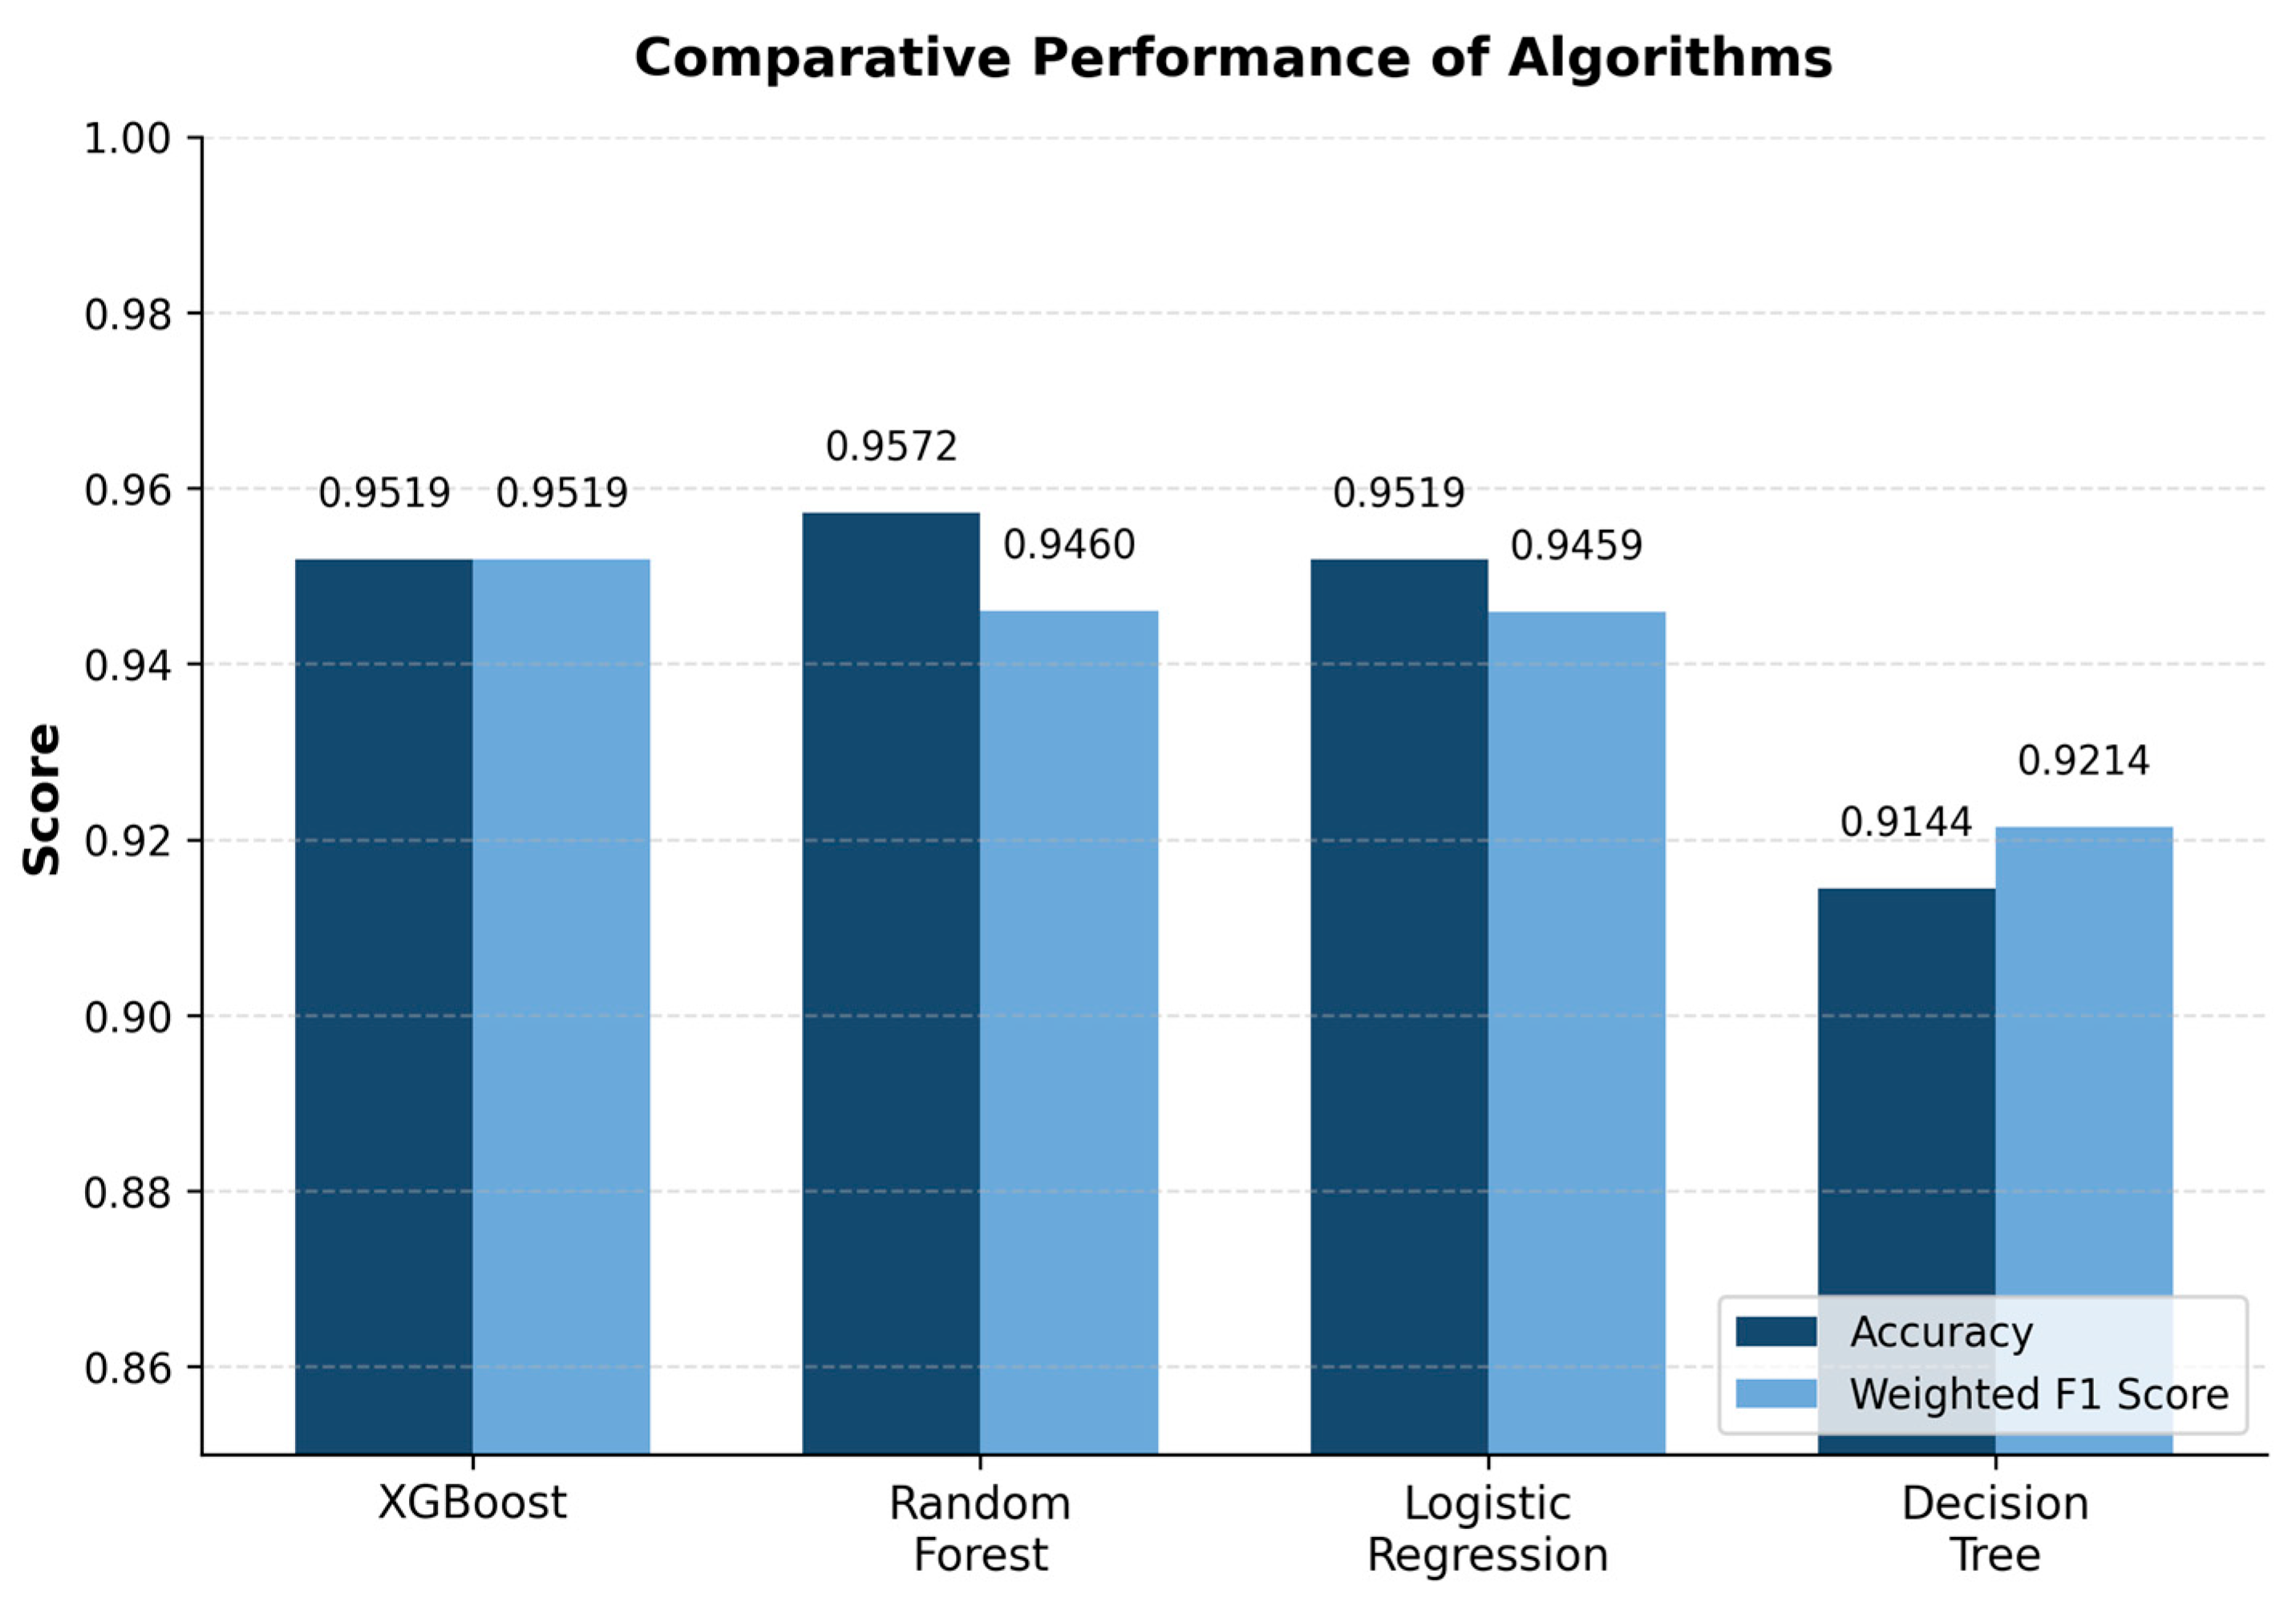
The performance results of the four algorithms on the test set are presented in Table 2. The models were evaluated on an 80% training–20% test split, using 187 test observations. Figure 1 visually compares the results.
Table 2.
Comparative performance results of the algorithms.
Figure 1.
Comparison of algorithms by accuracy and weighted F1 score.
As shown in Table 2 and Figure 1, XGBoost performs very closely to Random Forest in terms of accuracy (95.19–95.72%) while achieving the highest weighted F1 score among all models (0.9519). This result indicates that XGBoost’s performance across minority classes is more balanced than that of the other methods. Five-fold cross-validation confirms the generalizability of the XGBoost model and indicates a low risk of overfitting (mean: 96.68% ± 0.21%). The Decision Tree exhibits the weakest performance, while Logistic Regression matches XGBoost in accuracy but lags behind in F1 score.
3.3. Class-Level Performance Analysis for XGBoost
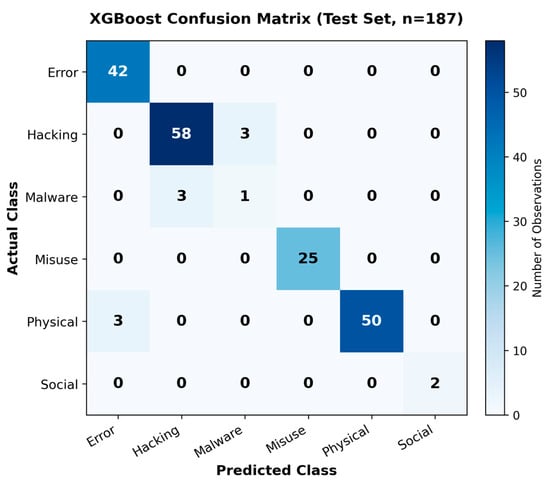
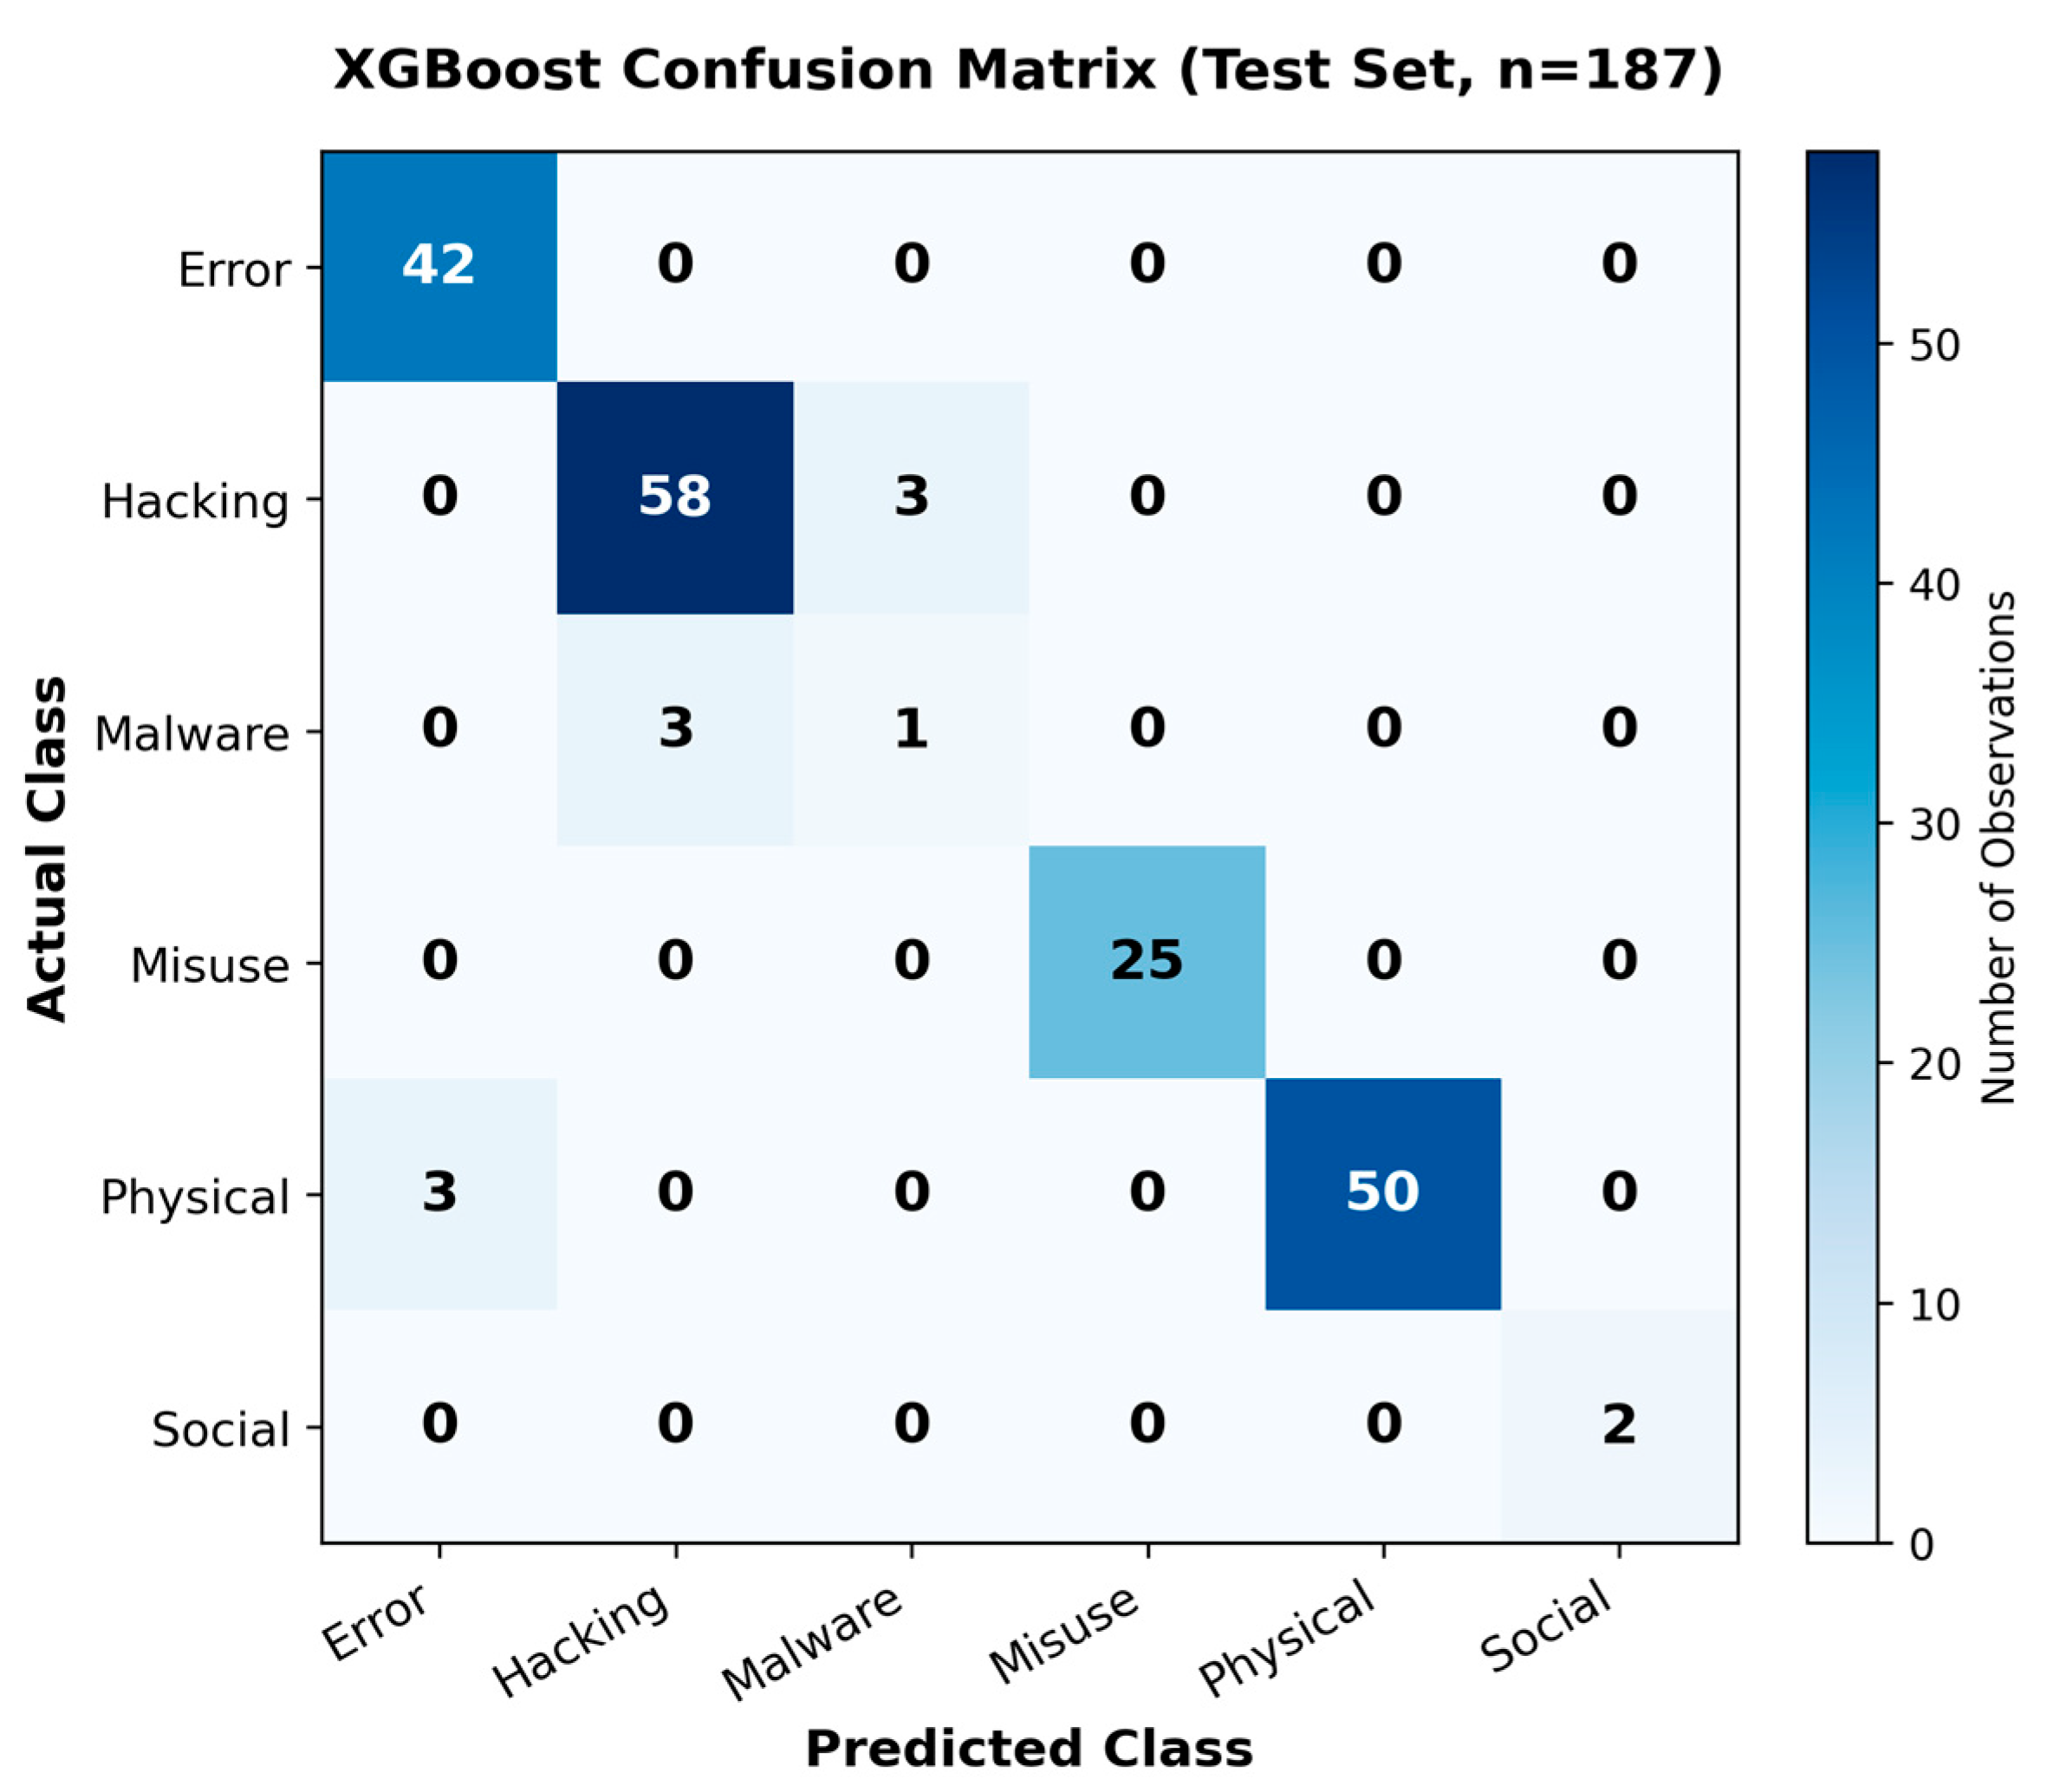
Table 3 presents the class-level performance values of the XGBoost model for each breach type, while Figure 2 displays the model’s confusion matrix on the test set.
Table 3.
XGBoost class-level performance report.
Figure 2.
XGBoost confusion matrix (test set, n = 187).
Taken together, Table 3 and Figure 2 show that high F1 values were achieved for the Error, Misuse, Physical, and Social classes. The only notable error pattern in the confusion matrix is the misclassification of three Hacking observations as Malware; this can be interpreted as reflecting the technical overlap between the two categories (for example, hacking attacks carried out using malicious software). The low F1 score for the Malware class (0.250) stems from the insufficient number of observations in the test set (n = 4). This finding suggests that data augmentation or class-weighting strategies for minority classes should be applied in future studies.
3.4. Feature Importance Analysis
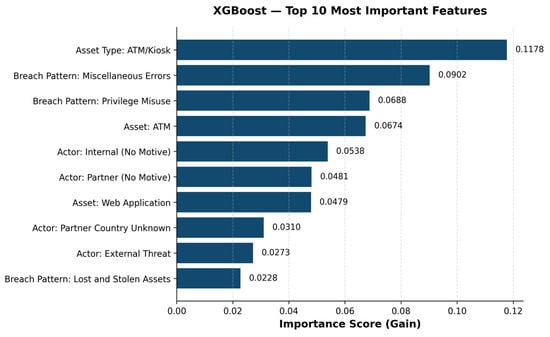
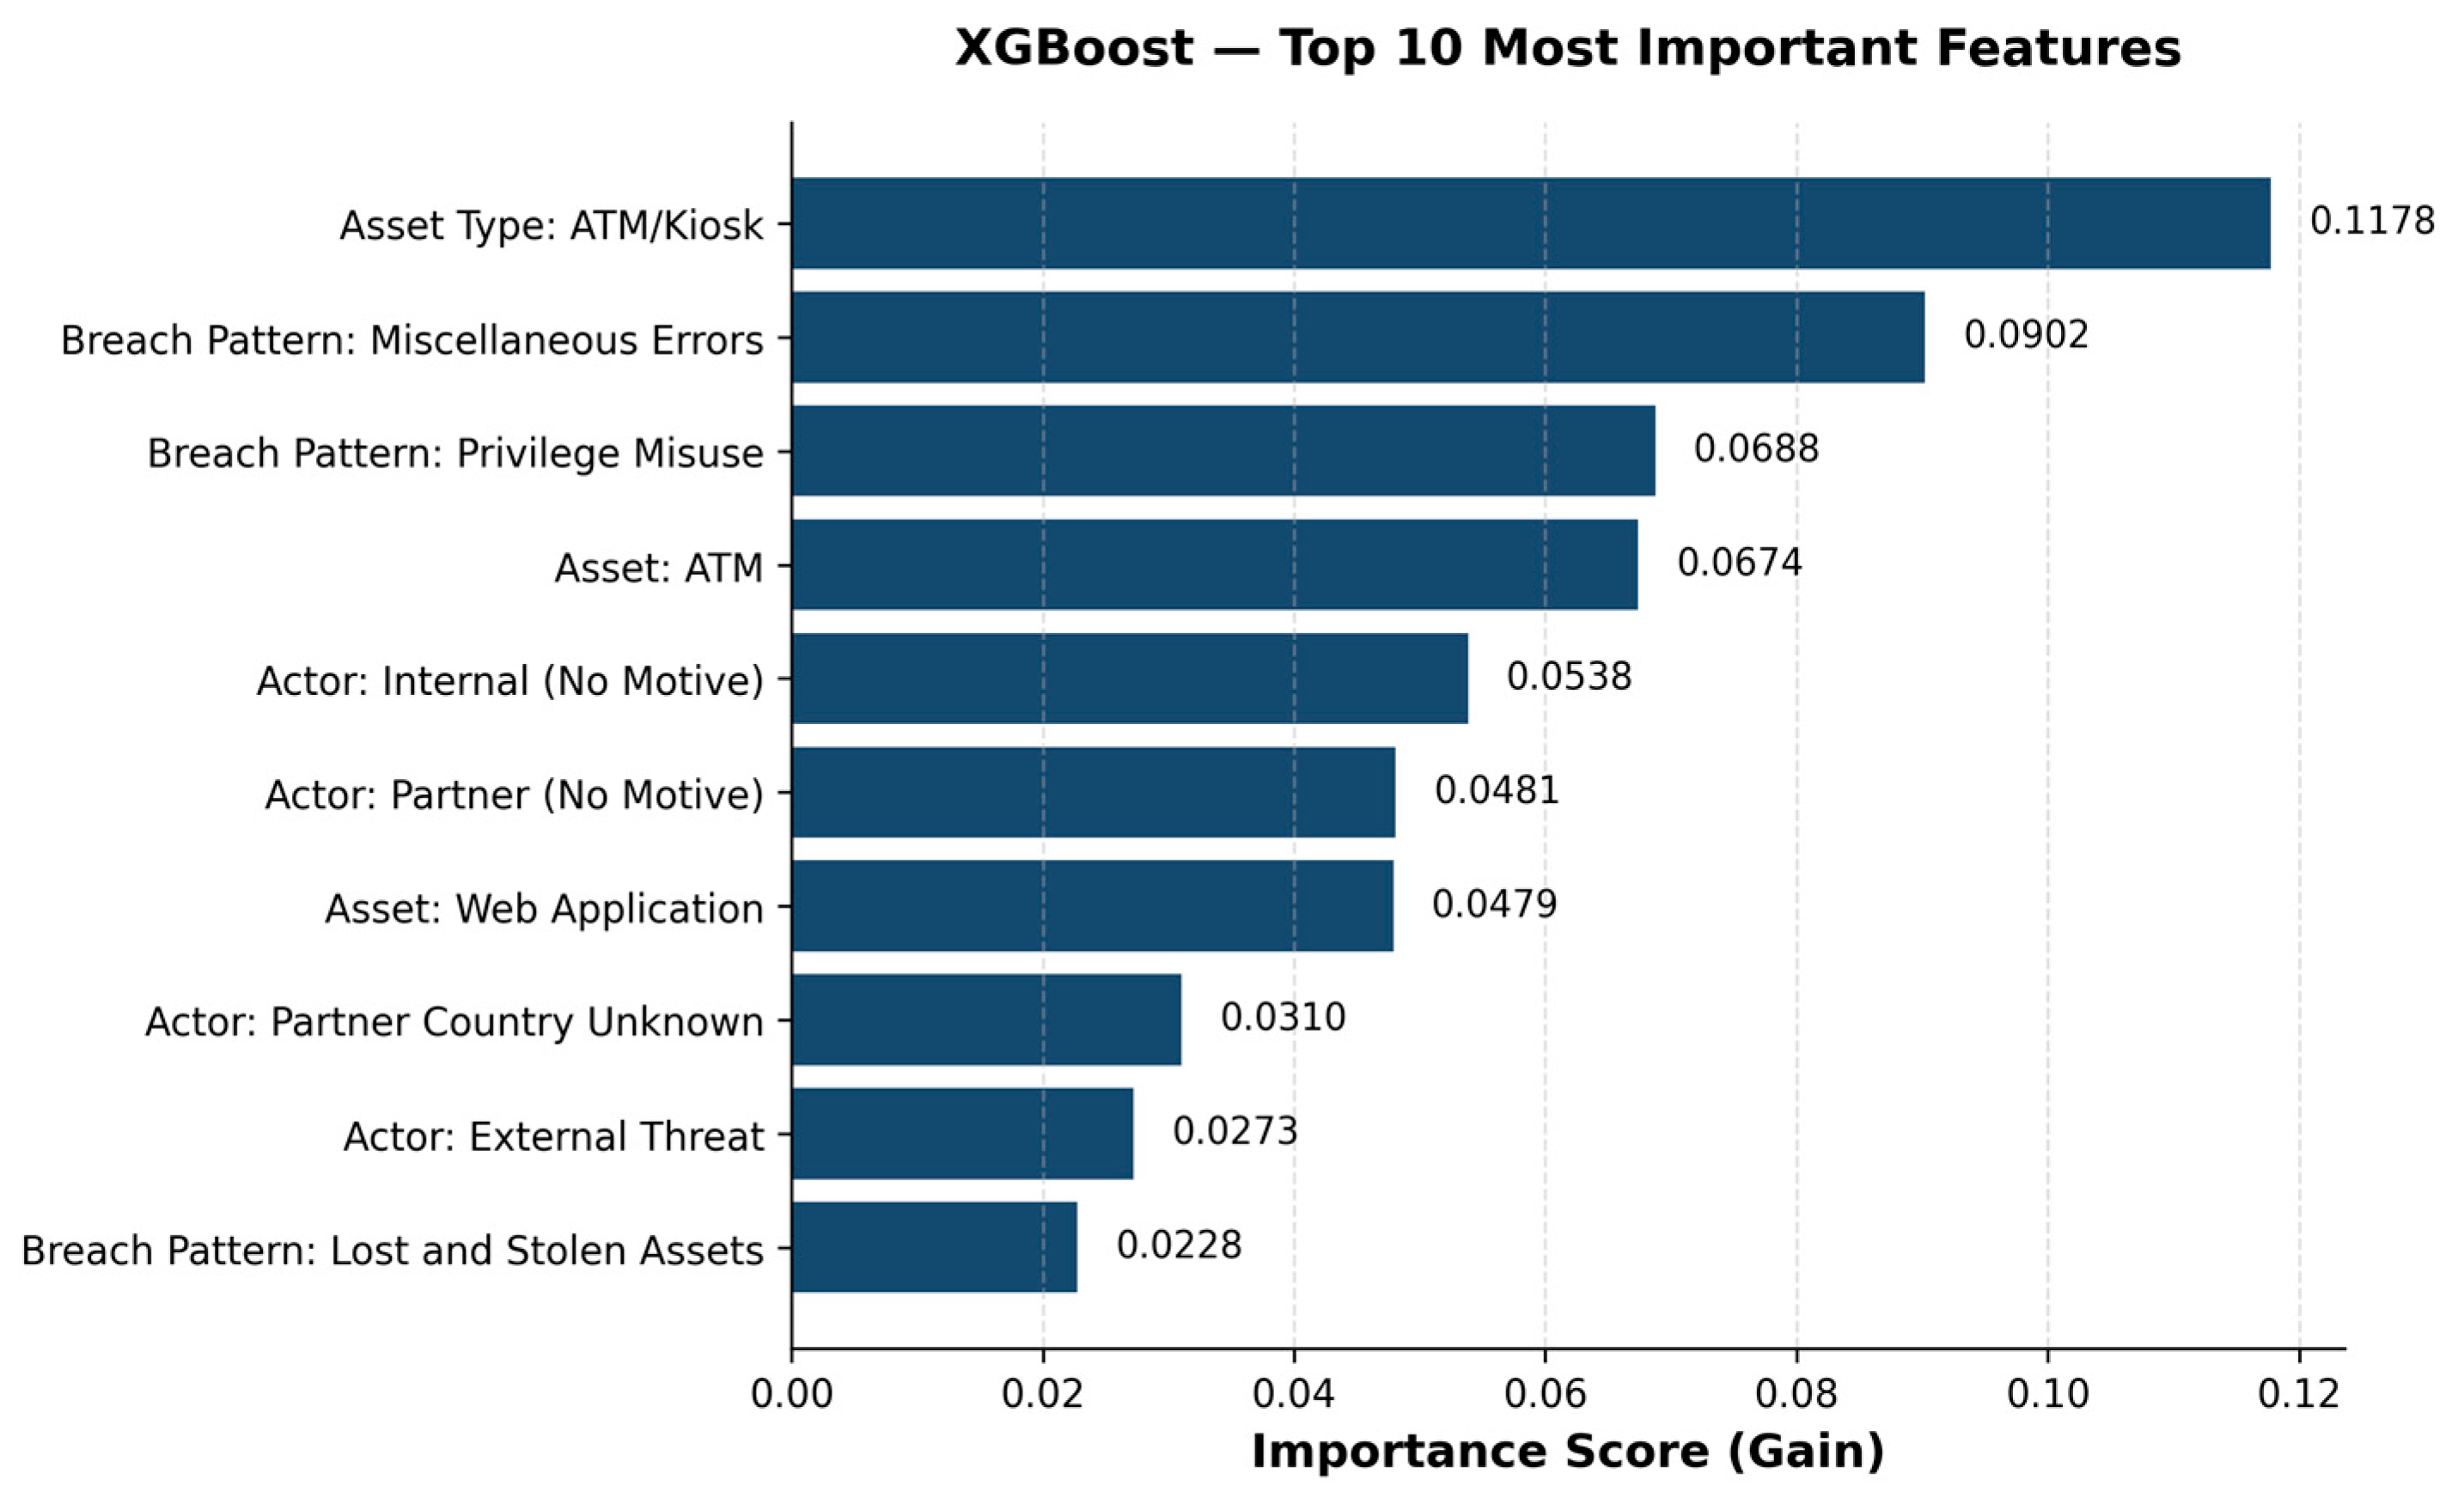
The gain-based feature importance scores of the XGBoost model reveal which variables play the most decisive role in breach-type classification. Table 4 and Figure 3 present the top ten features ranked by importance score.
Table 4.
XGBoost—top 10 feature importance scores (gain-based).
Figure 3.
XGBoost—visual presentation of the top 10 most important features.
Considered together, Table 4 and Figure 3 show that the two highest-scoring features are ATM/kiosk asset type (0.1178) and the miscellaneous-errors breach pattern (0.0902). This finding indicates that both the type of asset targeted by an attack and the pattern triggering the breach are meaningfully determinative of breach type. The high importance of the ATM/kiosk asset type is particularly noteworthy, as it suggests that physical breaches predominantly occur through this channel. The fact that variables relating to actor motive and actor type (internal, partner, external) also rank among the most important features indicates that, beyond technical asset characteristics, information about the identity of the threat actor carries meaningful explanatory power for determining breach type.
4. Discussion
4.1. Comparison of Findings with the Literature
The findings obtained in this study largely align with the existing literature confirming XGBoost’s superiority in structured-data classification. While researchers [23] reported that XGBoost outperforms conventional algorithms on imbalanced network traffic datasets, a consistent advantage is likewise observed in this study on financial-sector breach data. Combining XGBoost with SHAP has been shown to produce both interpretable and highly accurate results in network-based classification. The feature significance findings of this study also support the validity of this approach on VCDB data [7]. Verizon’s 2024 DBIR reporting on the Finance and Insurance sector emphasizes that system intrusion has risen to become the primary threat category and that social engineering has increased dramatically. The dominance of the Hacking class in the VCDB analysis is consistent with this observation; however, the temporal window of our data (2010–2025) differs from the single-year perspective of the DBIR. This difference suggests that long-term historical data more strongly reflect the weight of incidents arising from physical breaches and human error.
The most important finding of the feature importance analysis is that the type of affected asset and the breach pattern exhibit an exceptionally strong predictive function as independent variables. This finding is structurally consistent with the determining role of transaction type and transaction channel variables reported in a 2022 review focusing on the detection of financial fraud [19]. This parallel suggests that behavioral, pattern-based features are consistently critical determinants of threat classification in the financial sector.
4.2. Practical Implications
The findings of this research offer several important practical implications for information security management and corporate risk assessment. First, corporate Security Operations Centers (SOCs) can treat the high-importance features identified in this study as monitoring priorities when setting alert thresholds. In particular, anomalies observed in ATM/kiosk assets and unauthorized access attempts on web applications can be effectively used as early-warning signals.
Second, the model’s ability to classify breach type with high accuracy enables incident response protocols to be supported by automated triage processes. Security analysts can adopt the model’s output as a prioritization guide, thereby shortening response times. Third, the open-data approach adopted in this study—the free and unlicensed accessibility of the VCDB—demonstrates that this type of analysis can also be implemented by mid-sized financial institutions that lack the capacity to purchase comprehensive commercial data licenses.
4.3. Operationalizing Feature Importance as a Managerial Dashboard
We define our proposed DSS as comprising three integrated components: (1) a predictive engine (the XGBoost classifier that produces breach type probabilities), (2) a visualization layer (a dashboard that displays feature importance scores and alert priorities), and (3) an action module (automated escalation rules based on predicted breach type). This tripartite structure ensures that the system not only predicts but also guides and automates organizational responses.
Our feature importance analysis (Table 4) yields immediately actionable priorities for security managers. The model identifies ATM/kiosk infrastructure (importance score: 0.1178) as the single most decisive predictor of breach type. For risk committees, this finding suggests that physical security controls—including hardware tamper-proofing, surveillance, and regular physical audits—should be prioritized alongside network-based controls. Second, miscellaneous errors and privilege misuse (importance scores: 0.0902 and 0.0688) emerge as critical behavioral risk factors. This implies that SOCs should not solely focus on external threat actors; internal processes and employee training programs addressing human error and inappropriate access are equally vital. Third, the model’s inclusion of actor type (external, internal, partner) as a complementary predictor suggests that threat intelligence feeds should be enriched with identity and access management (IAM) data. Taken together, these findings enable a dashboard-based prioritization framework, where security teams can dynamically monitor high-importance features and escalate alerts based on their predictive weight. This dashboard approach transforms the model from a black-box classifier into a transparent decision-support instrument that aligns with the cognitive workflows of SOC analysts.
4.4. Limitations
This research has several important limitations. First and foremost, the VCDB includes only publicly disclosed breaches, meaning that unreported or confidentially handled incidents fall outside its scope. Although financial institutions subject to mandatory regulatory disclosure requirements are relatively less affected by this constraint, selection bias cannot be entirely ruled out.
The limited number of observations in the Malware and Social Engineering classes reduces model reliability for these categories. Imbalanced-data management techniques such as SMOTE (Synthetic Minority Oversampling Technique), together with datasets spanning longer time periods, could help address this limitation in future research. Additionally, hyperparameter optimization in this study was limited to an initial grid search; advanced methods such as Bayesian optimization were not employed.
Furthermore, although our dataset spans multiple years, the concentration of incidents from the 2010–2023 period means that the model may not fully capture the evolving nature of cyber threats, particularly the recent surge in AI-enabled and ransomware attacks. Future research should incorporate more recent incident data as they become available through the VCDB to ensure temporal generalizability.
The extremely low incidence of Social Engineering breaches (n = 9) in our sample warrants particular caution. This limitation reflects the public disclosure bias of the VCDB—social engineering attacks are often underreported due to reputational concerns. We therefore advise against using our model for Social class predictions in isolation; instead, organizations should complement the model’s output with targeted phishing simulation data and employee training metrics to strengthen detection in this category.
4.5. Implications for Organizational Theory
Our findings carry important implications for organizational theory, particularly for the emerging literature at the intersection of information systems governance and FinTech. By demonstrating that a machine learning classifier grounded in Task-Technology Fit (TTF) theory can be operationalized within SOC workflows, this study contributes to the theoretical understanding of how predictive analytics become embedded within organizational security routines. Our results suggest that TTF alignment is achieved dynamically as model outputs are translated into escalation rules, dashboards, and response protocols that match the cognitive workflows of security analysts [24].
Furthermore, our work positions algorithmic breach classification as an emerging RegTech instrument—technology that helps financial institutions meet regulatory compliance obligations (DORA, Basel III, SEC disclosure rules) through automated, data-driven means. This situation connects to the argument that RegTech represents a shift from manual rule-based compliance to analytics-driven assurance [25]. Future research should examine the organizational conditions under which firms successfully institutionalize such tools, including leadership commitment, analyst training, and integration of model outputs into formal governance reporting.
5. Conclusions
The purpose of this study was to classify the types of cybersecurity breaches targeting financial institutions using machine learning algorithms and to identify, in a data-driven manner, the risk factors that determine breach type. In light of this purpose, the answers to the three research questions posed in the Introduction are summarized below.
Regarding RQ1 (which organizational assets and breach patterns are the most decisive predictors of breach type), the findings are affirmative: the XGBoost model classified the financial-sector breach data with high success, achieving 95.19% accuracy and a weighted F1 score of 0.9519; the five-fold cross-validation result (mean: 96.68% ± 0.21%) confirms that this performance is not incidental and that the model generalizes well to unseen data. Regarding RQ2 (whether XGBoost provides superior and balanced classification compared to alternatives), the analysis shows that the type of affected asset (particularly ATM/kiosk) and the breach pattern (particularly miscellaneous errors and privilege misuse) are the most decisive variables in classification, while information about the identity of the threat actor (internal, external, partner) provides complementary explanatory power. Regarding RQ3 (how model outputs can be operationalized as a decision-support tool), the findings indicate that XGBoost performs very closely to Random Forest in terms of accuracy while producing the highest and most balanced result among the four algorithms in terms of weighted F1 score, whereas the Decision Tree exhibits the weakest performance.
Beyond these contributions, this study advances the theoretical understanding of how predictive analytics can be integrated into organizational security routines. By applying Task-Technology Fit (TTF) theory, we demonstrate that the effectiveness of machine learning classifiers in security operations depends not only on algorithmic accuracy but also on the alignment between predictive outputs and the decision-making workflows of SOC analysts. This theoretical lens provides a foundation for future research examining the socio-technical dimensions of cybersecurity analytics—an area that remains underexplored in the information systems literature.
In light of these findings, this study makes three original contributions to the relevant literature. The first contribution is methodological: departing from the dominant research trend that relies on synthetic network traffic datasets (such as NSL-KDD and UNSW-NB15), this study develops a financial-sector-specific classification model based on real, publicly available historical breach records (VCDB), an approach that enhances the model’s capacity to reflect real-world breach patterns. The second contribution is comparative: the systematic comparison of four different algorithms on the same data and under the same evaluation protocol provides financial-sector researchers and security practitioners with an empirically grounded algorithm selection guide. The third contribution is practical: the findings of the feature importance analysis offer a concrete, data-driven guide regarding which asset types and breach patterns security units with limited budgets should prioritize for monitoring.
The findings of this study should be evaluated within the limitations noted in Section 4.4 (the exclusion of undisclosed breaches from the dataset’s scope, the low number of observations in minority classes, and the limited scope of hyperparameter optimization). While these limitations do not entirely undermine the generalizability of the findings, they warrant a cautious interpretation of the results.
Three main recommendations are offered for future research: (1) applying deep learning architectures—particularly LSTM-based time-series models—to forecast annual breach trends, (2) improving minority-class performance through SMOTE or class-weighting strategies, and (3) integrating SHAP-based feature attribution analysis to enhance model interpretability. In conclusion, this research offers researchers and practitioners seeking to develop proactive threat intelligence for the protection of financial information assets a concrete framework that is both methodologically sound and practically applicable.
Practical Steps for Implementing the Framework in Financial Organization
For CIOs, CISOs, and security directors, our framework can be operationalized through the following four steps:
Data integration: Extract and standardize incident logs from existing SIEM (Security Information and Event Management) systems to align with the VERIS schema variables used in our model. This step ensures that the model’s feature set can be populated with real-time organizational data.
Model calibration: Retrain the XGBoost classifier with the organization’s own historical incident data to account for sector-specific and firm-specific risk profiles. While our model is trained on a multi-organizational public dataset, calibration with internal data improves predictive accuracy for unique organizational contexts.
Dashboard deployment: Visualize feature importance scores as a “risk heatmap” within SOC dashboards, enabling real-time monitoring of high-importance assets (e.g., ATM networks, web applications, internal access logs). This visualization allows analysts to focus on the most predictive variables identified in Table 4.
Response automation: Configure escalation rules triggered by the model’s predicted breach type. For example, “Malware” predictions can automatically activate endpoint isolation protocols, while “Social” predictions can trigger user awareness alerts and additional authentication challenges.
By embedding predictive analytics into existing security workflows, organizations can reduce the cognitive burden on SOC analysts, shorten mean time to response (MTTR), and align security operations with broader enterprise risk management objectives. Importantly, our use of publicly available data (VCDB) demonstrates that even organizations with limited budgets for commercial threat intelligence can implement this framework without substantial upfront investment.
Author Contributions
Data curation: M.S. and E.N.; formal analysis: E.N.; methodology: M.S.; project administration: N.A.; resources: M.S.; supervision: N.A.; validation: E.N.; visualisation: M.S. and E.N.; writing—original draft: M.S. and E.N.; writing—review and editing: E.N. and N.A. All authors have read and agreed to the published version of the manuscript.
Funding
The APC for this article was funded by Yozgat Bozok University. (EDYAP, Grant No: SED-2026-2411).
Institutional Review Board Statement
Not applicable.
Informed Consent Statement
Not applicable.
Data Availability Statement
The data was obtained from the publicly available database on GitHub, available database on GitHub, provided by the Verizon RISK Team. The address is https://github.com/vz-risk/VCDB (Accessed on 24 June 2026).
Acknowledgments
The financial support provided by the Scientific Research Projects Unit of Yozgat Bozok University (EDYAP, Grant No: SED-2026-2411) for the publication of this article is sincerely appreciated. During the preparation of this manuscript, the authors used Claude (Anthropic, Claude 3.5 Sonnet) for database searching, spell checking, and language support. The authors have reviewed and edited the output and take full responsibility for the content.
Conflicts of Interest
The authors declare no conflicts of interest.
Appendix A
- Hyperparameter values were determined based on an initial grid search; the final model used n_estimators = 200, max_depth = 6, learning_rate = 0.1, subsample = 0.8, and colsample_bytree = 0.8. All analyses were conducted in a Python 3.11 (Python Software Foundation, Wilmington, DE, USA) environment using the scikit-learn 1.4 (INRIA, Paris, France) and XGBoost 2.0 (XGBoost Contributors, distributed via GitHub) libraries, with a fixed random seed (random_state = 42) to ensure reproducibility.
- For comparative evaluation, four algorithms were applied using the same data split: XGBoost (n = 200 trees), Random Forest (n = 200 trees), Logistic Regression (max_iter = 1000), and Decision Tree (max_depth = 8). For each model, accuracy, weighted F1 score, and class-level precision and recall values were reported. Given the imbalanced class distribution, weighted average metrics were adopted as the primary evaluation criterion.
References
- IBM Security. Cost of a Data Breach Report 2024; IBM Corporation: Armonk, NY, USA, 2024; Available online: https://www.ibm.com/reports/data-breach (accessed on 1 July 2026).
- World Economic Forum. Global Risks Report 2024; World Economic Forum: Geneva, Switzerland, 2024; Available online: https://www.weforum.org/reports/global-risks-report-2024 (accessed on 3 July 2026).
- Gomber, P.; Kauffman, R.J.; Parker, C.; Weber, B.W. On the FinTech revolution: Interpreting the forces of innovation, disruption, and transformation in financial services. J. Manag. Inf. Syst. 2018, 35, 220–265. [Google Scholar] [CrossRef] [Scilit]
- Böhme, R.; Christin, N.; Edelman, B.; Moore, T. Bitcoin: Economics, technology, and governance. J. Econ. Perspect. 2017, 29, 213–238. [Google Scholar] [CrossRef] [Scilit]
- Verizon. 2024 Data Breach Investigations Report. Verizon Business. 2024. Available online: https://www.verizon.com/business/resources/reports/dbir (accessed on 1 July 2026).
- Mirsky, Y.; Doitshman, T.; Elovici, Y.; Shabtai, A. Kitsune: An ensemble of autoencoders for online network intrusion detection. In Proceedings of the Network and Distributed System Security Symposium (NDSS), San Diego, CA, USA, 18–21 February 2018. [Google Scholar] [CrossRef] [Scilit]
- Grabowski, A.; Xu, S. Advancing cybersecurity practice: Explainable machine learning for network intrusion detection. J. Cybersecur. Educ. Res. Pract. 2024, 2025, 25. [Google Scholar] [CrossRef] [Scilit]
- Buczak, A.L.; Guven, E. A survey of data mining and machine learning methods for cyber security intrusion detection. IEEE Commun. Surv. Tutor. 2016, 18, 1153–1176. [Google Scholar] [CrossRef] [Scilit]
- Vinayakumar, R.; Alazab, M.; Soman, K.P.; Poornachandran, P.; Al-Nemrat, A.; Venkatraman, S. Deep learning approach for intelligent intrusion detection system. IEEE Access 2019, 7, 41525–41550. [Google Scholar] [CrossRef] [Scilit]
- Wheatley, S.; Hofmann, A.; Sornette, D. Addressing insurance of data breach cyber risks in the catastrophe framework. Geneva Pap. Risk Insur.—Issues Pract. 2021, 46, 53–78. [Google Scholar] [CrossRef] [Scilit]
- COSO. Enterprise Risk Management—Integrating with Strategy and Performance; Committee of Sponsoring Organizations of the Treadway Commission: Coso Junction, CA, USA, 2017. [Google Scholar]
- Crossler, R.E.; Johnston, A.C.; Lowry, P.B.; Hu, Q.; Warkentin, M.; Baskerville, R. Future directions for behavioral information security research. Comput. Secur. 2013, 32, 90–101. [Google Scholar] [CrossRef] [Scilit]
- Xu, M.; Schweitzer, K.M.; Bateman, R.M.; Xu, S. Modeling and Predicting Cyber Hacking Breaches. IEEE Trans. Inf. Forensics Secur. 2018, 13, 2856–2871. [Google Scholar] [CrossRef] [Scilit]
- Yerlan, A.; Zheng, J.; Aziz, D.U.; Raza, M.A. Network intrusion detection using gradient boosting machine learning algorithms. In Proceedings of the 2021 IEEE International Conference on Dependable, Autonomic and Secure Computing, Calgary, AB, Canada, 25–28 October 2021; pp. 1–8. [Google Scholar] [CrossRef] [Scilit]
- Dhillon, G.; Backhouse, J. Information system security management in the new millennium. Commun. ACM 2000, 43, 125–128. [Google Scholar] [CrossRef] [Scilit]
- Herath, T.; Rao, H.R. Encouraging information security behaviors in organizations: Role of penalties, pressures and perceived effectiveness. Decis. Support Syst. 2009, 47, 154–165. [Google Scholar] [CrossRef] [Scilit]
- Cram, W.A.; D’Arcy, J.; Proudfoot, J.G. Seeing the Forest and the Trees: A Meta-Analysis of the Antecedents to Information Security Policy Compliance. MIS Q. 2019, 43, 525–554. [Google Scholar] [CrossRef] [Scilit]
- Goodhue, D.L.; Thompson, R.L. Task-technology fit and individual performance. MIS Q. 1995, 19, 213–236. [Google Scholar] [CrossRef] [Scilit] [PubMed]
- Ali, A.; Abd Razak, S.; Othman, S.H.; Elfadil Eisa, T.A.; Al-Dhaqm, A.; Nasser, M.; Elhassan, T.; Elshafie, H.; Saif, A. Financial fraud detection based on machine learning: A systematic literature review. Appl. Sci. 2022, 12, 9637. [Google Scholar] [CrossRef] [Scilit]
- Verizon RISK Team. VCDB: VERIS Community Database. GitHub. 2025. Available online: https://github.com/vz-risk/VCDB (accessed on 1 July 2026).
- HALOCK Security Labs. Assessing Cyber Risks Using Verizon VCDB and DBIR. 2024. Available online: https://www.halock.com/assessing-cyber-risks-using-verizons-vcdb/ (accessed on 1 July 2026).
- Chen, T.; Guestrin, C. XGBoost: A scalable tree boosting system. In Proceedings of the 22nd ACM SIGKDD International Conference on Knowledge Discovery and Data Mining; Association for Computing Machinery: New York, NY, USA, 2016; pp. 785–794. [Google Scholar] [CrossRef] [Scilit]
- Le, T.T.H.; Oktian, Y.E.; Kim, H. XGBoost for imbalanced multiclass classification-based industrial internet of things intrusion detection systems. Sustainability 2022, 14, 8707. [Google Scholar] [CrossRef] [Scilit]
- Anderson, R.; Barton, C.; Böhme, R.; Clayton, R.; Gañán, C.; Grasso, T.; Levi, M.; Moore, T.; Savage, S.; Vasek, M.; et al. Measuring the changing cost of cybercrime. In Proceedings of the 2019 Workshop on the Economics of Information Security, Boston, MA, USA, 3–4 June 2019. [Google Scholar]
- Arner, D.W.; Barberis, J.; Buckley, R.P. FinTech and RegTech in a nutshell, and the future in a sandbox. Eur. Bus. Organ. Law Rev. 2020, 21, 1–35. [Google Scholar] [CrossRef] [Scilit]

Disclaimer/Publisher’s Note: The statements, opinions and data contained in all publications are solely those of the individual author(s) and contributor(s) and not of MDPI and/or the editor(s). MDPI and/or the editor(s) disclaim responsibility for any injury to people or property resulting from any ideas, methods, instructions or products referred to in the content. |
© 2026 by the authors. Licensee MDPI, Basel, Switzerland. This article is an open access article distributed under the terms and conditions of the Creative Commons Attribution (CC BY) license.