


Abstract
Commercial ductile steel sheet is widely used in engineering applications because of its favorable combination of strength, ductility, machinability, and mechanical versatility. However, its structural integrity is frequently compromised by geometric discontinuities, specifically notches. These stress raisers negatively affect fracture toughness and fatigue strength. The V-notch is particularly prevalent and critical in structural failure analysis. This study presents an experimental, numerical, and machine-learning investigation of the tensile properties of ductile steel sheet, focusing on various V-notch geometries. A systematic experimental study of 36 distinct specimens isolated the effects of geometric variations. Tensile tests were conducted in accordance with ASTM E8 standards to ensure reliability. Experimental results quantified tensile property degradation due to stress concentration, revealing severely compromised ductility in notched specimens. A validated numerical method subsequently captured necking and fracture behavior, reducing the need for expensive destructive experiments. Additionally, experimental data established a predictive framework for untested geometries. Random Forest, LightGBM, CatBoost, and XGBoost ensemble algorithms were employed for training and validation. Engineered features and hyperparameter tuning trained the models to effectively capture the nonlinear stress–strain region. CatBoost and LightGBM (R2 = 0.9917 and 0.9902, respectively) provided the most stable predictive performance. This study establishes a validated baseline for V-notch behavior while demonstrating the effectiveness of data-driven models in minimizing extensive destructive testing.
1. Literature Review
Ductile steel sheet is widely used in structural and engineering applications for its high strength, ductility, and toughness. Stress–strain curves that represent the mechanical properties of ductile steel sheet are crucial for structural analysis. Thus, the development of the stress–strain curve under different conditions for the ductile steel sheet structure is very important. Notch geometry and loading rate greatly affect notch sensitivity and energy dissipation in ductile steel sheets. Studies have established a linear relationship between the logarithm of the strain rate and the yield strength, ultimate strength, and toughness of ductile steel. The energy-dissipation capacity increases with increasing radius and angle in notched specimens [1]. For Q235 steel, the mechanical properties, including yield strength, ultimate strength, elastic modulus, and fracture strain, decrease linearly with increasing corrosion rate [2]. Both the yield and ultimate strengths of Q235, Q355, and Q460 grade steels increase significantly as the testing temperature decreases [3]. In contrast to brittle materials, several studies have focused on ductile metallic materials subjected to uniaxial loading. Wang et al. [4] investigated the effects of notch radius and depth ratio on Q345 high-strength steel through uniaxial tensile tests, concluding that sharper and deeper notches significantly reduce ductility while increasing fracture strength. Correspondingly, Świt et al. [5] examined smooth and V-notched gas pipeline steel and found that smooth specimens failed primarily due to normal stress, whereas V-notched specimens exhibited shear-dominated failure mechanisms. Moreover, Strandberg [6] investigated fracture in AISI O1 tool steel at −50 °C using SENT and three-point bending specimens, showing that the fracture mode strongly depends on notch geometry and that simple point-stress-based criteria remain conservative for brittle fracture. More recently, advanced experimental techniques have been used to capture strain localization in notched specimens. Zhang et al. [7] employed Digital Image Correlation in tensile tests on V-notched 316 L stainless steel and observed severe plastic strain localization at the notch tip, with an approximately 80% increase in strain just before fracture.
Numerical simulations, especially the finite element method (FEM), are widely used to predict the tensile response of notched components. Given the complexities observed in experimental investigations, numerical modeling has become an essential tool for analyzing and predicting tensile fracture behavior. In general, numerical studies employ FEM techniques in two primary ways:
- To capture the full-range material response for a given constitutive law.
- To generate data under numerous hypothetical conditions for machine learning training or inverse parameter calibration.
Accordingly, Zhang et al. [8] performed extensive FEM simulations of notched Ti-6Al-4V specimens to create datasets linking known material parameters to stress–strain responses, where trained artificial neural networks accurately predicted the model parameters. Furthermore, Song et al. [9] implemented the Gurson-Tvergaard-Needleman (GTN) damage model within FE simulations of the small-punch test to generate 457 synthetic load–displacement curves for data-driven property identification. Moreover, FEM-based parameter identification has been combined with optimization techniques to characterize plastic–damage models. However, determining accurate damage-model parameters remains challenging, as it often requires extensive experimental input. In addition, Zhang et al. [7] applied numerical inverse methods, such as the finite-element model updating (FEMU) technique, to central-hole and notched tensile tests to directly identify strain-hardening parameters from Digital Image Correlation data. Nevertheless, FEM simulations involving large deformations and complex geometries remain computationally expensive and sensitive to modeling assumptions. In parallel with constitutive and damage modeling efforts, numerical fracture criteria have been developed and validated using FEM analysis. Ayatollahi et al. [10] proposed and validated the SV-MTS criterion for brittle fracture in sharp V-notches under mixed-mode I/II loading by employing FEM analysis and a newly developed sharp V-notched Brazilian disk (SV-BD) specimen. The results showed very good agreement between theoretical predictions and experimental data for fracture resistance and notch bifurcation angles across all mixed-mode conditions. Similarly, Świt et al. [5] performed combined experimental and numerical analyses of smooth and V-notched gas pipeline steel specimens using ABAQUS, demonstrating that smooth specimens fail primarily under normal stress, whereas V-notched specimens fail through tangential stress and shear-dominated mechanisms.
Machine learning (ML) is a subset of Artificial Intelligence (AI) that focuses on creating computer algorithms that can analyze data and learn from it. Machine learning uses algorithms to detect patterns across many variables and establish connections based on them. Studies have used ML models such as Gaussian Process Regression (GPR), Decision Tree Ensemble (DTE), and Artificial Neural Network (ANN) to predict the fracture load of brittle materials with notches and found that these models are 92%, 89%, and 88% accurate, respectively [11]. Ensemble learning models, such as boosting, stacking, and bagging, performed more accurately in fatigue life prediction than Linear Regression and K-Nearest Neighbors (KNN) [12]. In recent years, structural engineering has increasingly adopted machine learning (ML) techniques to tackle the complexities of modeling tensile behavior and fracture. Data-driven models have been applied to predict stress–strain behavior from experimental or simulated data. Katakareddi et al. [13] evaluated six regression models on molecular dynamics-generated data for Cu-Zr nanowires. It was found that advanced models such as Extreme Gradient Boosting, ANN, and Gradient Boosting achieved R2 scores of 0.96–0.97, whereas simpler models such as AdaBoost, Decision trees, and Random Forests only reached 0.86. Nakarmi et al. [14] used supervised autoencoders to predict full nonlinear stress–strain curves of cellular solids. Autoencoder-based models can reproduce complex, compressed stress–strain behavior and make faster predictions than direct FEM simulation. ML can effectively predict flow stress curves for steels using a purely data-driven approach, without relying on continuum mechanics. Rosiak et al. [15] trained a neural network with two hidden layers on data from 70 steel alloys, incorporating inputs like chemical composition, temperature, and strain rate. Trained a neural network with two hidden layers on data from 70 steel alloys, using inputs such as chemical composition, temperature, and strain rate. The ANN achieved high accuracy, with a mean absolute error of 11.4 Mpa and an R2 of 0.98. Al 6061-T6 was tested by Dorbane et al. [16] at temperatures ranging from 25 to 300 °C, using five-fold cross-validation on the stress–strain data. The neural network achieved an average mean absolute error of only 0.213% and an R2 of 0.998 when predicting full curves. Yacouti et al. [17] showed that deep learning frameworks can successfully capture microstructural effects, achieving 96% accuracy in predicting martensite volume fractions in composites using convolutional and graph network models trained on FEM data.
Despite these advancements, the specific interaction between varied V-notch geometries and the tensile response of ductile steel sheet remains insufficiently characterized. Most existing studies focus on high-strength alloys or limited notch configurations, leaving a significant gap in complete experimental, numerical, and predictive modeling for ductile steel sheet. There is a critical need for a unified framework that can accurately predict the full nonlinear stress–strain region without the computational burden of repeated FE simulations or the high cost of destructive testing.
Research Objectives
This research aims to bridge the gap by creating a framework to characterize notch-induced stress responses in ductile metals. The study’s objectives are:
- Systematically test 36 V-notched steel specimens to isolate the effects of opening angle, notch depth, and tip radius on tensile properties.
- Develop and validate a high-fidelity FEM model in Ansys Explicit Dynamics to capture localized necking and fracture behavior.
- Build a data-driven surrogate model using ensemble machine learning algorithms to generate nonlinear stress–strain curves for untested notch configurations.
- Perform bias-variance analysis to identify the most stable predictive model for optimizing structural integrity assessments.
2. Experimental Setup
2.1. Material
The material used in this experimental investigation was a commercially supplied ductile steel sheet (KY Steel, Chittagong, Bangladesh) with a uniform thickness of 3 mm. Steel sheet was selected because of its widespread use in structural and mechanical engineering applications and its ductile behavior under tensile loading. Before specimen preparation, the sheets were visually inspected to ensure the absence of surface defects, such as cracks, corrosion, or inclusions, that could influence the experimental results. It is important to note that although the material was supplied under a mild-steel designation, the measured tensile properties indicated a higher strength response than conventional annealed mild steel. However, since chemical composition and microstructural characterization were not performed, the material is referred to in this study as a commercial steel sheet rather than being assigned a specific steel grade. Moving from material characterization to the broader purpose of the research, the objective of the study was not limited to identifying the mechanical properties of the tested material, but also to establish an integrated experimental–finite element–machine learning framework for predicting the notch-dependent tensile response of steel sheets. Therefore, the measured material response was used as the experimental basis for developing and validating the proposed Experimental–FE–ML framework.
2.2. Specimen Geometry
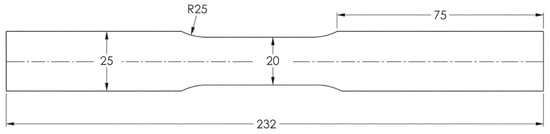
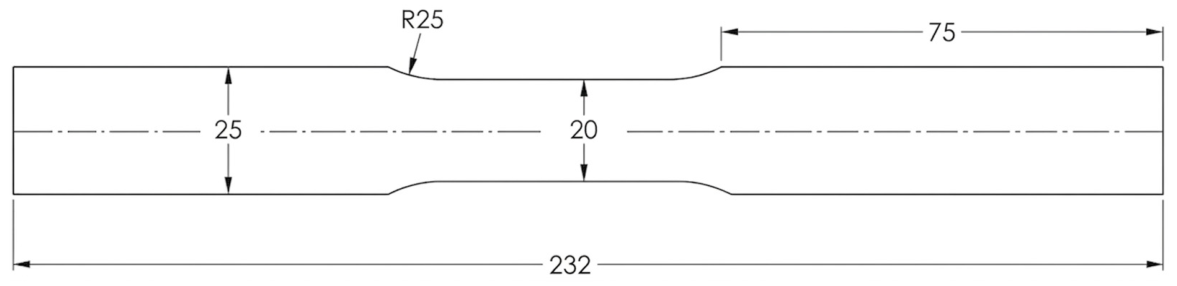
The tensile specimens were designed in accordance with ASTM E8 for metallic materials to ensure consistency, repeatability, and comparability with the existing literature. Each specimen had a standard dog-bone geometry with overall dimensions of 231.79 mm (length) × 20 mm (width) × 3 mm (thickness), illustrated in Figure 1. All dimensional parameters were carefully verified using a digital Vernier caliper before testing to confirm adherence to design tolerances.
Figure 1.
Dimensions of ASTM E8 tensile specimen.
2.3. Notch Geometry Design
A V-shaped notch was introduced at the center of the gauge section of each specimen to investigate the influence of geometric discontinuities on tensile behavior. Three notch geometry parameters were considered: notch opening angle (θ), notch depth (d), and notch tip radius (r). Based on these parameters, the specimens were divided into two distinct categories: sharp V-notches and blunt V-notches.
2.3.1. Sharp V-Notched Specimens
Sharp V-notched specimens were defined by notch depth (d) and notch opening angle (θ), with an effectively zero tip radius. Three notch depths of 2 mm, 3.5 mm, and 5 mm were combined with three notch opening angles of 30°, 60°, and 90°, resulting in nine unique sharp V-notch configurations. Table 1 represents all nine unique configurations of a sharp V-notch.
Table 1.
Variation in sharp V-notches.
2.3.2. Blunt V-Notched Specimens
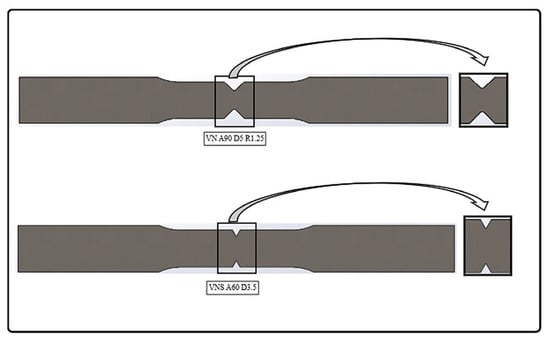
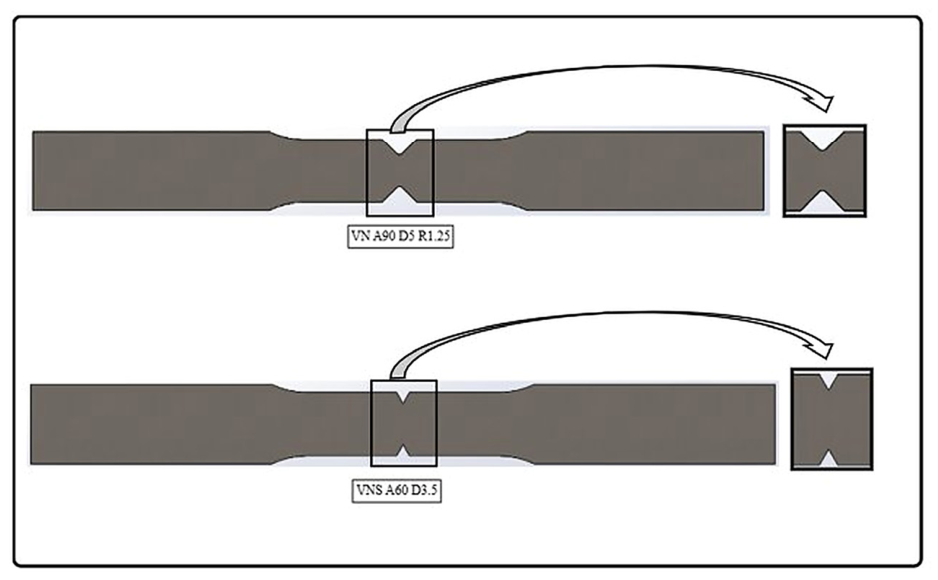
Blunt V-notched specimens were designed to reflect practical manufacturing conditions where the notch root is not ideally sharp. In addition to notch depth and notch angle, a finite notch tip radius (r) was introduced. Three notch depths (2 mm, 3.5 mm, and 5 mm) were combined with three notch angles (30°, 60°, and 90°) and three notch tip radii (0.75 mm, 1.25 mm, and 1.75 mm). This resulted in 27 unique blunt V-notch configurations. Table 2 shows all 27 unique blunt V-notch configurations. Figure 2 represents notches in the tensile specimen.
Table 2.
Variation in V-Blunt notches.
Figure 2.
Geometry of tensile specimens with various notch configurations.
2.4. Tensile Test Setup and Loading Conditions
Uniaxial tensile tests were performed using a servo-hydraulic universal testing machine (WANCE HUT A1602, Shenzhen WANCE Testing Machine Co., Ltd., Shenzhen, China) with a maximum load capacity of 100 kN. All experiments were conducted at room temperature (25 ± 2 °C). The tests were carried out under displacement-controlled loading, with a constant crosshead speed of 1 mm/min. This loading rate corresponds to a nominal strain rate of approximately 3.33 × 10⁻⁴ s−1, ensuring quasi-static loading conditions suitable for observing elastic-plastic deformation behavior. Specimens were mounted using servo-hydraulic wedge-action grips, which provided uniform clamping pressure and prevented slippage or end crushing. During installation, precise alignment was ensured so that the specimen’s longitudinal axis coincided with the loading axis of the testing machine. This minimized bending stresses and secondary loading effects.
During each tensile test, the applied load (F) and displacement (ΔL) were continuously recorded using the machine’s high-accuracy load cell (Class 1/0.5) and motion transducer. Data were acquired at a sampling frequency of 10 Hz, providing sufficient resolution to capture elastic, yielding, strain-hardening, and fracture stages. For each notch configuration, three specimens were tested (Test 1, Test 2, and Test 3) to ensure repeatability. The average response from the three tests was used as the representative dataset for subsequent analysis. Please note that, across all configurations, the three repeat tests closely agreed, with negligible variation. The average curve was thus highly representative.
2.5. Notch Sensitivity Ratio
Notches introduce geometric discontinuities, causing localized stress concentrations that govern tensile strength and fracture behavior. By representing the minimum cross-sectional area and experiencing peak local stress, notches prescribe the fracture location at the root and promote early failure.
To characterize sensitivity to notch-induced stress concentration, the notch sensitivity ratio (NSR) is defined as the ratio of notched to smooth specimen tensile strengths, shown in Equation (1):
where and denote the tensile strengths of the notched and smooth (unnotched) specimens, respectively. NSR provides a dimensionless, normalized measure of notching effects. Physically, NSR > 1 indicates that plastic deformation at the notch expands to redistribute stress, reflecting reduced notch sensitivity and lower embrittlement tendency. Conversely, an NSR < 1 indicates premature fracture before significant plastic propagation, revealing high notch sensitivity. A smaller NSR signifies a stronger dominance of stress concentration on fracture behavior [18].
2.6. Machine Compliance Correction
During the uniaxial tensile tests utilizing the WANCE HUT A1602 testing machine, the recorded total displacement ) inherently included both the true elongation of the specimen ) and the elastic deformation of the testing machine’s frame, load cell, and grips. To ensure high fidelity in subsequent finite element and machine learning models, a machine compliance correction procedure [19] was applied to extract the isolated specimen deformation. The correction factor relies on evaluating the linear-elastic region of the raw force-displacement data to determine the apparent total compliance of the system (). The theoretical compliance of the specimen () was calculated using the original gauge length, cross-sectional area, and the material’s established Young’s modulus of 212.08 Gpa. The machine correction factor, , representing the stiffness of the testing apparatus, was determined by subtracting the specimen compliance from the total apparent compliance, as expressed in Equation (2):
Once established, this correction factor was systematically applied to the raw displacement data at every recorded data point. The true change in length of the specimen was obtained by deducting the product of the instantaneous applied load and the correction factor from the total recorded displacement, as shown in Equation (3):
This mathematical removal of the machine’s external deformation ensured that the resulting engineering and true stress–strain curves accurately reflected the intrinsic elastoplastic behavior and localized necking phenomena of the V-notched ductile steel sheet specimens, entirely free from equipment-induced compliance artifacts.
3. Numerical Setup
3.1. Finite Element Framework and Solver Selection
Tensile behavior was simulated using the Explicit Dynamics framework in ANSYS Workbench (Version 2022 R1). The explicit solver effectively handles the strong nonlinearities of elastoplastic deformation, large strains, and severe stress concentrations at the notch root, thereby avoiding the convergence issues common to implicit schemes. To simulate quasi-static tensile testing, displacement was applied gradually over a long simulation time, thereby minimizing inertial effects and stress waves (as verified by the negligible kinetic energy relative to internal energy). This ensures a stable, reliable simulation of the full elastoplastic response and strain localization.
3.2. Material Model
The material was modeled as isotropic and homogeneous. Linear elastic behavior was defined using a Young’s modulus of 212.08 Gpa and a Poisson’s ratio of 0.3. Density was included to correctly compute inertial terms and stable time increments. Plastic behavior was defined using a true stress-equivalent plastic strain formulation to accommodate finite-deformation elastoplastic theory. Because significant strain localization occurs at the notch, true stress accurately represents the large-deformation response. Defining hardening strictly as a function of plastic strain prevents double-counting of elastic deformation and ensures stable stress integration. To accurately represent the post-yield response, an isotropic hardening elastoplastic formulation was employed using tabulated true stress versus equivalent plastic strain data. Experimental engineering stress–strain data were converted to true values, the elastic strain component was subtracted, and the resulting dataset was input into the solver to accurately capture nonlinear hardening and progressive plastic strain accumulation.
3.3. Finite Element Discretization and Mesh Refinement Strategy
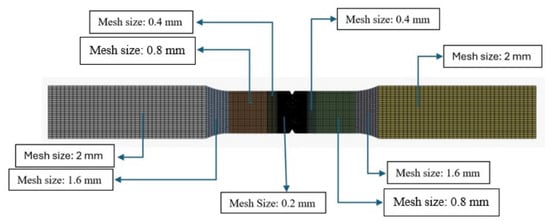
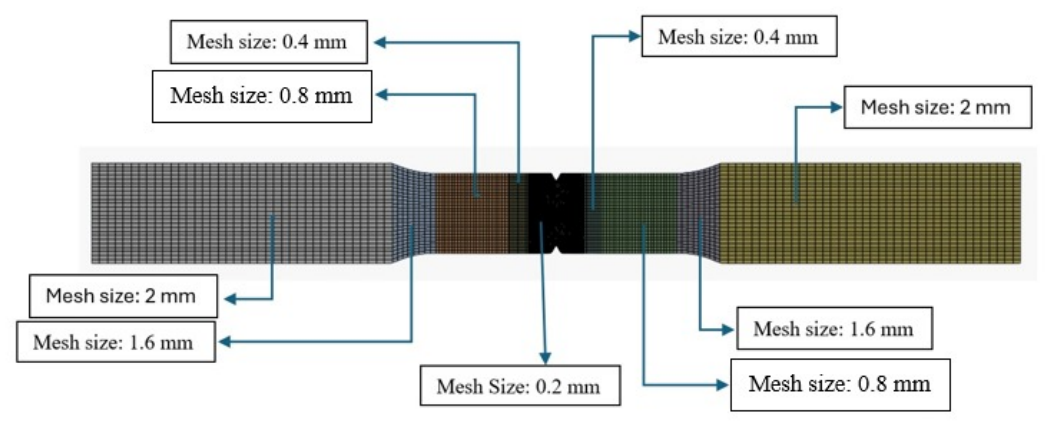
Full 3D solid elements were utilized for all models, as shown in Figure 3. To determine the appropriate mesh density, an initial convergence study was performed on the unnotched specimen, identifying 0.2 mm as the optimal minimum element size to capture bulk deformation. When modeling the notched specimens, we initially attempted to refine the mesh to below 0.2 mm to perfectly contour the smallest tip radii (0.75 mm). However, this proved computationally unfeasible within the Explicit Dynamics framework. Due to the Courant-Friedrichs-Lewy (CFL) condition, further refinement led to the stable time increment dropping so severely that the simulations could not complete. Maintaining the 0.2 mm limit allowed the models to run successfully without requiring severe artificial mass scaling, thereby preserving the test’s true quasi-static physics while still providing the necessary macroscopic stress–strain accuracy for the machine learning dataset.
Figure 3.
Mesh of the notched tensile specimen with localized refinement at the notch.
3.4. Boundary Conditions and Loading Protocol
To replicate experimental conditions, one end of the specimen was constrained axially, with minimal lateral constraints applied only to ensure numerical stability without artificially suppressing natural Poisson contraction.
Tensile loading was applied at the free end via a prescribed displacement-controlled boundary condition along the longitudinal +X-axis. Displacement control maintains numerical stability during post-yield plastic softening and strain localization. This gradual loading strategy suppresses artificial stress waves and ensures quasi-static deformation throughout the explicit simulation. Figure 4 shows the boundary condition.
Figure 4.
Boundary condition (A) displacement and (B) fixed support.
4. Machine Learning Algorithms and Modeling
4.1. Data Preprocessing and Feature Engineering
The dataset employed in this study was constructed using experimentally obtained tensile test data from 36 V-notched ductile steel sheet specimens. Each specimen was assigned a unique specimen ID to maintain traceability and consistency throughout data processing, feature engineering, and model development. The dataset is organized in a structured tabular format, where each row corresponds to an individual data point and each column represents a specific geometric or mechanical variable. Since the objective of this research is to evaluate the influence of V-notch geometry on tensile behavior, the notch configuration was parameterized using three fundamental geometric descriptors: notch opening angle, notch depth, and notch tip radius. These parameters are widely recognized in fracture mechanics and notch sensitivity studies as the primary factors governing stress concentration, plastic zone development, and crack initiation behavior in notched components [20]. To construct a comprehensive dataset suitable for machine learning analysis, tensile response data obtained from all specimens were combined into a single consolidated dataset by stacking the individual specimen data. This process resulted in a dataset comprising approximately 18,000 rows and five columns, as shown in Table 3.
Table 3.
Dataset used in machine learning modeling.
To ensure that model performance reflects genuine predictive capability, the dataset was partitioned at the specimen level (grouped by Specimen_ID) rather than at the individual data-point level. When a specimen was assigned to the test set, all its data points were withheld as a block. This ensured no portion of a test specimen’s curve was present during training. An 80:20 split was applied at this specimen level. Four configurations—VN A60 D3.5 R1.25, VN A90 D5 R1.75, VNS A60 D2, and VNS A90 D5—were reserved entirely for testing. The stress–strain curves predicted for these four held-out specimens are further discussed in Section 5.4.
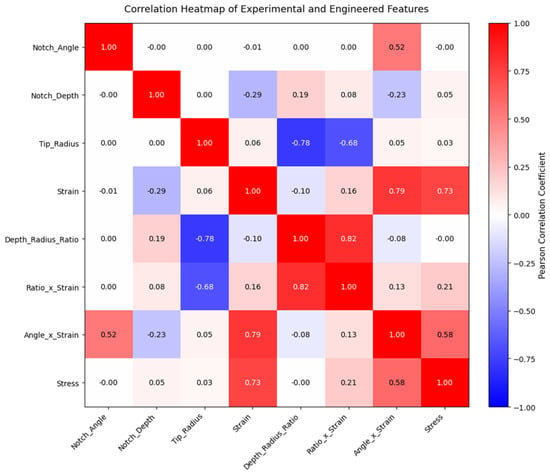
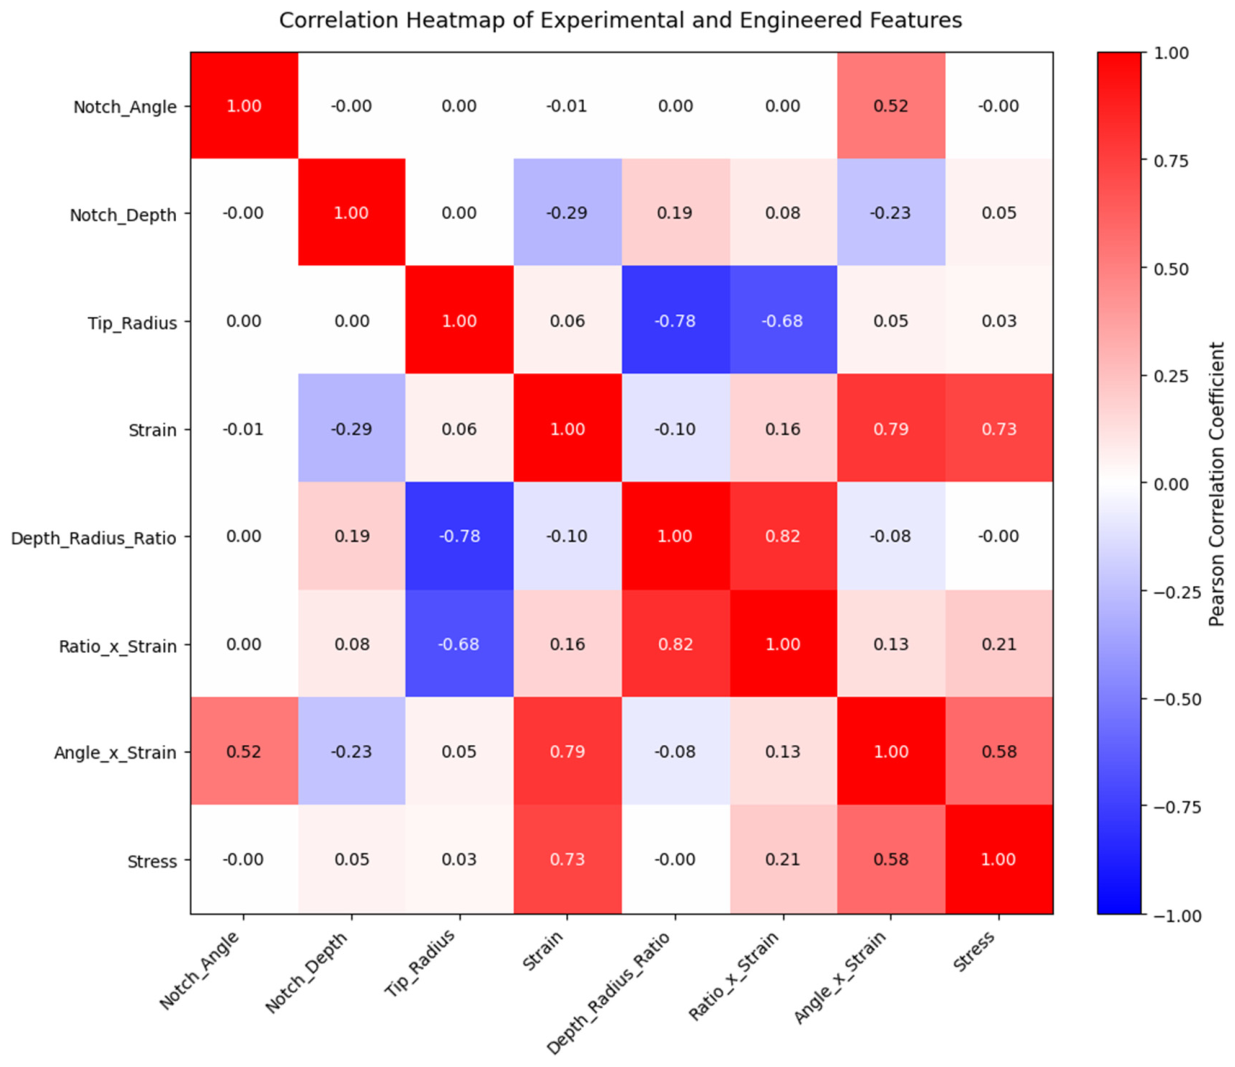
In the present study, feature engineering was applied to better capture the geometric-mechanical interactions governing the tensile behavior of V-notched ductile steel sheet specimens. Feature engineering utilized four foundational variables named Notch_Angle, Notch_Depth, Tip_Radius, and Strain to model the geometric-mechanical interactions governing the V-notched ductile steel sheet’s tensile behavior. A correlation heatmap mapped linear dependencies between these parameters and tensile response, offering data-driven insights into geometric-deformation interactions to guide the design of physically meaningful features [21]. Consequently, three features were engineered: Depth_Radius_Ratio captures combined stress concentration severity, while Ratio_×_Strain and Angle_×_Strain embed critical, nonlinear deformation-dependent geometric effects. Combining experimental and engineered features provides an interpretable dataset that enhances the machine learning of complex V-notch relationships while remaining consistent with materials deformation principles.
Figure 5 presents the correlation heatmap linking experimental features, engineered interactions, and tensile stress. While Strain predictably exhibits a strong positive correlation with Stress (0.73), individual geometric parameters show weak, independent correlations, indicating they inadequately capture the tensile response alone. Combined features reveal clearer trends: Angle_×_Strain (0.58) and Ratio_×_Strain (0.21) demonstrate significant coupled geometric-strain effects on stress, while Depth_Radius_Ratio strongly negatively correlates (−0.78) with tip radius, confirming its effectiveness in representing notch sharpness. Ultimately, the heatmap demonstrates that strain-geometry interactions govern tensile behavior far better than isolated parameters do, validating the use of these engineered features for capturing nonlinear mechanics.
Figure 5.
Correlation heatmap illustrating the relationships between the output variable (stress) and the experimental and engineered input features used for machine learning modeling.
4.2. Model Selection and Rationale
ML models were employed to reduce reliance on costly, time-consuming experimental testing and finite element analyses. By learning relationships between notch geometry and stress response from limited data, these models enable rapid, reliable predictions. This work utilizes ensemble learning, which integrates multiple learners to improve predictive performance, robustness, and generalization. Prominent ensemble frameworks include bagging (e.g., Random Forest) and boosting (e.g., XGBoost, LightGBM, CatBoost) [22].
- (a)
- XGBoost
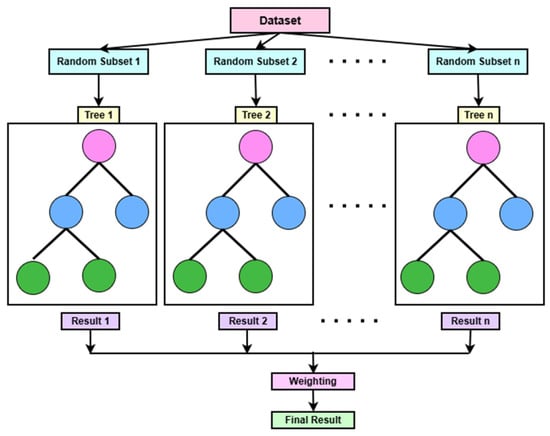
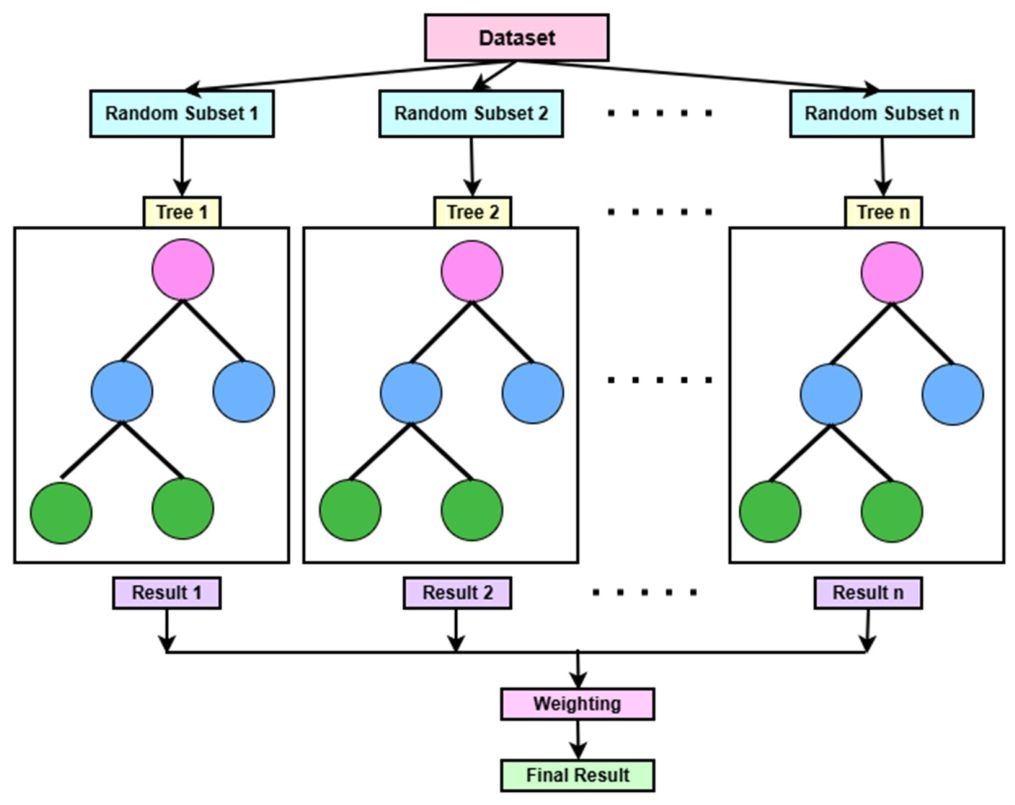
Extreme Gradient Boosting (XGBoost) scales gradient tree boosting by sequentially constructing models to correct prior pseudo-residuals [23]. Algorithmically, it reduces overfitting via regularized learning objectives with L1 and L2 penalties. Additionally, its sparsity-aware split-finding handles missing data efficiently, while system-level optimizations like cache-aware access and out-of-core computation ensure fast, highly accurate, and scalable performance [24]. Figure 6 demonstrates how XGBoost models work.
Figure 6.
Algorithm of XGBoost.
- (b)
- Random Forests
Random Forest is an ensemble method utilizing a collection of decision trees [25]. It introduces randomness by training each tree on a bootstrap sample of the dataset and determining node splits using random feature subsets. For regression, final predictions average the trees’ outputs. This random feature selection reduces inter-tree correlation while preserving individual tree strength, preventing overfitting, and making it robust for nonlinear regression.
- (c)
- LightGBM
LightGBM addresses conventional Gradient Boosting Decision Trees (GBDTs) scalability limitations via two techniques: Gradient-based One-Side Sampling (GOSS) and Exclusive Feature Bundling (EFB). GOSS prioritizes instances with larger gradients (by amplifying sampled small-gradient instances to preserve data distribution) to reduce computational cost. EFB bundles mutually exclusive features into single representations using a greedy algorithm. Together, these methods drastically reduce computational complexity and accelerate training without sacrificing accuracy [26].
- (d)
- CatBoost
CatBoost mitigates target leakage and prediction shift through “ordered boosting,” a permutation-based strategy computing residuals using only previously observed data. It also utilizes ordered target statistics for incremental feature processing and oblivious (symmetric) decision trees to enforce identical splitting conditions at uniform depths. These advancements eliminate target leakage, improve training stability, reduce overfitting, and make CatBoost highly effective for small-to-medium experimental datasets requiring strict bias control [27].
4.3. Hyperparameter Tuning and Optimization
Machine learning performance relies on both data-learned model parameters and externally configured hyperparameters that dictate model complexity and optimization [28]. Because hyperparameters are not updated during training, an improper predefined selection risks underfitting, overfitting, or instability. Identifying optimal configurations termed hyperparameter tuning [29] is essential for ensemble models, where variables like tree depth and learning rate govern the bias-variance trade-off and generalization, particularly for limited experimental datasets. Among optimization strategies, Randomized Search efficiently explores high-dimensional spaces by sampling from predefined distributions rather than exhaustive testing, evaluating broader configurations with significantly lower computational cost than Grid Search [30]. Randomized Search was applied uniformly across Random Forest, XGBoost, LightGBM, and CatBoost to ensure fair comparison. For each model, 500 configurations (n_iter = 500) were evaluated via 5-fold cross-validation (cv = 5), minimizing negative Root Mean Squared Error (neg_root_mean_squared_error). Parallel processing (n_jobs = −1), a fixed random state (random_state = 42), and progress monitoring (verbose = 1) ensured computational efficiency and reproducibility. These optimized sets trained the final models, with selected hyperparameters and search ranges summarized in Table 4. This standardized tuning ensures near-optimal operation and a reliable performance comparison across all ensemble techniques.
Table 4.
Hyperparameter tuning ranges for each machine learning model used in this study.
5. Results
5.1. Experimental Results
5.1.1. Base Material Tensile Behavior
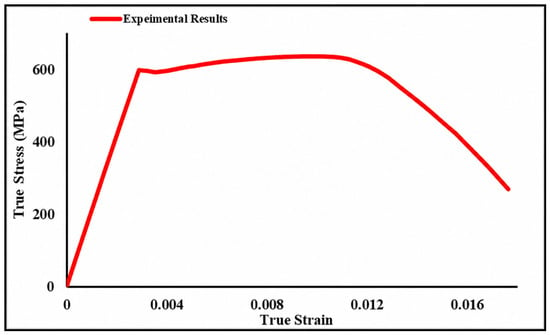
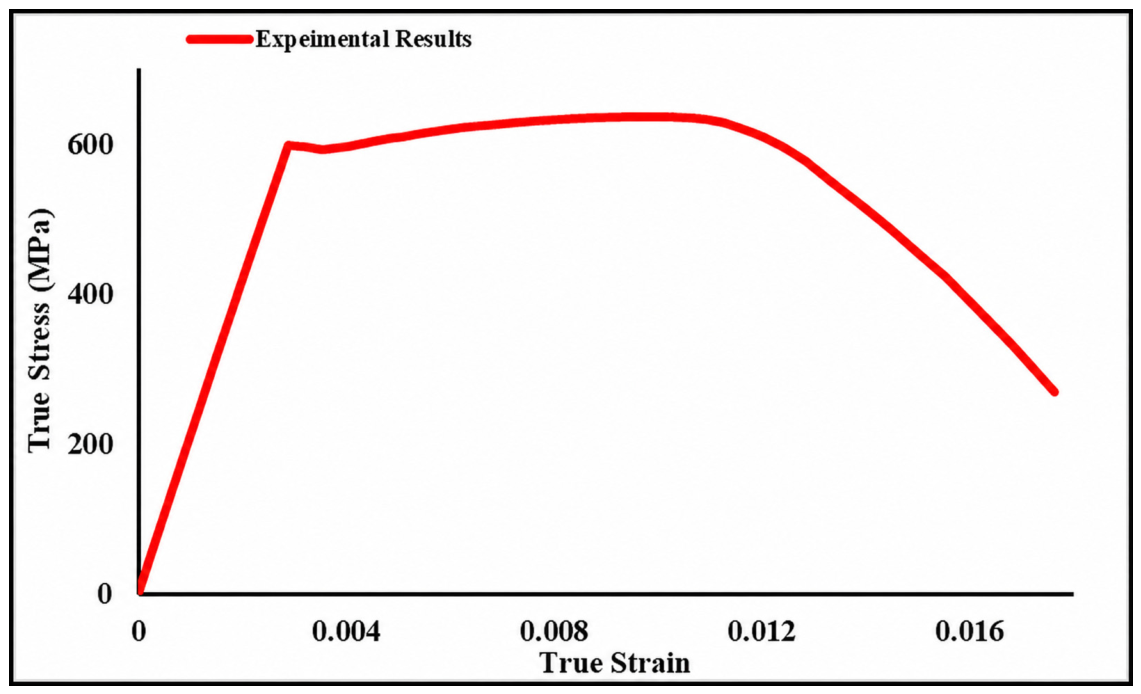
Uniaxial tensile tests on unnotched specimens established a reference baseline for the base material’s intrinsic mechanical behavior. The true stress–strain response and corresponding mechanical properties are presented in Figure 7 and Table 5, respectively. Figure 7 illustrates well-defined elastic-plastic deformation. Initial linear elastic deformation is governed by a 212.08 Gpa elastic modulus, with yielding initiating at 599 Mpa. Post-yielding, the material exhibits stable plastic deformation with limited strain hardening, reaching an ultimate tensile stress of 637.1 Mpa. The specimen fractures at approximately 0.017 strain, indicating moderate ductility.
Figure 7.
True stress vs. true strain curve of an unnotched tensile specimen.
Table 5.
Base materials properties.
The absence of geometric discontinuities allows uniform stress redistribution along the gauge length, delaying damage initiation and enabling higher strength and ductility than notched configurations. Fracture following distinct plastic deformation indicates a predominantly ductile failure mechanism. The mechanical properties in Table 5 serve as reference values for evaluating notch-induced strength reduction, ductility loss, and notch sensitivity in subsequent sections.
5.1.2. Stress–Strain Response of Notched Specimens
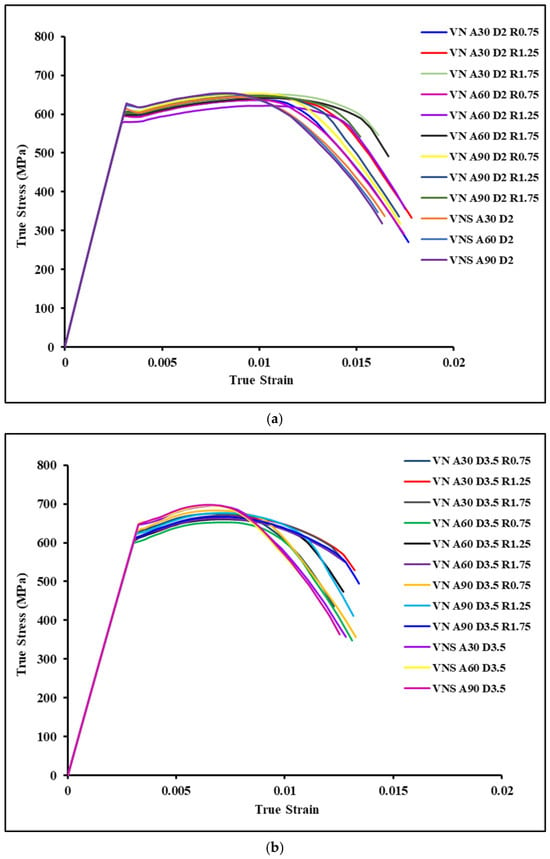
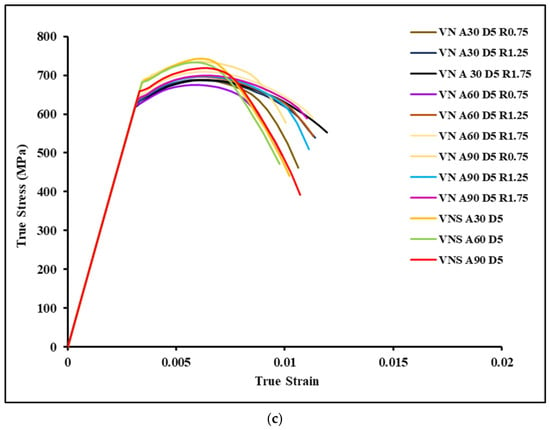
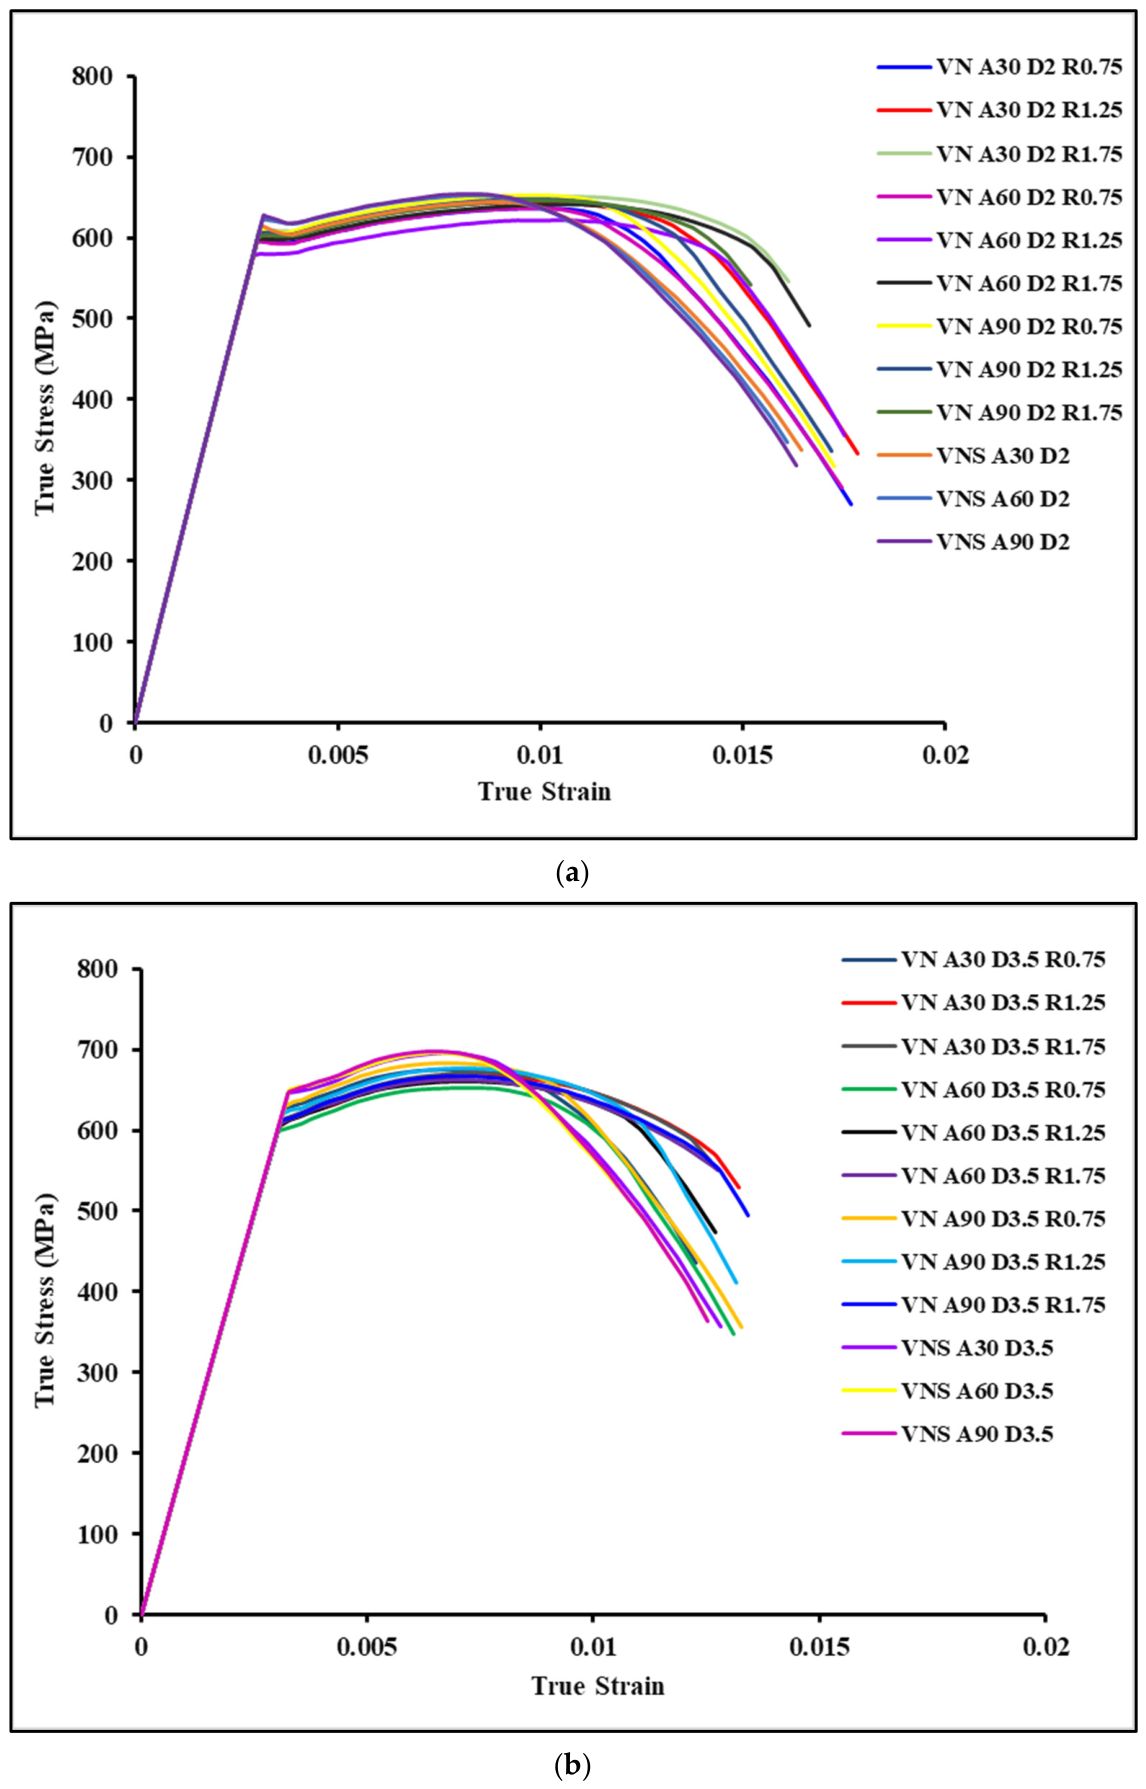
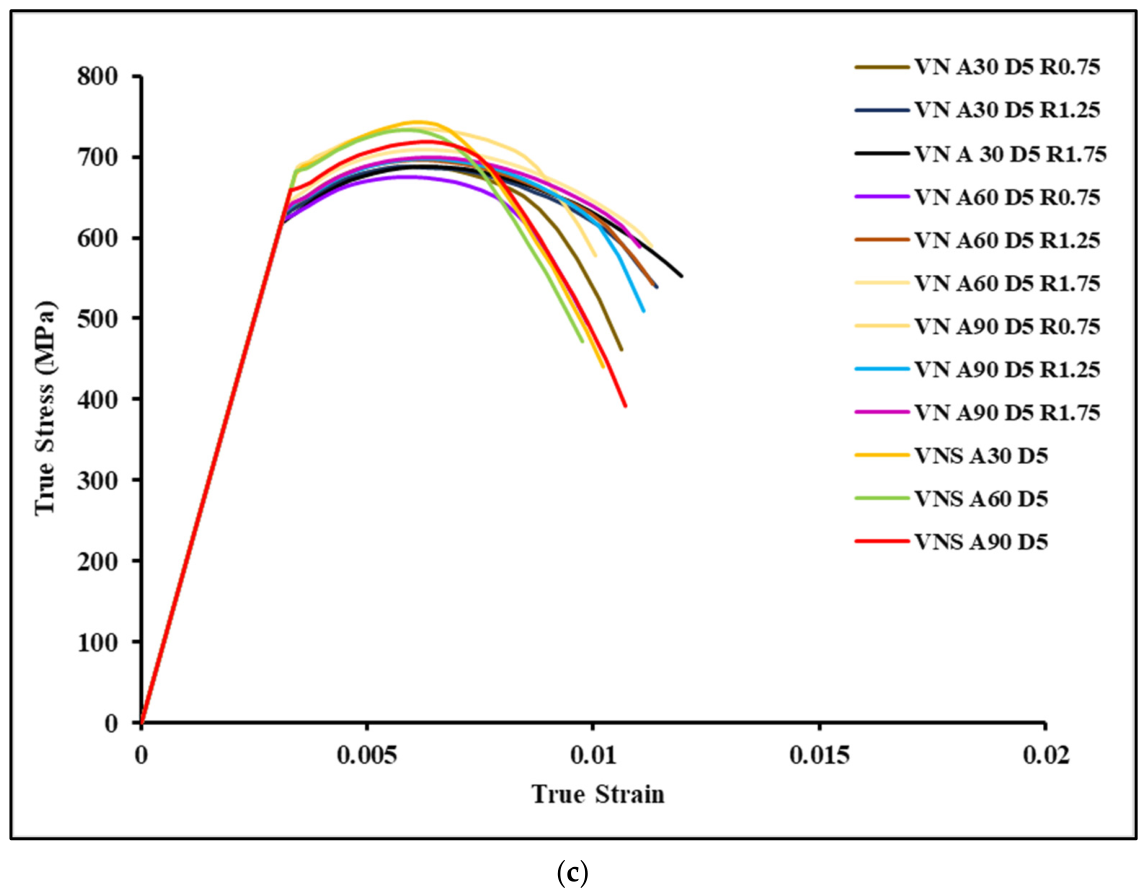
A one-variable-at-a-time approach isolated the individual influences of notch opening angle, depth, and tip radius on tensile behavior. The stress–strain responses of all 36 V-notched specimens are grouped by notch depth (12 specimens per depth). As shown in Figure 8a, specimens with a 2 mm depth exhibit an identical elastic slope (consistent Young’s modulus), with geometry dictating variations in ultimate tensile strength and fracture strain. The maximum fracture strain reaches 0.023, indicating relatively high ductility. For the 3.5 mm depth (Figure 8b), specimens similarly demonstrate identical elastic stiffness but noticeable differences in ultimate tensile strength. The maximum fracture strain decreases to 0.018, reflecting increased stress concentration and reduced deformation capacity. For the 5 mm depth (Figure 8c), Young’s modulus remains unchanged, but the maximum fracture strain drops further to 0.015. This indicates severe stress localization and an increased tendency toward premature fracture with deeper notches.
Figure 8.
True stress-true strain curve of V notched specimen with (a) depth 2 mm; (b) depth 3.5 mm; and (c) depth 5 mm.
5.1.3. Effect of Notch Opening Angle, Notch Depth, and Tip Radius
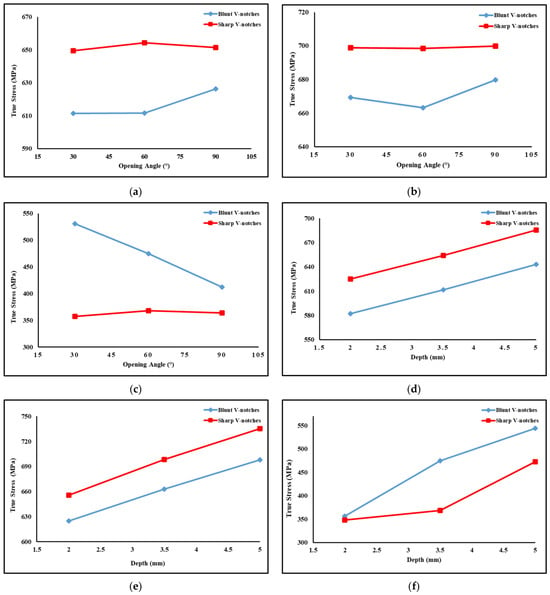
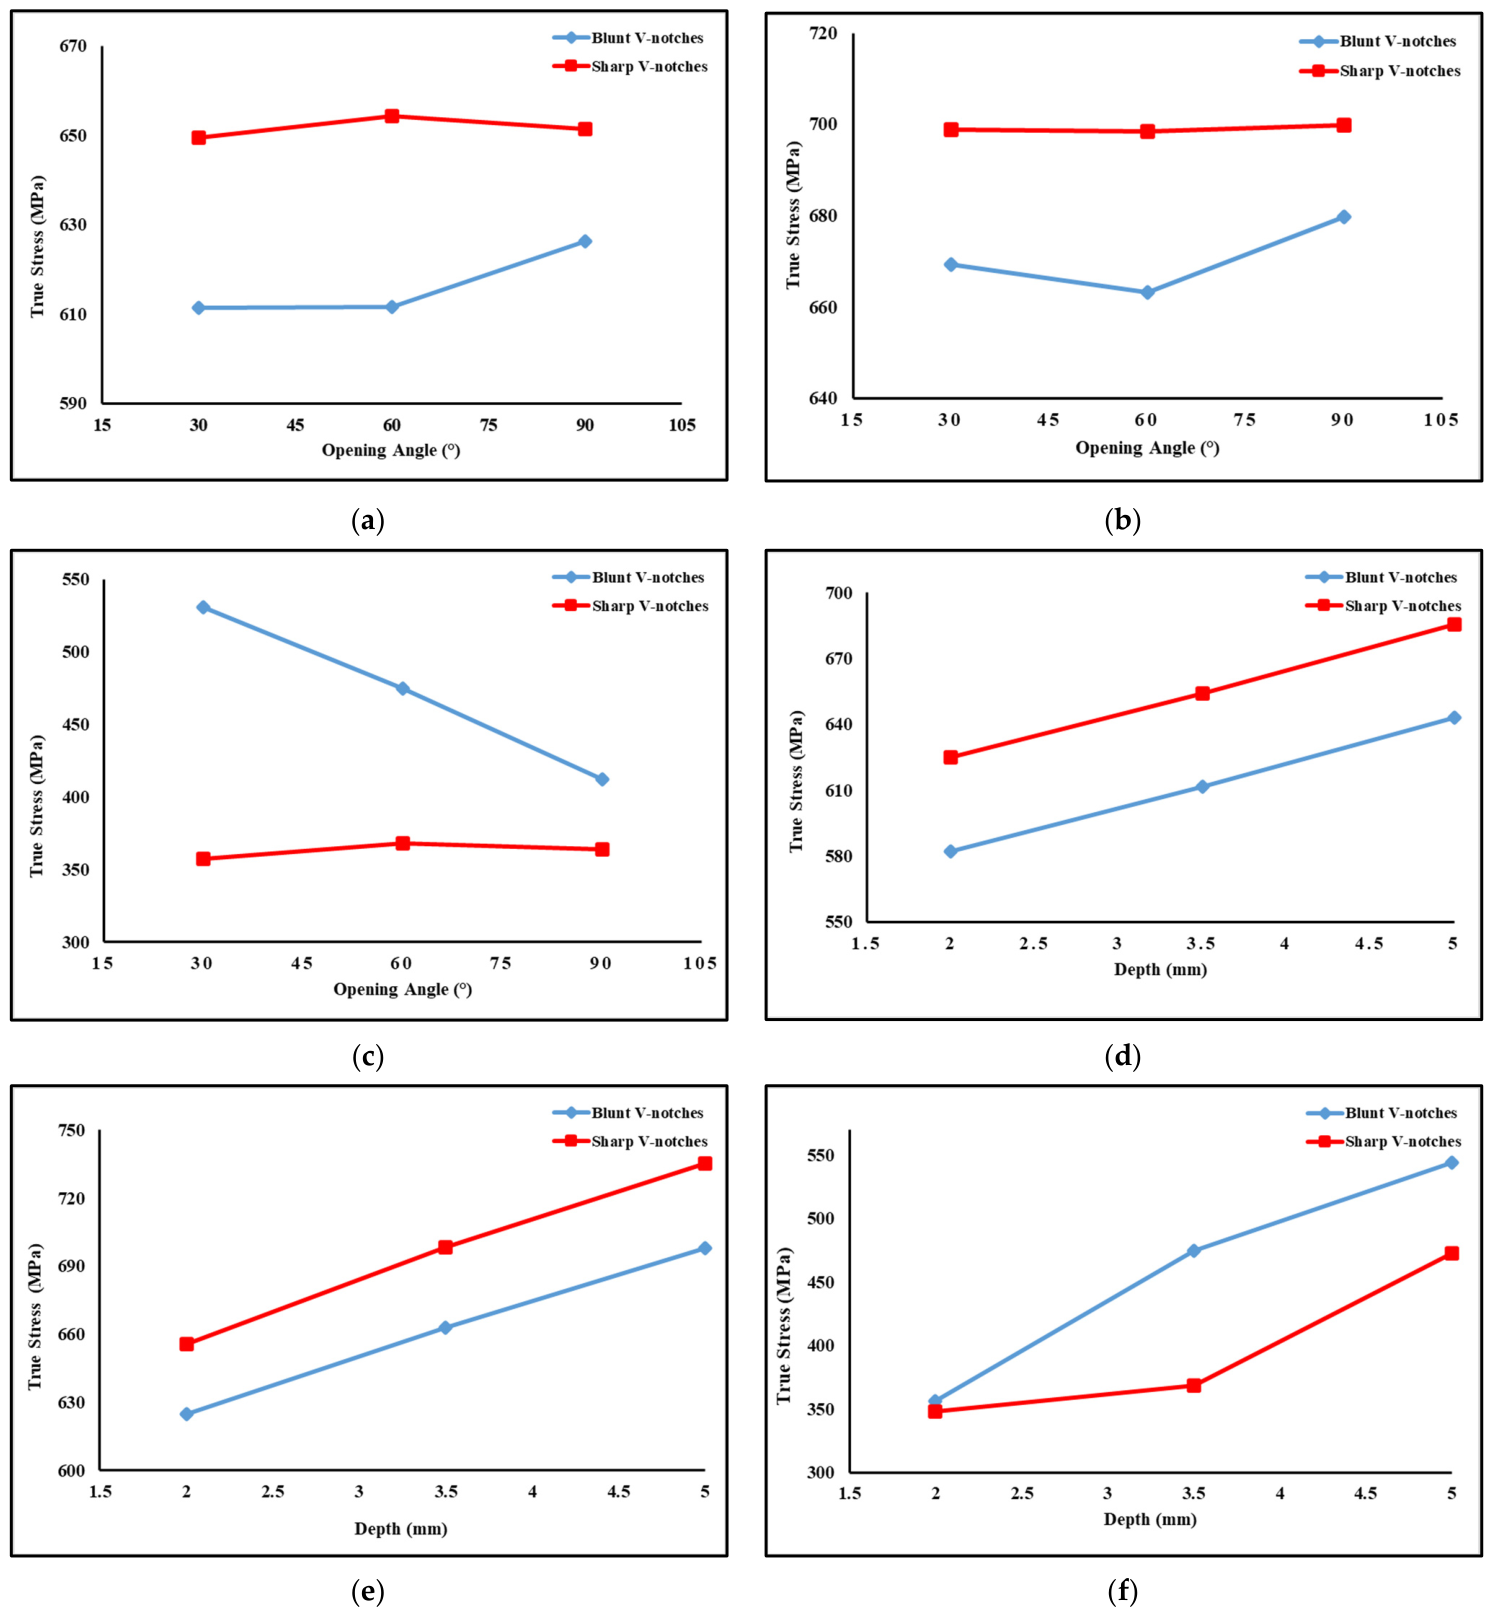
The influence of V-notch opening angle (30–90°) was isolated using a fixed depth (3.5 mm) and tip radius (1.25 mm). Figure 9a,b shows yield stress, and UTS exhibit minimal variation, indicating that the angle negligibly influences peak load capacity. Conversely, fracture stress decreases markedly as the angle widens (Figure 9c). Narrower angles localize stress to delay fracture, whereas wider angles distribute deformation, causing earlier failure. The effect of notch depth (2–5 mm) was isolated using a fixed 60° angle and 1.25 mm radius. Yield stress (Figure 9d) and UTS (Figure 9e) increase consistently with depth due to the reduced load-bearing cross-section. Fracture stress also increases with depth (Figure 9f), reflecting stronger geometric constraints that limit plastic deformation rather than improved material strength. Ultimately, notch depth directly controls localized stress and deformation restrictions; deeper notches produce higher nominal stresses but promote localized deformation and earlier fracture.
Figure 9.
Comparison of (a) yield stress and opening angle; (b) ultimate tensile stress and opening angle; (c) fracture stress and opening angle; (d) yield stress and depth; (e) ultimate tensile stress and depth; and (f) fracture stress and depth.
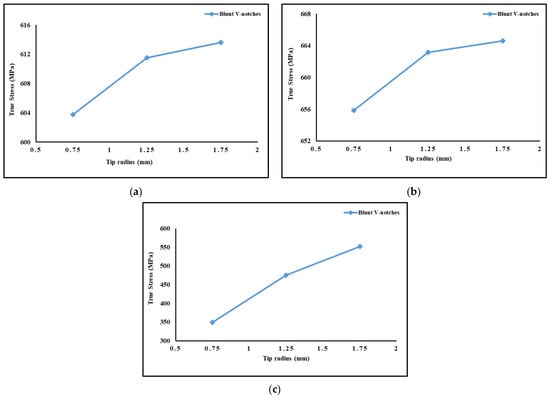
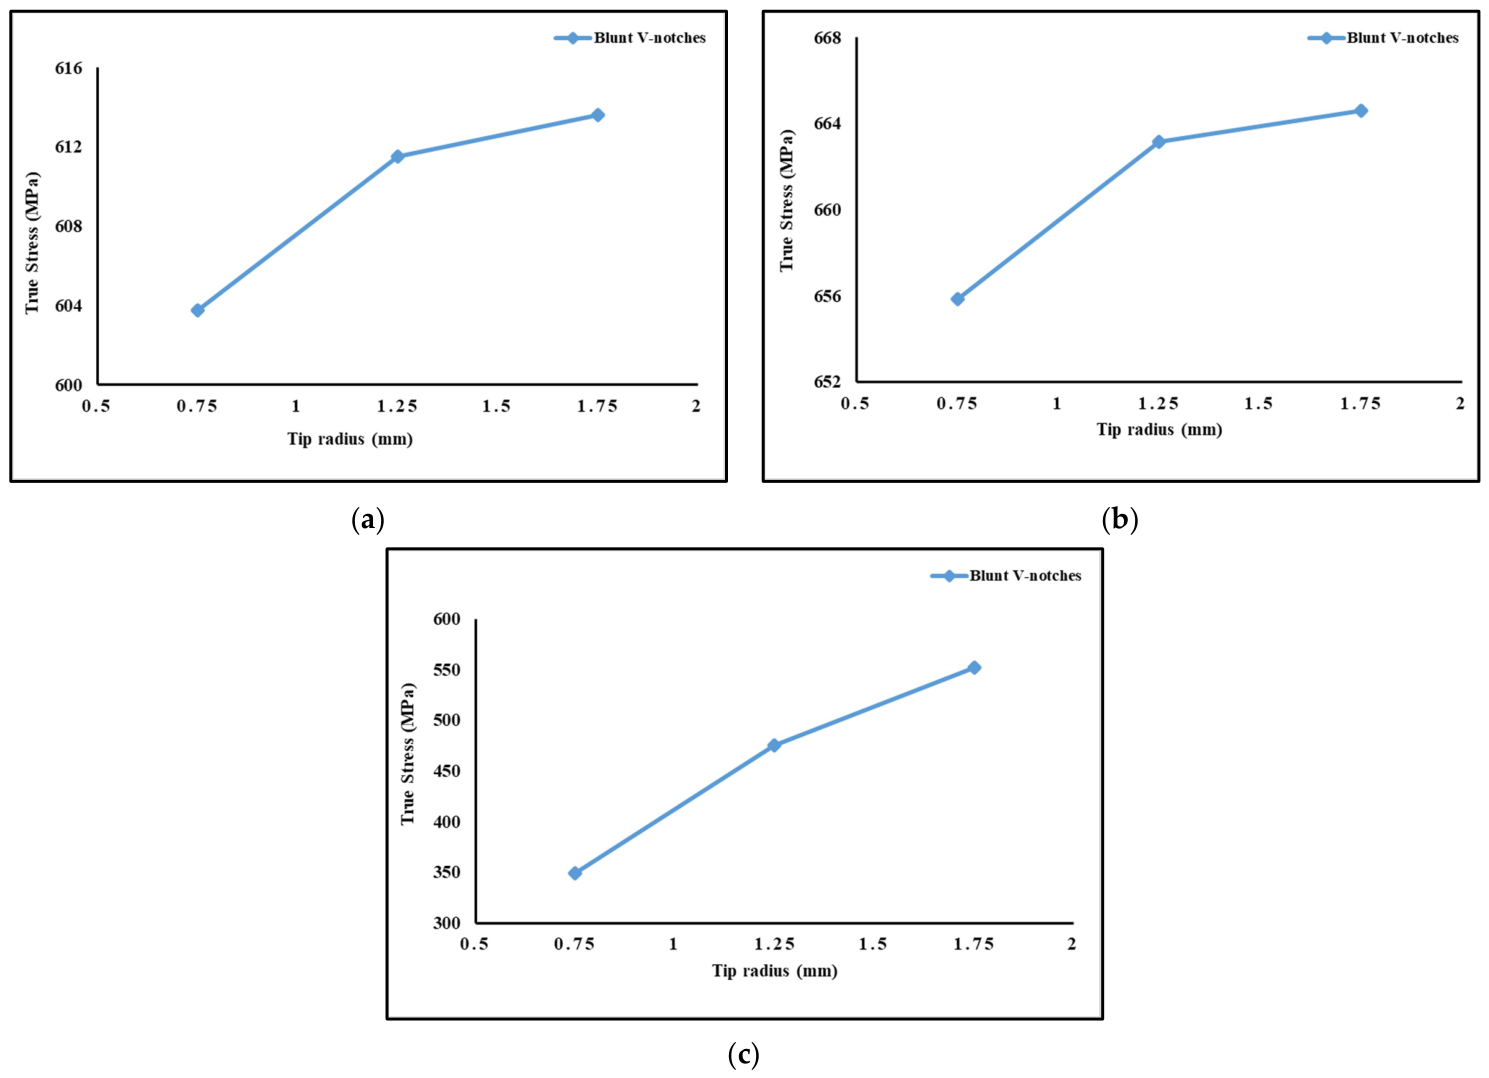
The influence of notch tip radius (0–1.75 mm) was isolated using a fixed 60° angle and 3.5 mm depth to directly assess stress concentration severity. Results are presented in Figure 10a–c. As shown in Figure 10a,b, yield stress and UTS increase as tip radius decreases, confirming that sharper notches intensify local stress concentration and elevate nominal strength measures. In contrast, fracture stress shows the opposite trend (Figure 10c). Sharp notches (0 mm radius) fail prematurely at significantly lower stresses with limited plasticity. As the tip radius increases, fracture stress rises markedly, as blunt notches spread plastic deformation and sustain higher loads prior to fracture. Overall, tip radius exerts the strongest influence on fracture behavior. Sharper notches increase yield and ultimate stress but substantially reduce fracture resistance, promoting brittle-like failure. Conversely, larger radii mitigate stress concentration and enhance toughness. The experimental results demonstrate that notch geometry significantly influences tensile behavior via stress concentration and deformation constraints. Notch opening angle minimally impacts yield stress and UTS, but strongly affects fracture stress, with wider angles reducing post-yield load capacity. Notch depth strongly increases yield, UTS, and fracture stress due to a reduced cross-sectional area, though deeper notches significantly restrict plastic deformation and ductility. Notch tip radius has the strongest influence on fracture behavior. Sharper notches increase yield/UTS but drastically reduce fracture stress and ductility, while larger radii promote distributed plasticity and higher fracture stress. Overall, notched specimens consistently exhibit reduced ductility compared to smooth specimens, with sharper and deeper notches promoting earlier fracture, providing a clear foundation for subsequent numerical and machine-learning analyses.
Figure 10.
Comparisons of (a) yield stress and tip radius; (b) ultimate tensile stress and tip radius; and (c) fracture stress and tip radius.
5.1.4. Notch Sensitivity Analysis
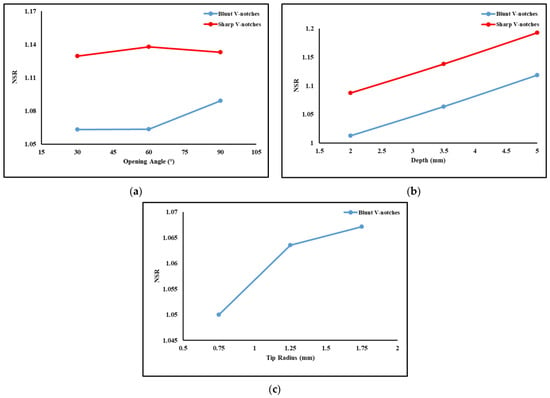
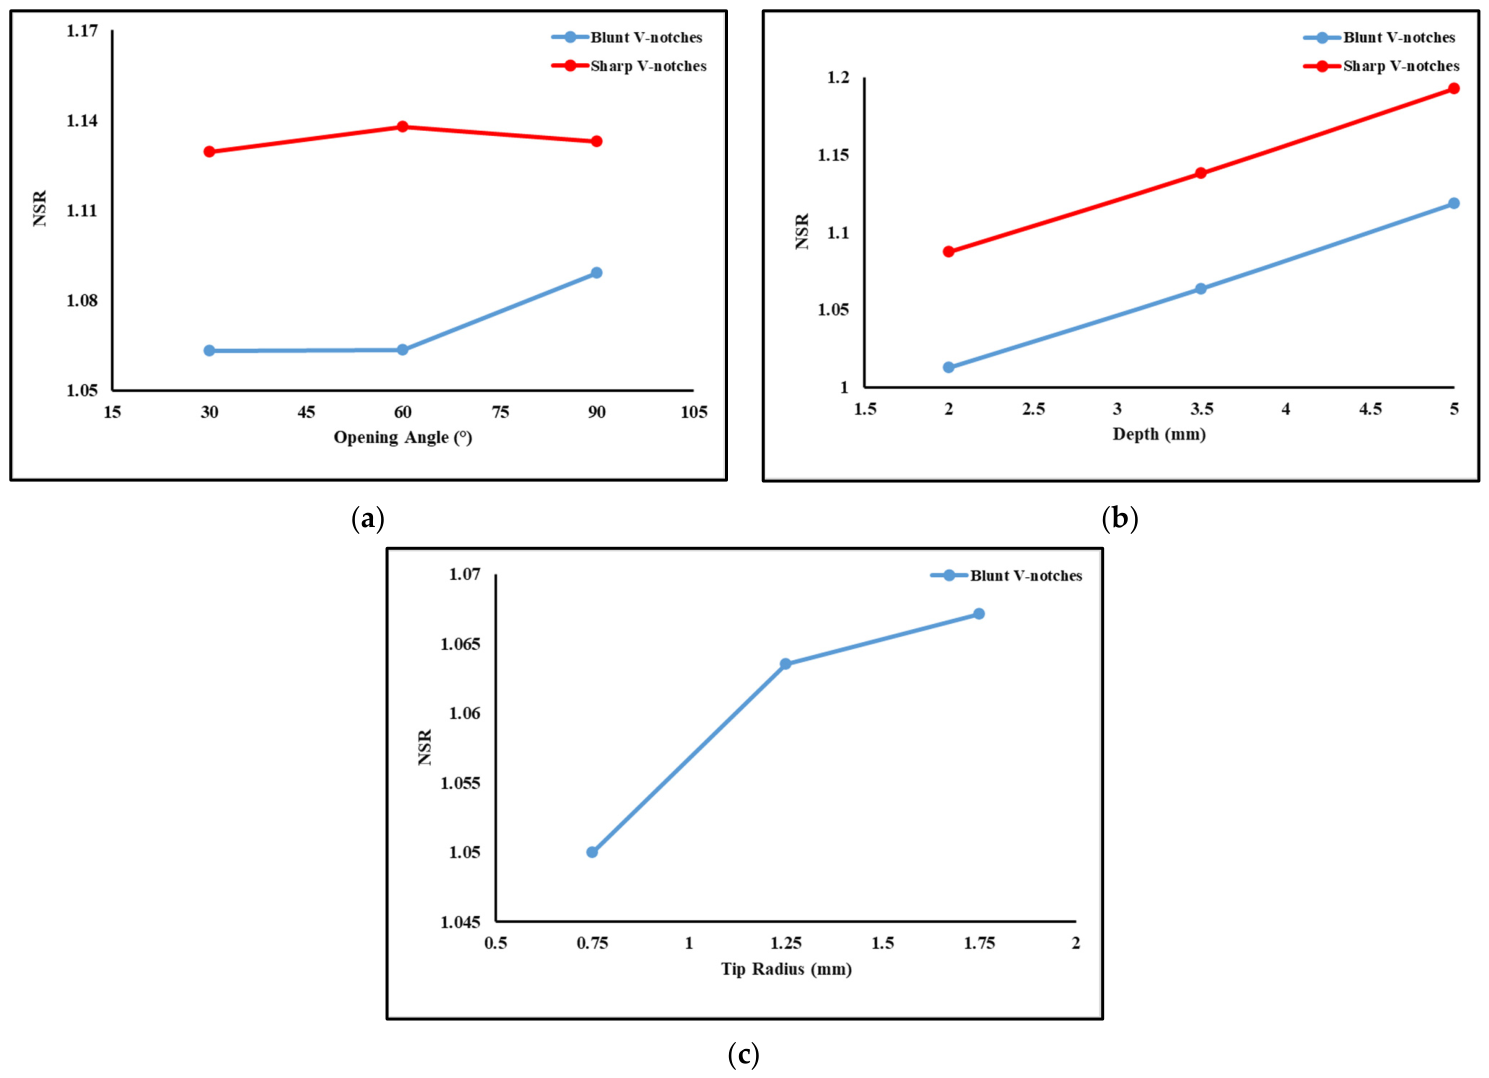
In this study, the notch sensitivity ratio (NSR) systematically evaluates the effects of notch geometry on tensile performance. Figure 11a shows the variation in NSR with notch opening angle at a fixed 3.5 mm depth. For blunt V-notches (1.25 mm tip radius), NSR increases slightly from approximately 1.06 at 30–60° to 1.09 at 90°. Sharp V-notches (0 mm tip radius) exhibit consistently higher, yet stable, NSR values (1.13–1.14). Overall, the opening angle has a minimal influence on NSR. Figure 11b illustrates NSR versus notch depth at a fixed 60° angle. NSR increases significantly with depth: from 1.01 (2 mm) to 1.12 (5 mm) for blunt notches, and from 1.09 to 1.19 for sharp notches. This indicates deeper notches promote higher apparent tensile strength. Consistently seeing NSR > 1 implies low-to-moderate notch sensitivity, as localized plastic deformation sufficiently redistributes stress and delays fracture. Figure 11c presents NSR against tip radius for blunt notches at a fixed 3.5 mm depth and 60° angle. NSR increases slightly from 1.05 (0.75 mm) to 1.07 (1.75 mm). This near-unity NSR confirms low notch sensitivity for blunt geometries. The increase demonstrates that larger radii reduce stress concentration and enhance the material’s ability to redistribute stress prior to fracture. Overall, NSR values remain > 1 across all investigated geometries, indicating low-to-moderate notch sensitivity. Notch depth and tip radius exert a much stronger influence on NSR than the opening angle.
Figure 11.
Effect of (a) notch opening angle on NSR, (b) notch depth on NSR, and (c) notch tip radius on NSR.
5.2. Numerical Results
5.2.1. Comparison of Experimental and Numerical Stress–Strain Responses
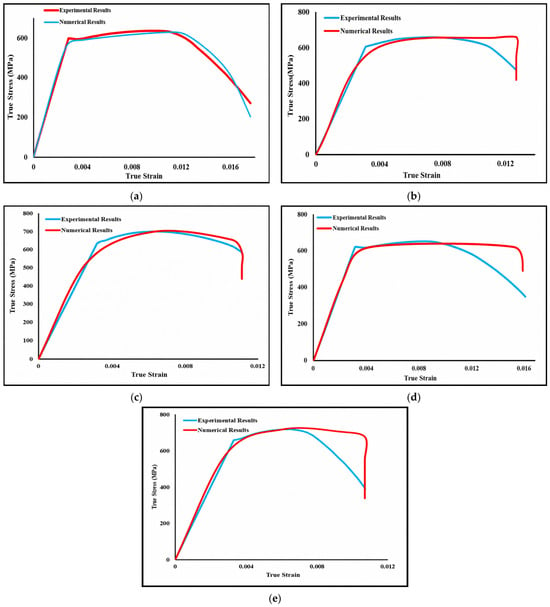
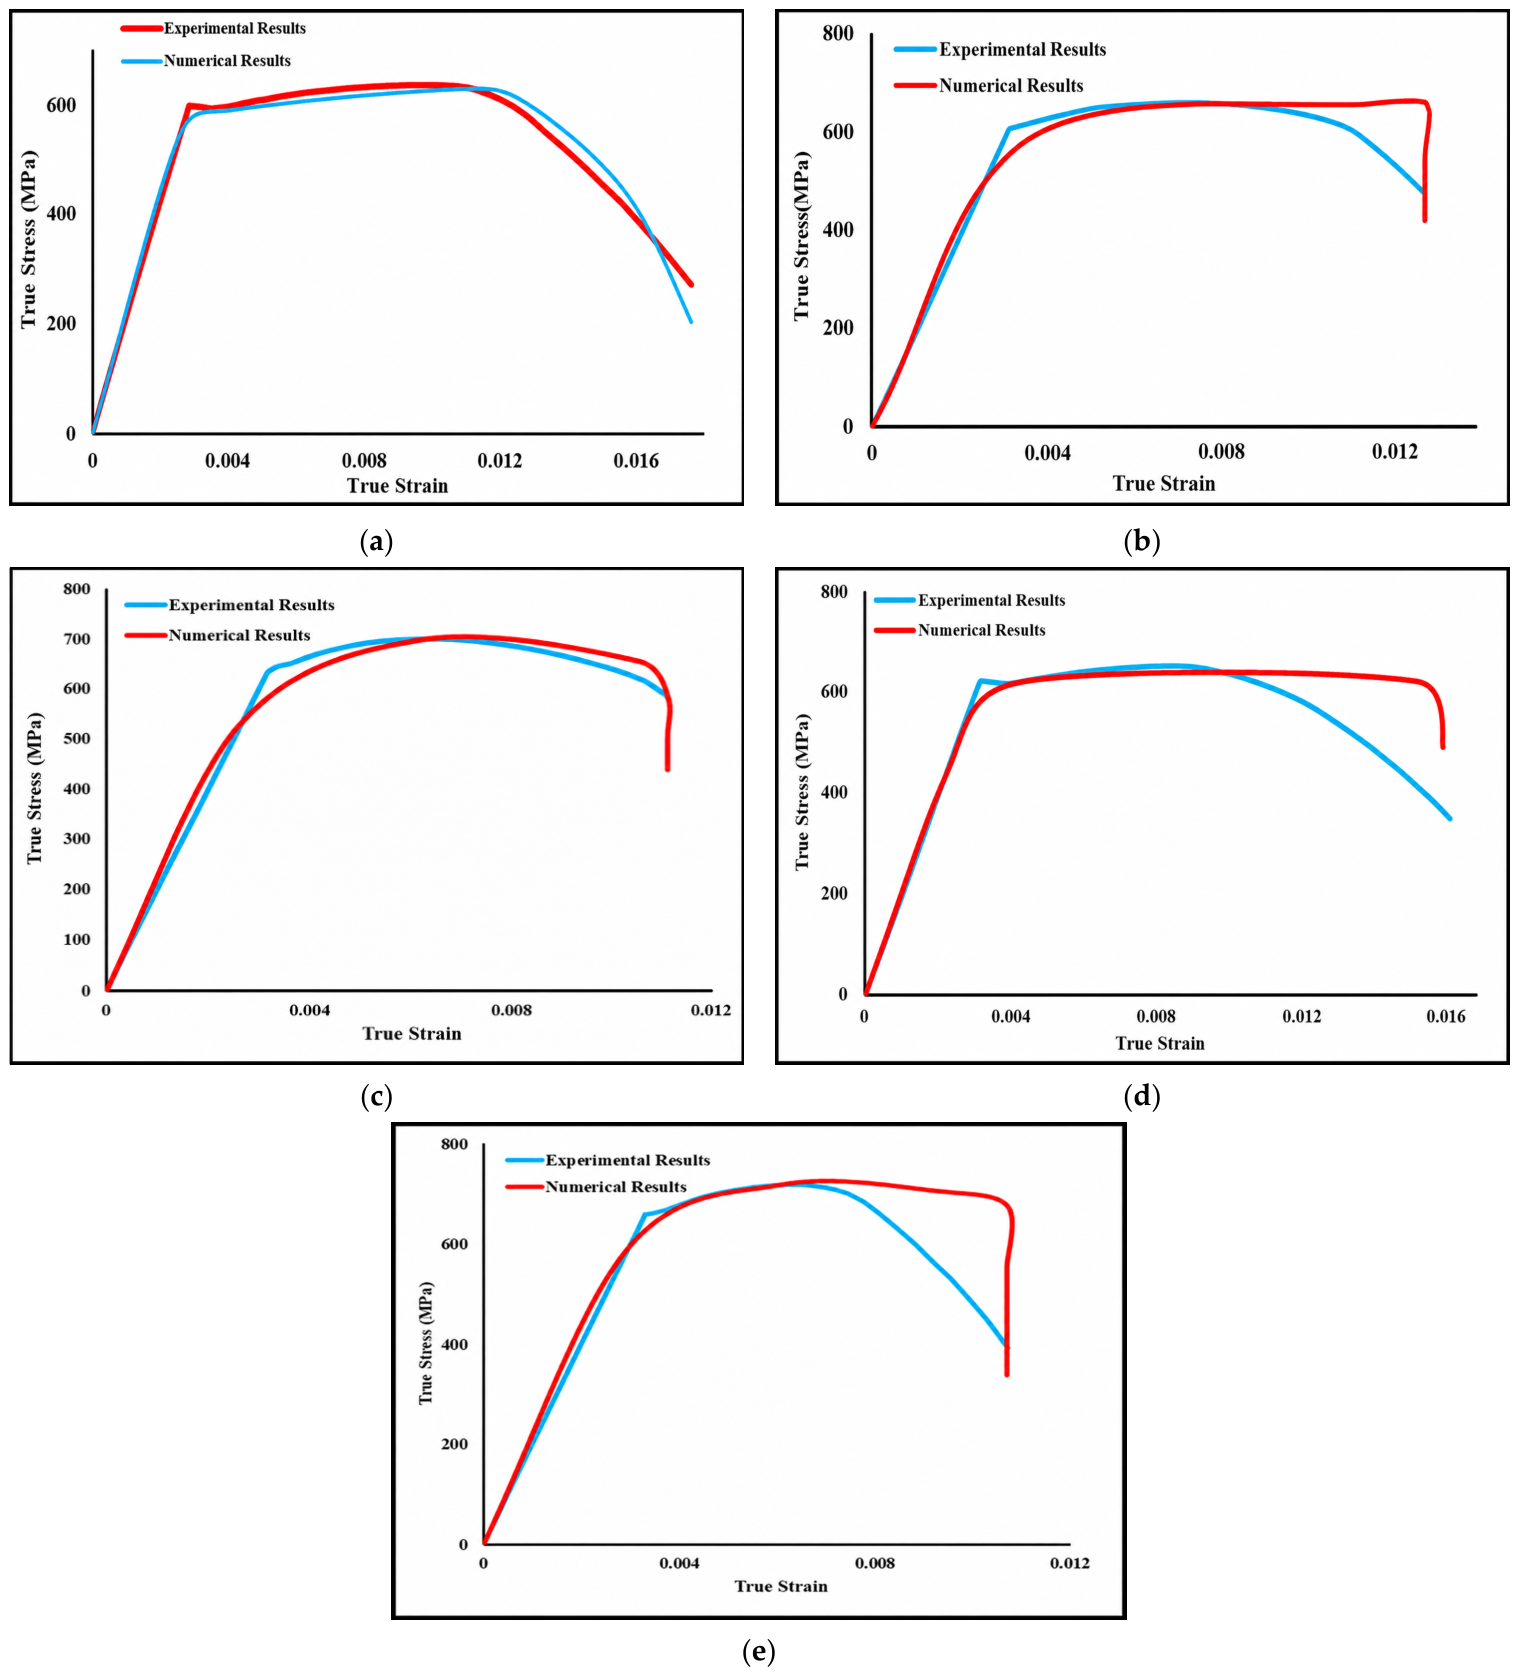
Figure 12a compares experimental and numerical true stress–strain curves for the smooth specimen. Good agreement is observed, particularly in the elastic and strain-hardening regions, accurately predicting the yield point and ultimate tensile stress. Minor post-yielding deviations stem from idealized material modeling, while a sharper stress drop at large strains reflects a simplified failure representation. Overall, the experimental curve validates the numerical model.
Figure 12.
Comparison of experimental and numerical true stress-true strain curves for (a) unnotched specimen; (b) VN A60 D3.5 R1.25 specimen; (c) VN A90 D5 R1.75 specimen; (d) VNS A60 D2 specimen; (e) VNS A90 D5 specimen.
Figure 12b–e compare experimental and numerical responses for selected blunt (VN) and sharp (VNS) V-notched specimens across varying geometries. The numerical simulations show good agreement with experimental results for all configurations.
Numerically, the elastic region, yield onset, and plastic deformation are accurately captured. Minor yield-point deviations arise from localized yielding effects not fully represented in the model. In the strain-hardening region, the simulation successfully reproduces geometric influences: blunt specimens exhibit smoother plasticity, while sharp specimens show higher stress levels due to intense concentration. At large strains, numerical curves display a sharper stress drop due to the absence of progressive damage and crack evolution modeling. Overall, the numerical results capture key experimental trends, confirming the finite element model’s suitability for analyzing notch-induced stress–strain behavior. However, it is also important to note that agreement in the post-peak region is reduced for the sharp and small-radius notches. This is attributed primarily to the limited mesh resolution at the notch tip, where the 0.2 mm element size (retained due to the CFL constraint, Section 3.3) cannot fully resolve the steep strain gradients in these geometries.
5.2.2. Deformation Stages and Fracture Evolution in Numerical Simulation
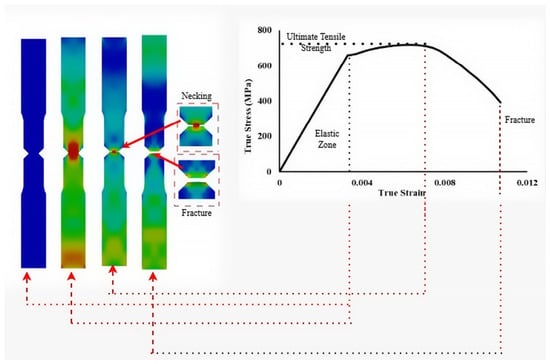
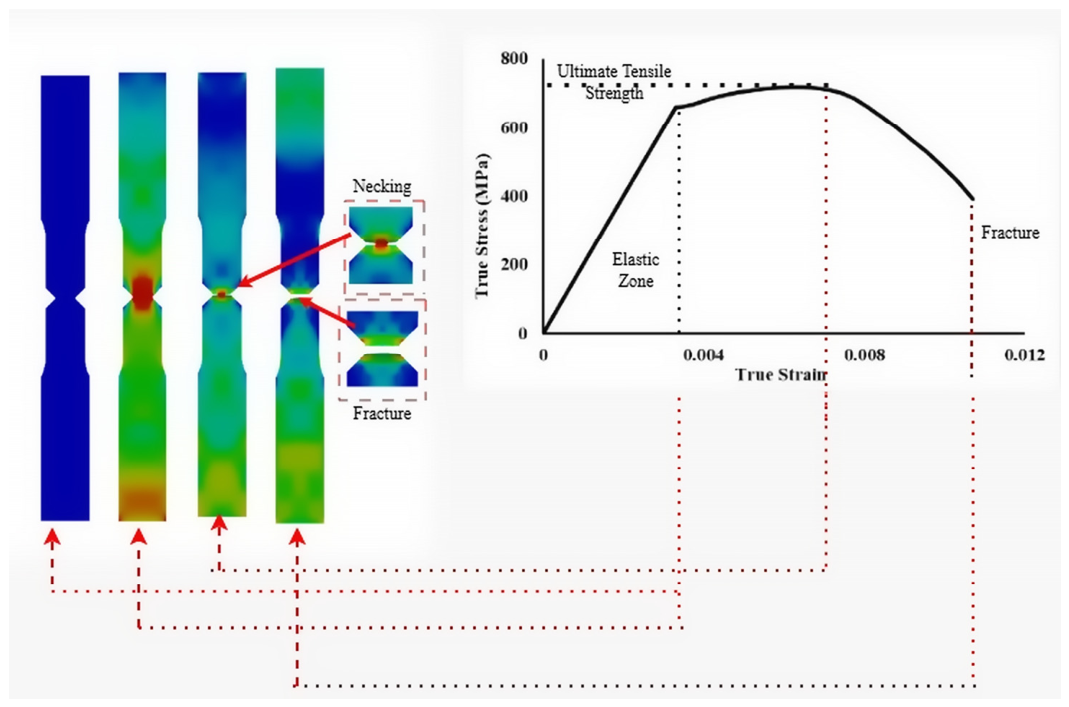
Figure 13 illustrates the numerical deformation and fracture stages of the sharp V-notched specimen (VNS A90 D5), correlating deformation evolution with the stress–strain response. Initial loading exhibits uniform elastic deformation. With increasing load, pronounced stress concentration initiates plastic deformation at the notch root. As deformation progresses, highly localized plastic strain forms a necking region as the specimen approaches its ultimate tensile strength. Final fracture occurs at the notch root, accompanied by a sharp stress drop. This confirms that the notch acts as a predefined fracture location that promotes localized deformation and suppresses distributed necking, successfully capturing key fracture stages.
Figure 13.
Stages of the specimen (VNS A90 D5) during the simulation.
5.2.3. Quantitative Comparison Between Experimental and Numerical Results
Table 6 compares experimental and numerical ultimate tensile strength (UTS) and fracture strain for selected notched specimens, demonstrating close correspondence across all configurations. UTS prediction error remains below 1%, demonstrating high accuracy in predicting peak load-carrying capacity. Predicted fracture strain errors stay below 4%, with minor discrepancies attributed to experimental variances and simplified numerical failure representations. Overall, these minimal errors confirm the finite element model’s reliability in predicting notched specimen strength and deformation, validating its use for subsequent machine learning modeling.
Table 6.
Comparison of ultimate strength and fracture strain.
5.3. Machine Learning Results
5.3.1. XGBoost Model Results and Analysis
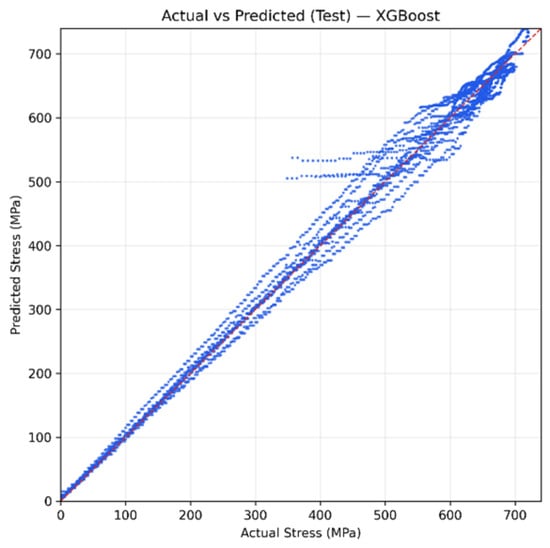
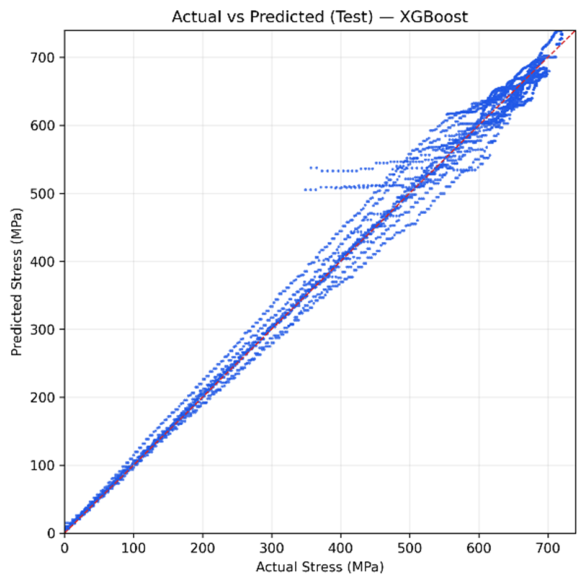
Base and tuned XGBoost models evaluated multiple feature configurations to predict stress using R2, RMSE, MSE, and MAE. Table 7 shows that the tuned 6-feature model achieved the highest R2 (0.9993), but bias-variance analysis revealed substantial overfitting. Conversely, the 6-feature base model demonstrated realistic performance (training R2 = 0.9977, testing R2 = 0.9899). This minimal gap and moderate RMSE confirm a balanced bias-variance trade-off. Testing results aligned well with limited high-stress scatter, indicating stable generalization. Ultimately, the 6-feature base XGBoost model was selected for its superior generalization and robustness over the tuned variant. The actual-versus-predicted stress plots shown in Figure 14 further support these findings. The testing results maintain good alignment with only limited scatter at higher stress levels.
Table 7.
XGBoost model evaluation matrices.
Figure 14.
Actual vs. predicted graph of the best model of XGBoost on test data.
5.3.2. Random Forest Model Results and Analysis
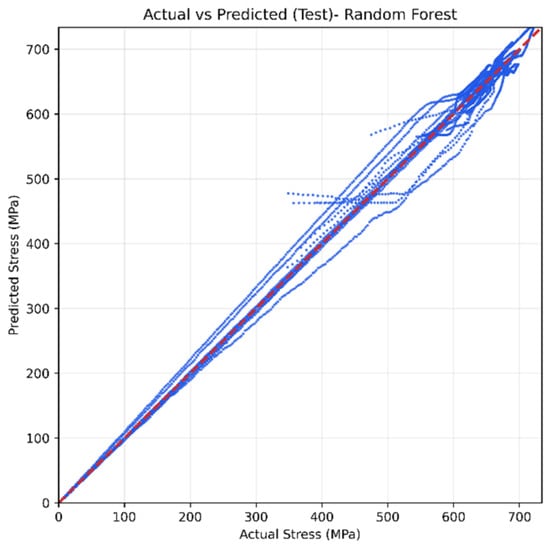
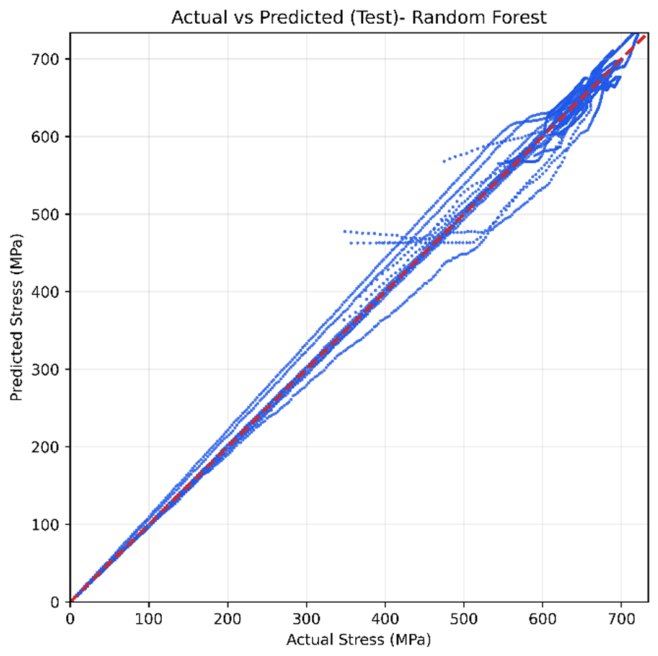
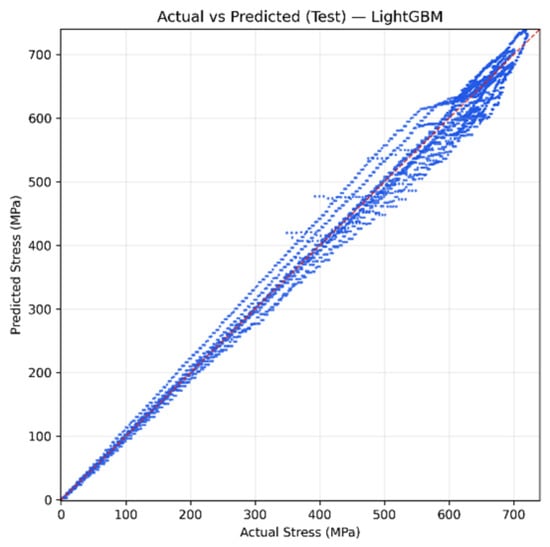
Random Forest models evaluated across different feature combinations achieved an R2 > 0.98. The 5-feature base model demonstrated the best performance, yielding the highest R2 (0.9918) and lowest MAE (12.62 MPa), showing a clear improvement over the 4-feature model despite a marginally higher RMSE. Hyperparameter tuning inconsistently affected performance and occasionally increased errors, indicating that default settings align well with the dataset. Consequently, Table 8 identifies the 5-feature base Random Forest model as the optimal configuration. Figure 15 illustrates the actual-versus-predicted stress plots. Testing predictions cluster tightly along the ideal diagonal with minor scatter at higher stress levels, demonstrating a balanced bias-variance trade-off and reliable predictive performance for notched specimens.
Table 8.
Random Forest model evaluation matrices.
Figure 15.
Actual vs. predicted graph of the best model of Random Forest on test data.
5.3.3. CatBoost Model Results and Analysis
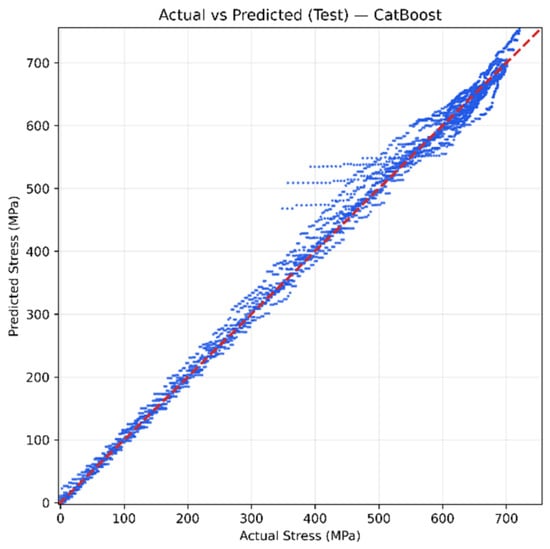
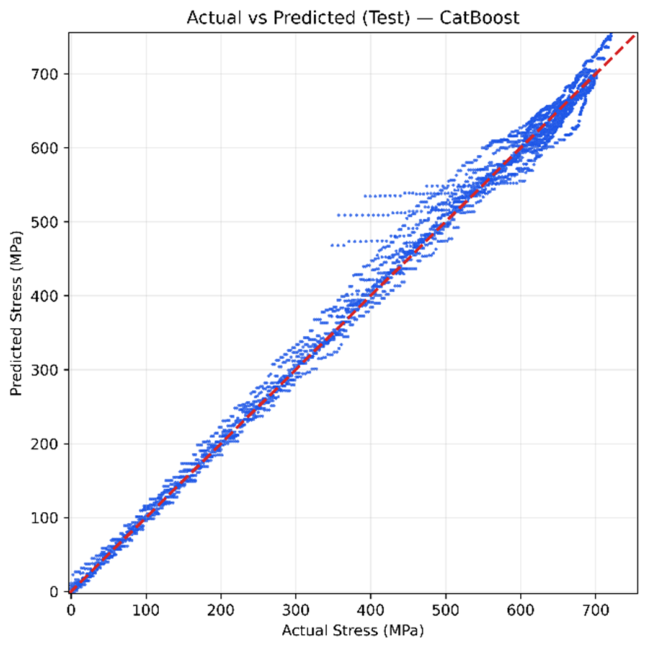
CatBoost models evaluated 4 to 7 input features to predict stress using R2, RMSE, MSE, and MAE, showing performance improves with engineered features up to an optimal complexity. Table 9 demonstrates that the 6-feature base model achieved the best overall performance (highest R2 = 0.9917; lowest RMSE = 19.03 MPa and MAE = 13.13 MPa). Hyperparameter tuning degraded the 6 and 7 feature models, indicating CatBoost’s inherent regularization and ordered boosting already suit the dataset perfectly without extensive tuning. Figure 16 illustrates actual versus predicted stress for the optimal 6-feature model. Testing predictions closely follows the 45° reference line, accurately capturing nonlinear behavior. Minor high-stress scatter reflects localized plasticity and experimental variability rather than systematic model bias.
Table 9.
CatBoost model evaluation matrices.
Figure 16.
Actual vs. predicted graph of the best model of CatBoost on test data.
5.3.4. LightGBM Model Results and Analysis
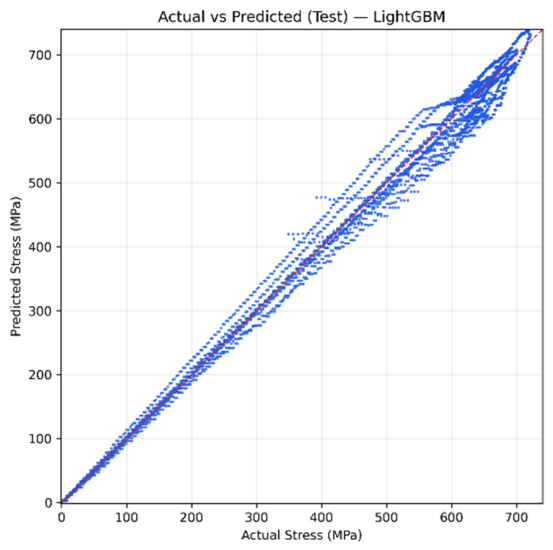
LightGBM models evaluated multiple feature configurations to predict stress. As Table 10 illustrates, the hyperparameter-tuned 6-feature model achieved the best overall performance (R2 = 0.9902, RMSE = 20.69 MPa, MAE = 15.17 MPa), outperforming base models and alternative combinations. Table 10 details the corresponding RandomizedSearchCV-optimized parameters. Figure 17. confirms these results. Testing predictions align tightly with the diagonal, exhibiting only limited high-stress scatter caused by plastic deformation and fracture variability. Consequently, this tuned 6-feature LightGBM model, as shown in Table 11, provides an optimal balance of accuracy and generalization, establishing it as the selected representative configuration.
Table 10.
LightGBM model evaluation matrices.
Figure 17.
Actual vs. predicted graph of the best model of LightGBM on test data.
Table 11.
Optimized hyper-tuned parameter values.
5.3.5. Performance Comparison and Bias-Variance Analysis of ML Models
Table 12 details the bias-variance characteristics of the optimal models. The Random Forest model achieves high training accuracy (R2 = 0.9995; low bias) and maintains strong testing performance (R2 = 0.9919, RMSE = 18.83 MPa, MAE = 12.49 MPa). This minimal metric gap indicates ductile sheet variance typical of ensemble tree methods, demonstrating a controlled reduction in overfitting. CatBoost exhibits strong robustness with a training R2 of 0.9987 (low bias) and testing R2 of 0.9917. The narrow gap (ΔR2 = 0.0070) reflects ductile sheet variance and effective generalization, achieving a well-balanced bias-variance trade-off across all notch configurations. The tuned 6-feature LightGBM model shows near-perfect training accuracy (R2 = 0.9999, RMSE = 1.82 MPa; very low bias) and strong testing capability (R2 = 0.9902, RMSE = 20.69 MPa). This expected error increase reflects moderate variance typical of gradient-boosted models applied to complex experimental data. Similarly, the 6-feature base XGBoost model demonstrates high training accuracy (R2 = 0.9977) and strong testing performance (R2 = 0.9899). However, the notable increase in RMSE from training (9.81 MPa) to testing (20.98 MPa) highlights a higher tendency toward overfitting and variance compared to the CatBoost and Random Forest models. Ultimately, all four models demonstrated strong predictive performance (R2 > 0.98) for stress prediction. CatBoost and LightGBM provided the best accuracy-generalization balance with stable bias-variance behavior. Random Forest proved reliable with moderate errors, while XGBoost exhibited slightly higher variance and a tendency to overfit.
Table 12.
Best result comparisons of machine learning models.
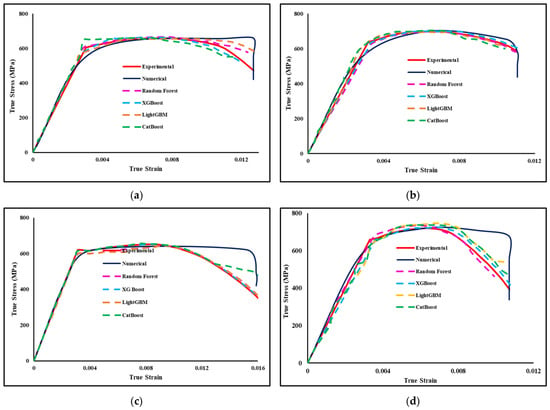
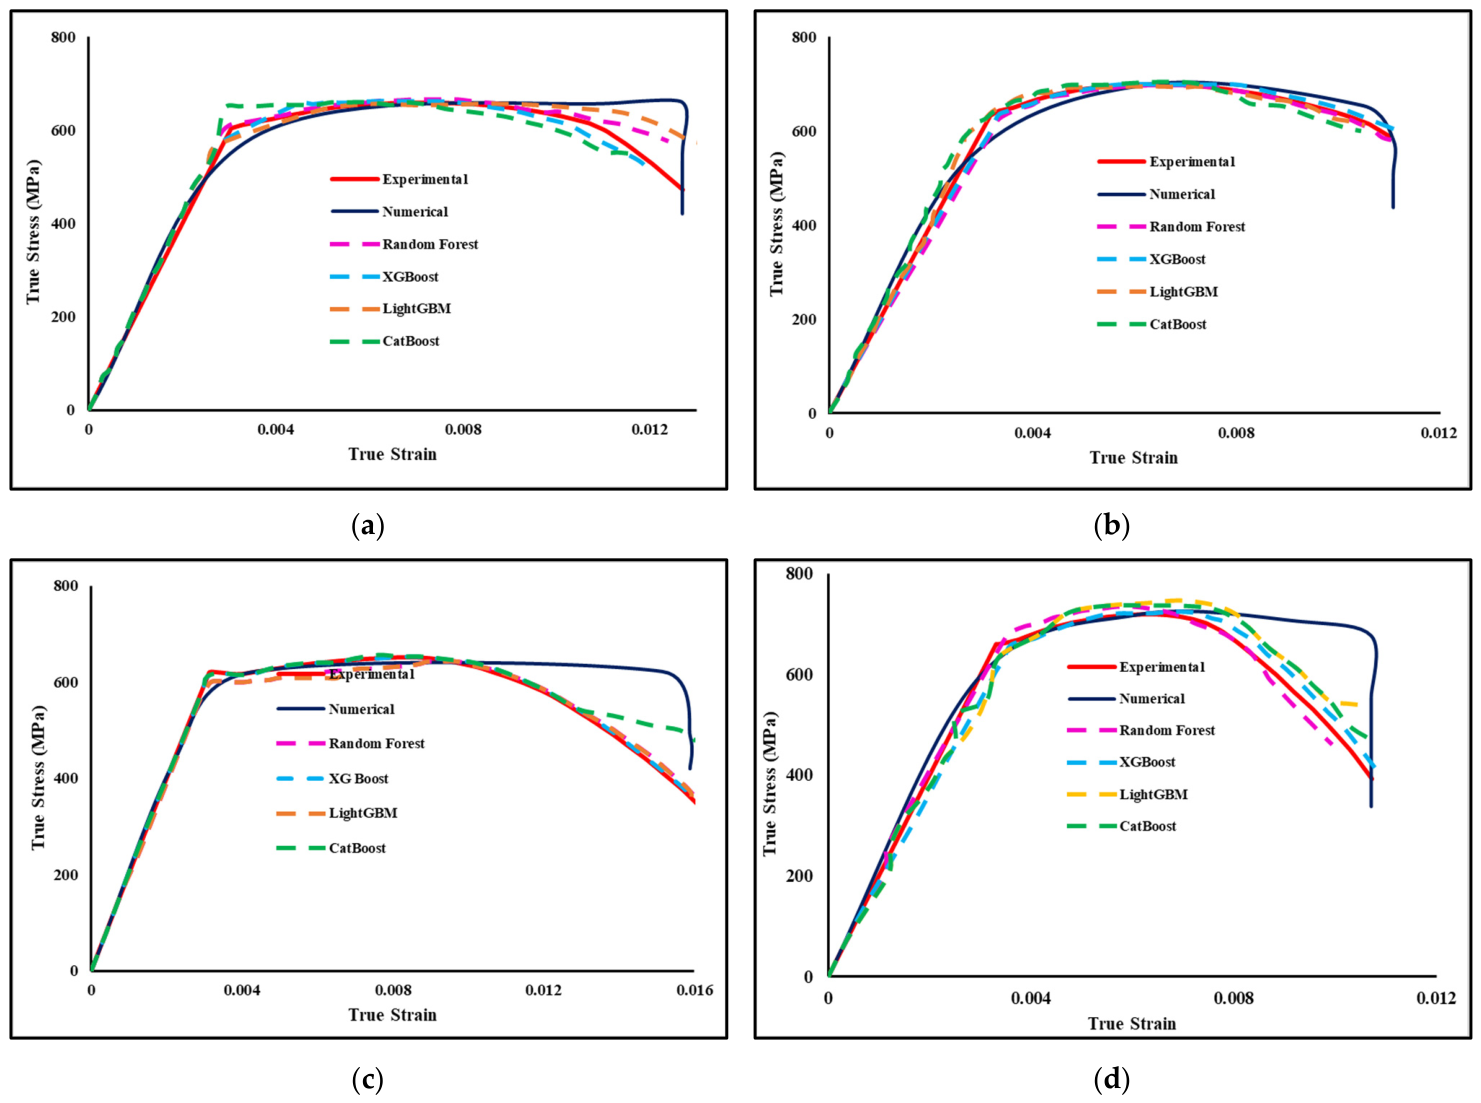
While the ensemble models demonstrated high predictive accuracy for the macroscopic strain-hardening envelope and ultimate fracture points, it is crucial to acknowledge their limitations regarding localized yielding phenomena. As shown in the comparative stress–strain curves in Figure 18, the machine-learning regressions smoothed over the distinct yield point effect observed in the experimental data. Because tree-based ensemble methods optimize for global error reduction across the entire deformation history, they inherently average out sudden, highly localized stress discontinuities such as the upper and lower yield drop. Consequently, while these trained models successfully capture the geometry-driven fracture mechanics of the specific ductile steel sheet evaluated in this study, caution must be exercised regarding their broader applicability. These specific model weights should not be extrapolated to predict the behavior of fully annealed, highly ductile steel sheets, which exhibit pronounced yield plateaus (Lüders bands) and massive post-yield plastic deformation, as the current algorithms would fail to capture those specific microstructural yielding mechanisms.
Figure 18.
Comparisons of true stress-true strain curve of (a) VN A60 D3.5 R1.25 specimen; (b) VN A90 D5 R1.75 specimen; (c) VNS A60 D2 specimen; and (d) VNS A90 D5 specimen.
The predictive performance achieved in this study represents a significant advancement over earlier data-driven attempts in material characterization. For instance, previous research by Katakareddi et al. [13] found that while some advanced models performed well, simpler regression architectures, such as standard Decision Trees and Random Forests, only reached an R2 of 0.86. In contrast, the ensemble models developed here consistently achieved R2 values exceeding 0.99, proving that our approach of integrating engineered features and ensemble techniques is highly effective for capturing complex material behavior. While the models do show some minor scatter at high stress levels due to localized plastic deformation, this level of accuracy confirms that these ensemble frameworks provide a vastly superior alternative to the simpler predictive models used in past studies.
5.4. Comparative Analysis of Stress–Strain Curve
The four configurations in Figure 18 were excluded from the training process (Section 4.1). Consequently, the curves presented represent model predictions for previously unseen specimens, rather than reproductions of training data. Figure 18a–d compares the true stress–strain responses from experiments, numerical simulations, and four ML models. To evaluate these surrogate models beyond standard statistical metrics, analyses are conducted to understand how well they capture three critical physical stages:
- Yielding: All models capture initial elastic stiffness, but Random Forest artificially smooths the yield point. XGBoost and LightGBM replicate the abrupt yield characteristic of cold-rolled steel.
- Onset of Necking: Numerical simulations show minor deviations in post-necking; CatBoost and Random Forest under-predict the ultimate tensile strength or miss the descending segment of localized deformation. XGBoost and LightGBM closely track strain-hardening and accurately locate the necking transition.
- Failure: FEM termination points fluctuate due to element deletion mechanics, XGBoost, and LightGBM; however, they end at the exact experimental fracture strain. They reproduce the sudden loss of load capacity at fracture rather than tapering of f.
All models fit the general macroscopic data well. XGBoost and LightGBM show better physical fidelity. They precisely capture the onset of necking and absolute elongation to failure. These qualities make them reliable and efficient alternatives to FEM for known design spaces.
6. Conclusions
In this research, a systematic approach was used to establish the geometric parameters of the notches. A total of 36 specimens with unique configurations were tested, and the experimental data were used to validate the numerical simulations and construct a dataset for machine learning applications. Four ensemble learning models were employed to predict the stress–strain curves of untested V-notch specimen configurations. From the results, the following summary can be drawn:
- Unnotched ductile steel sheet (E = 212.08 GPa, Yield = 599 MPa, UTS = 637.1 MPa, Fracture Strain = 0.017) establishes the reference for assessing notch effects.
- Opening angle minimally affects yield and UTS, but wider angles significantly decrease fracture stress, causing earlier failure.
- Notch depth increases yield, UTS, and fracture stress due to reduced effective area and higher geometric constraint, though overall ductility decreases.
- Tip radius dominates fracture behavior. Sharper notches increase yield/UTS but severely reduce fracture resistance and strain capacity. Larger radii enhance distributed plasticity and fracture stress.
- Notch Sensitivity Ratio remains near unity (1.01–1.19), indicating low-to-moderate quasi-static notch sensitivity, driven primarily by depth and tip radius rather than opening angle.
- FEM models accurately match experimental data (UTS error < 1%, fracture strain error < 4%), validating their use for notch-driven deformation analysis.
- All models achieved R2 > 0.98.
- Random Forest (5-feature base): R2 = 0.9919, RMSE = 18.83 MPa, MAE = 12.49 MPa.
- CatBoost (6-feature base): R2 = 0.9917, RMSE = 19.03 MPa, MAE = 13.13 MPa.
- LightGBM (6-feature tuned): R2 = 0.9902, RMSE = 20.69 MPa.
- XGBoost (6-feature base): R2 = 0.9899 (demonstrating better robustness than it overfitted tuned variant).
Finally, integrating experiments, FEM simulations, and ML successfully predicted the stress–strain and fracture behavior of V-notched ductile steel sheets, with XGBoost and LightGBM demonstrating the highest physical fidelity and stable predictive performance. This integrated framework serves as a foundation for several promising avenues of future research. To enhance the model’s practical applicability, future work will focus on asymmetric notch configurations to reflect more complex real-world structural conditions. Additionally, we plan to refine the methodology by investigating high-strain-rate loading conditions and integrating microstructural banding effects into numerical simulations to achieve greater physical fidelity.
Author Contributions
Conceptualization, M.A.I., R.I.F., M.A.M. and S.B.R.; methodology, M.A.I., R.I.F. and M.A.M.; software, M.A.I.; validation, M.A.I. and R.I.F.; formal analysis, M.A.I., R.I.F. and M.A.M.; investigation, M.A.I., R.I.F., M.A.M. and S.B.R.; resources, M.M.R., S.B.R. and G.V.; data curation, M.A.I., R.I.F. and M.A.M.; writing—original draft preparation, M.A.I., R.I.F. and M.A.M.; writing—review and editing, M.M.R., S.B.R. and G.V.; supervision, S.B.R.; project administration, S.B.R. and G.V. All authors have read and agreed to the published version of the manuscript.
Funding
This research was funded by the Aviation and Aerospace University, Bangladesh (AAUB) under research grant reference AAUB/Research/2025/09.
Data Availability Statement
The data presented in this study are available on request from the corresponding author.
Acknowledgments
The support of the AAUB Research Cell is sincerely appreciated. The authors also extend their sincere gratitude to Saifur Rahman Bakaul, Director of the Research Cell, for recognizing the merit of the research proposal and for his valuable guidance and constructive input throughout the study. The authors also acknowledge the use of Grammarly for grammar checking, language refinement, and improving the clarity and flow of the manuscript.
Conflicts of Interest
The authors declare no conflict of interest.
References
- Gupta, M.K.; Singh, N.K.; Gupta, N.K. Energy dissipation and notch sensitivity of mild steel at different strain rates and temperatures. Int. J. Impact Eng. 2023, 178, 104610. [Google Scholar] [CrossRef] [Scilit]
- Kong, Z. Experimental and theoretical study on mechanical properties of mild steel after corrosion. Ocean Eng. 2022, 246, 110652. [Google Scholar] [CrossRef] [Scilit]
- Xie, J.; Xi, R.; Tong, C.; Yan, J.-B. Mechanical properties of Q235∼Q460 mild steels at low temperatures. Constr. Build. Mater. 2023, 363, 129850. [Google Scholar] [CrossRef] [Scilit]
- Wang, W.; Qian, X.; Su, R.; Wang, X. Tensile tests and analyses of notched specimens fabricated from high strength steels using a generalized yield model. Fatigue Fract. Eng. Mater. Struct. 2010, 33, 310–319. [Google Scholar] [CrossRef] [Scilit]
- Świt, G.; Dzioba, I.; Ulewicz, M.; Lipiec, S.; Adamczak-Bugno, A.; Krampikowska, A. Experimental-numerical analysis of the fracture process in smooth and notched V specimens. Prod. Eng. Arch. 2023, 29, 444–451. [Google Scholar] [CrossRef] [Scilit]
- Strandberg, M. Fracture at V-notches with contained plasticity. Eng. Fract. Mech. 2002, 69, 403–415. [Google Scholar] [CrossRef] [Scilit]
- Zhang, H.; Wu, Q.; Yuan, S.; Song, H.; Huang, G. Investigation of strain hardening behavior of 316 L stainless steel by digital image correlation combined with machine learning. Mater. Today Commun. 2025, 47, 113183. [Google Scholar] [CrossRef] [Scilit]
- Zhang, H.; Wu, Q.; Yuan, S.; Fu, T.; Song, H.; Huang, G. Study on hardening and damage behaviors of Ti6Al4V alloy based on WOA-BP neural network. Arch. Appl. Mech. 2025, 95, 223. [Google Scholar] [CrossRef] [Scilit]
- Song, M.; Li, X.; Cao, Y.; Zhen, Y.; Zhong, J.; Guan, K. Determination of elastoplastic properties of in-service pipeline steel based on backpropagation neural network and small punch test. Int. J. Press. Vessel. Pip. 2021, 190, 104316. [Google Scholar] [CrossRef] [Scilit]
- Ayatollahi, M.R.; Torabi, A.R.; Azizi, P. Experimental and Theoretical Assessment of Brittle Fracture in Engineering Components Containing a Sharp V-Notch. Exp. Mech. 2011, 51, 919–932. [Google Scholar] [CrossRef] [Scilit]
- Talebi, H.; Bahrami, B.; Daneshfar, M.; Bagherifard, S.; Ayatollahi, M.R. Data-driven based fracture prediction of notched components. Philos. Trans. R. Soc. A Math. Phys. Eng. Sci. 2023, 382, 20220397. [Google Scholar] [CrossRef] [Scilit]
- Farhadi, S.; Tatullo, S.; Ferrian, F. Comparative analysis of ensemble learning techniques for enhanced fatigue life prediction. Sci. Rep. 2025, 15, 11136. [Google Scholar] [CrossRef] [Scilit]
- Katakareddi, G.; Ali, S.; Jungalwala, K.; Yedla, N. Predicting Stress–Strain Characteristics of Hot Deformed Cu-Zr Metallic Glass Alloy Composite Nanowires Using Supervised Machine Learning Algorithms. J. Mater. Eng. Perform. 2024, 34, 8165–8181. [Google Scholar] [CrossRef] [Scilit]
- Nakarmi, S.; Leiding, J.A.; Lee, K.-S.; Daphalapurkar, N.P. Predicting non-linear stress–strain response of mesostructured cellular materials using supervised autoencoder. Comput. Methods Appl. Mech. Eng. 2024, 432, 117372. [Google Scholar] [CrossRef] [Scilit]
- Rosiak, A.; Schmeling, M.; Marcelino, R.; Schaeffer, L. Machine learning applied to predict the flow curve of steel alloys. Int. J. Adv. Manuf. Technol. 2024, 134, 5481–5492. [Google Scholar] [CrossRef] [Scilit]
- Dorbane, A.; Harrou, F.; Anghel, D.-C.; Sun, Y. Machine Learning Prediction of Aluminum Alloy Stress–Strain Curves at Variable Temperatures with Failure Analysis. J. Fail. Anal. Prev. 2023, 24, 229–244. [Google Scholar] [CrossRef] [Scilit]
- Yacouti, M.; Erb, D.J.; Yu, H.Z.; Lu, K.; Shakiba, M. Predicting the mechanical response of shape-memory Zirconia-reinforced metal-matrix composites using finite element analysis and deep learning. Compos. Struct. 2025, 374, 119641. [Google Scholar] [CrossRef] [Scilit]
- Niu, H.; Sun, Y.; Lin, C. Study on notch tensile properties of Fe-Mn-Si shape memory alloy. Mater. Res. Express 2024, 11, 076502. [Google Scholar] [CrossRef] [Scilit]
- Rohaizat, N.I.; Alharbi, K.; Pinna, C.; Ghadbeigi, H.; Hanlon, D.N.; Azid, I.A. Using a Correction Factor to Remove Machine Compliance in a Tensile Test on DP1000 Steel Validated with 2D Digital Image Correlation Technique. In Progress in Engineering Technology III; Springer International Publishing: Cham, Switzerland, 2021; Volume 148, pp. 113–123. [Google Scholar]
- Abachi, P.; Naseri, P.S.Z.; Purazrang, K.; Coyle, T.W. Fracture Behavior Evaluation of High-Strength 7050 and 7075 Aluminum Alloys Using V-Notched Specimen. In Fracture Mechanics—Properties, Patterns and Behaviours; Alves, L.M., Ed.; InTech: London, UK, 2016. [Google Scholar] [CrossRef] [Scilit]
- Guyon, I.M.; Elisseeff, A. An Introduction to Variable and Feature Selection. J. Mach. Learn. Res. 2003, 3, 1157–1182. Available online: https://www.semanticscholar.org/paper/An-Introduction-to-Variable-and-Feature-Selection-Guyon-Elisseeff/d8384f7ef288d2d5cb267128471c5427fc98b54b (accessed on 9 January 2026).
- Sewell, M. Ensemble learning. RN. 2008. Available online: https://www.academia.edu/2813351/Ensemble_learning (accessed on 12 January 2026).
- Chen, T.; Guestrin, C. XGBoost: A Scalable Tree Boosting System. In Proceedings of the 22nd ACM SIGKDD International Conference on Knowledge Discovery and Data Mining-KDD ’16; Association for Computing Machinery: New York, NY, USA, 2016; Volume 1, pp. 785–794. [Google Scholar] [CrossRef] [Scilit]
- Clark, B.; Lee, F. What Is Gradient Boosting? Ibm.com. 7 April 2025. Available online: https://www.ibm.com/think/topics/gradient-boosting (accessed on 2 February 2026).
- Breiman, L. Random Forests. Mach. Learn. 2001, 45, 5–32. [Google Scholar] [CrossRef] [Scilit]
- Ke, G.; Meng, Q.; Finley, T.; Chen, W.; Ma, W.; Ye, Q.; Liu, T.-Y. LightGBM: A Highly Efficient Gradient Boosting Decision Tree. In Neural Information Processing Systems; 2017; Available online: https://papers.nips.cc/paper_files/paper/2017/hash/6449f44a102fde848669bdd9eb6b76fa-Abstract.html (accessed on 2 February 2026).
- Prokhorenkova, L.; Gusev, G.; Vorobev, A.; Dorogush, A.V.; Gulin, A. CatBoost: Unbiased boosting with categorical features. arXiv 2019, arXiv:1706.09516. [Google Scholar] [CrossRef] [Scilit]
- Claesen, M.; Moor, B.D. Hyperparameter Search in Machine Learning. arXiv 2015, arXiv:1502.02127. [Google Scholar] [CrossRef] [Scilit]
- Yu, T.; Zhu, H. Hyper-Parameter Optimization: A Review of Algorithms and Applications. arXiv 2020, arXiv:2003.05689. [Google Scholar] [CrossRef] [Scilit]
- Bergstra, J.; Bengio, Y. Random search for hyper-parameter optimization. J. Mach. Learn. Res. 2012, 13, 281–305. [Google Scholar]



Disclaimer/Publisher’s Note: The statements, opinions and data contained in all publications are solely those of the individual author(s) and contributor(s) and not of MDPI and/or the editor(s). MDPI and/or the editor(s) disclaim responsibility for any injury to people or property resulting from any ideas, methods, instructions or products referred to in the content. |
© 2026 by the authors. Licensee MDPI, Basel, Switzerland. This article is an open access article distributed under the terms and conditions of the Creative Commons Attribution (CC BY) license.