


Abstract
Heat is now one of the leading weather-related causes of death worldwide, and unlike a flood or a storm, its damage rarely arrives in a single moment. It accumulates, mostly indoors and mostly at night, through physiological stress that builds across hours rather than striking all at once. This perspective proposes a human biometeorological framework that reads heat adaptation through the sequence of a single hot day, from the cool morning to nocturnal recovery, rather than through a list of technologies. Physiologically Equivalent Temperature (PET) and the Universal Thermal Climate Index (UTCI), both developed for the outdoor thermal environment, translate atmospheric conditions into a load the body carries. They give households, workplaces, care facilities and cities a common language for timing, shading and ventilation. Indoors and at work, the established indices and standards for the indoor thermal environment and for occupational heat stress remain the tools of choice, and the framework is meant to complement them. Particular weight is given to overheating indoors, to the people for whom recovery is hardest to reach, and to the unequal distribution of tropical nights. The central argument is that successful adaptation depends less on any single measure than on managing the cumulative heat load across the whole day. A climate-resilient city, on this view, is one that supports physiological recovery through its buildings, its neighbourhoods and the daily choices its residents are able to make.
1. Introduction
Heat is now one of the leading weather-related causes of death worldwide. Unlike a flood or a storm, its damage rarely arrives in a single moment: it accumulates, mostly indoors and mostly at night, through physiological stress that builds across hours rather than striking all at once [1]. What a body carries by the end of such a day depends less on the outdoor peak than on when the heat arrived, how the building responded to it, what choices were made along the way, and whether the night gave it room to recover.
Hippocrates opens Airs, Waters, Places by telling the physician to study the winds, the waters and the seasons of a town before treating anyone living in it [2]. Human biometeorology puts this instinct into numbers: indices such as the Physiologically Equivalent Temperature (PET) and the Universal Thermal Climate Index (UTCI) describe the exchange of heat between a body and its surroundings, not the air alone [3,4,5]; in Germany the method is laid down in guideline VDI 3787 Part 2 [6]. What has been missing is the translation of that number into the ordinary course of a day, in a language a household, a care facility, a workplace or a municipal administration can act on. This perspective attempts exactly that translation, by following a single hot day from before sunrise to the following night.
A word on scope. PET and UTCI were developed to describe the outdoor thermal environment, and that is where they are used here. Indoors and at the workplace, separate standards exist for building overheating and for heat stress at work (for example ISO 7730, EN 16798-1, ISO 17772-1, ISO 7933, ISO 7243 and ISO 15265) [7,8,9,10,11,12,13,14]. Among these, the WBGT is an empirical index, whereas PMV and the Predicted Heat Strain model are built on the heat balance of the human body [8,15]. These methods answer questions that an outdoor biometeorological index was not built to answer, for example how long a person may work under given conditions. Overviews of the many thermal indices, their basis and their fields of application are given in [16,17,18]. This perspective therefore uses PET and UTCI for the outdoor setting and as a common language, and it points to the indoor and occupational methods wherever the setting is a room or a workplace. The Freiburg examples are illustrations: the timing of the phases of a day, and the values that go with them, depend on climate, season and latitude.
2. A Human Biometeorological Day
2.1. Human Biometeorology and the Scale of the Problem
Human biometeorology has the tools to describe a hot day in terms that matter to the body. PET and UTCI combine air temperature, radiation, wind, humidity, activity and clothing into a single physiologically meaningful number, and the difference from air temperature alone is not academic: at the same air temperature, radiation and wind can move the actual heat load by many degrees [3,4,5].
Both indices are expressed in degrees Celsius and are read against their own stress scales. The table and figure below therefore give PET and UTCI side by side, so that the reader can see how close the two run to each other and where they differ.
The scale of the problem is well-documented. The summers of 2003 and 2022 are associated with tens of thousands of additional deaths in Europe [19,20], and a pan-European analysis puts heat-related deaths in the summer of 2024 alone at around 62,700, on top of more than 61,000 in 2022 [21]. Provisional figures for 2026 point in the same direction: the Robert Koch Institute estimates about 16,000 heat-related deaths in Germany for calendar weeks 15 to 37 of 2026, about half of them in people aged 85 and older [22]. Heat stress measured with the UTCI has increased in many regions since the 1970s, extreme heat stress now occurs about two and a half times as often in Europe, and a growing share of the world population is exposed to hazardous heat [23]. Indices built on the human heat balance have long been used for outdoor assessment, and epidemiological studies that compare them with air temperature give a mixed picture: in some studies the indices perform better; in many they do not [24,25]. The indices describe how severe the environment is for the body; they do not replace health data.
The question that matters for adaptation is not whether a day is hot, but when, where and for whom it becomes dangerous. That is the question the rest of this perspective is built around, treating the day itself as the working unit of adaptation.
2.2. The Rhythm of the Day: Using the Cool Morning and Avoiding the Peak
The early morning is the most useful part of a hot day, and it is free. Outdoor work, errands and physical activity belong here, before the sun gains strength, because physical effort adds its own heat to whatever the atmosphere is already contributing [26]. The same hours are the moment to ventilate, while outdoor air still runs cooler than indoor air, and then to close the building down again as radiation increases: shutters closed, windows shaded, before the room has had the chance to warm.
Through the middle of the day, adaptation is less about doing and more about not doing. Shade, or a cooler room; fluid before thirst arrives; the lightest possible physical load; rest where rest is possible. In the evening, ventilation can resume once the air outside is genuinely cooler than the air inside, though humidity, air quality, safety and insects will all have their say in exactly when.
None of this is new. Shaded courtyards, heavy walls, controlled ventilation, an afternoon rest and water used for cooling have been used in hot climates for as long as people have built houses in them. The wind towers and underground water channels of Iranian desert towns are one well-documented example [27]; the courtyard houses of the Mediterranean, with their thick walls, shuttered windows and the afternoon rest, are another, and Xenophon already let Socrates recommend a house that takes the low winter sun and stays in the shade in summer [28]. The street is a separate matter. Measurements in a Freiburg street canyon show why the geometry of a street matters as much as the technique used within it: canyon shading changes the radiant load on a pedestrian far more than it changes the air temperature [29]. Adaptive thermal-comfort research makes the same point from a different angle: people tolerate a wider range of conditions once they can adjust their clothing, their activity and their immediate surroundings [30]. The aim is not to reproduce one traditional practice everywhere, but to recognise the physiological logic behind all of them.
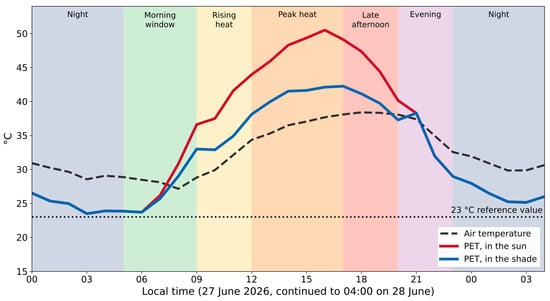
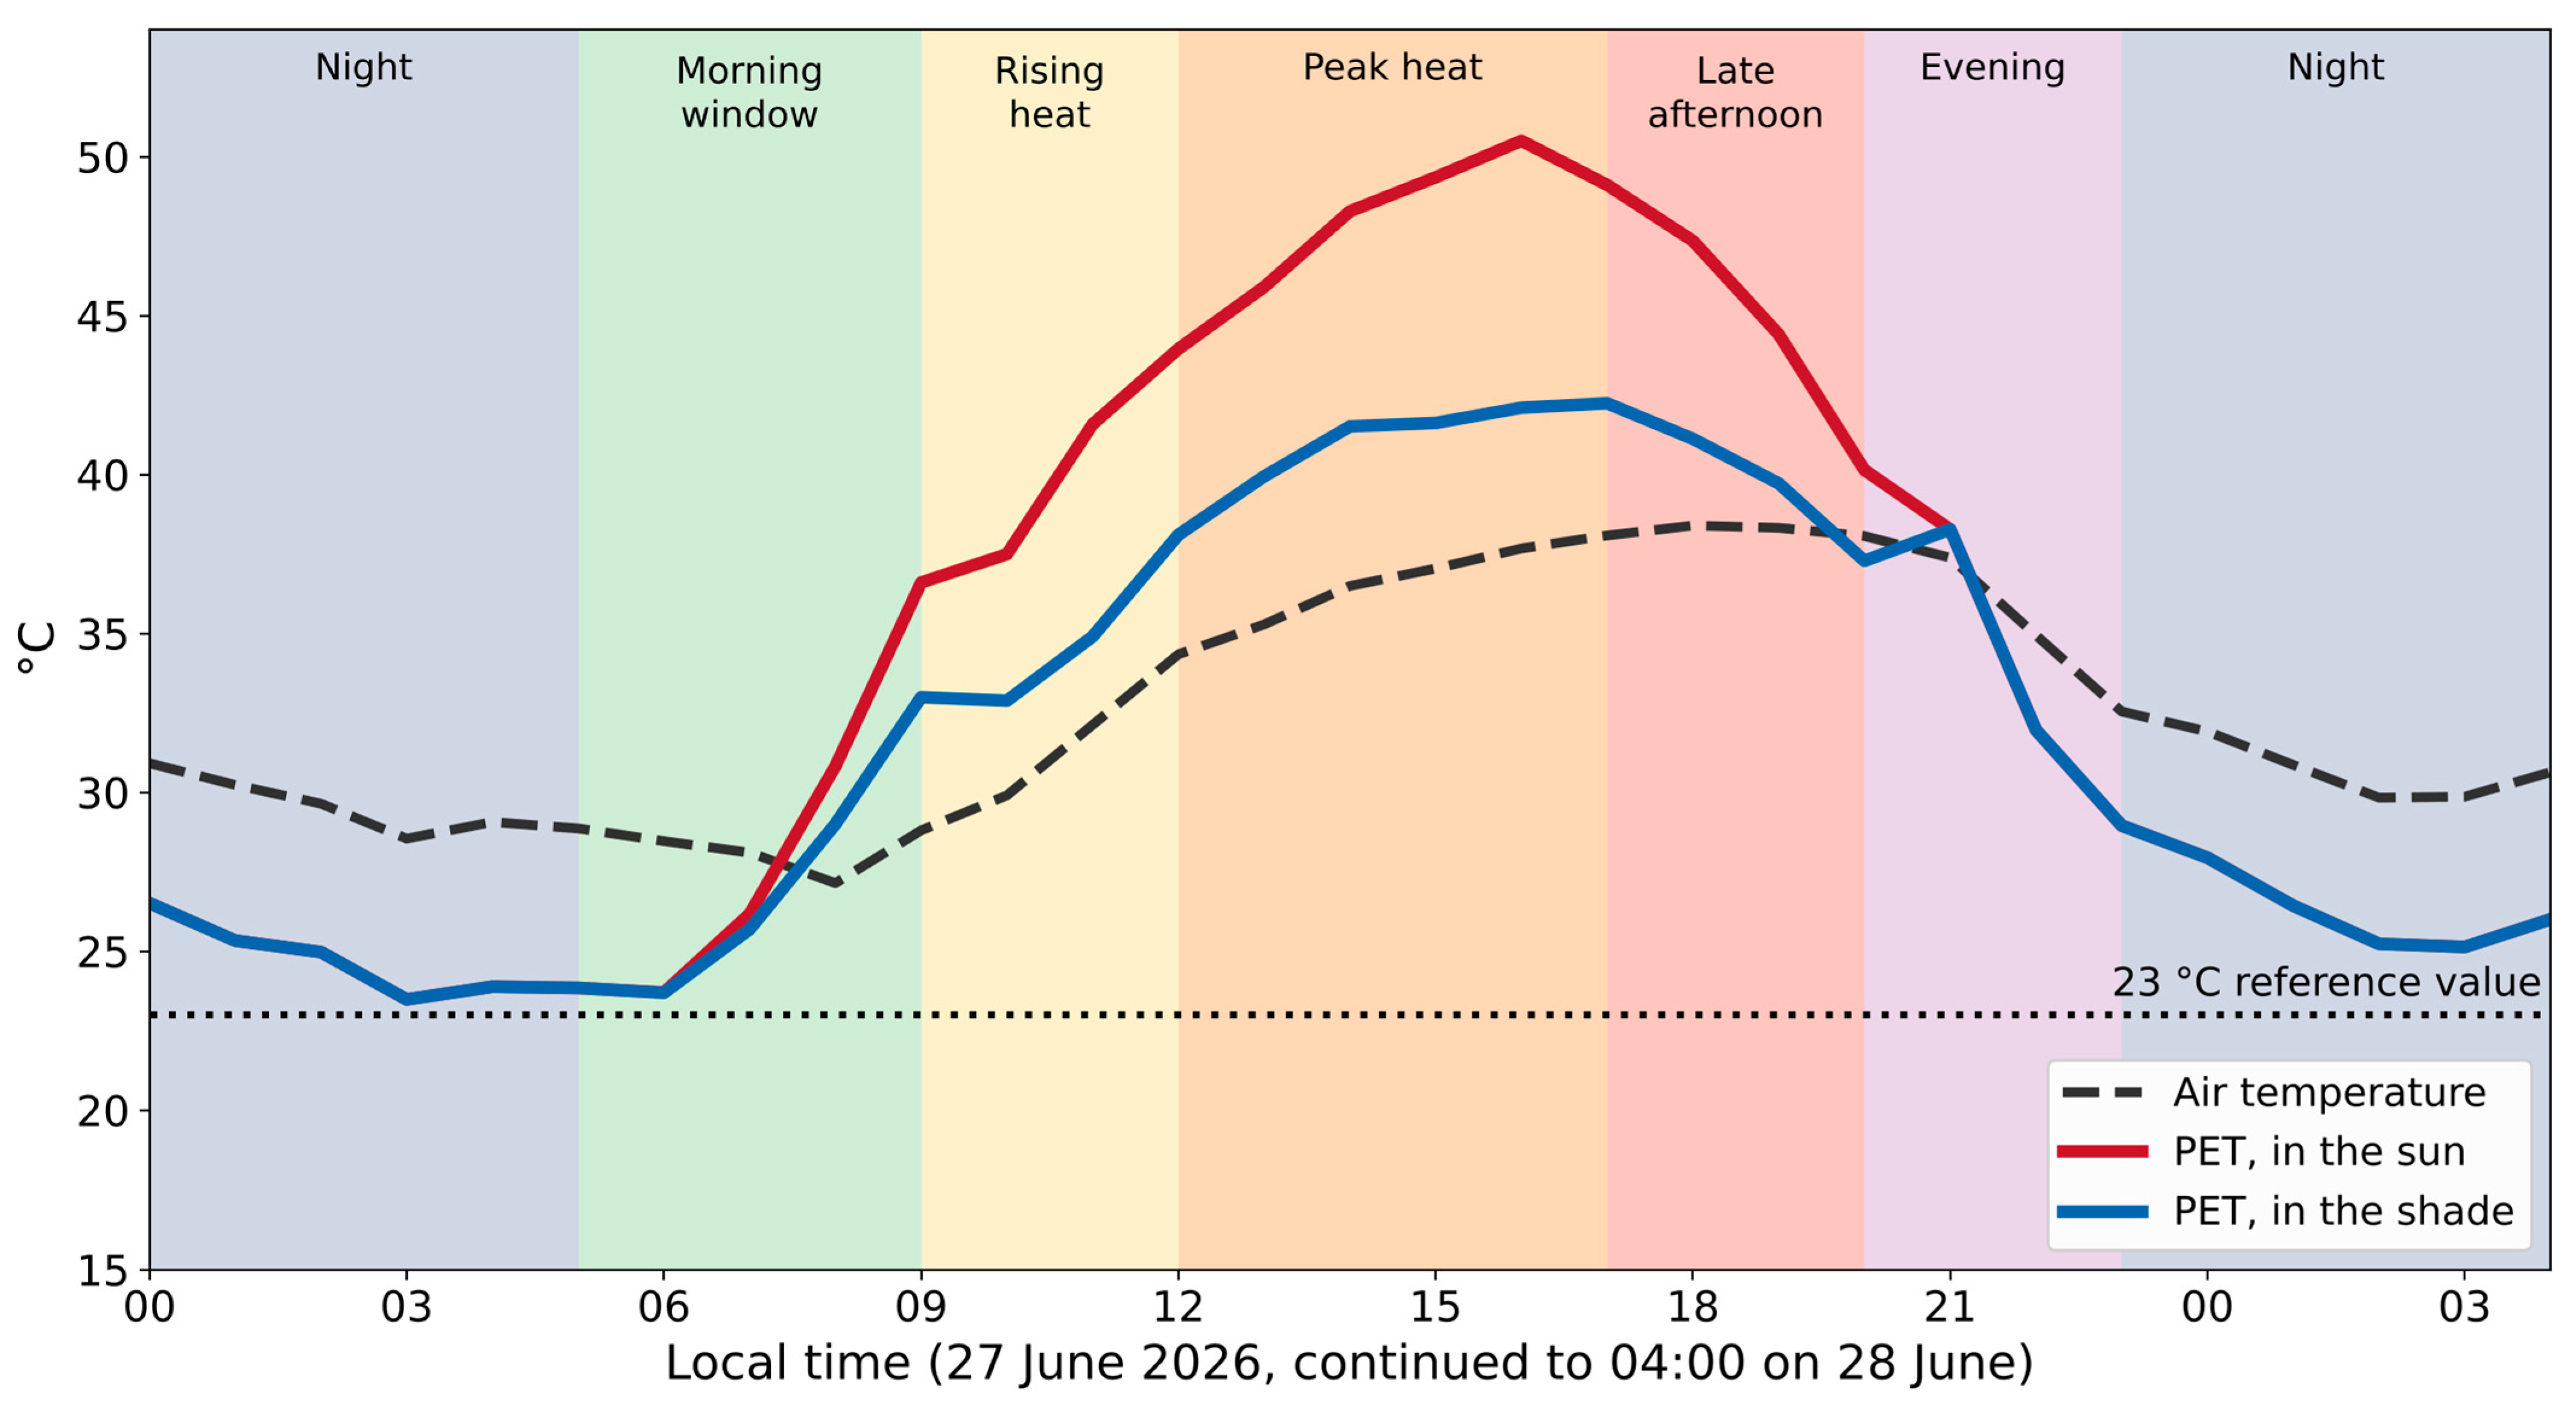
Passive measures such as night ventilation, thermal mass and external sun protection reduce overheating in buildings [31]. Across Europe, people have so far tolerated rising temperatures better than projections without adaptation assume, and better housing and wider access to air conditioning are the likely reasons [32]. The cool morning is a practical opportunity, and one of the cheapest available. Table 1 and Figure 1 summarise these phases and the actions recommended for each, using the hottest day of the June 2026 heat wave at the Freiburg roof station as an illustration. The times and the values belong to this place and this day. In another climate, in another season or at another latitude the phases shift, and the PET values with them. The value of 23 °C is used as a reference value for the border between comfortable and slightly warm conditions, not as a threshold for health.
Table 1.
Phases of a hot day, thermal context and recommended actions. PET and UTCI ranges (°C; in the sun and in the shade) were calculated from hourly measurements at the roof station of the University of Freiburg on 27 June 2026 (night: 27–28 June). They are illustrative of one hot day in one place and are not universal thresholds. PET stress classes follow [4,33].
Figure 1.
Observed course of air temperature and PET in the sun and in the shade at the roof station of the University of Freiburg on 27 June 2026, the hottest day of the June heat wave, with the phases of the day used in Table 1. PET was calculated from hourly measurements (air temperature, humidity, wind, global radiation) for a standard person; the dotted line marks the 23 °C reference value. The phases illustrate this day and place.
2.3. Air Conditioning: A Targeted Refuge, Not a 24-Hour Strategy
Mechanical cooling changes the thermal conditions of peak heat substantially, but it works best alongside passive and behavioural measures, not as their replacement. The practical sequence is simple: ventilate while conditions allow, shade the windows that catch the sun, cut unnecessary internal heat gains, and only then bring in mechanical cooling for what remains.
The right set point is a matter of comfort, health, energy use and the gap between indoor and outdoor temperature, not a fixed rule, and a large temperature contrast is not itself a sign of good protection. Simulation studies of night-time ventilation show the timing point: the cooling depends on the air flow during the night, on thermal mass and on internal heat gains, and natural ventilation works least well in the warm periods when it is needed most [31]. These recommendations are context-specific. The right sequence depends on climate, building, occupants and electricity supply, and not every household can follow it.
Access to mechanical cooling is also unequal. The households most exposed, in dense neighbourhoods and older housing, are often the ones least able to buy or run an air conditioner. That is a health-equity problem in its own right, and a planning one too, since cooling switched on everywhere at once strains the electricity grid precisely when it is most needed. Passive measures stay important even where mechanical cooling is available, not instead of it.
2.4. Indoors: Where the Heat Load Is Really Decided
For most people, most of a hot day happens indoors, and indoor conditions deserve the same attention as the street outside, not less, because heat stored in a building can outlast the afternoon that put it there [34]. A warning system built only on outdoor conditions misses a large part of what people actually experience.
Measurements from ten monitored workplaces in Freiburg during the hot summer of 2022 make the point directly. Indoor and outdoor exposure differed, and rooms with poor shading sat at moderate to strong heat stress for hours at a stretch [35]. Outdoor temperature alone would not have predicted this. The indoor situation is a different one from the outdoor situation for which PET and UTCI were designed, and the study used them as an exploratory step to describe indoor and outdoor exposure in one unit. For building overheating, tools developed for the indoor environment, such as operative temperature, adaptive comfort models and the overheating criteria of EN 16798-1 and ISO 17772-1, are the appropriate basis [7,8,10,11,34]. For workplaces with heat exposure, the occupational methods named in the Introduction apply.
Four things decide how much heat a building accumulates: how it faces the sun, what it is built from, which floor a room sits on, and how it is cooled. External shading, a well-designed roof and façade, insulation, and night ventilation can all keep heat out without running a machine continuously [36], and the same measures make a building more resilient the day the power goes out.
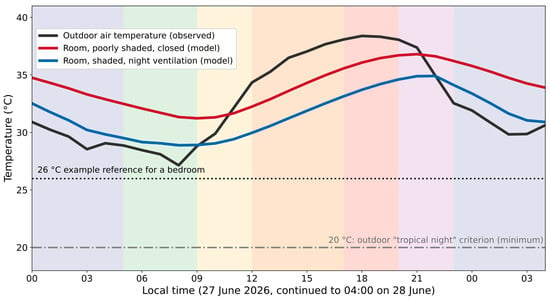
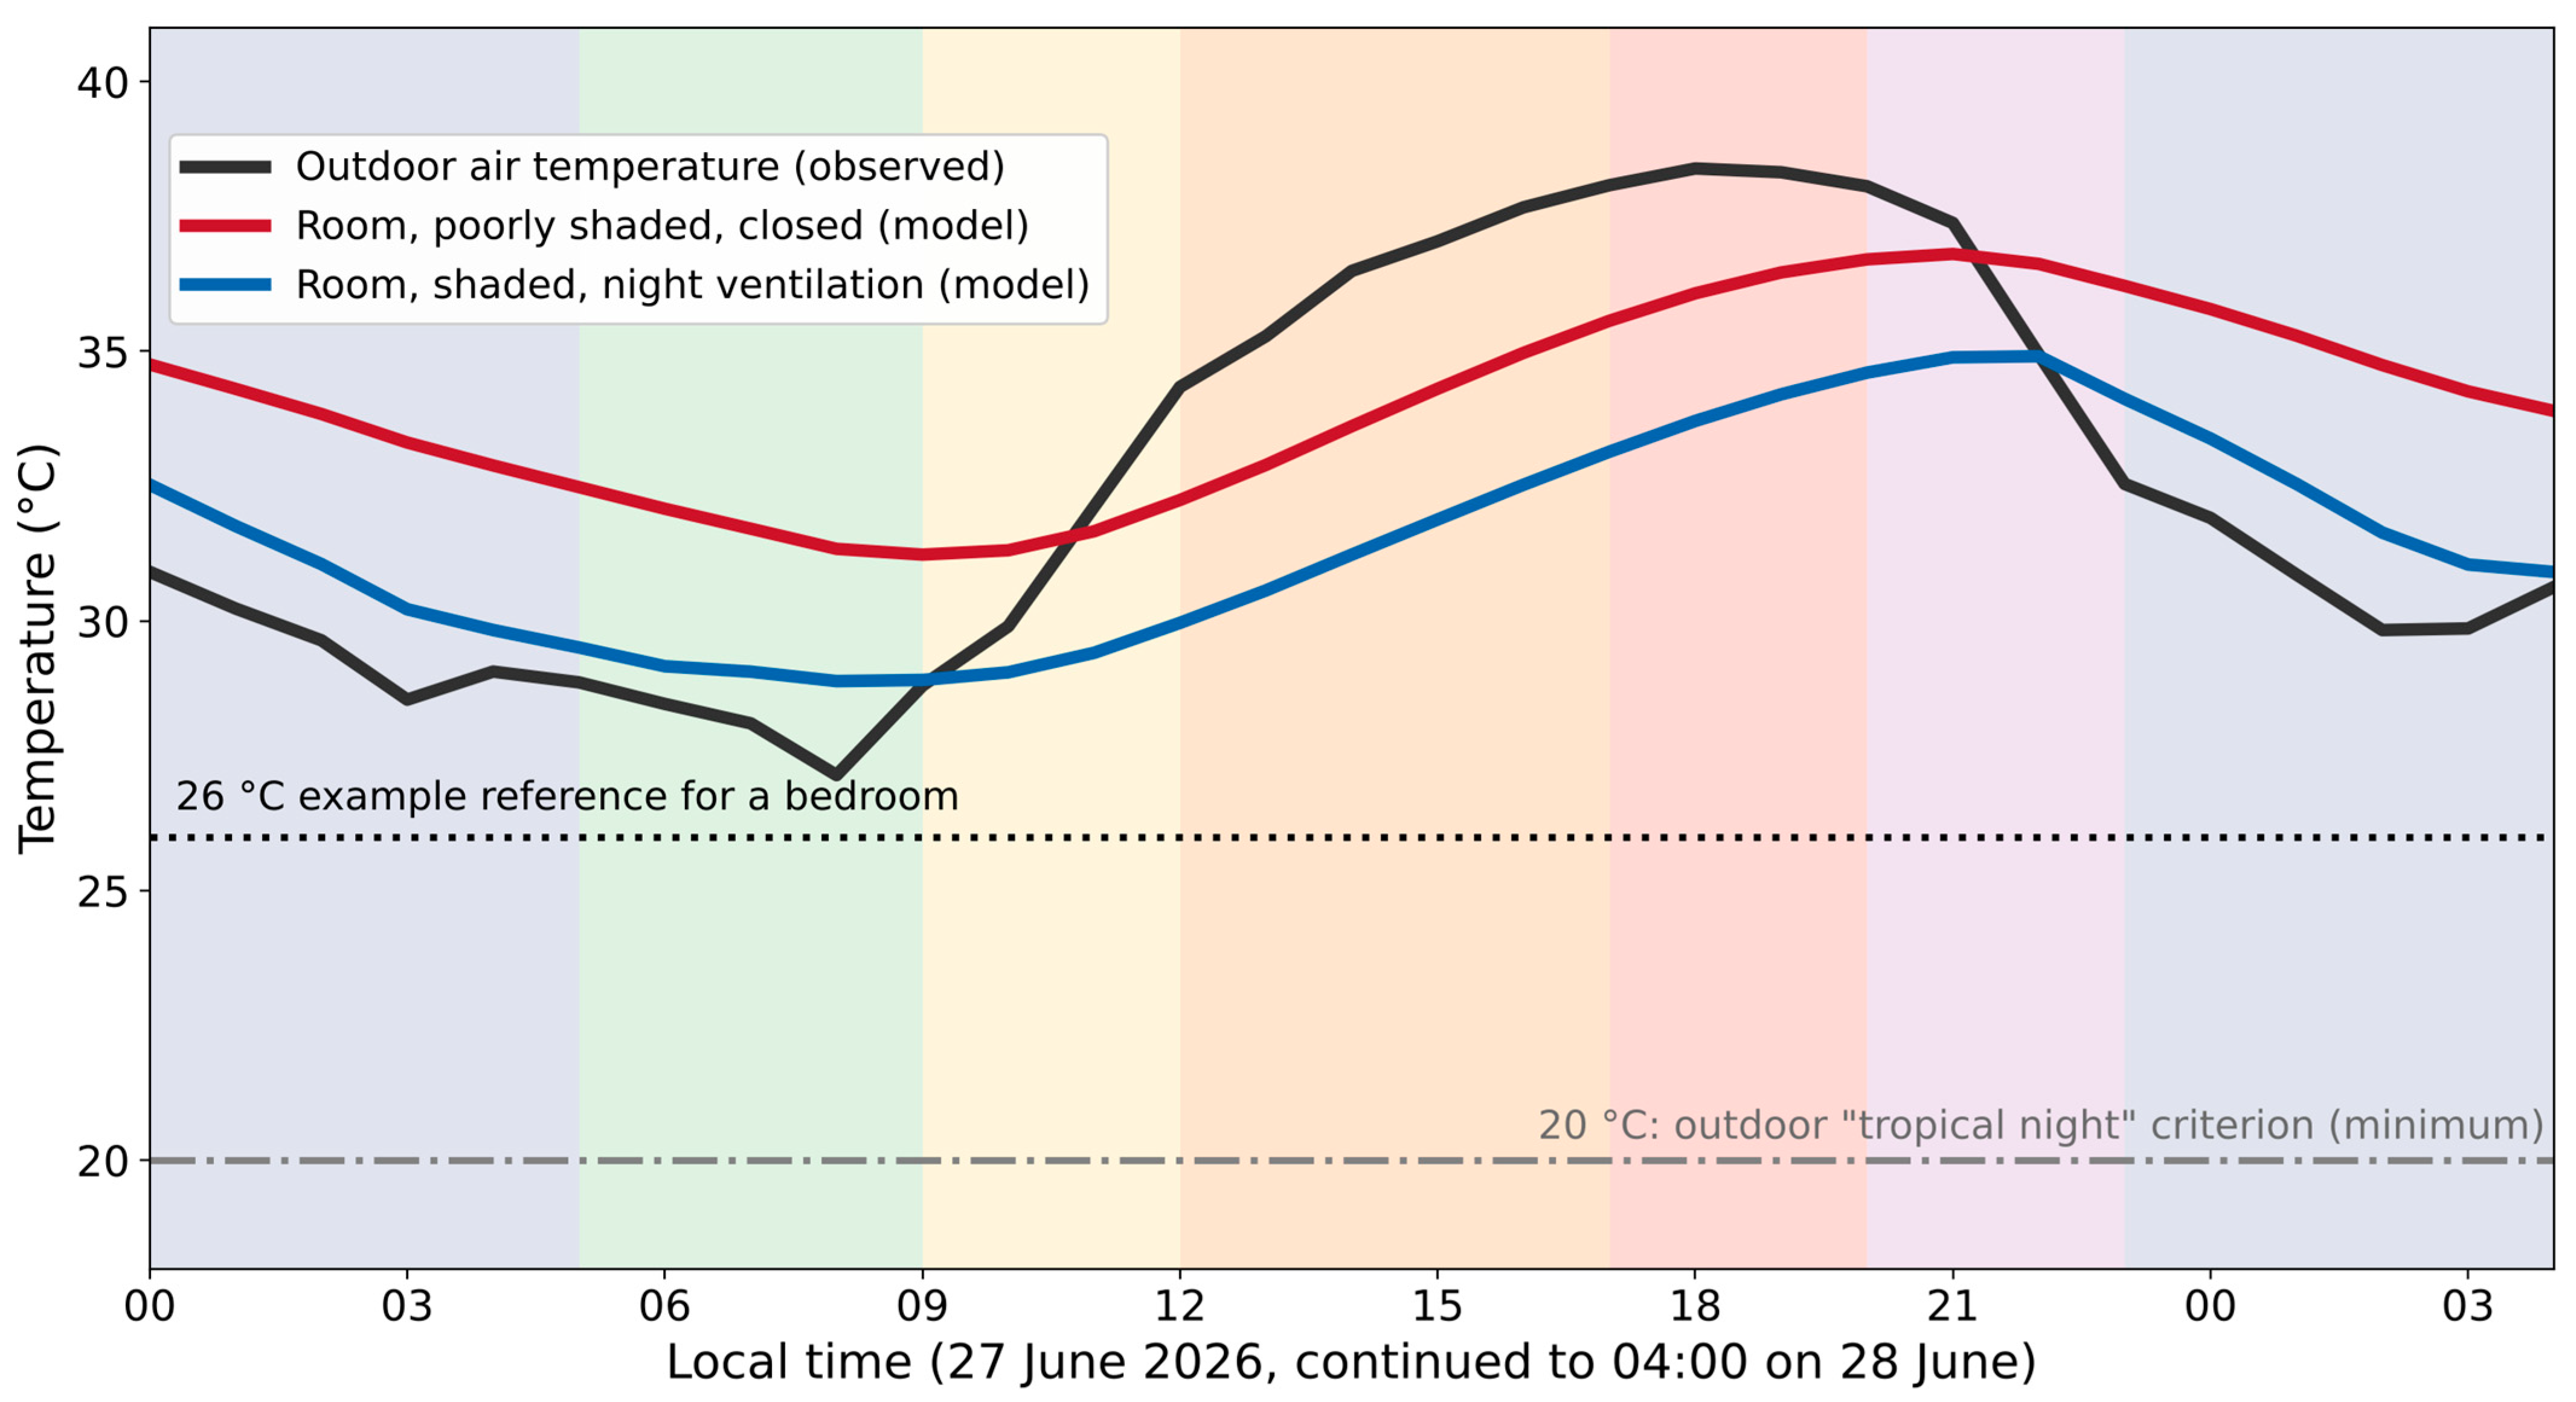
Indoor monitoring should be as routine as outdoor forecasting. A simple temperature and humidity reading already tells a household something useful, though a full assessment also needs operative temperature, air movement, activity and clothing to say anything precise [7,8]. Figure 2 illustrates this outdoor–indoor contrast with a simple building response model driven by the observed outdoor data.
Figure 2.
Outdoor air temperature (observed, roof station of the University of Freiburg, 27–28 June 2026) and indoor temperature of two illustrative rooms, calculated with a first-order building response model driven by the observed air temperature and global. The curves are a conceptual illustration of delayed indoor heat and lost night recovery, not measurements. The parameters were chosen for illustration and are not based on a specific building. Dotted line: example reference value for a bedroom; dash-dotted line: minimum-temperature criterion of the outdoor tropical night.
2.5. The Night: The Hours That Decide Recovery
The night is where recovery happens, or does not. Physiological recovery depends on the body’s ability to cool, and a warm night can carry the day’s strain straight through to the next morning, so heat does not simply reset at sunrise.
A tropical night is usually defined as a minimum air temperature at or above 20 °C. This is an outdoor criterion, measured at a weather station, and it says little about the room in which a person sleeps. A bedroom under a roof can stay far above the outdoor minimum, and a well-ventilated one can follow the outdoor air closely, as Figure 2 shows. In the June 2026 heat wave, the minimum air temperature at the roof station stayed above 26 °C from 26 to 28 June, far above the 20 °C of the criterion. Night-time overheating of dwellings has to be judged with indoor measurements and indoor criteria [10,34], and warm nights are linked to higher mortality in their own right [37]. In a city, stored heat in walls and pavement delays that cooling, and high humidity blunts what evaporative cooling remains available [38,39]. What a warm night actually costs a person depends on this whole combination, not on the minimum temperature alone.
Duration matters as much as any single peak. A run of hot days and warm nights erodes sleep and narrows the margin for recovery night after night, and vulnerability tends to build as a heat episode goes on rather than staying constant [40,41,42,43,44,45]. The night-time thresholds used in heat–health action plans vary widely between systems, and there is little evidence that they represent the same level of risk everywhere they are applied [46].
Heat–health action plans need to treat the night as a subject in its own right: protecting sleep, providing a cooler room or a public cooling space, and finding the people who have no way to cool their own home.
2.6. Vulnerability: The Same Day Is Not the Same for Everyone
The same day is not the same day for everyone. Age, health, occupation, housing and the freedom to change what you are doing all decide how much a given afternoon actually costs a body.
- Older adults, especially those living alone, often have a smaller margin: sweating and thirst respond later, medication can interfere with either, and there may be nobody nearby to notice when things go wrong [47,48,49];
- Infants and small children cannot regulate their own temperature well and cannot ask for help; they depend entirely on an adult noticing;
- People with heart or lung disease carry an extra physiological cost during heat, one that can interact with their medication in ways that are easy to miss;
- Outdoor workers add their own metabolic heat to whatever the weather is already delivering, often with little control over when the work happens;
- People who are socially isolated, in homes that do not cool well, are the ones most likely to be found too late, simply because nobody was checking.
These are not edge cases. Together they make up a large share of the population a heat–health action plan is actually meant to protect, and a plan built around a healthy adult who can rearrange their schedule, control their indoor thermal environment and afford to run an air conditioner will underestimate exactly the people it should be designed for [50,51].
The figures for 2026 show it. Of the roughly 16,000 heat-related deaths estimated by the Robert Koch Institute for Germany, about 8200 occurred in people aged 85 and older and about 1500 in people under 65 [22].
Housing decides as much as the person. A top-floor flat under an uninsulated roof, a single-aspect room without cross-ventilation, a home without external shading or a cool room, and a neighbourhood without trees, shade or a public cooling space put the same person at very different risk. In the 2003 heat wave in France, living on the top floor and poor thermal insulation were among the factors that raised the risk of death for elderly people living at home [52], and guidance on healthy housing makes the same link between dwelling, thermal conditions and health [53]. Housing quality, access to cooling and the conditions of the neighbourhood therefore belong next to age, health and occupation when vulnerability is assessed.
The indices have limits of their own. The standard PET and UTCI values and their stress classes refer to a reference person, a 35-year-old man, and the classes were derived for Western and Central Europe [4]. The models accept individual data, but these mainly adjust metabolic rate and body size. They do not describe age-related changes such as reduced sweating and lower skin blood flow [54], nor the effect of medication or chronic disease. Older people may therefore be under more strain than the index value suggests. A lower alert level for them is a sensible, if approximate, way to handle this, and a thermophysiological model that includes these changes is the better answer [55]. The stress classes also shift with climate and adaptation: in Taiwan, the PET ranges at which people felt neutral, warm or hot lay clearly above those found in Europe [33,56]. In another climate the classes should therefore be checked locally, with a survey of the population or with local health data, before they are used for warnings.
Thresholds used in occupational and public-health guidance need to be read with this in mind. A single number rarely carries the same risk for every population it is applied to [50]. For workplaces, the occupational standards and the Predicted Heat Strain model remain the basis, because they include metabolic rate (ISO 8996) [57], work intensity, clothing insulation and evaporative resistance (ISO 9920) [58] and exposure time [8,15]. What human biometeorology can add is a population-specific assessment, treated as a starting point for judgement rather than a clinical cut-off. Table 2 summarises practical protective measures for each of these groups.
Table 2.
Vulnerable population groups and practical heat–health measures. Thresholds are not universal clinical limits and should be adapted to the population, climate, exposure setting, and relevant guidance. The indicators in the third column are examples of environmental information; they are not substitutes for occupational heat stress methods (for example ISO 7933 and ISO 7243 [12,13]) or for clinical assessment. Sources: Older adults [47,48,49]; young children [47,48]; outdoor workers [26,51]; chronic illness [48,49]; socially isolated people [48,52].
2.7. When the Machine Fails: What Remains Without Power
Heat adaptation also has to survive the day the power fails. The blackout across the Iberian Peninsula on 28 April 2025 [59] was a reminder of how completely modern life leans on electricity, for cooling, for communication, for healthcare, for nearly everything that keeps a hot day manageable.
When mechanical cooling goes out at the worst possible moment, what is left is whatever was built passively into the place beforehand: shade, cross-ventilation, thermal mass, reflective surfaces, a tree outside the window. None of it needs power.
This is the case for passive survivability. A building that stays reasonably liveable without electricity is more resilient in a heat wave than one whose safety depends entirely on a compressor that may or may not still be running. It is also the strongest argument for building this into design and retrofit now, rather than after the next outage makes the case for us.
2.8. From the Day to the City: Shade, Warning and Neighbourhood
A single day becomes a city’s problem once enough people are exposed to it at the same time. A heat–health warning gives the first signal, but acting on it needs more than the warning itself: timing, indoor conditions, the night ahead, and where the nearest cool space actually is [60,61,62].
Shade does more of the work than most people expect, because human thermal stress answers to radiation more than to air temperature [63,64]. Removing a single tree measurably increases the hours of heat stress across a year, and a tree’s shade can cut the mean radiant temperature far more than it cuts the air temperature nearby [65,66].
Urban heat adaptation works best as a combination: shade and ventilation together with building form, surface choice and where the footpaths actually run. Trees, reflective surfaces, buildings oriented to let the wind through, all of these reduce thermal stress while making the street a better place to be regardless of the weather [66,67].
The social side of this matters just as much as the physical side. A neighbour who checks on someone living alone gives a protection that no index or building technology provides. Recent field and modelling work supports this for trees and shade: placement, not just quantity, decides how much good they do where people actually walk [68,69].
3. Discussion
This perspective does not propose a new thermal index or another warning threshold. It proposes the day itself as the unit of analysis, as the frame that links outdoor conditions, the indoor thermal environment, behaviour and physiological recovery together. For adaptation, the heat wave is too coarse a unit; the sequence of exposure and recovery across a single day is more useful.
Warning systems built on outdoor conditions and actual human exposure do not match well. People move between the street, the workplace, home and a care facility, and each of these has its own thermal environment. Heat stored indoors can outlast the afternoon that caused it, and a warm night can remove the one recovery period that would otherwise separate one hot day from the next [35].
For heat–health action plans, this has a direct consequence. A plan that ends at a warning threshold treats a hot day as a single number. Effective adaptation is a sequence of decisions: when to ventilate, when to shade, when to slow down, when to switch on cooling, who to check on, and how to protect the night [61]. Building codes and retrofit programmes should be judged not only by the daytime peak they are designed against, but by whether a dwelling can actually cool down after dark.
The limits of this approach should be stated. It is a conceptual argument built on published measurements and reviews, not a new empirical study, and the right timing for any of these actions depends on climate, construction, air quality, humidity, culture, occupation and individual health. The Freiburg day is one example: in hotter, more humid or colder climates the phases, the PET classes and the best actions differ, and the framework has to be filled in locally. PET and UTCI are useful, but neither is a clinical threshold. No thermal index describes a health outcome by itself. PET and UTCI describe how severe an environment is for the body. Physiological strain, such as core temperature and dehydration over a work shift, is the field of models such as the Predicted Heat Strain model [15,55], and clinical outcomes need clinical judgement. Three levels should therefore be kept apart: the environment (indices such as PET, UTCI or operative temperature), the strain on the body (physiological models) and the health outcome (clinical and epidemiological evidence). The day framework works on the first level and helps people to decide what to do, as an addition to heat–health guidance. It does not replace the methods and standards for indoor spaces and workplaces, and it organises existing evidence rather than replacing guidance built for a specific population.
Its value is practical: it gives a weather forecast a route into building operation, work scheduling, household habit, neighbourhood design and the simple act of looking in on someone. It also keeps recovery visible, which a single daytime number cannot do. Avoiding the midday peak means little if the bedroom is still warm at midnight.
4. Conclusions
Heat adaptation is better understood as managing a cumulative load across an entire day than as a response to a single extreme. The measures that work best combine passive building design, the timing of daily activity, cooling at night, and support from neighbours, not any one of these alone.
Human biometeorology gives this a scientific basis: a way of holding atmospheric conditions, the building, behaviour and recovery together, and connecting outdoor thermal indices, together with the established indoor and occupational standards, to the decisions made by a household, a workplace, a care facility or a city.
Adaptation succeeds when the people most at risk keep the chance to recover every night, whatever their age, health, housing or circumstances. A climate-resilient city therefore takes the human body as its measure: how people live in its buildings and streets, and how they recover in them, day after day. This is also why we are not powerless in the face of heat [70]: adaptation means ordinary days that are planned well.
Funding
This research received no external funding.
Institutional Review Board Statement
Not applicable.
Informed Consent Statement
Not applicable.
Data Availability Statement
No new measurement data were created in this perspective. The hourly data of the roof station of the University of Freiburg (26–28 June 2026) used for Table 1 and Figure 1 and Figure 2, the PET and UTCI values calculated from them (Python packages biometeo Version 0.5.2 and pythermalcomfort Version 4.6.1). The measurement data referred to in the text are available in the cited publications.
Acknowledgments
During the preparation of this manuscript, the author used Claude (Anthropic) for language editing, structural revision, and reference-list verification. The author reviewed and edited all AI-assisted output and takes full responsibility for the content of this publication.
Conflicts of Interest
The author declares no conflicts of interest.
References
- Matzarakis, A. Heat, UV radiation, and other related atmospheric stressors: Exposure pathways, health effects, and adaptation needs. Meteorology 2026, 5, 19. [Google Scholar] [CrossRef] [Scilit]
- Adams, F., Translator; The Genuine Works of Hippocrates, On Airs, Waters, and Places; Sydenham Society: London, UK, 1849. [Google Scholar]
- Höppe, P. The physiological equivalent temperature—A universal index for the biometeorological assessment of the thermal environment. Int. J. Biometeorol. 1999, 43, 71–75. [Google Scholar] [CrossRef] [Scilit] [PubMed]
- Matzarakis, A.; Mayer, H.; Iziomon, M.G. Applications of a universal thermal index: Physiological equivalent temperature. Int. J. Biometeorol. 1999, 43, 76–84. [Google Scholar] [CrossRef] [Scilit] [PubMed]
- Bröde, P.; Fiala, D.; Błažejczyk, K.; Holmér, I.; Jendritzky, G.; Kampmann, B.; Tinz, B.; Havenith, G. Deriving the operational procedure for the Universal Thermal Climate Index (UTCI). Int. J. Biometeorol. 2012, 56, 481–494. [Google Scholar] [CrossRef] [Scilit] [PubMed]
- VDI 3787 Part 2; Environmental Meteorology—Methods for Human-Biometeorological Evaluation of the Thermal Component of the Climate. Verein Deutscher Ingenieure: Düsseldorf, Germany, 2022.
- Yao, R.; Zhang, S.; Du, C.; Schweiker, M.; Hodder, S.; Olesen, B.W.; Toftum, J.; Romana d’Ambrosio, F.; Gebhardt, H.; Zhou, S.; et al. Evolution and performance analysis of adaptive thermal comfort models—A comprehensive literature review. Build. Environ. 2022, 217, 109020. [Google Scholar] [CrossRef] [Scilit]
- d’Ambrosio Alfano, F.R.; Palella, B.I.; Riccio, G. Standardized indices for the assessment of indoor thermal environments: Background, application and perspectives. Energies 2026, 19, 3894. [Google Scholar] [CrossRef] [Scilit]
- ISO 7730:2025; Ergonomics of the Thermal Environment—Analytical Determination and Interpretation of Thermal Comfort Using Calculation of the PMV and PPD Indices and Local Thermal Comfort. International Organization for Standardization: Geneva, Switzerland, 2025.
- EN 16798-1:2019; Energy Performance of Buildings—Ventilation for Buildings—Part 1: Indoor Environmental Input Parameters for Design and Assessment of Energy Performance of Buildings Addressing Indoor Air Quality, Thermal Environment, Lighting and Acoustics—Module M1-6. European Committee for Standardization: Brussels, Belgium, 2019.
- ISO 17772-1:2017; Energy Performance of Buildings—Indoor Environmental Quality—Part 1: Indoor Environmental Input Parameters for the Design and Assessment of Energy Performance of Buildings. International Organization for Standardization: Geneva, Switzerland, 2017.
- ISO 7933:2023; Ergonomics of the Thermal Environment—Analytical Determination and Interpretation of Heat Stress Using Calculation of the Predicted Heat Strain. International Organization for Standardization: Geneva, Switzerland, 2023.
- ISO 7243:2017; Ergonomics of the Thermal Environment—Assessment of Heat Stress Using the WBGT (Wet Bulb Globe Temperature) Index. International Organization for Standardization: Geneva, Switzerland, 2017.
- ISO 15265:2004; Ergonomics of the Thermal Environment—Risk Assessment Strategy for the Prevention of Stress or Discomfort in Thermal Working Conditions. International Organization for Standardization: Geneva, Switzerland, 2004.
- Malchaire, J.B.; Piette, A.; Kampmann, B.; Mehnert, P.; Gebhardt, H.J.; Havenith, G.; Den Hartog, E.; Holmer, I.; Parsons, K.C.; Alfano, G.; et al. Development and validation of the predicted heat strain model. Ann. Occup. Hyg. 2001, 45, 123–135. [Google Scholar] [CrossRef] [Scilit]
- de Freitas, C.R.; Grigorieva, E.A. A comprehensive catalogue and classification of human thermal climate indices. Int. J. Biometeorol. 2015, 59, 109–120. [Google Scholar] [CrossRef] [Scilit] [PubMed]
- de Freitas, C.R.; Grigorieva, E.A. A comparison and appraisal of a comprehensive range of human thermal climate indices. Int. J. Biometeorol. 2017, 61, 487–512. [Google Scholar] [CrossRef] [Scilit] [PubMed]
- Staiger, H.; Laschewski, G.; Matzarakis, A. Selection of appropriate thermal indices for applications in human biometeorological studies. Atmosphere 2019, 10, 18. [Google Scholar] [CrossRef] [Scilit]
- Robine, J.-M.; Cheung, S.L.K.; Le Roy, S.; Van Oyen, H.; Griffiths, C.; Michel, J.-P.; Herrmann, F.R. Death toll exceeded 70,000 in Europe during the summer of 2003. Comptes Rendus. Biol. 2008, 331, 171–178. [Google Scholar] [CrossRef] [Scilit] [PubMed]
- Ballester, J.; Quijal-Zamorano, M.; Méndez Turrubiates, R.F.; Pegenaute, F.; Herrmann, F.R.; Robine, J.M.; Basagaña, X.; Tonne, C.; Antó, J.M.; Achebak, H. Heat-related mortality in Europe during the summer of 2022. Nat. Med. 2023, 29, 1857–1866, Correction in Nat. Med. 2024, 30, 603. [Google Scholar] [CrossRef] [Scilit] [PubMed]
- Ballester, J.; Quijal-Zamorano, M.; Méndez Turrubiates, R.F.; Pegenaute, F.; Herrmann, F.R.; Robine, J.-M.; Achebak, H. Heat-related mortality in Europe: Multi-country estimates for 2022, 2023 and 2024. Nat. Med. 2025, 31, 4065–4074. [Google Scholar]
- Koch-Institut, R. Wochenbericht zur Hitzebedingten Mortalität, Kalenderwoche 37/2026 (07.09. Bis 13.09.2026), Stand 24.09.2026; Robert Koch-Institut: Berlin, Germany, 2026. Available online: https://www.rki.de/DE/Themen/Gesundheit-und-Gesellschaft/Gesundheitliche-Einflussfaktoren-A-Z/H/Hitze/Bericht_Hitzemortalitaet.html (accessed on 11 October 2026).
- Emerton, R.; Nicolas, J.; Lombardi, A.; Di Napoli, C. Global heat stress intensification and its expanding footprint on the human population. Nat. Clim. Change 2026, 16, 989–996. [Google Scholar] [CrossRef] [Scilit]
- Pantavou, K.; Fillon, A.; Li, L.; Maniadis, Z.; Nikolopoulos, G.K. Thermal indices for assessing the impact of outdoor thermal environments on human health: A systematic review of epidemiological studies. Int. J. Biometeorol. 2025, 69, 1843–1866. [Google Scholar] [CrossRef] [Scilit] [PubMed]
- Barnett, A.G.; Tong, S.; Clements, A.C.A. What measure of temperature is the best predictor of mortality? Environ. Res. 2010, 110, 604–611. [Google Scholar] [CrossRef] [Scilit] [PubMed]
- Cheung, S.S.; Lee, J.K.W.; Oksa, J. Thermal stress, human performance, and physical employment standards. Appl. Physiol. Nutr. Metab. 2016, 41, S148–S164. [Google Scholar] [CrossRef] [Scilit] [PubMed]
- Bahadori, M.N. Passive cooling systems in Iranian architecture. Sci. Am. 1978, 238, 144–154. [Google Scholar] [CrossRef] [Scilit]
- Xenophon. Memorabilia, Oeconomicus, Symposium, Apology; Marchant, E.C., Translator; Loeb Classical Library; Book III, Chapter 8; William Heinemann: London, UK, 1923. [Google Scholar]
- Mayer, H.; Holst, J.; Dostal, P.; Imbery, F.; Schindler, D. Human thermal comfort in summer within an urban street canyon in Central Europe. Meteorol. Z. 2008, 17, 241–250. [Google Scholar] [CrossRef] [Scilit] [PubMed]
- Nicol, F.; Humphreys, M.; Roaf, S. Adaptive Thermal Comfort: Principles and Practice; Routledge: London, UK, 2012. [Google Scholar]
- Artmann, N.; Manz, H.; Heiselberg, P. Parameter study on performance of building cooling by night-time ventilation. Renew. Energy 2008, 33, 2589–2598. [Google Scholar] [CrossRef] [Scilit]
- Walkowiak, M.P.; Bandurski, K.; Walkowiak, J.; Walkowiak, D. Outpacing climate change: Adaptation to heatwaves in Europe. Int. J. Biometeorol. 2025, 69, 989–1002. [Google Scholar] [CrossRef] [Scilit] [PubMed]
- Lin, T.-P.; Matzarakis, A. Tourism climate and thermal comfort in Sun Moon Lake, Taiwan. Int. J. Biometeorol. 2008, 52, 281–290. [Google Scholar] [CrossRef] [Scilit] [PubMed]
- Lomas, K.J.; Porritt, S.M. Overheating in buildings: Lessons from research. Build. Res. Inf. 2017, 45, 1–18. [Google Scholar] [CrossRef] [Scilit]
- Shevchenko, O.; Sulzer, M.; Christen, A.; Matzarakis, A. Coupling indoor and outdoor heat stress during the hot summer of 2022: A case study of Freiburg, Germany. Atmosphere 2025, 16, 167. [Google Scholar] [CrossRef] [Scilit]
- Kumar, A.; Suman, B.M. Experimental evaluation of insulation materials for walls and roofs and their impact on indoor thermal comfort under composite climate. Build. Environ. 2013, 59, 635–643. [Google Scholar] [CrossRef] [Scilit]
- Murage, P.; Hajat, S.; Kovats, R.S. Effect of night-time temperatures on cause and age-specific mortality in London. Environ. Epidemiol. 2017, 1, e005. [Google Scholar] [CrossRef] [Scilit] [PubMed]
- Oke, T.R. The energetic basis of the urban heat island. Q. J. R. Meteorol. Soc. 1982, 108, 1–24. [Google Scholar] [CrossRef] [Scilit]
- Davis, R.E.; McGregor, G.R.; Enfield, K.B. Humidity: A review and primer on atmospheric moisture and human health. Environ. Res. 2016, 144, 106–116. [Google Scholar] [CrossRef] [Scilit] [PubMed]
- Davy, R.; Esau, I.; Chernokulsky, A.; Outten, S.; Zilitinkevich, S. Diurnal asymmetry to the observed global warming. Int. J. Climatol. 2017, 37, 79–93. [Google Scholar] [CrossRef] [Scilit]
- Barriopedro, D.; Fischer, E.M.; Luterbacher, J.; Trigo, R.M.; García-Herrera, R. The hot summer of 2010: Redrawing the temperature record map of Europe. Science 2011, 332, 220–224. [Google Scholar] [CrossRef] [Scilit] [PubMed]
- Feser, F.; van Garderen, L.; Hansen, F. The summer heatwave 2022 over Western Europe: An attribution to anthropogenic climate change. Bull. Am. Meteorol. Soc. 2024, 105, E2175–E2179. [Google Scholar] [CrossRef] [Scilit]
- Fouillet, A.; Rey, G.; Laurent, F.; Pavillon, G.; Bellec, S.; Guihenneuc-Jouyaux, C.; Clavel, J.; Jougla, E.; Hémon, D. Excess mortality related to the August 2003 heat wave in France. Int. Arch. Occup. Environ. Health 2006, 80, 16–24. [Google Scholar] [CrossRef] [Scilit] [PubMed]
- Urban, A.; Hanzlíková, H.; Kyselý, J.; Plavcová, E. Impacts of the 2015 heat waves on mortality in the Czech Republic—A comparison with previous heat waves. Int. J. Environ. Res. Public Health 2017, 14, 1562. [Google Scholar] [CrossRef] [Scilit] [PubMed]
- Baniassad Asli, N.; Haddadi, H.; Seyedian, S.M. Effects of heatwaves and tropical nights on sleep in middle-aged and older adults: A scoping review. Clocks Sleep 2025, 8, 37. [Google Scholar] [CrossRef] [Scilit] [PubMed]
- Deng, J.; Liu, J.; Gou, Z.; Xia, L. Action on hot nights: A scoping review of nighttime heat thresholds in heat-health action plans. Urban Clim. 2026, 61, 102388. [Google Scholar]
- Kovats, R.S.; Hajat, S. Heat stress and public health: A critical review. Annu. Rev. Public Health 2008, 29, 41–55. [Google Scholar] [CrossRef] [Scilit] [PubMed]
- Hajat, S.; O’Connor, M.; Kosatsky, T. Health effects of hot weather: From awareness of risk factors to effective health protection. Lancet 2010, 375, 856–863. [Google Scholar] [CrossRef] [Scilit] [PubMed]
- Bunker, A.; Wildenhain, J.; Vandenbergh, A.; Henschke, N.; Rocklöv, J.; Hajat, S.; Sauerborn, R. Effects of air temperature on climate-sensitive mortality and morbidity outcomes in the elderly: A systematic review and meta-analysis of epidemiological evidence. eBioMedicine 2016, 6, 258–268. [Google Scholar] [CrossRef] [Scilit] [PubMed]
- Monteiro, A.; Carvalho, V.; Góis, J.; Sousa, C. Vulnerable to heat stress: Gaps in international standard metric thresholds for sensitive populations. Int. J. Biometeorol. 2024, 68, 2495–2506. [Google Scholar] [CrossRef] [Scilit] [PubMed]
- World Health Organization; World Meteorological Organization. Heat Stress and Working in a Warming World; World Health Organization: Geneva, Switzerland, 2025. [Google Scholar]
- Vandentorren, S.; Bretin, P.; Zeghnoun, A.; Mandereau-Bruno, L.; Croisier, A.; Cochet, C.; Ribéron, J.; Siberan, I.; Declercq, B.; Ledrans, M. August 2003 heat wave in France: Risk factors for death of elderly people living at home. Eur. J. Public Health 2006, 16, 583–591. [Google Scholar] [CrossRef] [Scilit] [PubMed]
- Ormandy, D.; Ezratty, V. Health and thermal comfort: From WHO guidance to housing strategies. Energy Policy 2012, 49, 116–121. [Google Scholar] [CrossRef] [Scilit]
- Kenny, G.P.; Yardley, J.; Brown, C.; Sigal, R.J.; Jay, O. Heat stress in older individuals and patients with common chronic diseases. Can. Med. Assoc. J. 2010, 182, 1053–1060. [Google Scholar] [CrossRef] [Scilit] [PubMed]
- Havenith, G.; Fiala, D. Thermal indices and thermophysiological modeling for heat stress. Compr. Physiol. 2016, 6, 255–302. [Google Scholar] [CrossRef] [Scilit]
- Lin, T.-P.; de Dear, R.; Hwang, R.-L. Effect of thermal adaptation on seasonal outdoor thermal comfort. Int. J. Climatol. 2011, 31, 302–312. [Google Scholar] [CrossRef] [Scilit]
- ISO 8996:2021; Ergonomics of the Thermal Environment—Determination of Metabolic Rate. International Organization for Standardization: Geneva, Switzerland, 2021.
- ISO 9920:2007; Ergonomics of the Thermal Environment—Estimation of Thermal Insulation and Water Vapour Resistance of a Clothing Ensemble. International Organization for Standardization: Geneva, Switzerland, 2007.
- ENTSO-E. Final Report on the Grid Incident in Spain and Portugal on 28 April 2025; European Network of Transmission System Operators for Electricity: Brussels, Belgium, 2026; Available online: https://www.entsoe.eu/publications/blackout/28-april-2025-iberian-blackout/ (accessed on 11 October 2026).
- WHO Regional Office for Europe. Heat–Health Action Plans: Guidance; Matthies, F., Bickler, G., Cardeñosa Marín, N., Hales, S., Eds.; WHO Regional Office for Europe: Copenhagen, Denmark, 2008. [Google Scholar]
- Matzarakis, A.; Giannaros, C. Toward the next-generation of heat-health warning systems and action plans. Atmosphere 2025, 16, 938. [Google Scholar] [CrossRef] [Scilit]
- Casanueva, A.; Burgstall, A.; Kotlarski, S.; Messeri, A.; Morabito, M.; Flouris, A.D.; Nybo, L.; Spirig, C.; Schwierz, C. Overview of existing heat-health warning systems in Europe. Int. J. Environ. Res. Public Health 2019, 16, 2657. [Google Scholar] [CrossRef] [Scilit] [PubMed]
- Thorsson, S.; Rocklöv, J.; Konarska, J.; Lindberg, F.; Holmer, B.; Dousset, B.; Rayner, D. Mean radiant temperature—A predictor of heat related mortality. Urban Clim. 2014, 10, 332–345. [Google Scholar] [CrossRef] [Scilit]
- Kántor, N.; Unger, J. The most problematic variable in the course of human-biometeorological comfort assessment—The mean radiant temperature. Cent. Eur. J. Geosci. 2011, 3, 90–100. [Google Scholar] [CrossRef] [Scilit]
- Streiling, S.; Matzarakis, A. Influence of single and small clusters of trees on the bioclimate of a city: A case study. J. Arboric. 2003, 29, 309–316. [Google Scholar] [CrossRef] [Scilit]
- Lee, H.; Mayer, H.; Chen, L. Contribution of trees and grasslands to the mitigation of human heat stress in a residential district of Freiburg, Southwest Germany. Landsc. Urban Plan. 2016, 148, 37–50. [Google Scholar] [CrossRef] [Scilit]
- Erell, E.; Pearlmutter, D.; Boneh, D.; Bar Kutiel, P. Effect of high-albedo materials on pedestrian heat stress in urban street canyons. Urban Clim. 2014, 10, 367–386. [Google Scholar] [CrossRef] [Scilit]
- Jo, S.; Park, S. The shading effect of single trees on human thermal sensation during summer: A case study in Jeju, Republic of Korea. Int. J. Biometeorol. 2025, 69, 1003–1014. [Google Scholar] [CrossRef] [Scilit] [PubMed]
- Lenzholzer, S.; van der Hoeven, F. Heat stress in social housing districts: Tree cover–built form interaction and mitigation potential. Build. Cities 2025, 6, 1–18. [Google Scholar] [CrossRef] [Scilit]
- Matzarakis, A. Responding to heat: Why we are not powerless. Atmosphere 2026, 17, 267. [Google Scholar] [CrossRef] [Scilit]

Disclaimer/Publisher’s Note: The statements, opinions and data contained in all publications are solely those of the individual author(s) and contributor(s) and not of MDPI and/or the editor(s). MDPI and/or the editor(s) disclaim responsibility for any injury to people or property resulting from any ideas, methods, instructions or products referred to in the content. |
© 2026 by the author. Licensee MDPI, Basel, Switzerland. This article is an open access article distributed under the terms and conditions of the Creative Commons Attribution (CC BY) license.