


Abstract
The summer of 2012 in Europe was characterized by sharp contrasts in precipitation. The United Kingdom recorded its wettest summer season (June–August) since 1912. Spain faced drought and wildfires, as summer precipitation levels there were the second lowest in the last 60 years. These anomalies demonstrate an unexpectedly rapid northward shift of the precipitation zone across Europe. The shift contradicted, however, prevailing climate change projections, according to which severe summer drying across the continent and a slower trend toward increased wetting of northern Europe have been expected. The physical mechanisms responsible for the extreme trend remain not clear. It is worth noting that a significant part of 2012 summer precipitation occurred from mid-June to mid-July. Hurricane Chris and Tropical Storm Debby also formed in the North Atlantic in June of that year. This paper presents evidence that the extreme climate behavior of the summer of 2012 and the anomalous summer precipitation distribution in Europe could have been largely determined by the intense transport of moist air from the tropical Atlantic associated with the formation of Tropical Storm Debby, which should be considered among the main drivers of intense flooding events over northwestern and southeastern Europe during the 2012 summer season.
1. Introduction
The summer of 2012 was marked by sharp contrasts in precipitation anomalies across Europe. It was very wet in northern Europe and on the northern coast of the Black Sea, and unusually dry in southern Europe. The anomalous distribution of precipitation represented a northward shift of the precipitation zone compared to previous years [1,2,3,4,5,6,7]. This seasonal precipitation trend contradicted the existing climate change projections, which expected a widespread summer drying across the continent and slower wetting of northern Europe [8,9,10,11]. As was found out later, the summer marked a turning point: while precipitation in the region increased between 1979 and 2012, the period 2012–2020 was characterized by a downward trend in both the intensity and amount of summer precipitation, as well as the intensity of water vapor transport from the North Atlantic to Europe [12,13]. Observational data demonstrated the exceptional nature of the climate event observed in 2012. A few studies have focused on determining the possible key mechanisms that may have been responsible for the unusual characteristics of the season in Europe in 2012 [7,12,13,14,15,16,17,18,19,20,21,22,23,24,25].
According to the data from the Climate Prediction Center (CPC), which is an operational unit of the National Weather Service (NWS) under the National Oceanic and Atmospheric Administration (NOAA) —the summer season (June–August) of 2012 was characterized by the negative phase of the Summer North Atlantic Oscillation (SNAO) [22,23,24,25,26]. It must be noted that although in July the value of the NAO index was negative (mean value −1.32) for most of the month, during the last third of the month it became neutral (near zero). The mean monthly NAO index was negative (−0.98) but it was negative only at the beginning and middle of the month but bounced to near-neutral in between and near the end of the month. (cpc.ncep.noaa.gov/products/precip/CWlink/pna/norm.nao.monthly.b5001.current.ascii.table (accessed on 29 September 2026)).
The year 2012 ranked tenth among the warmest years since 1990 [14]. Globally averaged Sea Surface Temperature (SST) for 2012 was among the 11 warmest on record. In the area of the Gulf Stream in the North Atlantic, the SSTs were more than 1.5 °C warmer than average. Most of the North Atlantic was warmer than average: over 2.5 °C warmer in the northwest North Atlantic and the Davis Strait. The Mediterranean was also very warm, with anomalies up to 2.5 °C more than the 1960–2012 mean [7,27]. Although average annual SST in the Black Sea in 2012 was lower than in the two preceding years [28,29,30], the period from 1982 to 2012 (and later) was characterized by a sustained and pronounced upward trend in Black Sea SST, amounting to approximately 0.08 °C per year [27,29] [according to satellite observations during short periods, SST here exceeded the long-term mean by about 4–5 °C [31,32,33]. The annual mean SST in the Baltic Sea, however, only slightly exceeded the long-term average for the 1990–2012 period [34]. Small positive anomalies prevailed in the northern part of the Baltic Sea, however [34]. The year was also marked by a strongly positive phase of the Atlantic Multidecadal Oscillation [16]. Notable features of the year also included a record loss of Arctic sea ice in August–September 2012 [14,35] and an increase in the frequency of deep baroclinic depressions in the mid-troposphere over the eastern North Atlantic and a substantial decrease over the western part of the region [36].
2. Data and Methodology
Each of these factors could have played a role in determining the observed precipitation anomaly. Additional factors could also be involved. The analysis below utilizes data of averaged over different time periods absolute and anomaly (the anomaly calculations are based on the 1981–2010 monthly averaged climatology calculated for each day) values of sea level pressure (SLP), columnar precipitable water (CPW) [as an atmospheric characteristic representing precipitation sufficiently well] [37], a relative humidity (RH) and specific humidity (SH) at 850, 500 and 300 hPa. Results of air-parcel trajectory calculations are also adopted in the study to identify the synoptic mechanisms that enabled the observed during that summer season’s synoptic processes. The following sections present the results of identifying the period that appears to have played a major role in shaping the anomalous 2012 summer precipitation distribution in Europe, a discussion of the documented extreme weather events of this period, an identification of the trajectories of air masses from the western North Atlantic, and further assessments, including the use of a Hovmüller diagram [38] to analyze this period. The SLP and CPW, RH and SH data are from the state-of-the-art National Oceanic and Atmospheric Administration, Cooperative Institute for Environmental Sciences, Department of Energy (NOAA-CIRES-DOE) multi-year twentieth century (20CRV3) reanalysis version 3 (20CRv3) dataset with a spatial resolution of 1.0 degree provided by the NOAA Physical Sciences Laboratory, Boulder, Colorado, on their website at https://psl.noaa.gov/data/composites/subdaily_20thc/details.html (accessed on 29 September 2026) [39]. The air-parcel trajectory calculations were performed using meteorological fields from the NOAA Global Data Assimilation System (GDAS) with a spatial resolution of 0.5° × 0.5° with the NOAA Air Resources Laboratory (ARL) HYSPLIT transport and dispersion model [40,41,42] available from its READY website (https://www.ready.noaa.gov (accessed on 29 September 2026)). British Met Office analysis SLP maps from the Deutsche Wetterdienst data archive at https://www.wetter3.de/archivukmetdt.html (accessed on 29 September 2026) are also adopted for the evaluation.
3. Identifying the Time Period
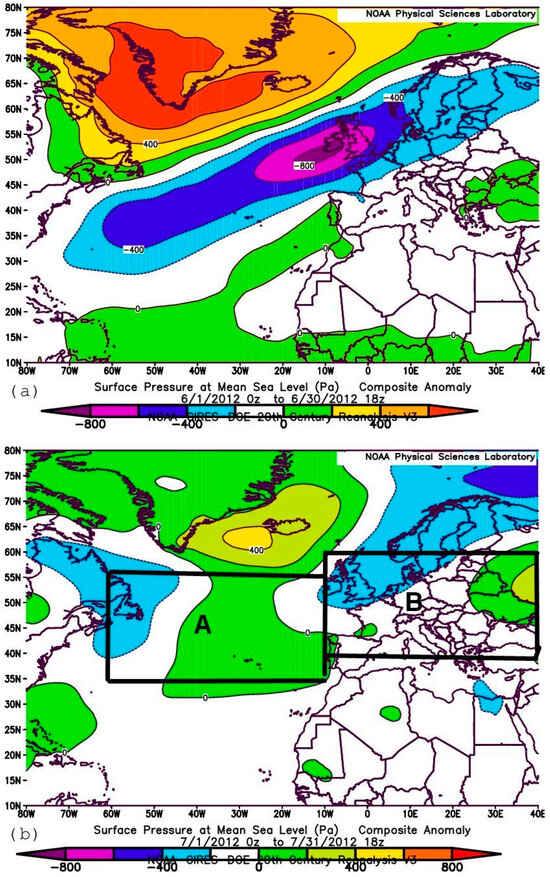
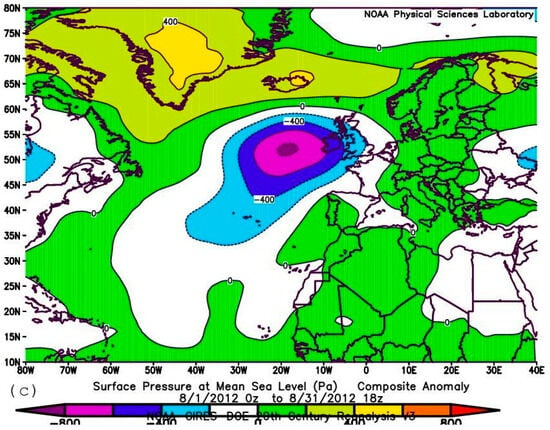
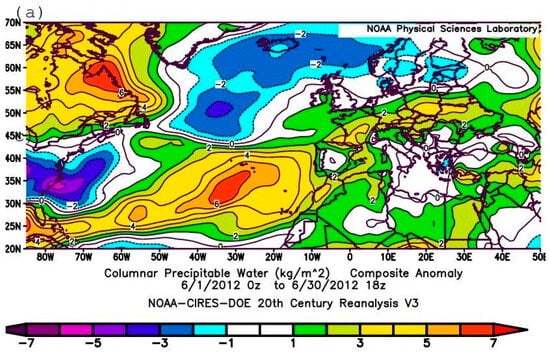
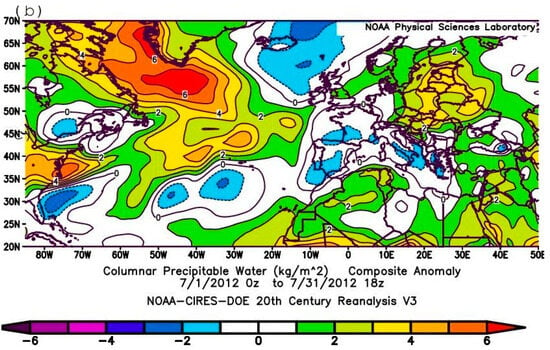
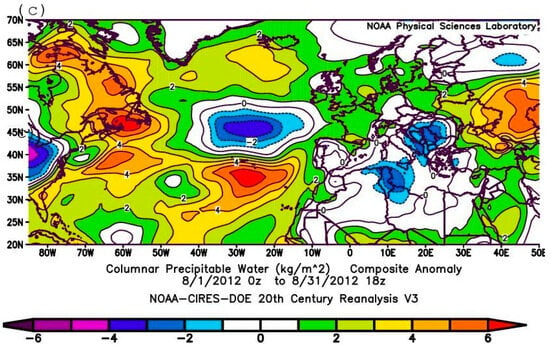
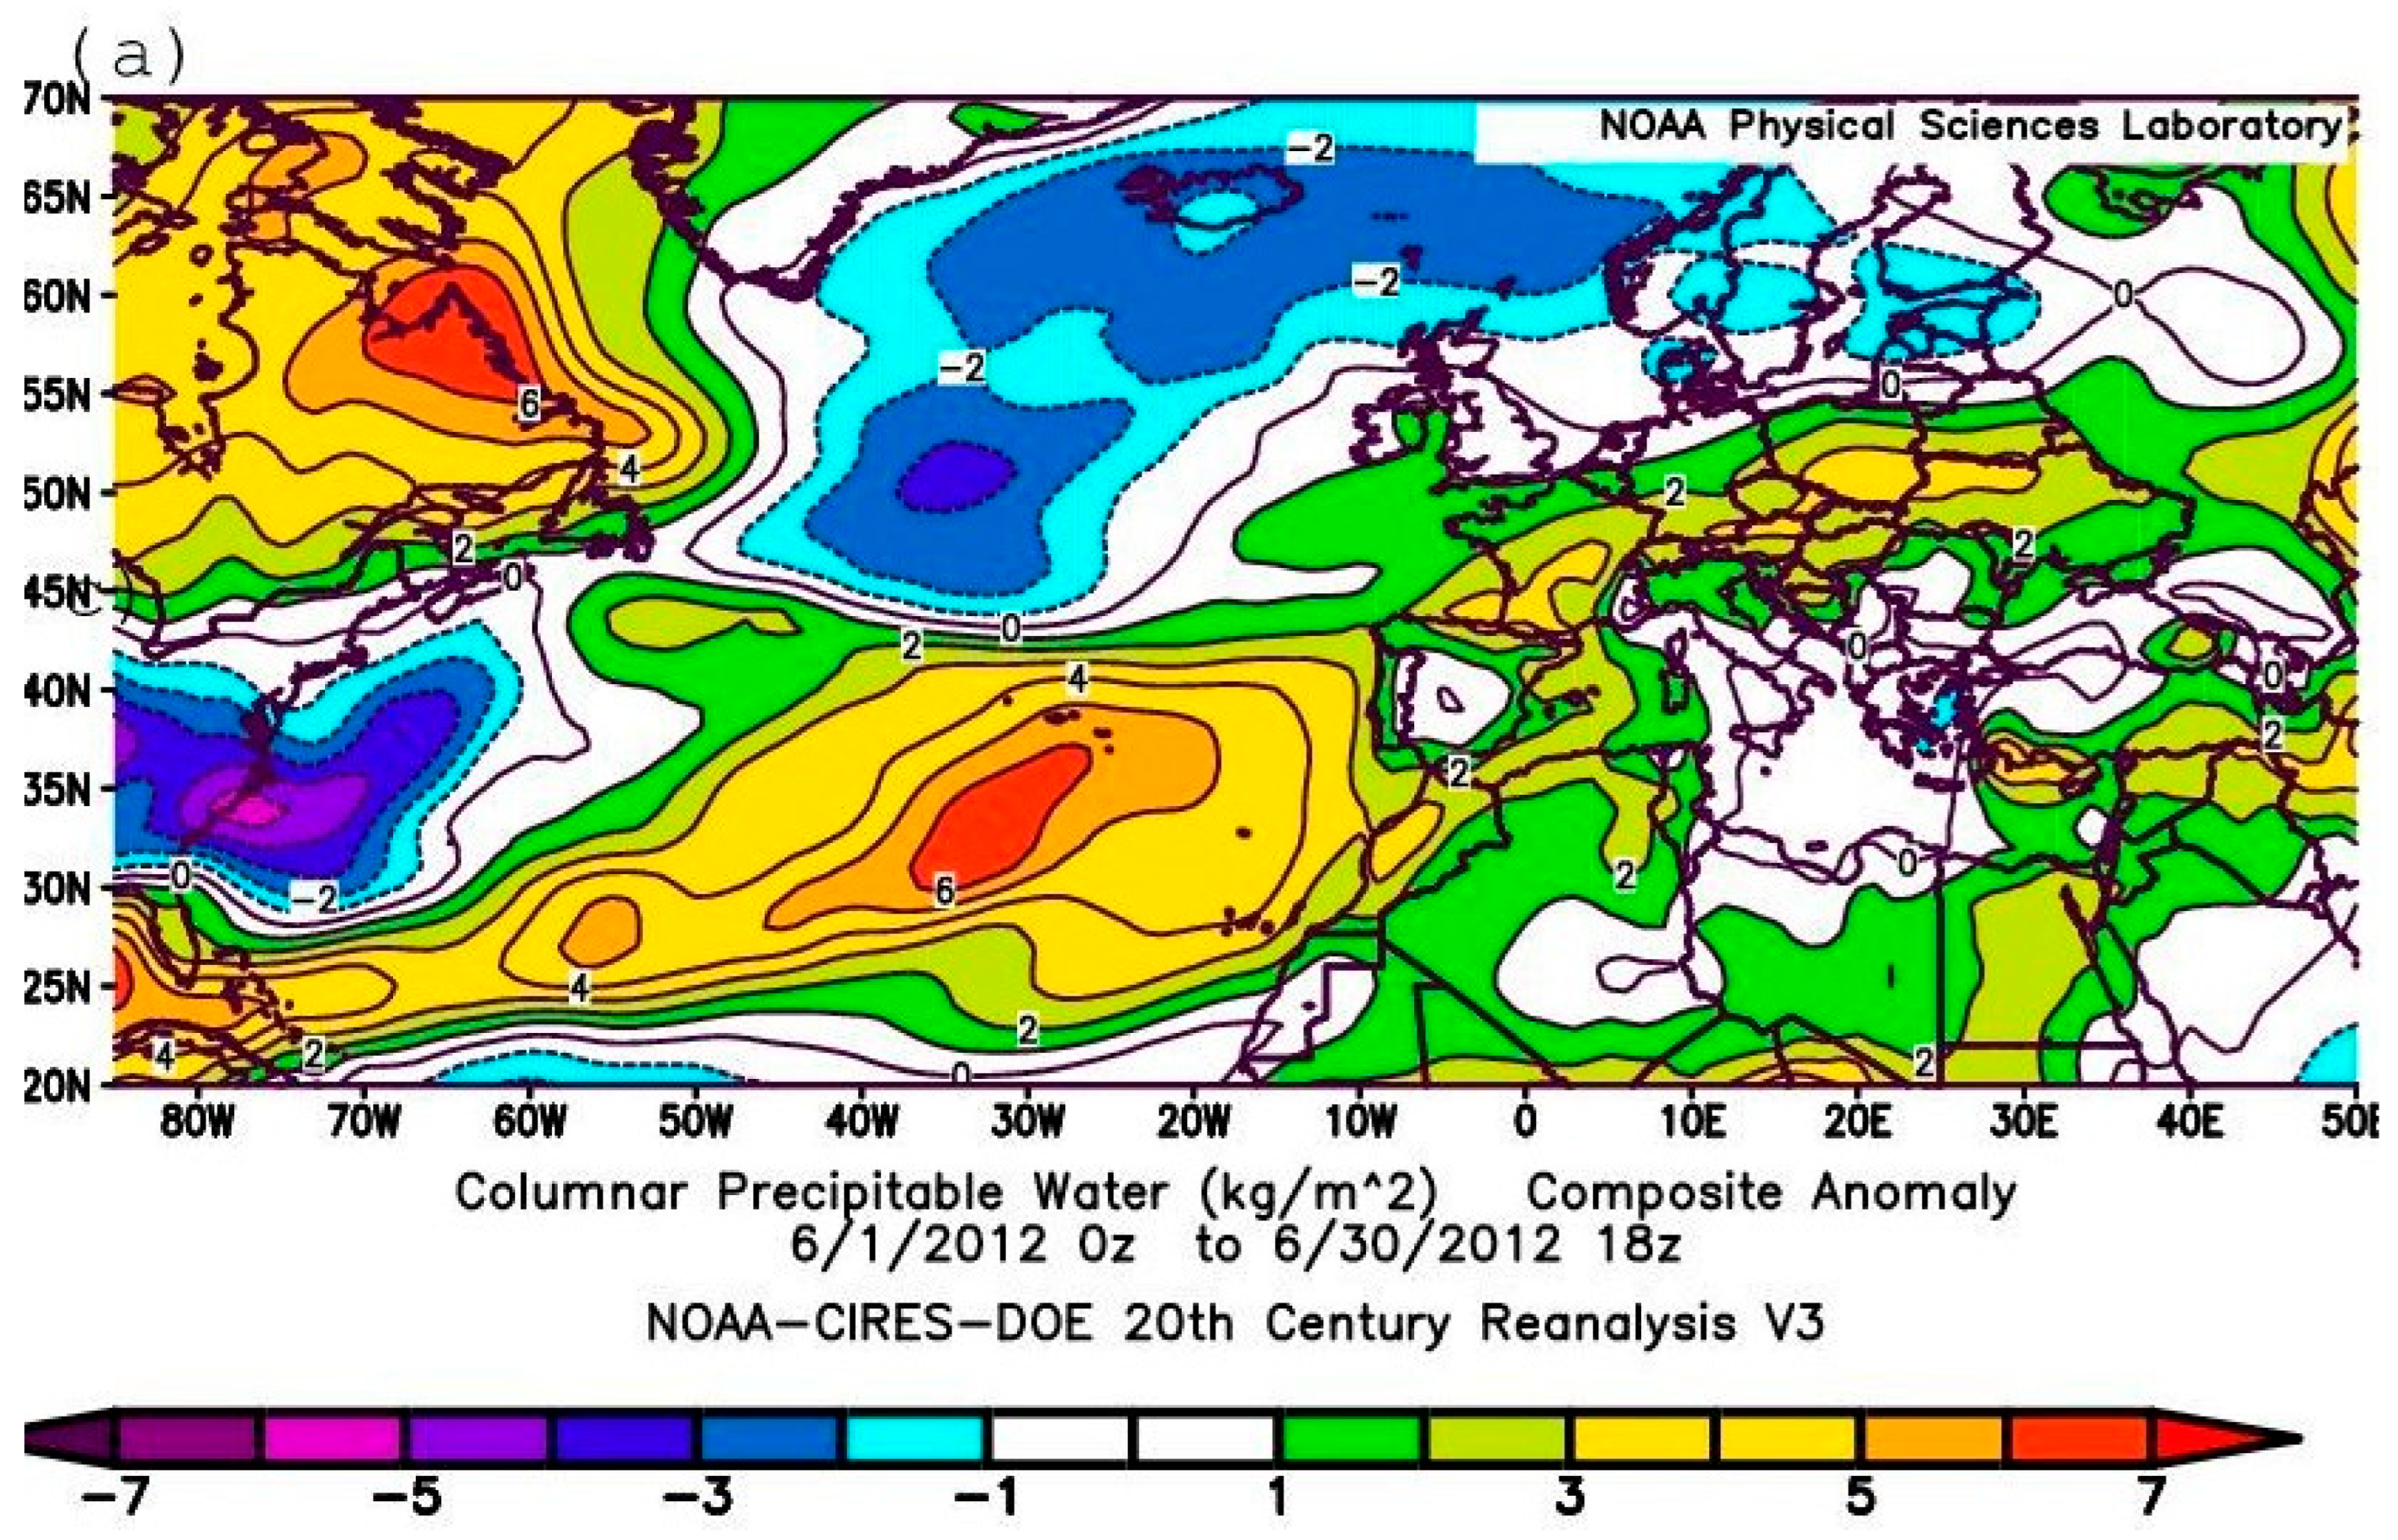
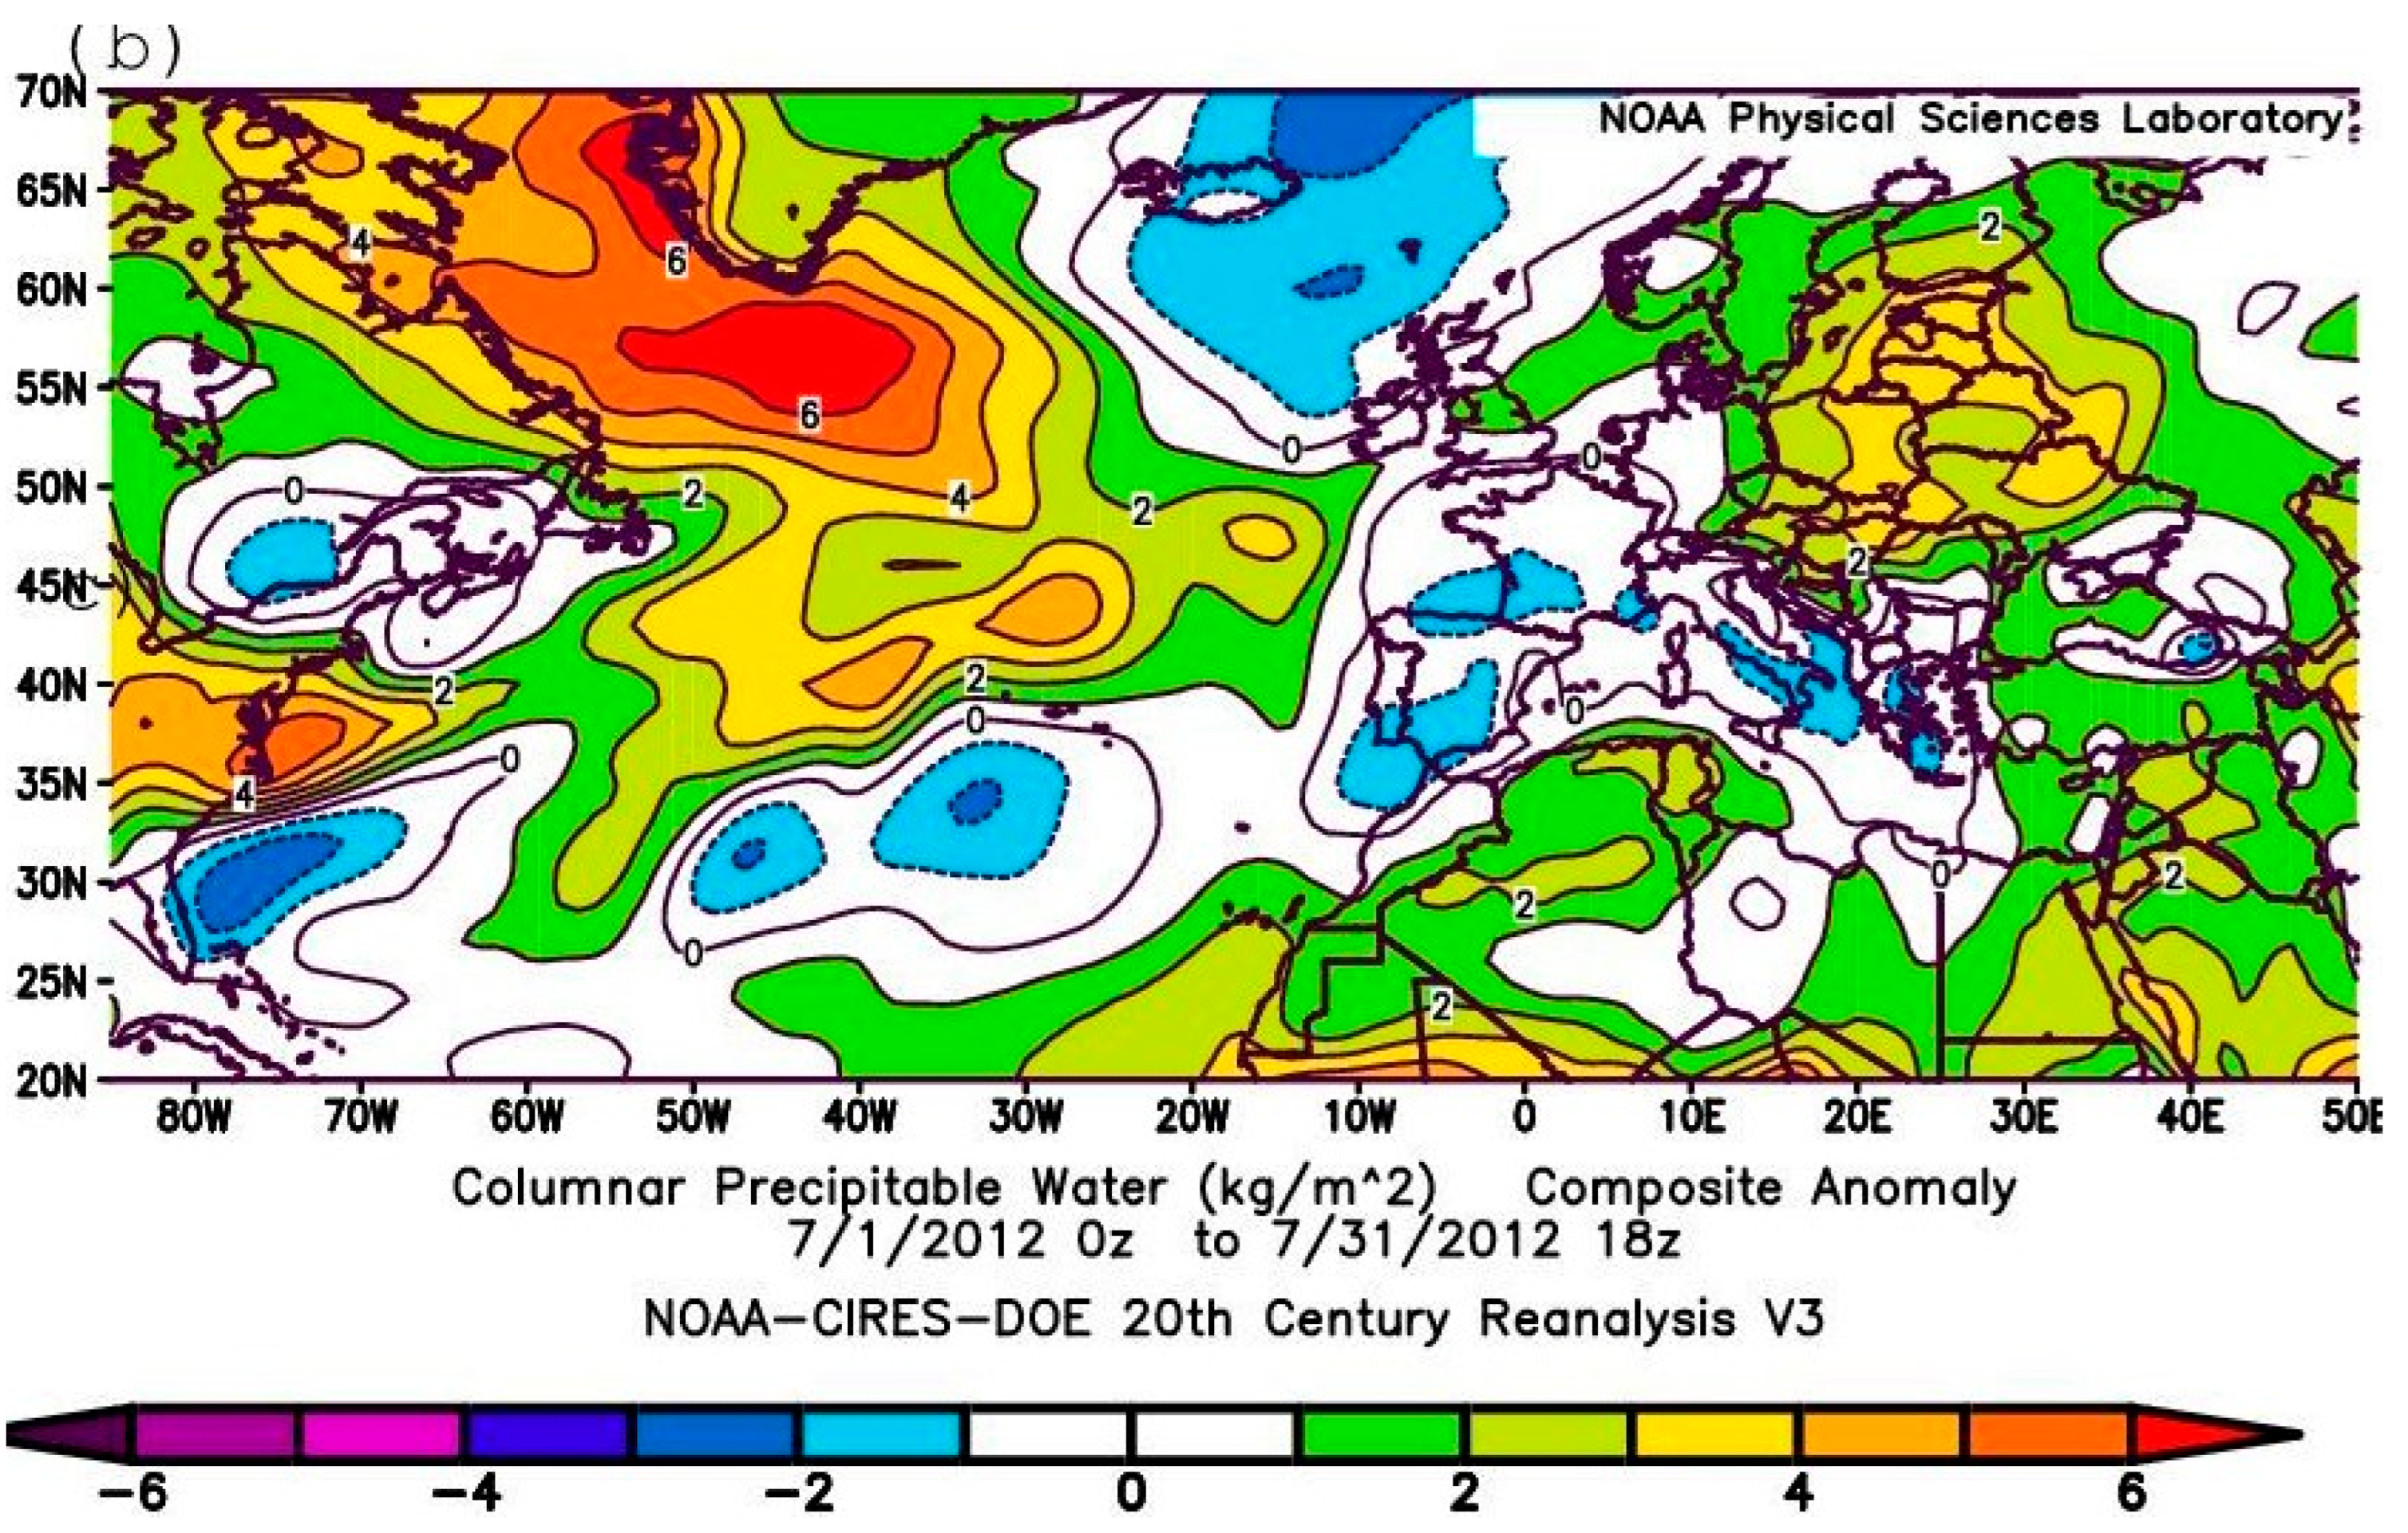
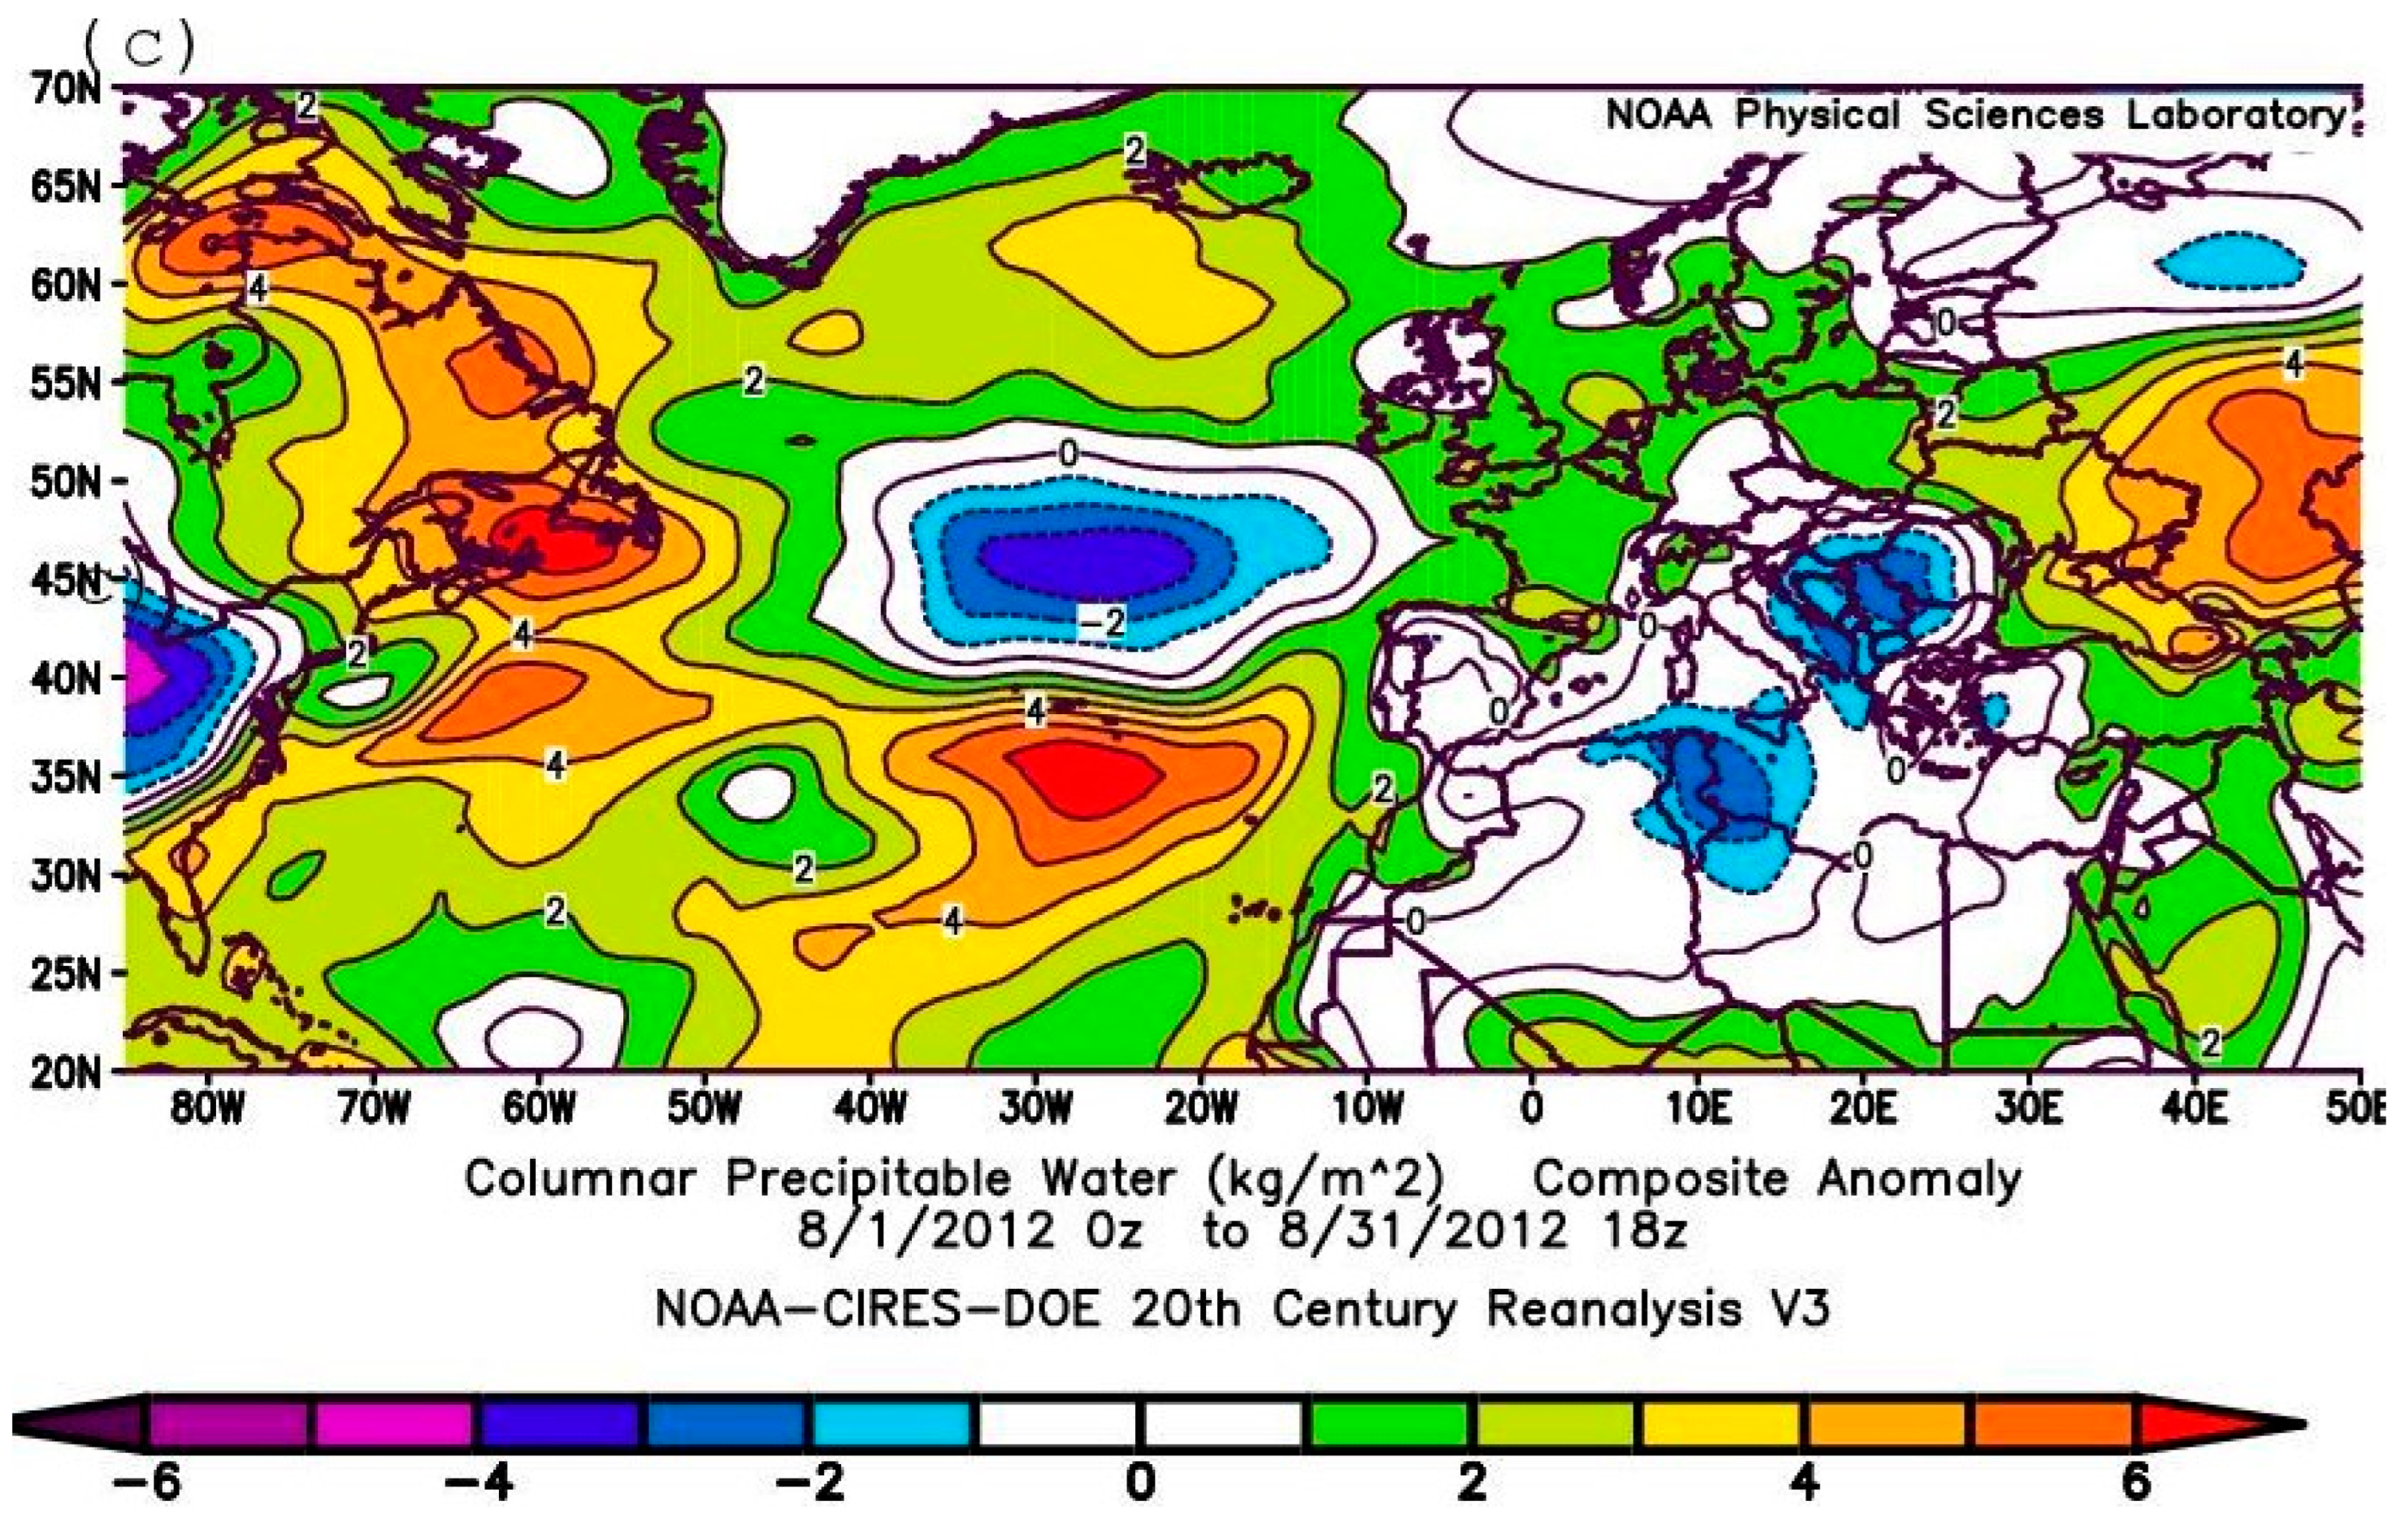
According to seasonal mean (June–August) data (e.g., [7]), the heavy summer precipitation of 2012 in northern Europe was associated with specific synoptic conditions over northwestern Europe [7,14,20]. These conditions were characterized by a large-scale dipole pattern of sea level pressure change over the North Atlantic, with an area of anomalously low pressure associated with high atmospheric moisture concentrations extending from the Atlantic across the British Isles and Scandinavia, and a high-pressure area over Greenland [18,21]. These analyses have focused on assessing average seasonal patterns, however. In the current study, the evaluation is carried out over shorter time periods to elucidate the mechanisms responsible for the formation of this synoptic pattern. The anomaly fields for sea level pressure (SLP) (Figure 1a–c) and columnar precipitable water (CPW) (Figure 2a–c) for each of the summer (June–August) months separately provide additional information on the synoptic processes that characterized this period. As follows from Figure 1, the distribution of seasonal pressure anomalies presented in Figure 10.1a of [21] fully corresponds only to the conditions of June 2012 (Figure 1a) and, to some extent, July (Figure 1b), but not to the conditions of August 2012 (Figure 1c). According to Figure 1c, the pattern of sea level atmospheric pressure anomalies in August 2012 (Figure 1c) is noticeably different from the patterns in June and July, being characterized by an area of negative pressure anomaly over the British Isles and a small area of positive anomaly values over Greenland. As follows from Figure 2a–c, which present the spatial distribution of CPW anomalies for each month of the summer season, respectively, only the pattern for June 2012 (Figure 2a) is characterized by two areas of extreme PW anomalies: one over the northeastern coast of Canada, and the other extending from the tropical western Atlantic Ocean towards eastern Europe. On the map for July (Figure 2b), an area of significant positive CPW anomalies appears over the Labrador Sea. Extreme positive CPW anomaly values also characterized central Europe and northwestern Africa. By August 2012, an area with positive CPW anomalies (Figure 2c) was located over eastern Europe.
Figure 1.
Maps with composite sea level pressure (SLP) anomalies in Pa (calculated from 1981–2010 daily means) for (a) June, (b) July, (c) August 2012 [based on the NOAA CIRES DOE 20th century 20CRV3 reanalysis data]. Shading interval 400 Pa. (The two rectangles A and B in Figure 1b represent the North Atlantic and European sub-regions used in the subsequent analysis).
Figure 2.
Maps with composite Column Precipitable Water (CPW) anomalies in kg m−2, shading interval 5 kg m−2. (calculated from 1981–2010 daily means) for (a) June, (b) July, (c) August 2012 [based on the NOAA CIRES DOE 20th century 20CRV3 reanalysis data].
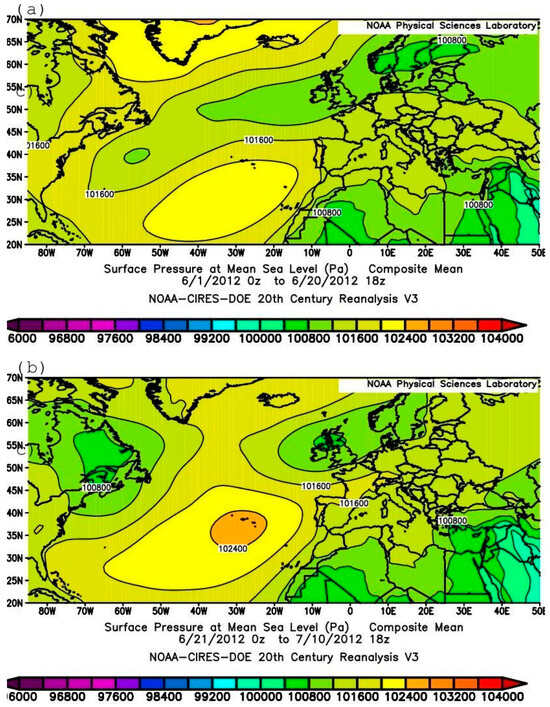
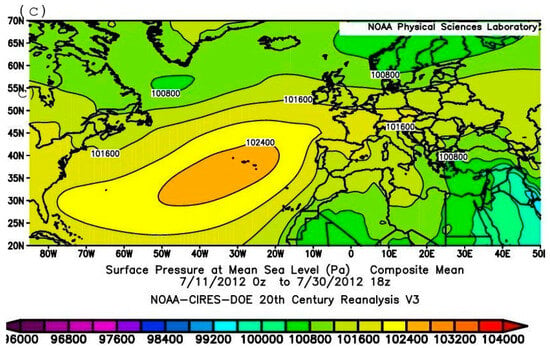
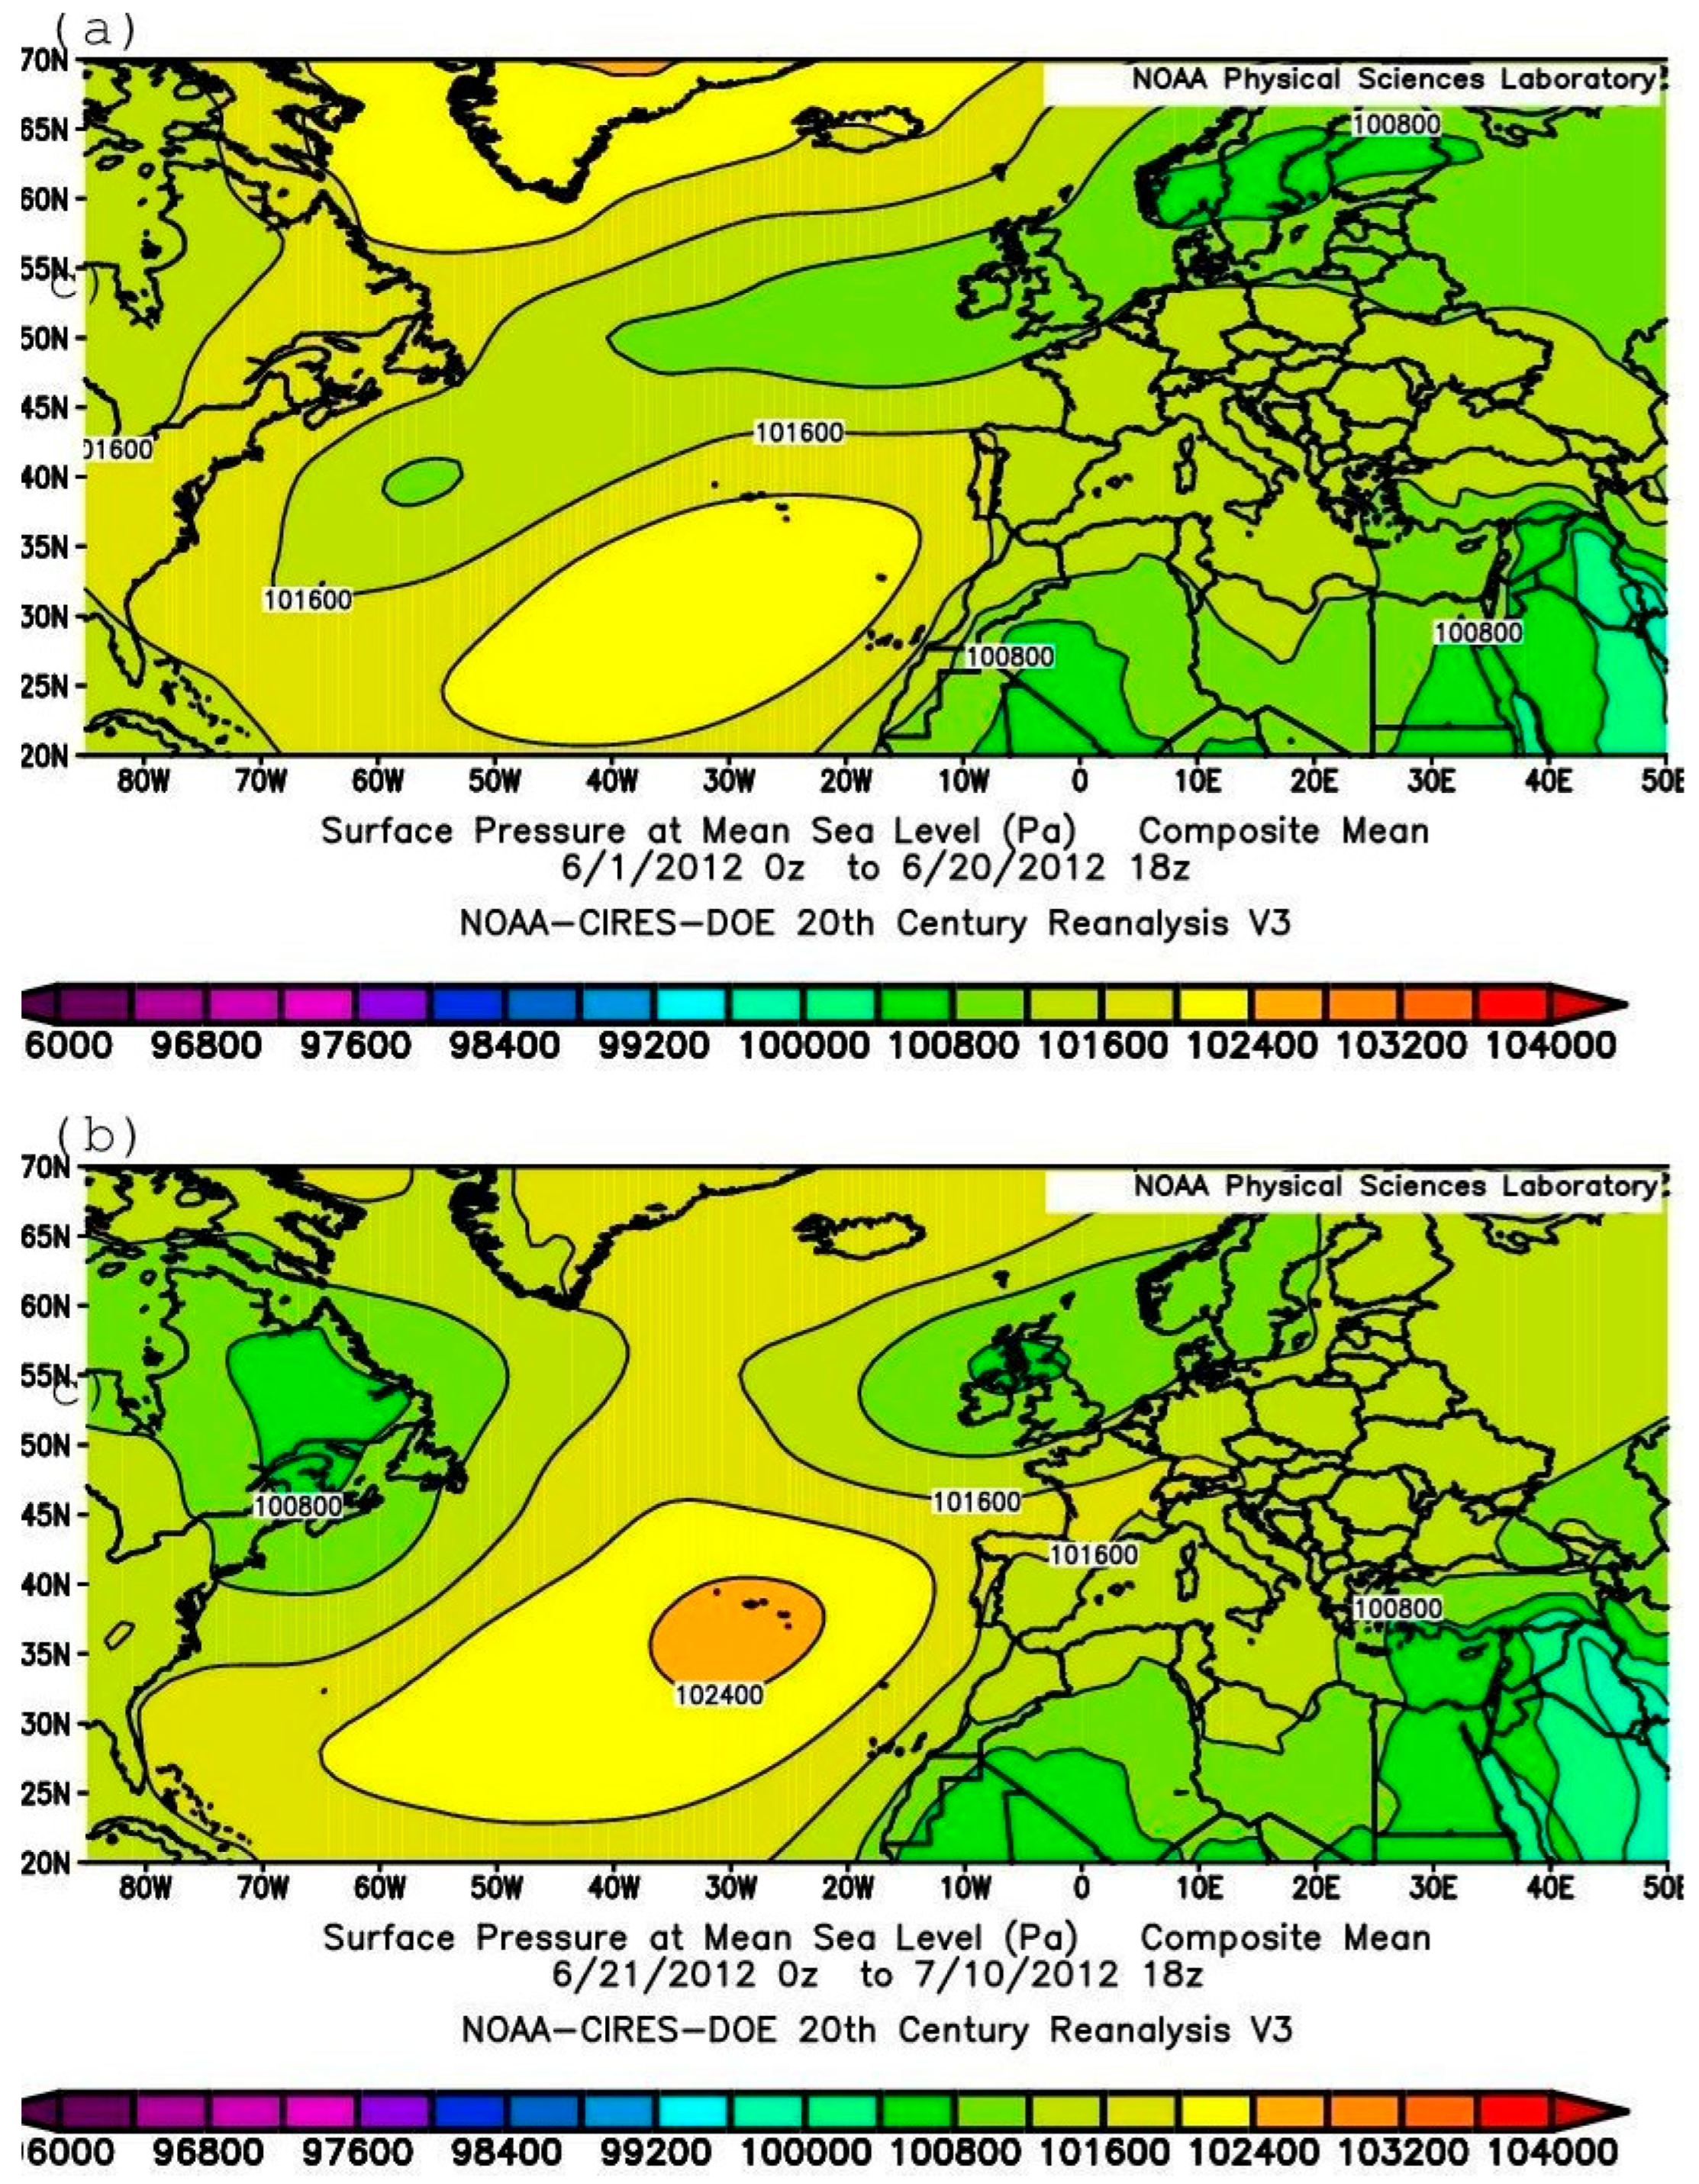
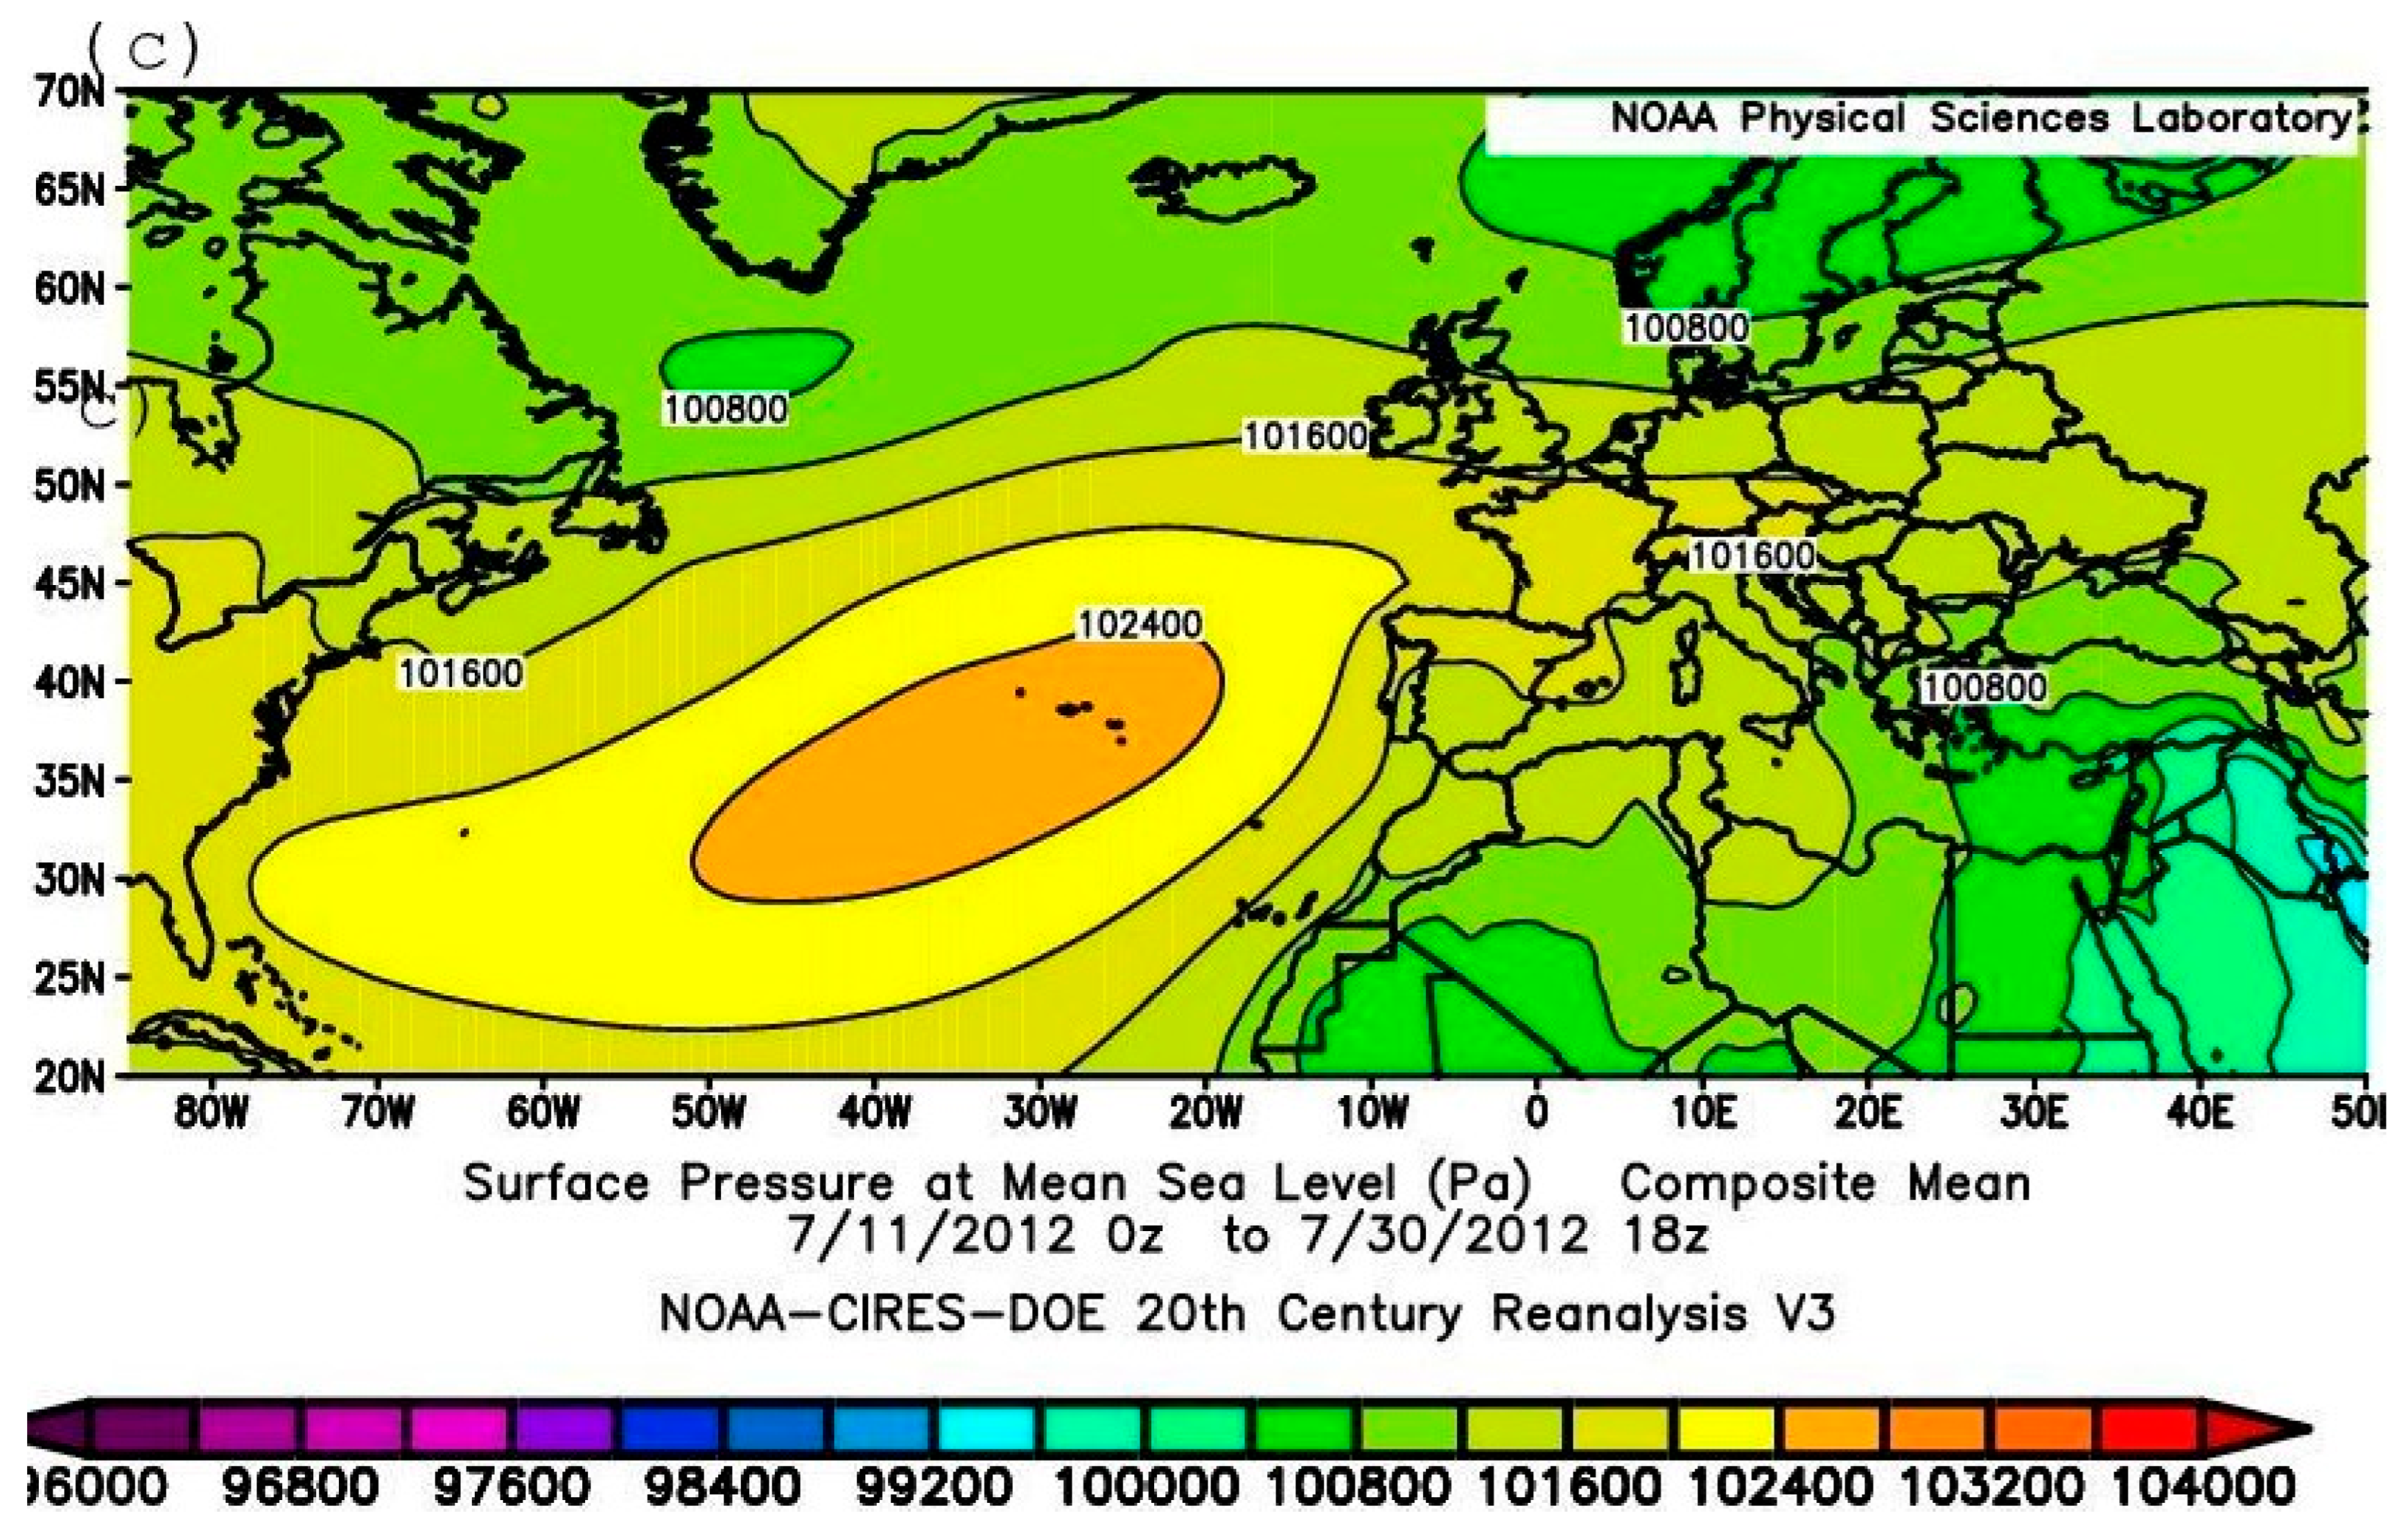
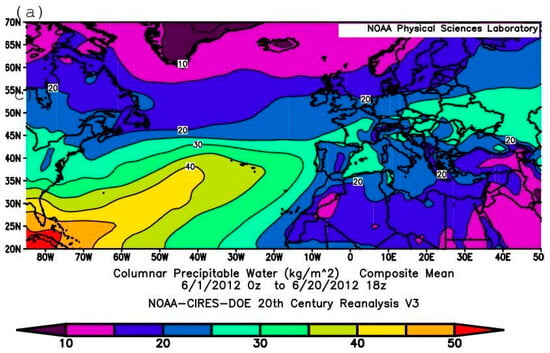
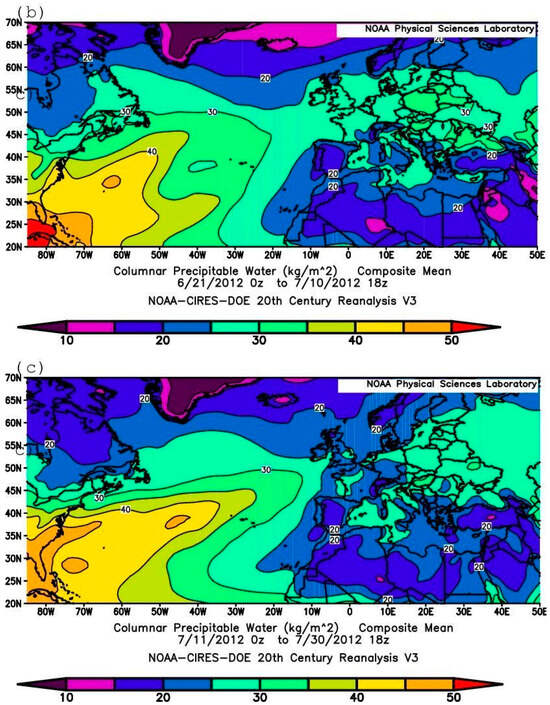
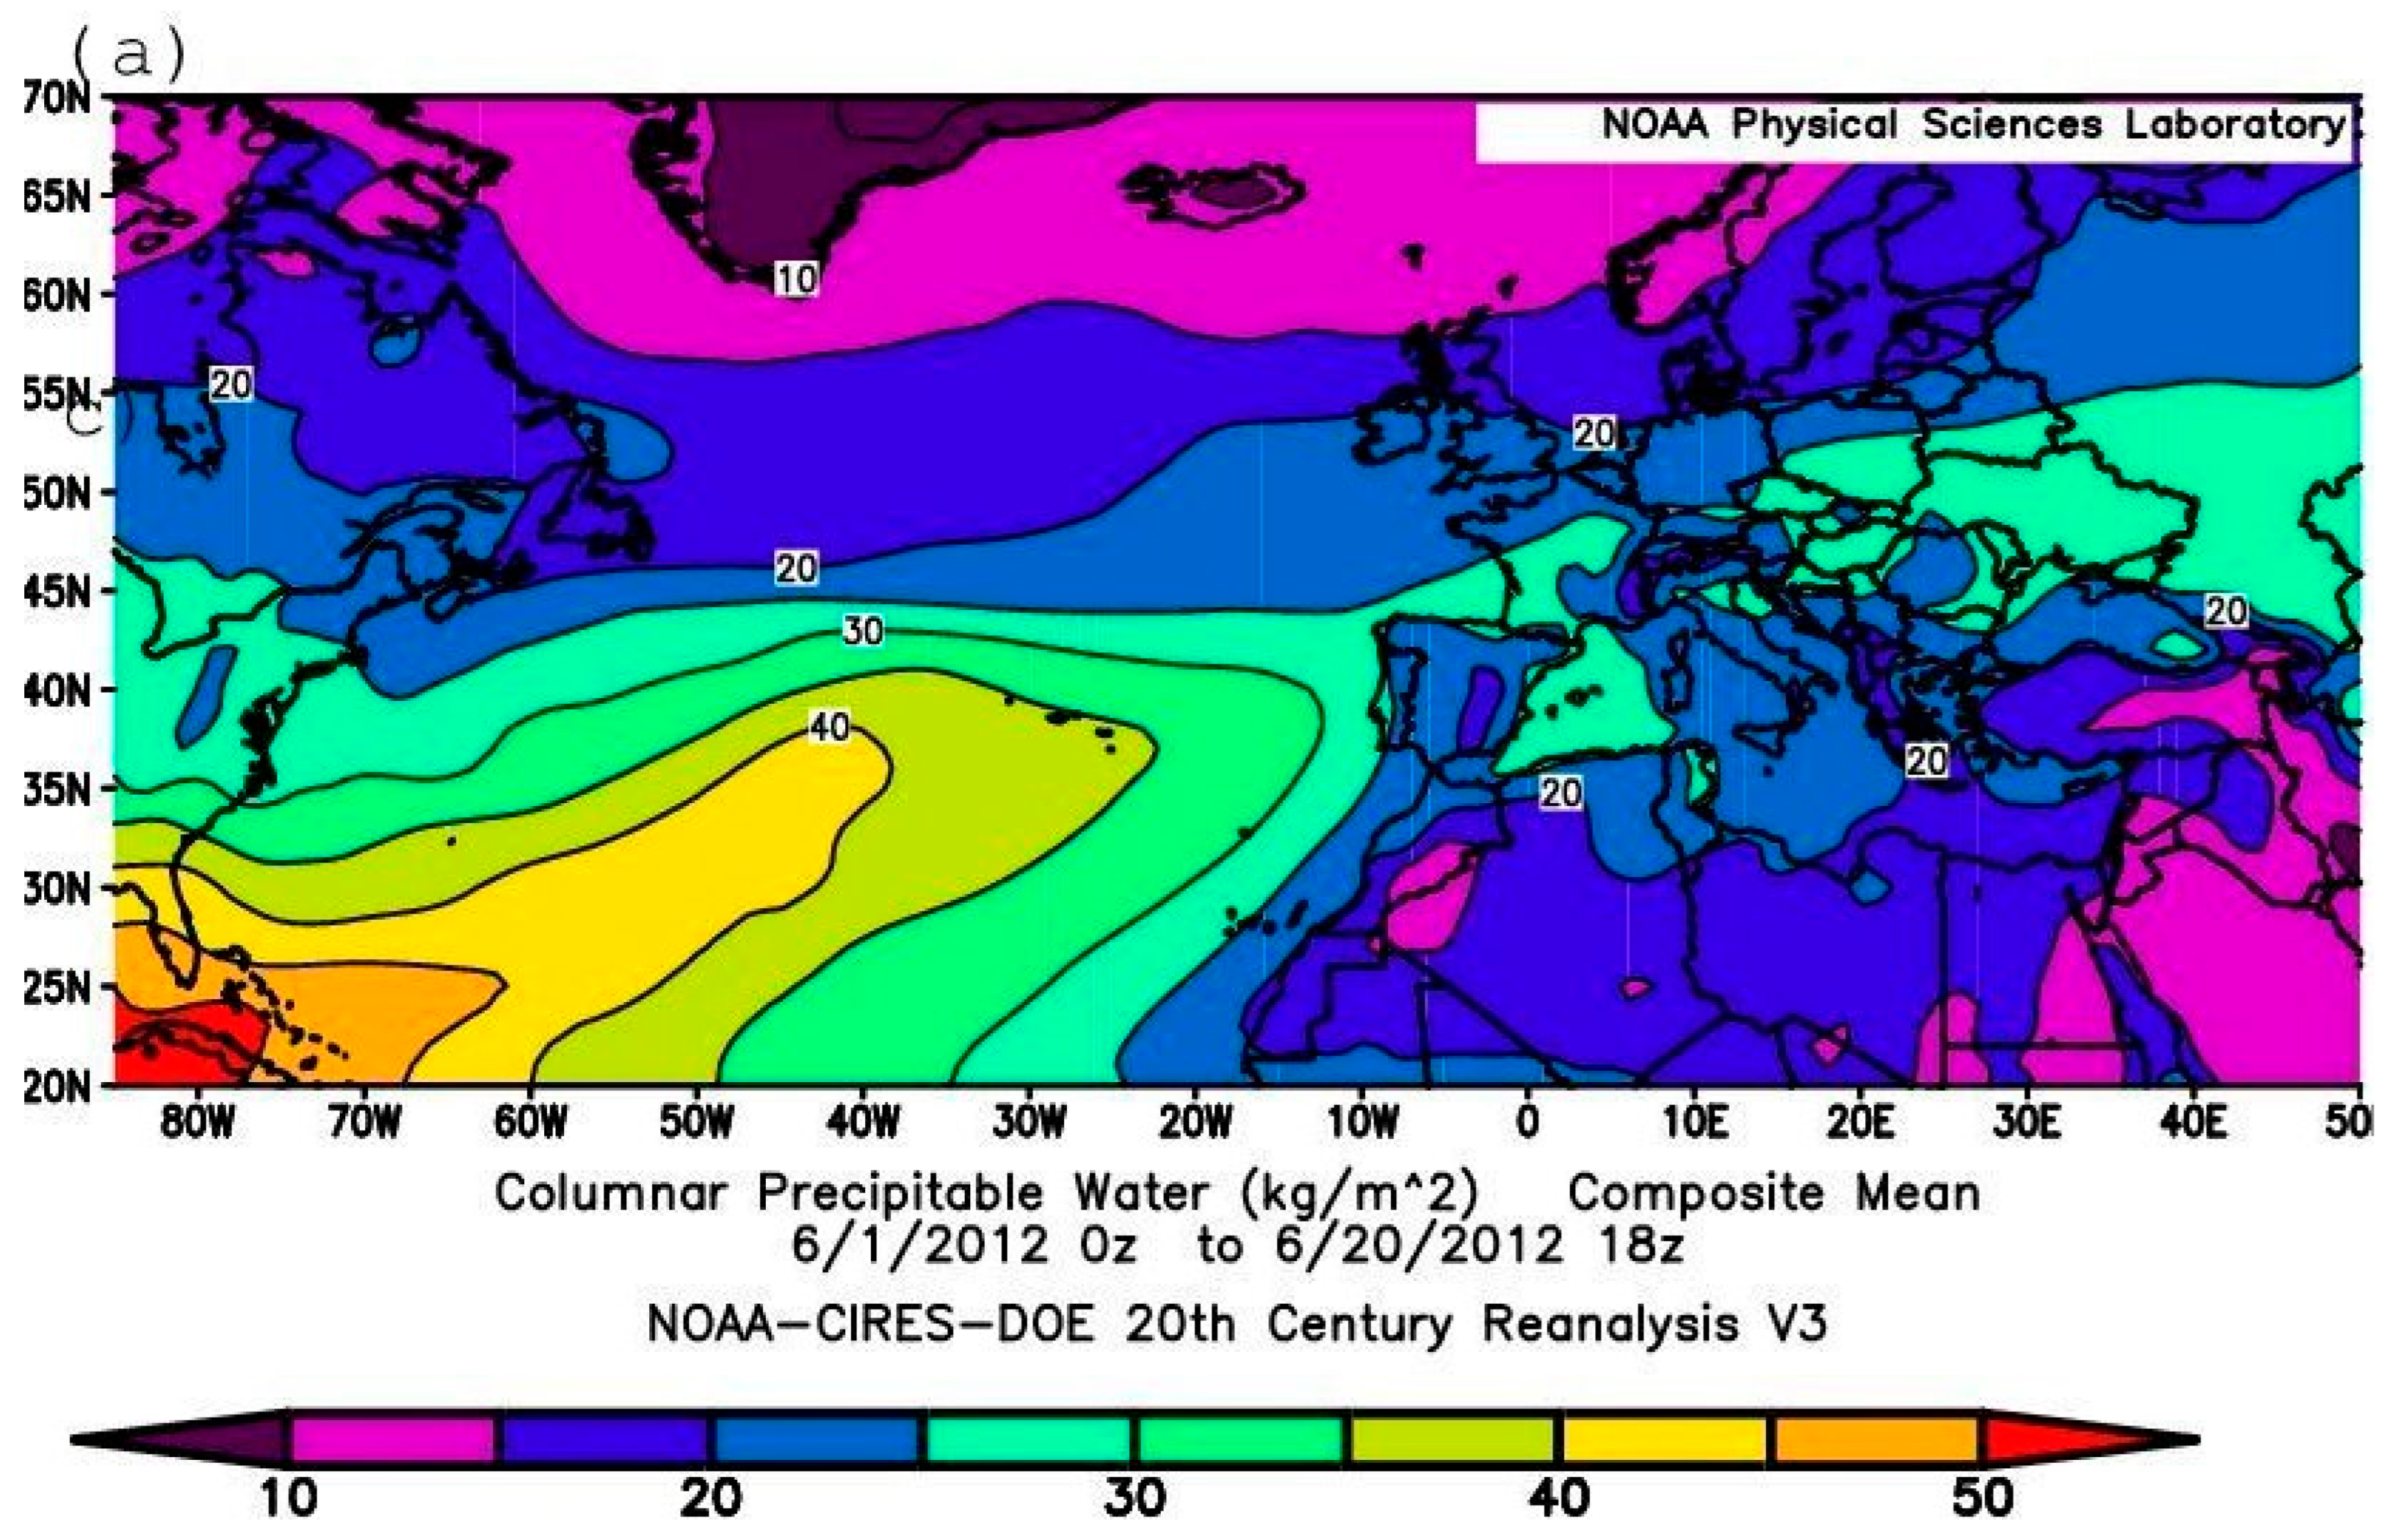
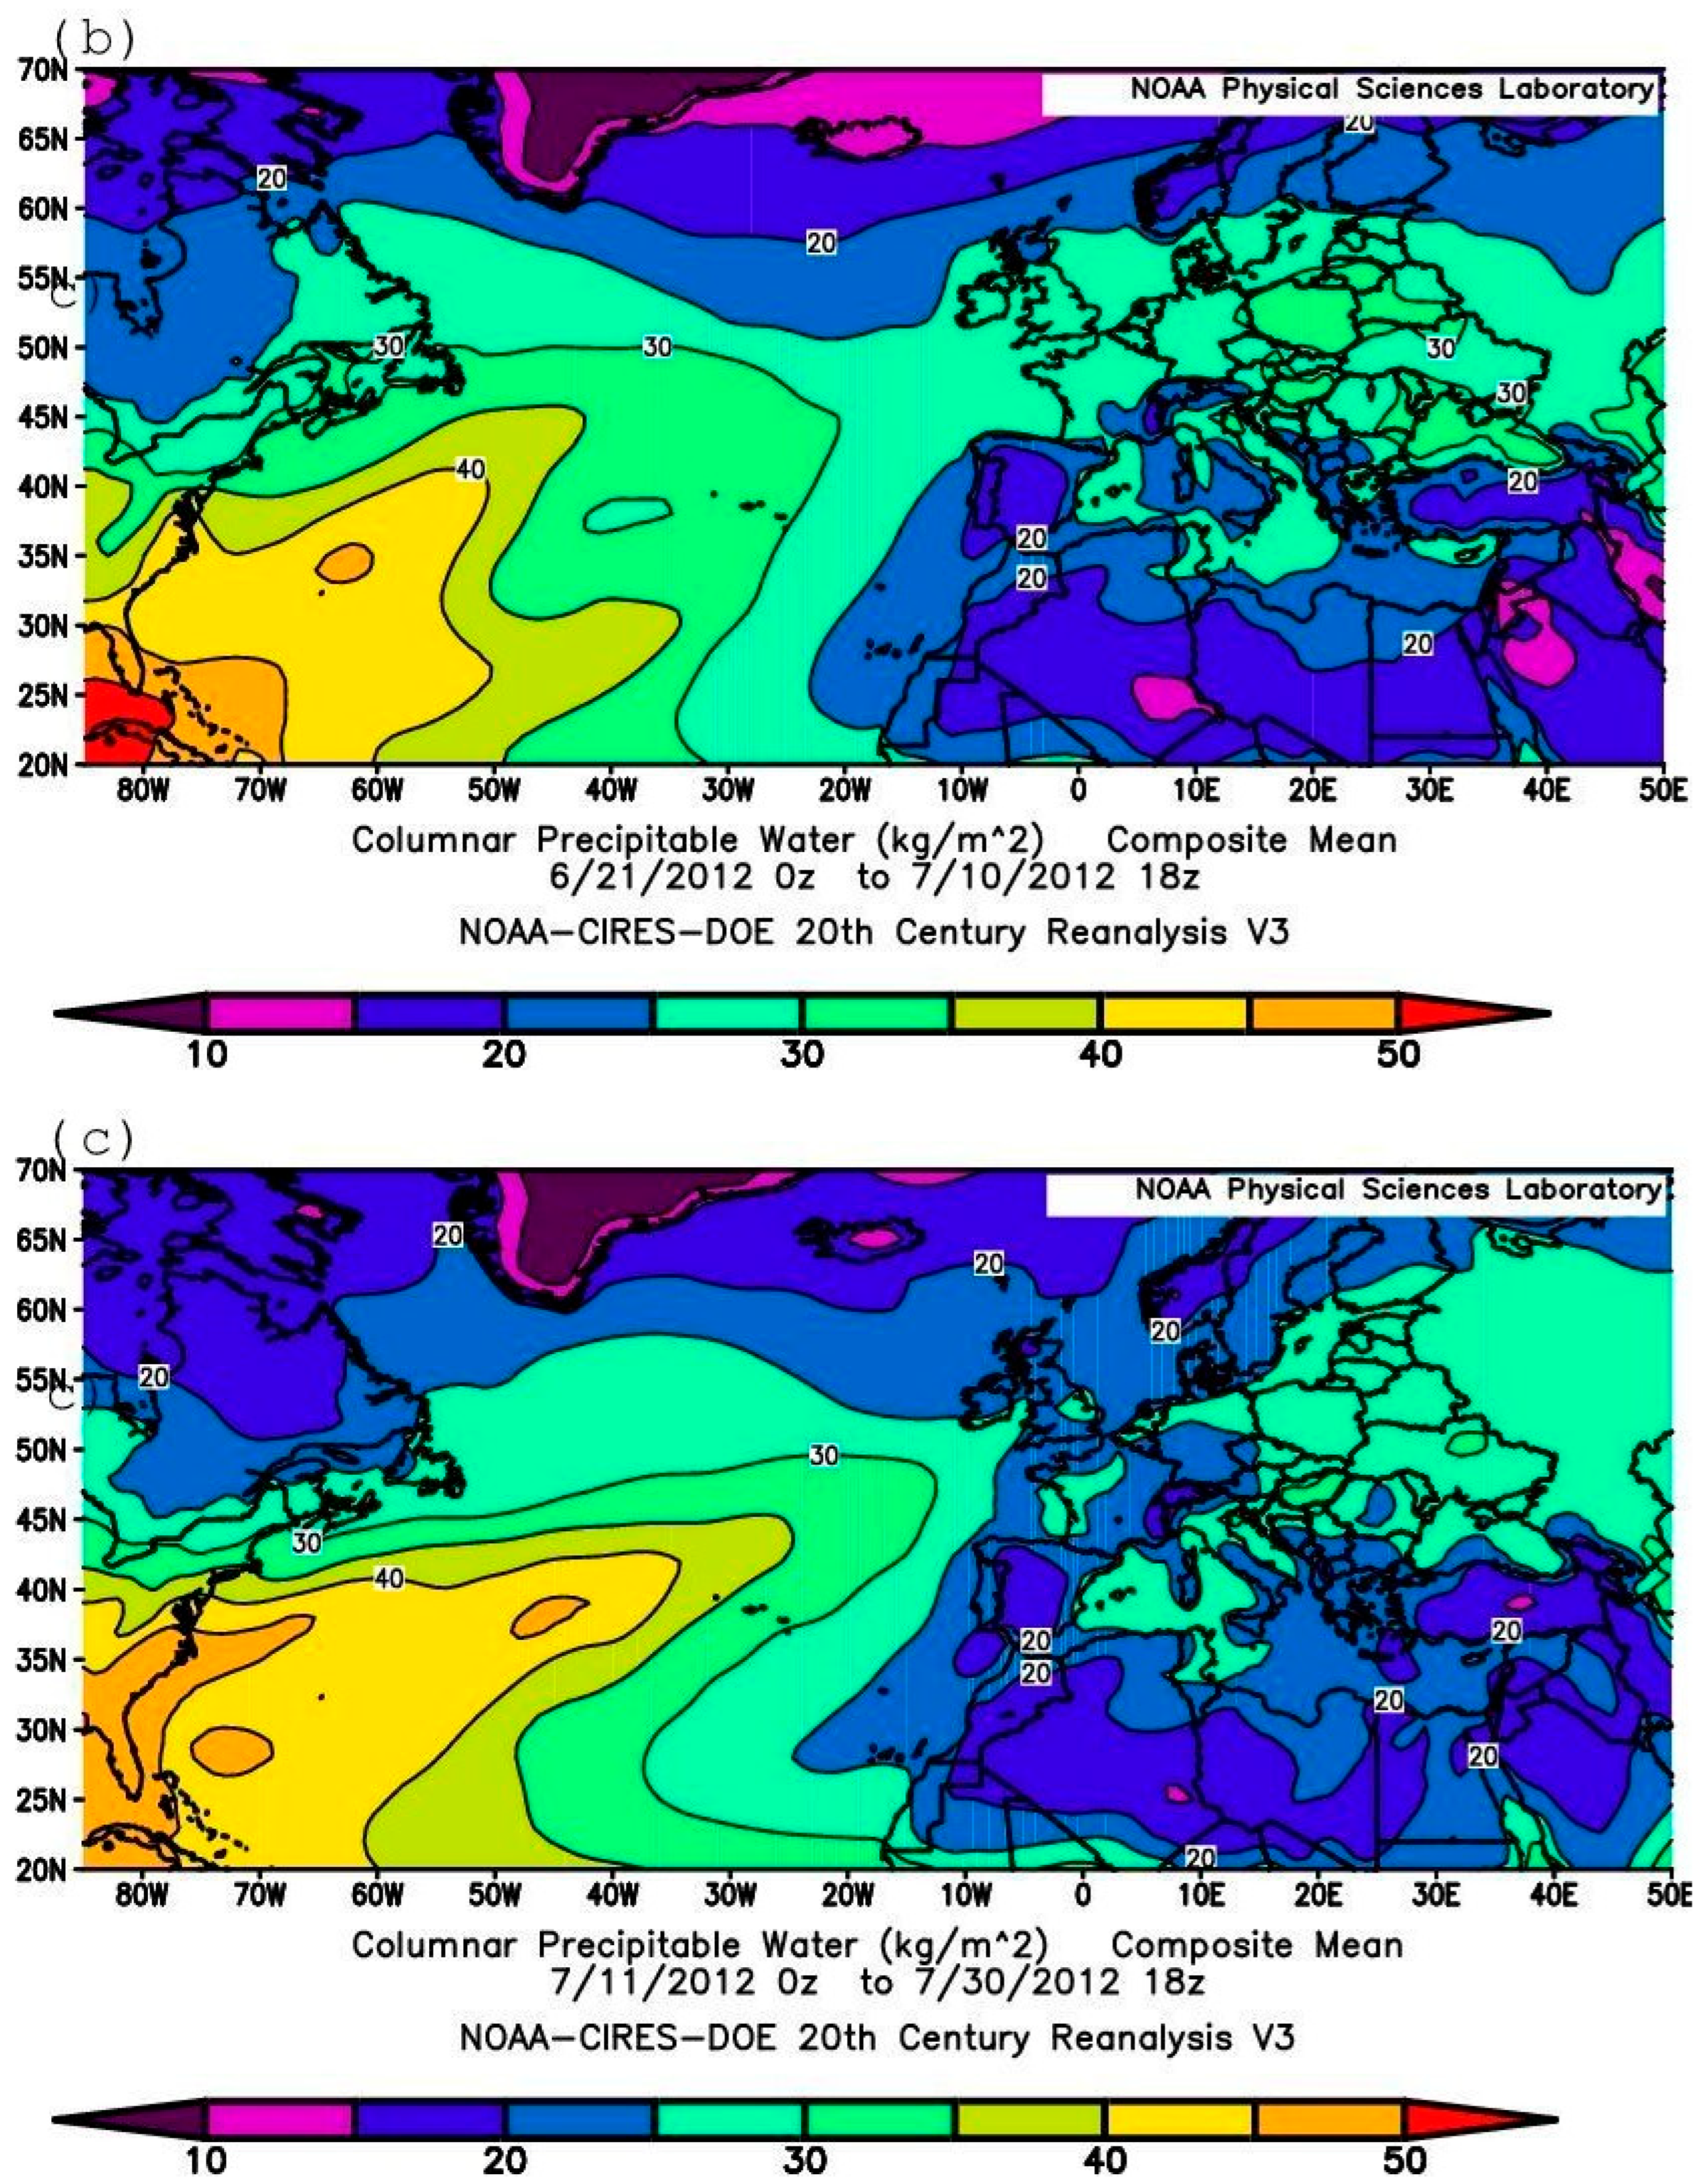
Maps of the 20-day-averaged absolute SLP and CPW spatial distributions (Figure 3a–c and Figure 4a–c) for 1–20 June, 21 June–10 July, and 11–30 July, respectively, were also constructed. As can be seen from Figure 3a, the first 20 days of the 60-day period were characterized by the presence of a narrow trough in the surface pressure field extending from the western tropical Atlantic to northwestern Europe. During the next two 20-day periods (21 June–10 July and 11–30 July), however, two low atmospheric pressure centers formed over Newfoundland and western Europe (Figure 3b), the cyclone centered over Newfoundland and Greenland weakened, and the cyclonic area over northern Europe deepened. Also noteworthy is the gradual strengthening of the anticyclone in the central Atlantic Ocean and its penetration into Europe over all three 20-day periods (Figure 3a–c). According to Figure 4a–c, the entire 60-day period (from 1 June to 30 July) was characterized by the export of moist air to Europe from the western tropical–sub-tropical Atlantic (Figure 4a).
Figure 3.
Maps with 20-day composite SLP for (a) 1–20 June; (b) 21 June–10 July; (c) 11–30 July 2012 in Pa., shading interval 400 Pa. [based on the NOAA CIRES DOE 20th century 20CRV3 reanalysis data].
Figure 4.
Maps with 20-day composite CPW for (a) 1–20 June; (b) 21 June–10 July; (c) 11–30 July 2012 in Pa., shading interval 400 Pa. [based on the NOAA CIRES DOE 20th century 20CRV3 reanalysis data]. Shading interval 5 kg m−2.
4. Extreme Weather Events in and Around Europe
As was already stated above, a notable part of the extreme rainfall that occurred in Europe in the summer of 2012 took place over a relatively brief period in June–July. According to observational data, the period was marked by very intense weather events including heavy rain on 8 and 22 June in Ireland [2,43]. On 8–9 June 2012, a very deep depression drifted northeast across Wales, causing heavy and persistent rain for several hours (about 125 mm of rain in 24 h) [44]; a wind vane stalling event occurred on 13–15 June 2012 in the Netherlands [45]; a series of violent thunderstorms and intense short-duration rainfalls and flash flooding in numerous places which affected parts of England and Wales occurred on 28 June 2012 [46]; and torrential rains and devastating floods occurred on 5–7 July in various districts of the United Kingdom [47], the Netherlands, Sweden and Estonia [2], and on 6–7 July in the northern Black Sea coastal area (including disastrous floods in the town of Krymsk) of Russia [31,32,48,49]. The fact that all these extreme weather events occurred during the same period and most of them in roughly the same geographic region may indicate that, despite taking place in different countries, they were in reality manifestations of a single large-scale process unfolding across Europe at the time; they were driven by the same physical mechanism and, collectively, were among the primary causes of the sharp contrasts in precipitation anomalies observed in Europe during the summer of 2012.
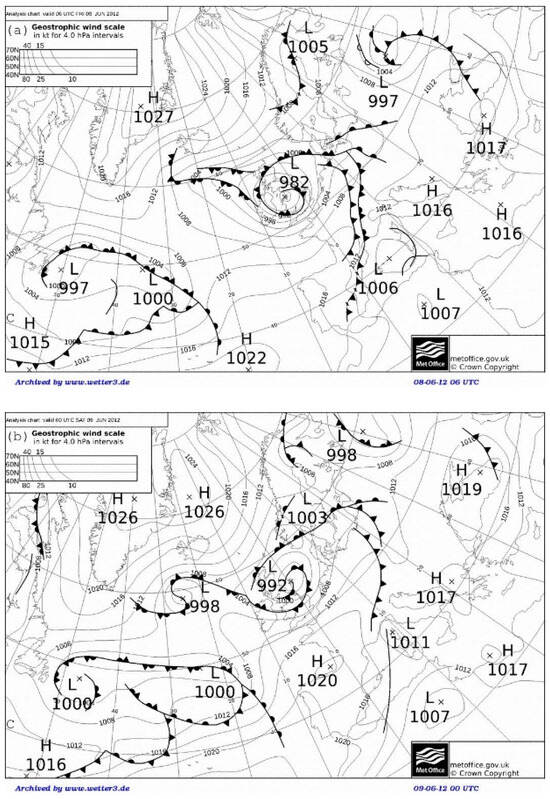
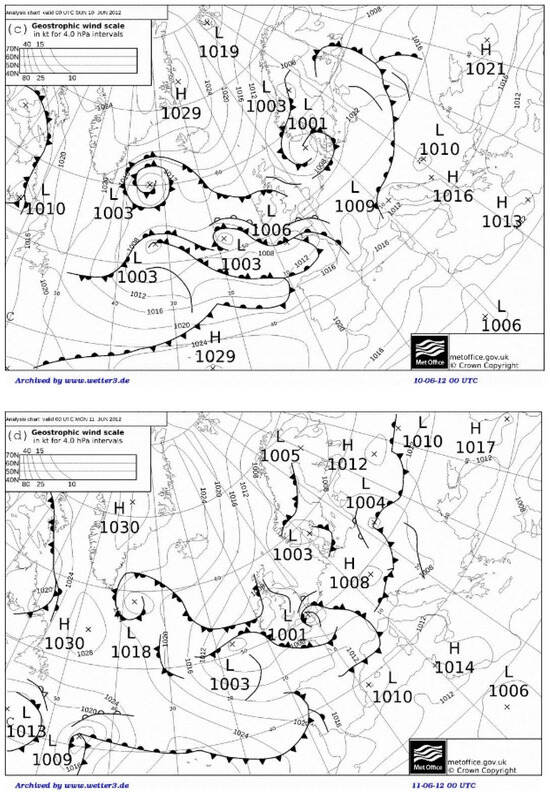
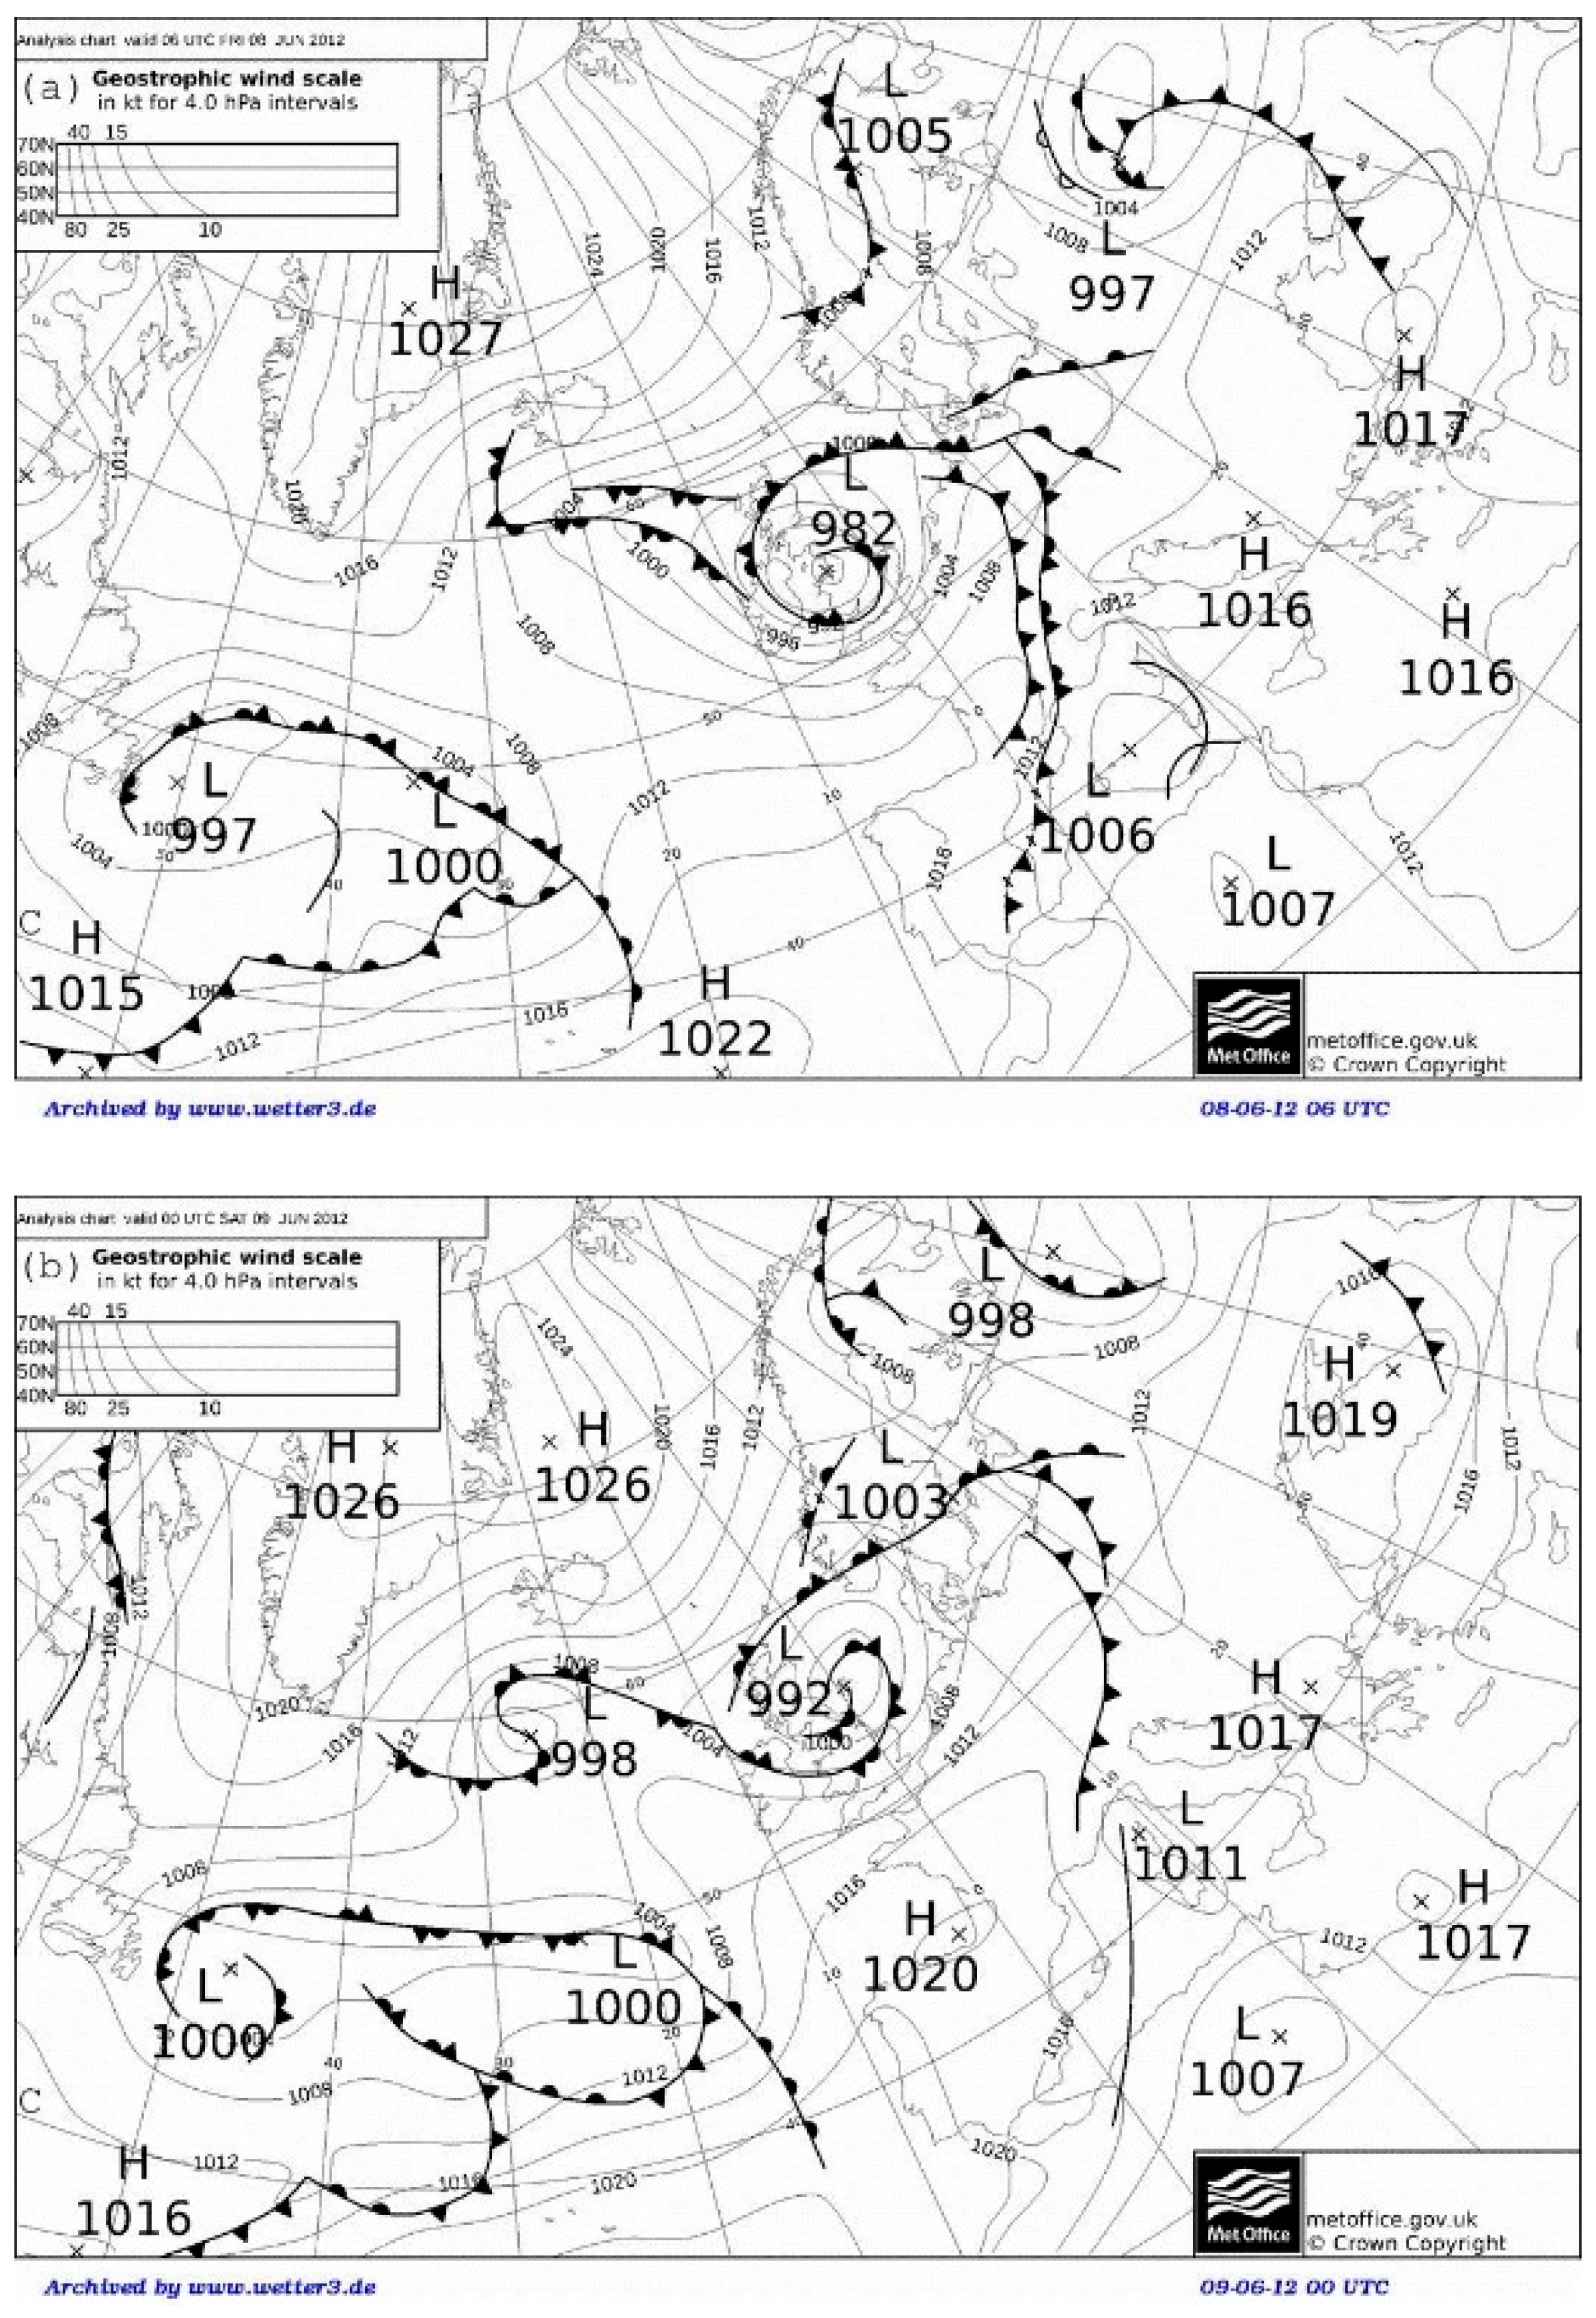
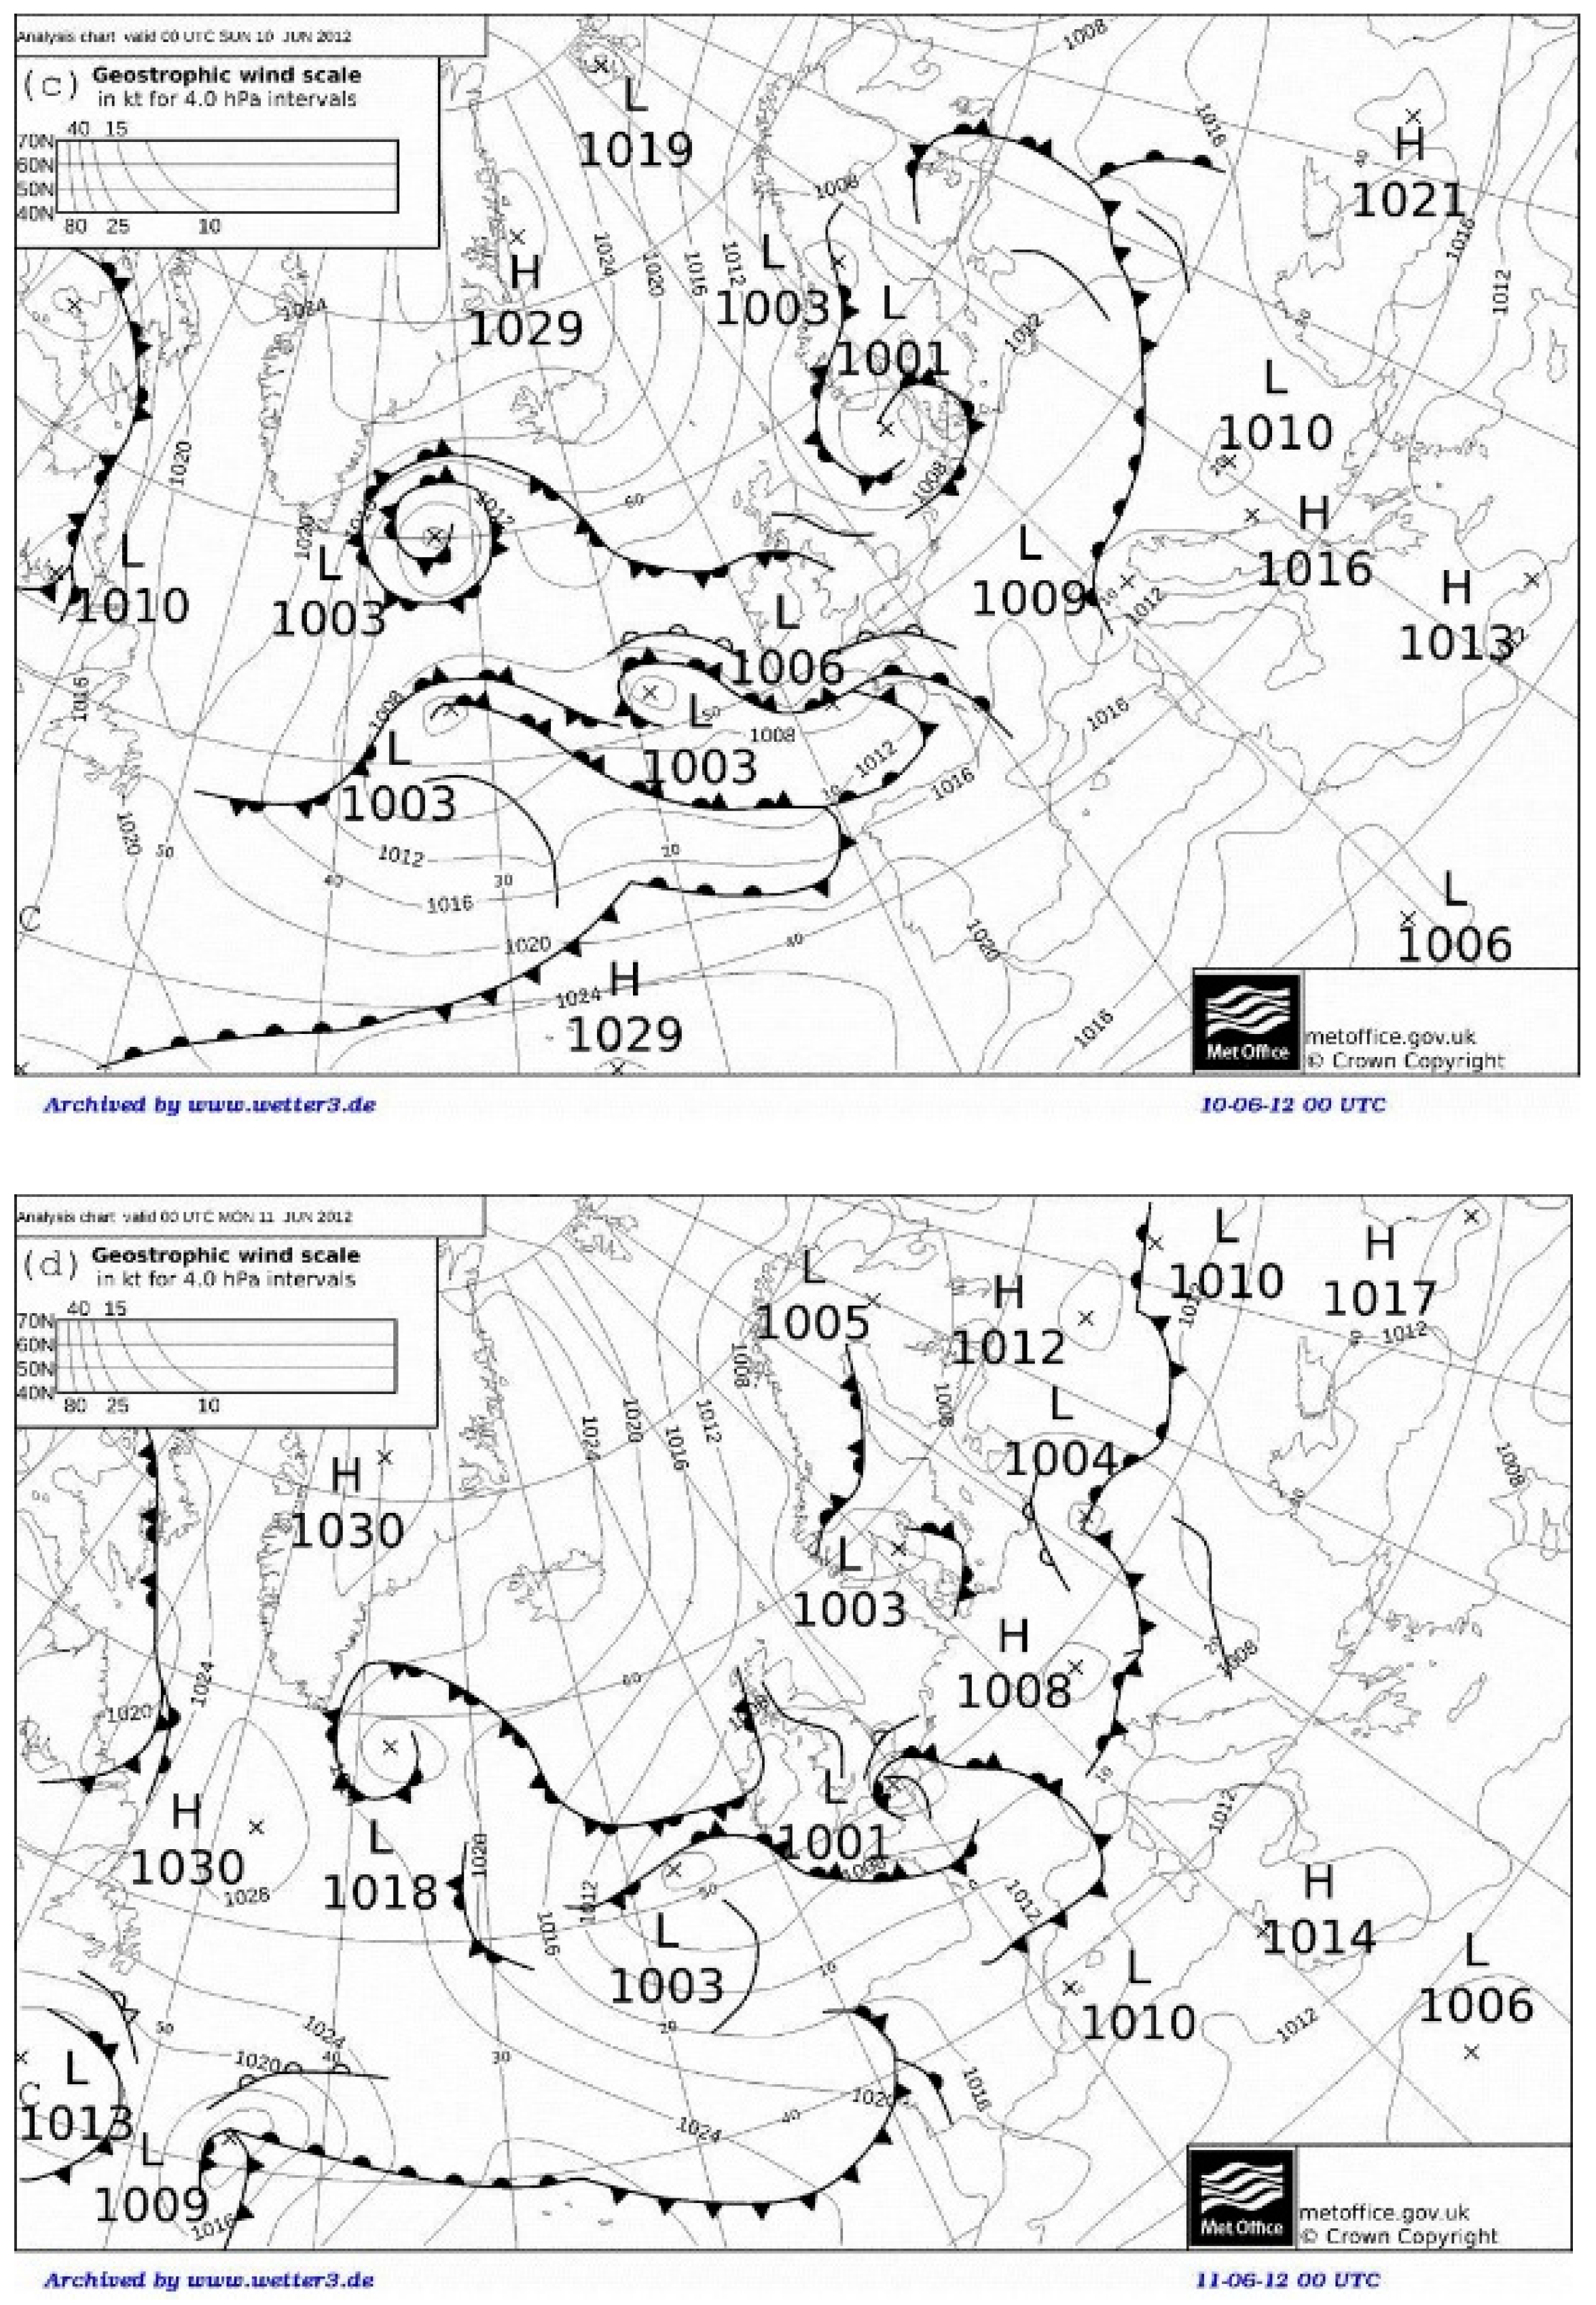
The synoptic-scale activity of the period was also characterized by the formation of Hurricane Chris (18–22 June) [50,51] and Tropical Storm Debby (23–27 June) [52,53] in the North Atlantic Ocean. The formation of these two strong cyclonic systems explains the amount of water vapor in the air masses [54,55,56] exported to Europe from the western tropical Atlantic during the period under discussion. According to the official National Hurricane Center report on Hurricane Chris [50], (see also the discussion in [51]), the formation of the pre-Chris cyclone was the result of the tropical transition of a cyclone of non-tropical origin in the North Atlantic Ocean. It has been earlier demonstrated (see [51] and references herein), during such processes, the extra-tropical cyclone transforms from a cold- to warm-core system. Such synoptic processes are commonly preceded by a complex process of co-development of a family of cyclonic systems. As suggested in [51], which details the development of the Chris system, the initial trigger for the formation of the precursor trough was the breakdown of an anticyclonic wave that took place over the northwest Atlantic Ocean on 12 June 2012 near 40° N, 55° W (indicated by C near the left-bottom corners of Figure 5a–d). As a separate system, pre- Chris started developing near Bermuda on 12–13 June. After that, the system moved southeastward and became stationary southwest of Bermuda by 15 June. The extra-tropical system strengthened over Bermuda around 1800 UTC on 15 June and continued developing till about 19 June. The pre-Chris cyclone made the transition to a tropical storm when it was centered south–southwest of Cape Race, Newfoundland. Chris became a hurricane at an unusually high latitude early on 21 June and reached its peak intensity at around 1200 UTC on 21 June, when the system was located southeast of Cape Race. During the following two days, the system gradually weakened and by 1800 UTC on 24 June, as it was already a post-tropical cyclone, it was absorbed by a much larger baroclinic low-pressure system northwest of the island of Flores in the westernmost Azores.
Figure 5.
Met Office analysis charts at 0000 UTC on (a) 08, (b) 09, (c) 10, (d) 11 June 2012 as indicated in each panel. The analysis charts mark the sea level pressure (hPa), front positions, and extrema of the surface pressures, with the maximum and minimum marked by H and L, respectively. The pressure contour intervals are 4 hPa. Analysis charts are Crown copyrighted.
The weather charts (SLP) presented below provide information on synoptic developments preceding the formation of an apparent trigger of the process. The charts are based on the British Met Office analysis, which is produced operationally by forecasters using a range of products, including the output of the Met Office Unified Model and the forecasters’ expertise. The locations of the cyclones occurring in the North Atlantic during the period of the study are assessed manually, based on surface pressure minima, using 6-hourly Met Office analysis charts. As follows from the charts, the process of formation of the above-mentioned starting system was preceded by the development of a deep cyclone (central pressure 982 hPa) over the northwest Atlantic Ocean on about 8 June 2012 (Figure 5a) near 53° N, 4° W. The development was followed by a series of waves seen on the maps for 9 June (Figure 5b), 10 June (Figure 5c), and 11 June (Figure 5d). Between 8 and 11 September 2012 (Figure 5a–d), a series of cyclones developed successively over the North Atlantic, eventually leading to the formation of an extra-tropical cyclone on 12 June, which later became Hurricane Chris, and then to other intense synoptic events that essentially defined the 2012 summer precipitation anomaly.
During the middle part of June, the Inter-tropical Convergence Zone migrated northward to a position over southern Mexico. According to the official TC report on Tropical Storm Debby from the National Hurricane Center [53], the formation of this powerful storm of the period occurred almost simultaneously with that of Hurricane Chris. Pre-Debby started its development as a large tropical storm that formed in the south–central Gulf of Mexico [53]. Mid-level cyclonic circulation formed over the eastern Gulf of Tehuantepec on 18 June. A weak surface low-pressure area developed in association with this feature by 19 June. The low-pressure area gradually moved north–northeastward across the Yucatan peninsula during the next couple of days to the central Gulf of Mexico. Meanwhile, a large area of showers began moving northwestward across the northwestern Caribbean Sea on 18 June. A portion of the wave reached the southeastern Gulf of Mexico on 20 June and merged with the disturbance near the Yucatan peninsula over the next couple of days.
A trough of low pressure formed over the southeastern Gulf of Mexico on 22 June [53].Tropical Storm Debby formed around 12:00 UTC on June 23 south–southeast of the mouth of the Mississippi River. After its formation, the tropical storm gradually intensified near the northeastern Gulf of Mexico on 24 June. By 25 June, the storm’s center was located over the Florida Peninsula. Debby approached the coast of Florida’s Big Bend on 26 June and made landfall near Steinhatchee, Florida. The cyclone then crossed north-central Florida and weakened to a tropical depression southwest of Gainesville on 27 June. The depression moved across the remainder of north–central Florida, emerging offshore off the northeastern coast of Florida by 12:00 UTC on 27 June. Debby’s circulation began to dissipate on 27 June. The remnants of Debby underwent several reorganizations, and on 28 June, a new circulation center formed between the east coast of Florida and Bermuda. The non-tropical cyclone intensified slightly, slowing and approaching Bermuda. On 29 June, the system became more frontal. Around 18:00 UTC on 30 June, south of Newfoundland, the cyclone degenerated into an open trough [53].
An important role of post-tropical cyclones (PTCs) in rare instances of hazardous precipitation and flooding in mid-latitudes has been demonstrated (see, for example, [57] and references therein). Accurately accounting for PTC data, and especially changes in their trajectories due to interactions with upper-tropospheric jet streams, opens opportunities for reliable warning of the public about the possibility of natural disasters, although the interaction of PTCs with the airflows in mid-latitudes often significantly complicates the forecasting of such weather events, creating challenges for risk management. The poleward trajectory of Storm Debby (and its remnants)—unlike that of Storm Chris—allows this system [57] to be seen as the key factor determining the intensity of extreme weather events in Europe during June and July 2012, as well as the anomalous nature of that year’s summer precipitation.
5. Trajectories of Air Parcels
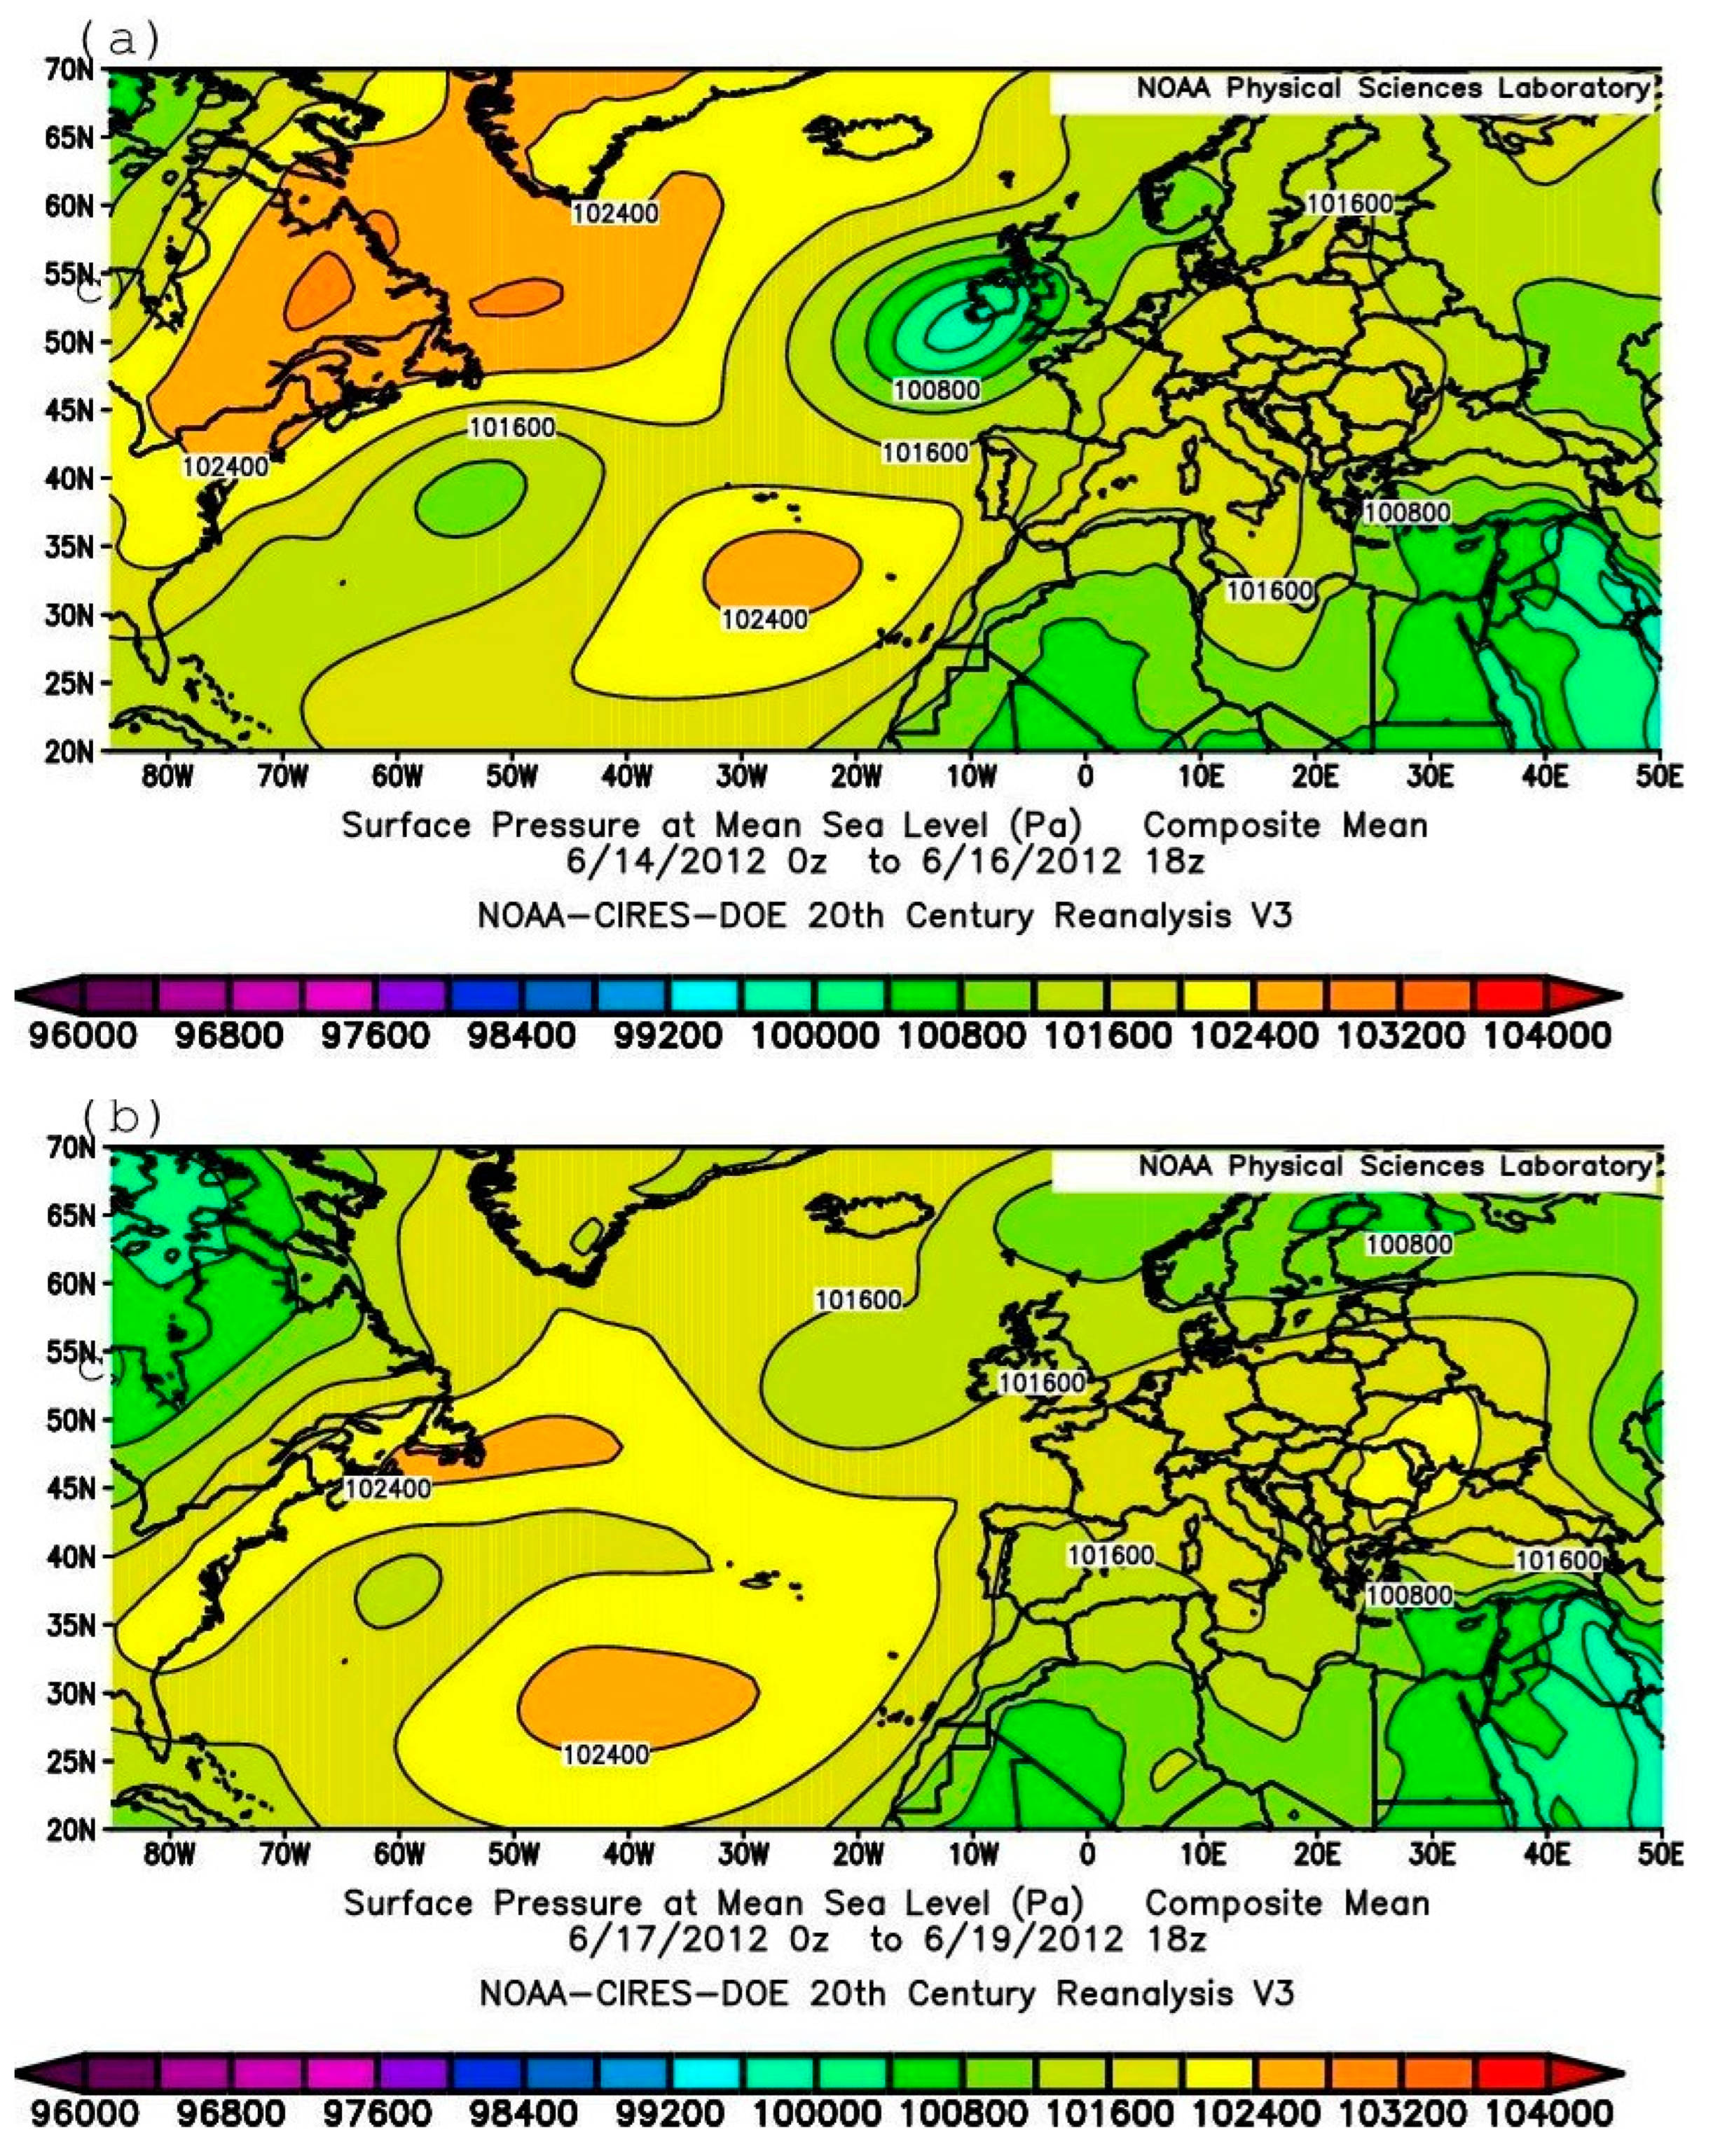
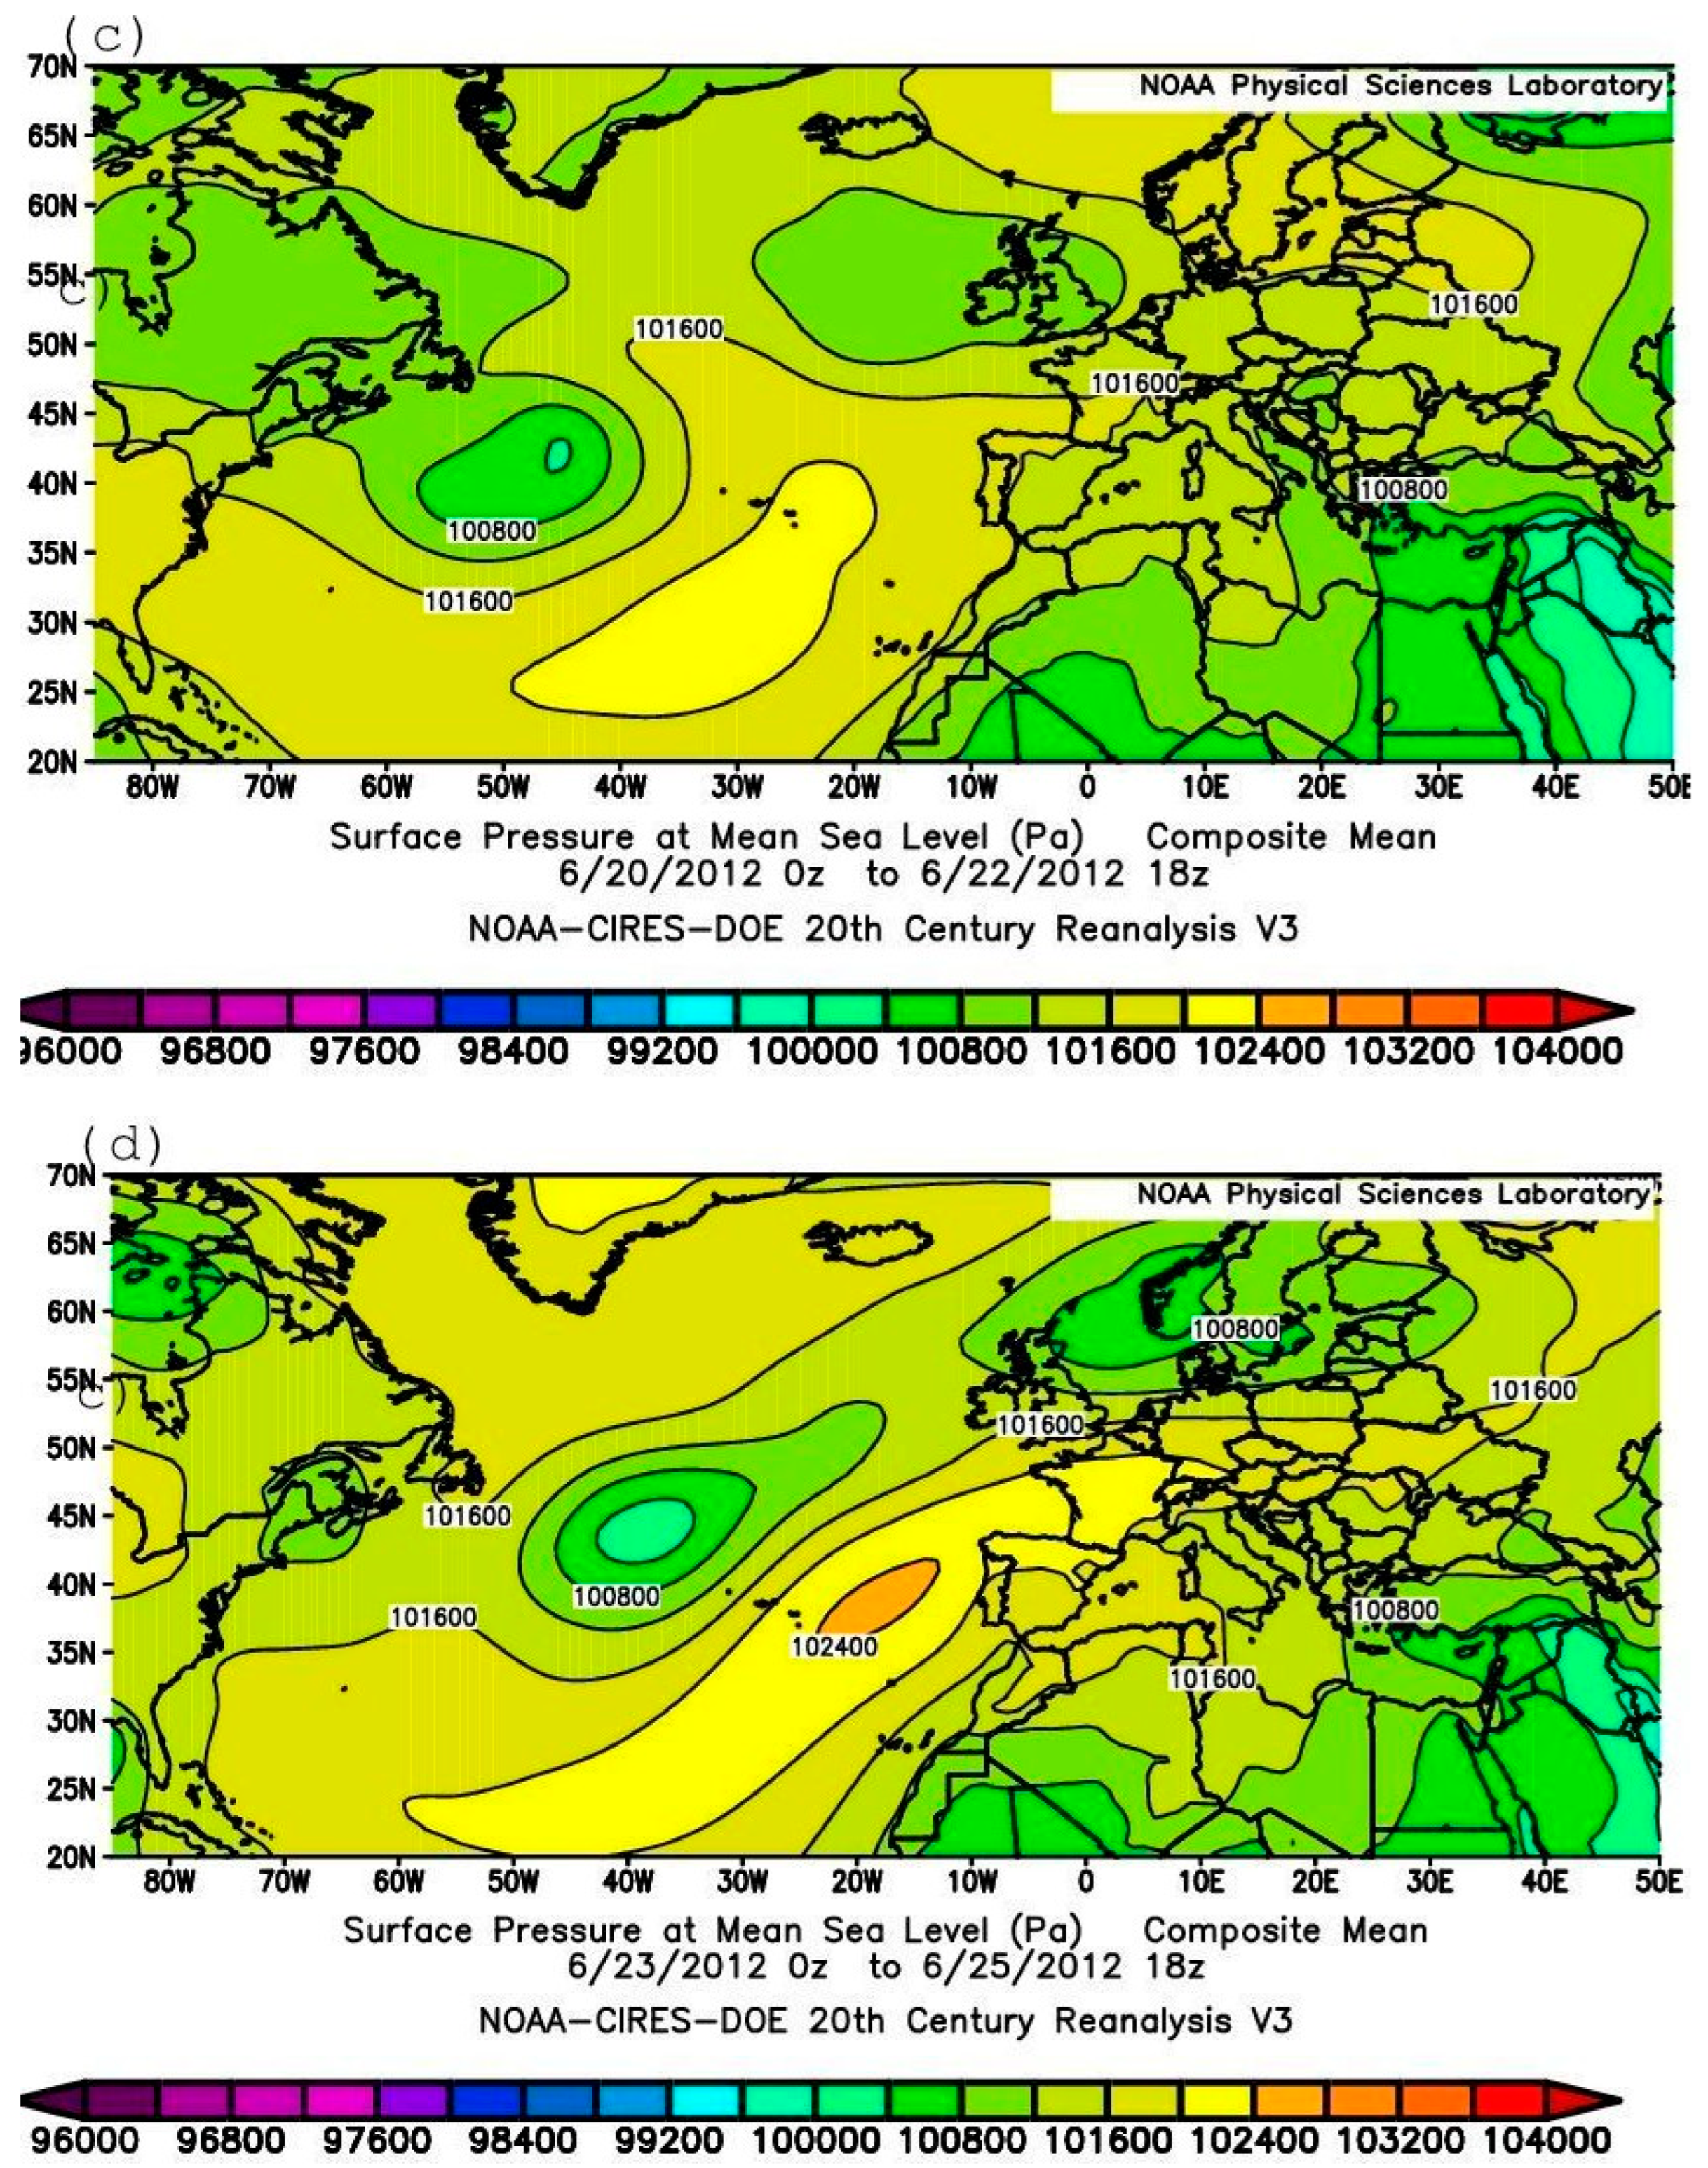
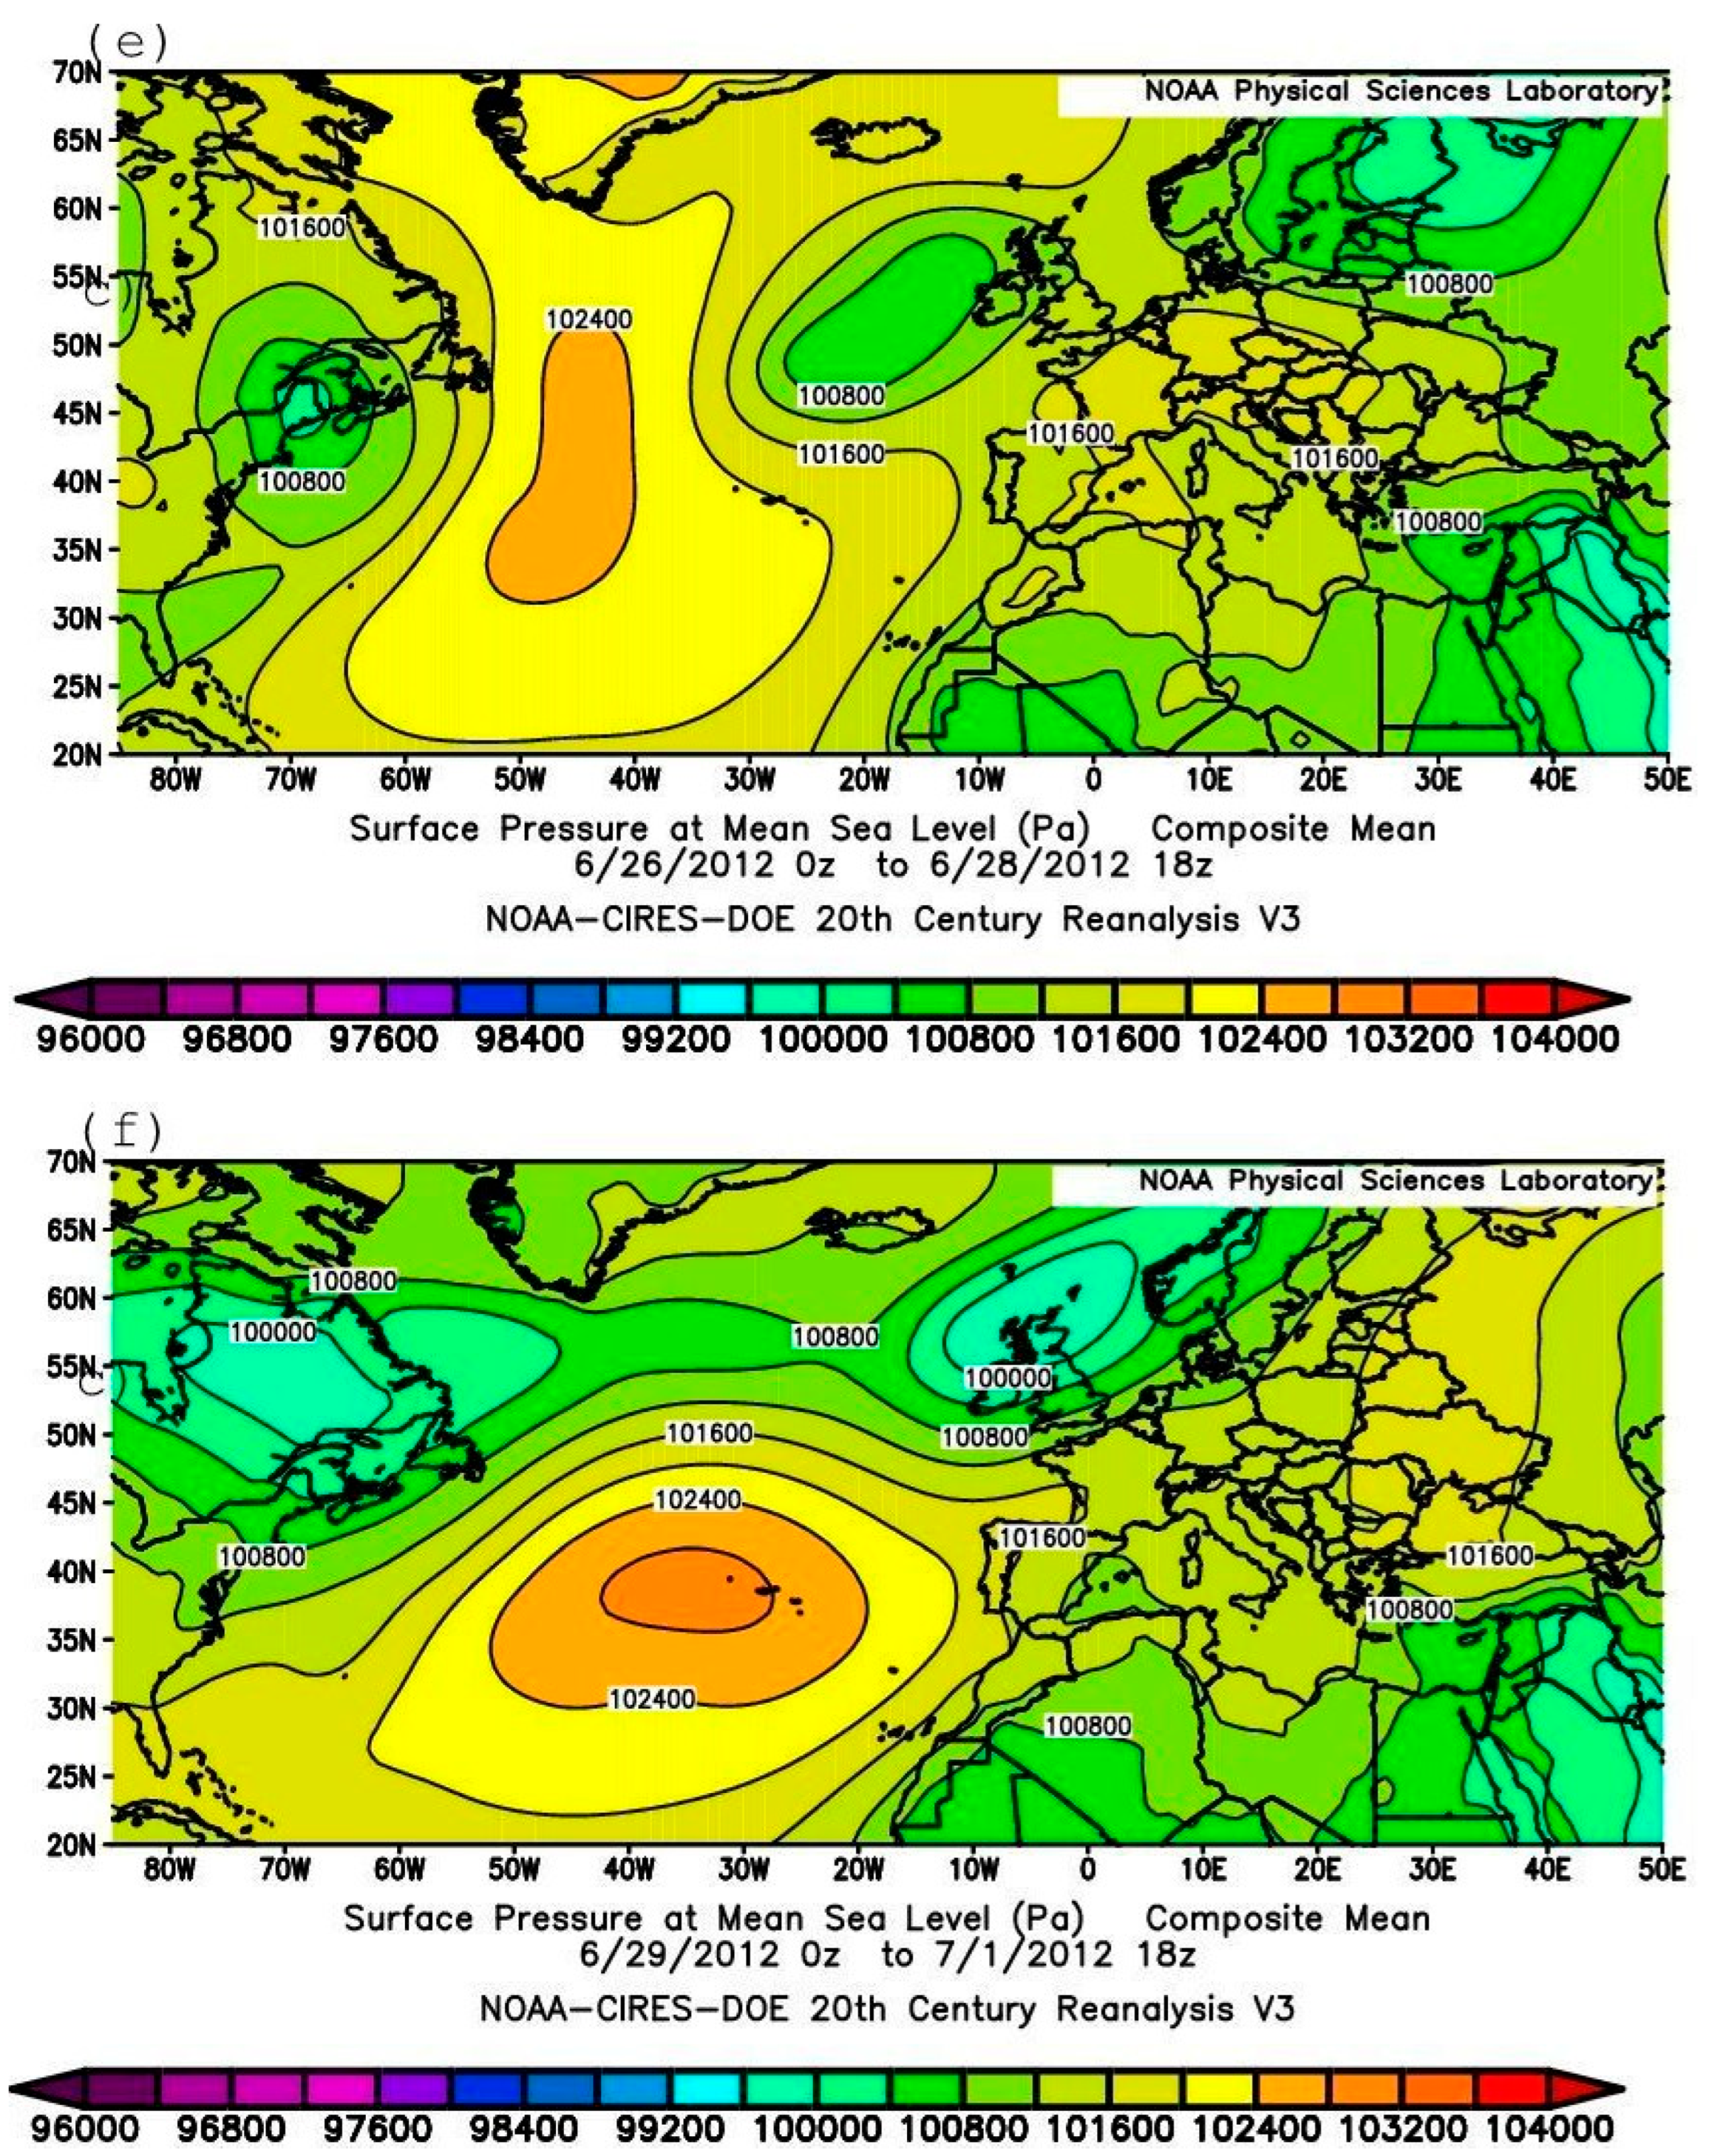
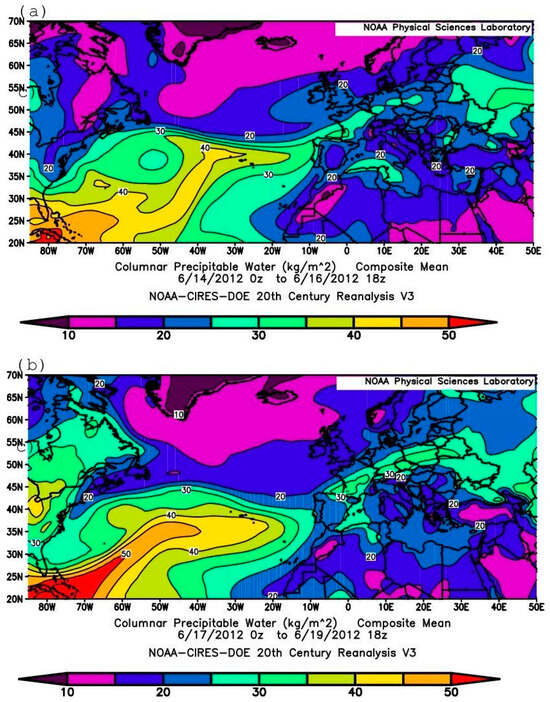
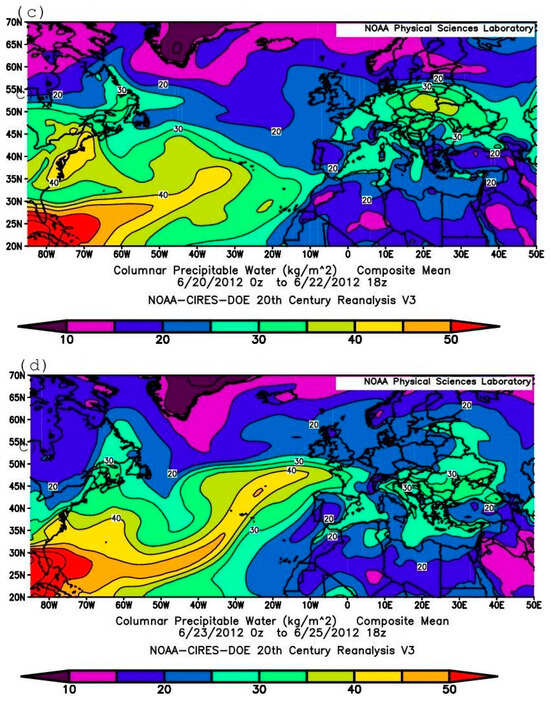
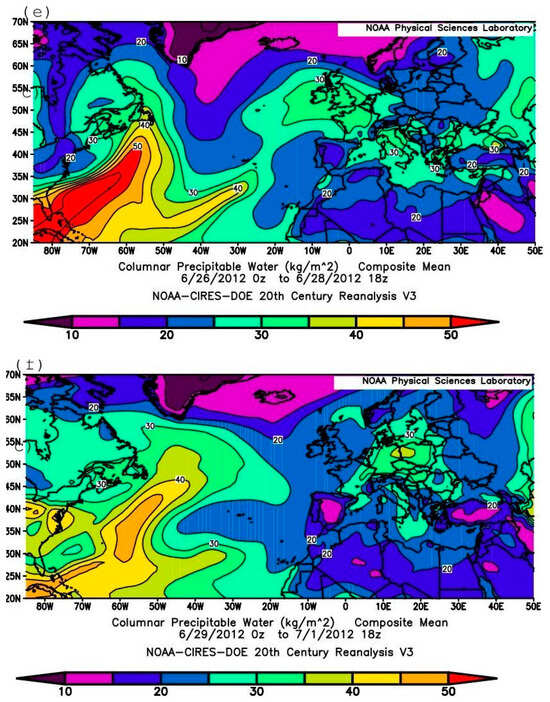
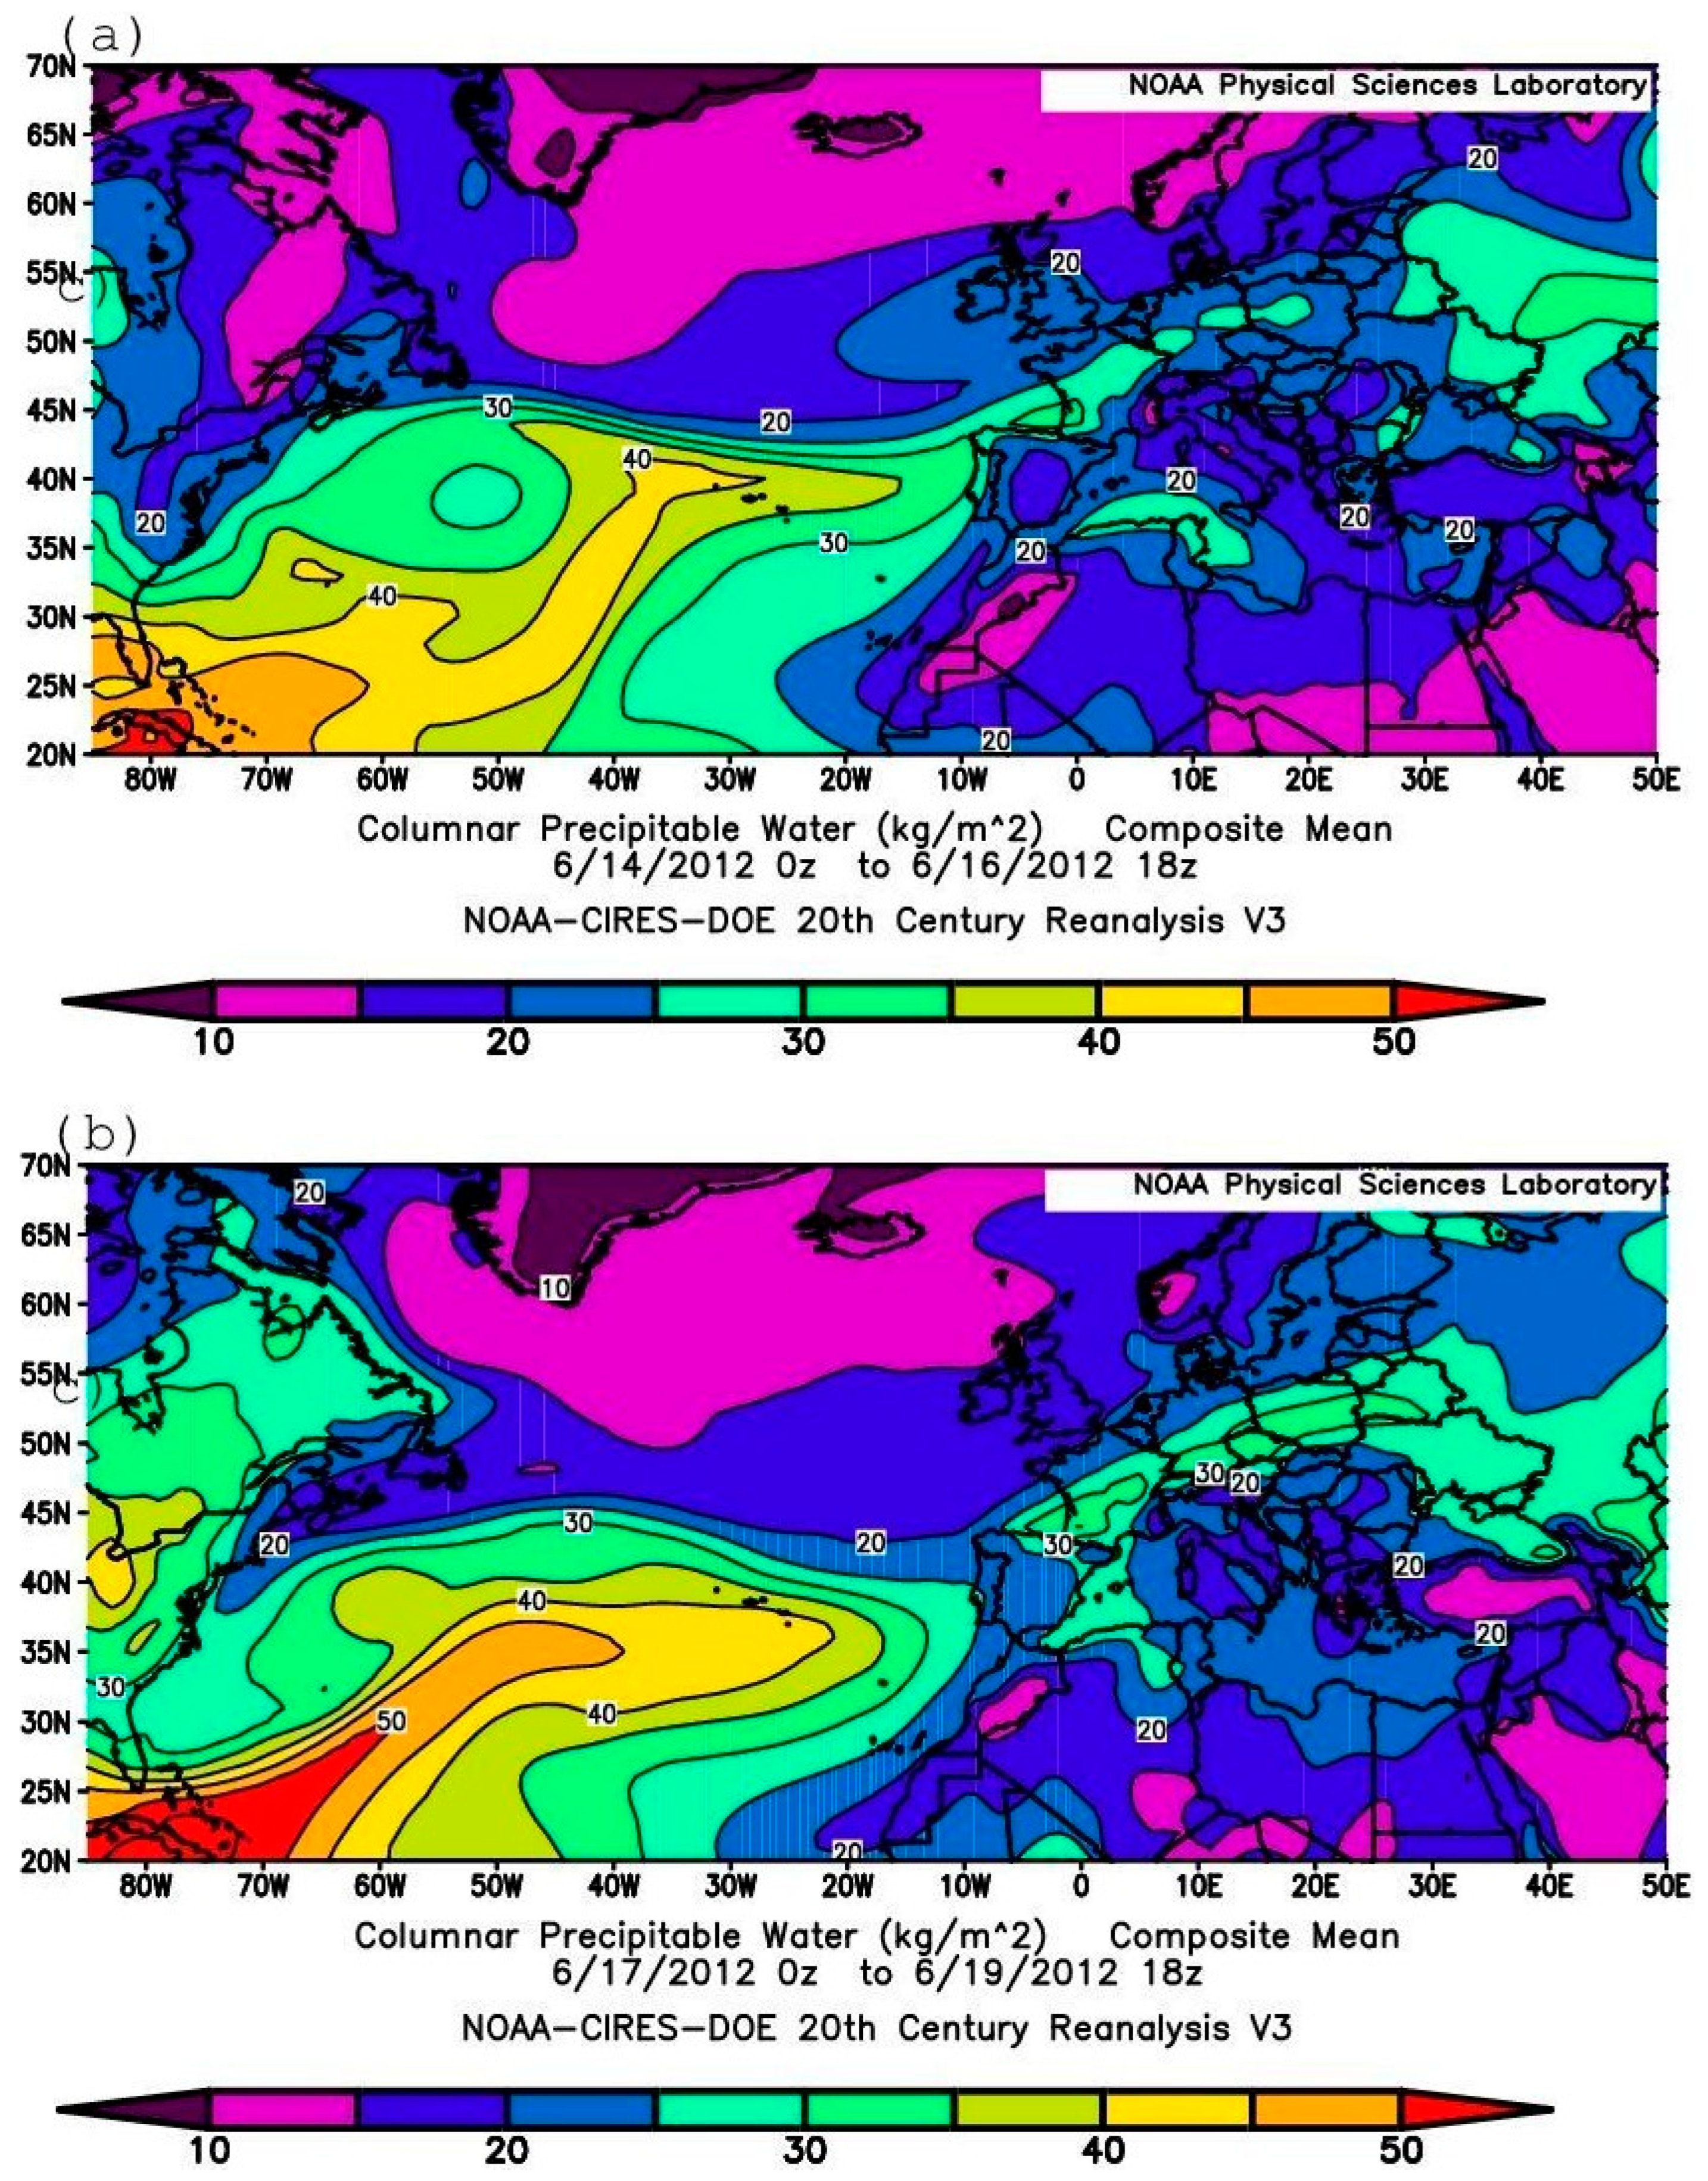
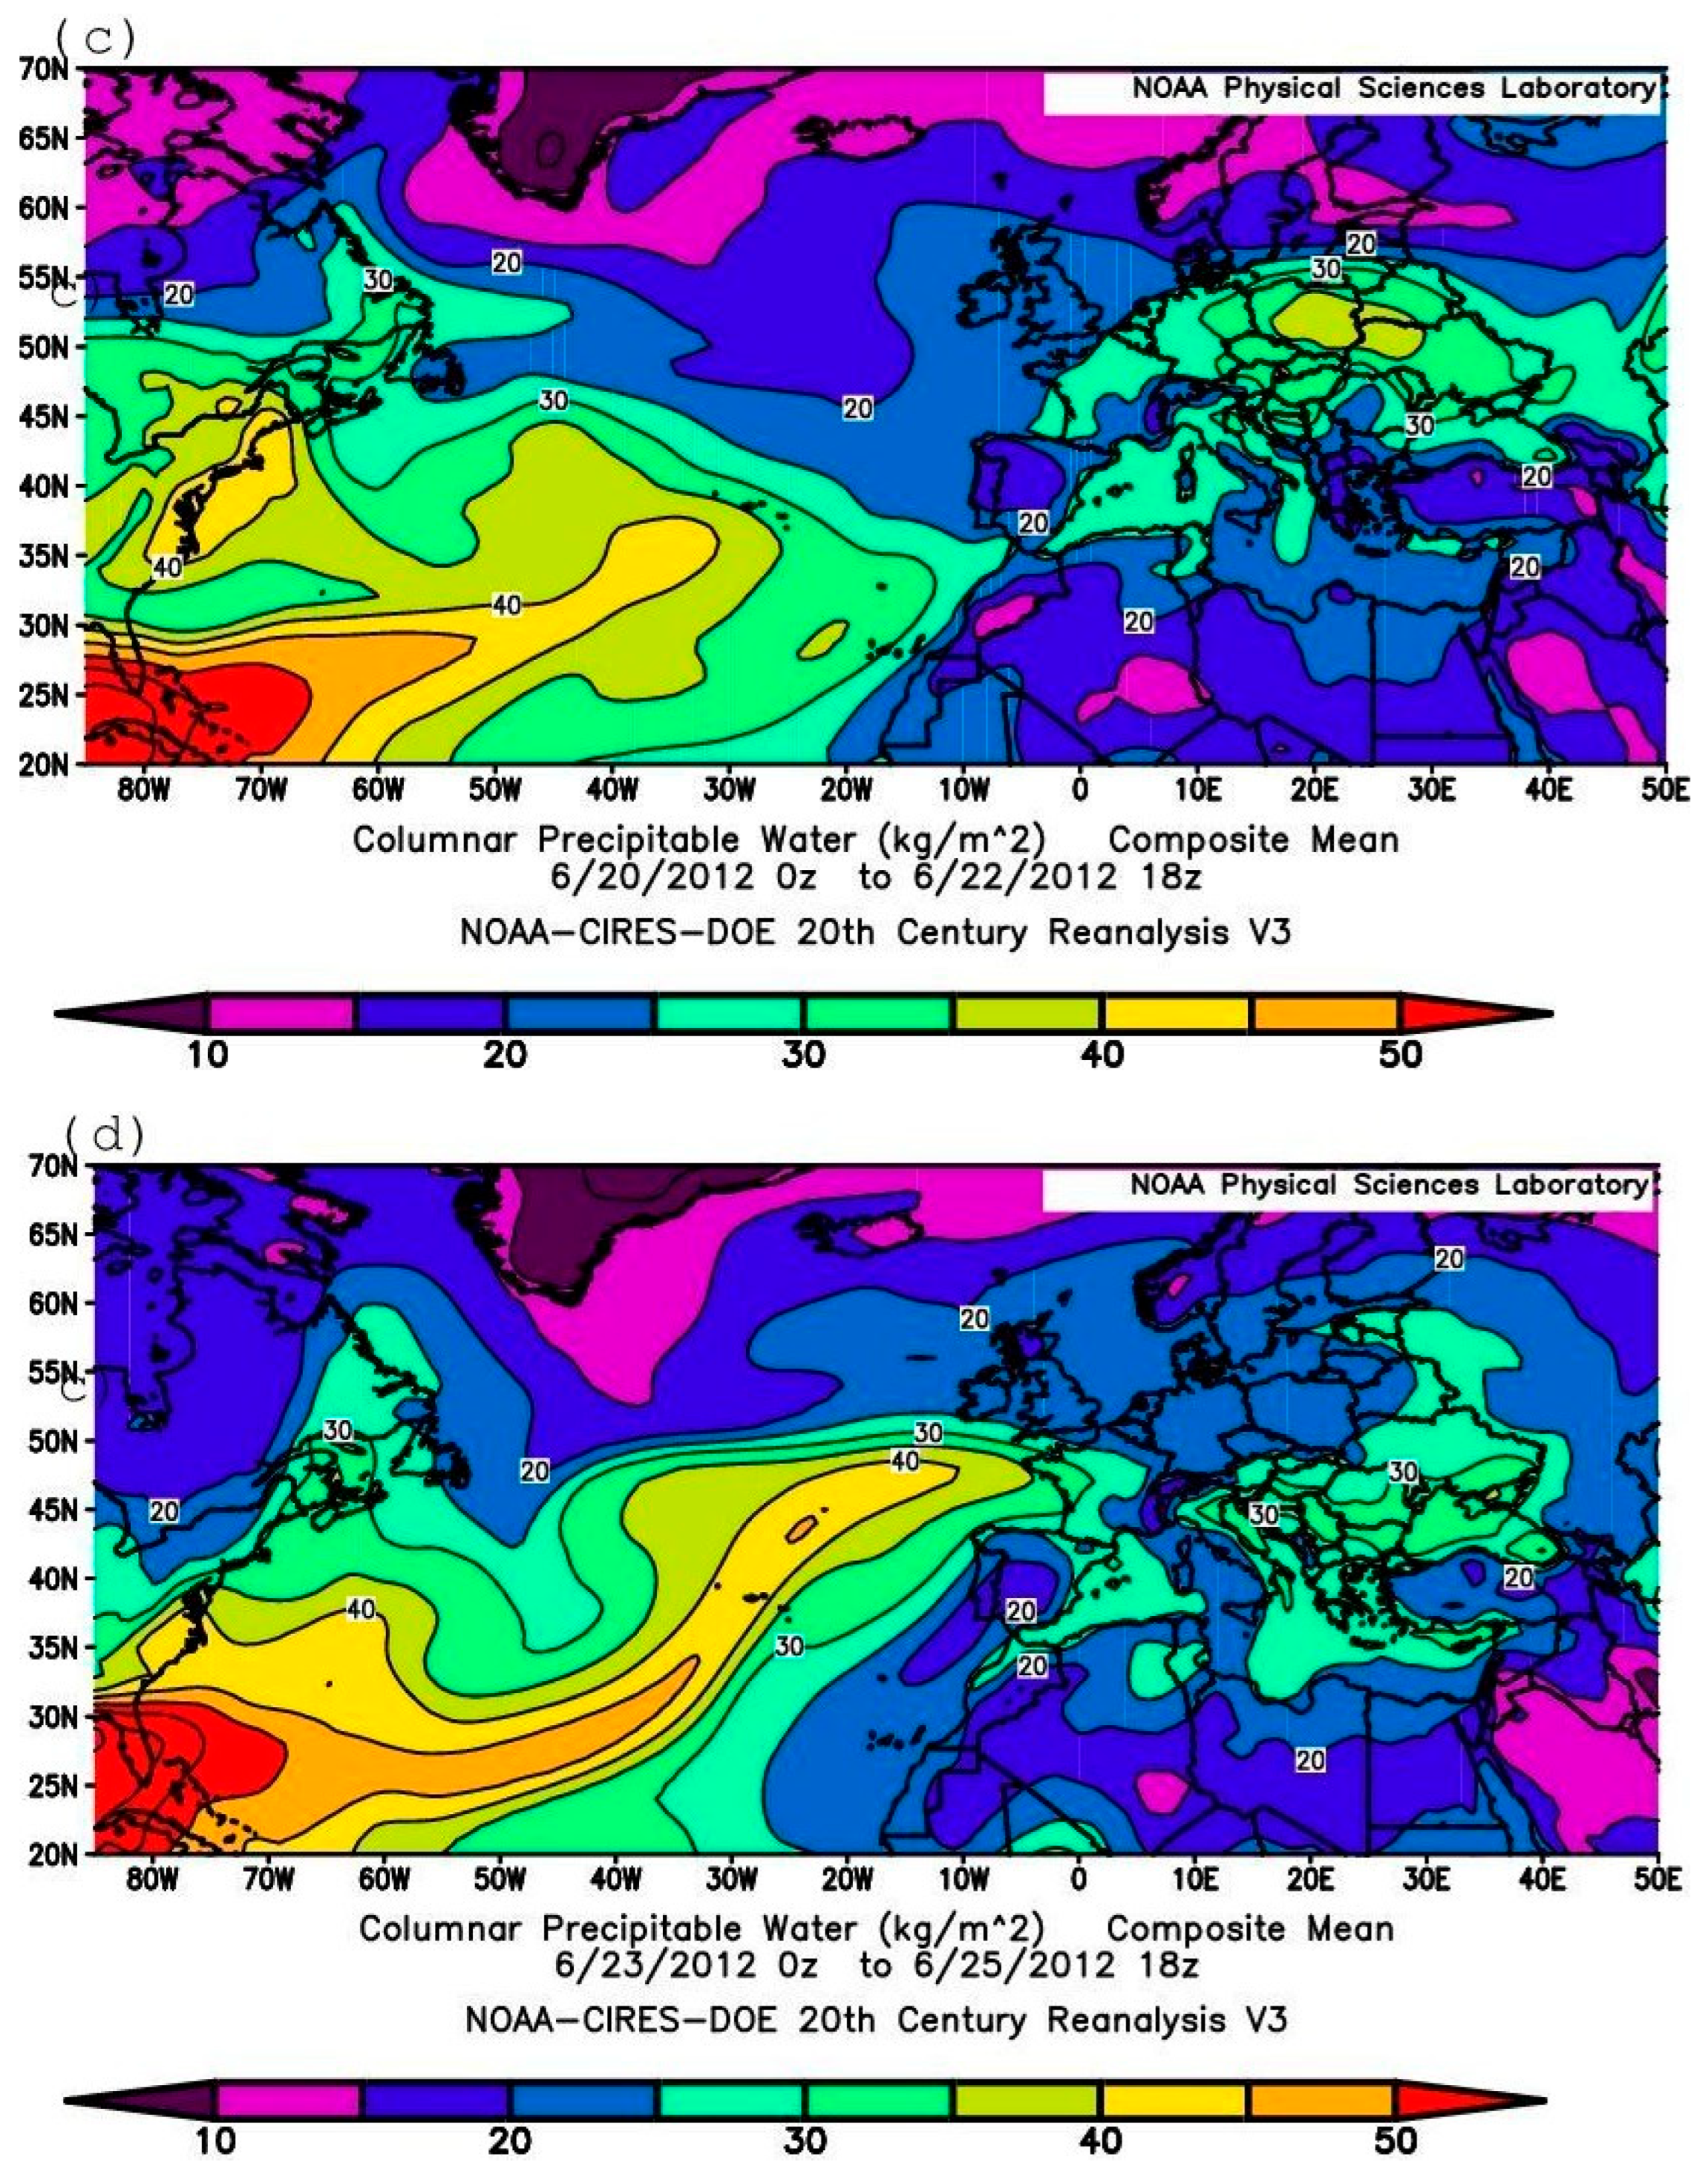
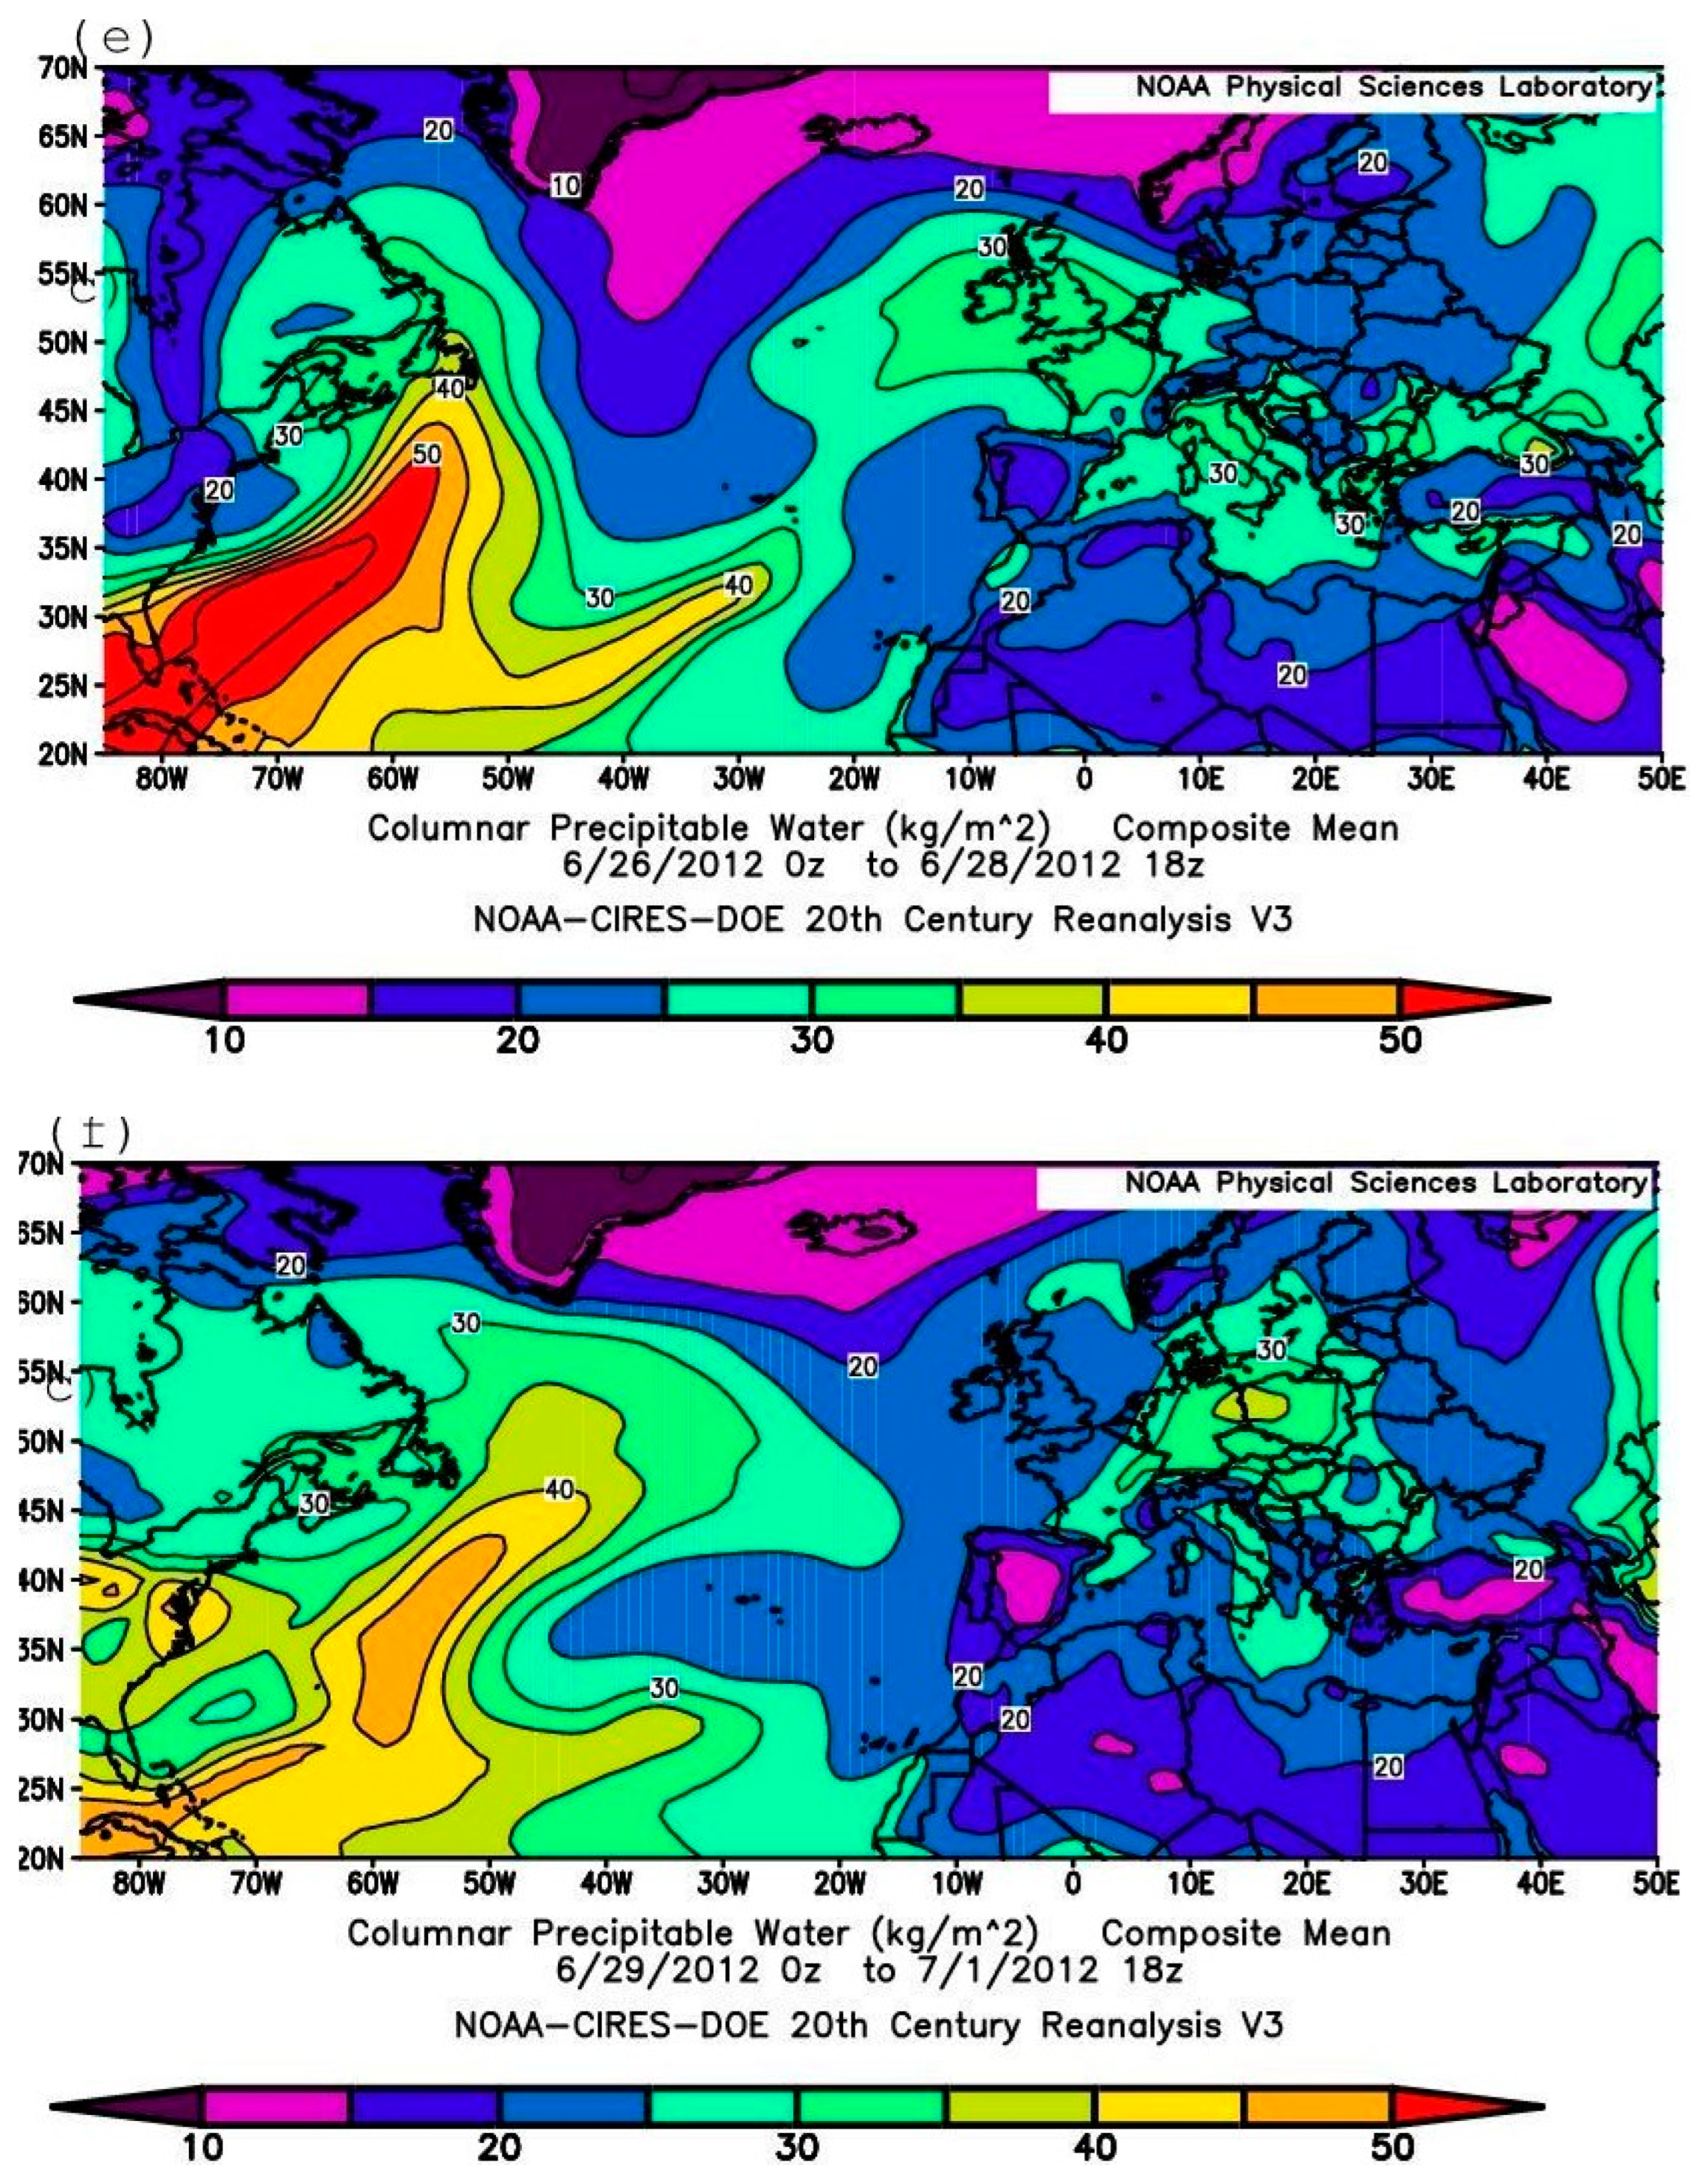
To understand the role of Debby in the large-scale synoptic process under analysis, maps of the spatial distribution of three-day mean sea level pressure (Figure 6a–f) and CPW (Figure 7a–f) were constructed for the periods of 14–16 June, 17–19 June, 20–22 June, 23–25 June, 26–28 June, and 29 June–1 July, respectively. As follows from Figure 6a, the three-day sea level pressure distribution pattern for 14–16 June was characterized by the presence of a deep cyclone located southwest of the British Isles and another cyclone in the western part of the sub-tropical zone of the North Atlantic. Also noteworthy is the presence of two anticyclones: one centered over Newfoundland and Greenland, and the other over the Azores Islands. Over the next five three-day periods (Figure 6b–f), a strong cyclone formed over or near the east coast of North America, the anticyclone weakened over North America, the Azores Anticyclone gradually strengthened, and by 23–25 June (Figure 6d), a narrow low-pressure area formed, extending from the western sub-tropical and then central North Atlantic to northwestern Europe. Figure 7a–f show that between 14 June and 1 July, a large amount of high-CPW air was transported from the southwestern North Atlantic to Europe. The direction of the moist air streams (towards the north–northeast and east) explains a substantial (>30 kg m−2) amount of moist air observed during 4–7 July 2012 over Europe and (exceeding 40 kg m−2—not presented) the Black Sea region. These conclusions are further supported by the results of ensemble forward trajectory calculations, which provide a general overview of the air transport during the period. The role of the water vapor originating from the area of activity of Debby in observed extreme rains in Europe appears evident.
Figure 6.
Maps with 3-day composite SLP for (a) 14–16 June, (b) 17–19 June, (c) 20–22 June, (d) 23–25 June, (e) 26–28 June, (f) 29 June–1 July 2012, shading interval 400 Pa. [based on the NOAA CIRES DOE 20th century 20CRV3 reanalysis data].
Figure 7.
Maps with 3-day composite CPW for (a) 14–16 June, (b) 17–19 June, (c) 20–22 June, (d) 23–25 June, (e) 26–28 June, (f) 29 June–1 July 2012.
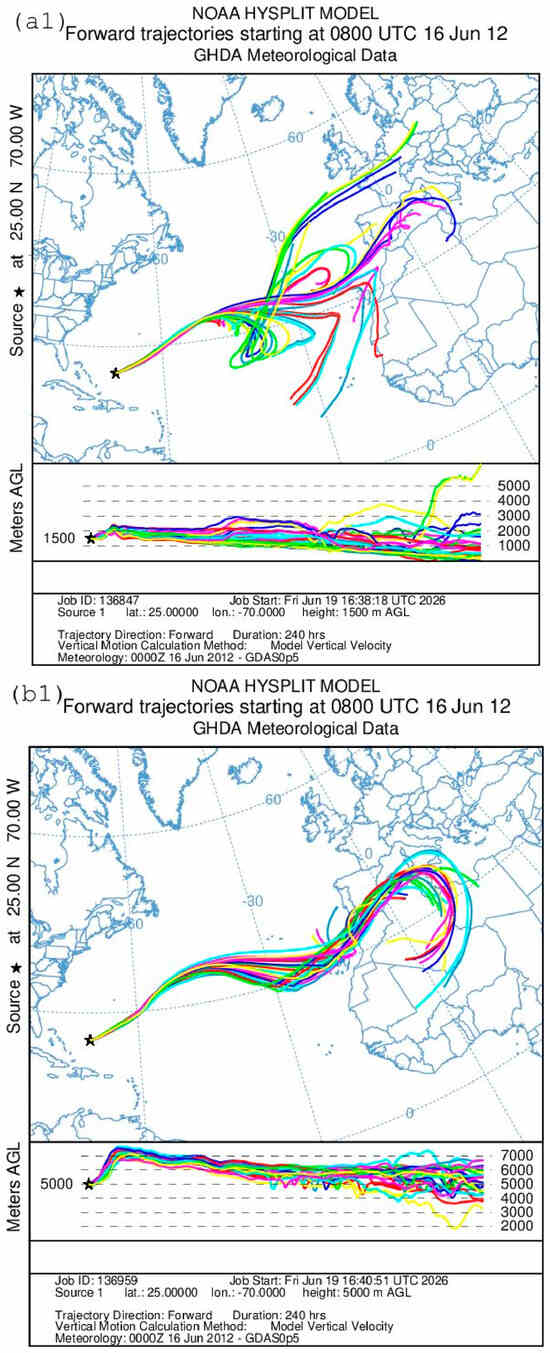
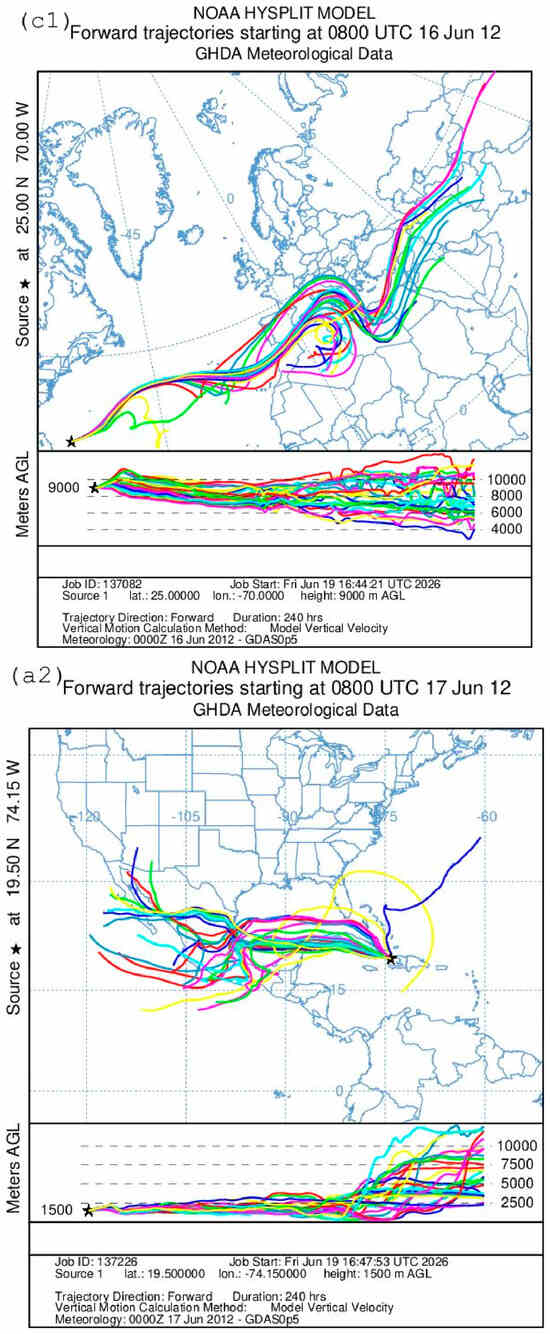
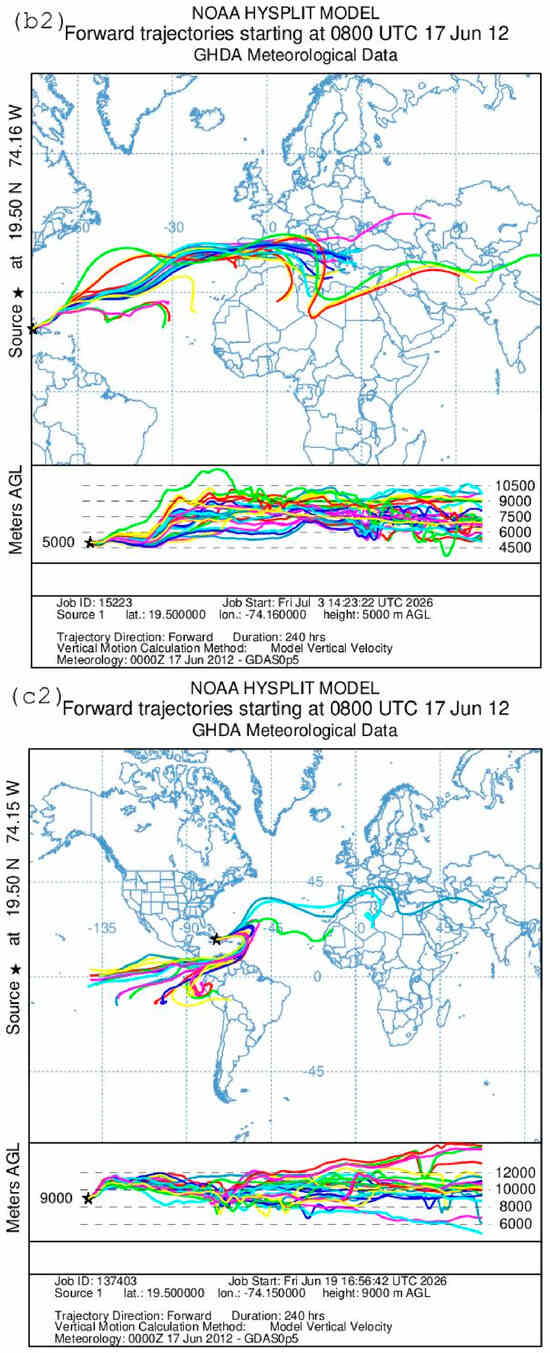
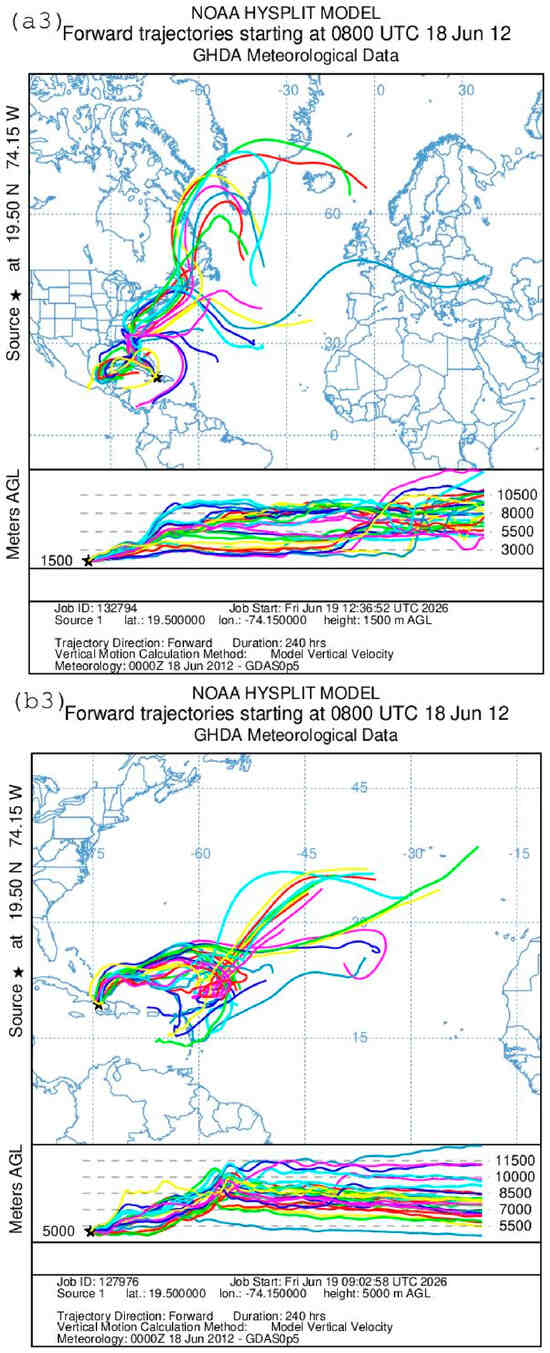
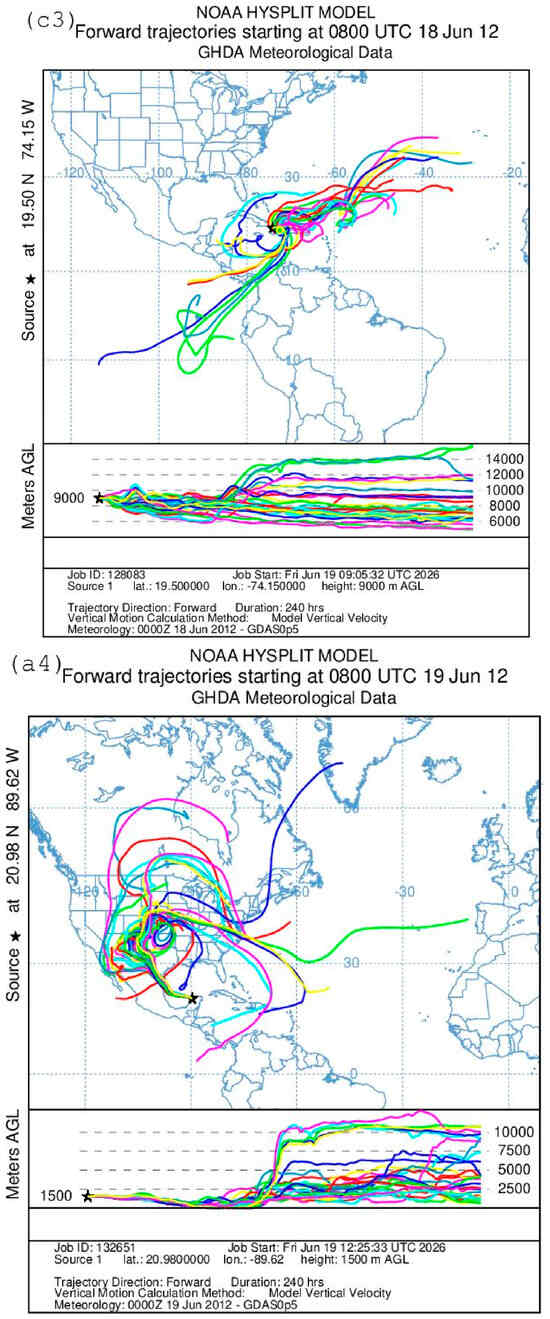
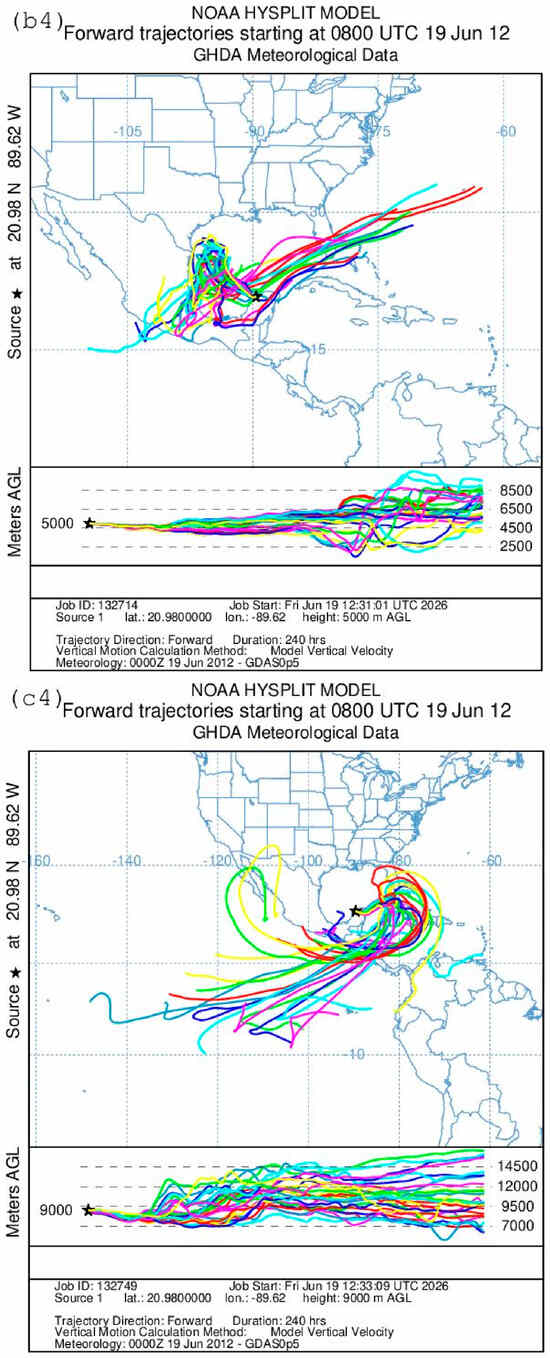
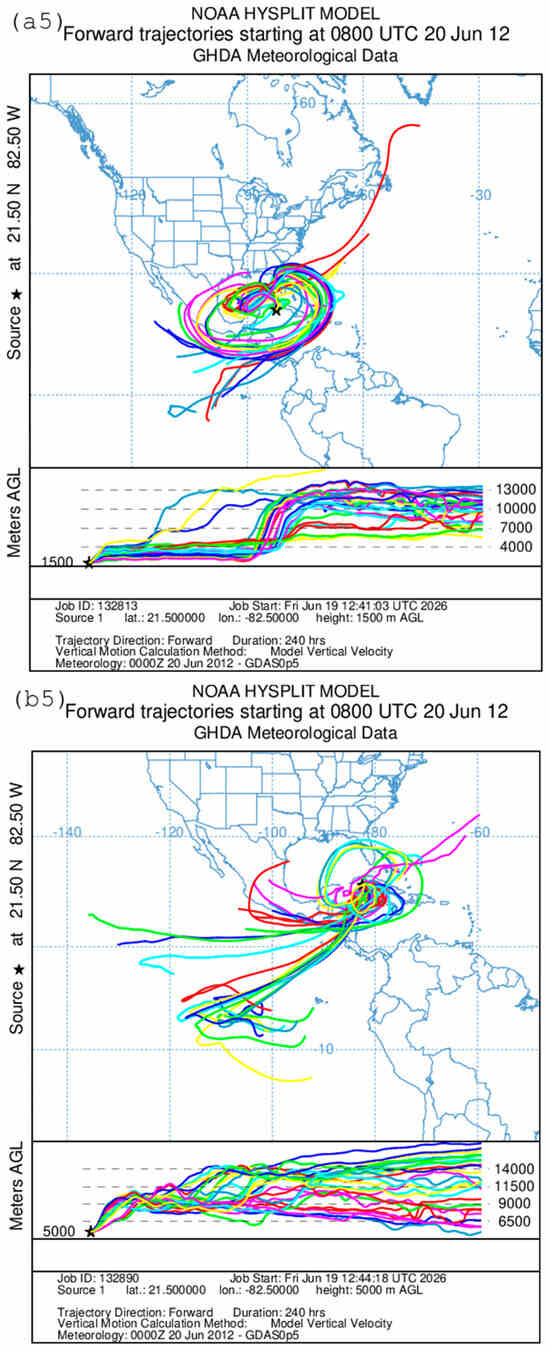
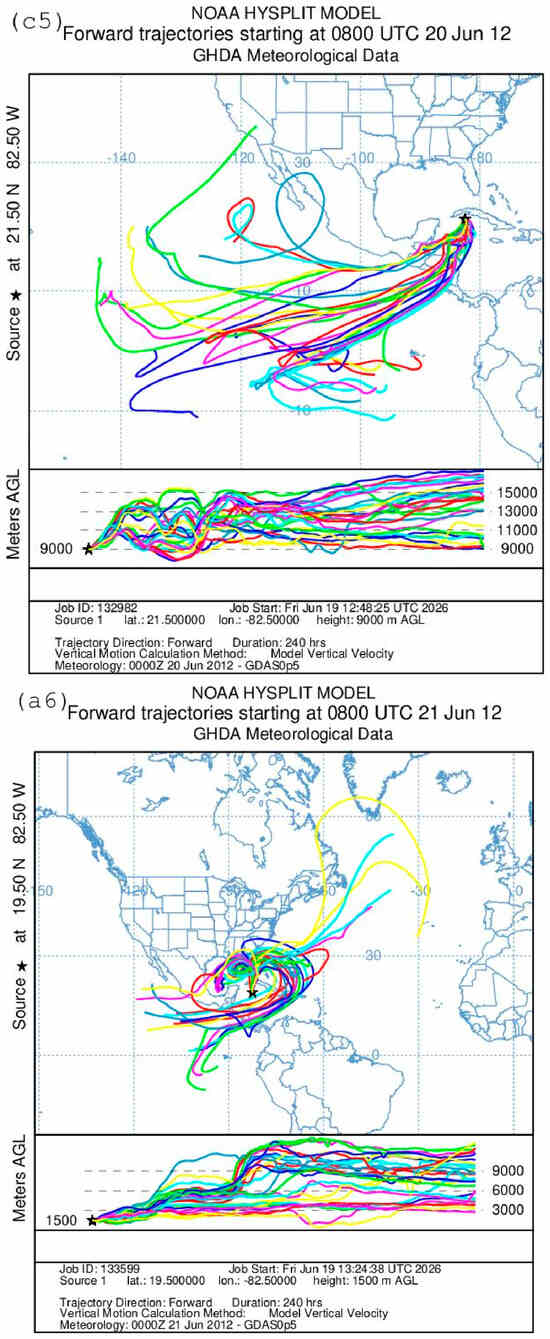
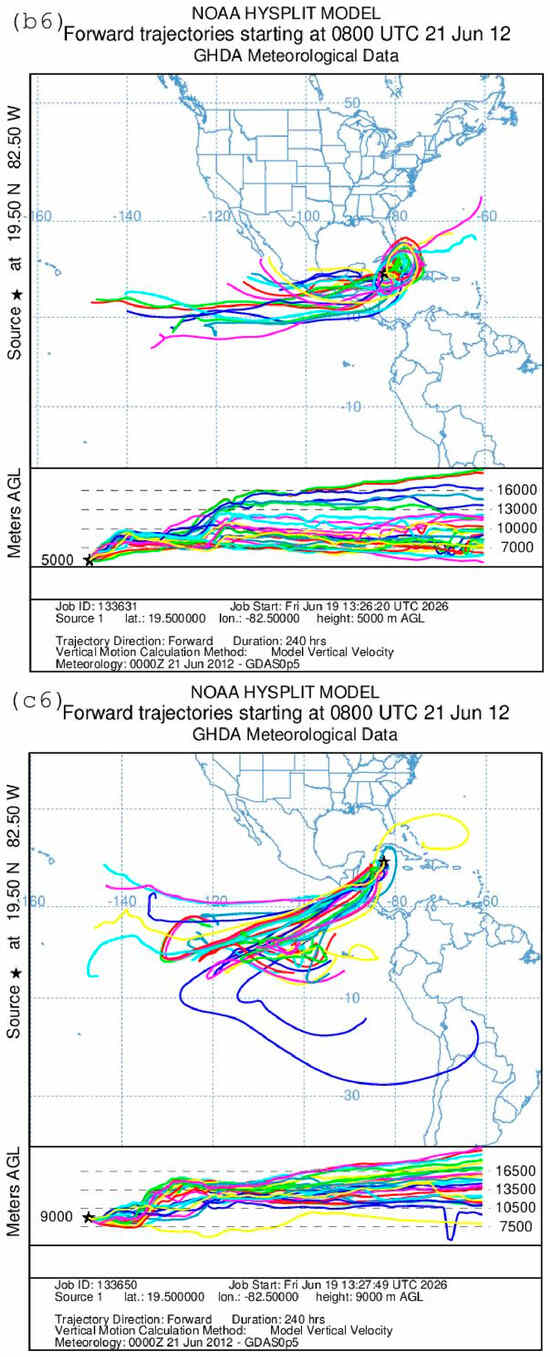
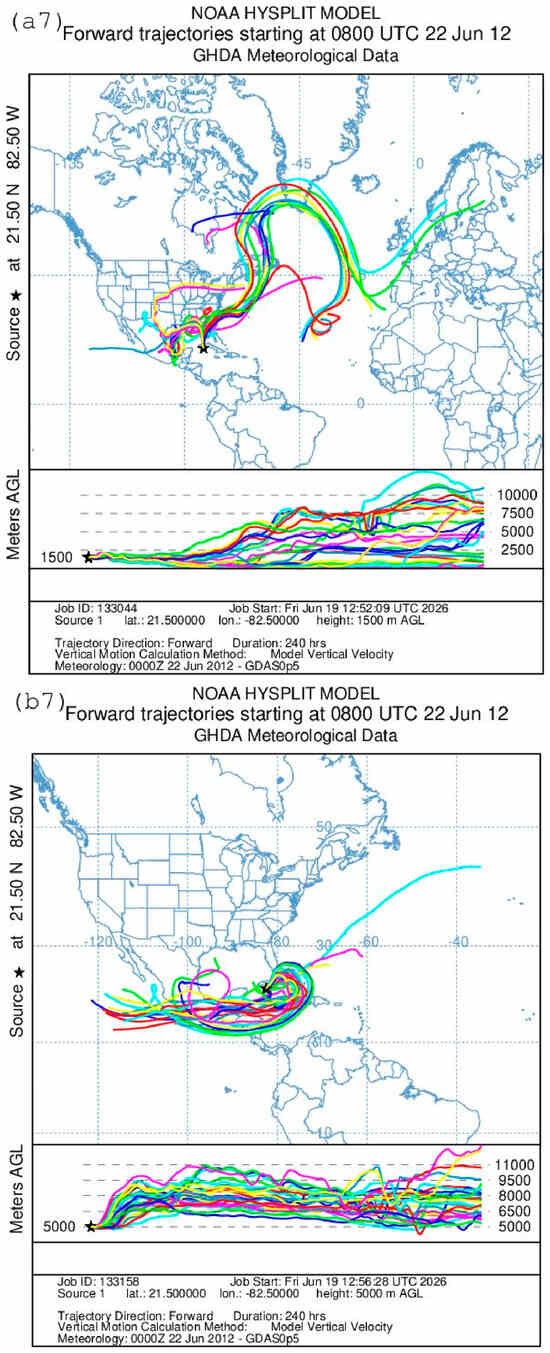
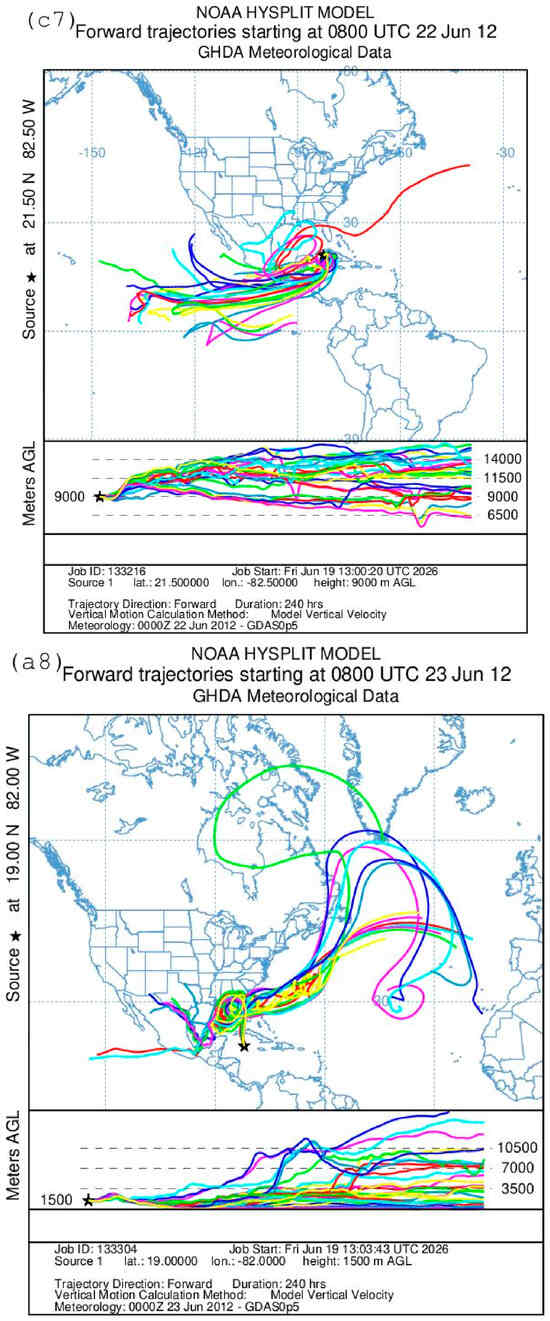
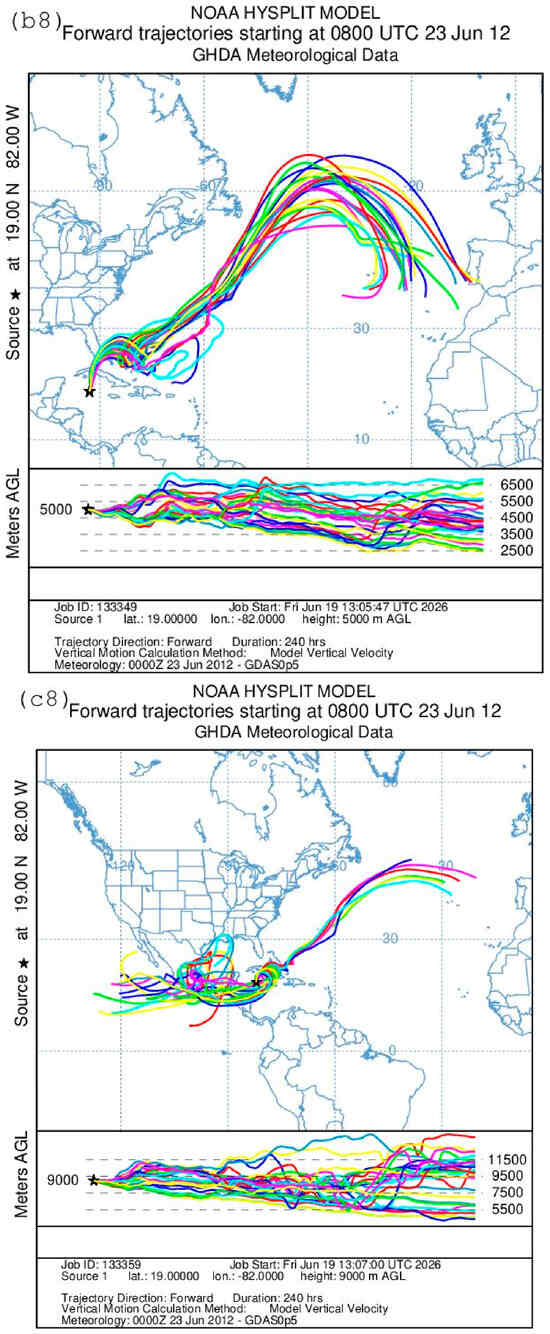
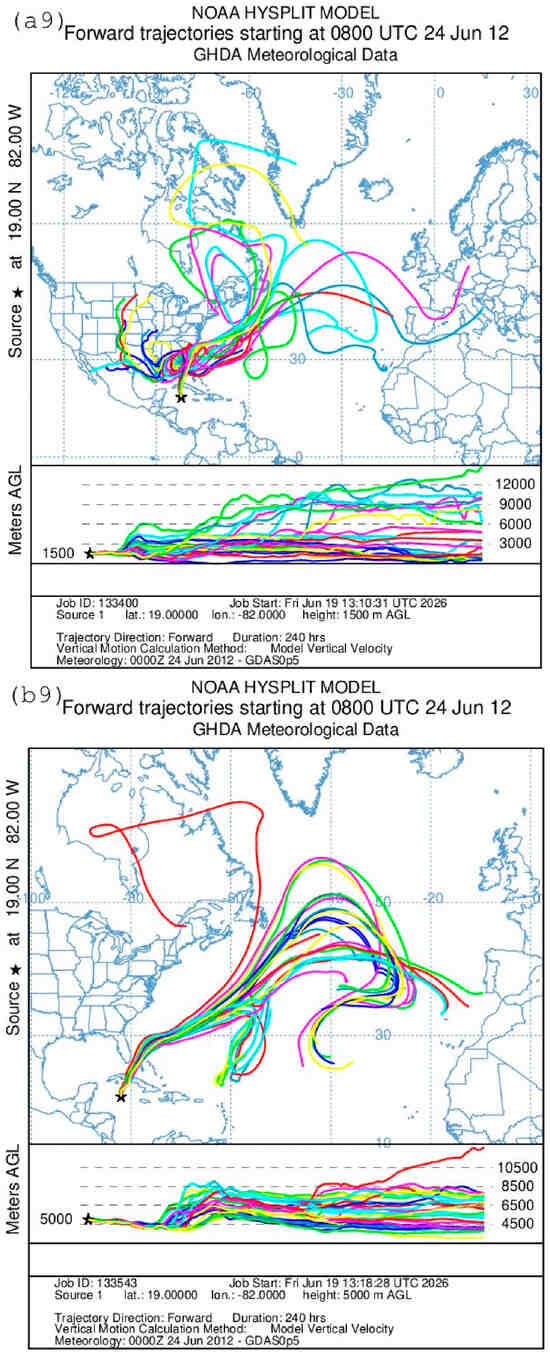
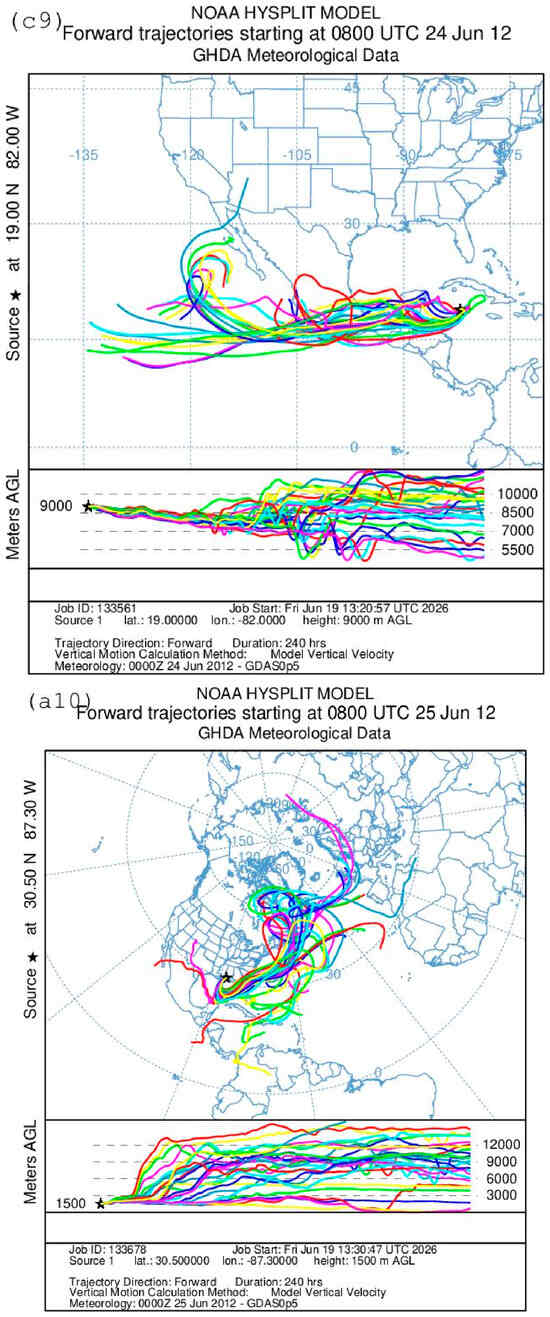
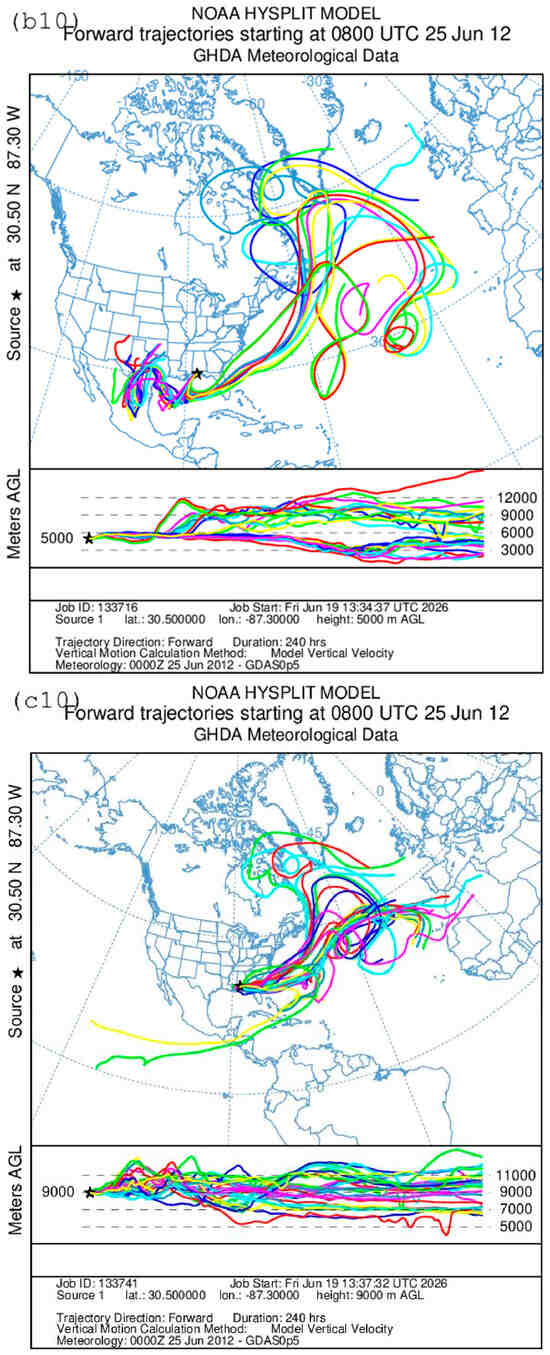
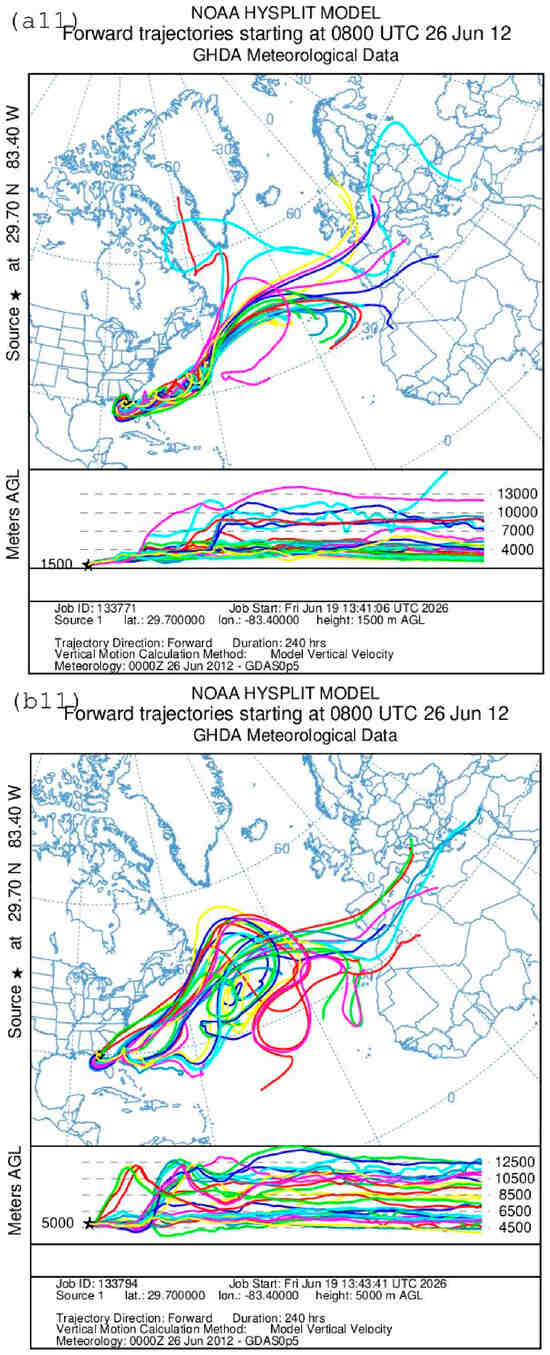
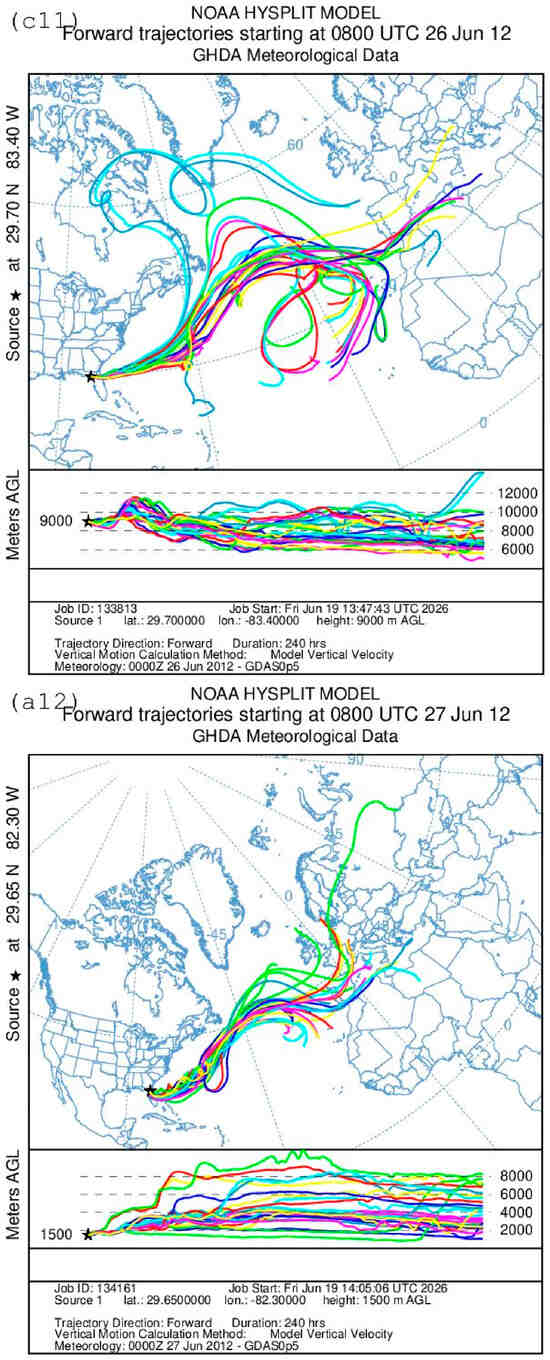
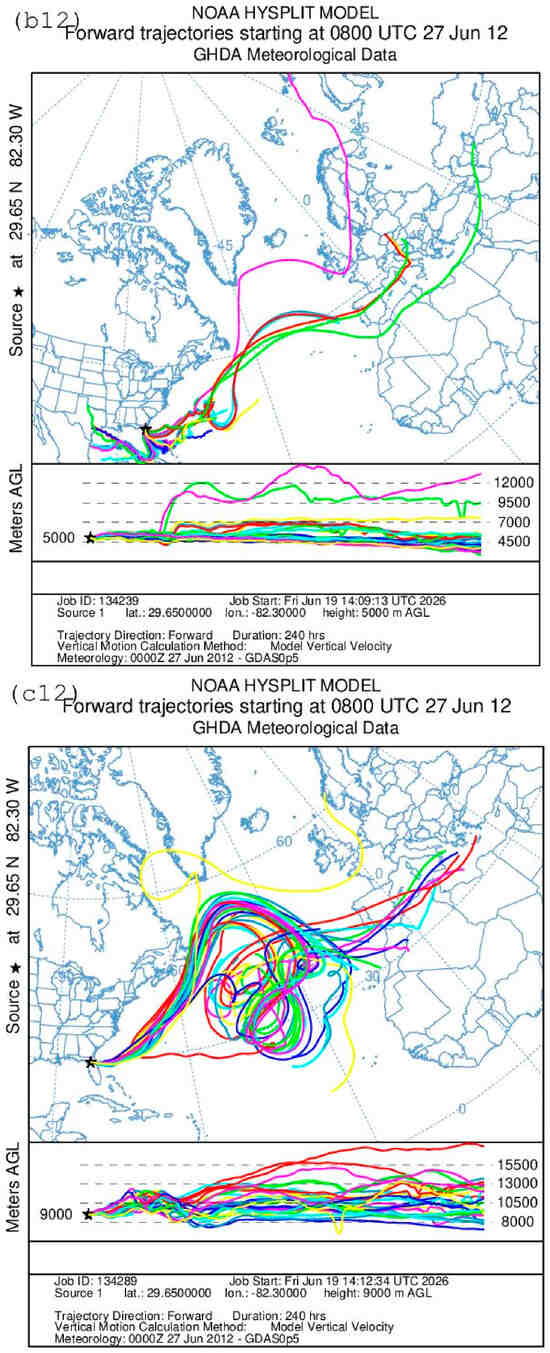
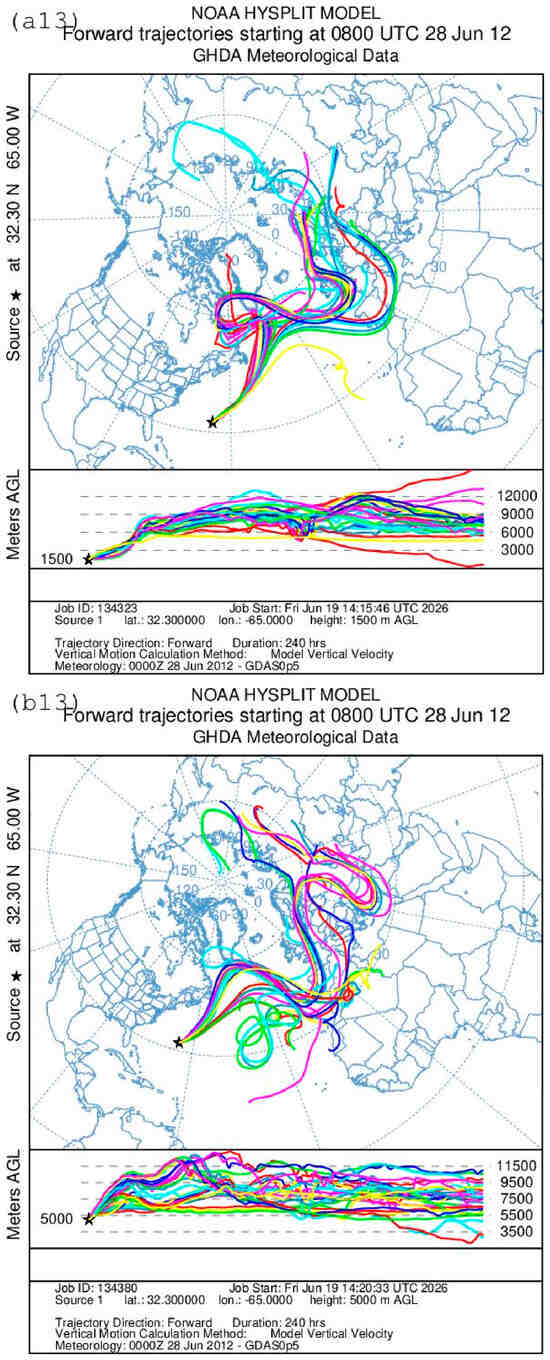
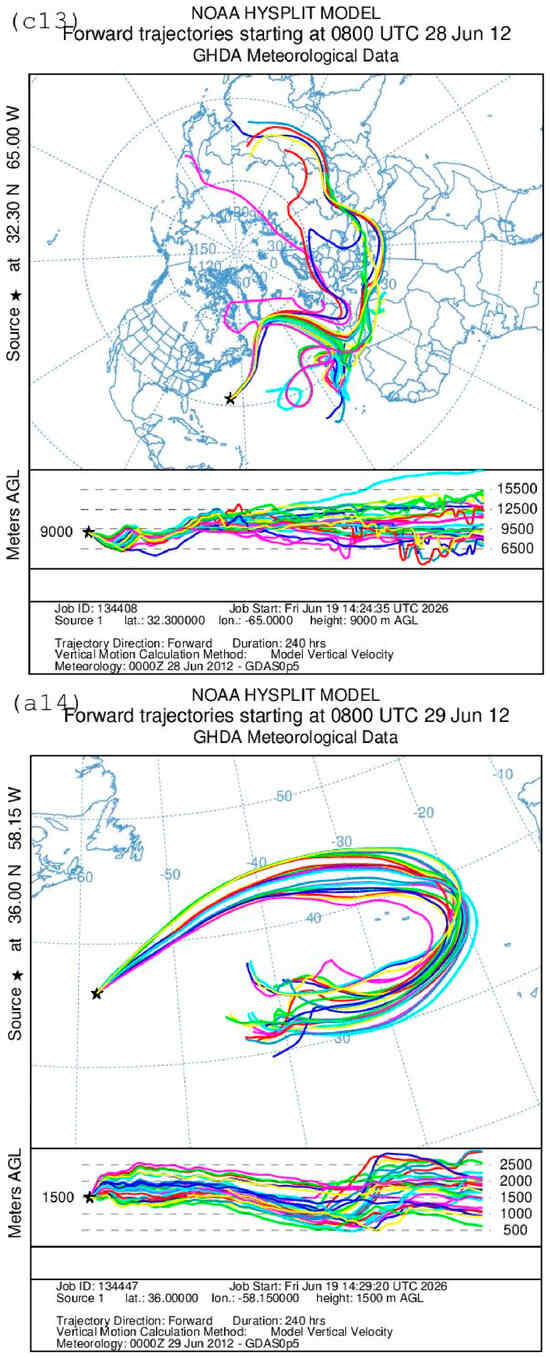
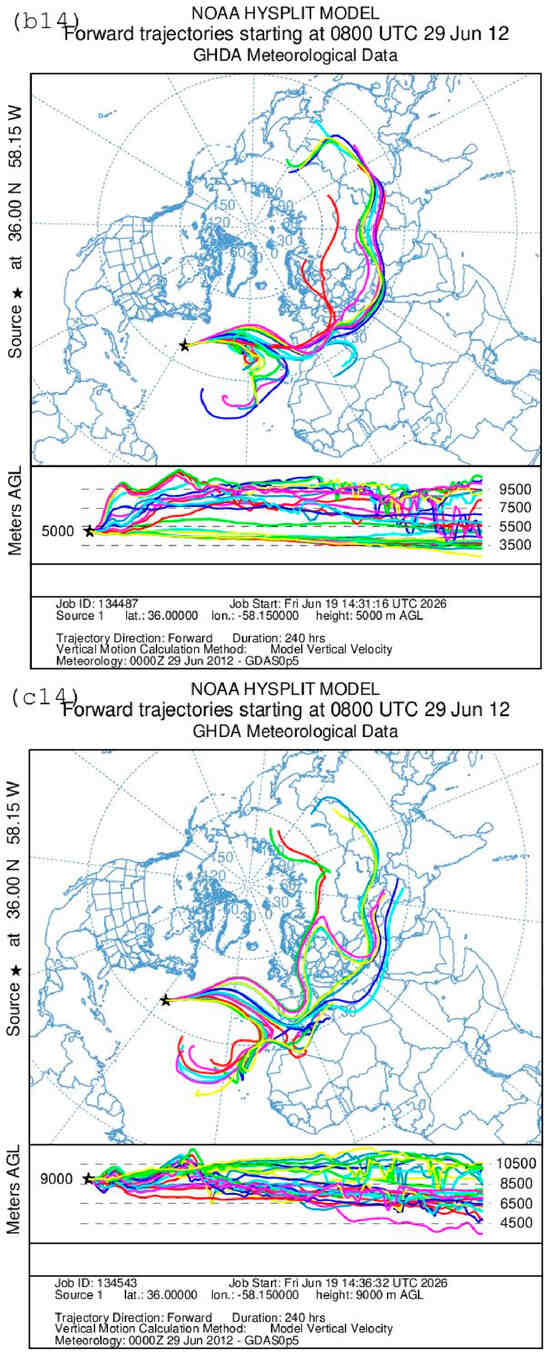
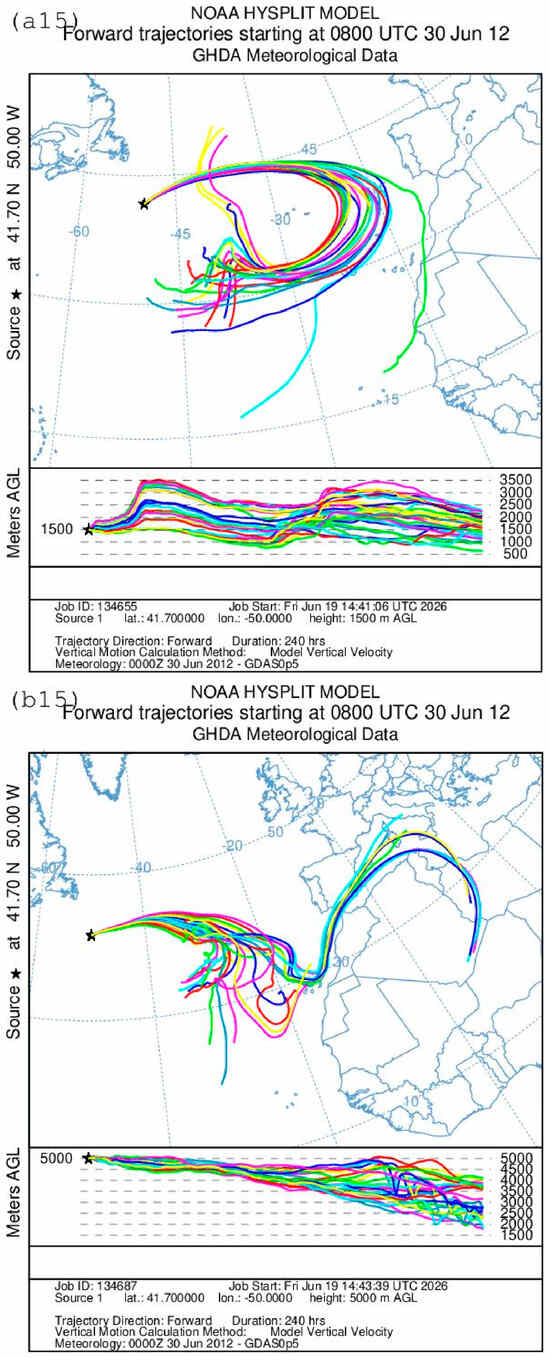
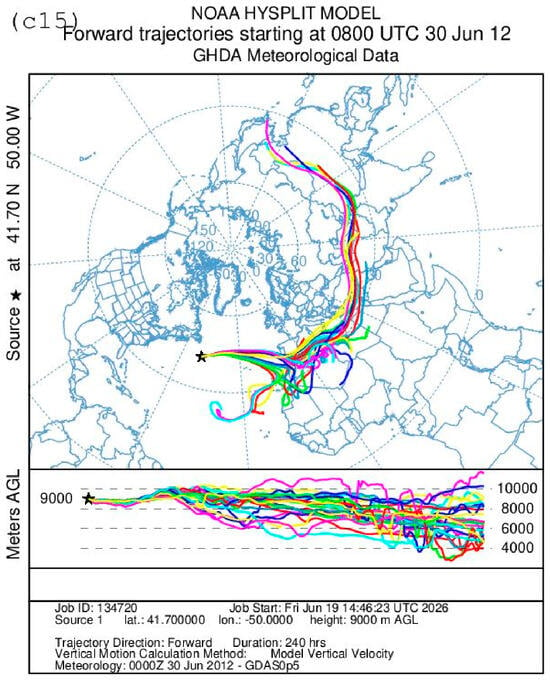
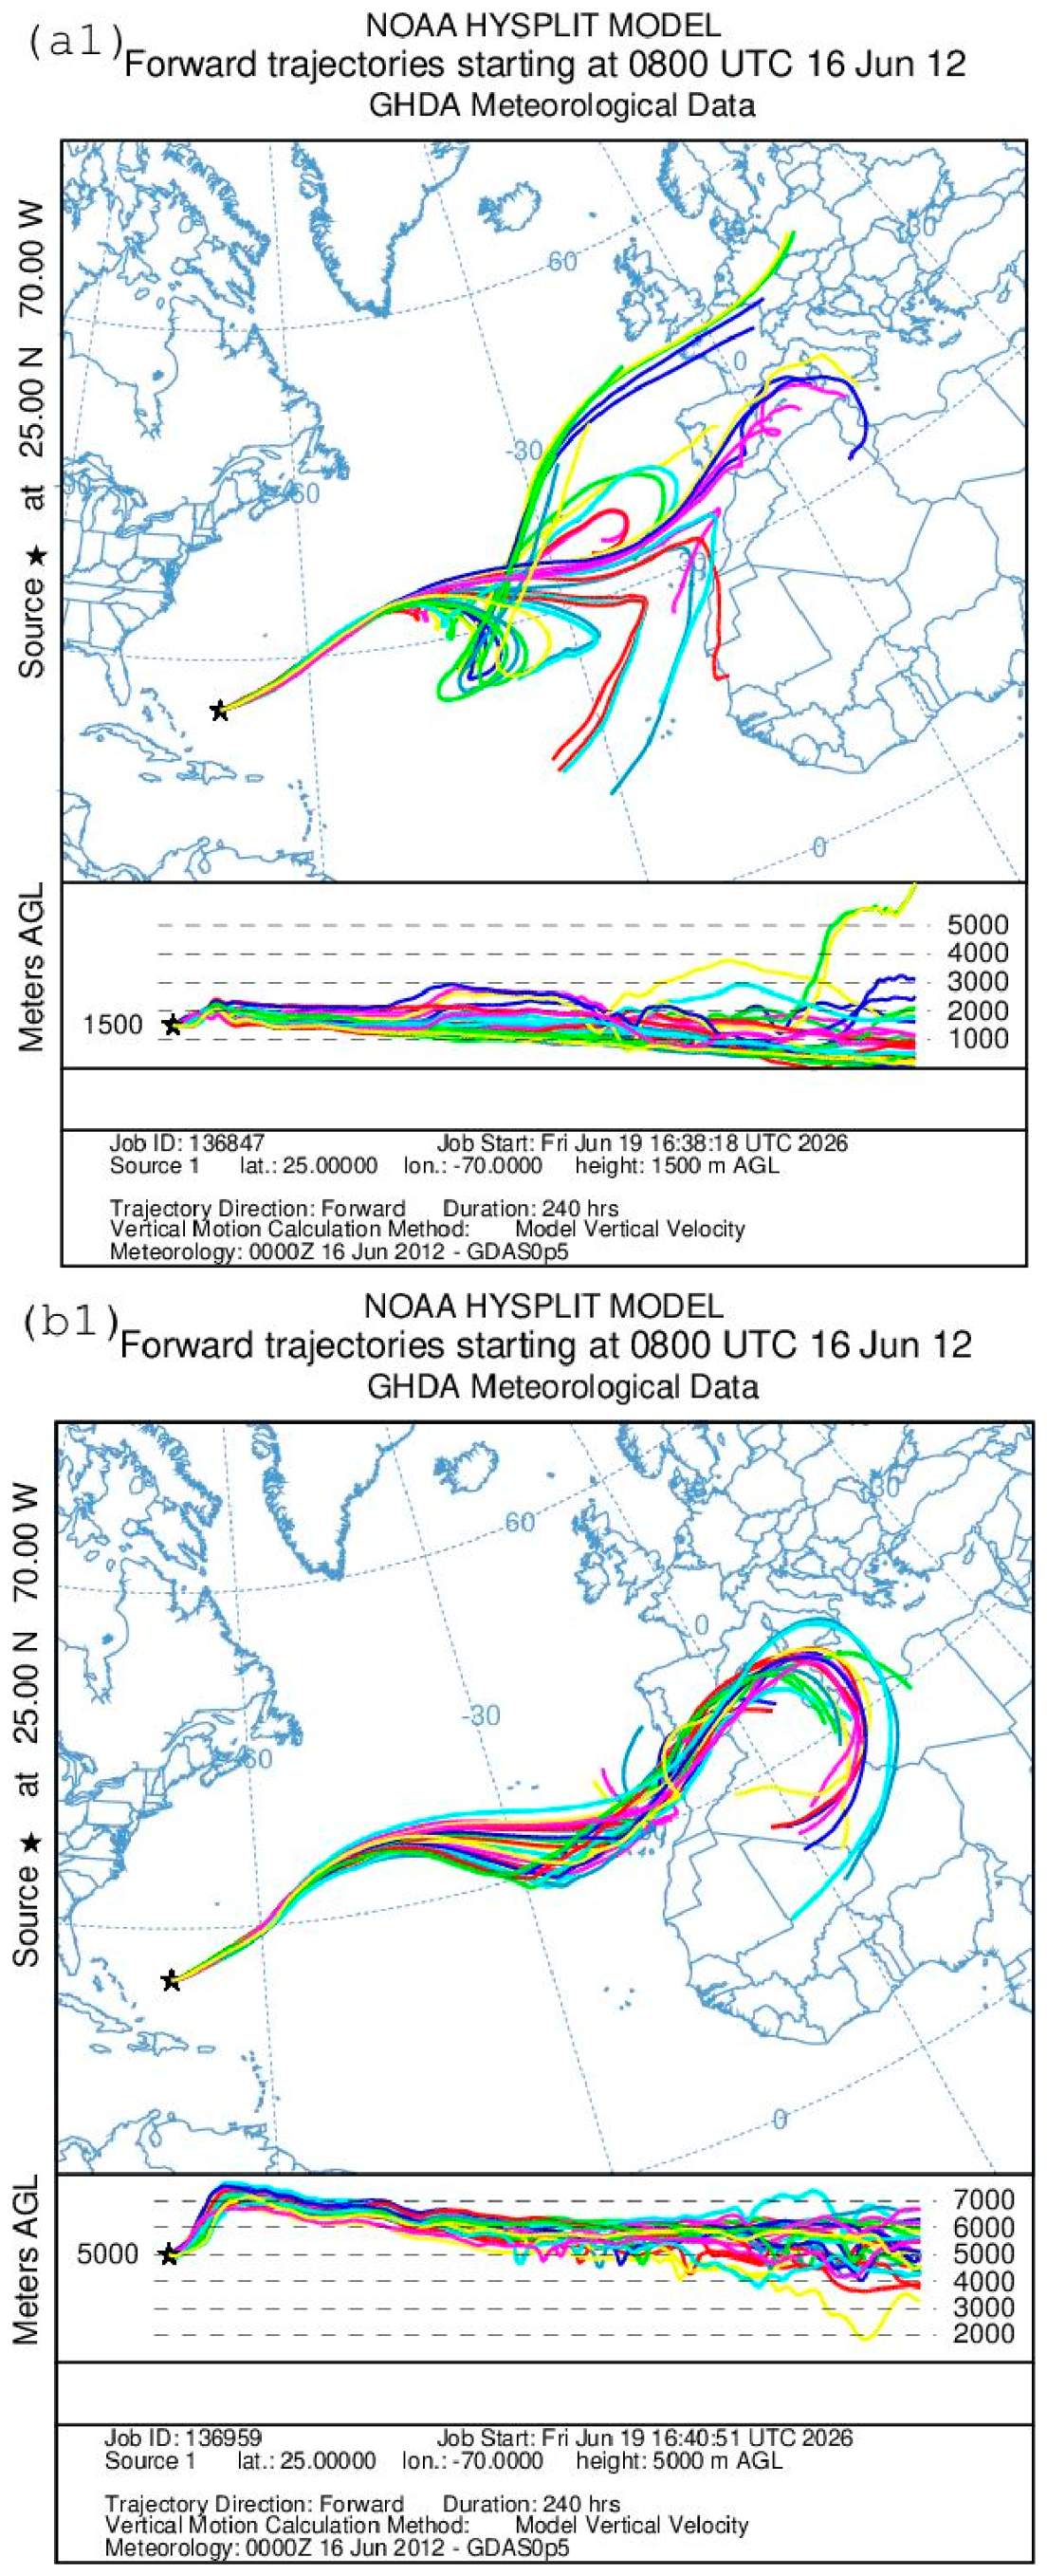
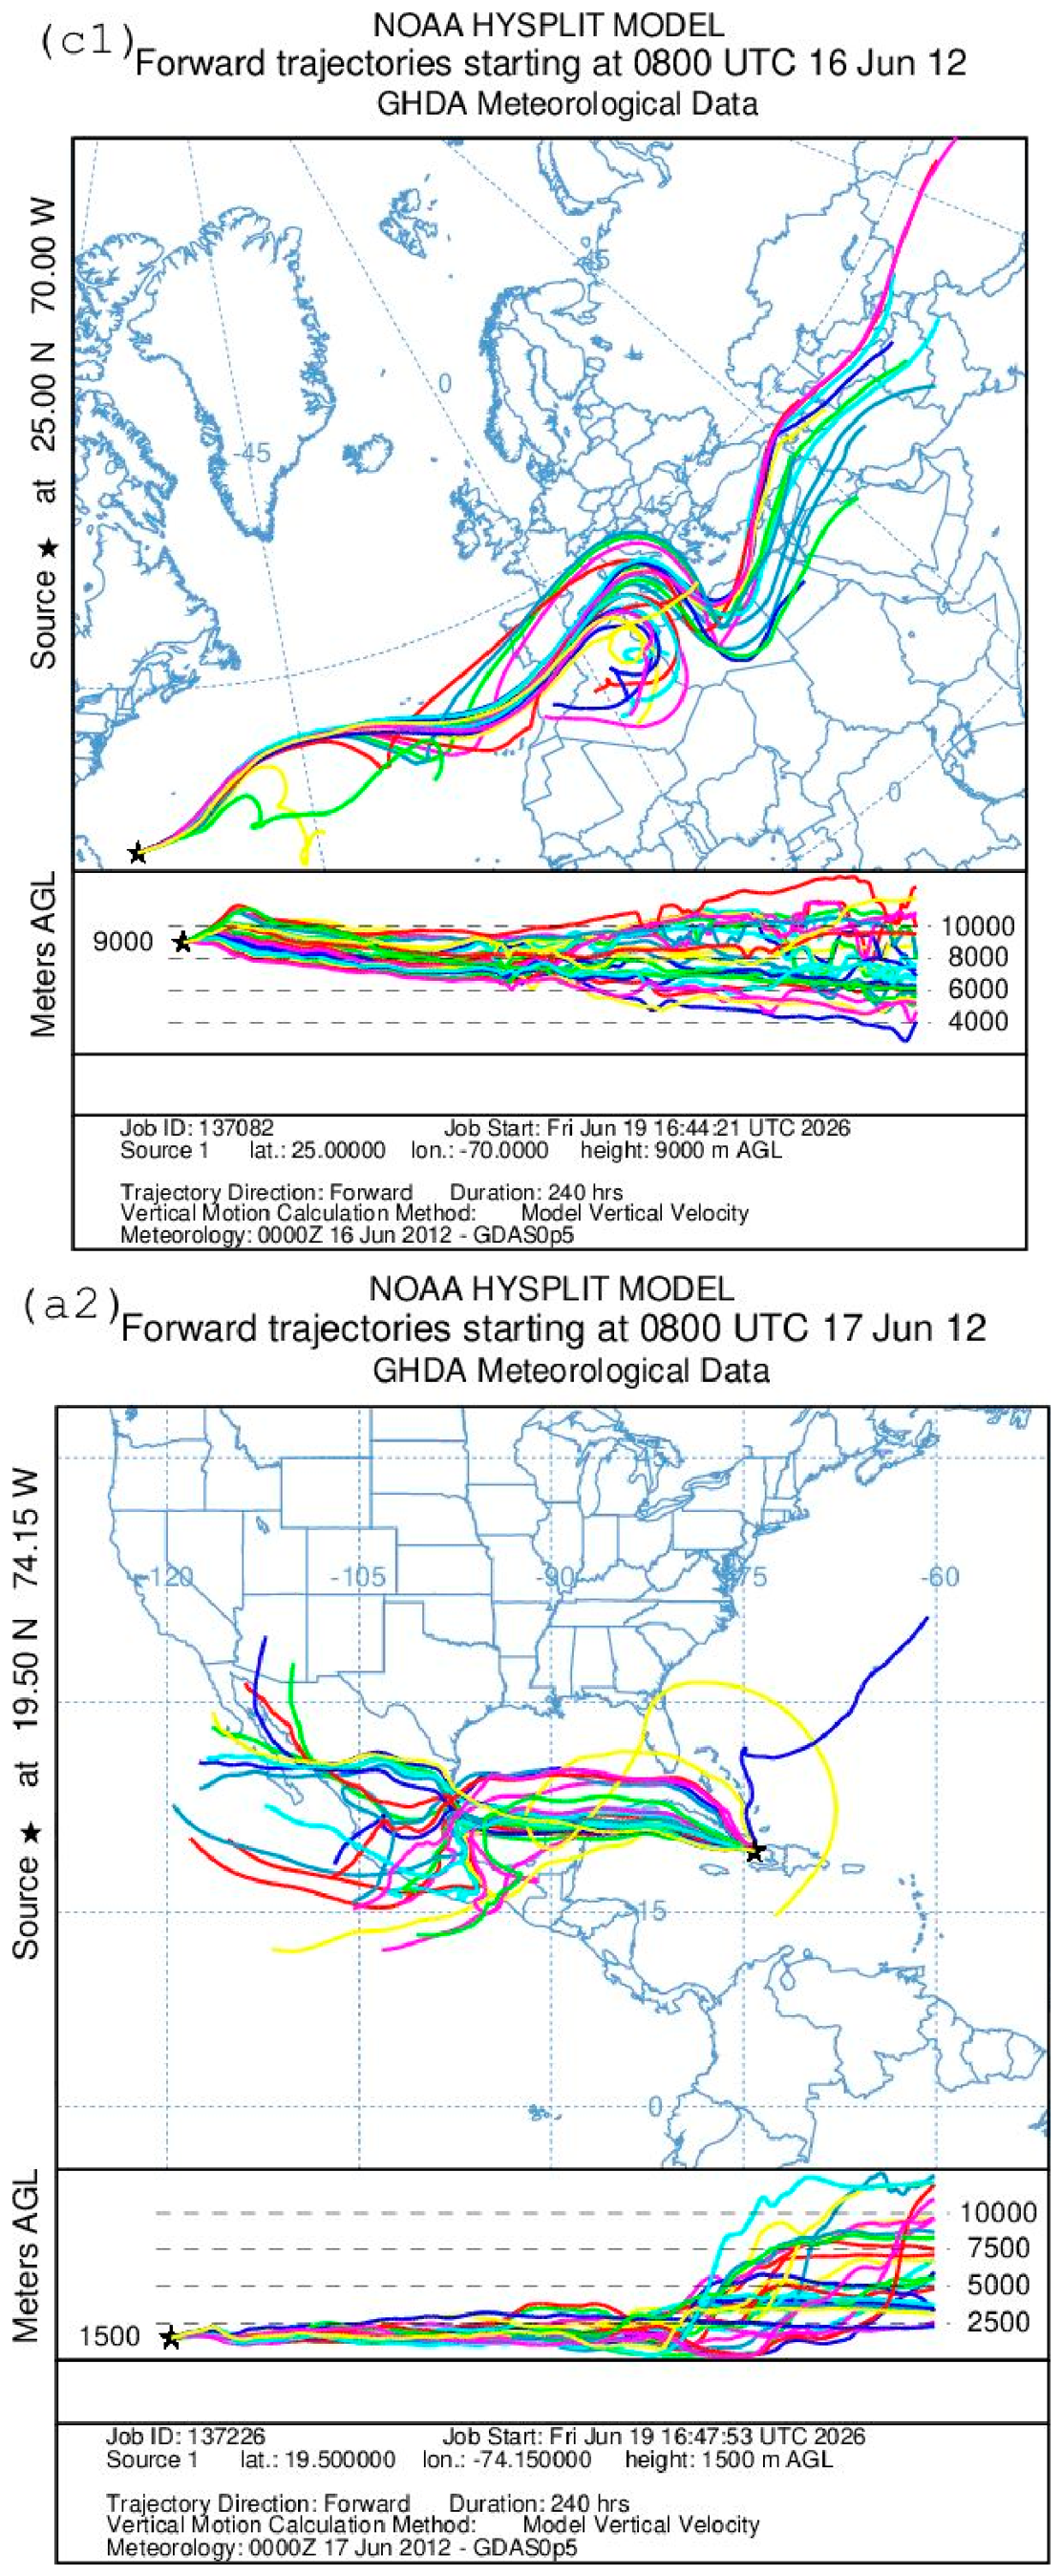
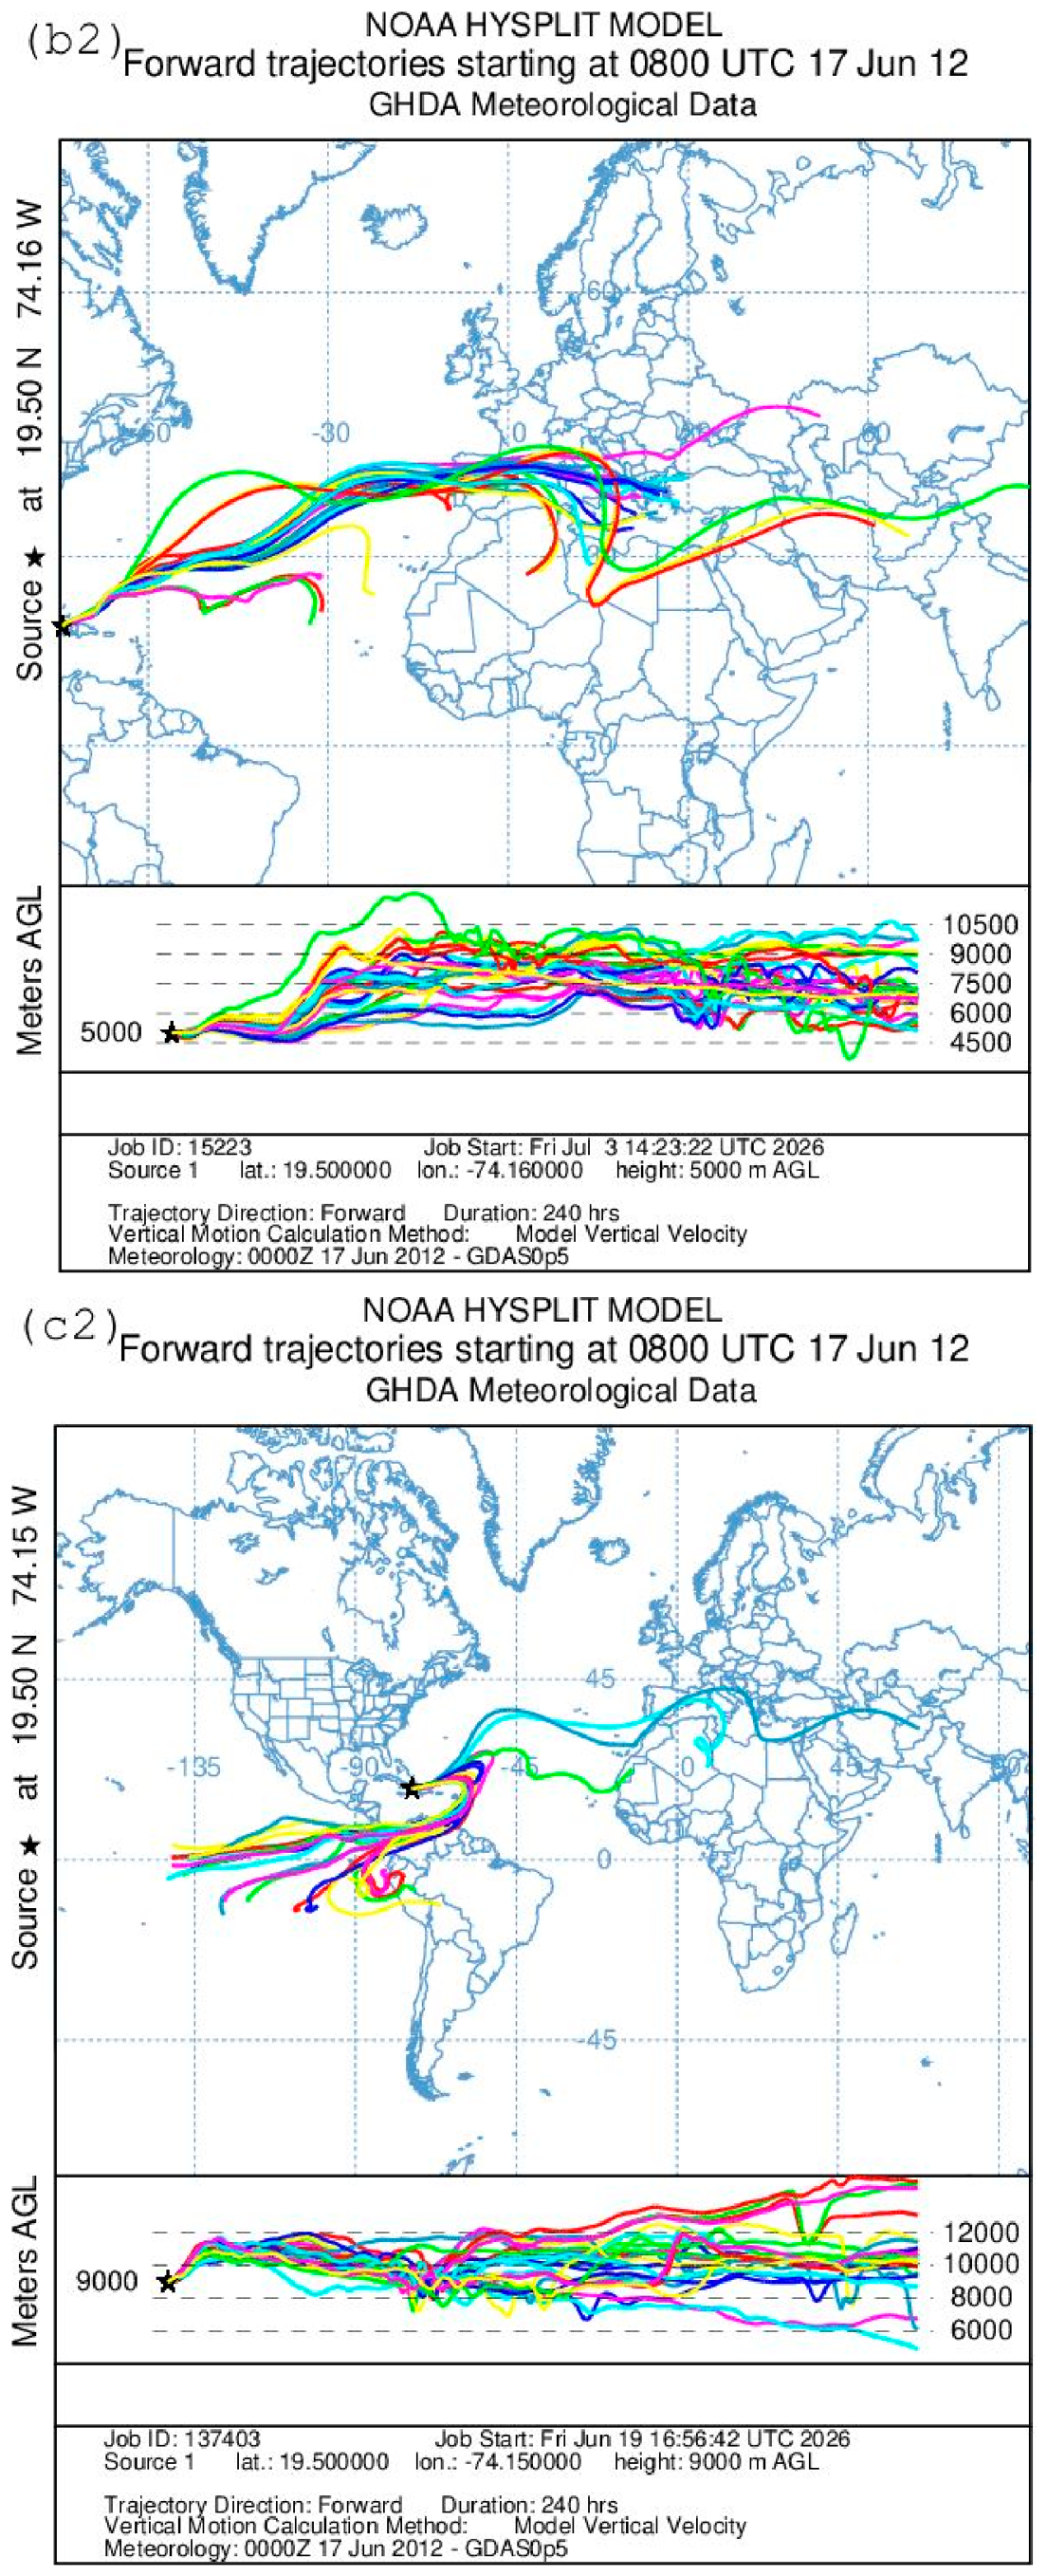
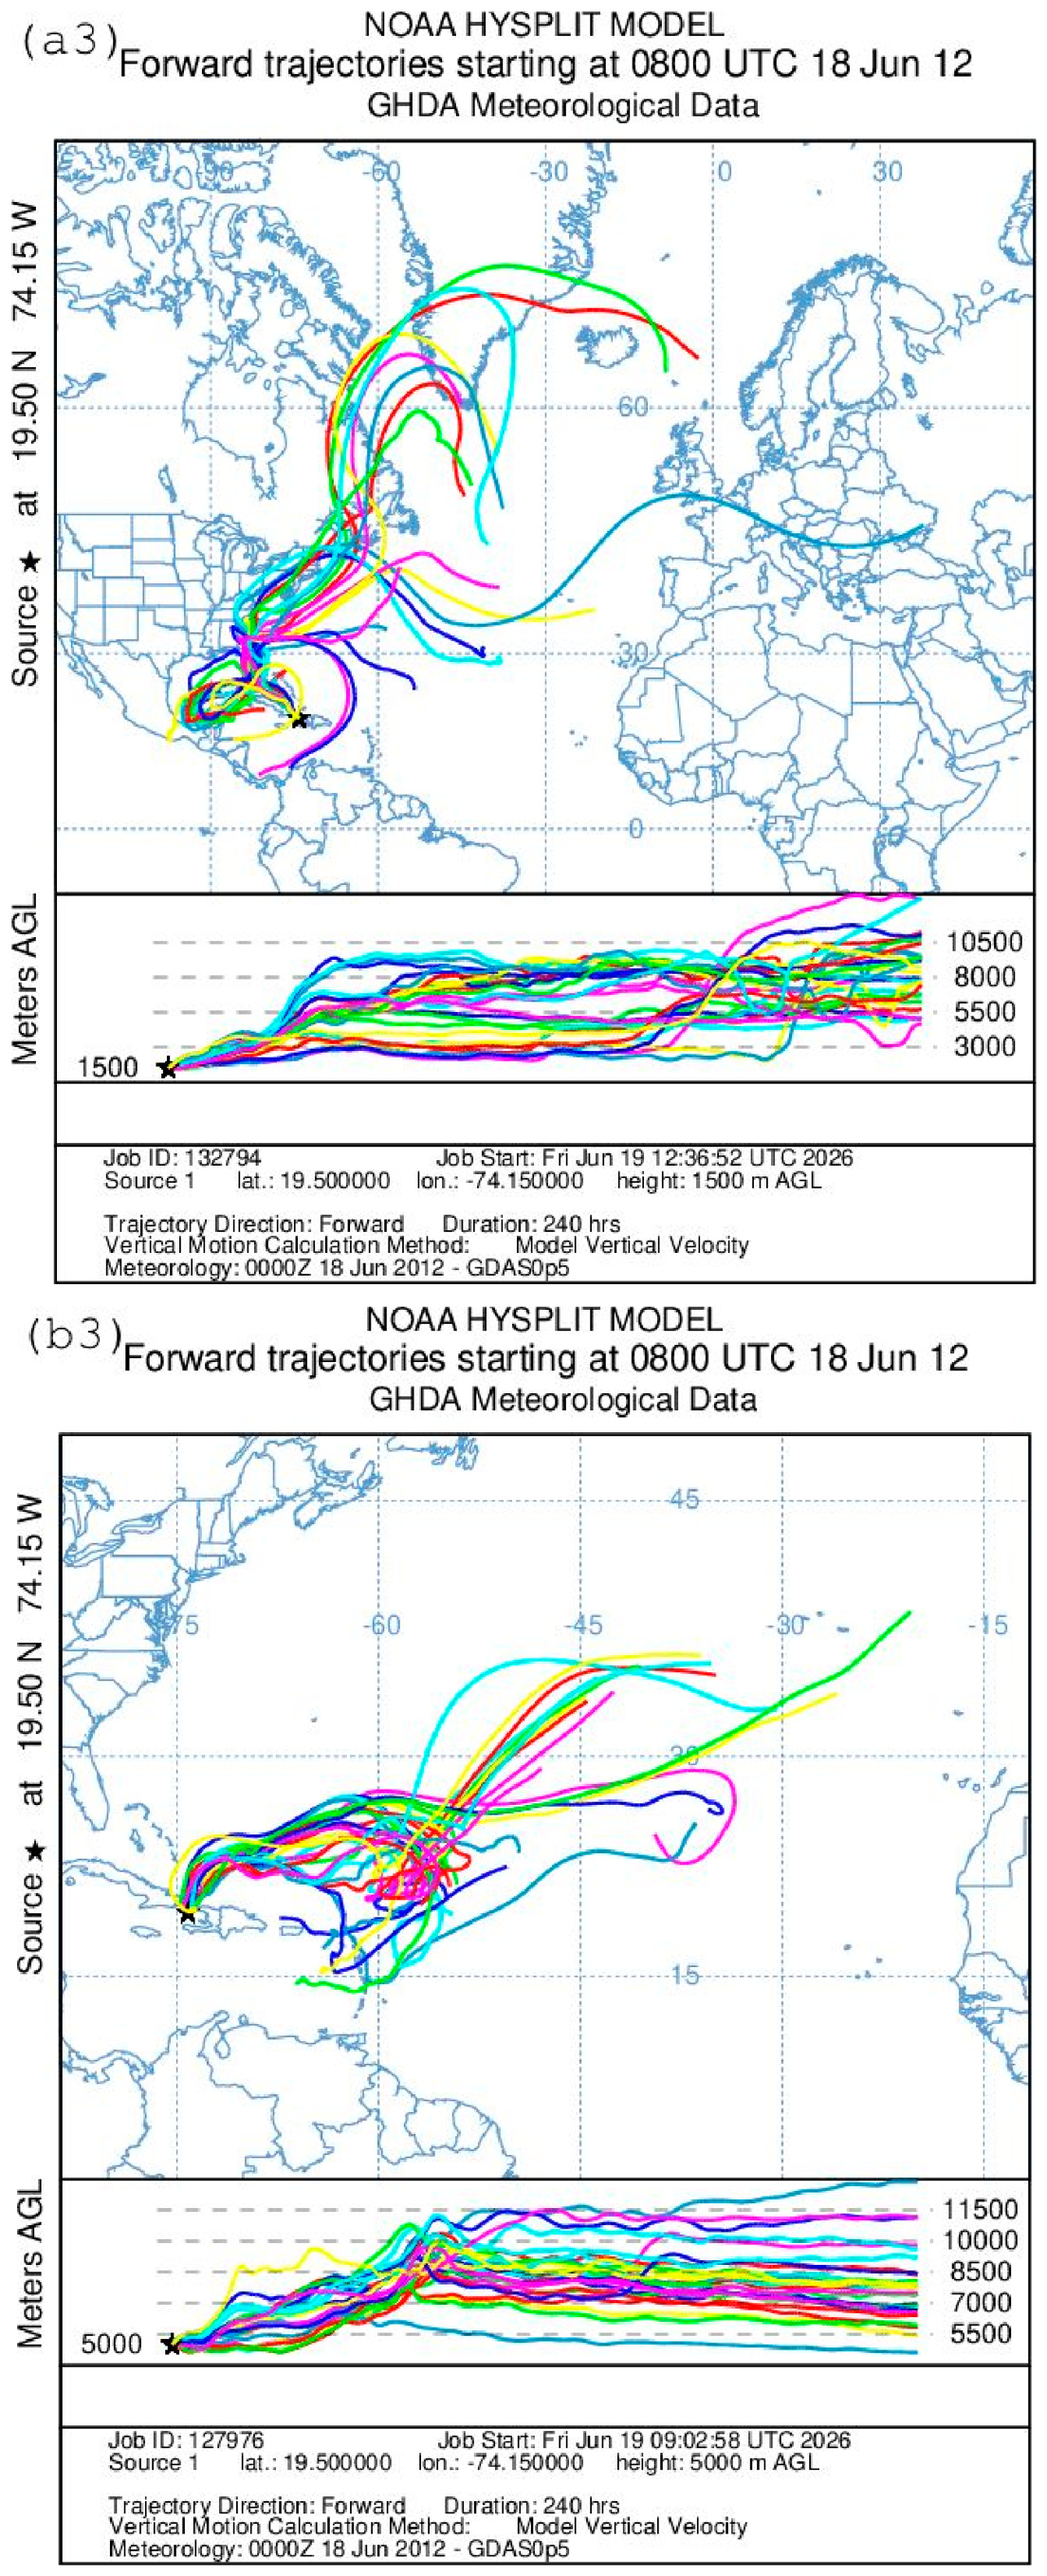
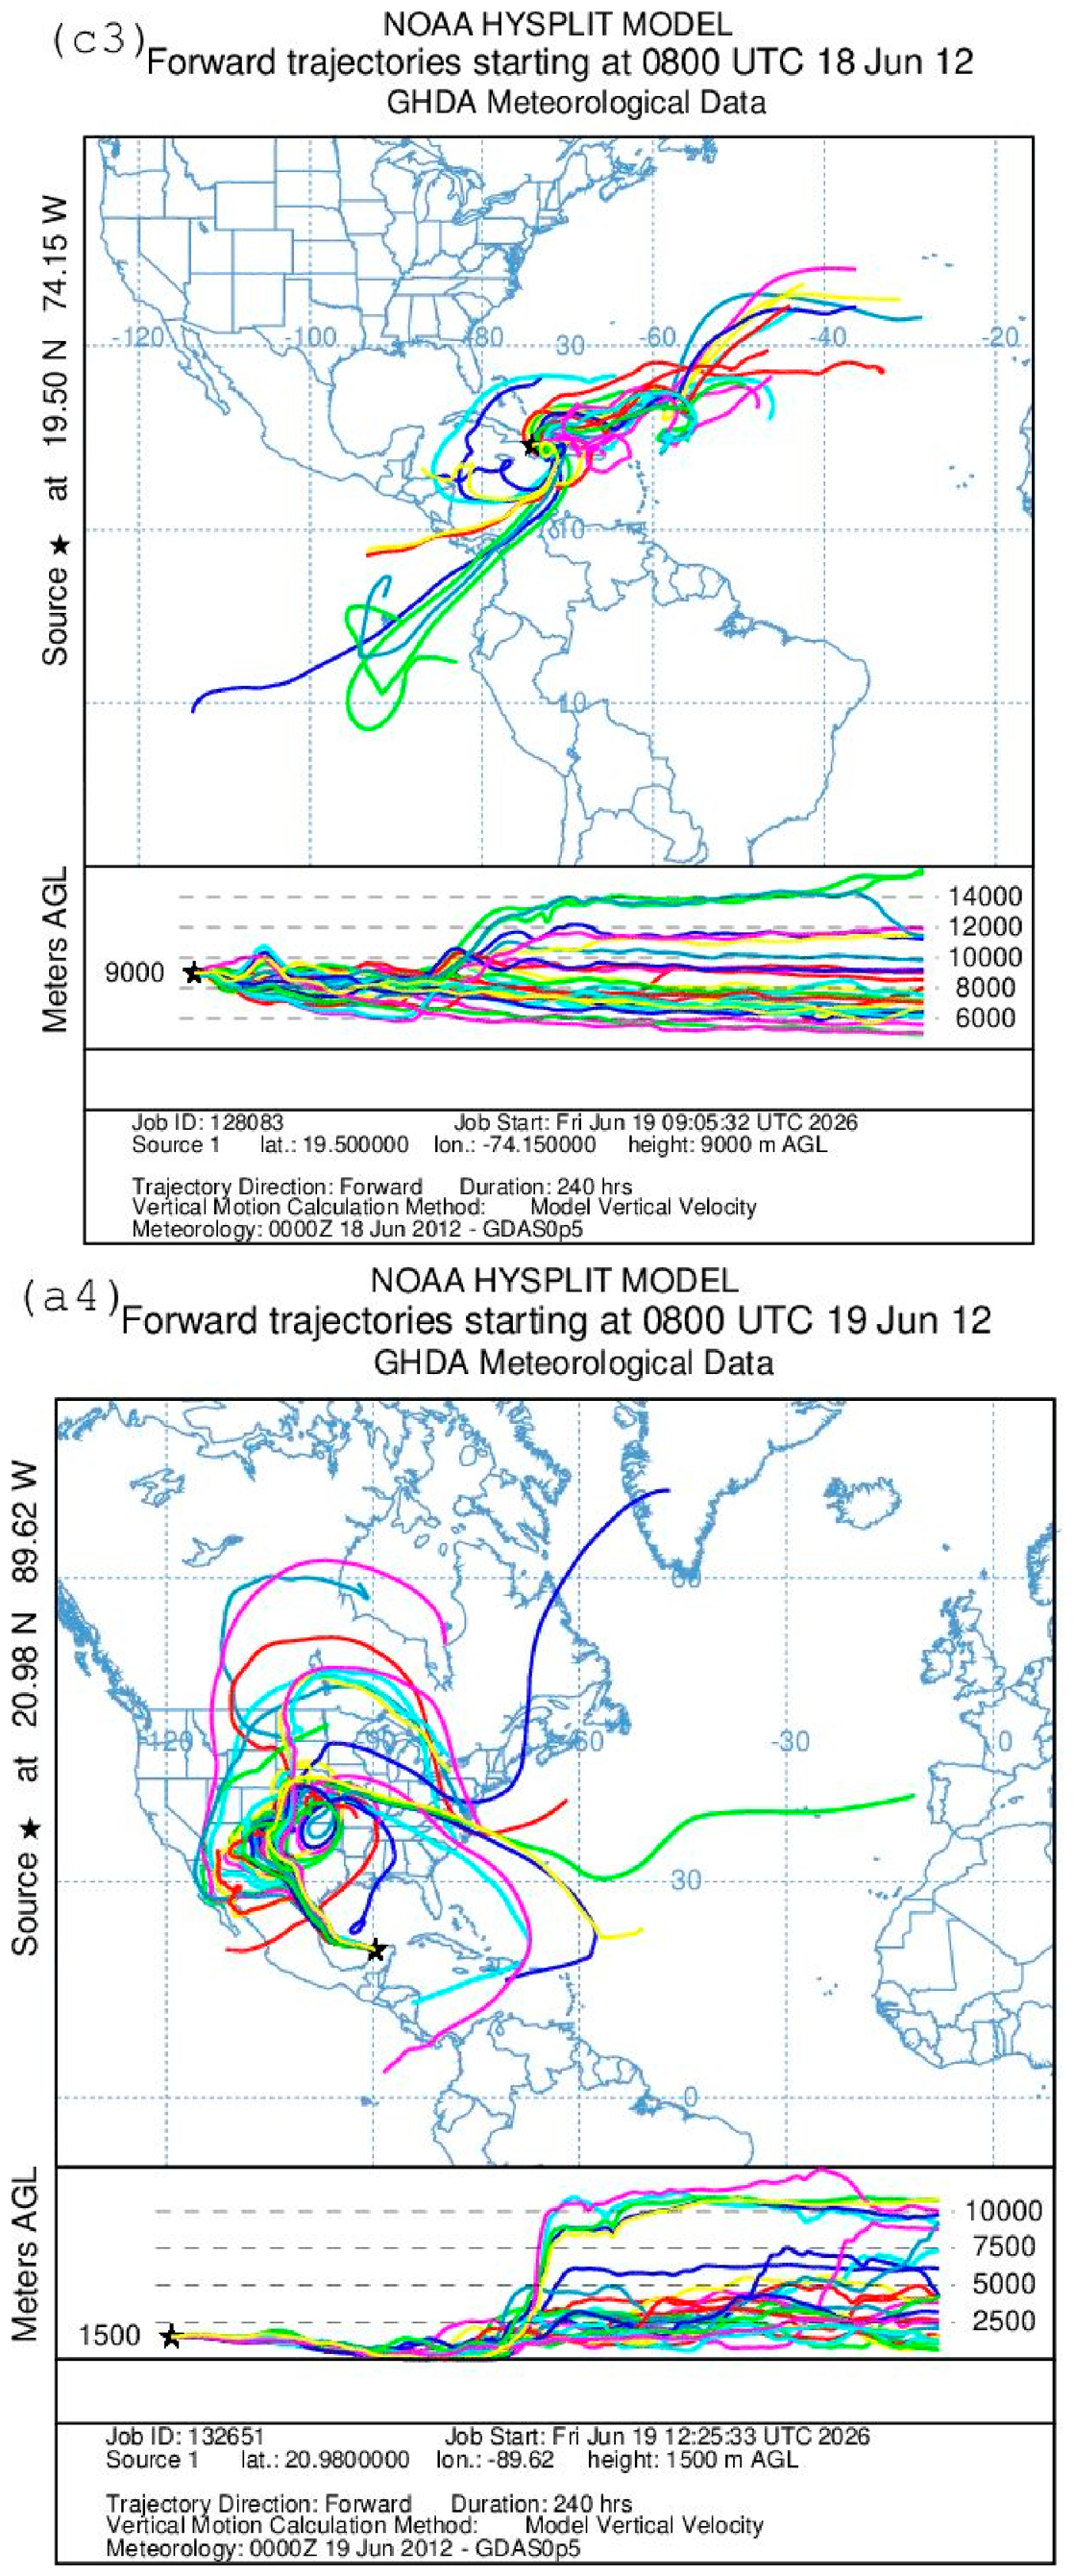
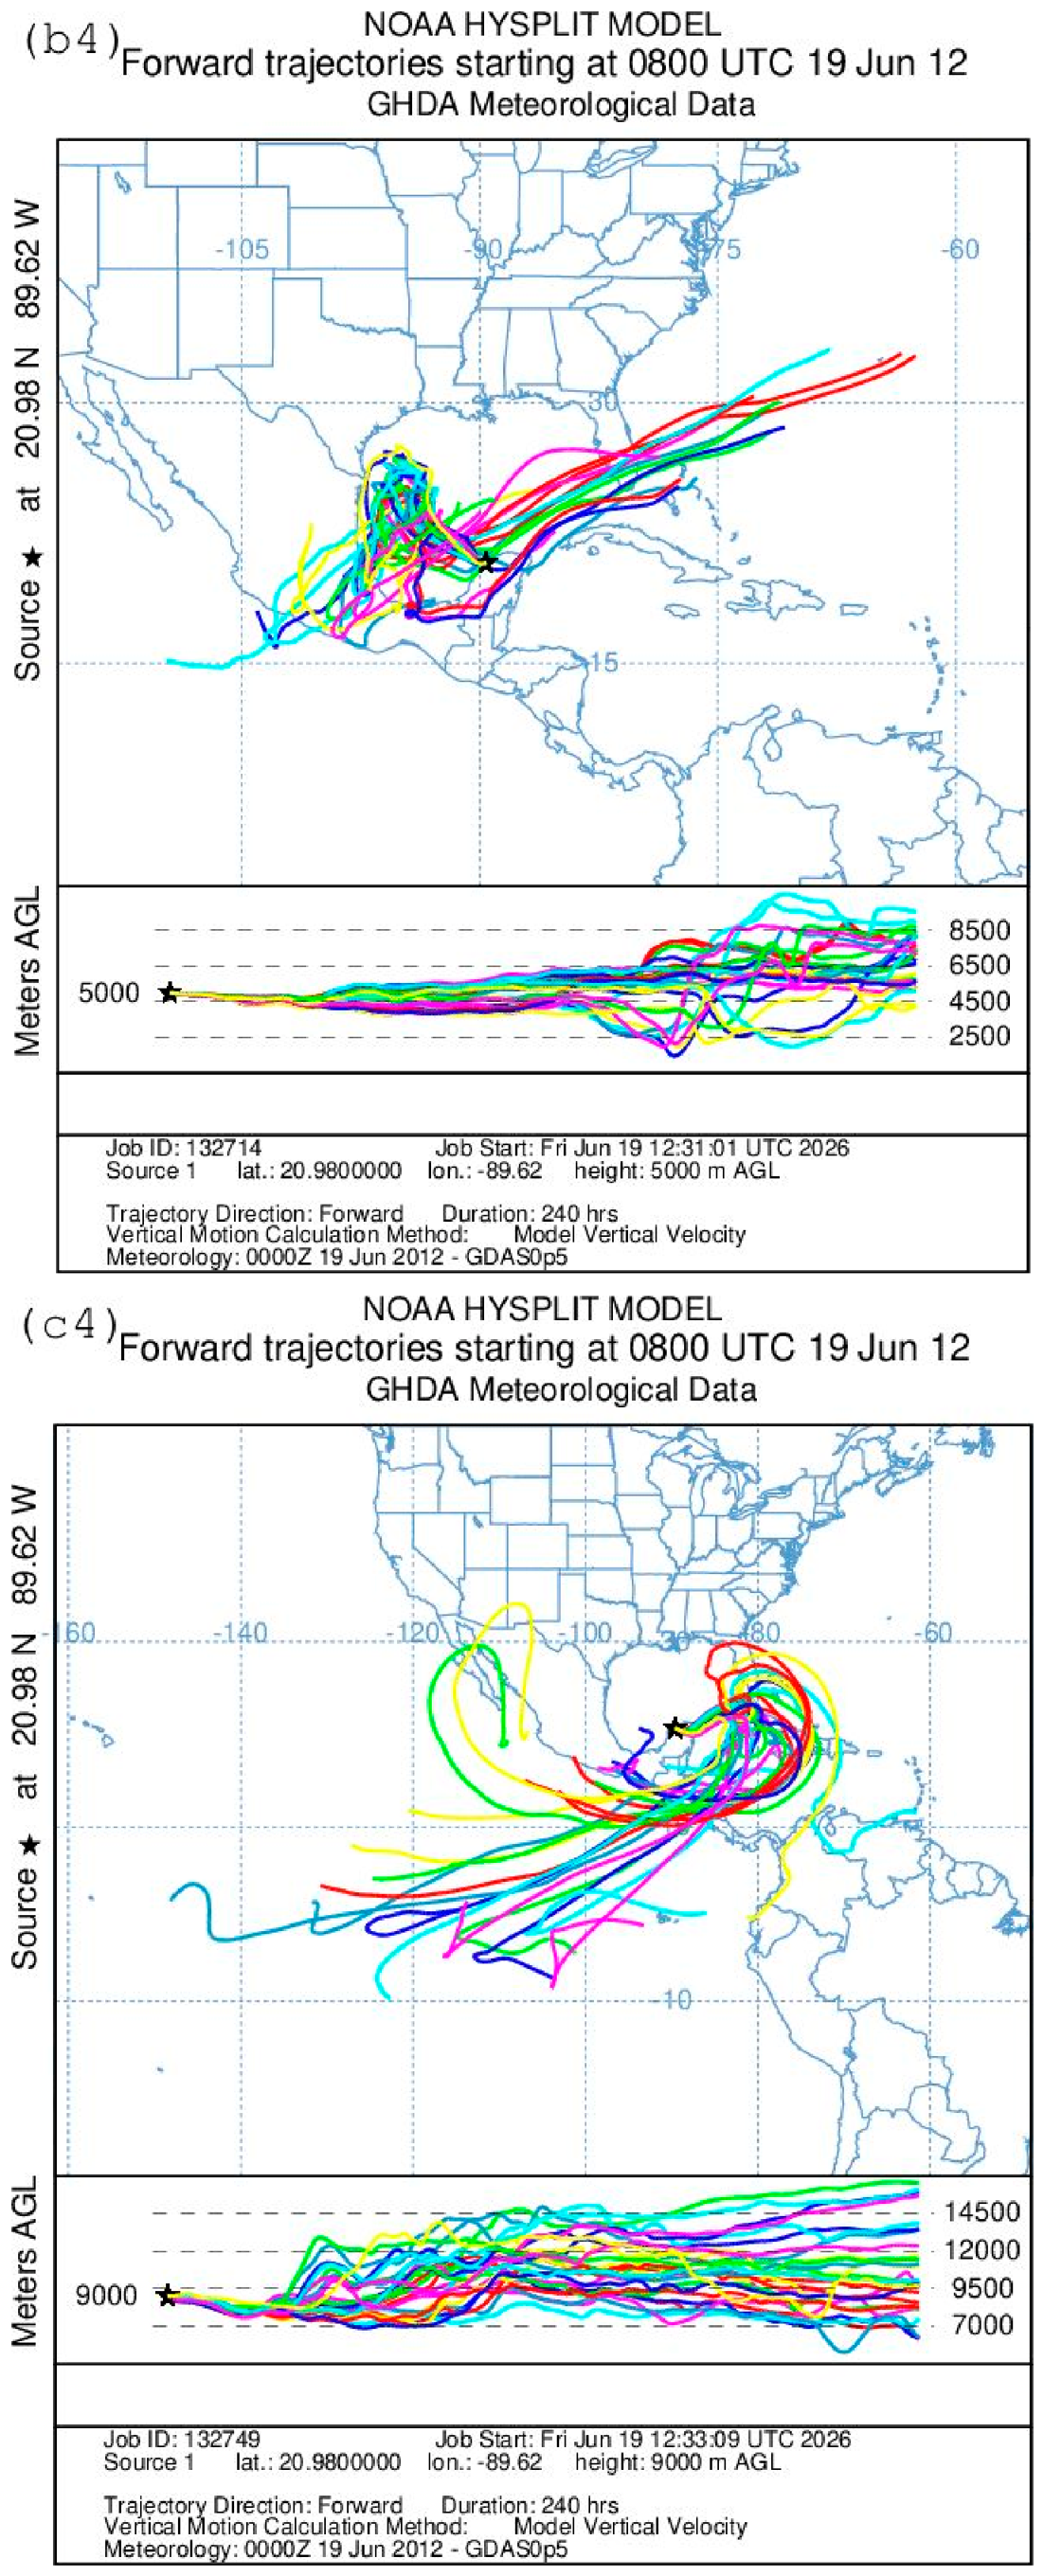
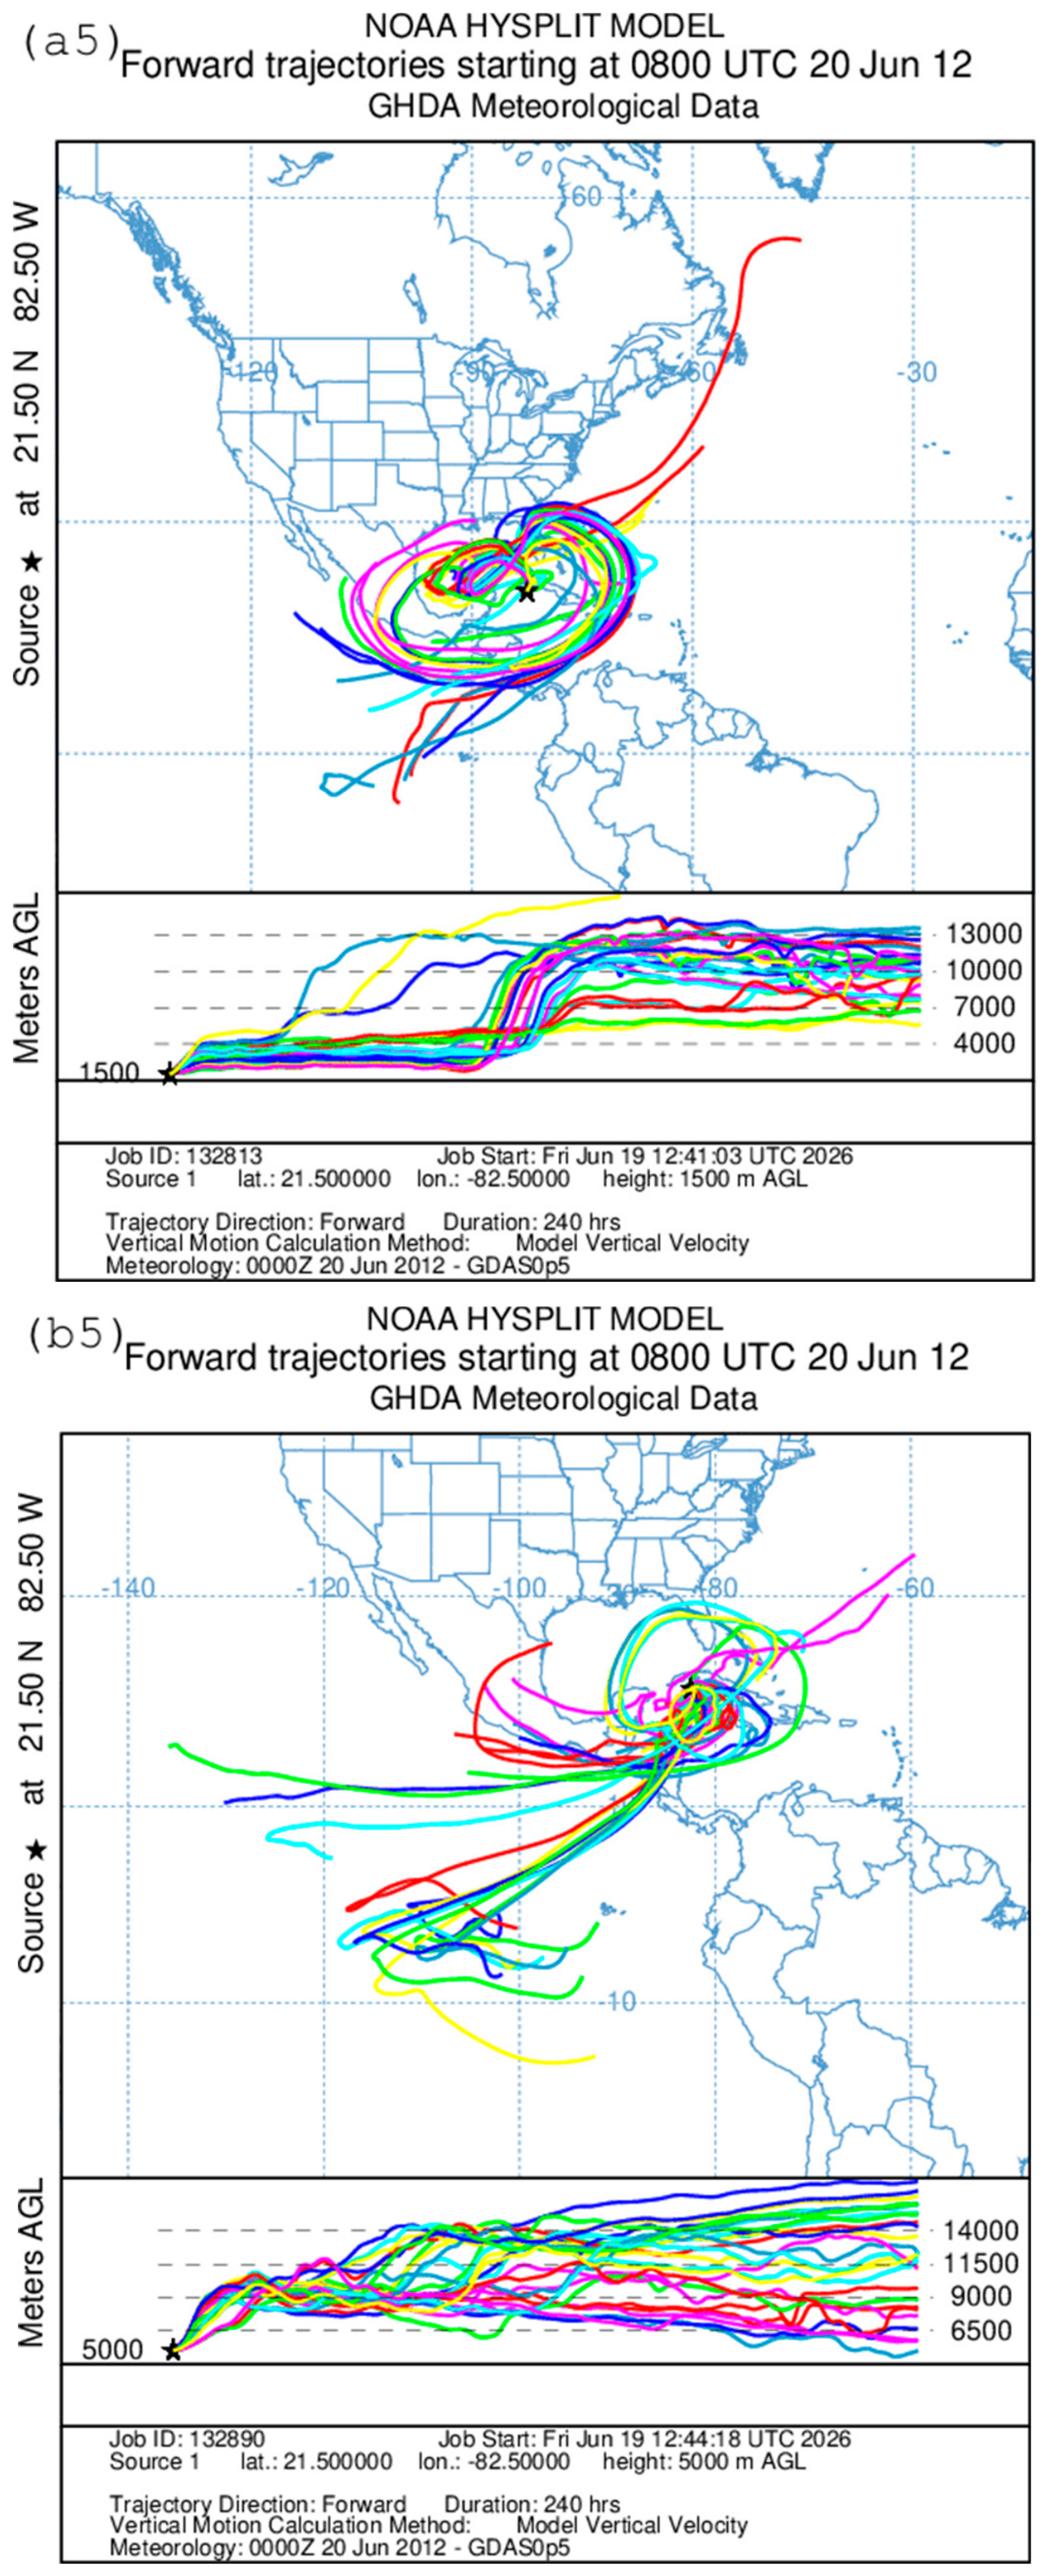
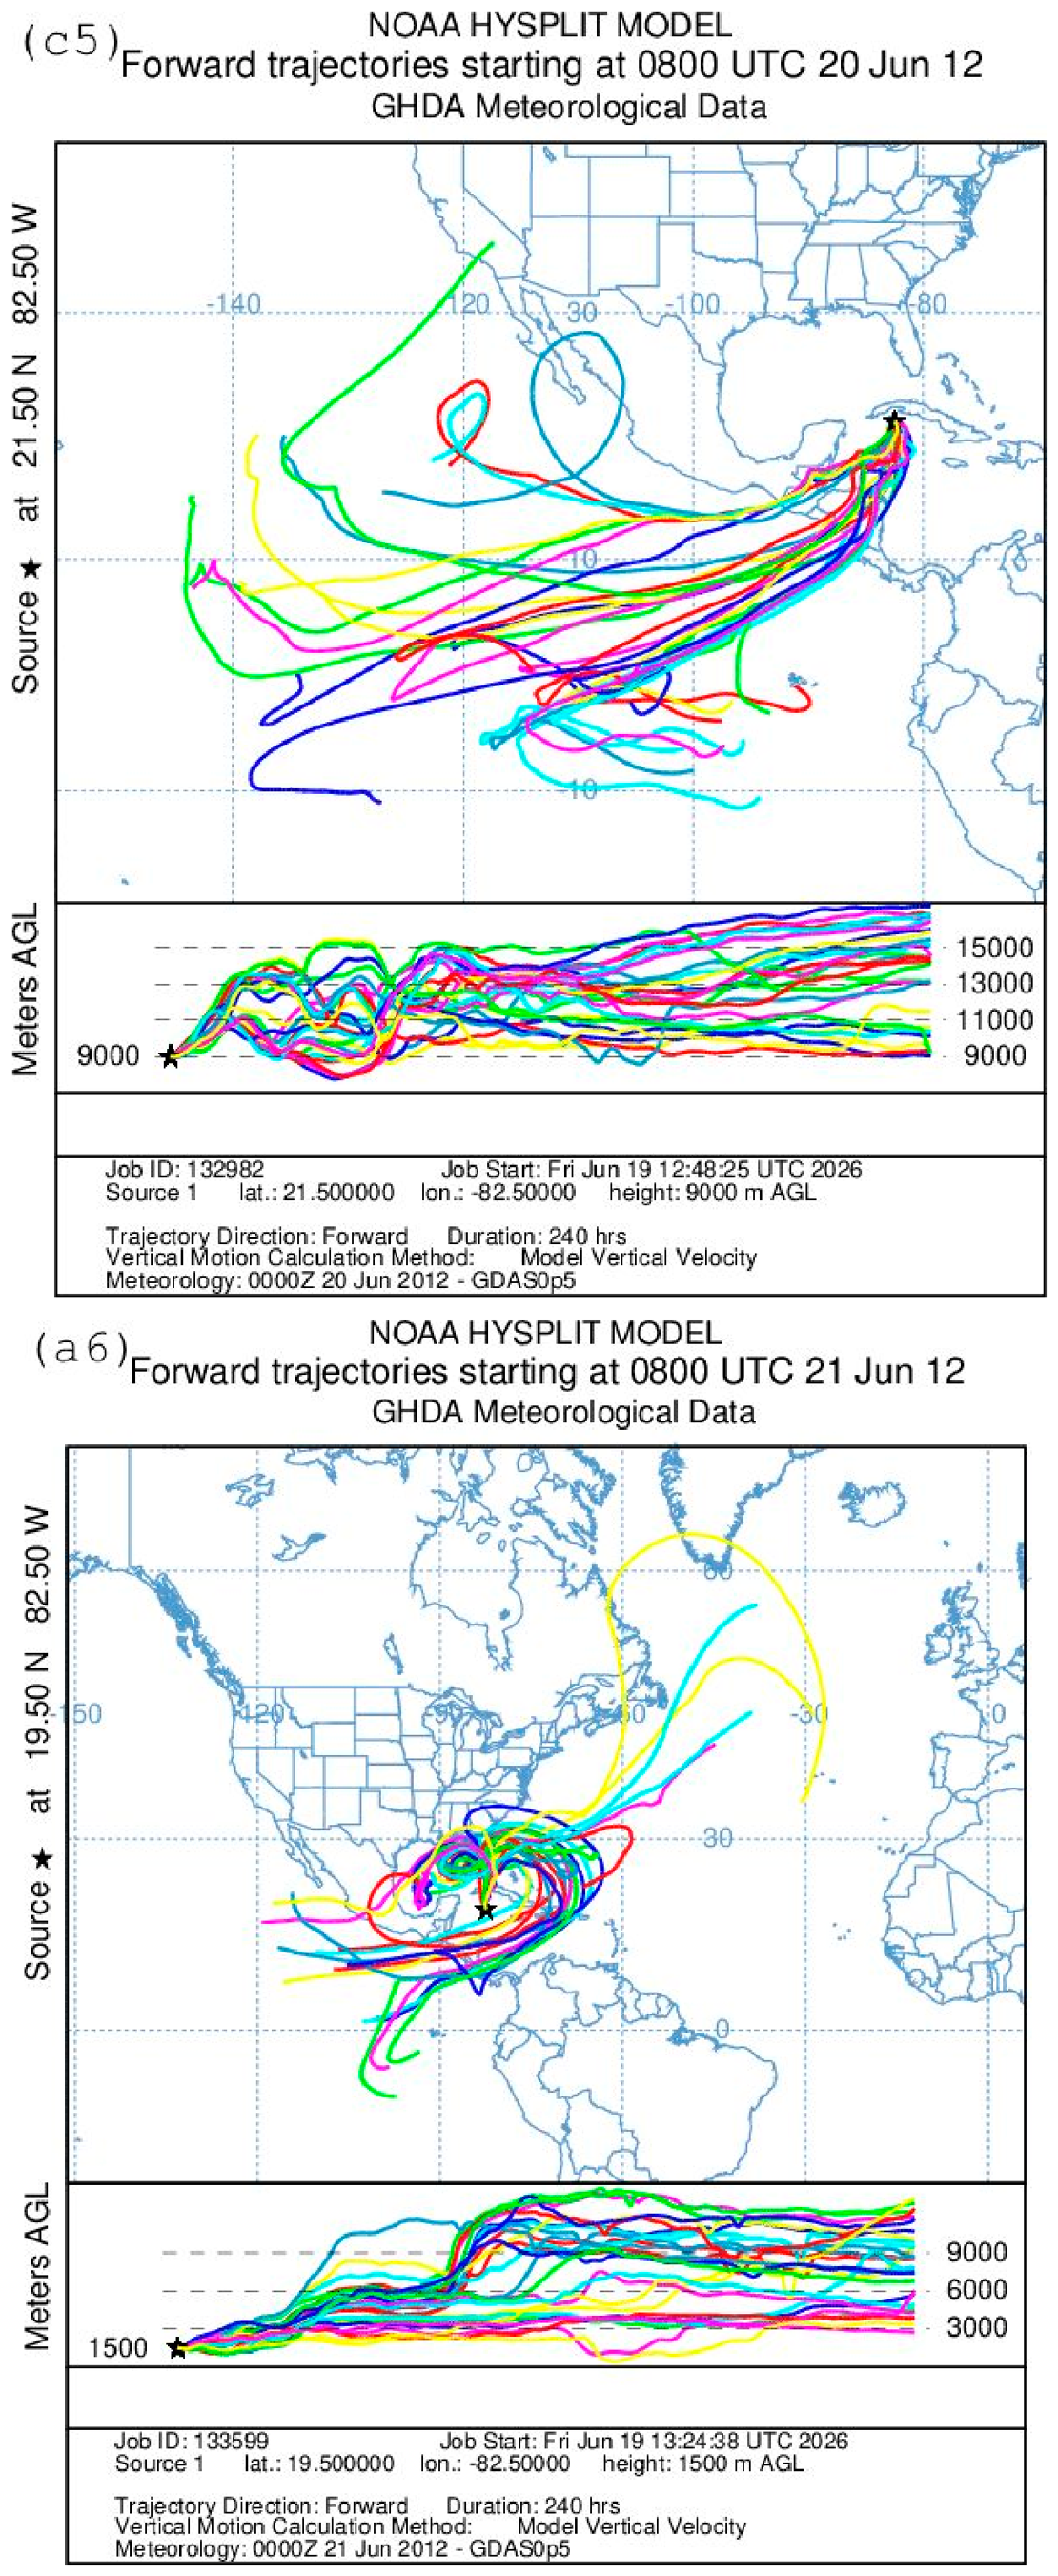
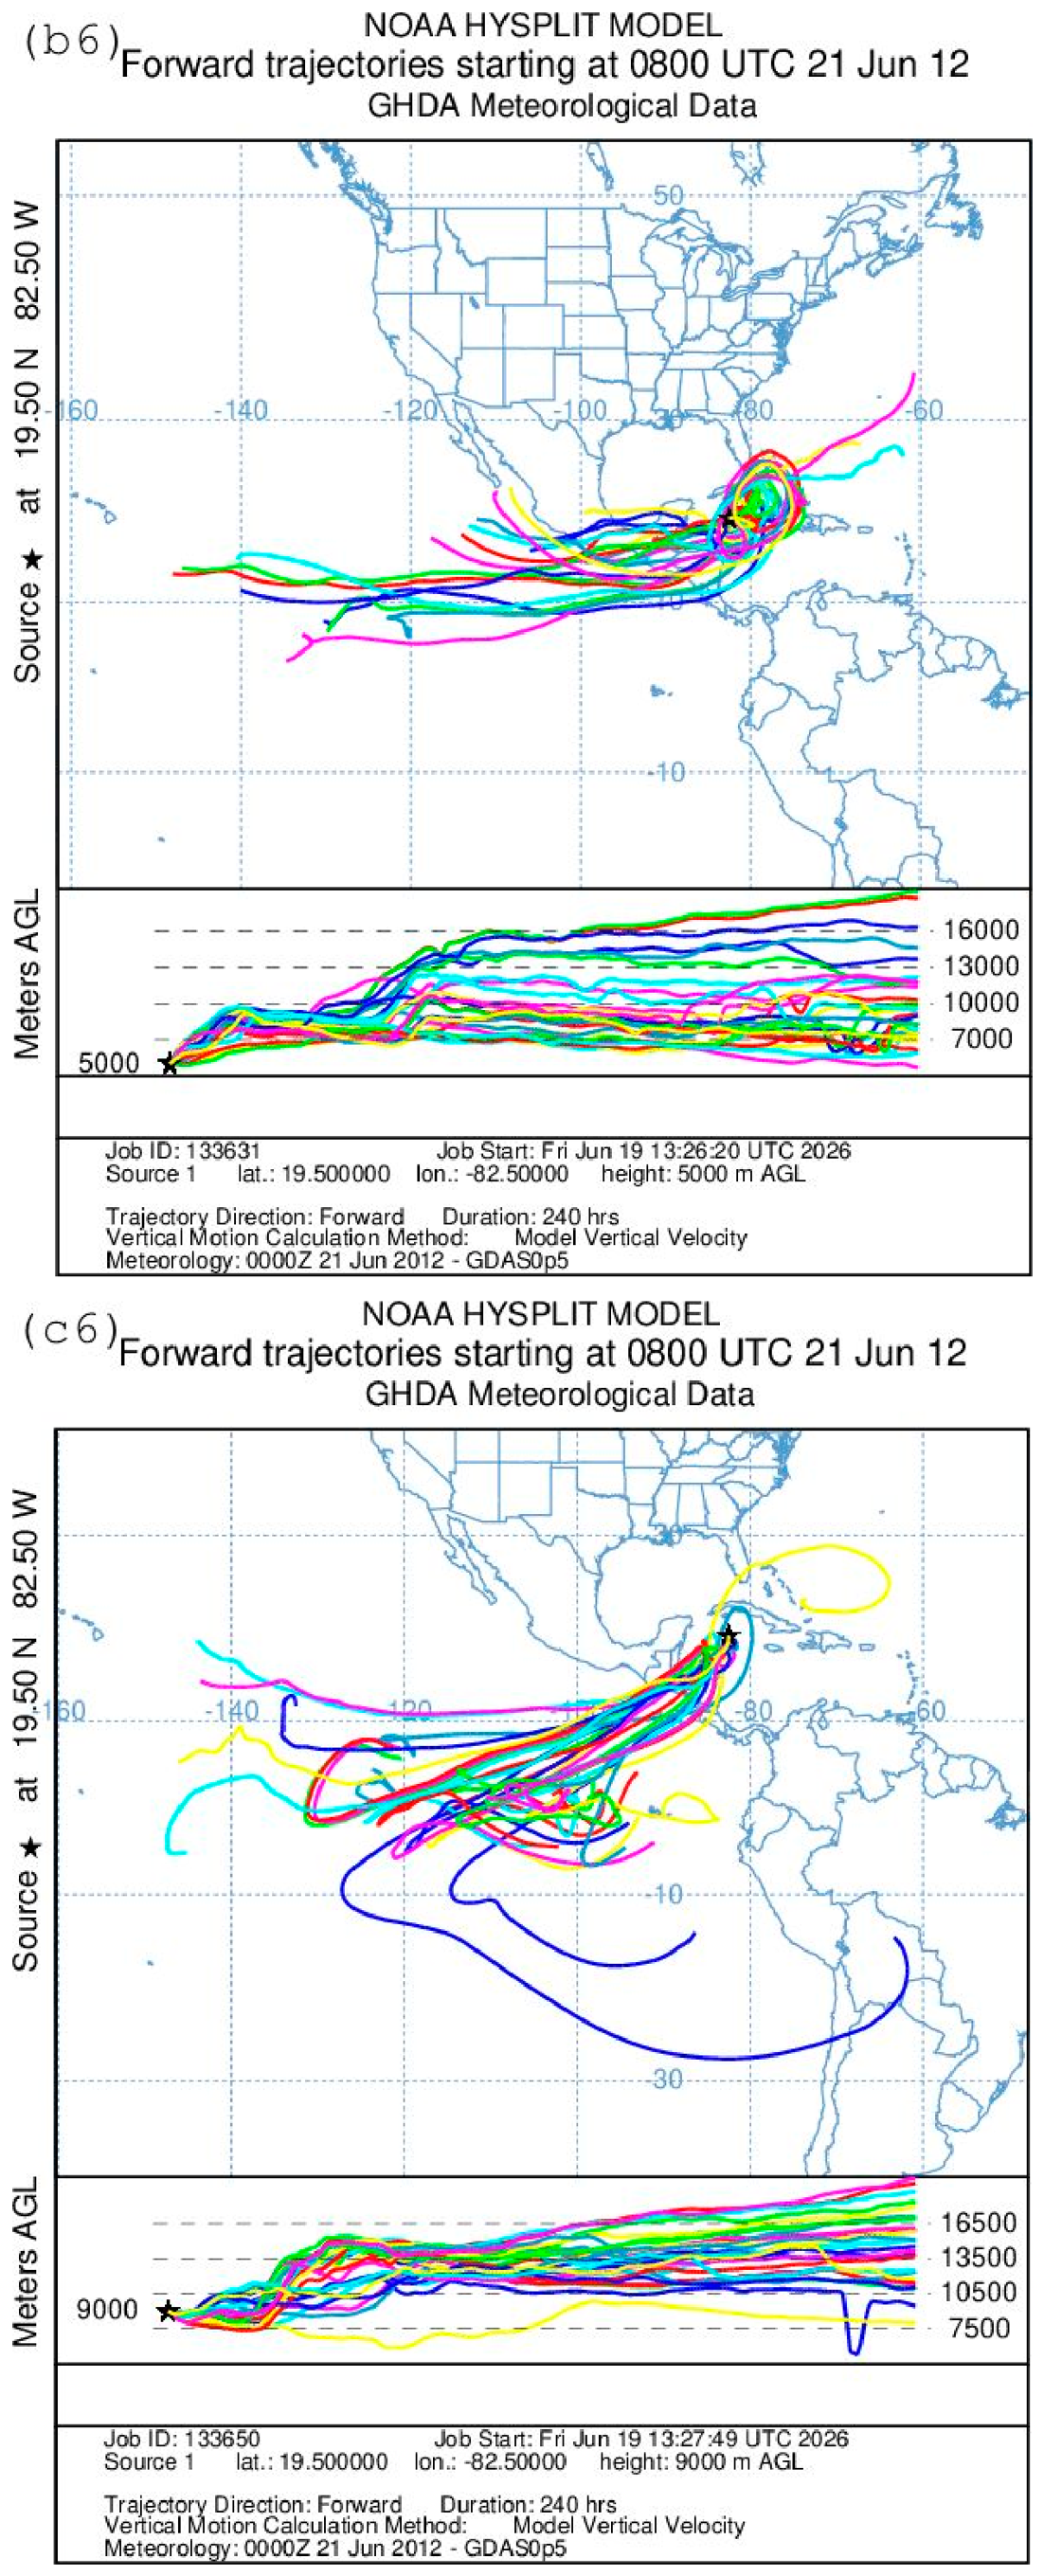
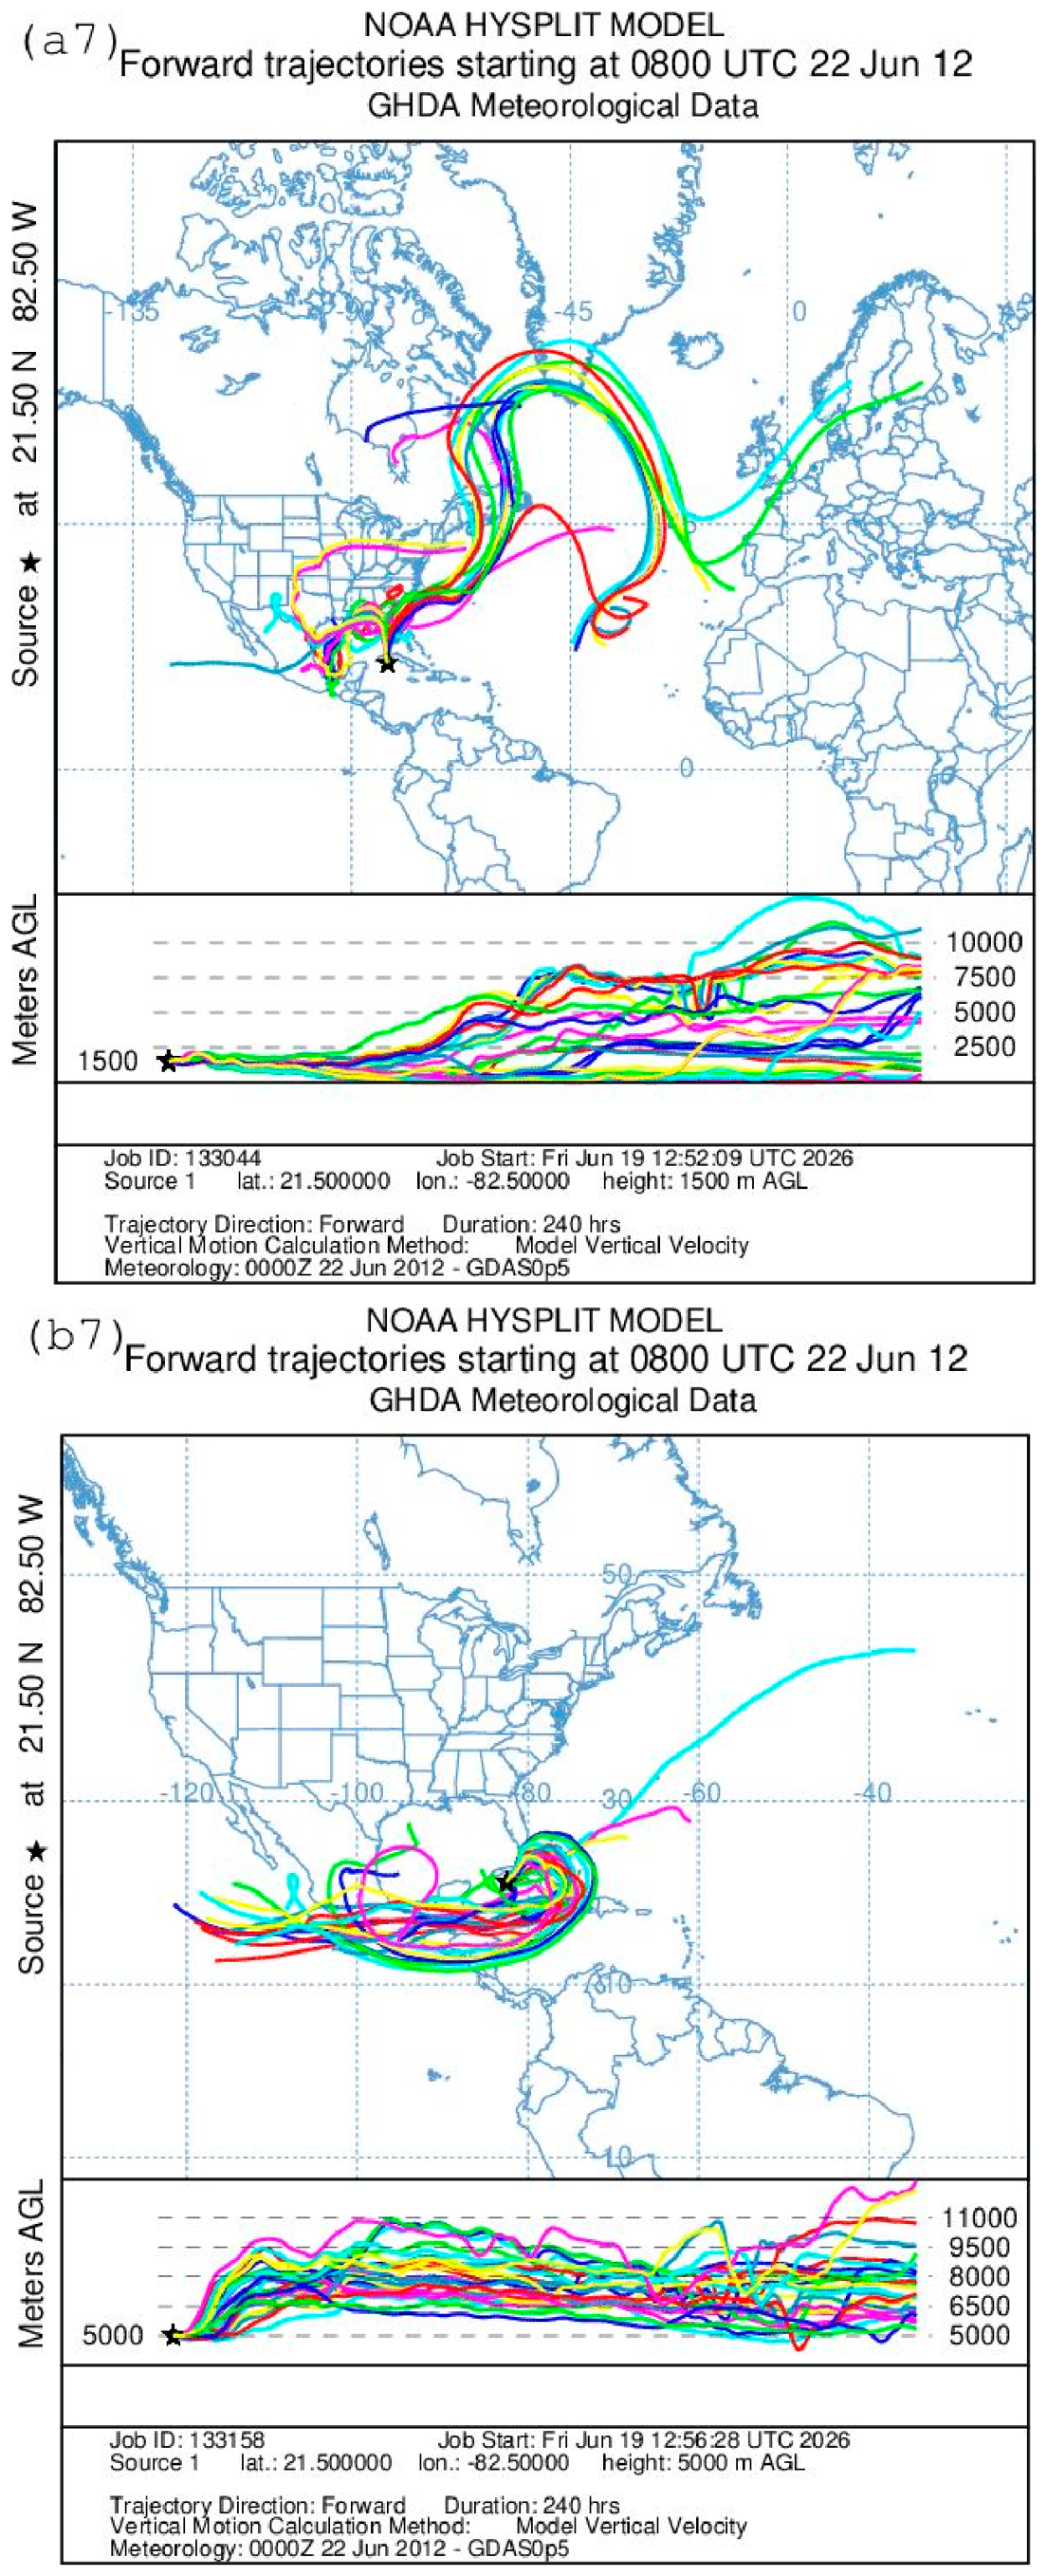
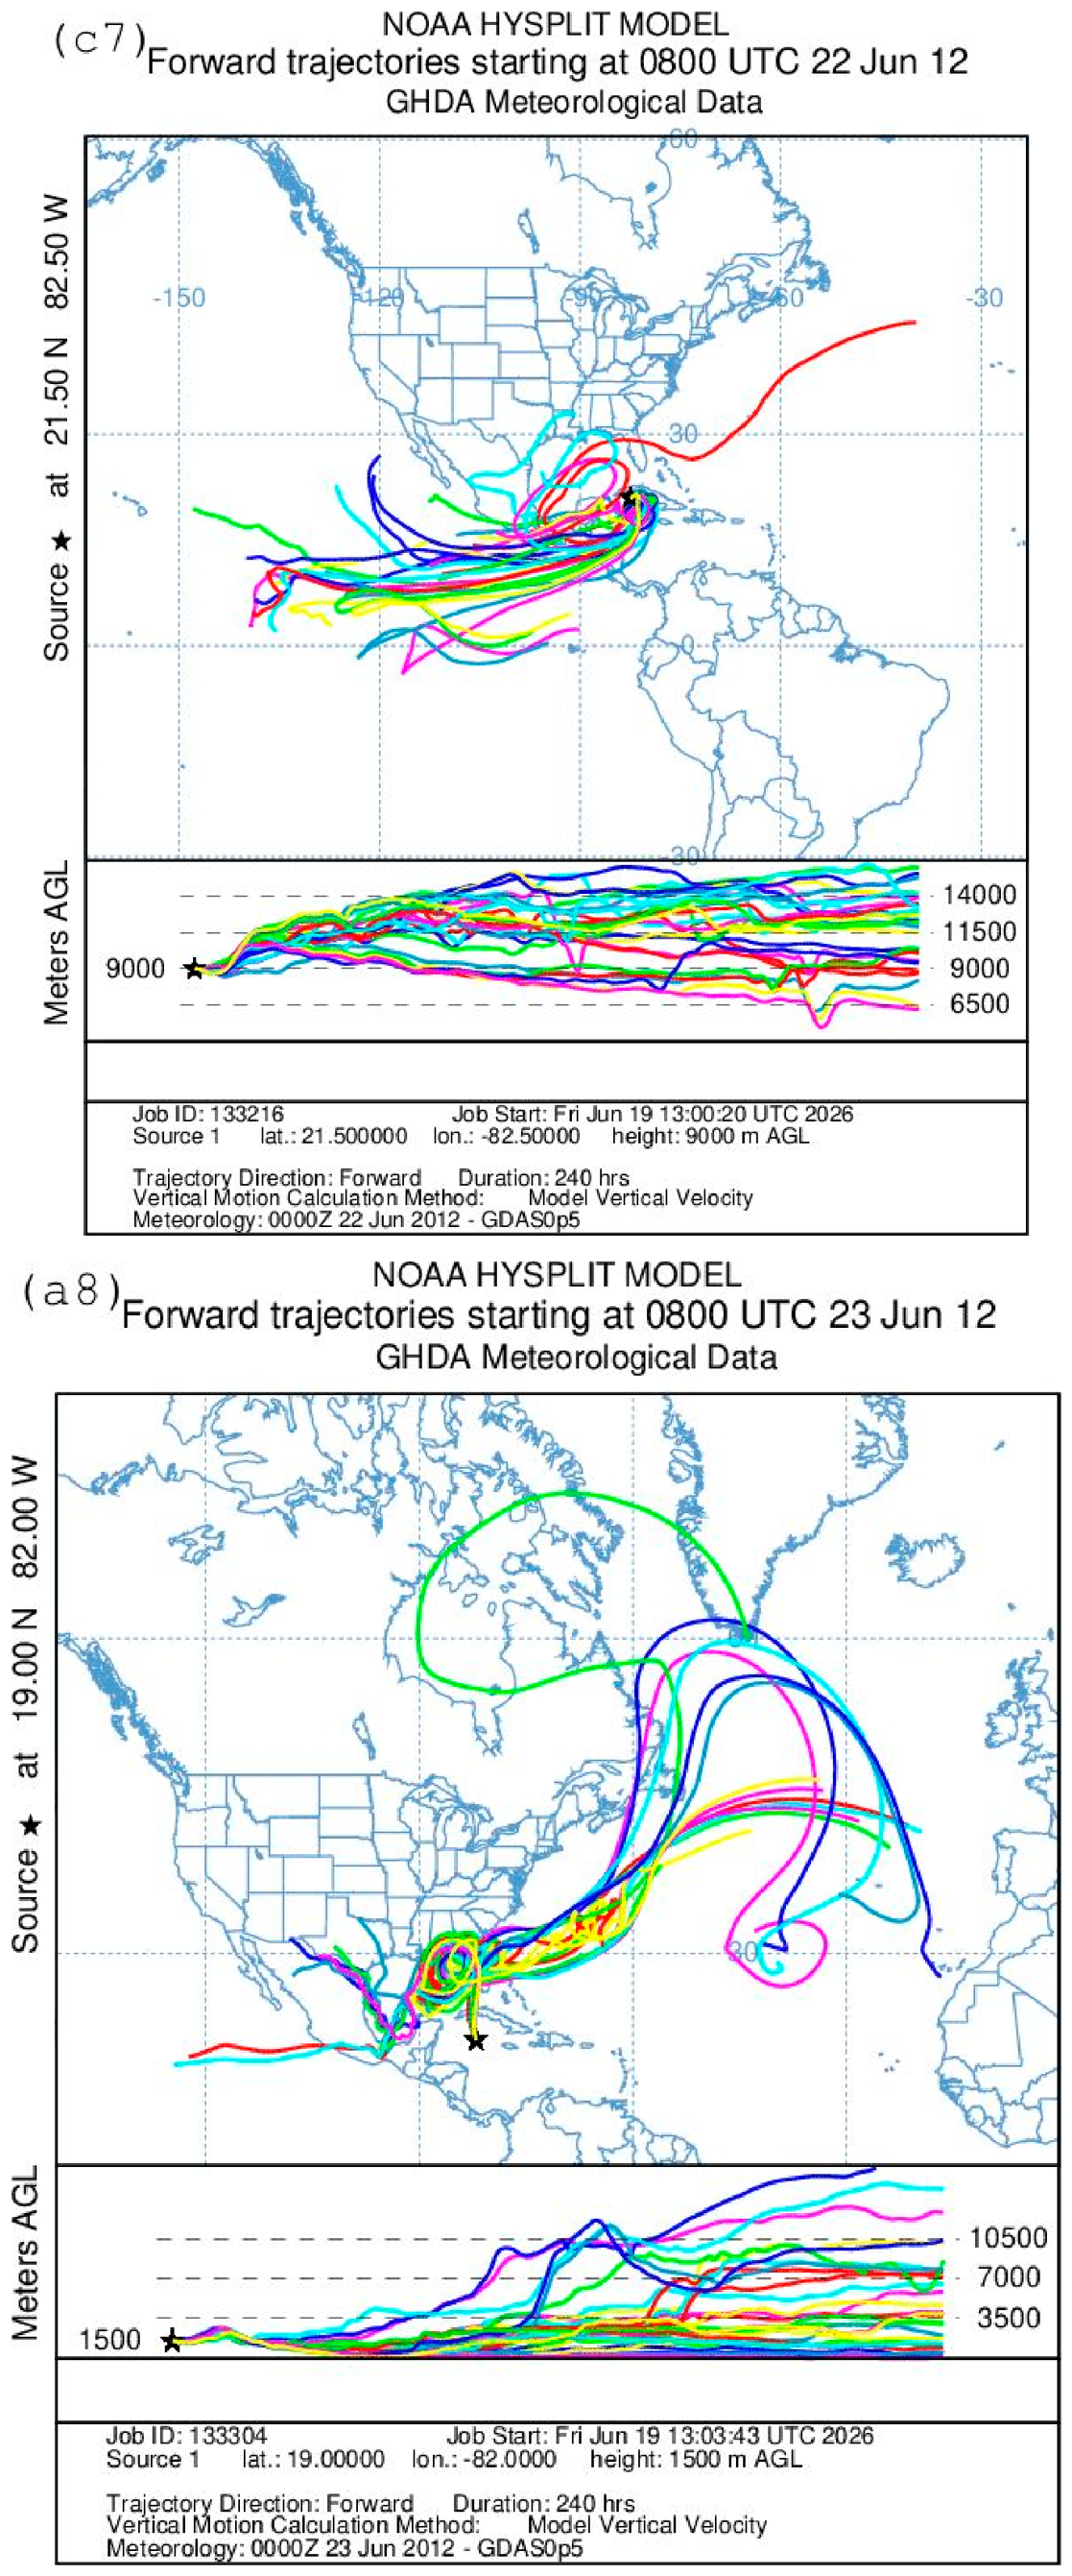
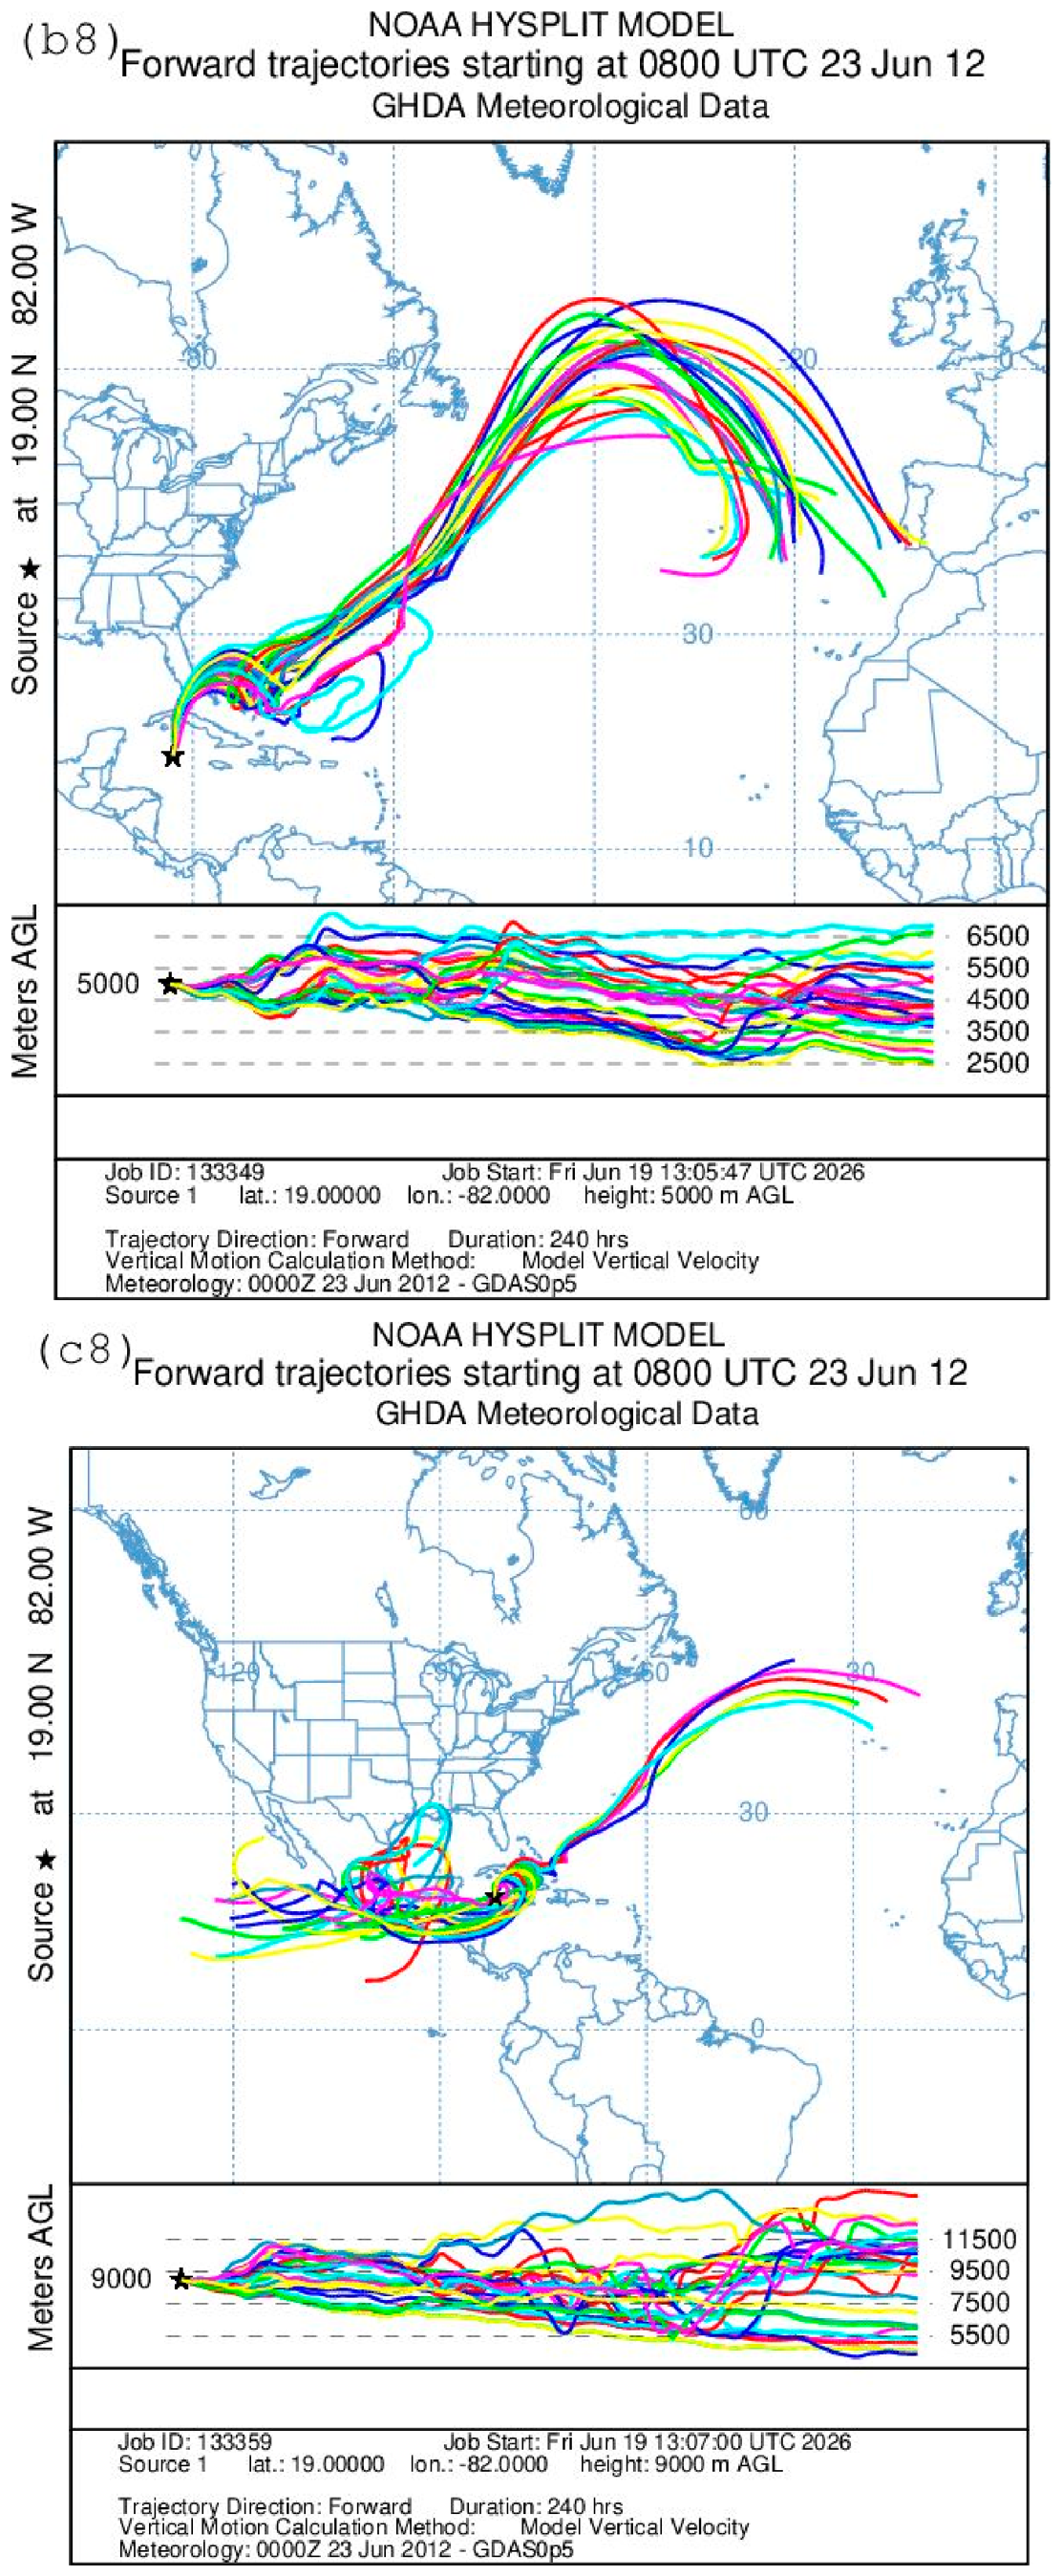
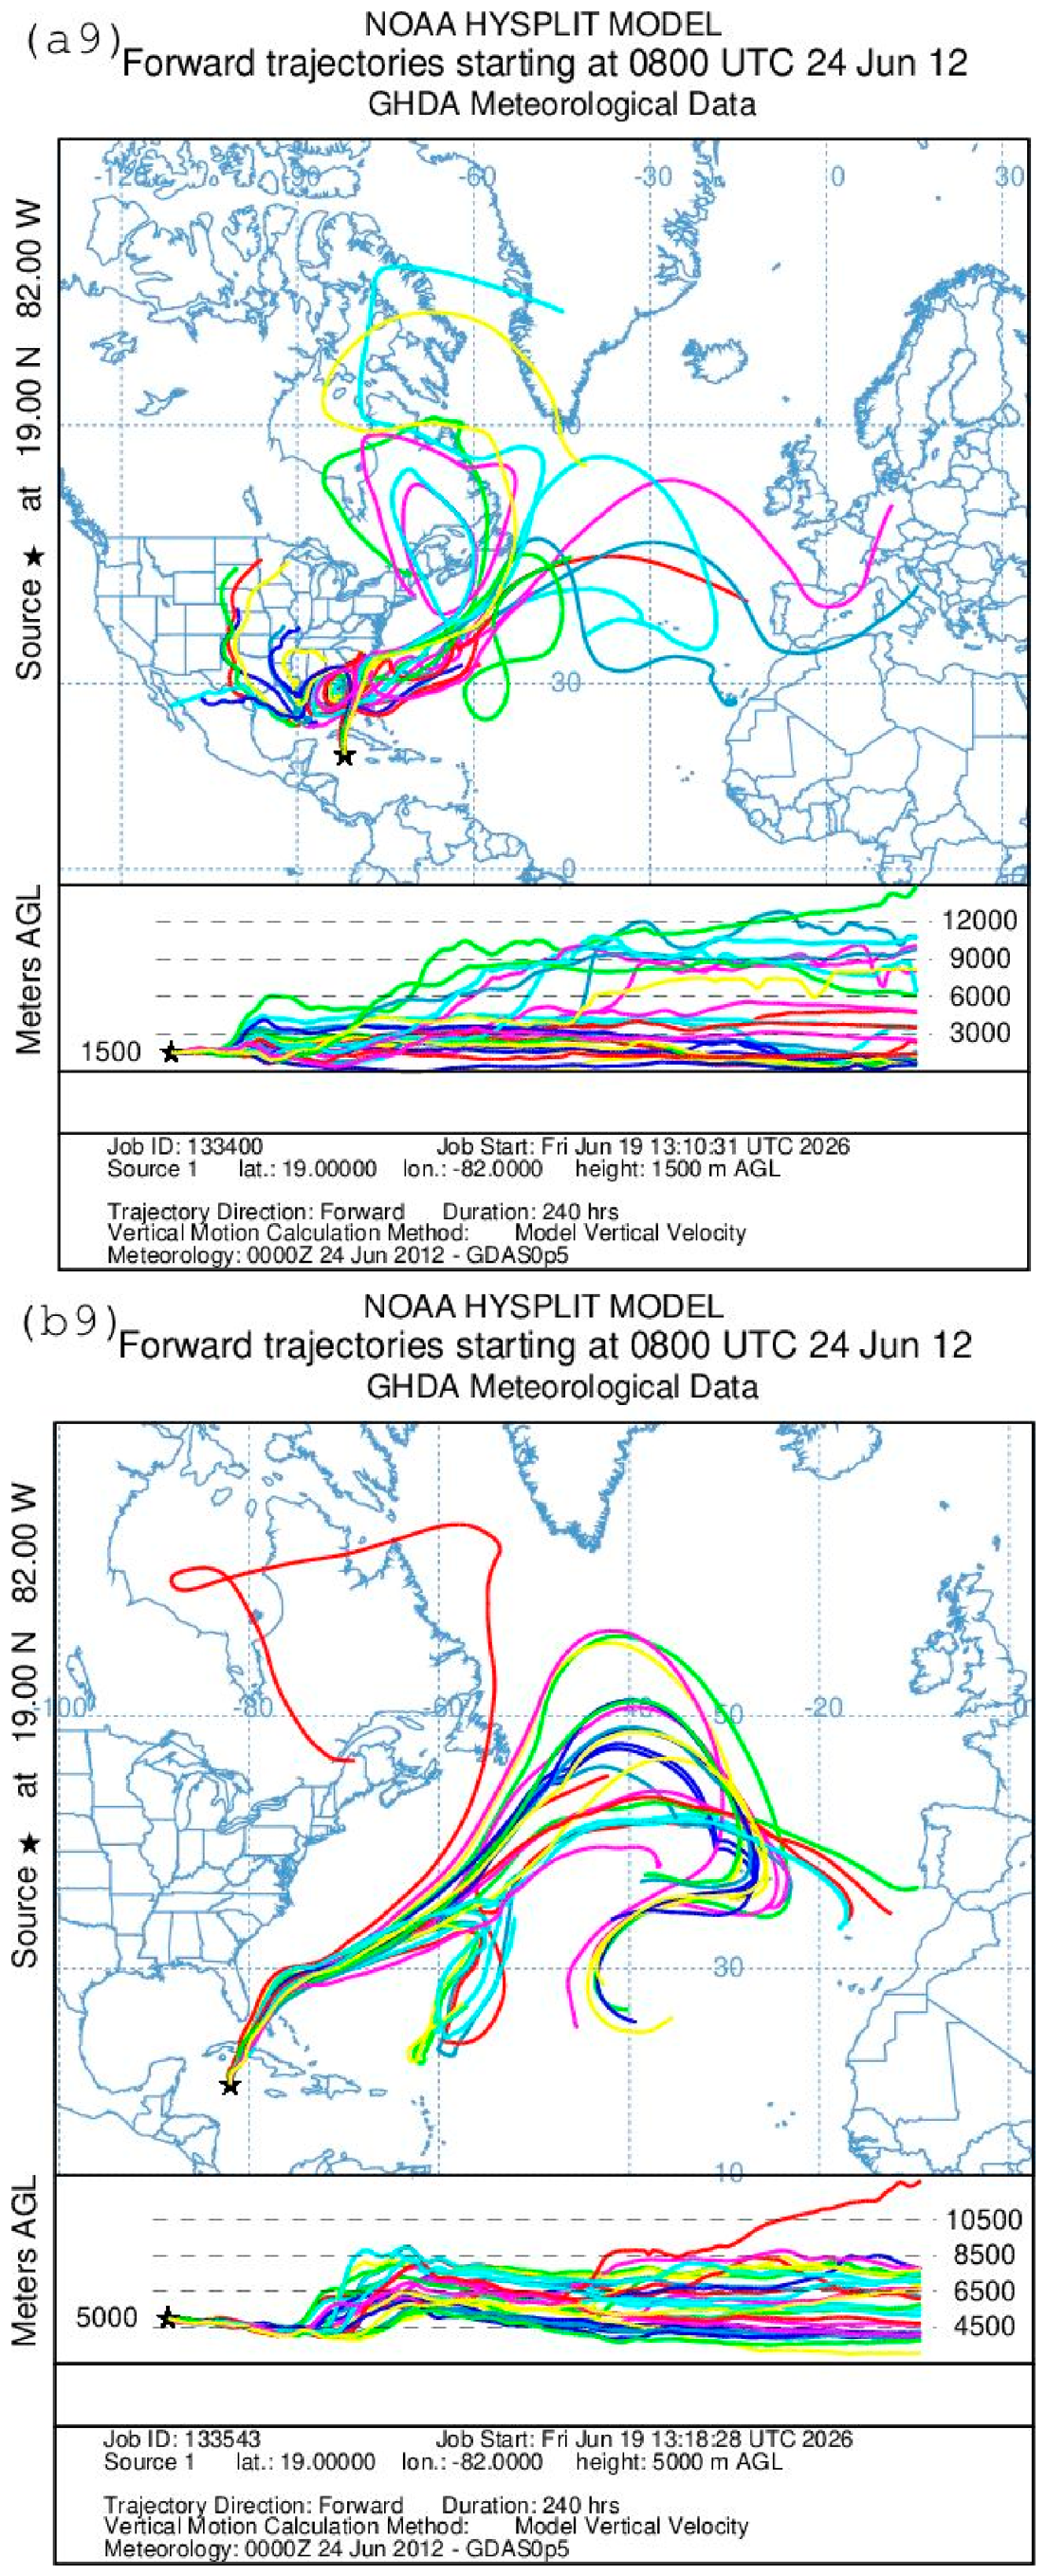
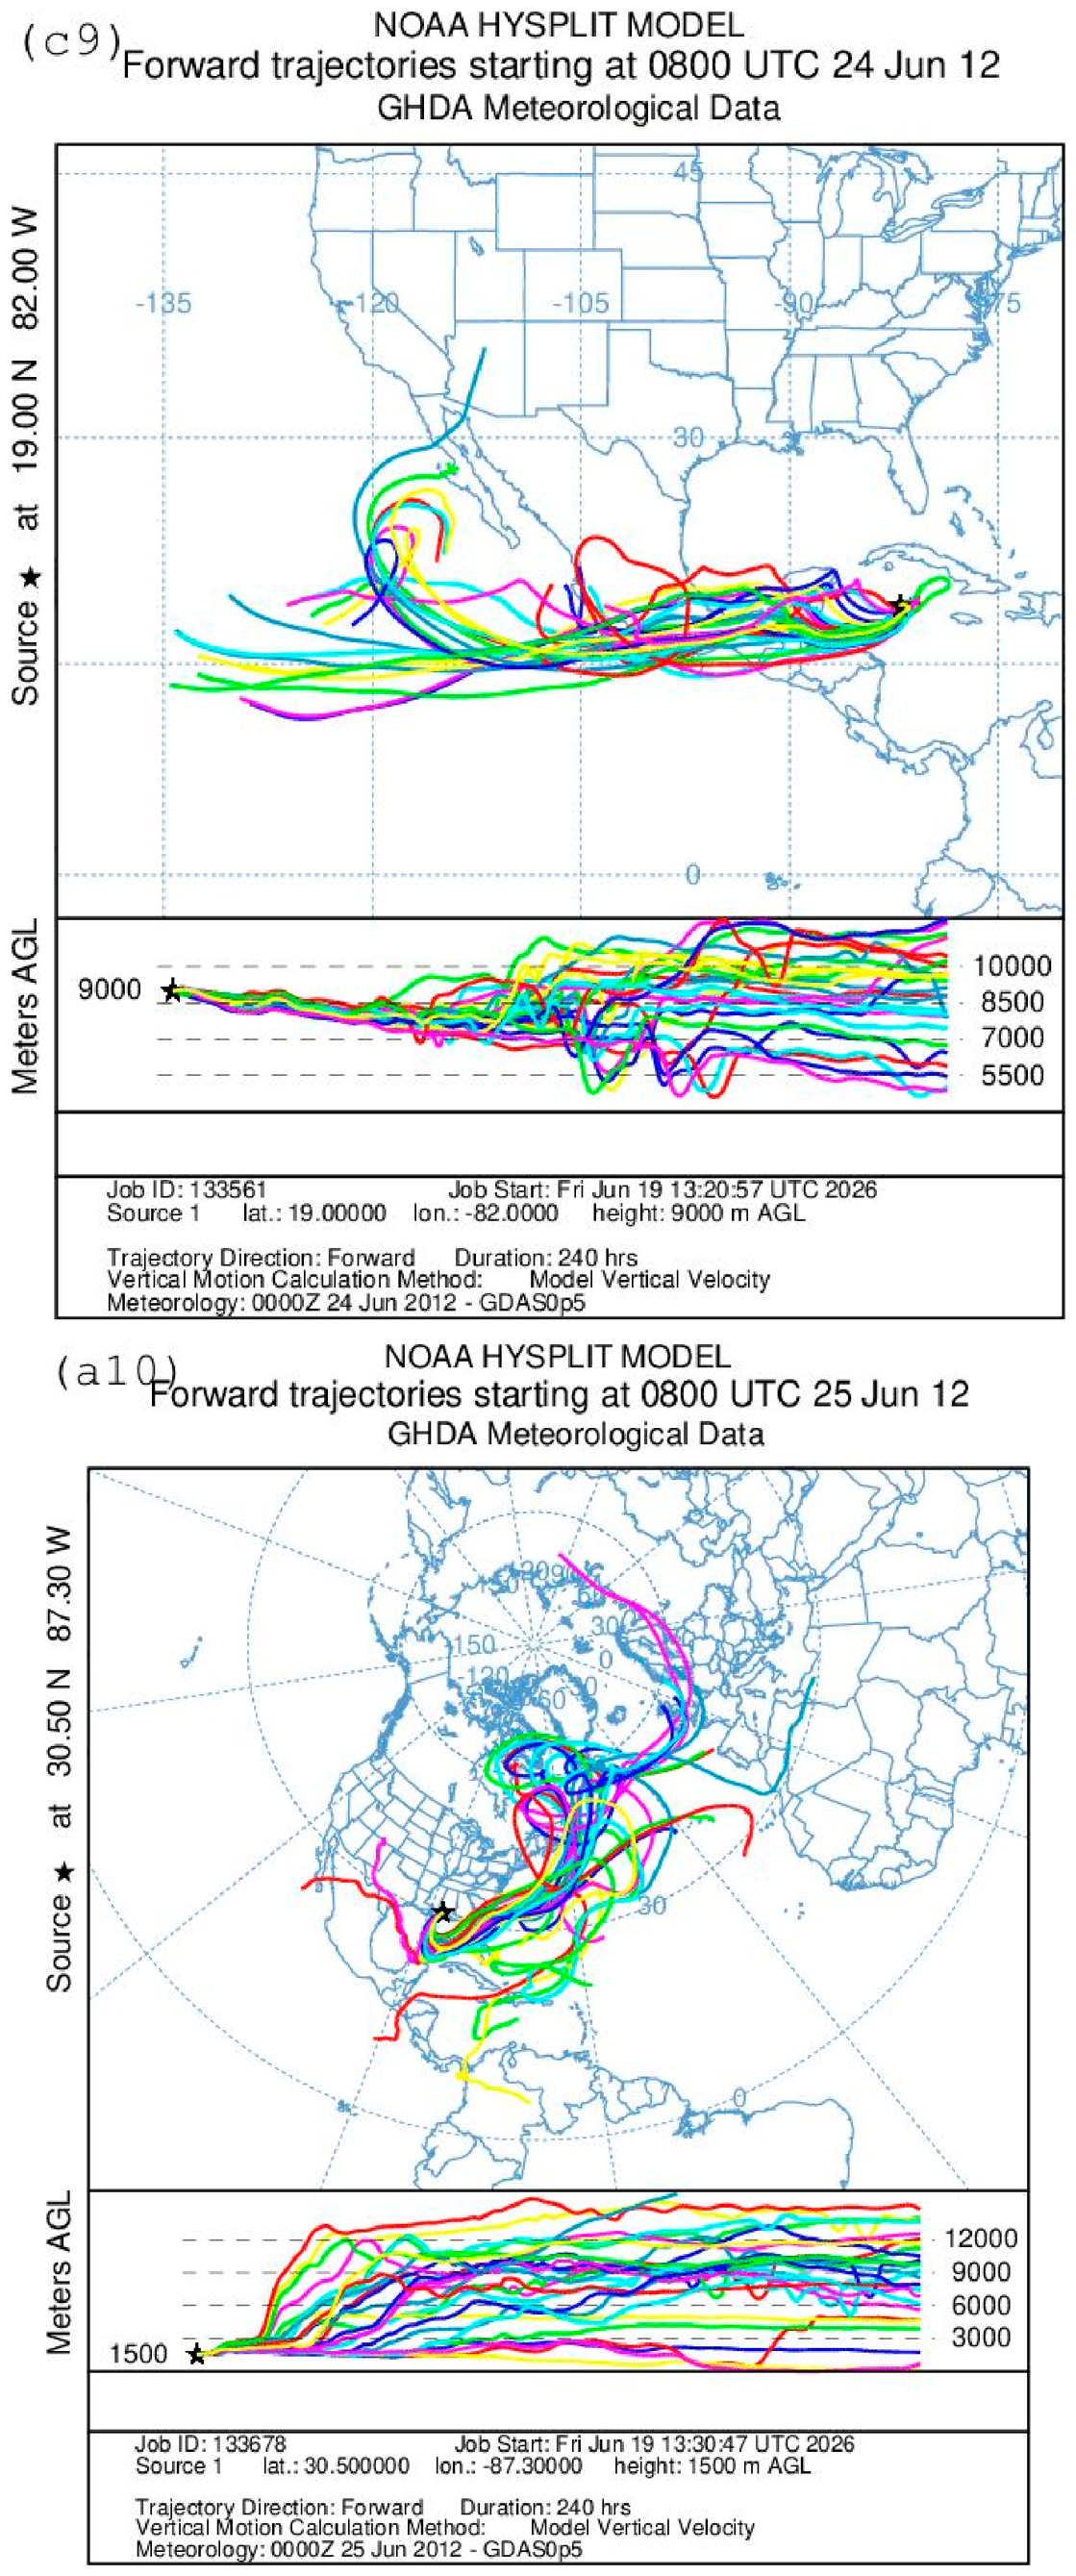
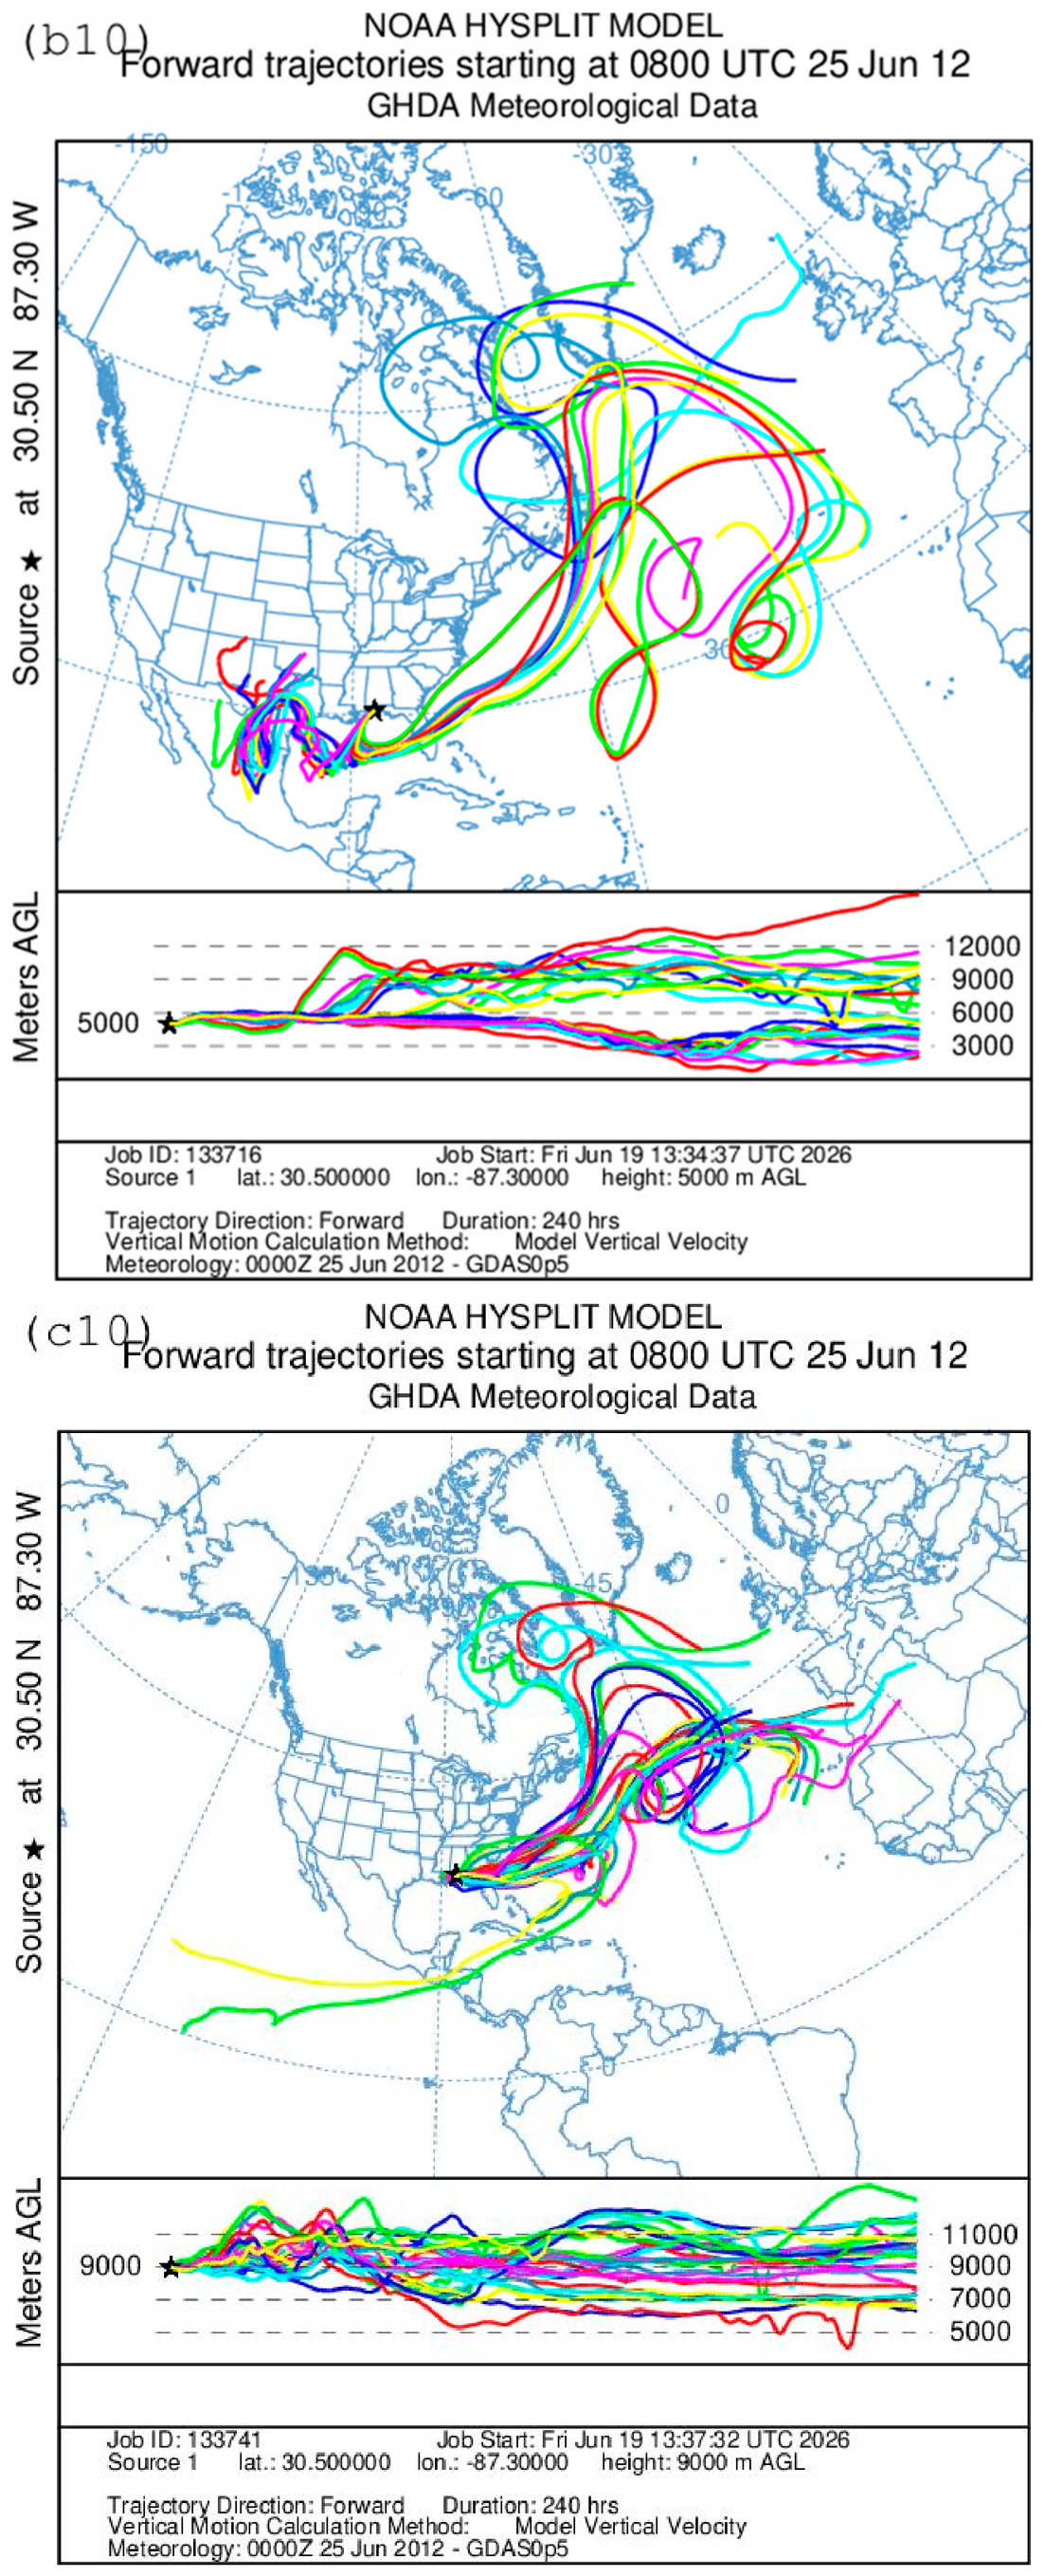
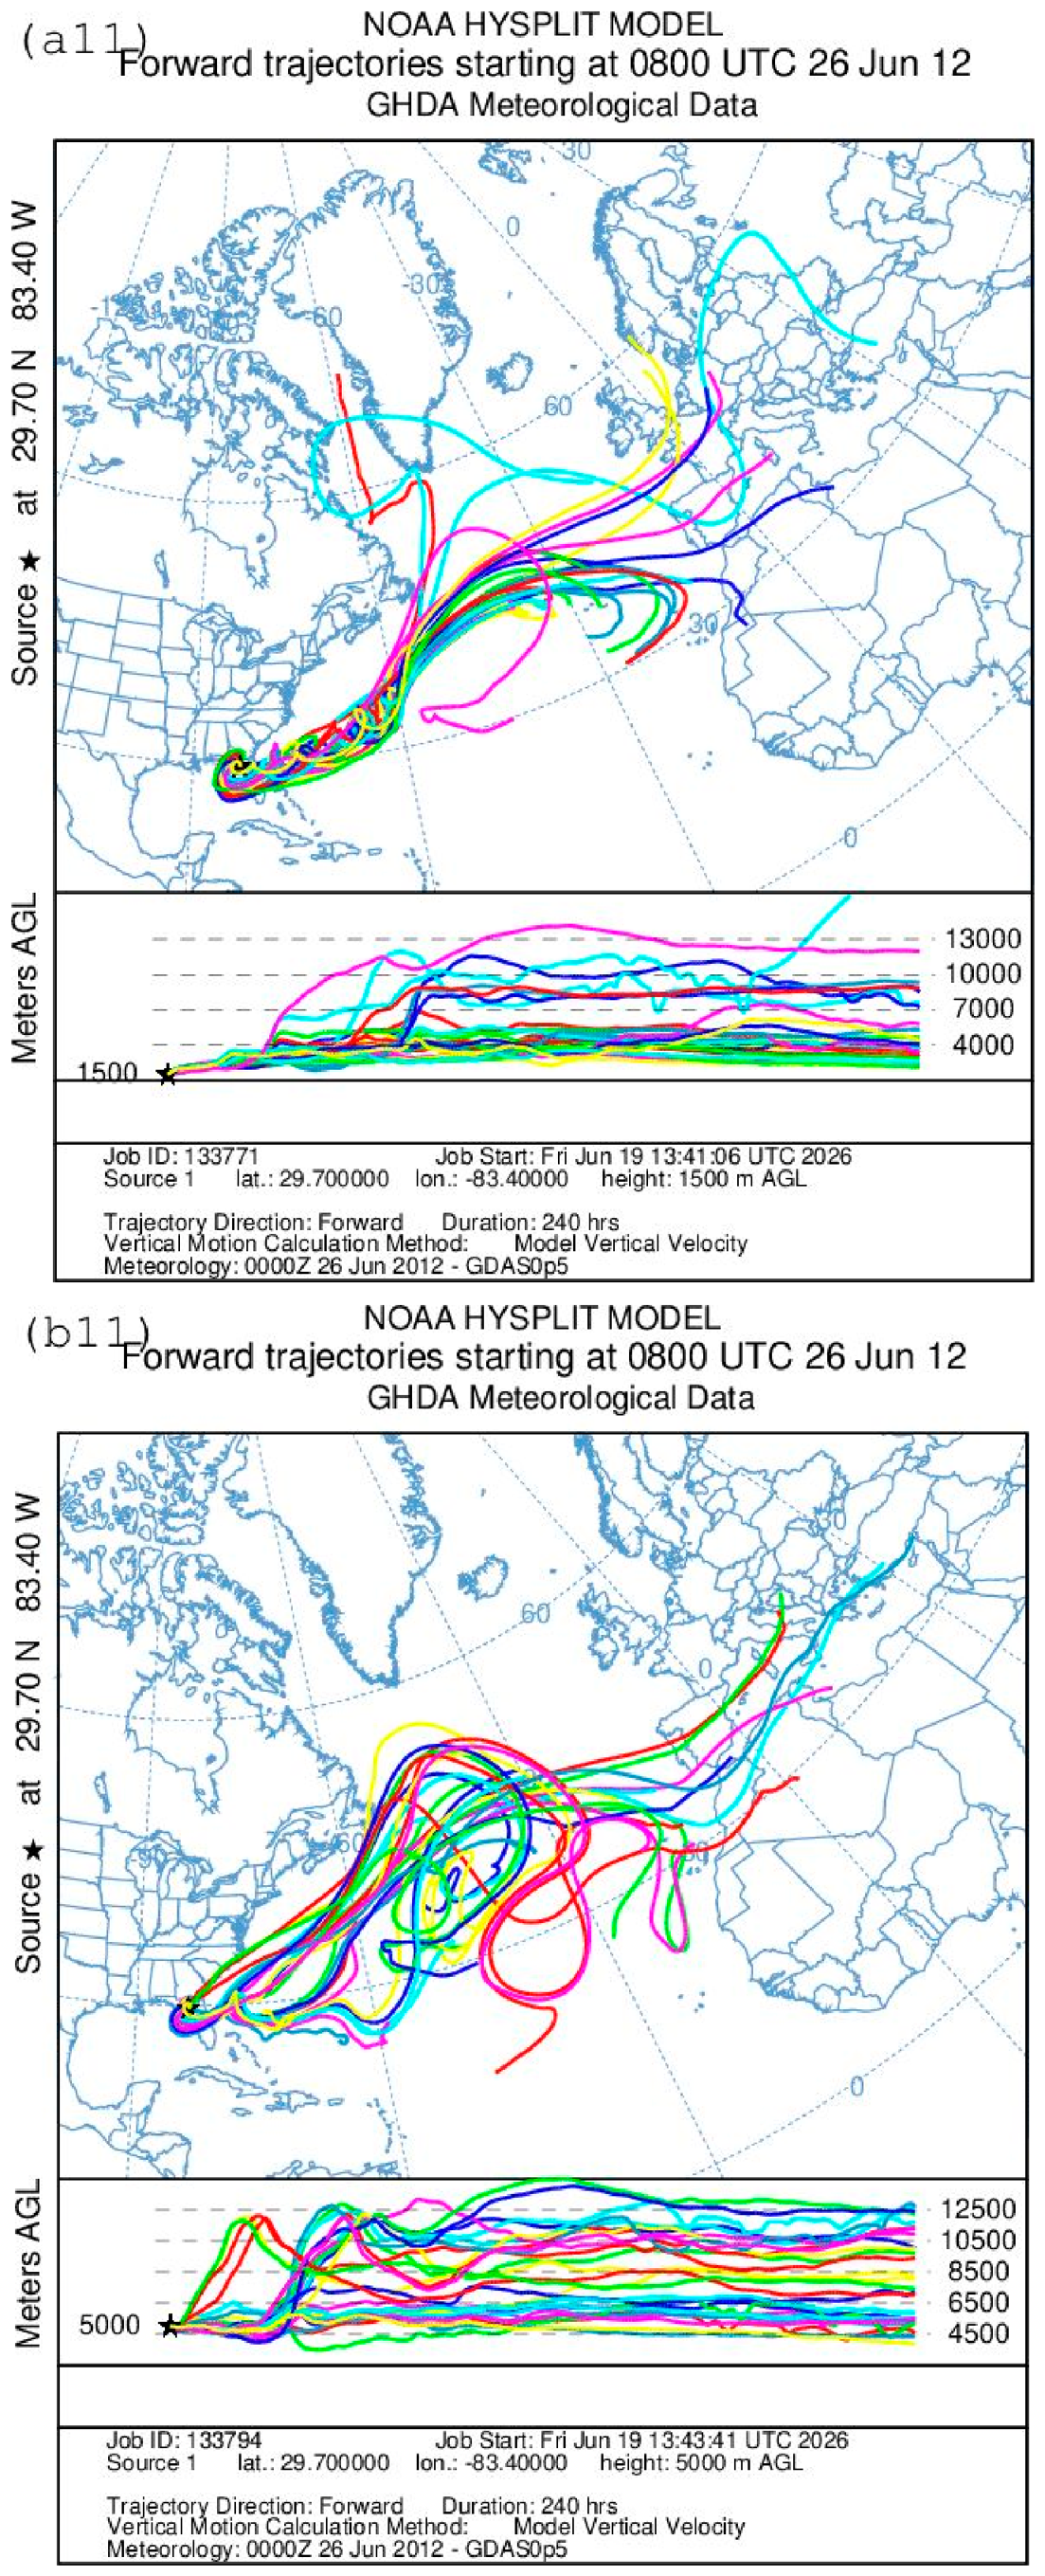
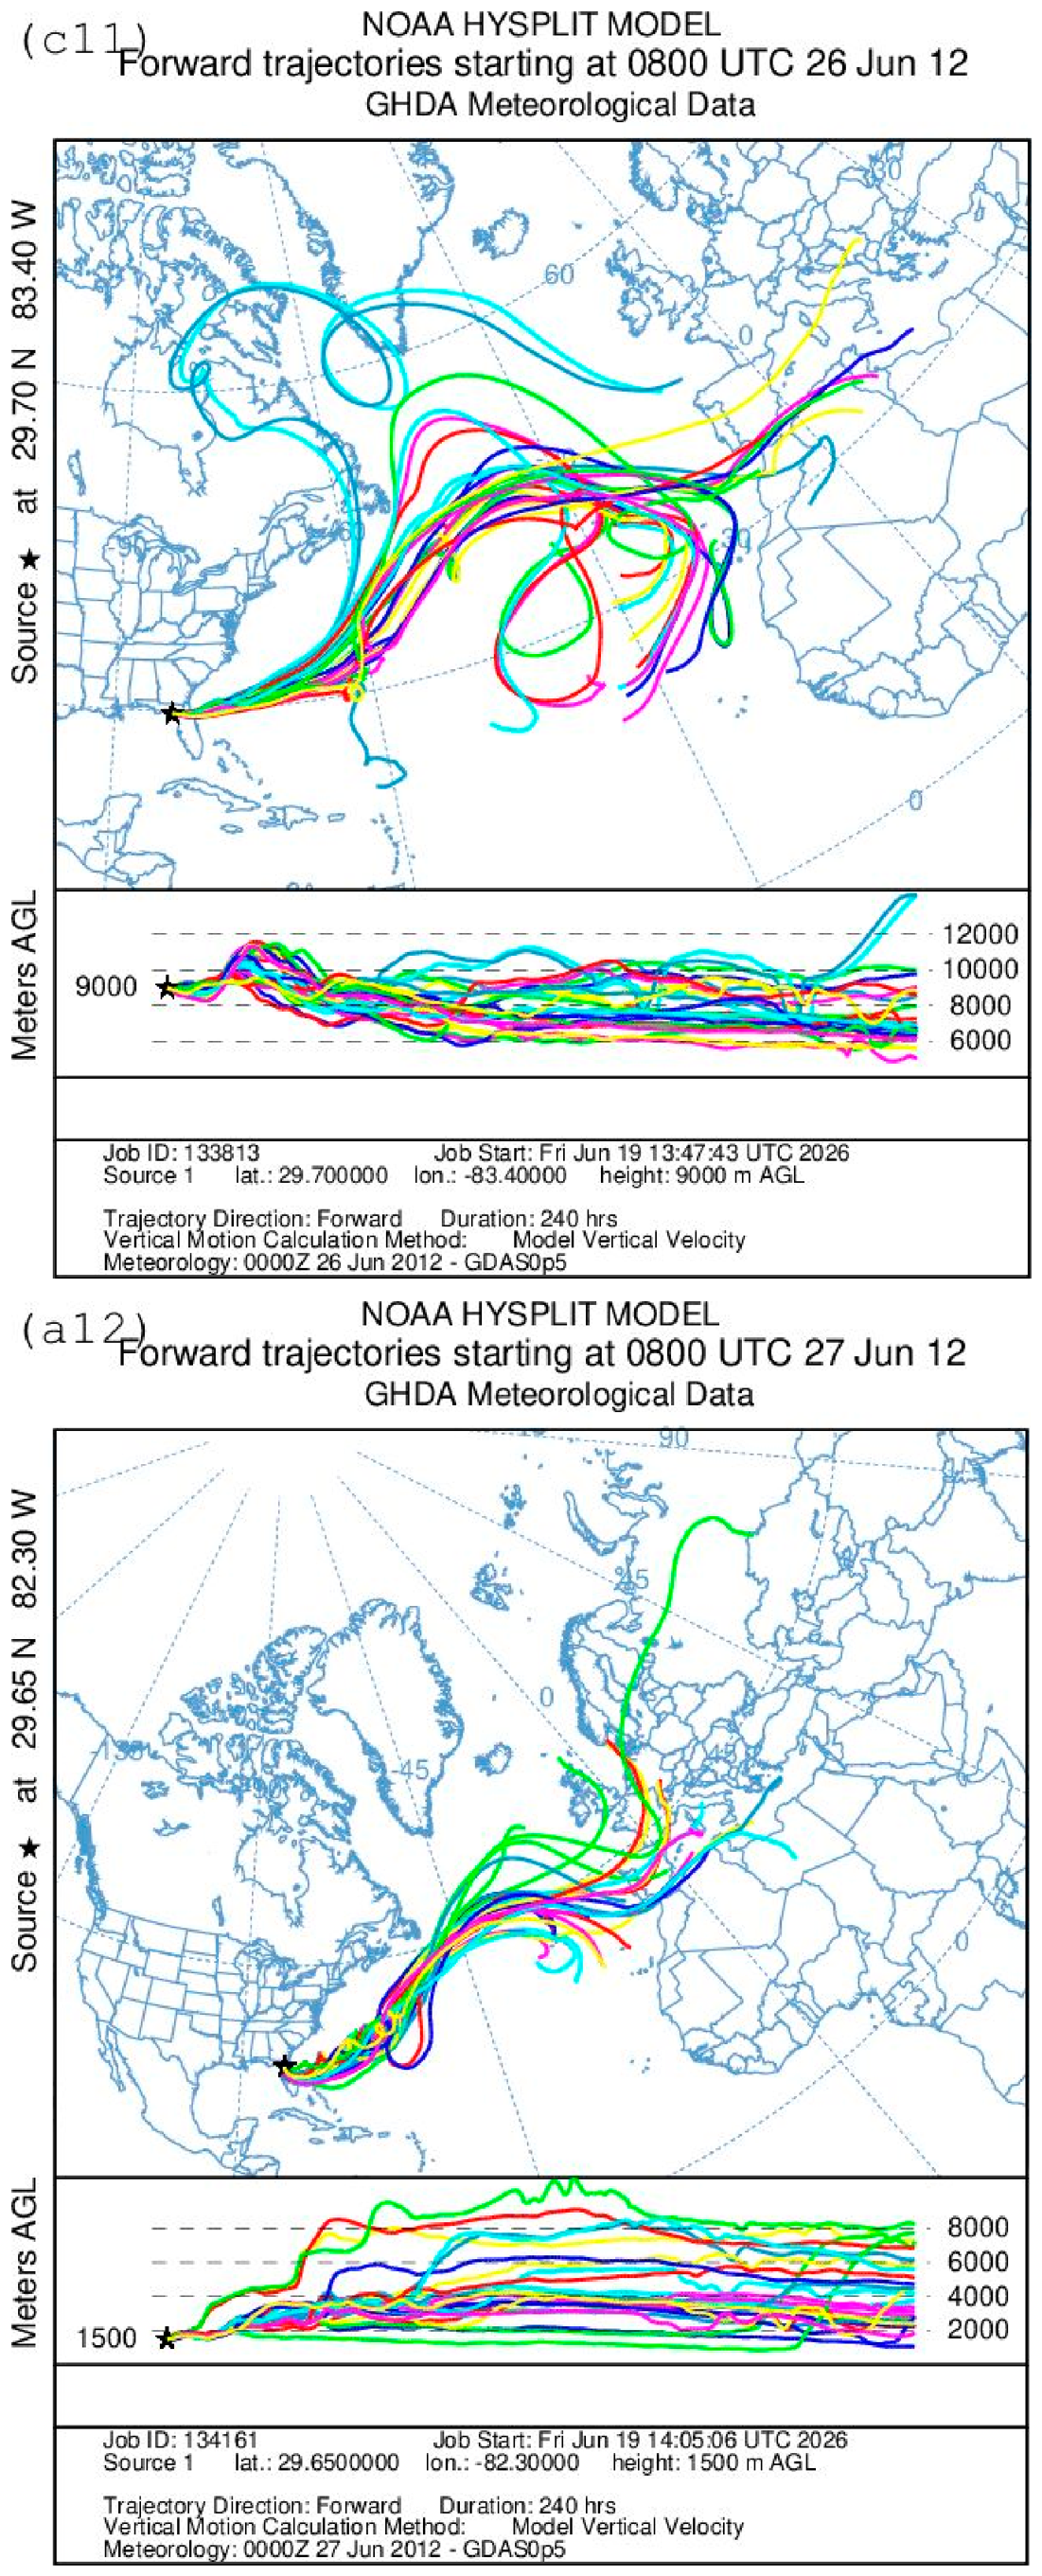
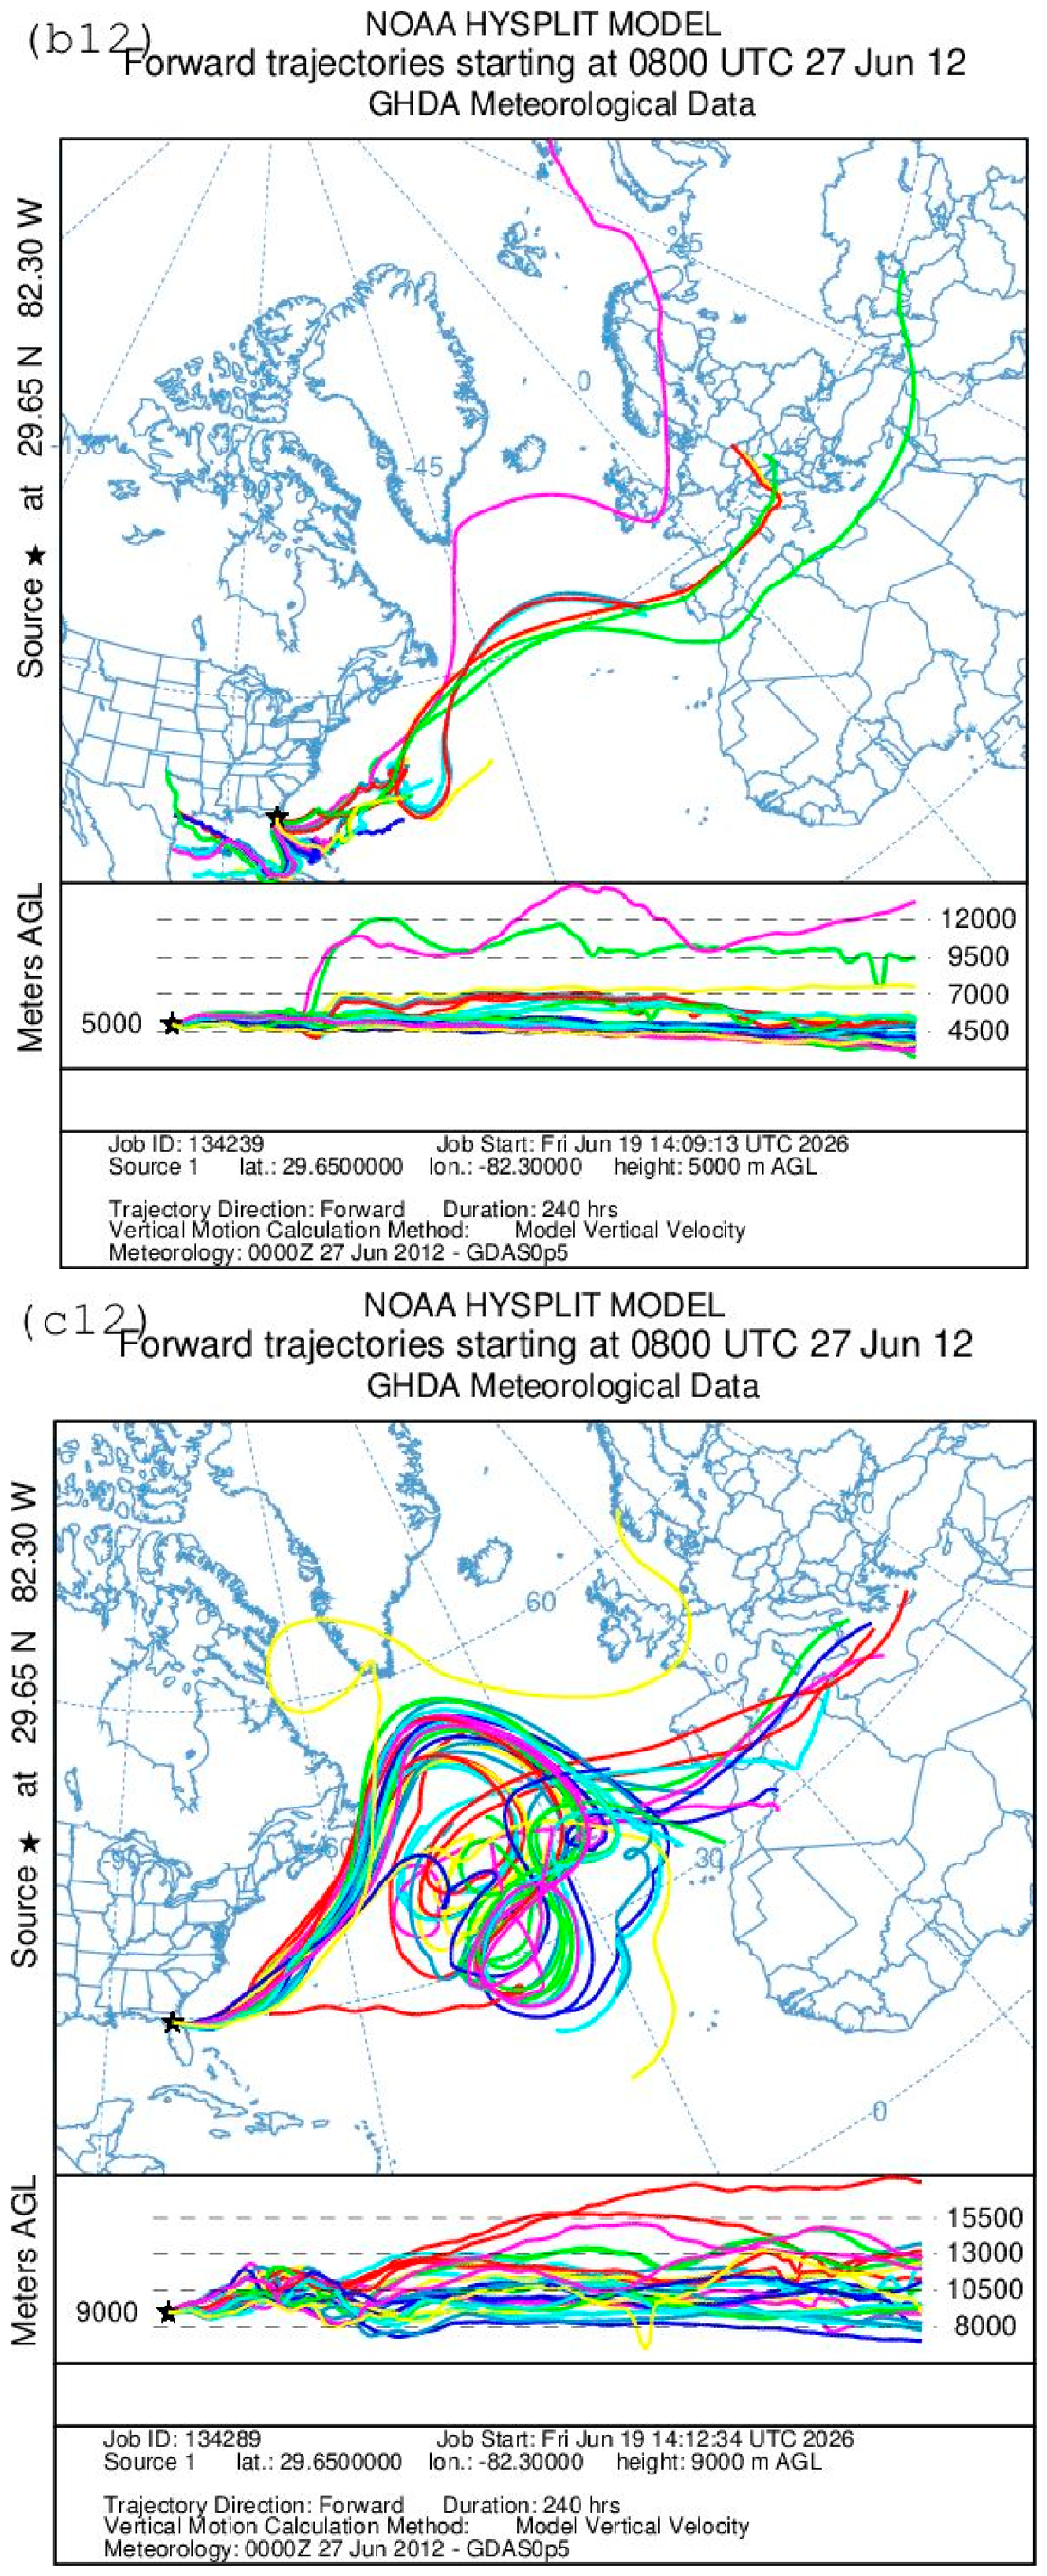
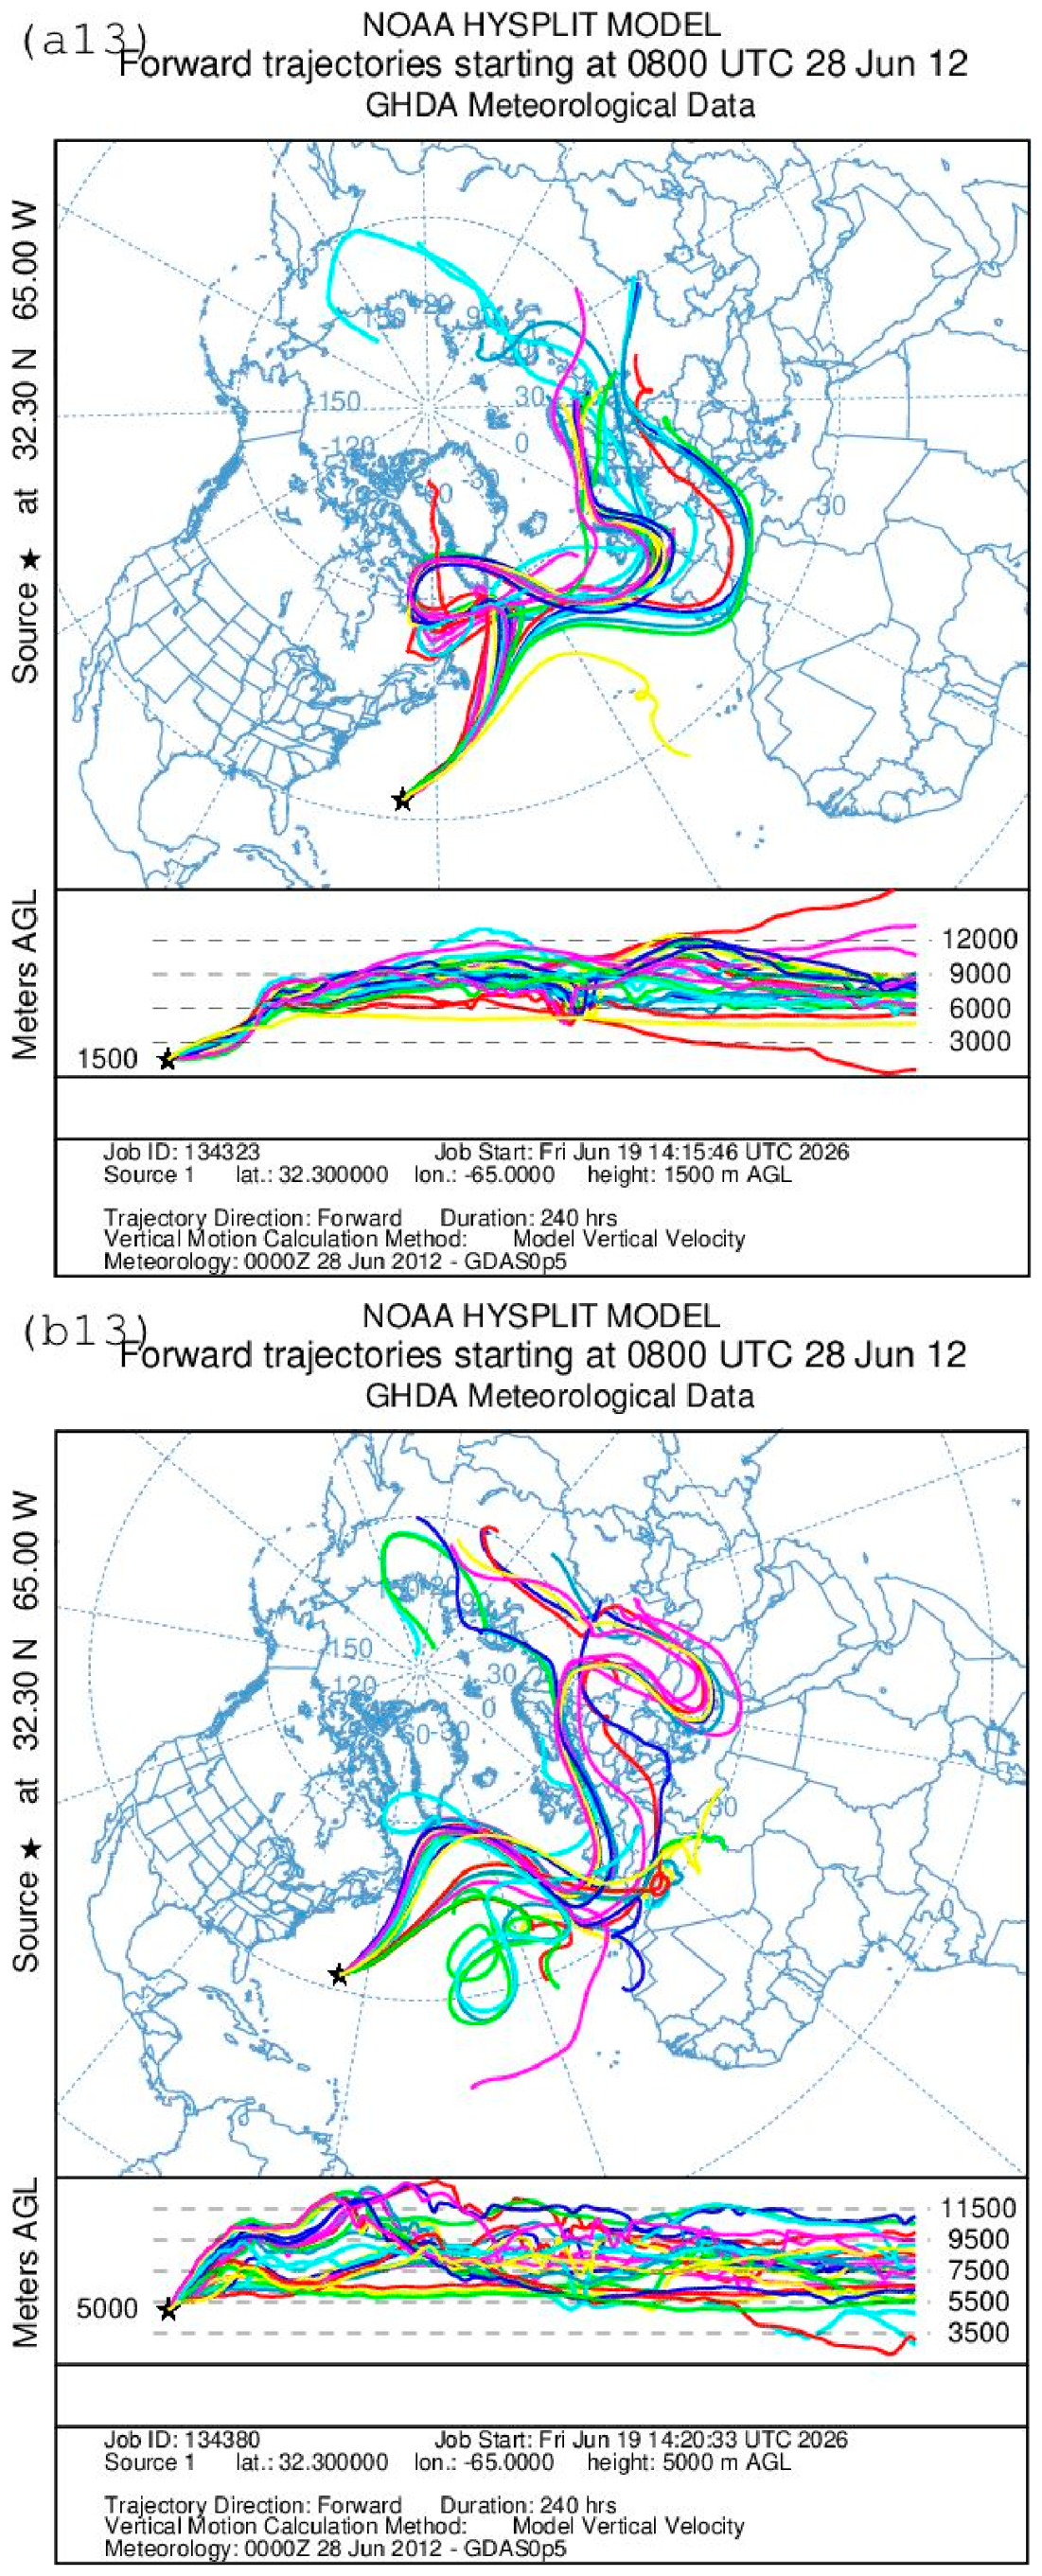
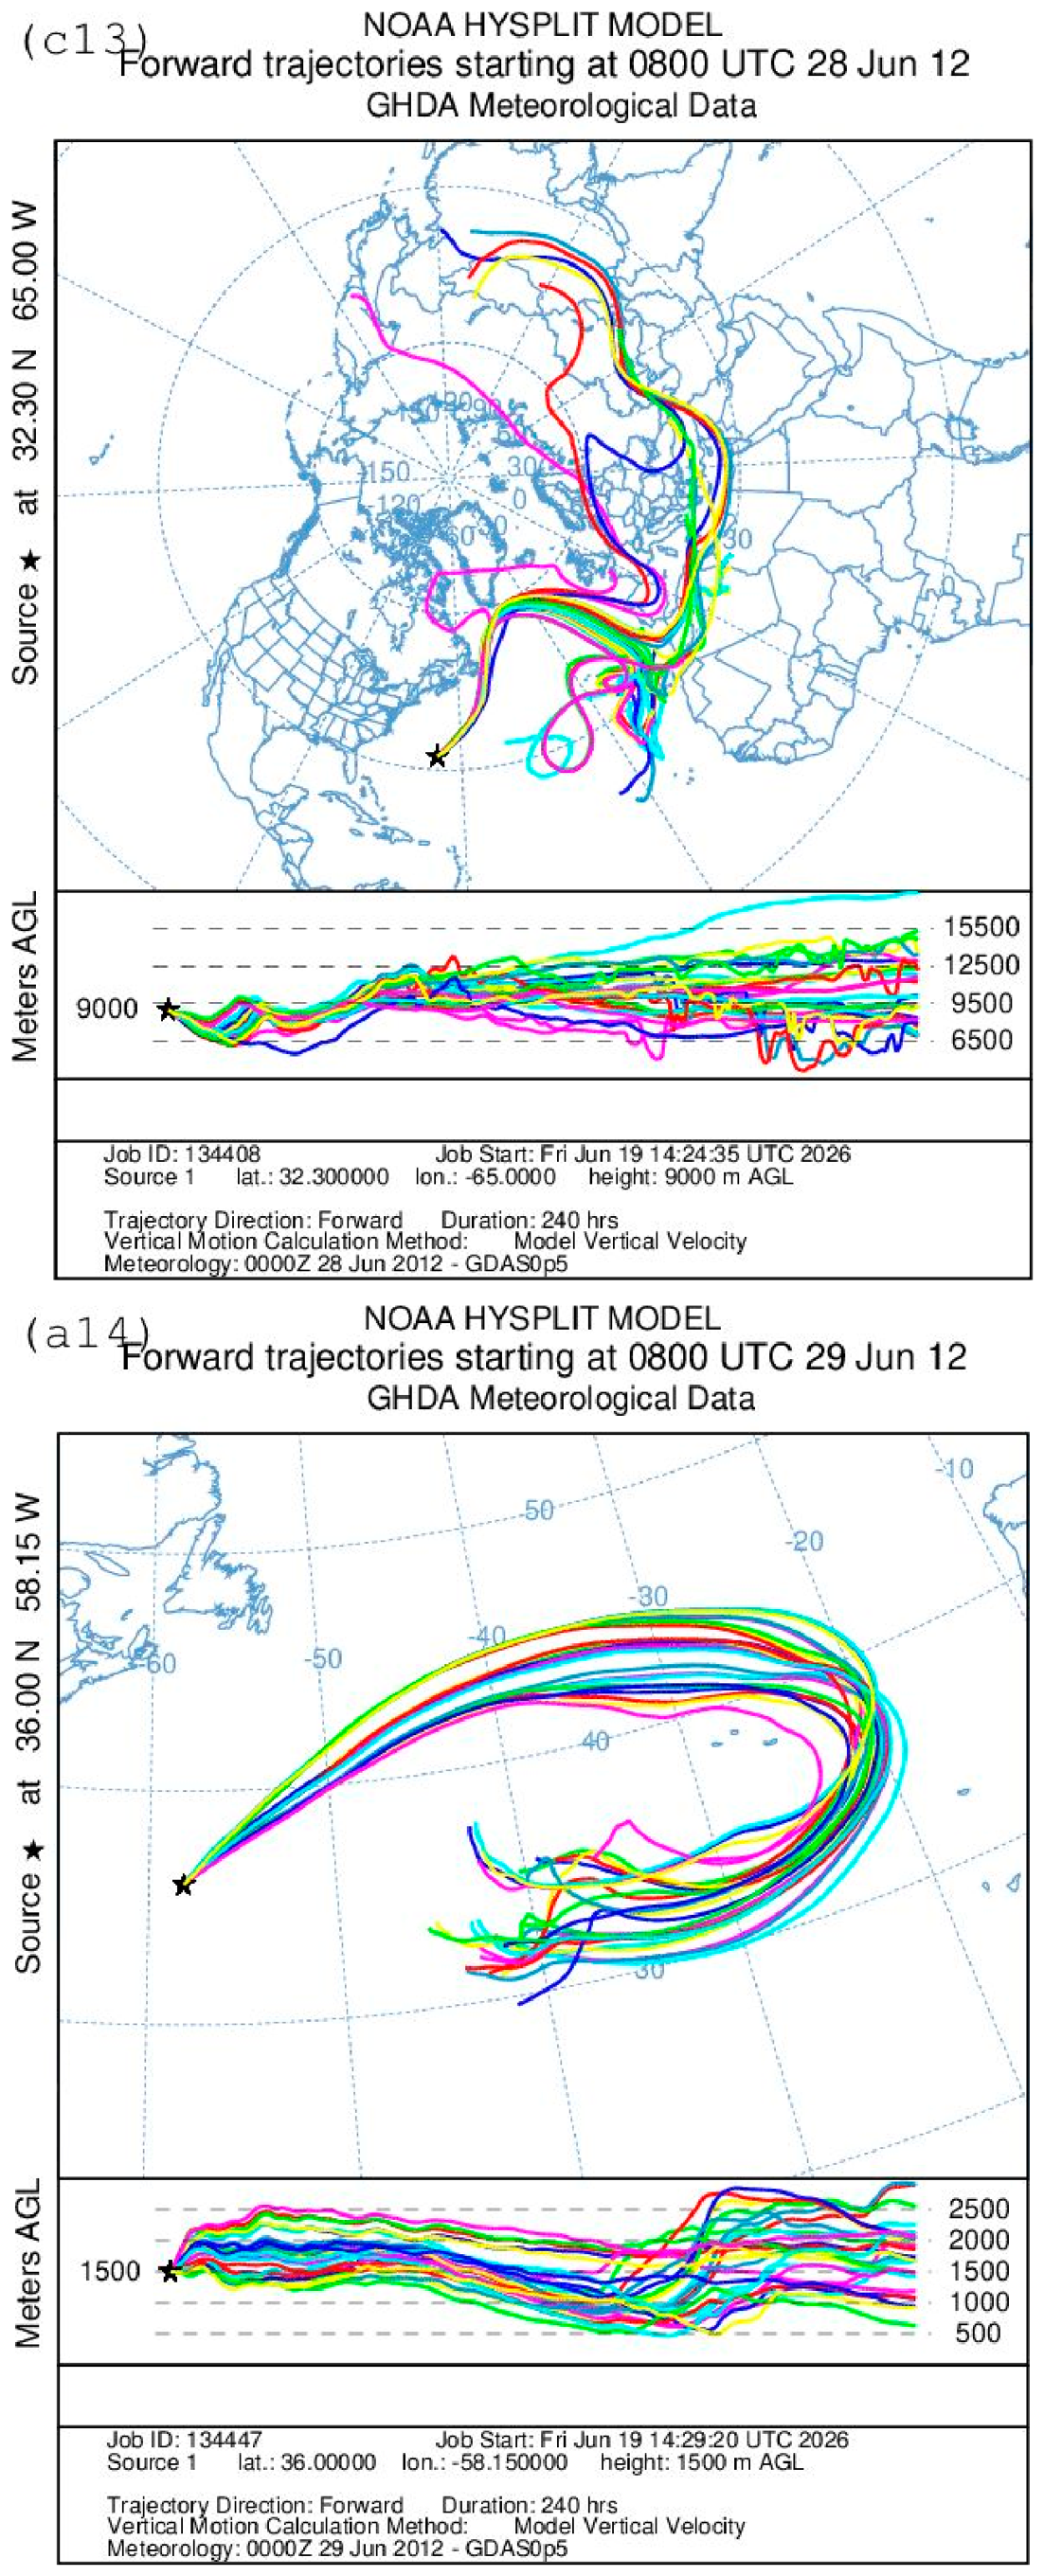
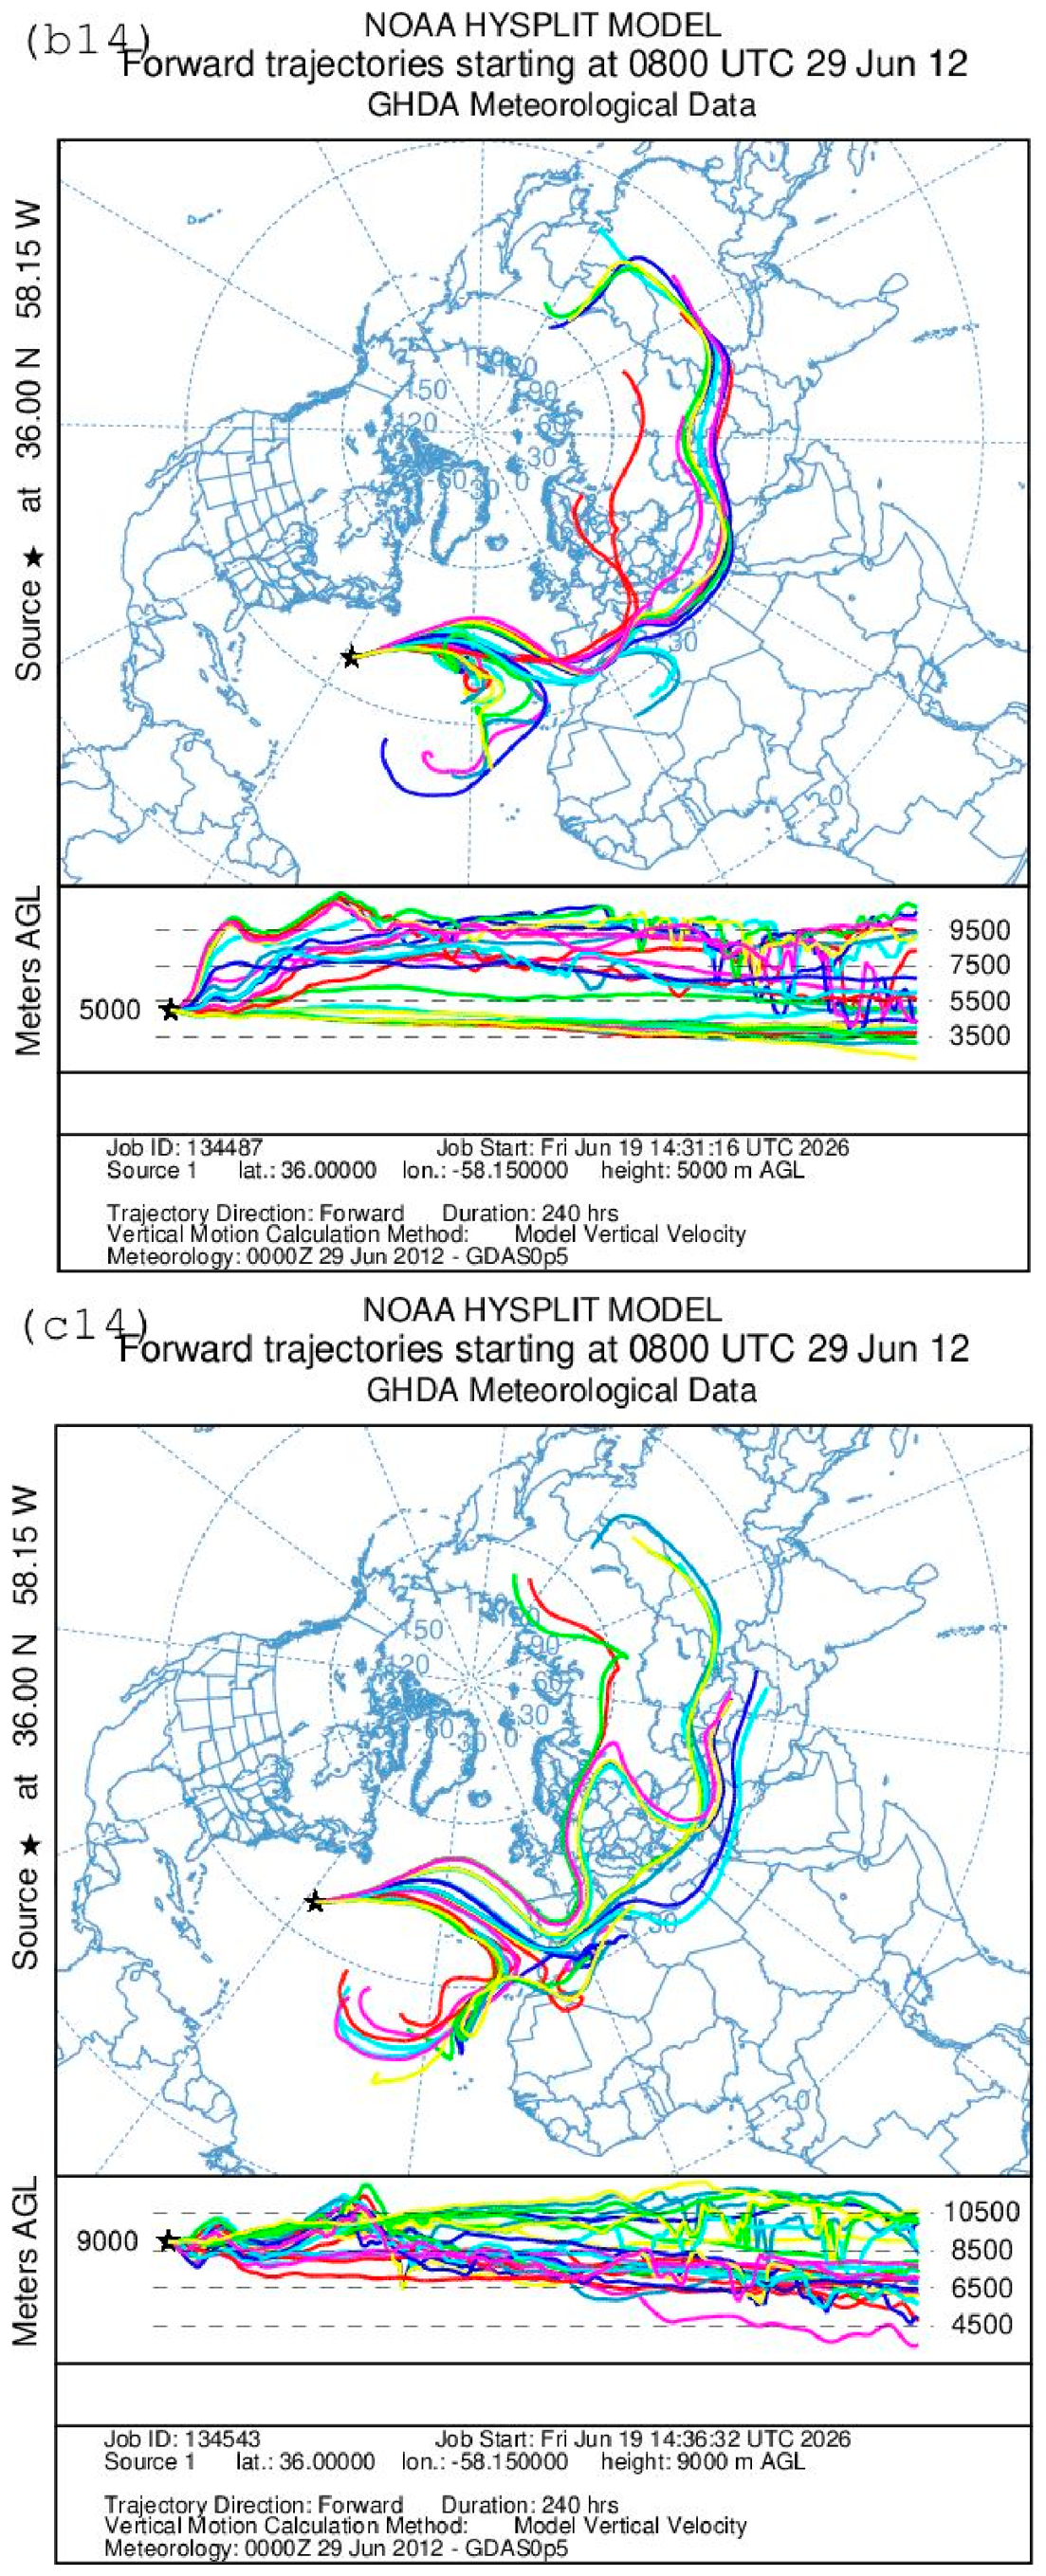
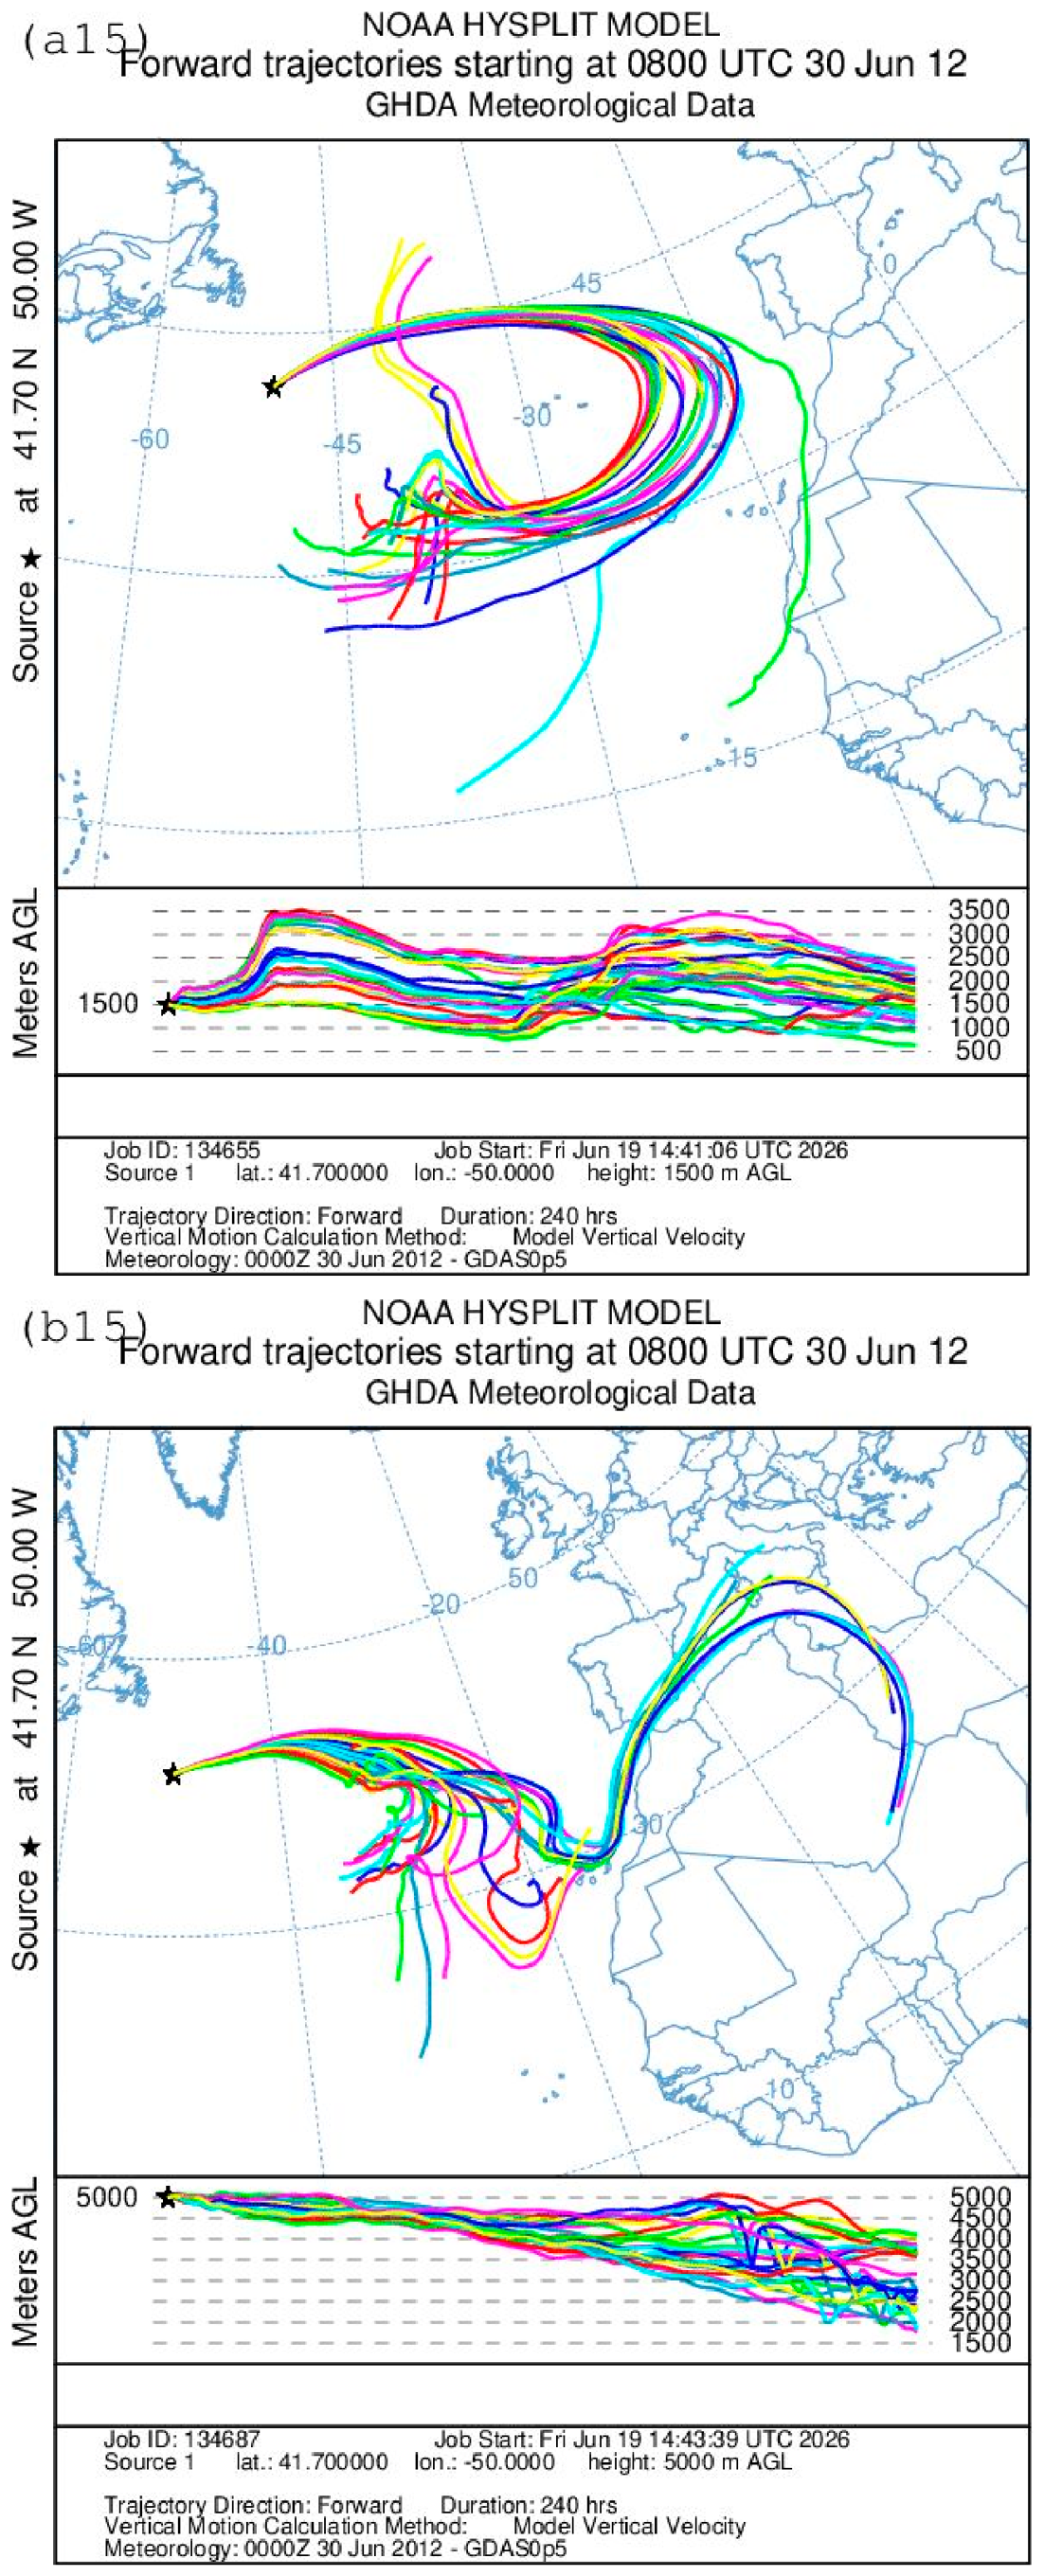
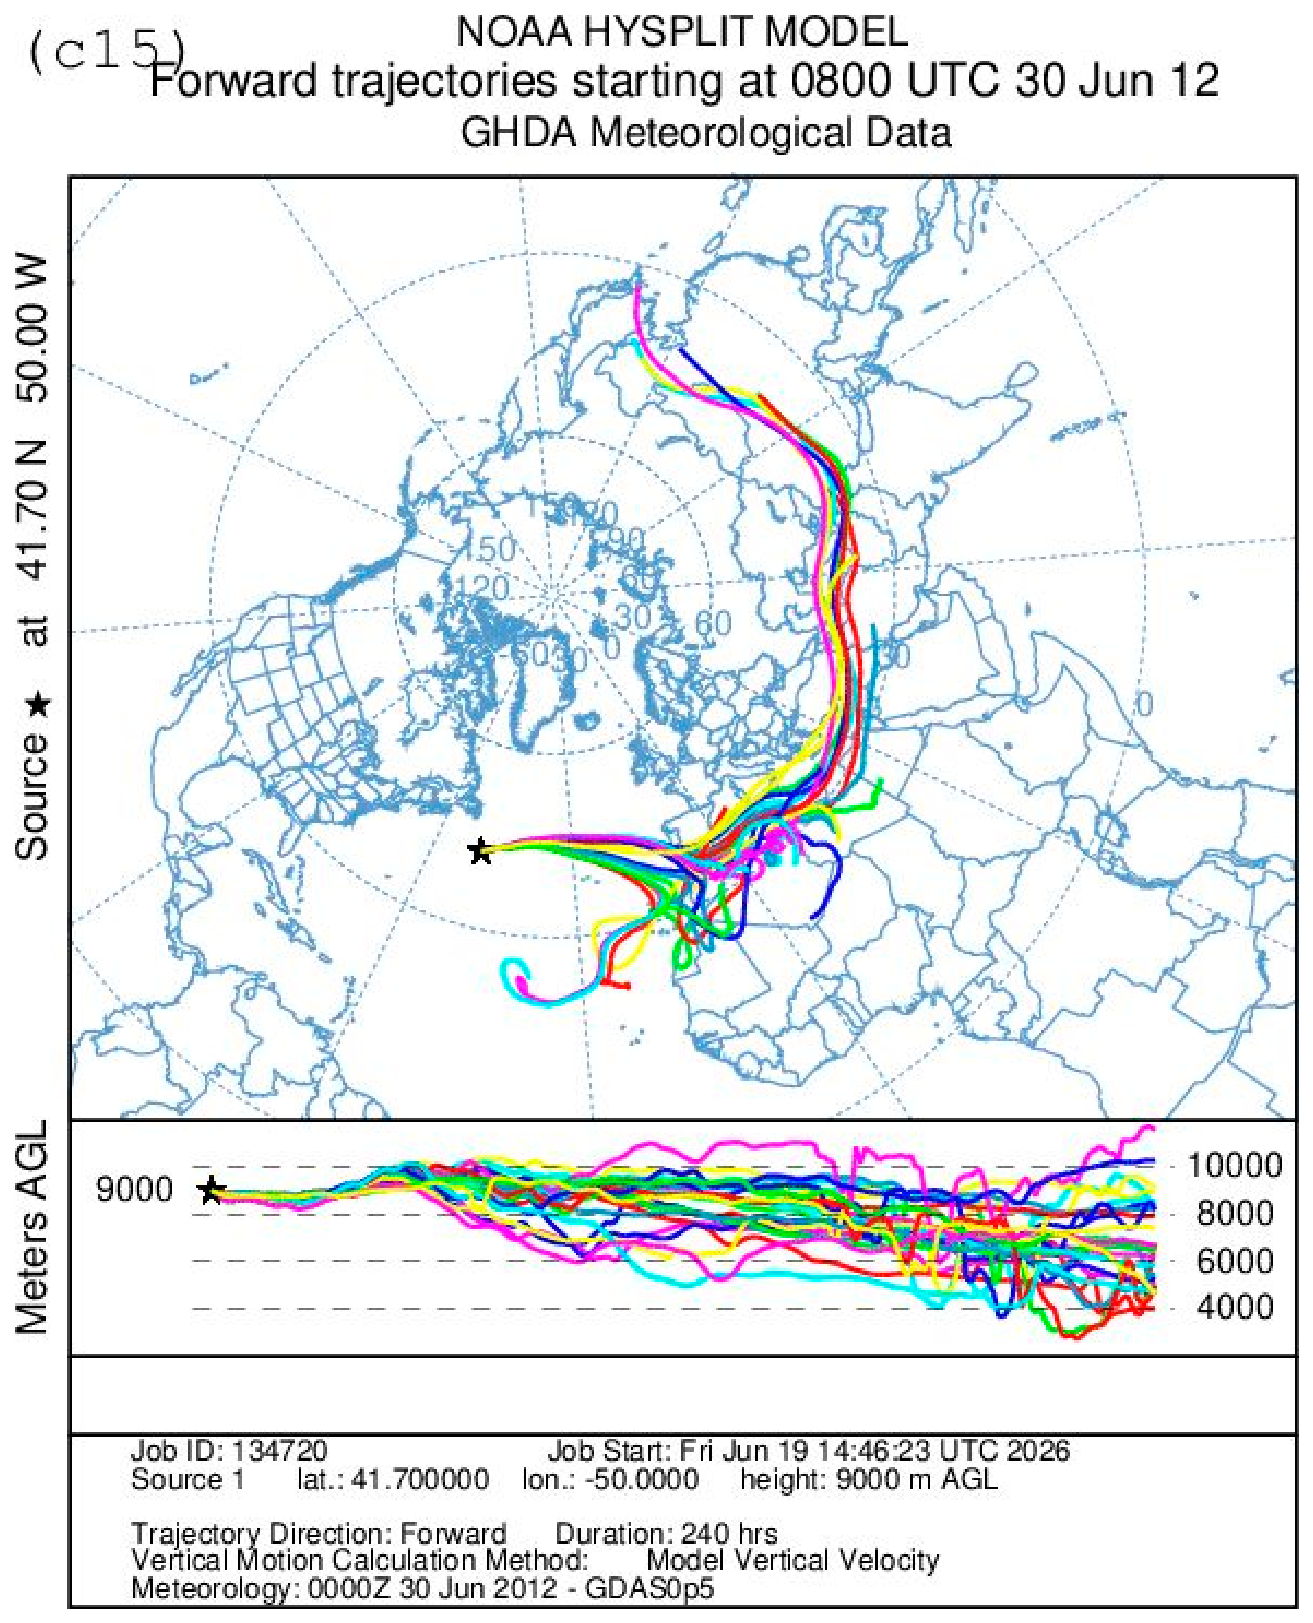
The potential for extreme precipitation in mid-latitudes resulting from the transport of moist tropical air masses from an Atlantic hurricane zone has previously been discussed (see, e.g., [58,59,60]). The transport of moist air masses from the North Atlantic to Europe is carried out primarily by extra-tropical cyclones lifting and directing huge volumes of water vapor via atmospheric rivers, warm conveyor belts, low-level jets, as well as air–sea surface fluxes and evaporation (e.g., [61,62,63,64] and references herein). Upper tropospheric moistening by tropical cyclones and, especially, hurricanes may also play a significant role. In this analysis (as in [58,59]), we do not attempt to elucidate the precise physical mechanisms (for details see, e.g., [64,65] and references herein) that ensured the transport of moist air of tropical origin to mid-latitudes but limit the analysis by computation of air-mass trajectories. The trajectory calculations were performed for three different air masses, initially located at altitudes of 1500, 5000, and 9000 m. To address the role of the air masses originating from the area with the Tropical Storm Debby during the end of June to the first week of July 2012 in Europe, forward air-mass trajectories have been calculated for 240 h with the help of the HYSPLIT-4.9 Hybrid Single-Particle Lagrangian Integrated Trajectory Model (http://www.arl.noaa.gov (accessed on 29 September 2026); [66]). Gridded 0.5° resolution data from the National Center for Environmental Prediction (NCEP) Global Data Assimilation System (GDAS) (Global Data Assimilation System)—derived every three hours from the native Global Forecast System (GFS) hybrid sigma-coordinate system—were used as the input for the calculations. To reduce uncertainties associated with trajectory calculations based on data of limited spatial resolution and accuracy, HYSPLIT was run in ensemble mode to generate a set of trajectories from a single meteorological field [66]. Each ensemble member is calculated from the same geographical location, but during the initial computation, the meteorological grid is shifted by ±1 grid step horizontally (x, y) and by ±0.005 steps vertically. This results in 27 ensemble members, each assumed to have equal probability. All these calculations were made starting at 08:00 UTC each day between 16 June and 30 June, at the geographic locations 16.06 (25.00° N; 70.00° W); 17.06 (19.50° N; 74.16° W); 18.06 (19.50° N; 74.15° W); 19.06 (20.98° N; 89.62° W); 20.06 (21.50° N; 82.50° W); 21.06 (19.50° N; 82.50° W); 22.06 (21.50° N; 82.50° W); 23.06 (19.00° N; 82.00° W); 24.06 (19.00° N; 82.00° W); 25.06 (30.50° N; 87.30° W); 26.06 (29.70° N; 83.40° N); 27.06 (29.65° N; 82.30° W); 28.06 (32.30° N; 65.00° W); 29.06 (36.00° N; 58.15° W); and 30.06 (41.70° N; 50.00° W) where Debby (or the pre- or post-Debby cyclone) was observed according to [53]. The results are presented in Figure 8, [(1) 16.06; (2) 17.06; (3) 18.06; (4) 19.06; (5) 20.06; (6) 21.06; (7) 22.06; (8) 23.06; (9) 24.06; (10) 25.06; (11) 26.06; (12) 27.06; (13) 28.06; (14) 29.06; (15) 30.06].
Figure 8.
Ensemble forward trajectories calculated for 240 h with the HYSPLIT-4.9 Hybrid Single-Particle Lagrangian Integrated Trajectory Model using 0.5° resolution National Center for Environmental Prediction (NCEP) Global Data Assimilation System (GDAS) data all starting at 08:00 UTC from corresponding geographic locations of Tropical Storm Debby in 2012—(a1,b1,c1) 16.06; (a2,b2,c2) 17.06; (a3,b3,c3) 18.06; (a4,b4,c4) 19.06; (a5,b5,c5) 20.06; (a6,b6,c6) 21.06; (a7,b7,c7) 22.06; (a8,b8,c8) 23.06; (a9,b9,c9) 24.06; (a10,b10,c10) 25.06; (a11,b11,c11) 26.06; (a12,b12,c12) 27.06; (a13,b13,c13) 28.06; (a14,b14,c14) 29.06; (a15,b15,c15) 30.06. Left panel (a)—height of the starting points at 1500 m above ground level (AGL); (b) central panel at 5000 m AGL; right panel (c) at 9000 m AGL.
Where the left panel (a1–a15) shows the trajectories of the air masses at the initial moment of time, located at an altitude of 1500 m above ground level (AGL), while the central panel (b1–b15) is at an altitude of 5000 m AGL, and the right panel (c1–c15) is at an altitude of 9000 m AGL. As can be seen from Figure 8a, moist air masses that formed in the region where Debby was already developing reached Europe before 28 June. Air masses that were in this region on 16 June (Figure 8a1–c1)moved toward Europe in the lower, middle, and upper troposphere and, therefore, could have been the main cause of intense synoptic processes in northern Europe on 28 June 2012 [46]. The transport of air masses into Europe (confined to the mid-troposphere) continued into the following day, 17 June (Figure 8a2–c2); however, it subsequently ceased and did not resume until 23 June (Figure 8a8–c8)—by which time Storm Debby had fully formed. Between 23 June and 27 June (Figure 8a12–c12), air masses were transported from the vicinity of Storm Debby into Europe, while from 28 June (Figure 8a13–c13) onwards, long-range transport was observed in the upper troposphere—extending from the Storm Debby region toward central Asia and possibly further, reaching as far as Japan and China. The results of the trajectory analysis presented in Figure 8 suggest that the intense rainfall that occurred in Ireland on 28 June could be a consequence of the powerful outburst of air masses from the Debby pre-storm region that occurred between 16 and 17 June. As can be seen in the right panel of Figure 8c1, the air transport that occurred during this stage of the upper tropospheric synoptic process could have delivered significant volumes of moist air much further east. According to the results presented in the figures showing the directions of air traffic from the area of Tropical Storm Debby that began on 24, 25 and 27, 28 June (Figure 8.9–8.10; 8.12–8.13), the synoptic developments and the processes of formation of unprecedented rainfall intensity, discussed in the already referenced studies [31,32,44,46,47,48,49], in England, Scandinavia and the northern Black Sea coast on 6 and 7 June also appear to be a result of an impact of Tropical Storm Debby on Europe associated with the transport of high amounts of moist air masses of tropical and oceanic origin in some cases into the continental areas, leading to the formation of conditions similar to those in the atmospheric rivers e.g., [63].
The timings of the events, with torrential rains and catastrophic floods on 13–15 June 2012 in the Netherlands, the unprecedented storm in England on 28 June, torrential rains and devastating floods on 5–7 July in various districts of the United Kingdom, the Netherlands, Sweden and Estonia, as well as the disastrous floods on 6–7 July (among them disastrous floods in the town of Krymsk) in the northern Black Sea coastal area of Russia, are fully consistent with the presented in the analysis results of trajectory computations. This indicates that it is highly possible that all these catastrophic events mentioned above have resulted from the fact that during the period, the European continent was both directly and indirectly hit by the North Atlantic remnants of Chris and Debby. Results of trajectory computation show that the impact could not be limited to the transport of moist air masses by atmospheric rivers and warm conveyor belts in the cyclones but also associated with intense direct long-range air-mass transport [61,63,67,68].
6. Additional Evaluations
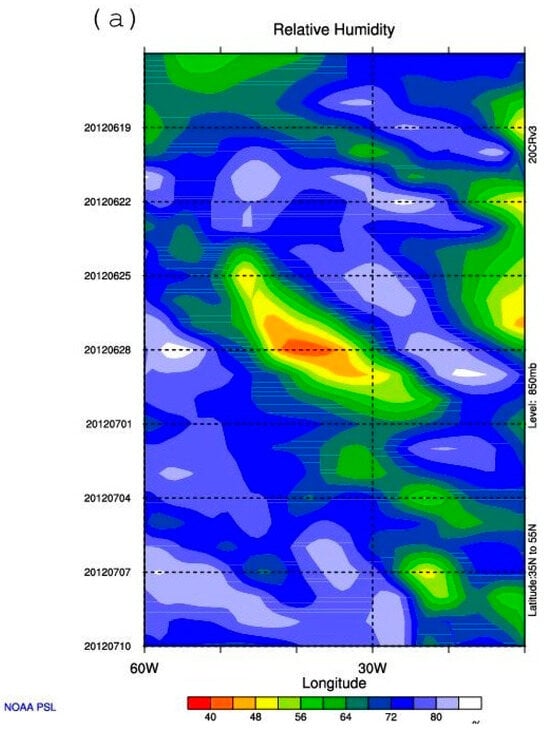
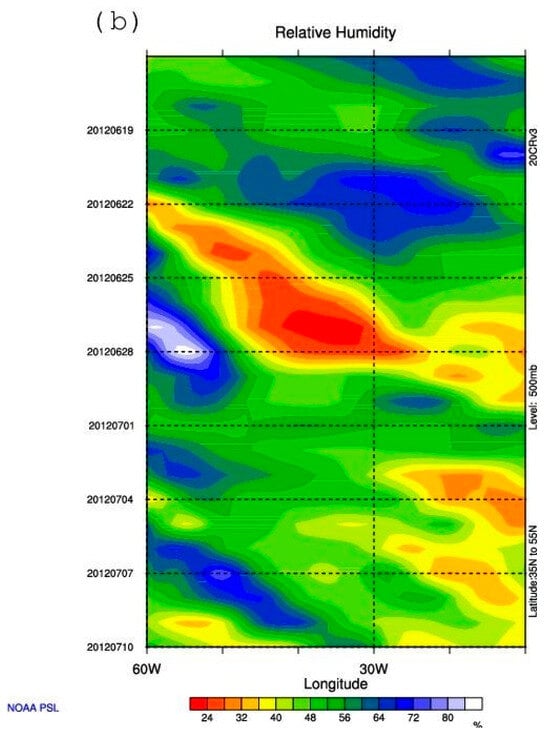
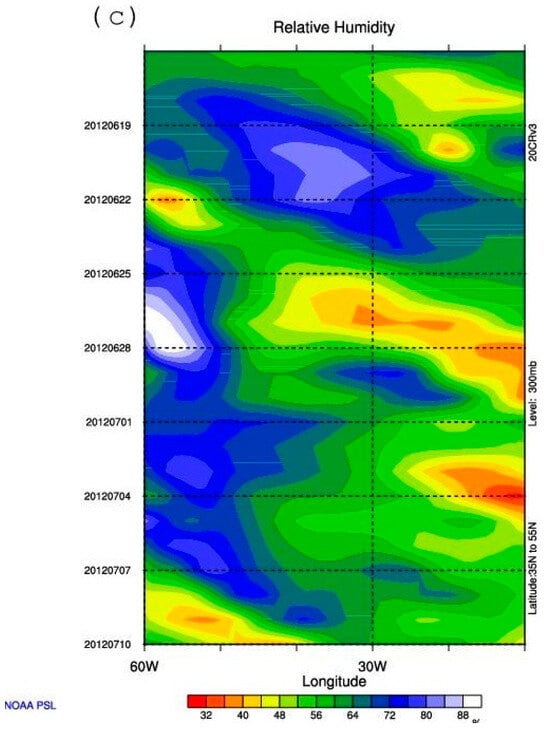
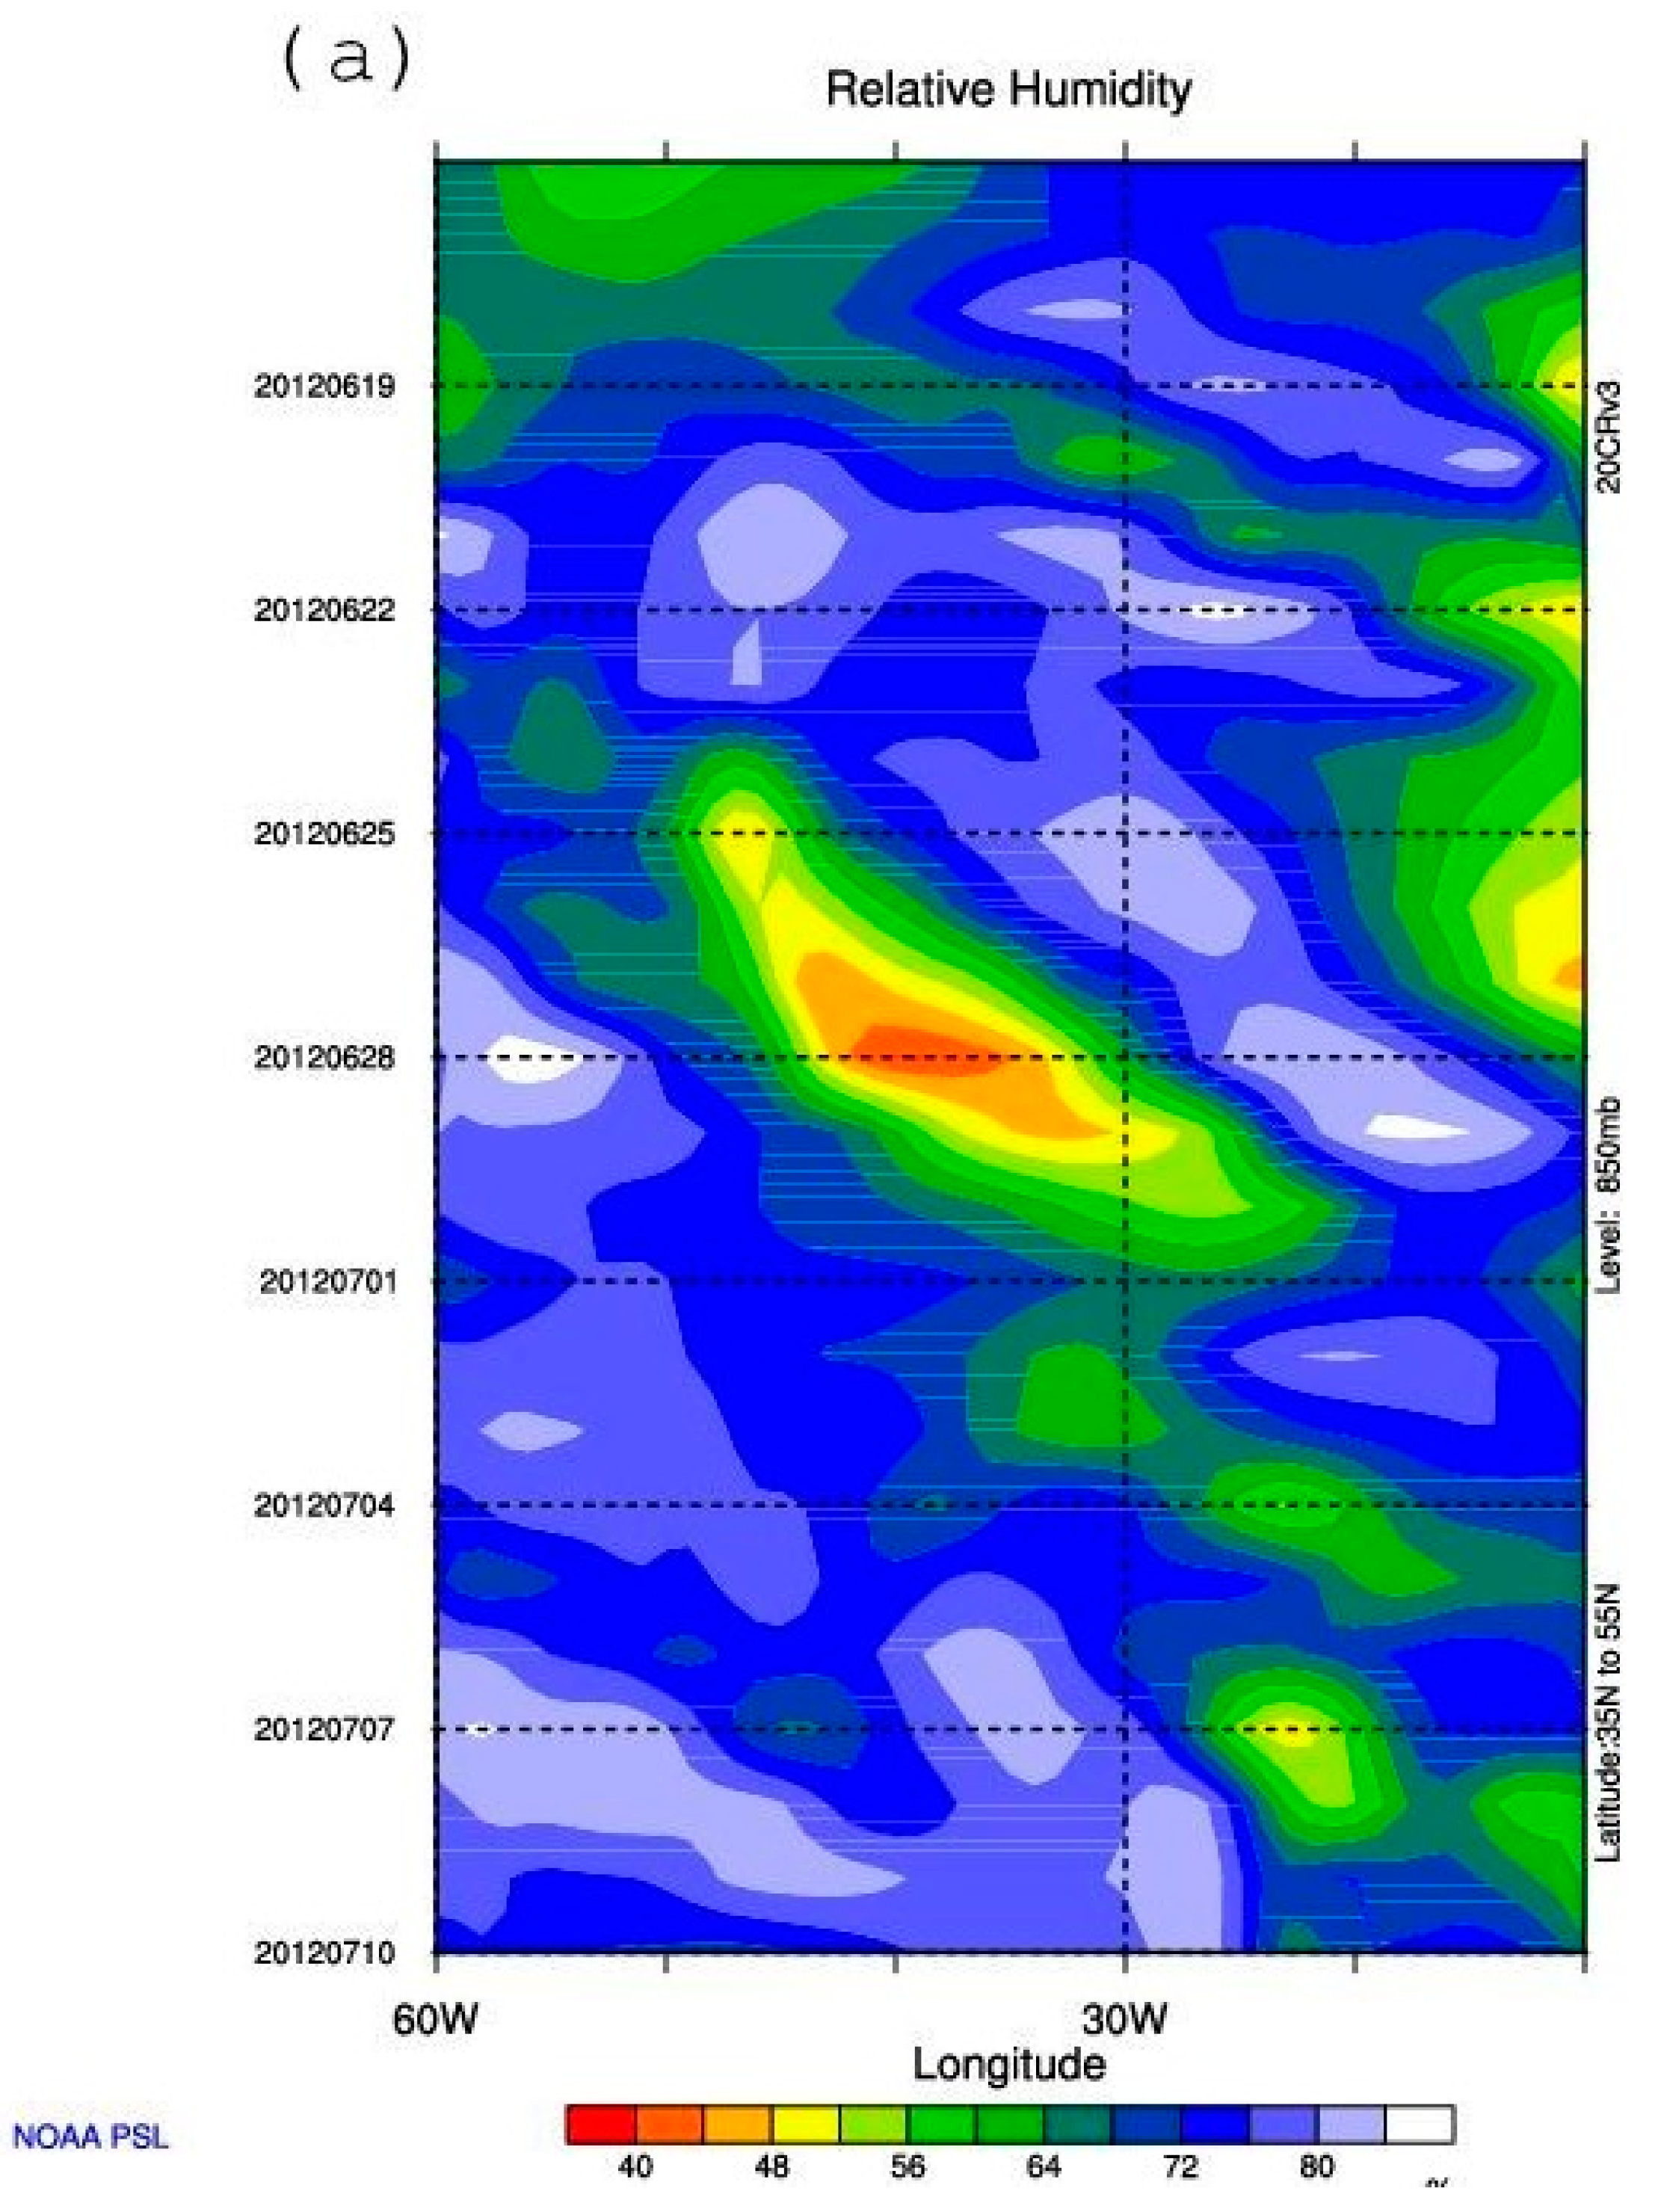
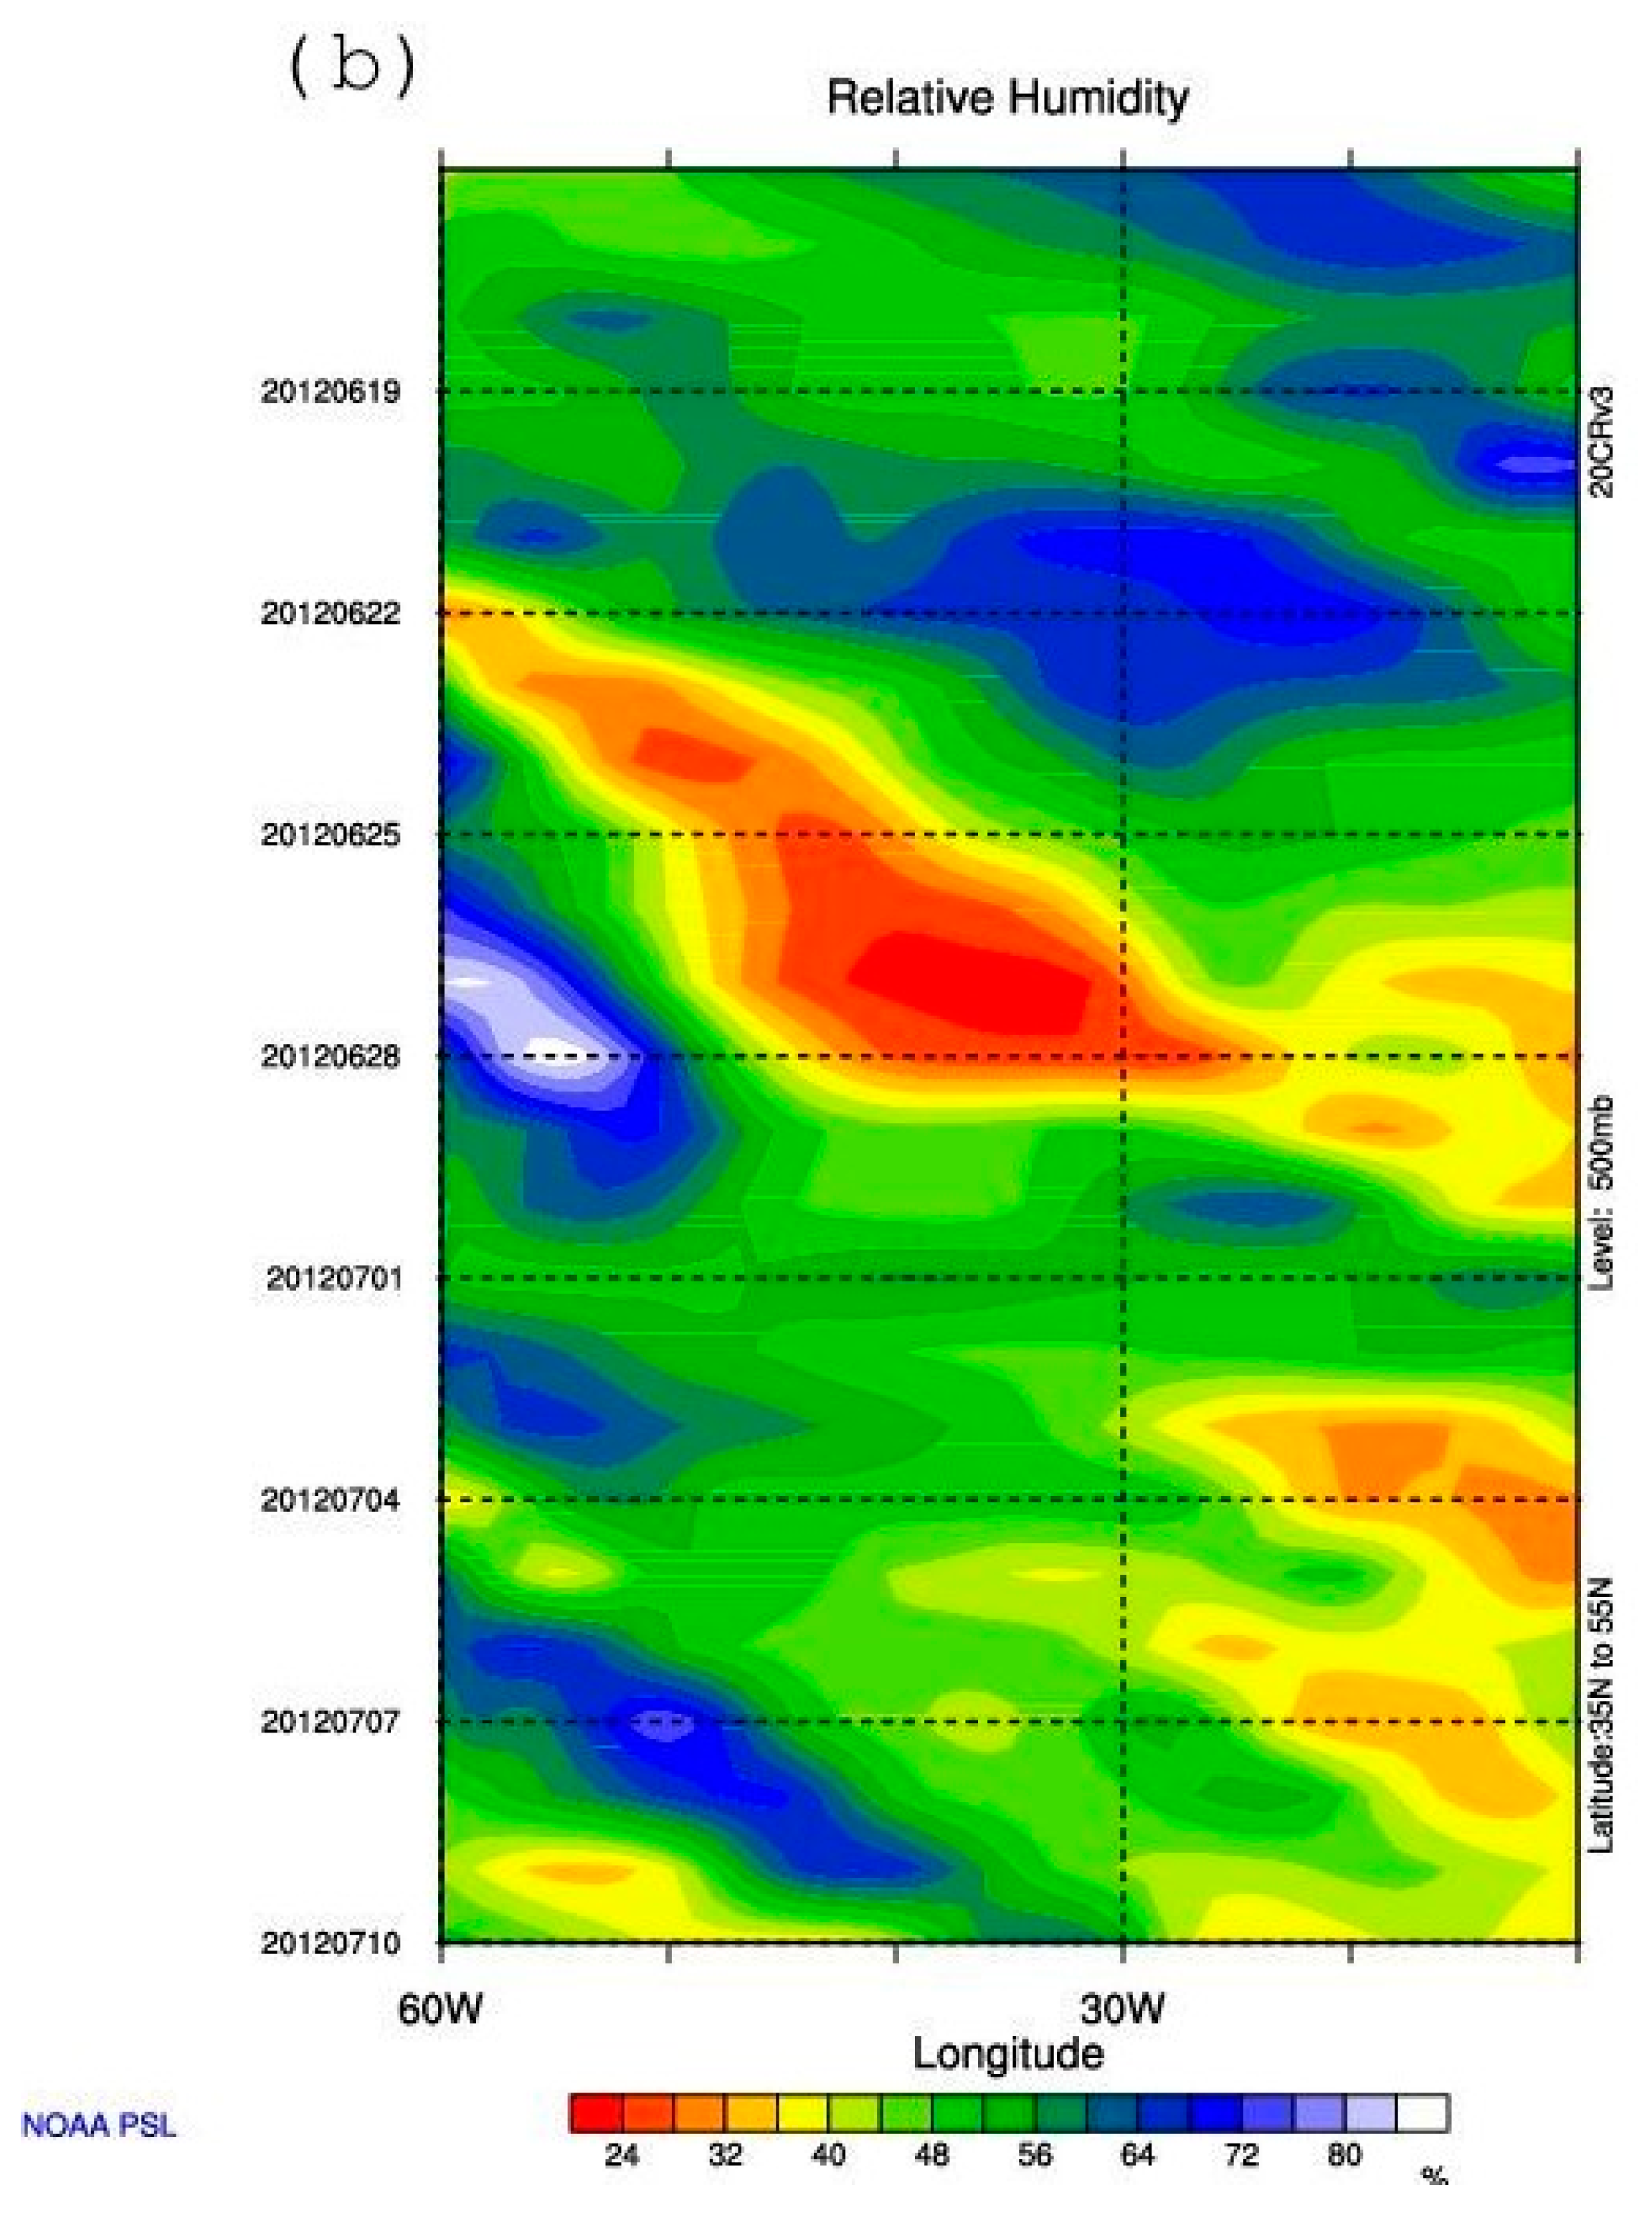
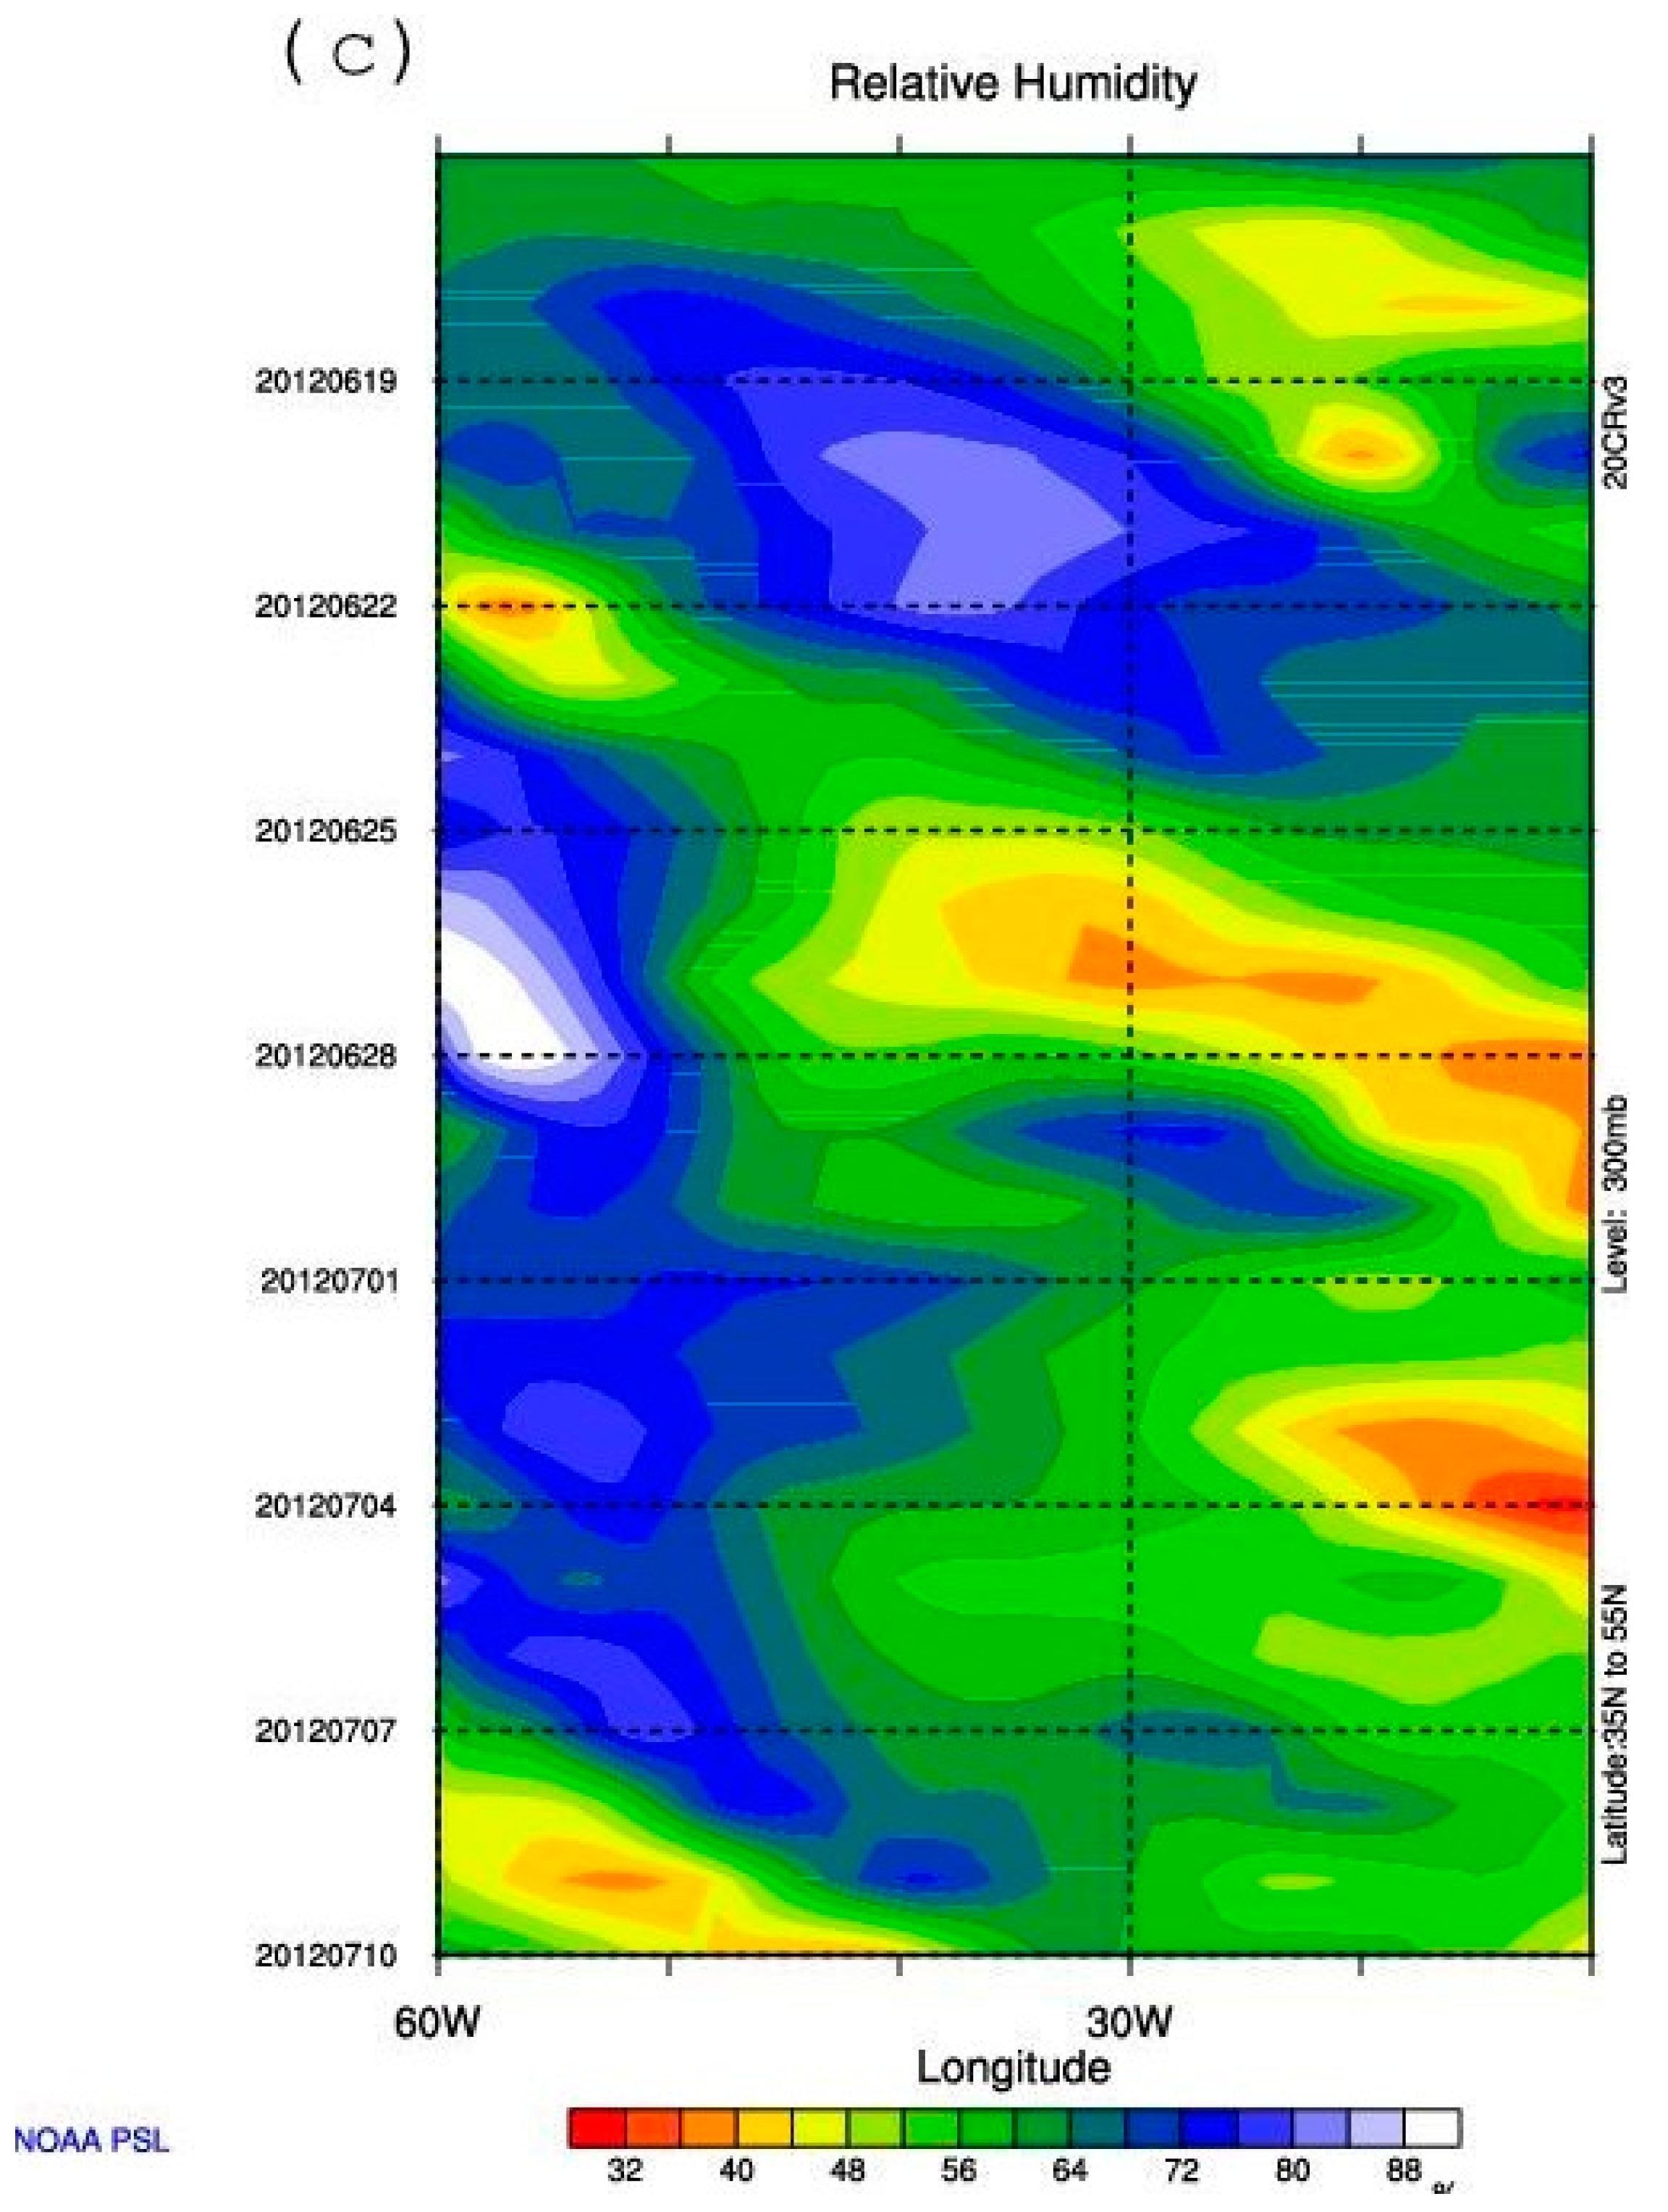
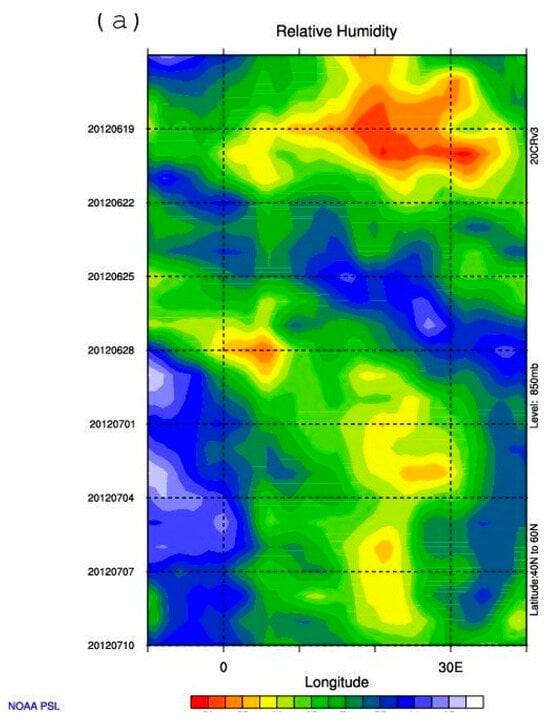
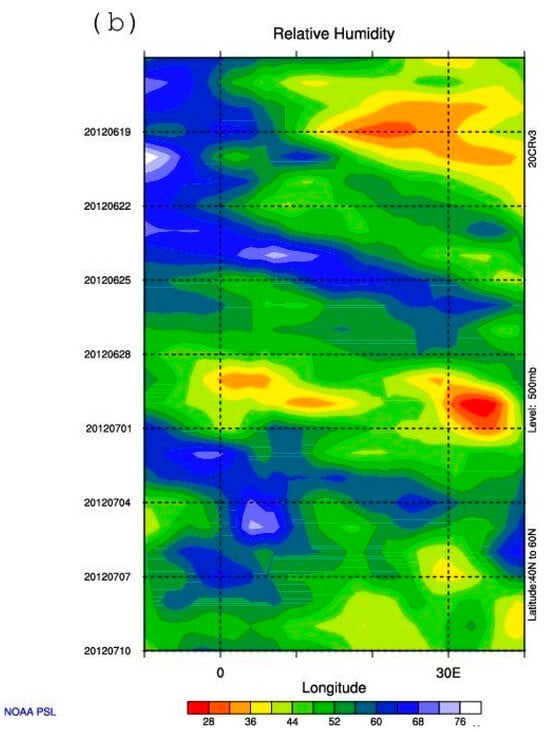
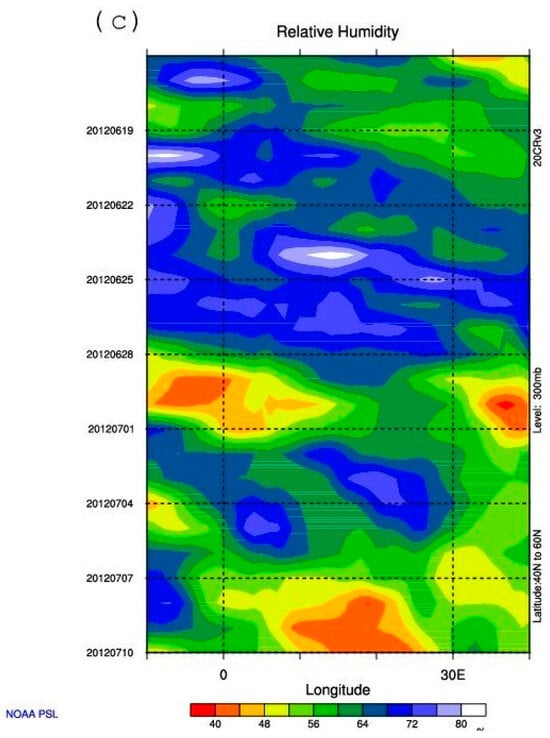
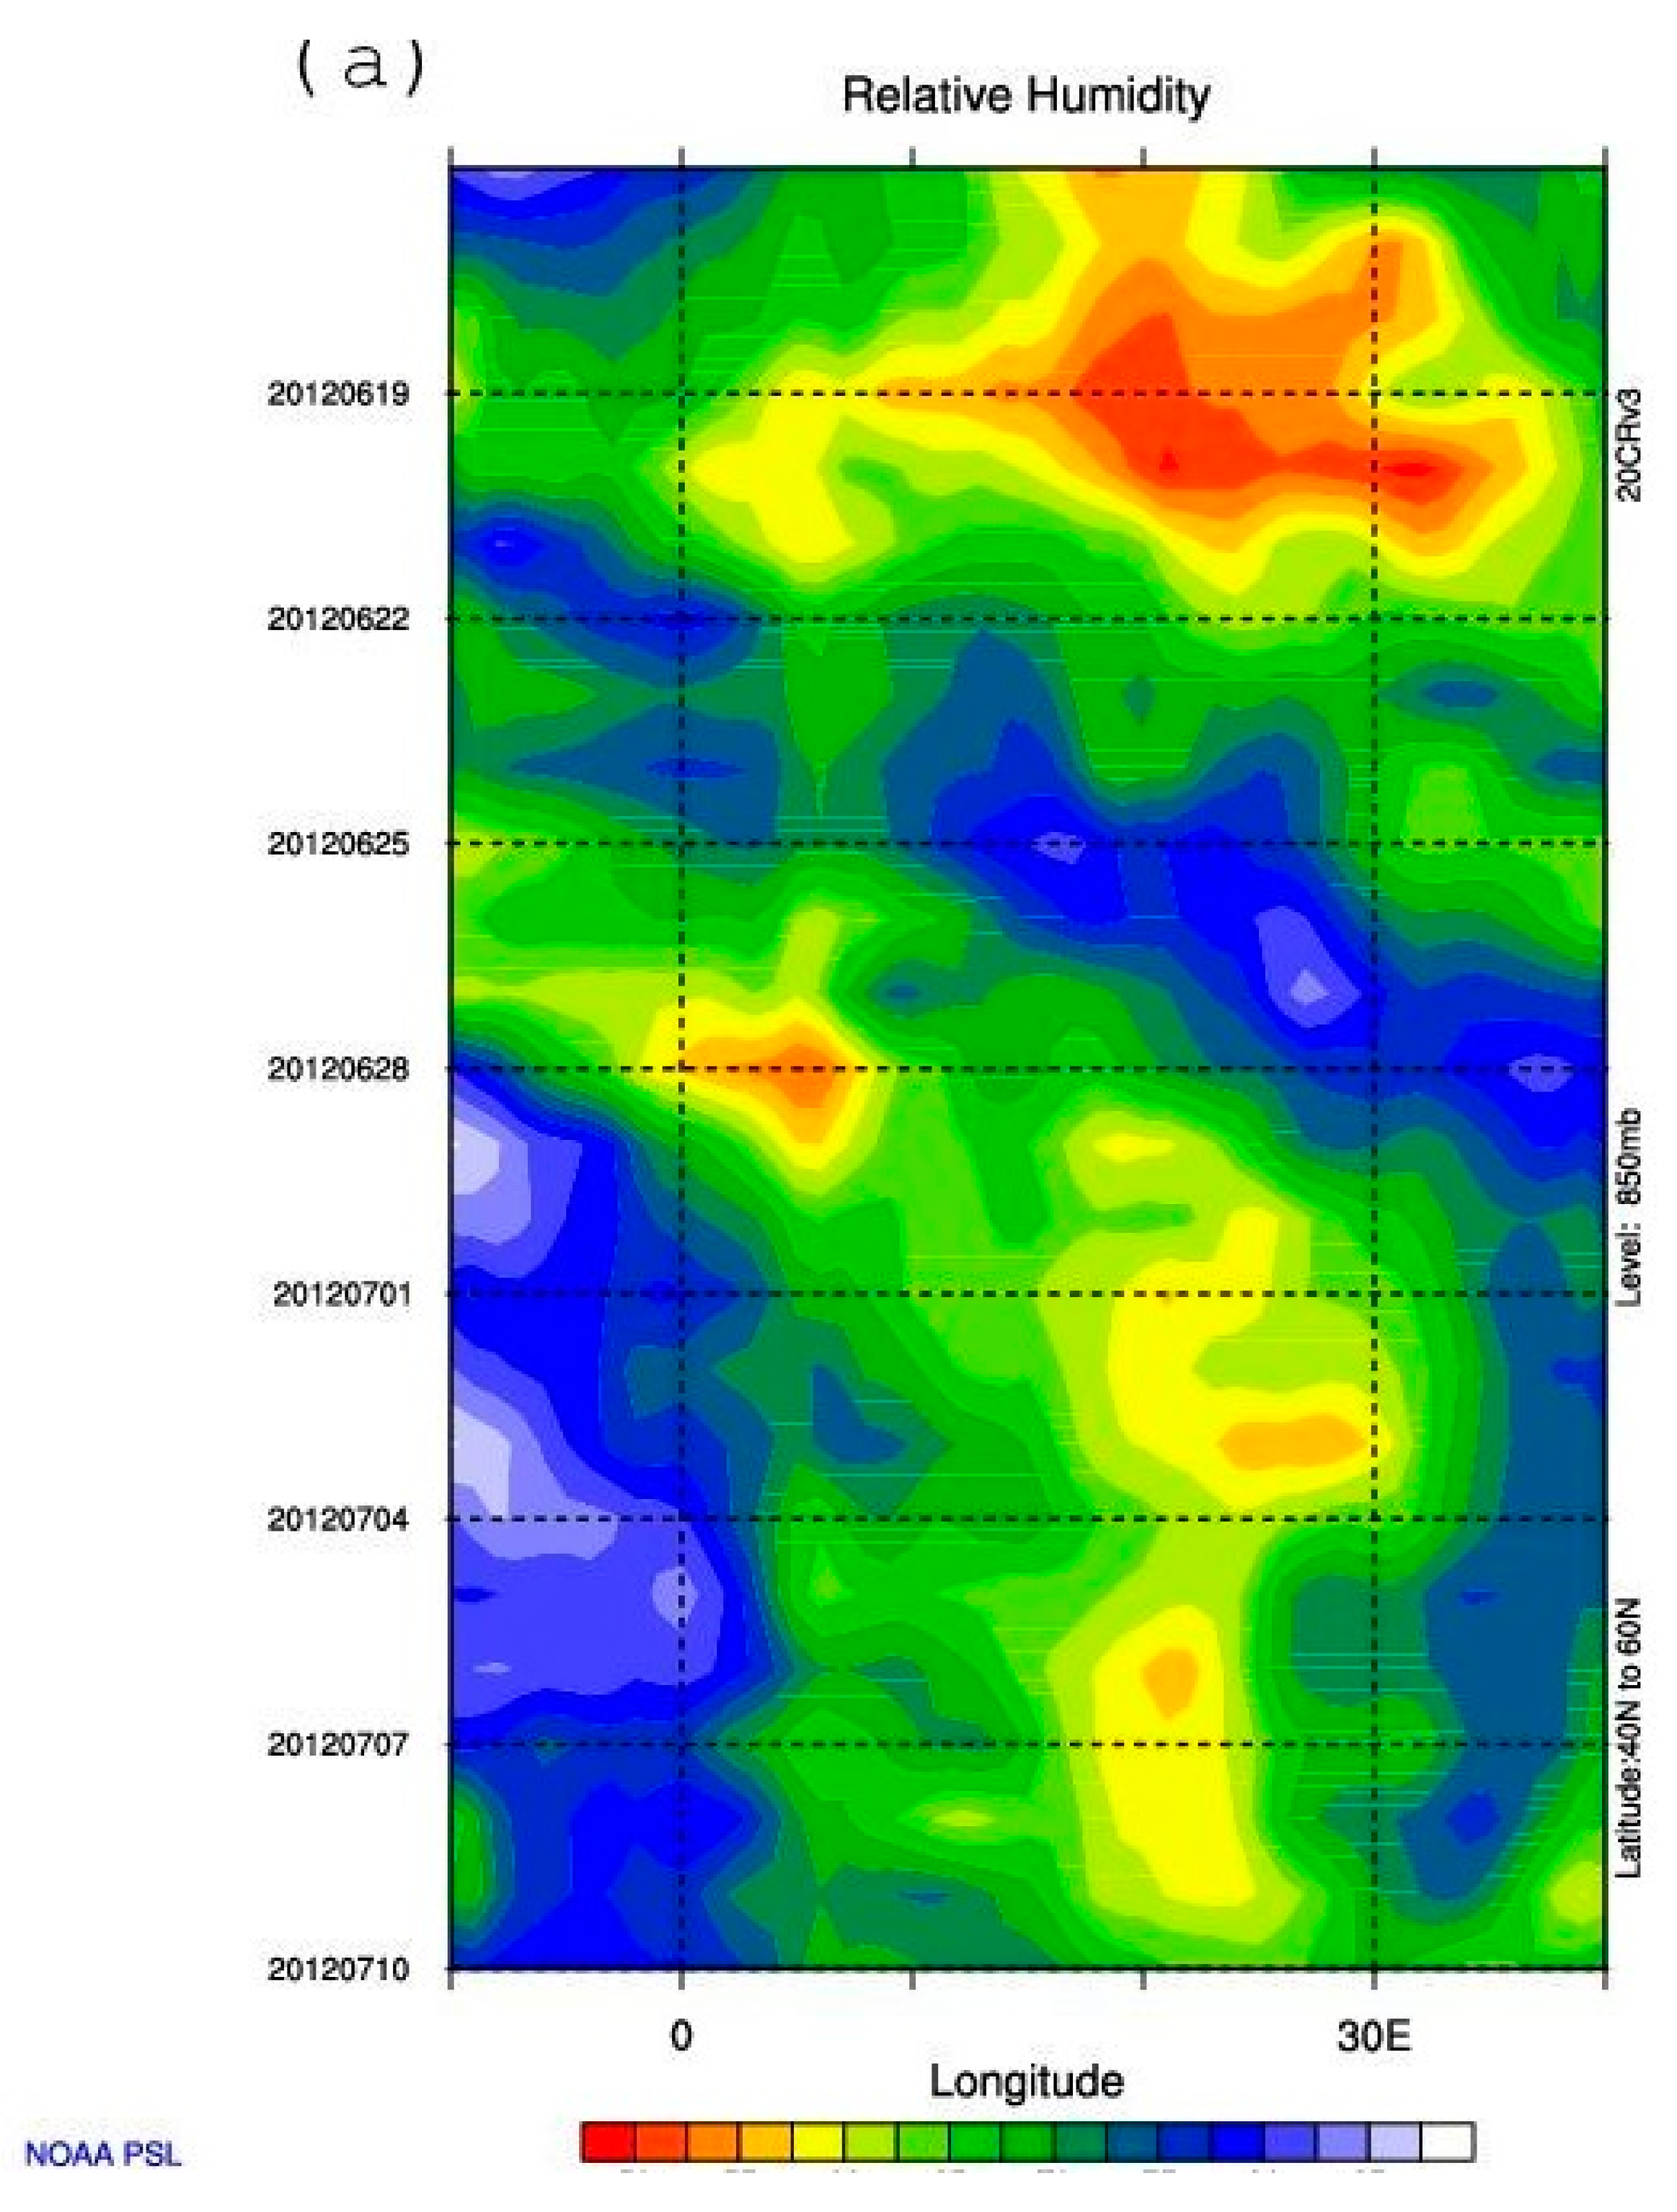
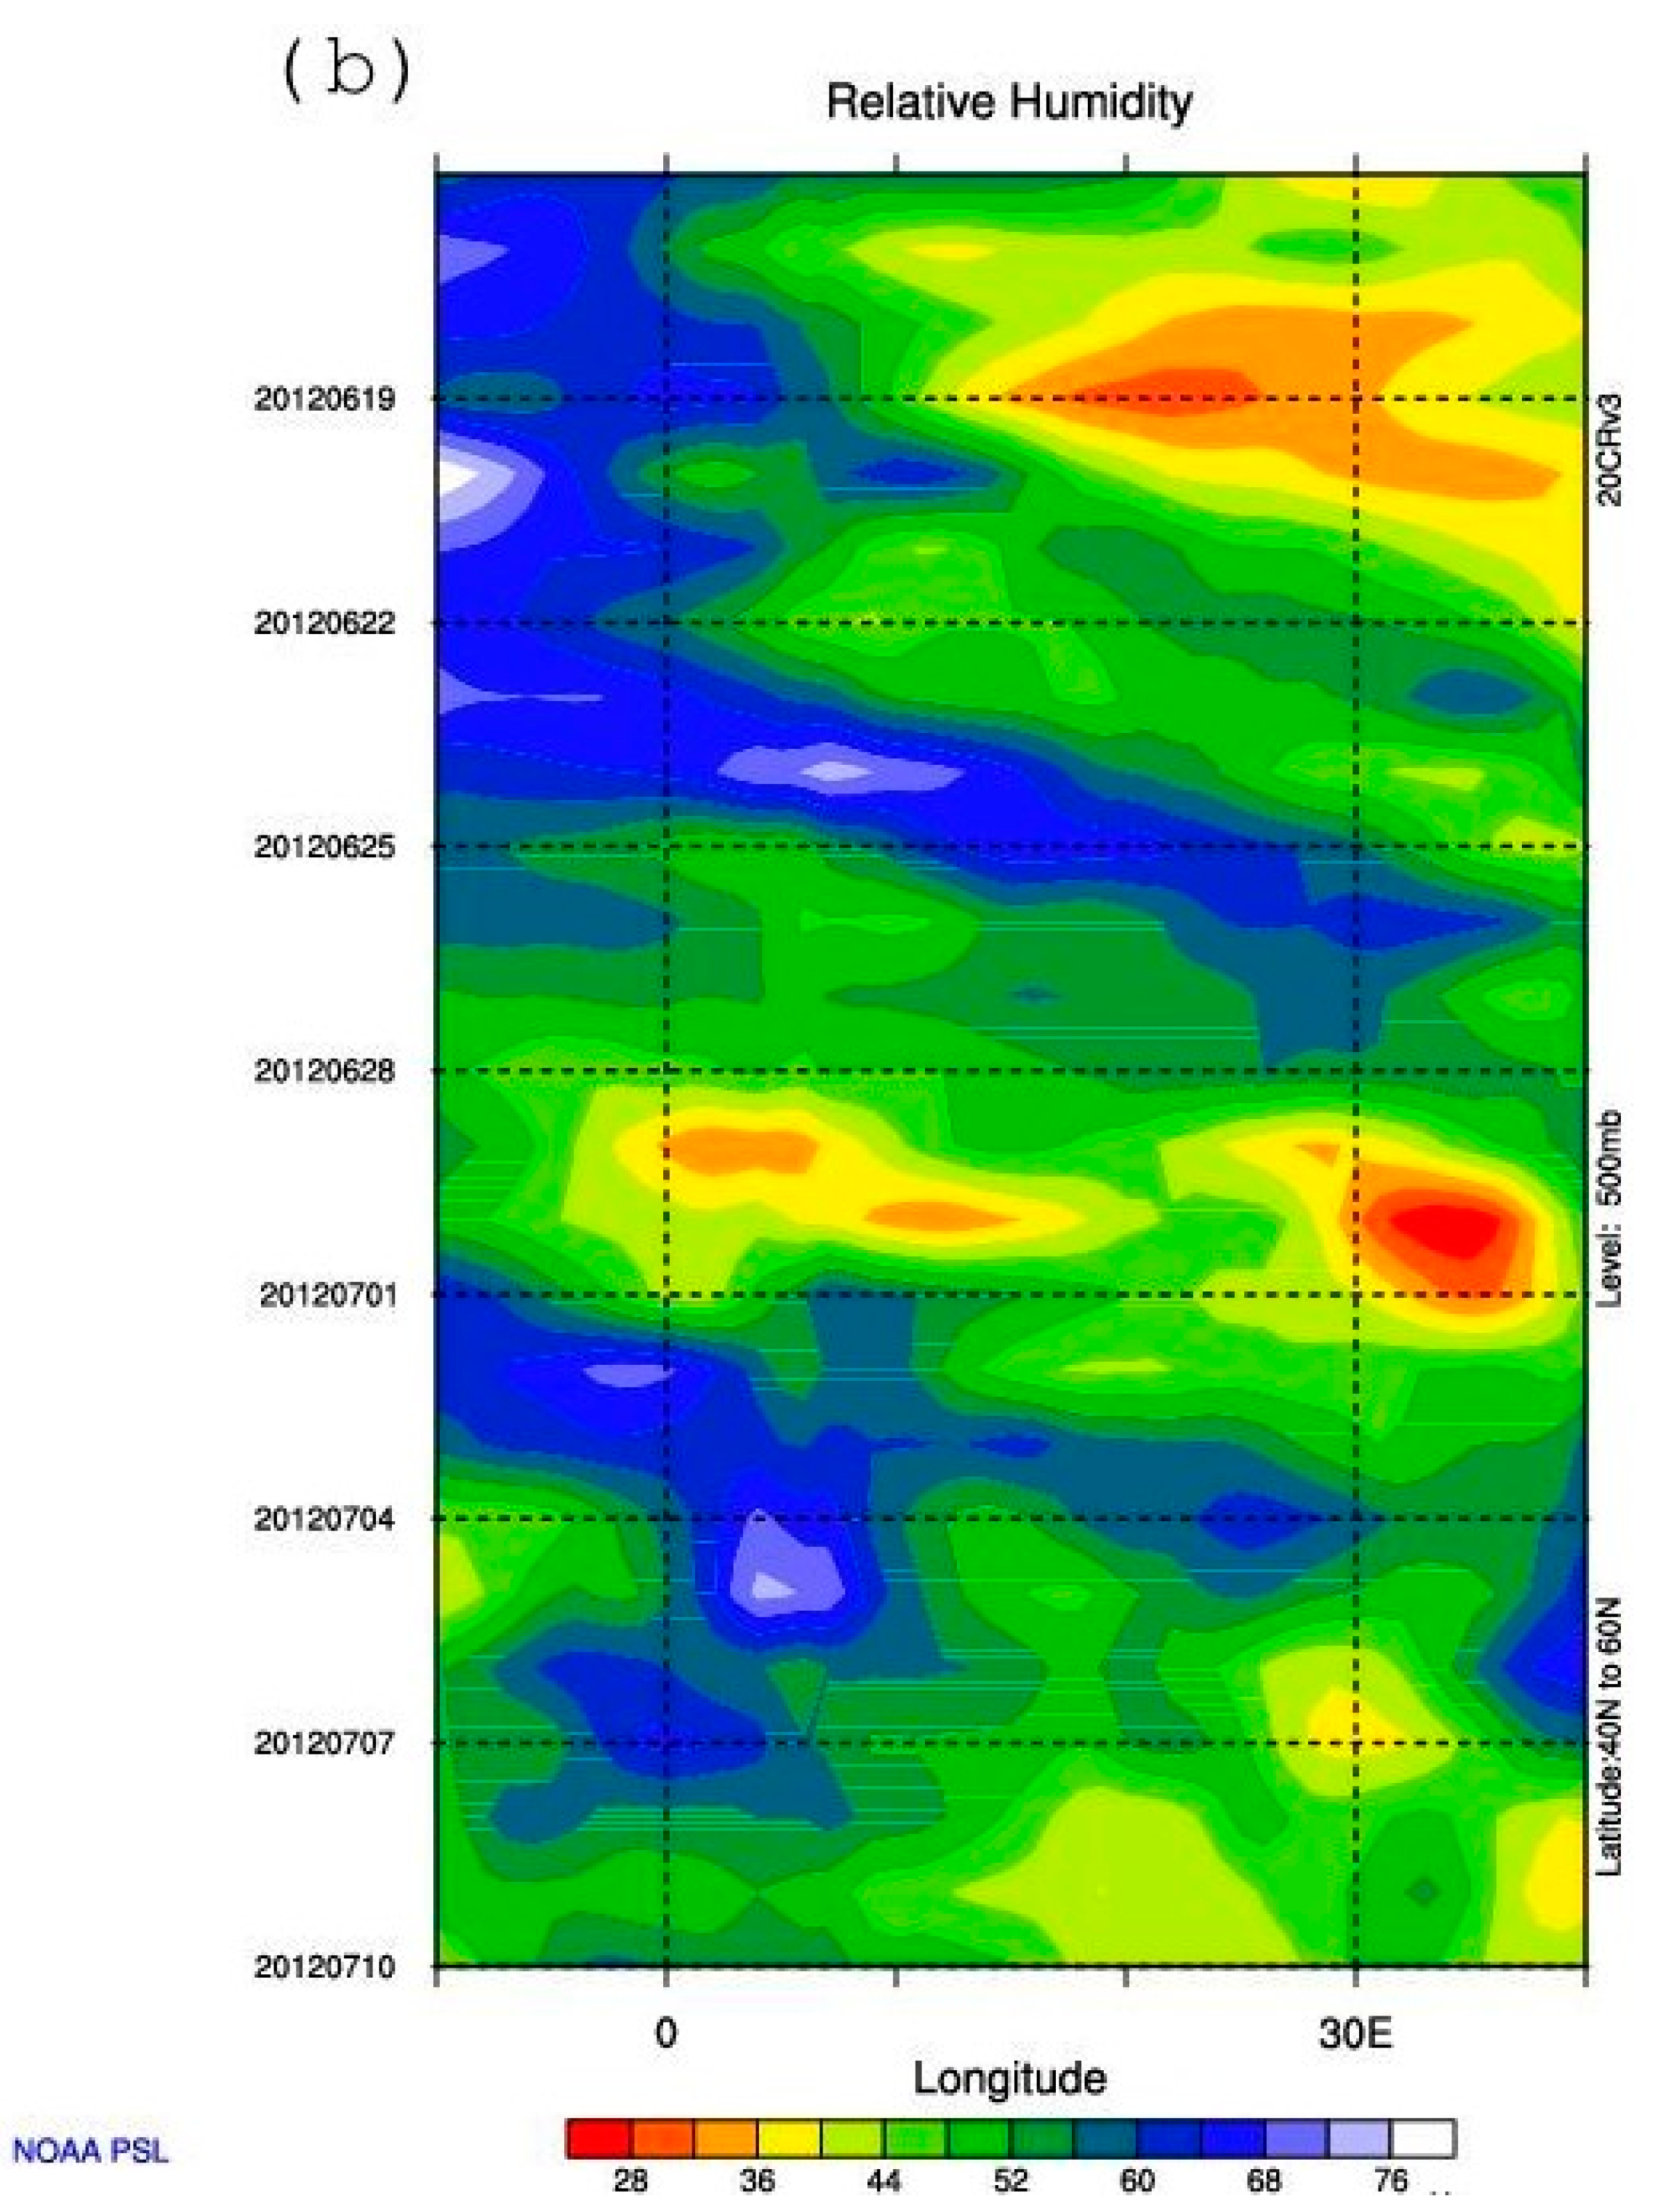
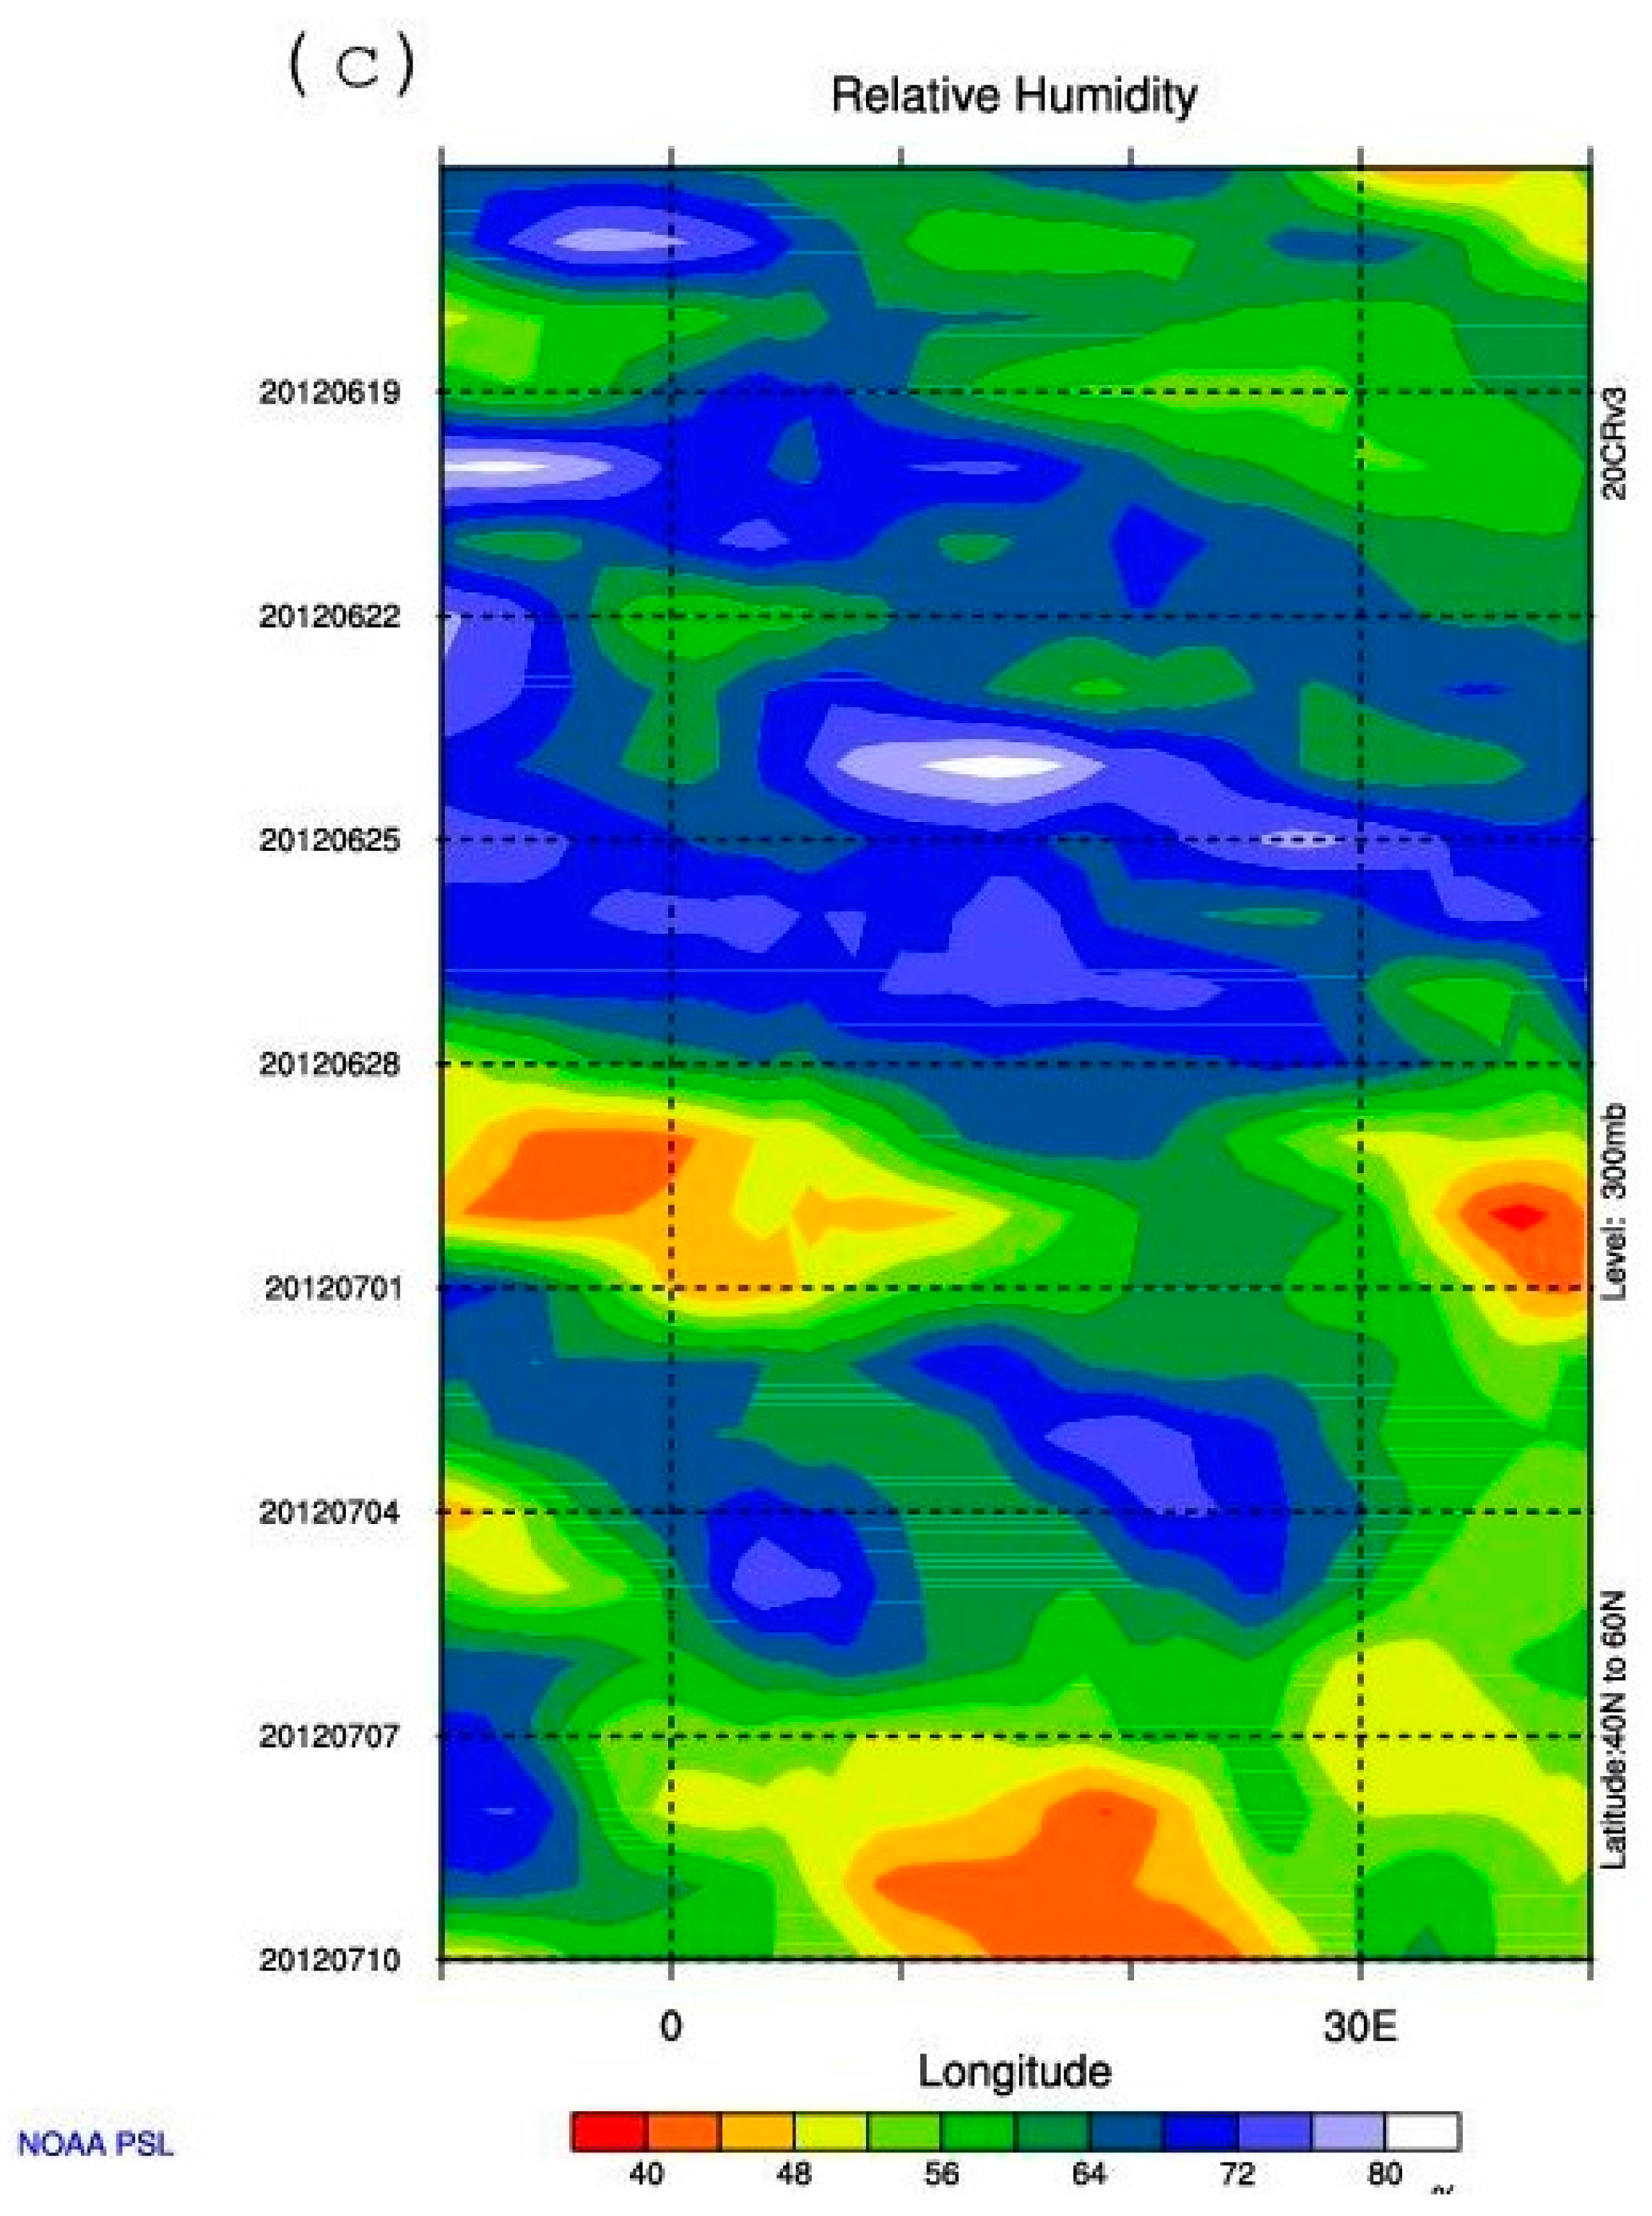
Hovmöller diagrams [38] were also constructed in time–longitude coordinates for relative humidity (RH) at the 850, 500, and 300 hPa isobaric levels over a 24-day period (from 16 June to 10 July 2012) for two sectors: the North Atlantic (60–10° W, 35–55° N) and Europe (10° W–40° E, up to 60° N), the boundaries of which are shown as quadrilaterals in Figure 1b. These diagrams (presented for sectors A and B in Figure 9a–c and Figure 10a–c, respectively) provide additional information on the synoptic process. In the Atlantic sector (Figure 9a–c), the period from 16 to 20 June is characterized by a vertically coherent region of high humidity associated with pre-Debby and moving eastward; this region encompasses layers extending from the 850 hPa level (RH > 80%) through the 500 hPa level (56–64%) and up to 300 hPa (72–80%), demonstrating the transport of moist air masses along the air-parcel trajectories shown in all three panels of Figure 8a. During the remainder of the period under consideration, the diagrams show high RH values (latitude-averaged) in the lower troposphere (Figure 9a), as well as a marked increase in atmospheric moisture content in the middle and upper troposphere after approximately 25 June, i.e., during the period characterized by intense mid- and upper-tropospheric air-mass transport from the area with Debby and its remnants to Europe.
Figure 9.
Hovmöller diagrams of relative humidity (%) at (a) 850, (b) 500 and (c) 300hPa in the Atlantic (indicated as A in Figure 1b) for the latitudinal range 35–55 N in the 24 d period between 16 June and 10 July 2012 (shaded) [based on the NOAA CIRES DOE 20th century 20CRV3 reanalysis data].
Figure 10.
Hovmöller diagrams of relative humidity (%) at (a) 850, (b) 500 and (c) 300hPa in the Atlantic (indicated as B in Figure 1b) for the latitudinal range 40–60 N in the 24 d period between 16 June and 10 July 2012 (shaded) [based on the NOAA CIRES DOE 20th century 20CRV3 reanalysis data].
According to Figure 10a–c, moist air from the Atlantic sector (A) entered Europe via mid- and upper-tropospheric airflows in two waves (the first beginning around 26 June, and the second on 4 July). It can be suggested that the moist air from the first wave contributed to heavy rains over both northwestern Europe (around 28 June) and the Black Sea region (around 6 June), whereas the bulk of the air that reached the region with the second wave contributed to precipitation primarily over northwestern Europe around 6 June.
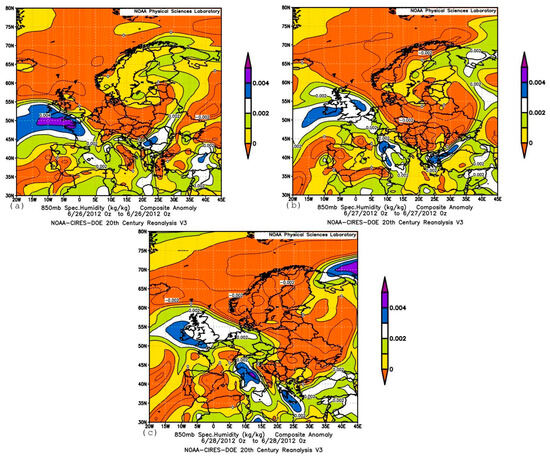
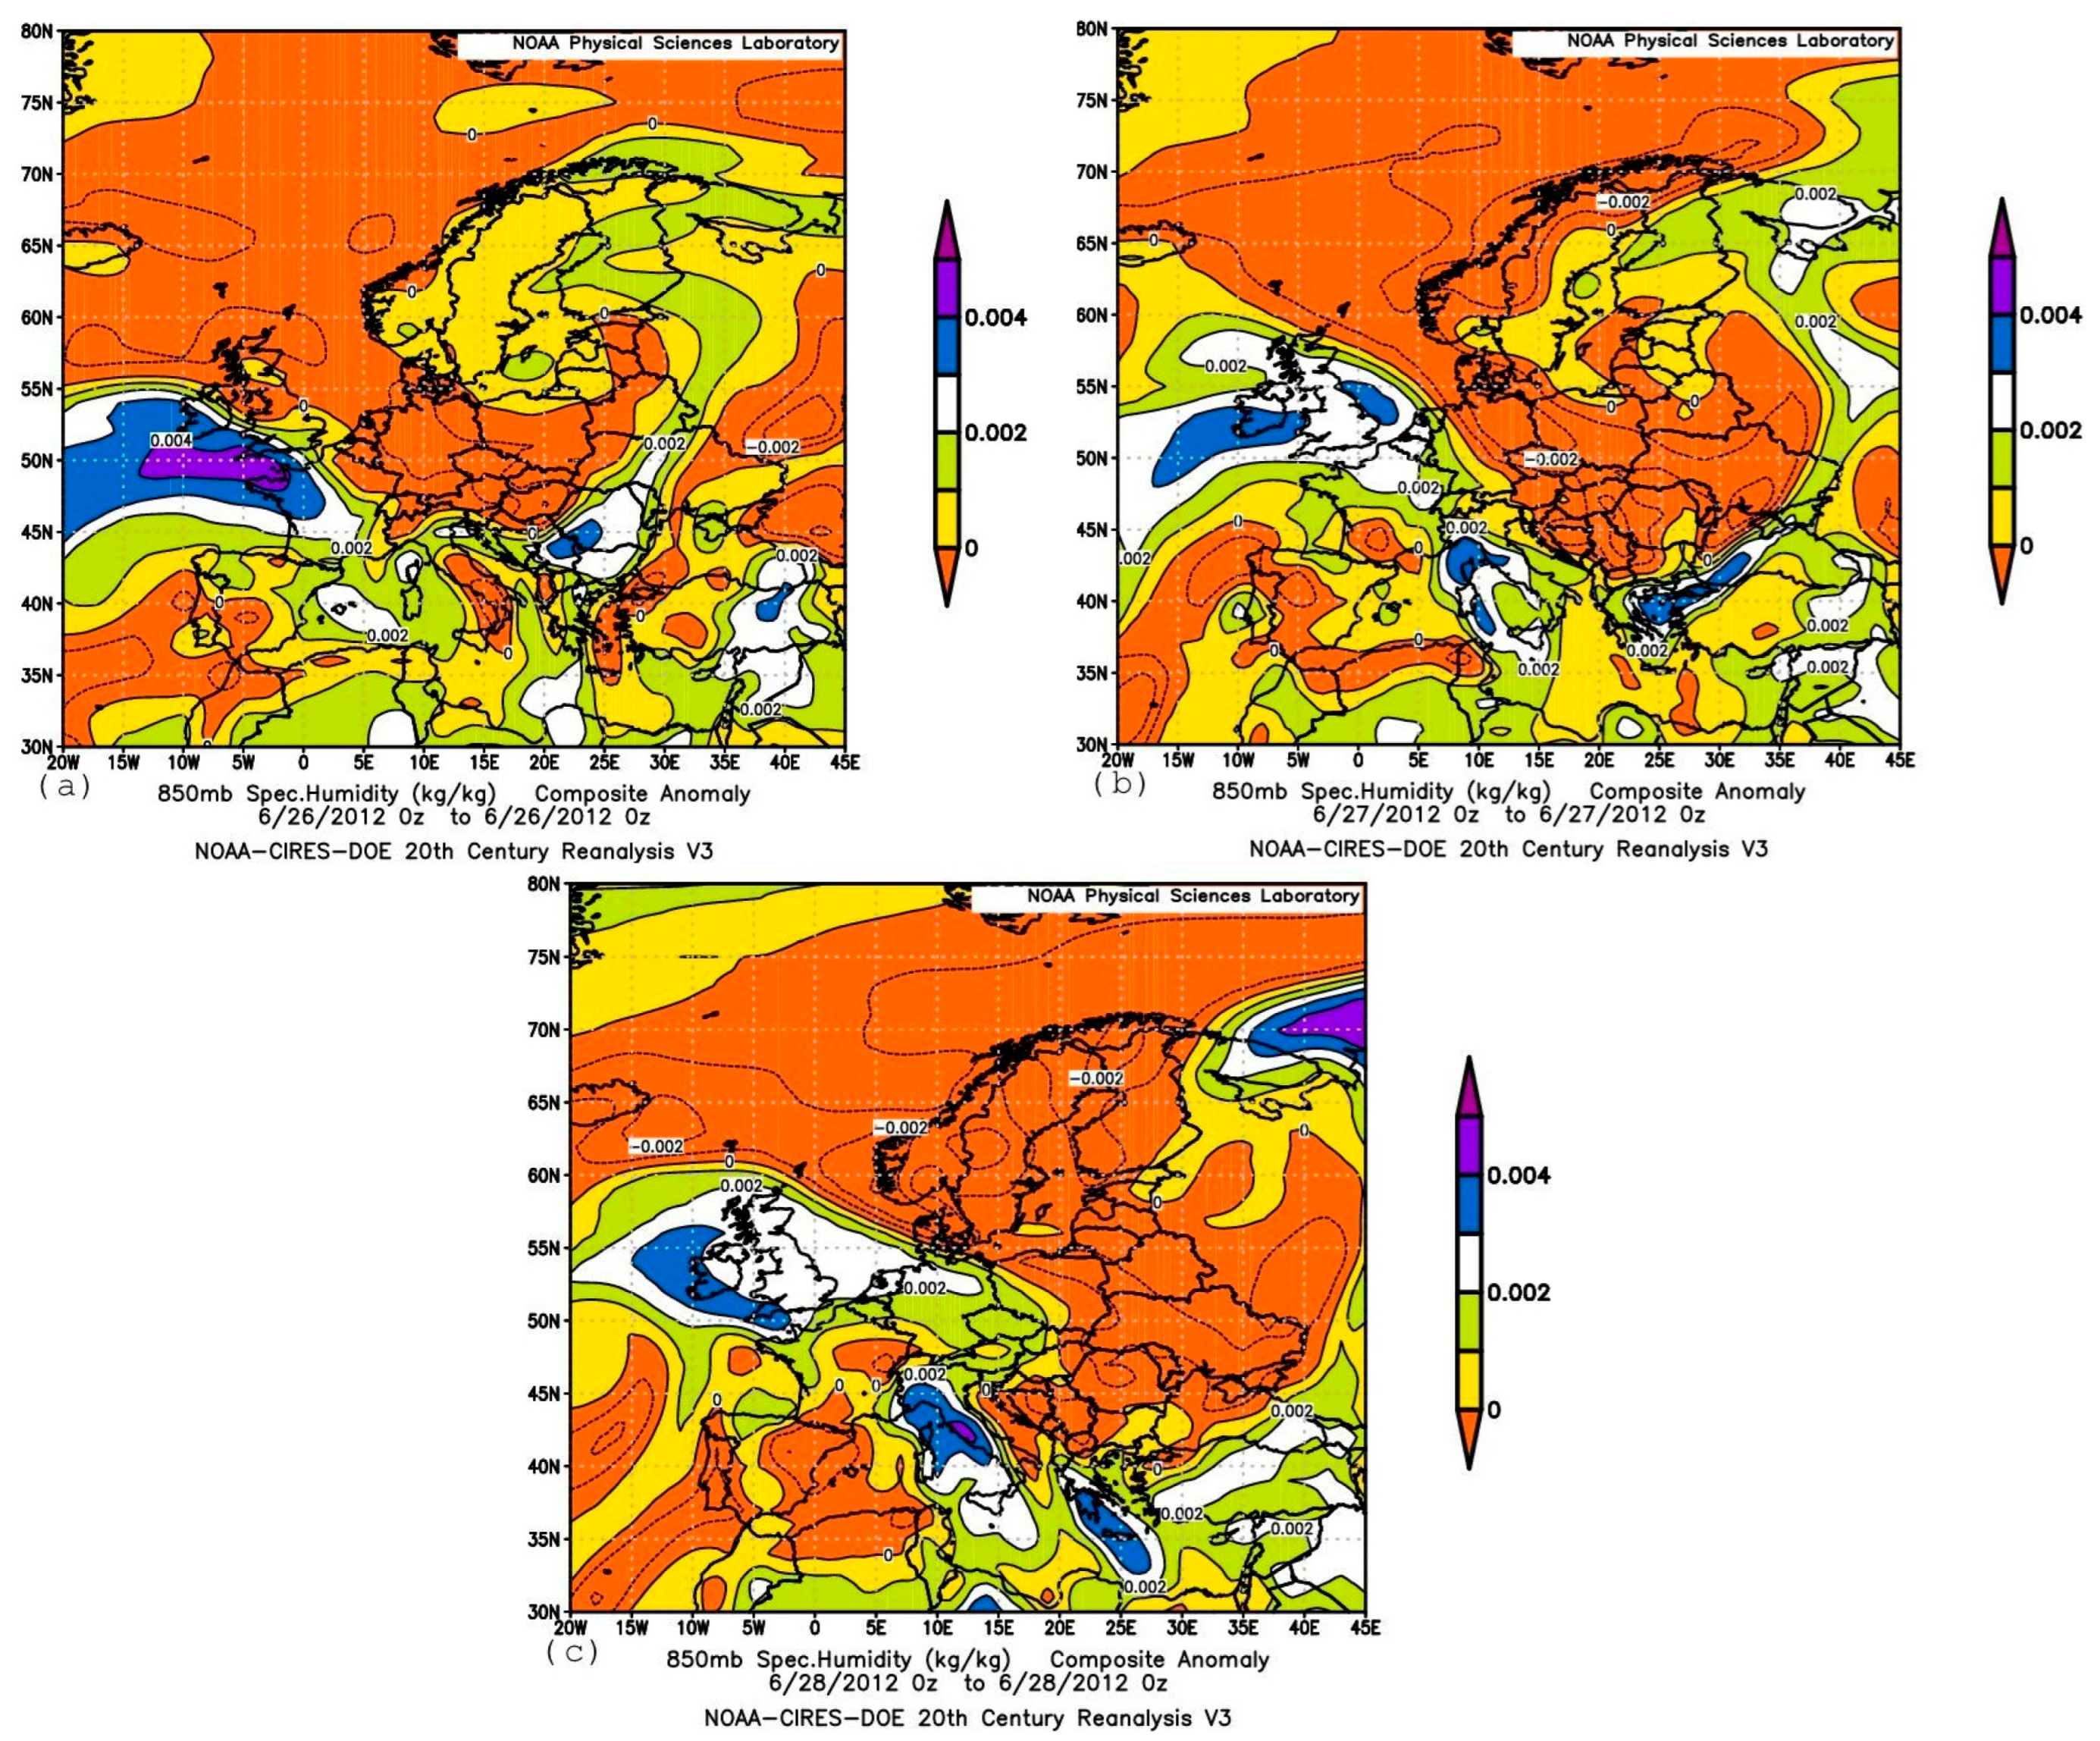
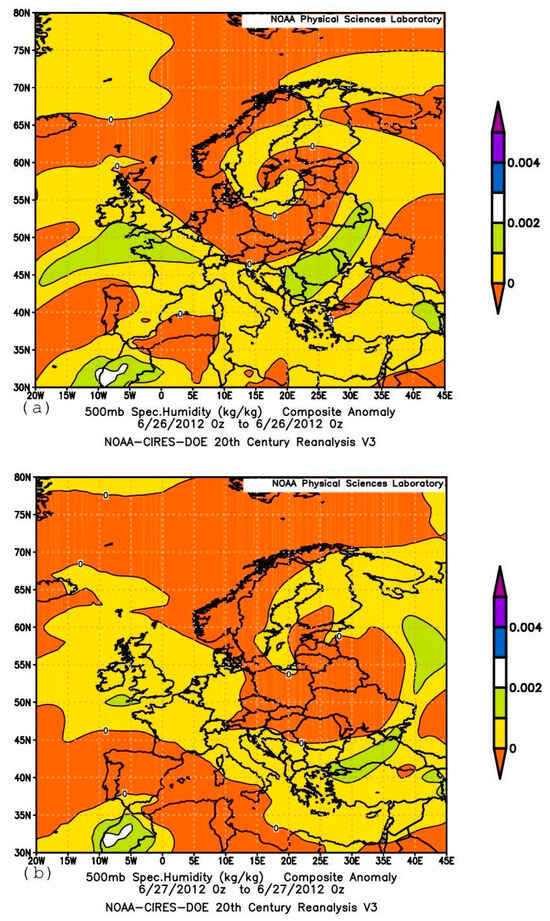
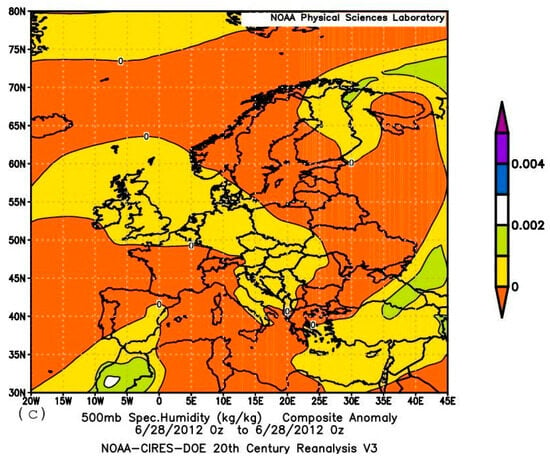
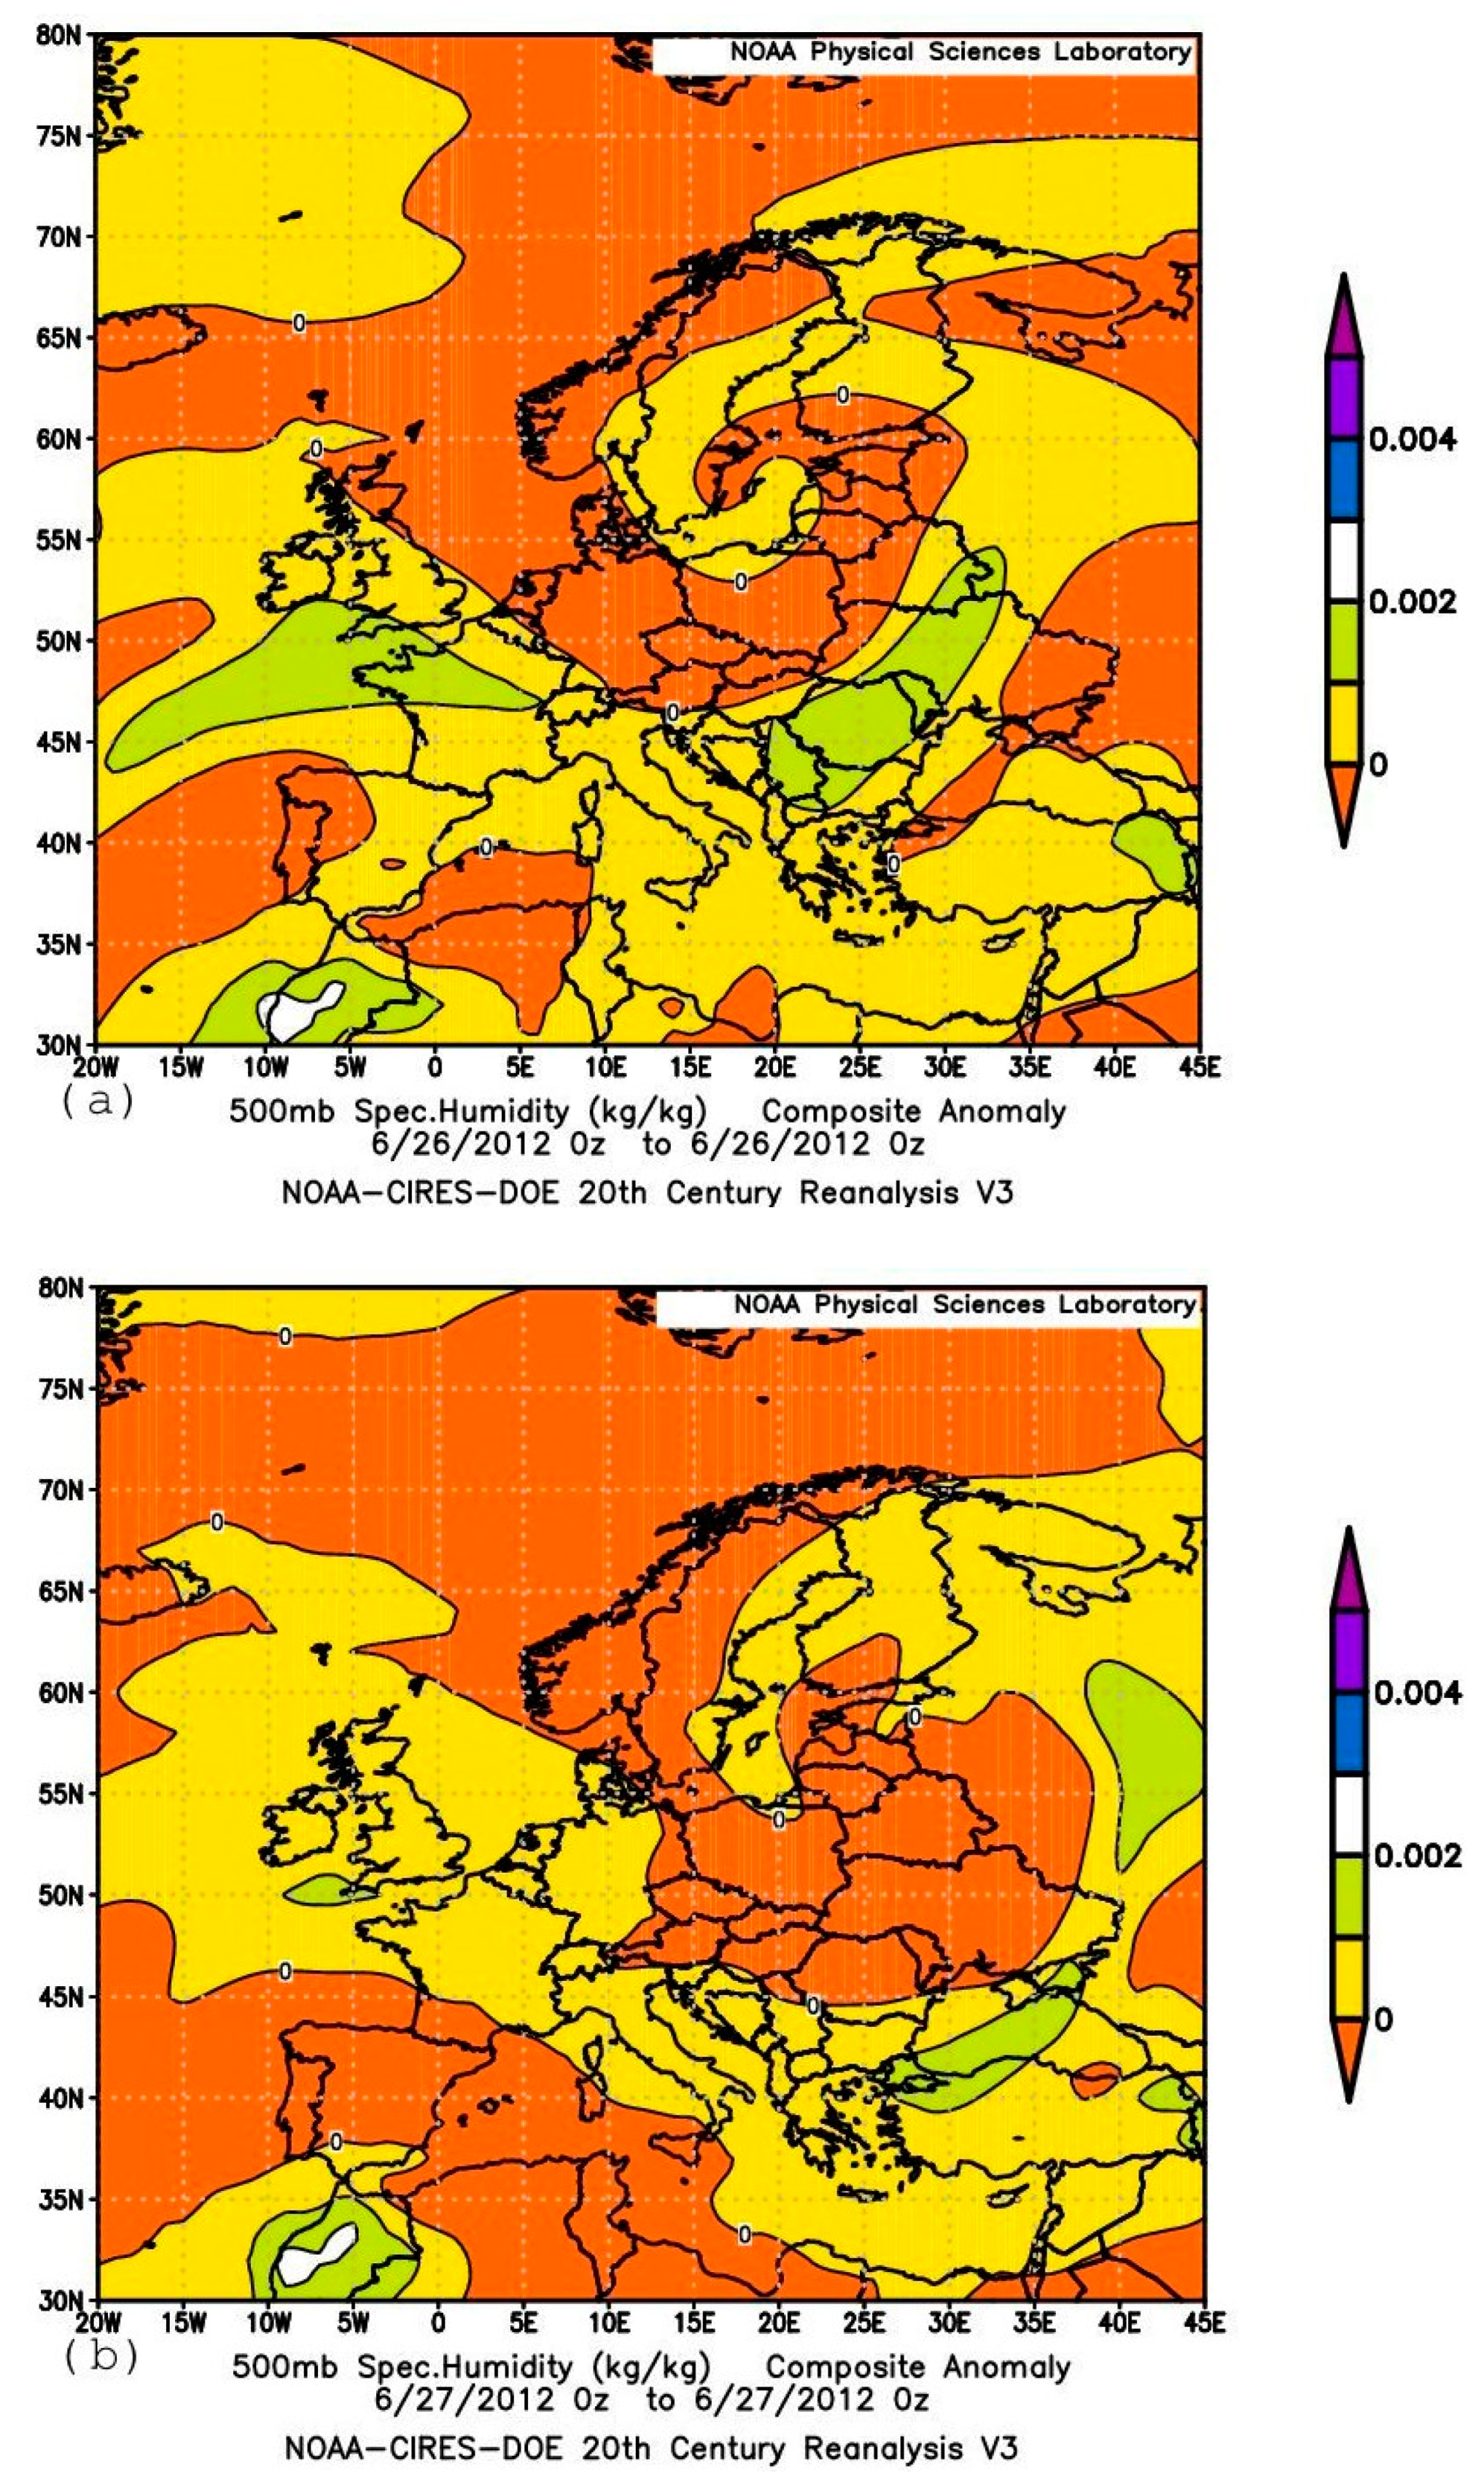
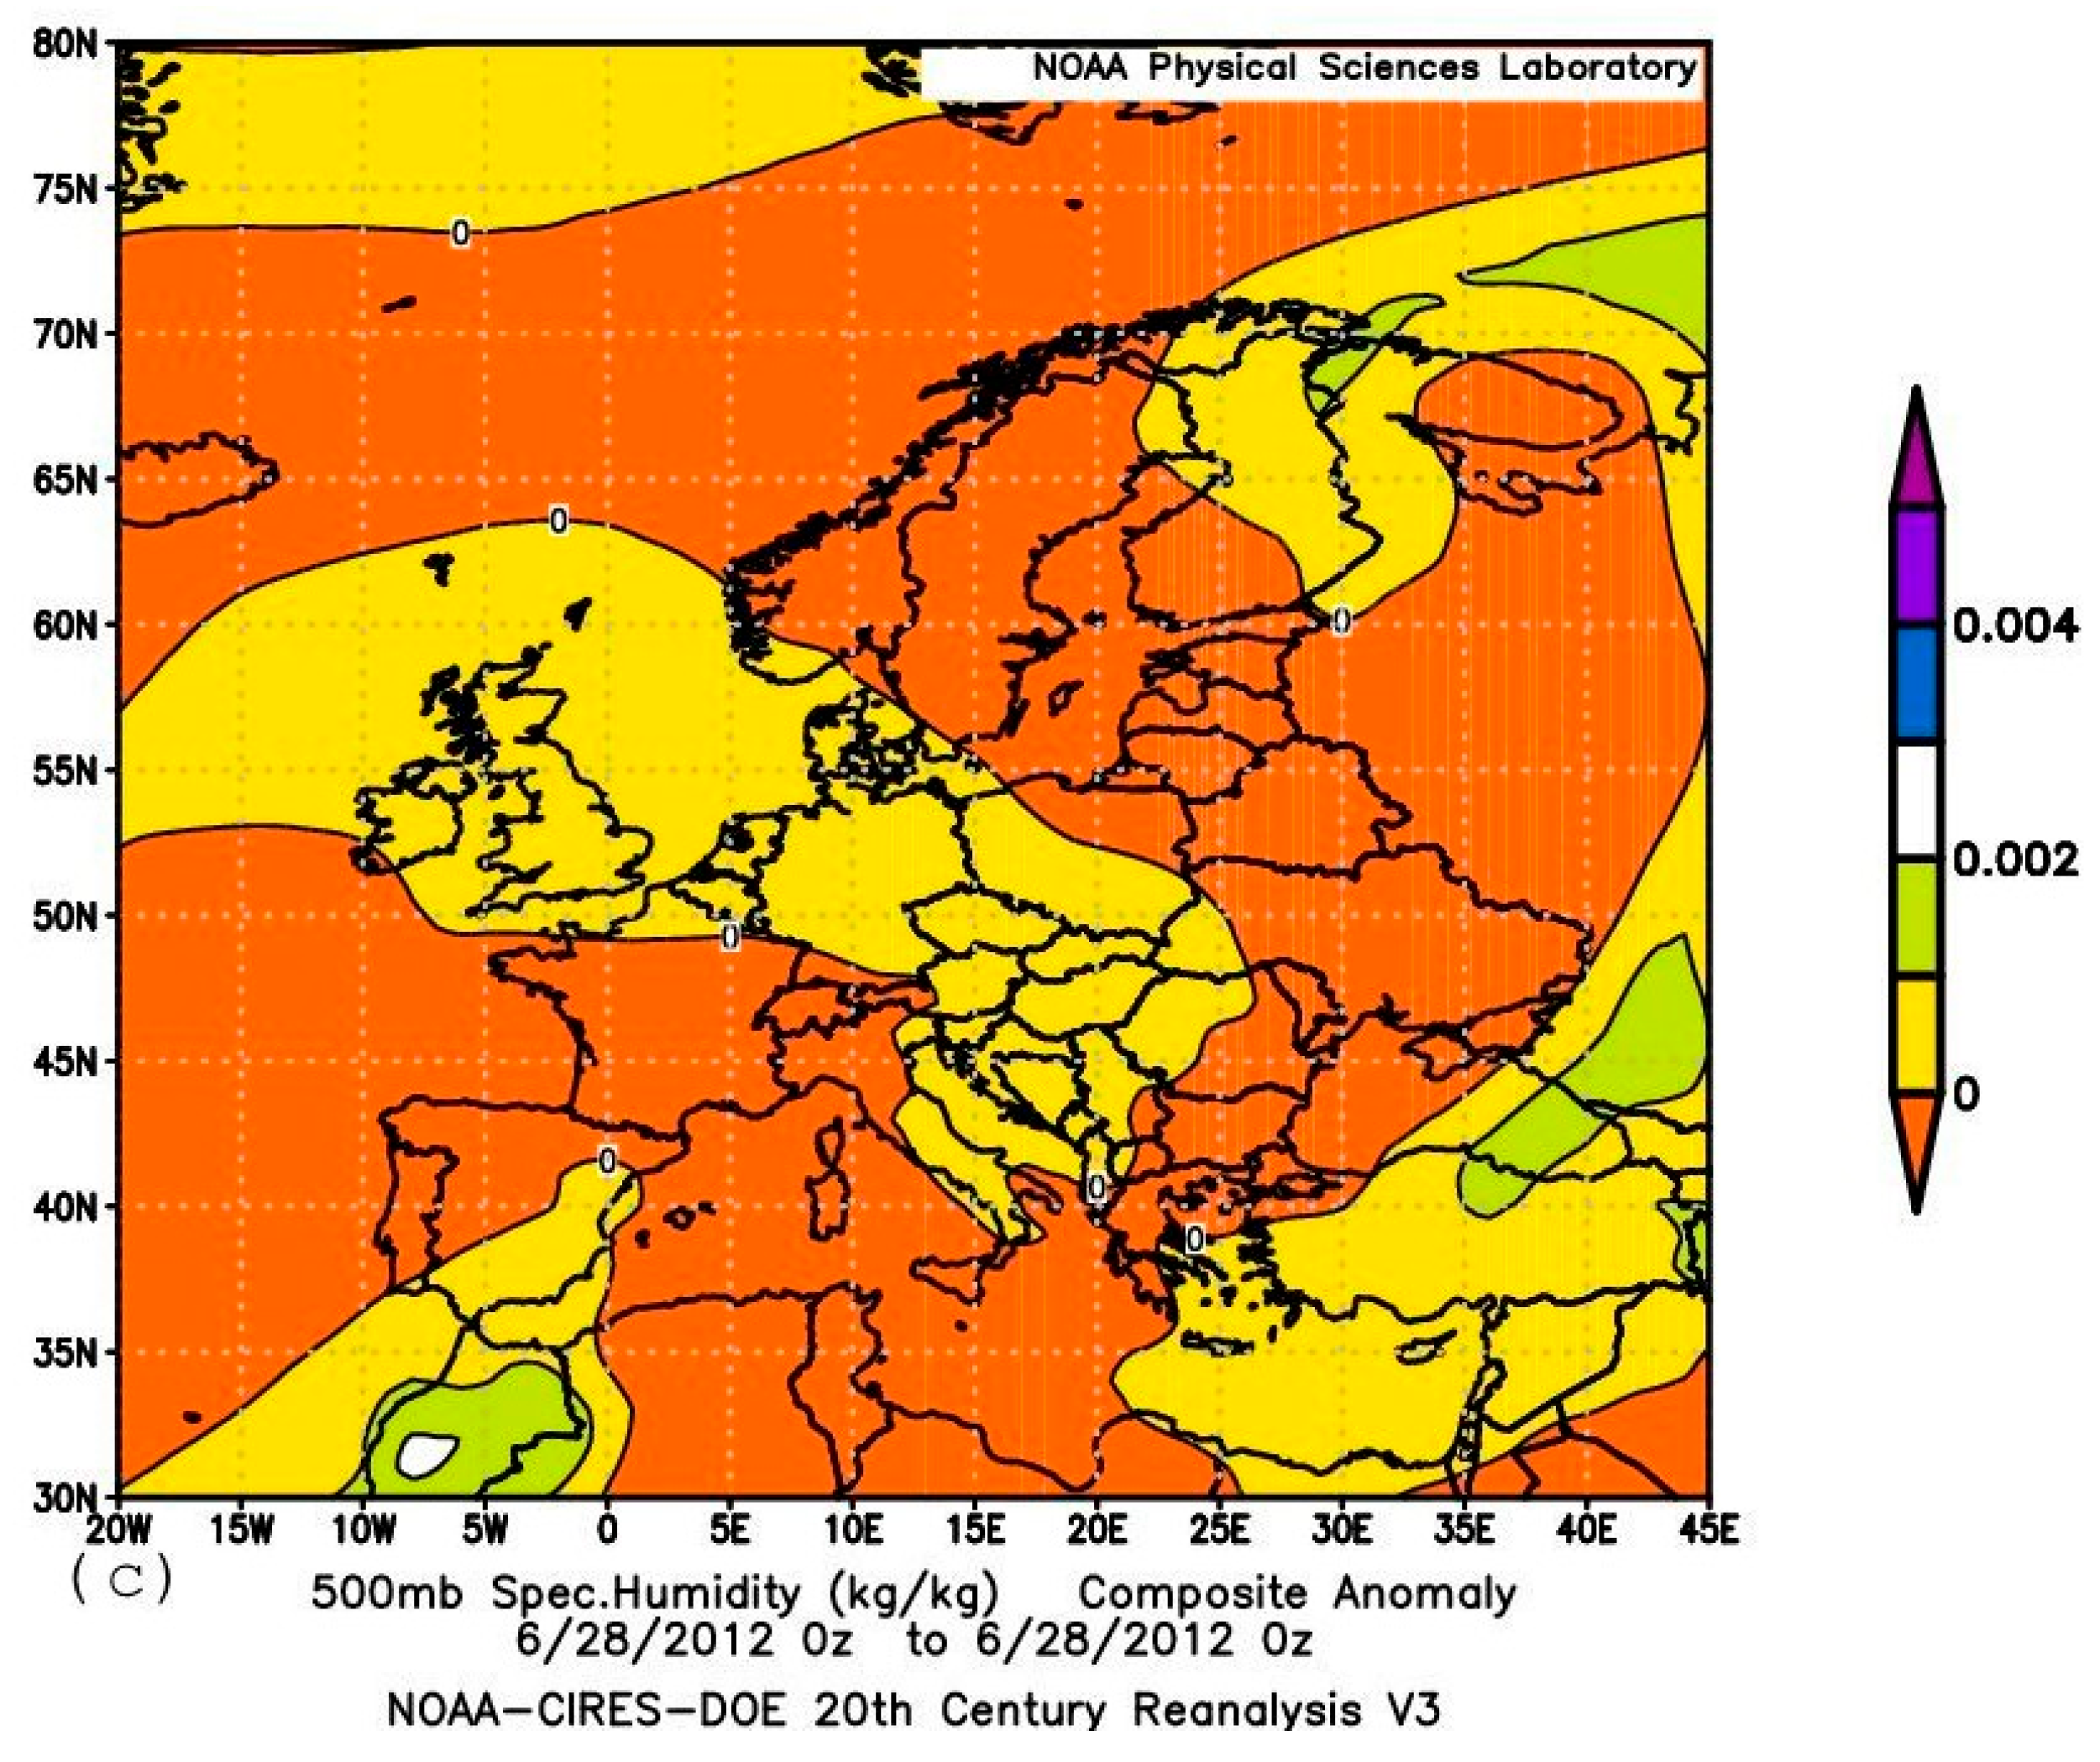
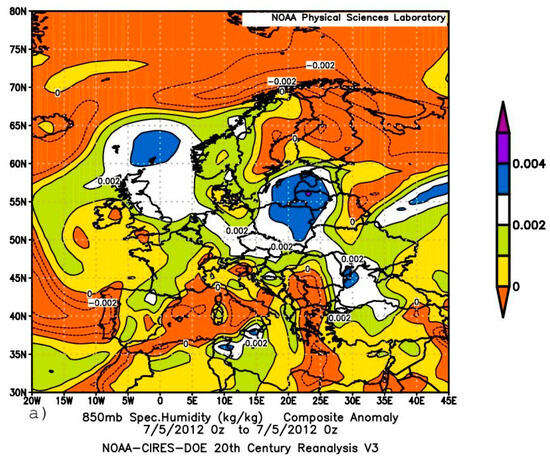
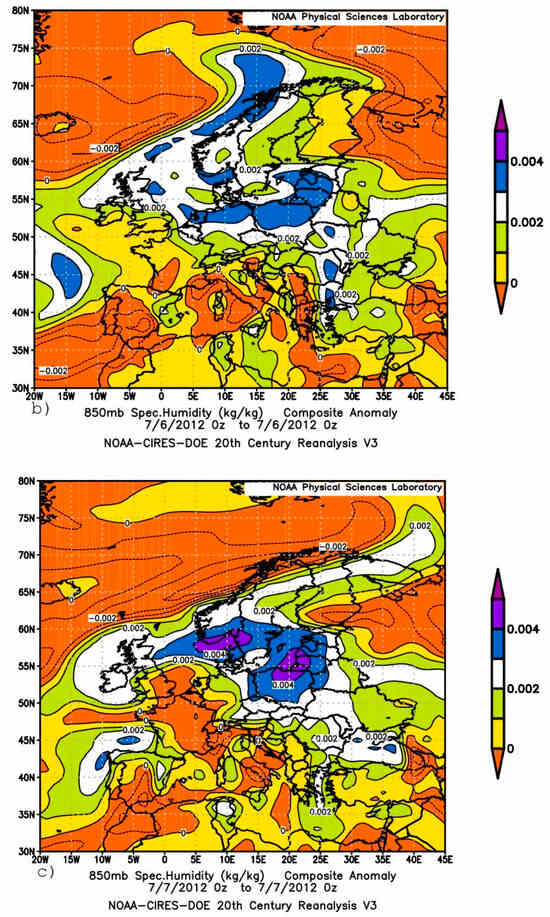
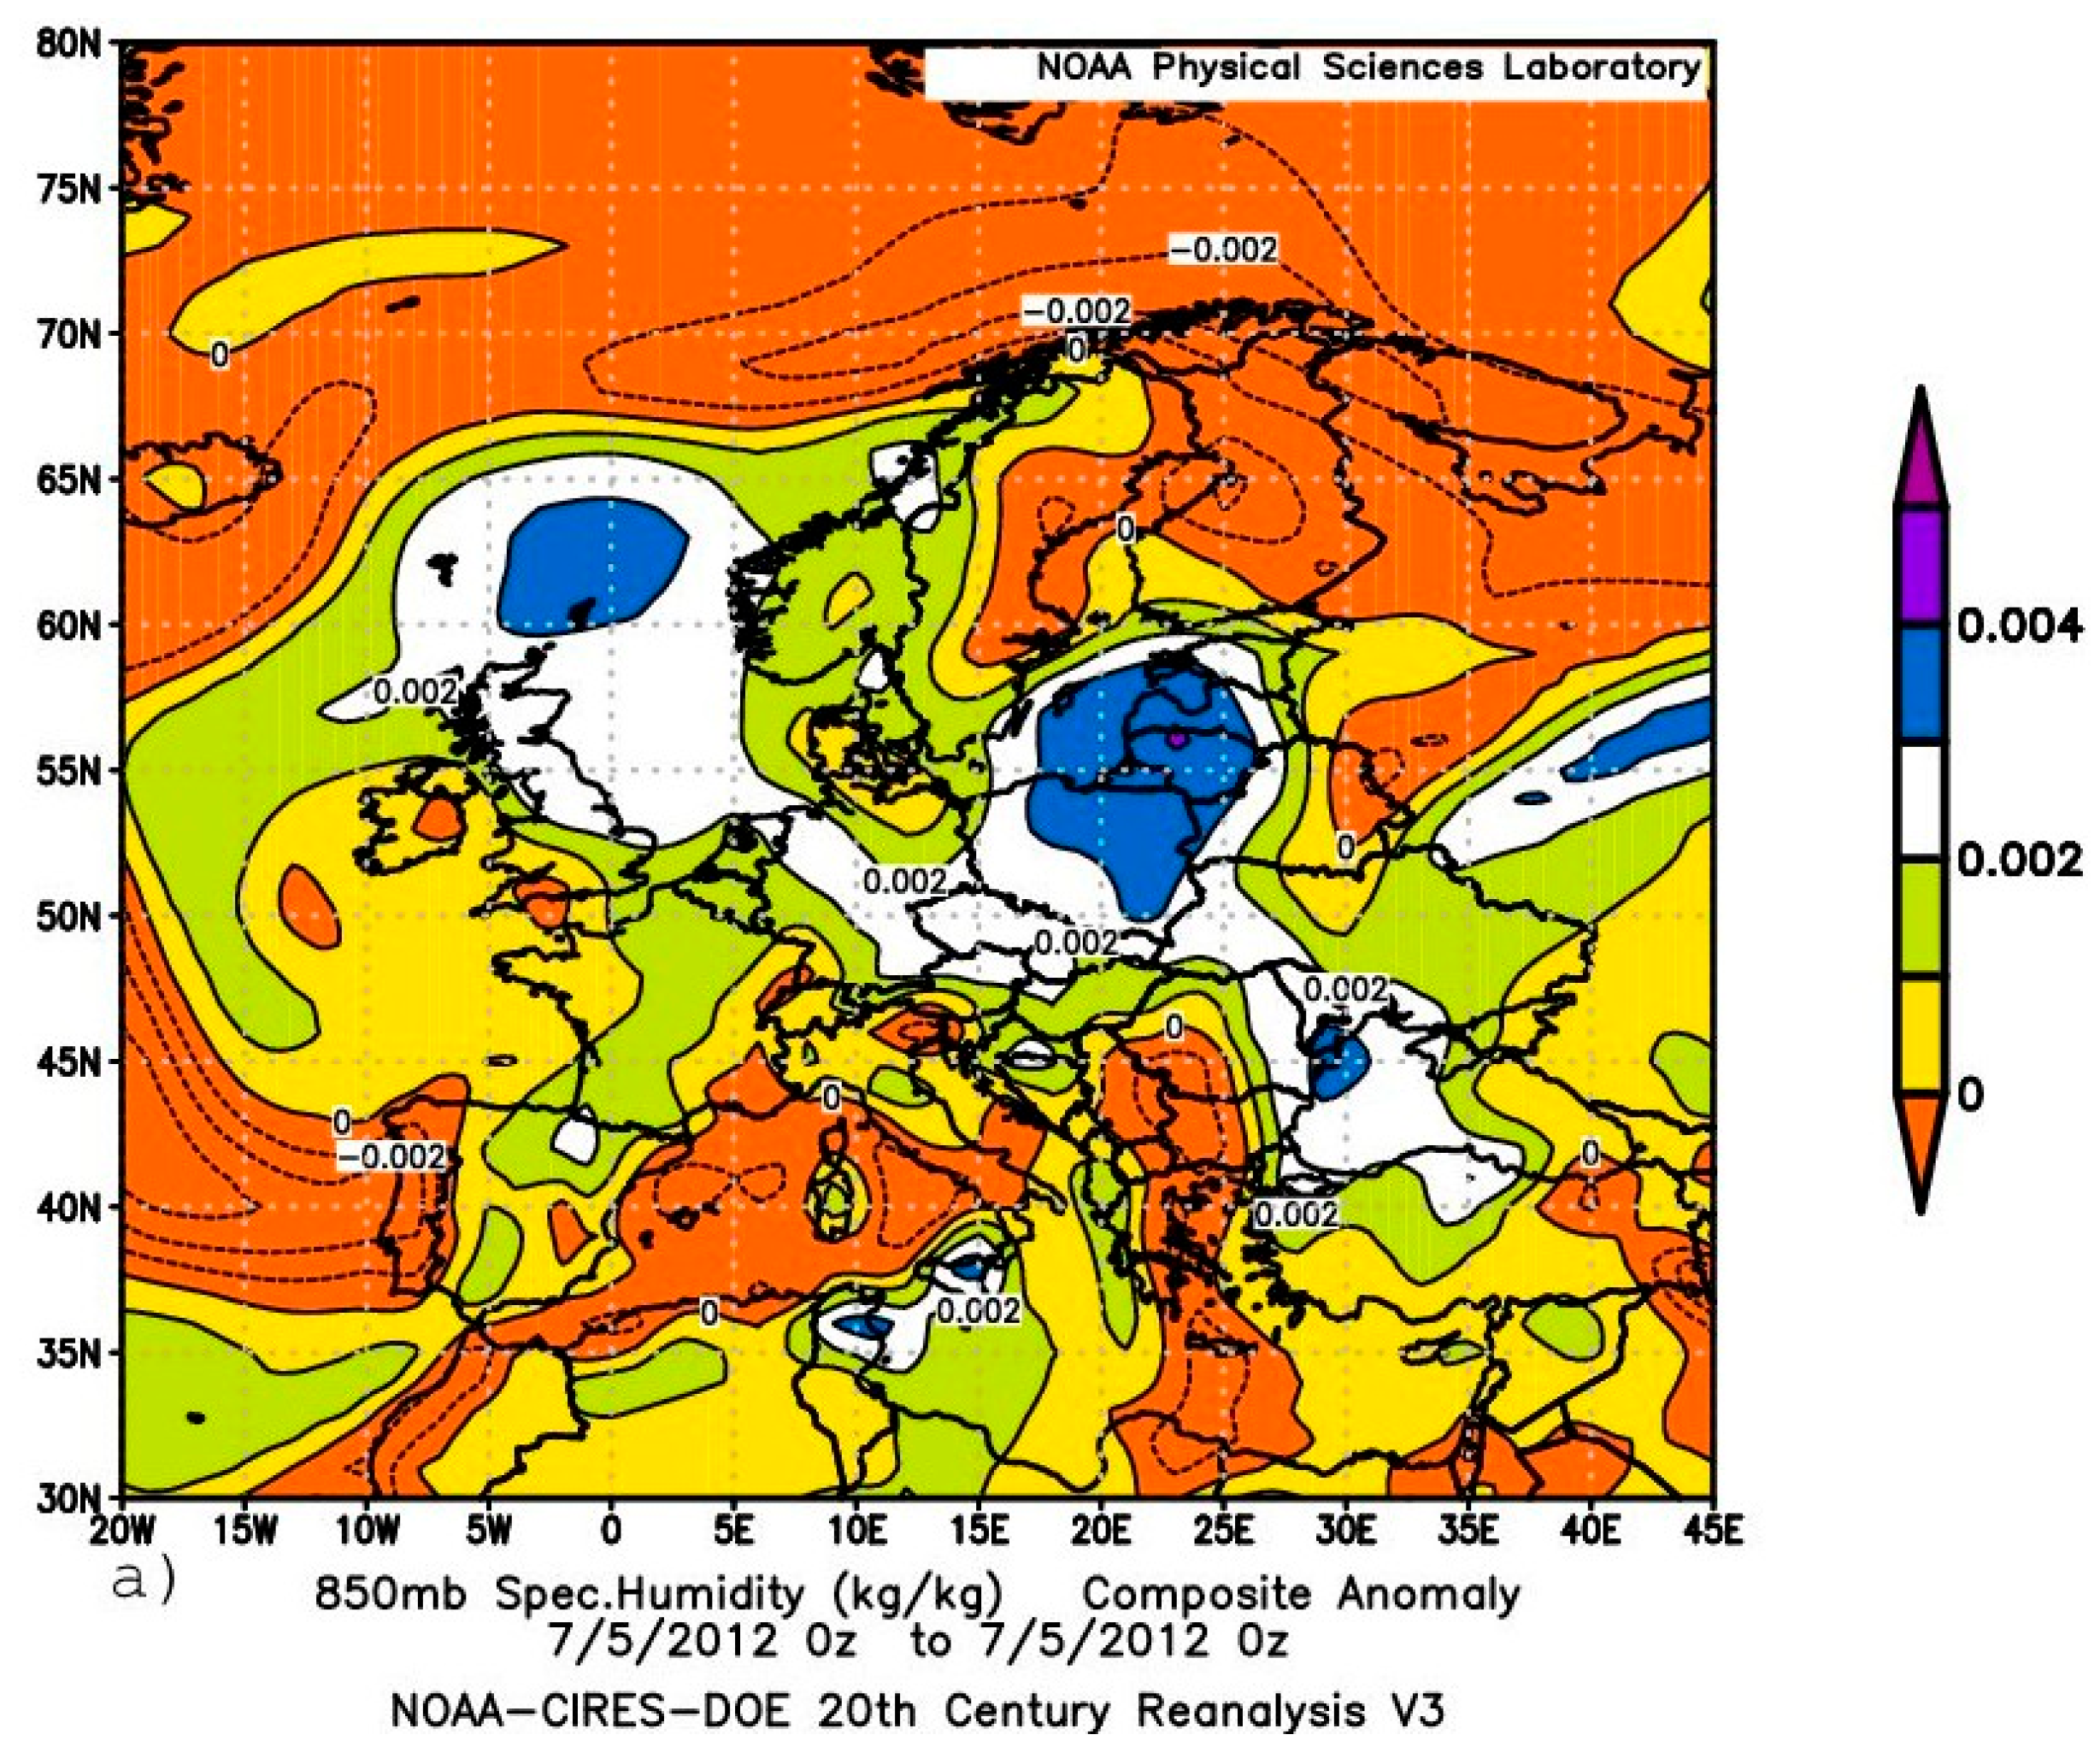
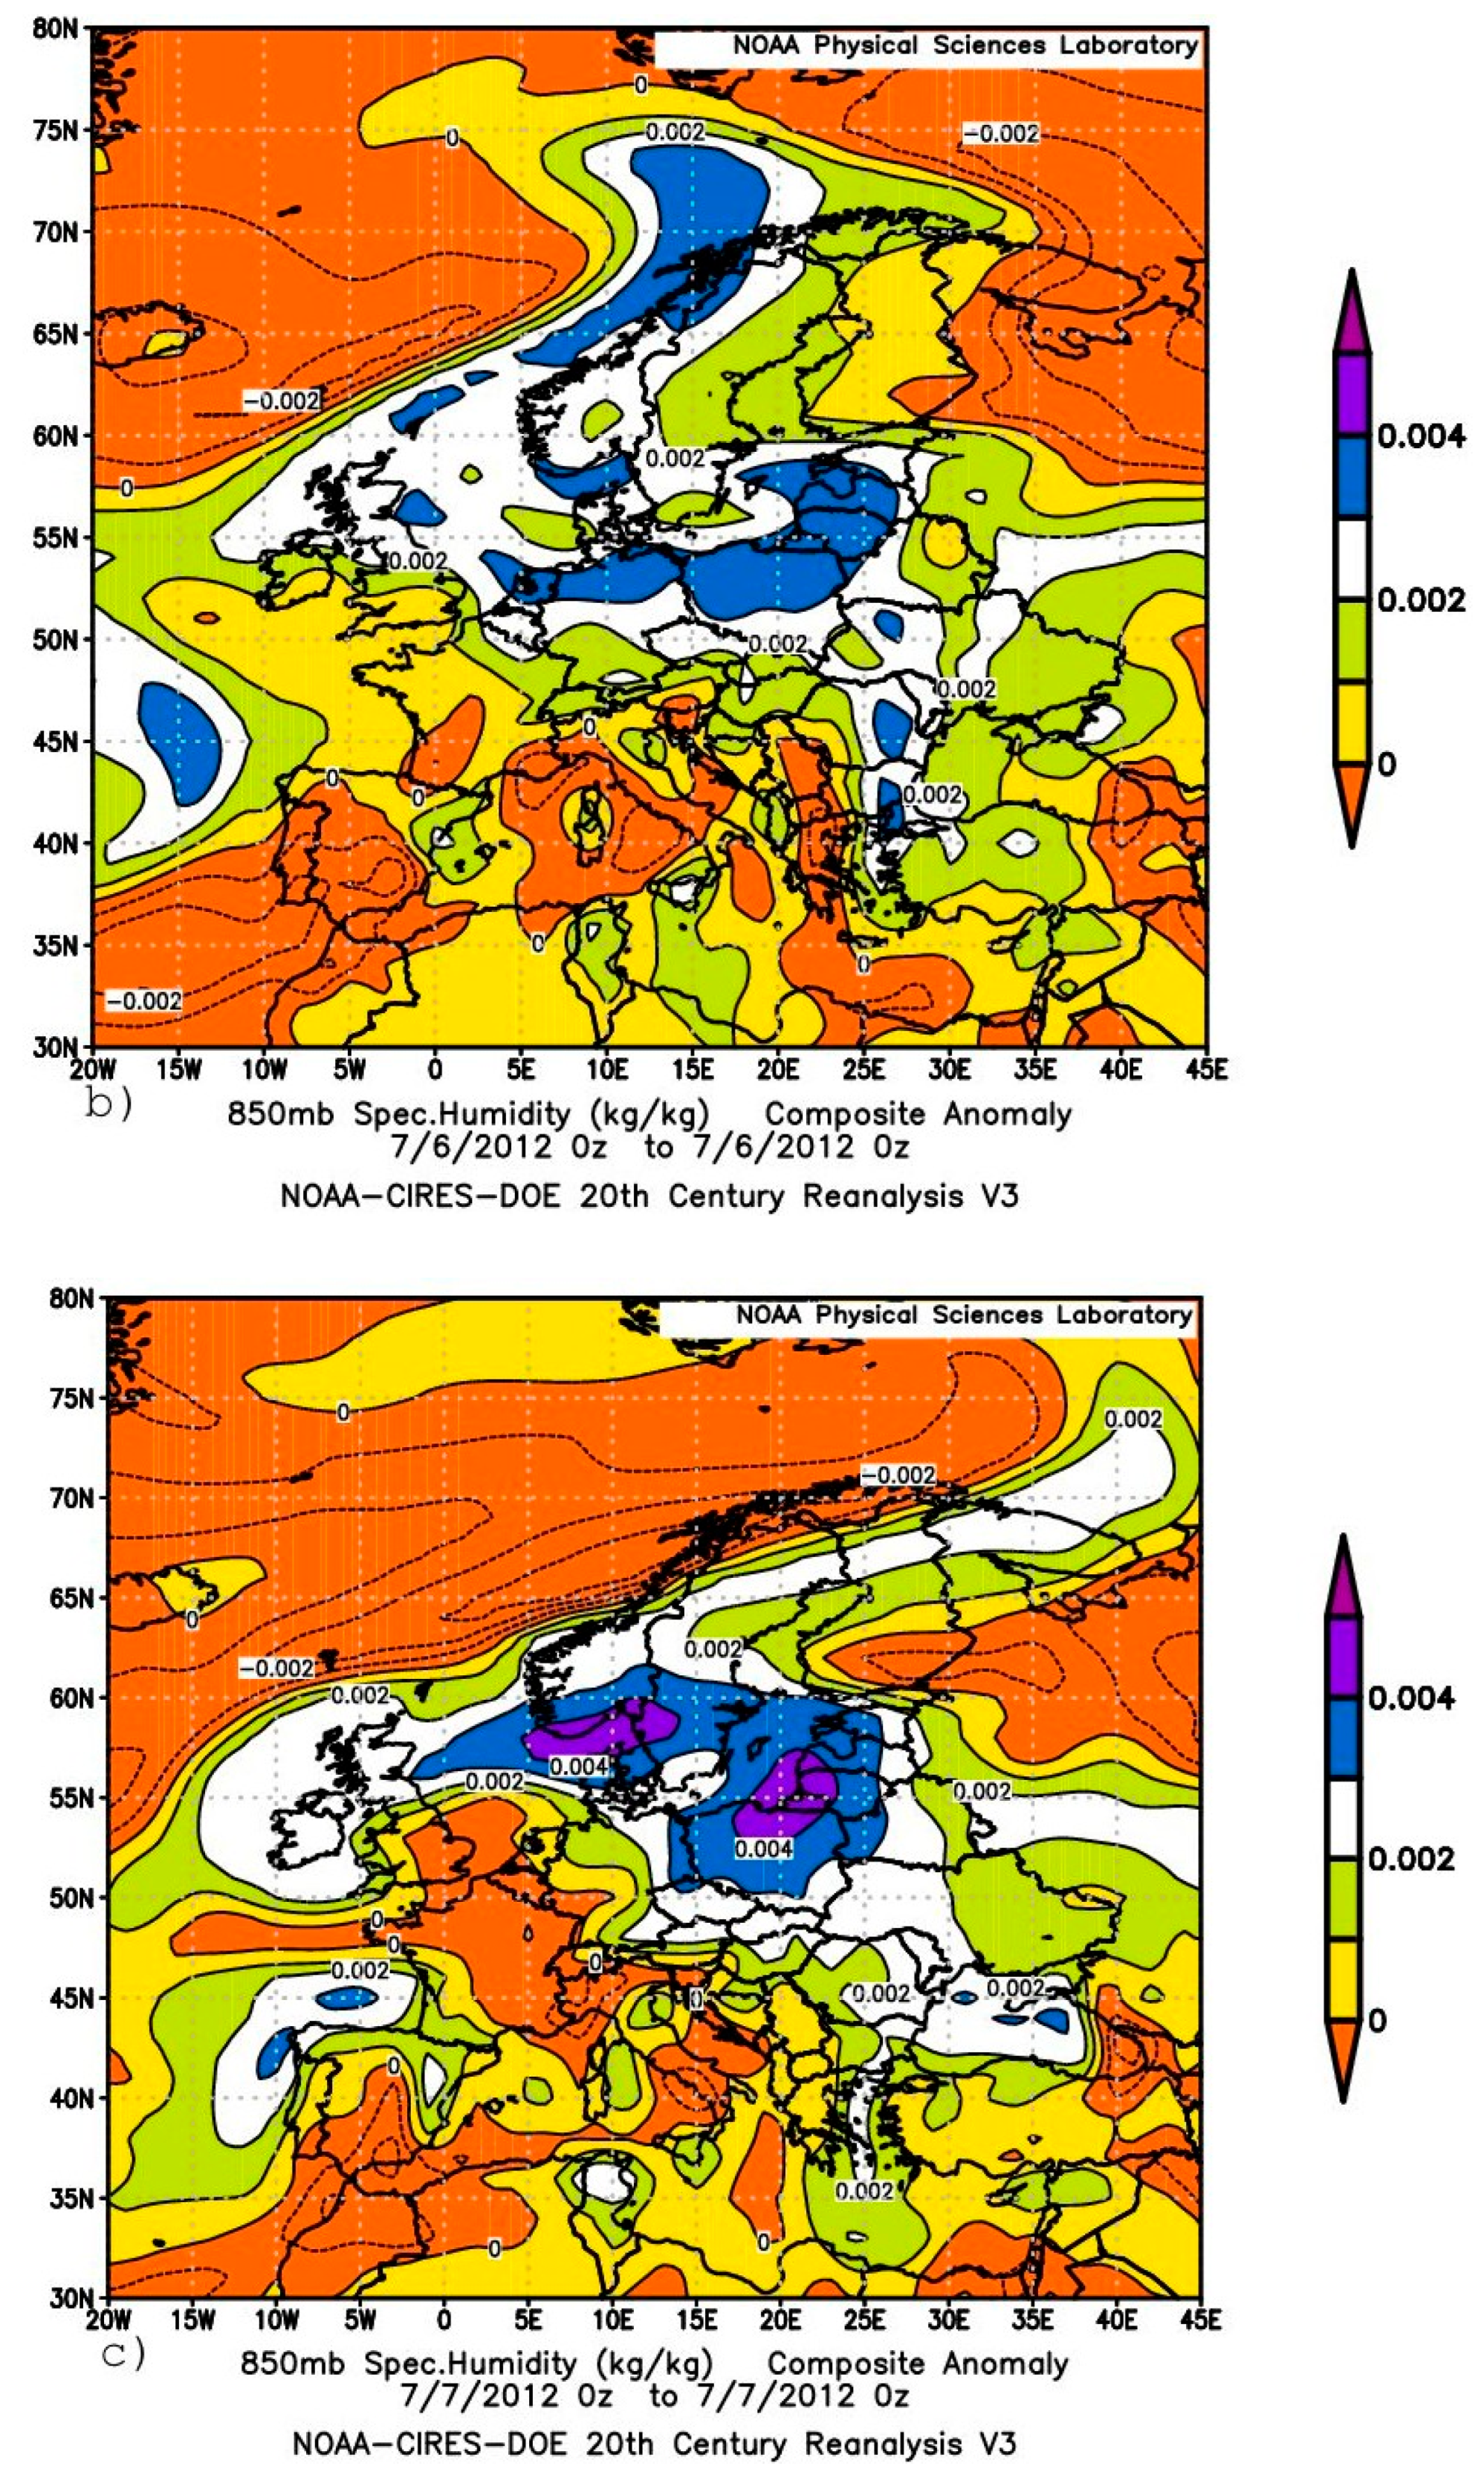
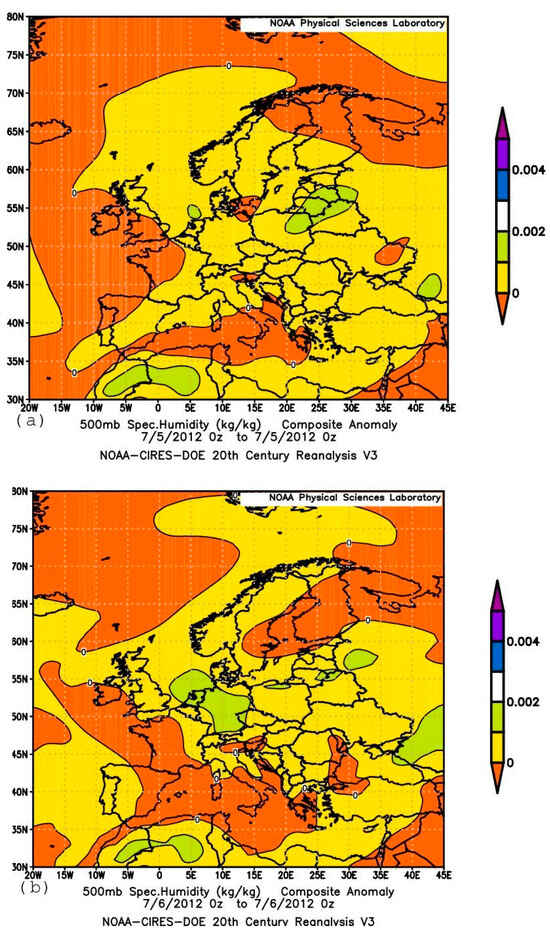
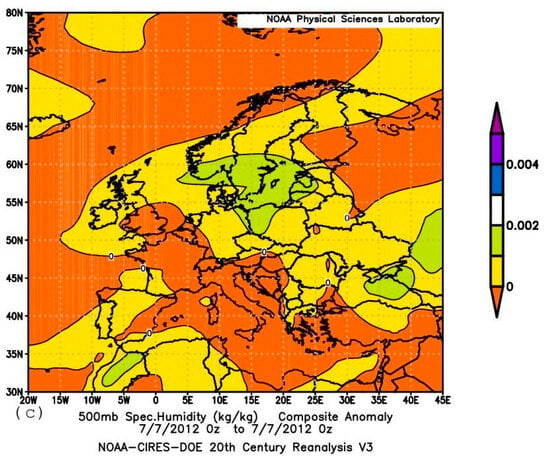
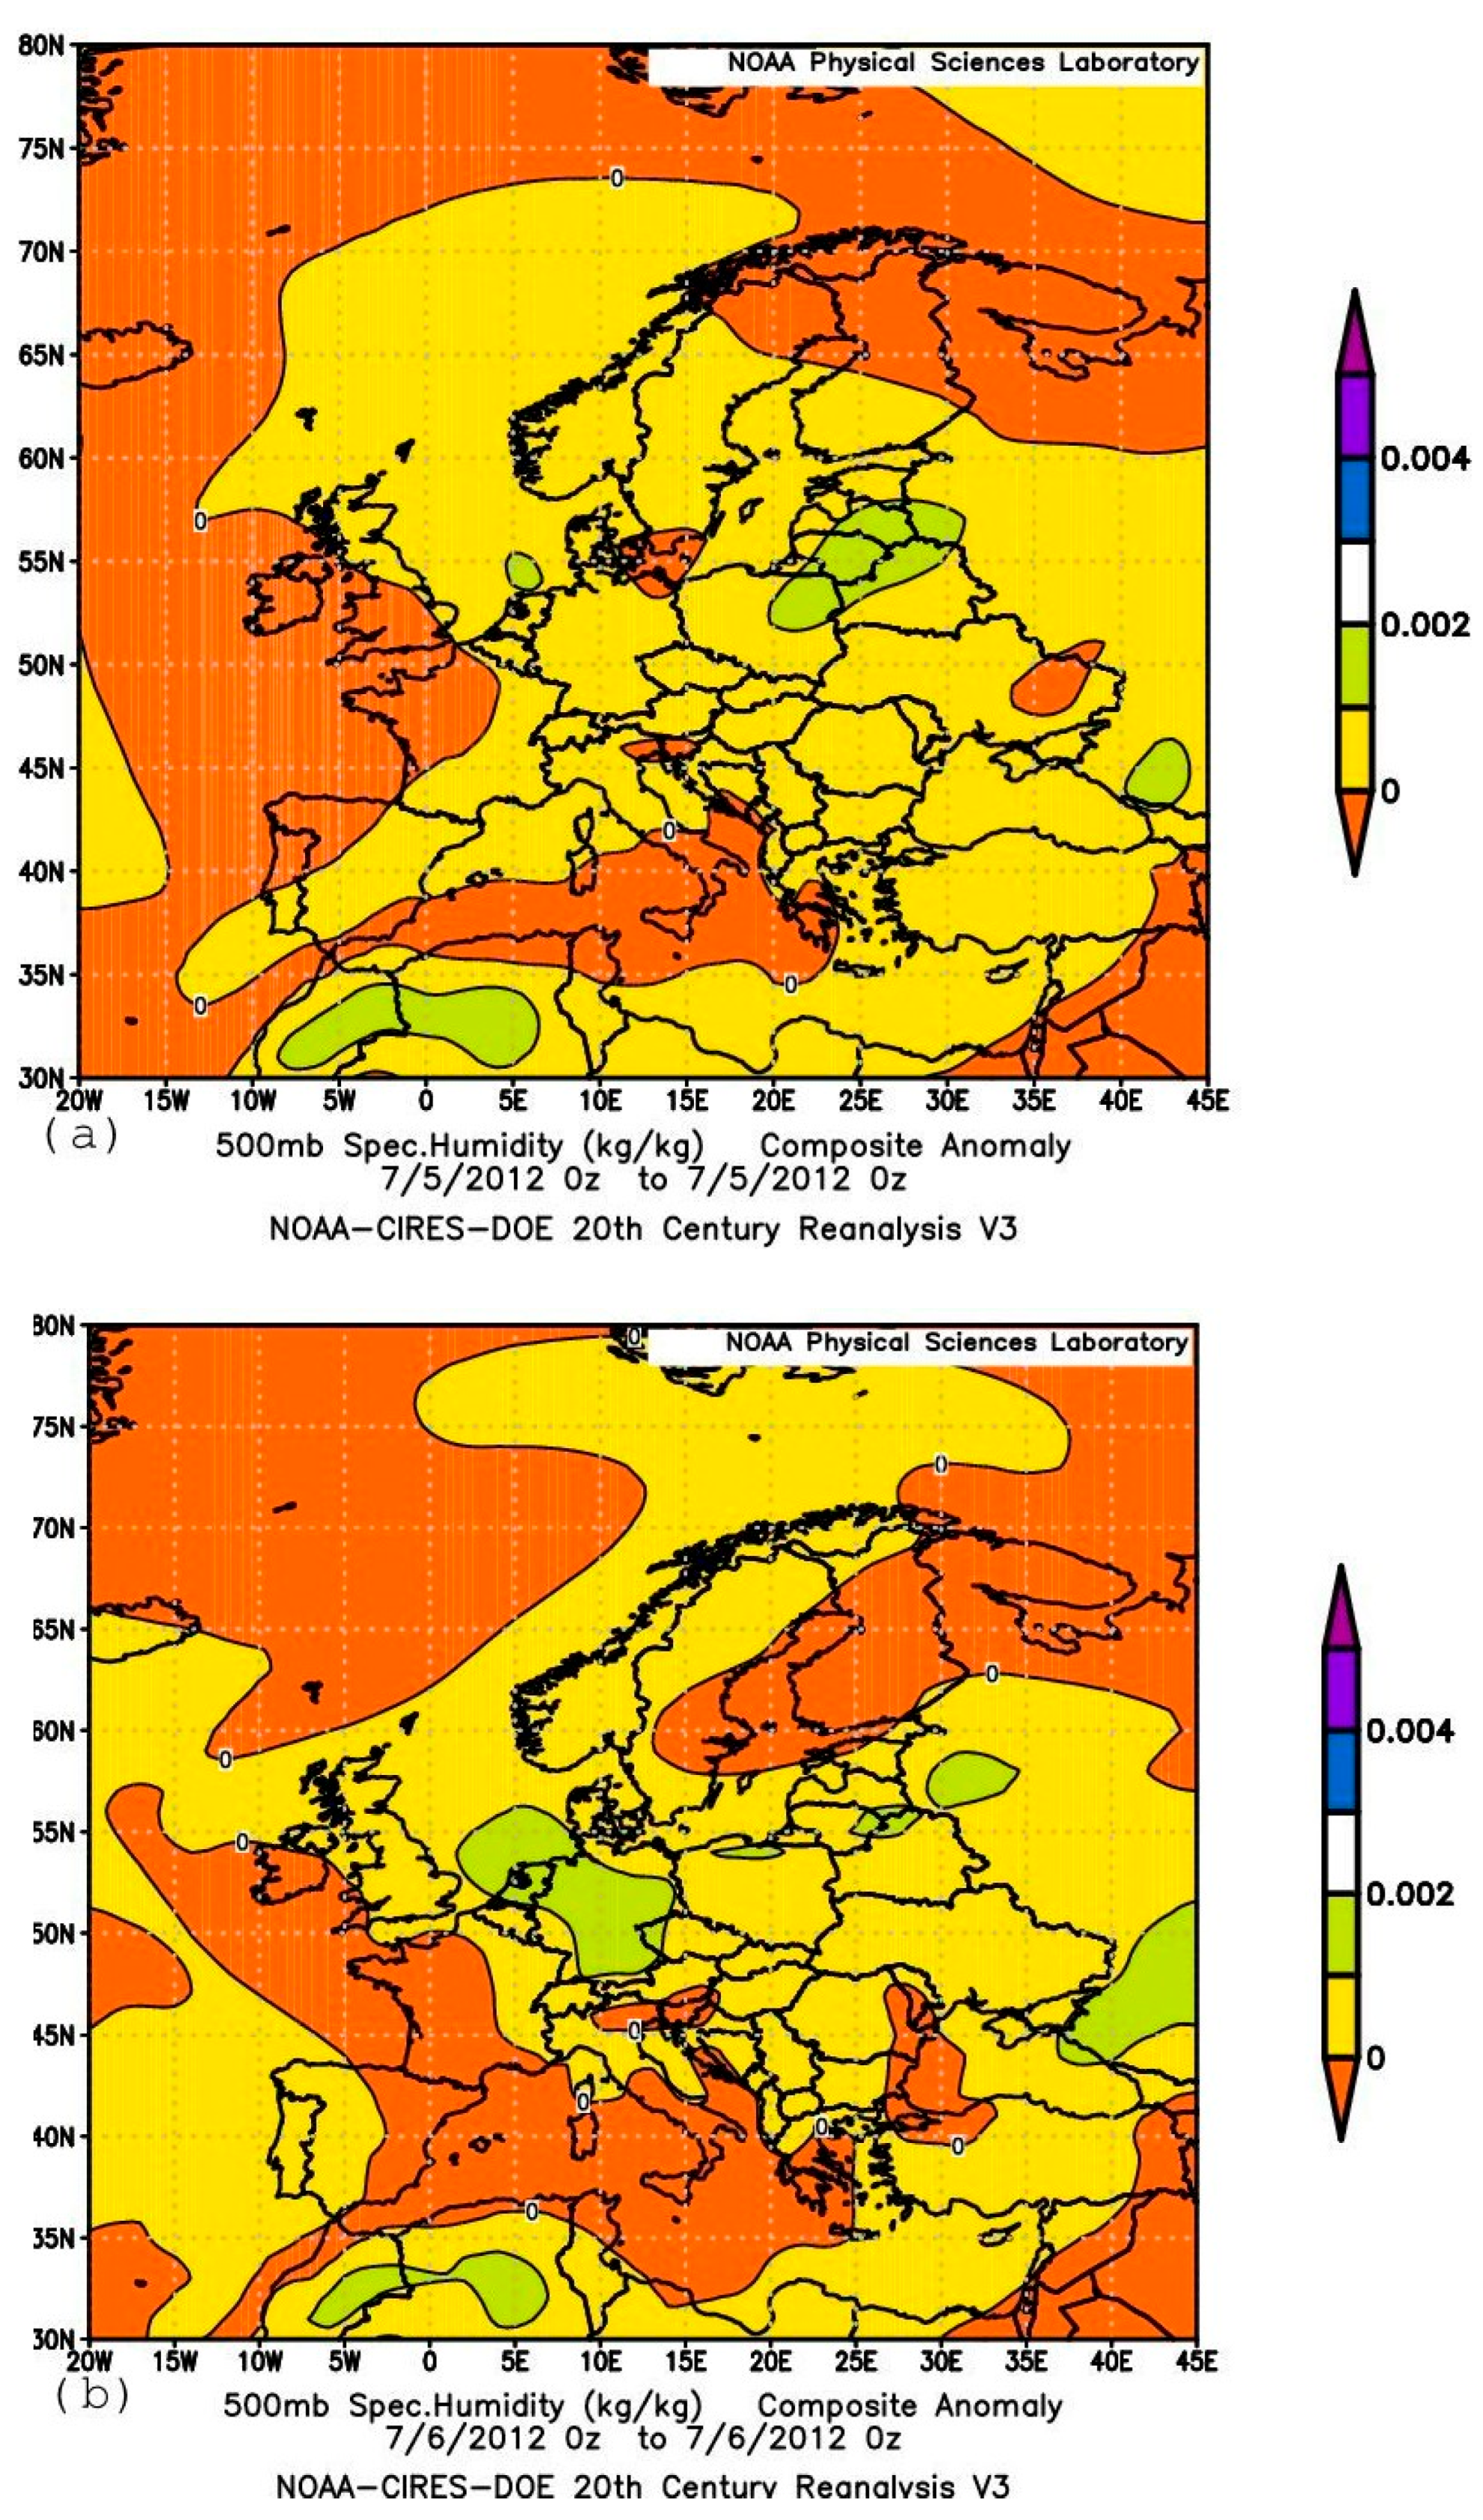
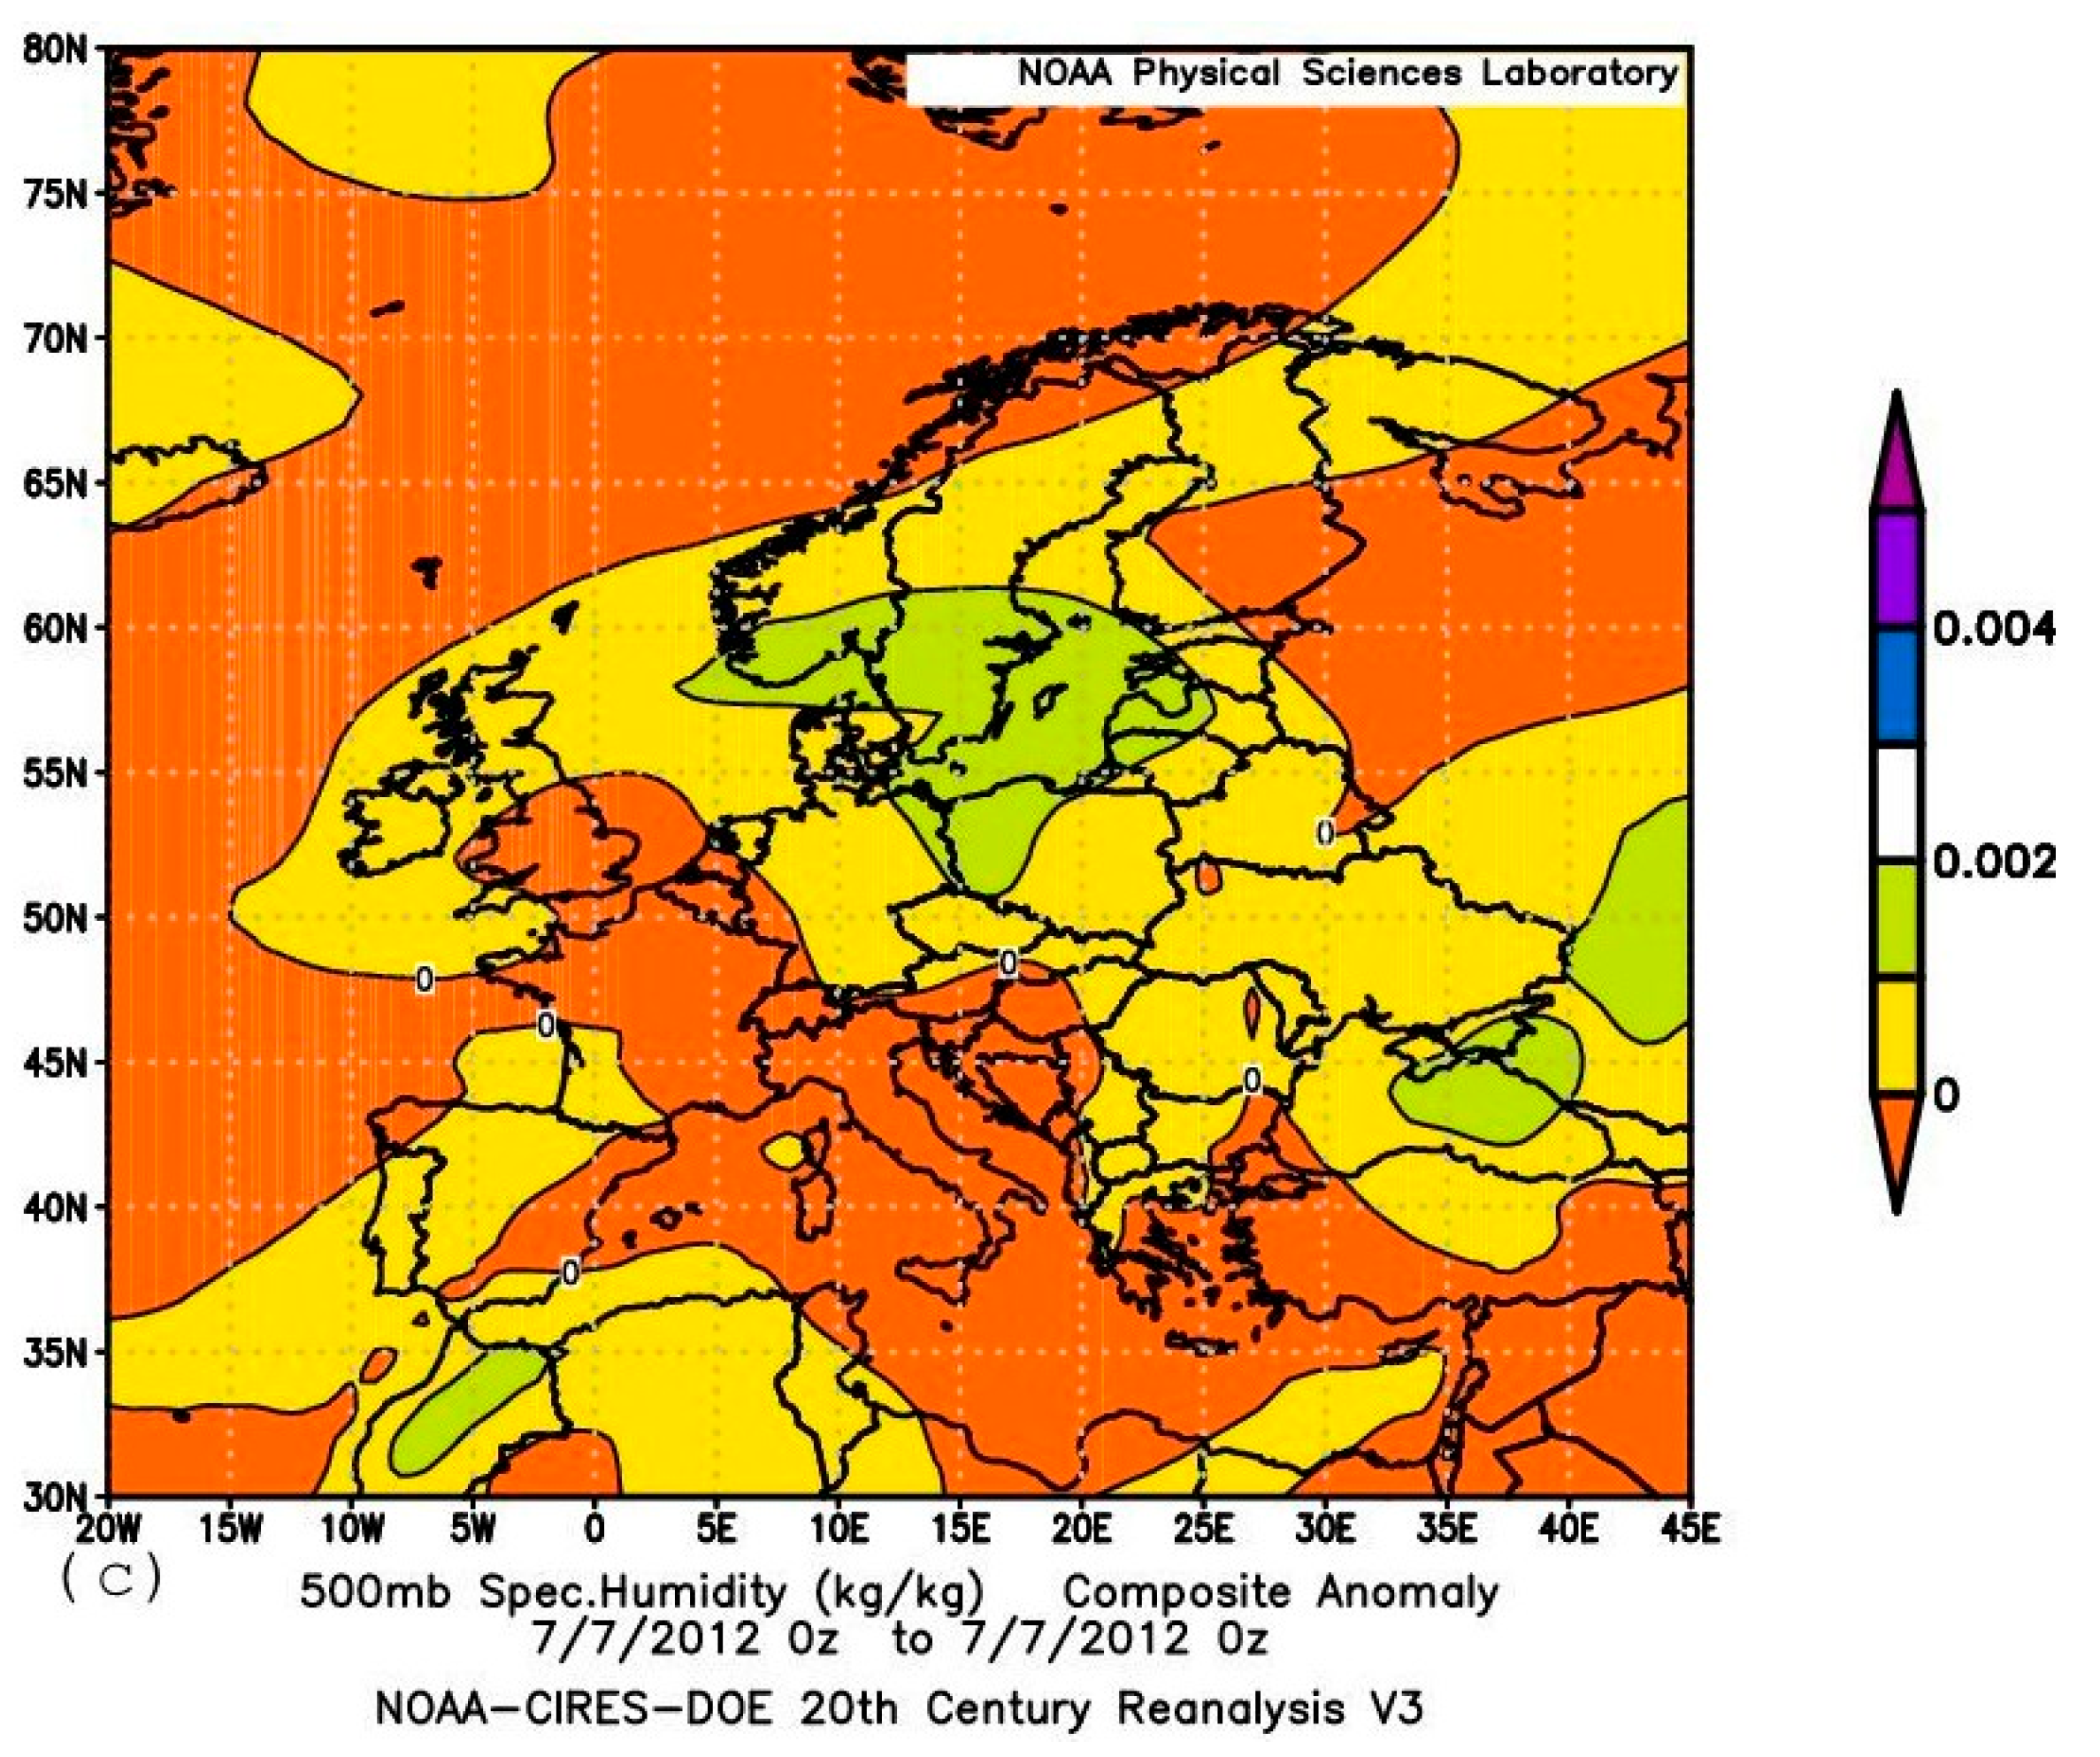
This suggestion is qualitatively supported by the spatial distribution of specific humidity at the 850 and 500 hPa levels, as shown in Figure 11a–d and Figure 12a–d for two periods (26–28 June and 5–7 July), during which the aforementioned extreme precipitation events occurred in Europe (around 28 June and 6 July). Observational (reanalysis) data on specific humidity at the 850 hPa level indicate the presence of zones with large positive humidity anomalies over Europe at both the 850 and 500 hPa levels. The specific humidity anomaly values—highlighted in dark blue in Figure 11a–c and Figure 13a–c (for the 850 hPa level) and in light green in Figure 12d–f and Figure 14a–c (for the 500 hPa level), indicating zones with a high probability of extreme precipitation (3–4 g/kg at 850 hPa and 1–2 g/kg at 500 hPa)—are consistent with research findings on improving methods for detecting and forecasting extreme precipitation using numerical modeling technologies [69,70,71].
Figure 11.
Anomaly (with respect to the 1981–2010 monthly climatology) of specific humidity (kg/kg) patterns (shading, contour interval 1 kg/kg) for 00:00 UTC on 26, 27 and 28 June 2012 at 850 (a–c) [based on the NOAA CIRES DOE 20th century 20CRV3 reanalysis data].
Figure 12.
Anomaly (with respect to the 1981–2010 monthly climatology) of specific humidity (kg/kg) patterns (shading, contour interval 1 kg/kg) for 00:00 UTC on 26, 27 and 28 June 2012 at 500 (a–c) [based on the NOAA CIRES DOE 20th century 20CRV3 reanalysis data].
Figure 13.
Anomaly (with respect to the 1981–2010 monthly climatology) of specific humidity (kg/kg) patterns (shading, contour interval 1 kg/kg) for 00:00 UTC on 5, 6 and 7 of July 2012 at 850 hPa (a–c). [based on the NOAA CIRES DOE 20th century 20CRV3 reanalysis data].
Figure 14.
Anomaly (with respect to the 1981–2010 monthly climatology) of specific humidity (kg/kg) patterns (shading, contour interval 1 kg/kg) for 00:00 UTC on 5, 6 and 7 of July 2012 at 500 hPa (a–c). [based on the NOAA CIRES DOE 20th century 20CRV3 reanalysis data].
7. Discussion
The dynamic interaction of upper-tropospheric Rossby waves, the polar and subtropical jet streams, and North Atlantic storm tracks determines the summer precipitation regime in western Europe. While winter precipitation is largely driven by strong, persistent storm tracks, summer rainfall depends on a combination of jet stream shifts, wave activity, and local convective storms. Furthermore, Atlantic cyclones often play a crucial role in transporting moisture from low latitudes to Europe in cases associated with extreme precipitation.
The results presented here indicate that the intense synoptic processes that dominated a large area from the western tropical North Atlantic to the British Isles and Scandinavia in the North Atlantic during the first half (June–July) of the summer season may have played a significant role in determining the anomalous summer precipitation distribution in Europe in 2012. The main synoptic events that appear to have contributed to the anomalous summer precipitation characteristics include the formation of a deep cyclone near the British Isles around 8 June, which likely triggered subsequent processes, and the nearly simultaneous formation of two strong tropical systems: Hurricane Chris (18–22 June) and Tropical Storm Debby (23–27 June). The poleward trajectory of Storm Debby (and its remnants) suggests that this system [57] was a key driver of the intensity of extreme weather events in Europe in June and July 2012, as well as the anomalous summer precipitation pattern that year. This indicates that from mid-June to mid-July, the European region—from the northwestern regions to the northern Black Sea coast—was affected by post-tropical systems formed from the remnants of Tropical Storm Debby, whose development, in turn, was apparently influenced by the development of Hurricane Chris.
It is highly possible that the impact was associated at least partly with intense direct long-range air-mass transport [63,67,68]. According to the data available, it may be hypothesized that the whole process was triggered by the formation [16,18,72] of a deep cyclonic system near to the British Islands and Scandinavia on about 7–8 June (possibly as a result of the record low level of Arctic sea ice, which apparently was a consequence of climate change). Based on the above, we conclude that the sharp contrasts in precipitation anomalies over Europe in the summer of 2012 manifested the role of an influence of Atlantic tropical cyclones on European summer climate [57] and precipitation formation in Europe [21,73,74]. The development of the process that caused the floods in Europe in June–July 2012 may indicate an increasing dependence of the European climate on the intensity of synoptic processes in the tropical Atlantic Ocean, as well as the possibility of similar events recurring in the future [75,76,77,78,79].
8. Conclusions
It may be concluded that the timings of the events, with torrential rains and catastrophic floods on 13–15 June 2012 in Netherlands, the unprecedented storm in England on 28 June, torrential rains and devastating floods on 5–7 July in various districts of the United Kingdom, the Netherlands, Sweden and Estonia, as well as disastrous floods on 6–7 July (among them disastrous floods in the town of Krymsk) in the northern Black Sea coastal area of Russia, are fully consistent with the presented results of trajectory computations. This indicates that all these catastrophic events of the summer of 2012 have apparently resulted from the fact that during the period, the European continent was both directly and indirectly hit by the North Atlantic remnants of Chris and Debby.
The unprecedented amounts of precipitation during the events allow a suggestion that the abnormal character of the summer precipitation in western Europe during the summer of 2012 has been largely a consequence of the fact that during the first part of the season, high amounts of very moist air of tropical origin collected by Debby were exported to Europe and further to the East. The development of the process that caused the floods in Europe in June–July 2012 may indicate an increasing dependence of the European climate on the intensity of synoptic processes in the tropical Atlantic Ocean in response to the effects of the global warming, as well as the possibility of similar events recurring in the future [75,76,77,78,79,80]. Identification of the facts appears to be important for a better understanding of the regional trends in precipitation.
Although this finding means that the catastrophic precipitation events that occurred in several areas in Europe during the period under consideration could likely have been predicted in advance, this aspect of the problem was not addressed in the study. At the current state of scientific research, the response to climate change of the Europe-impacting post-tropical cyclones and their dependency on the tropical sources of water vapor is uncertain [57,72,78,81]. The results presented do not allow a definite conclusion on the source of rainwater which fell in Europe during the hazardous precipitation events in Europe discussed above. Further research with the use of weather prediction and climate models able to simulate strong tropical cyclones would be required to confidently assert if the abnormal character of the 2012 summer precipitation in Europe was a consequence of an accidental composition of synoptic processes or if there was a known permanently acting physical factor responsible. In conclusion, it may also be noted that this factor possibly at least partly also played a role in the other also unprecedented extreme precipitation events registered during the subsequent 10–15 days over the territory of the Altai Mountains in Russia [82,83], on 11–14 July in Yame, Fukuoka (33.2° N, 130.5° E), Japan [84,85], and on 21–22 July in China, when Beijing (39.9° N, 116.4° E) received a regionally averaged total precipitation of 190.3 mm, and the center of the rainfall event received 460.0 mm; the observations of 11 stations broke the historical records. Overall, the flooding event resulted in 79 fatalities and around $1.6 billion in damages [86,87,88]. Although the period from 8 July to 22 July has not been considered here, in accordance with the results of the earlier analyses (e.g., [89,90,91]), it appears reasonable to expect a role of the Atlantic storm moisture in these Eurasian extreme precipitation events also. Additional analyses are required for convincing confirmation or rejection of the hypothesis.
Funding
This research received no external funding.
Data Availability Statement
Multi-year twentieth century (20CRV3) reanalysis version 3 (20CRv3) data with a spatial resolution of 1.0 degree are available at https://psl.noaa.gov/data/composites/subdaily_20thc/details.html (accessed on 29 September 2026). The NOAA Global Data Assimilation System (GDAS) with a spatial resolution of 0.5° × 0.5° are available from the NOAA Air Resources Laboratory (ARL) HYSPLIT transport and dispersion model at its READY website (https://www.ready.noaa.gov (accessed on 29 September 2026)). British Met Office analysis SLP maps from the Deutsche Wetterdienst data archive are available at https://www.wetter3.de/archivukmetdt.html (accessed on 29 September 2026).
Acknowledgments
The author gratefully acknowledges the NOAA Air Resources Laboratory (ARL) for the provision of the HYSPLIT transport and dispersion model and/or READY website (https://www.ready.noaa.gov (accessed on 29 September 2026)) used in this publication and the National Weather Service Global Data Assimilation System (GDAS) data (GDASDOC/NOAA/NWS/NCEP/EMC Environmental Modeling Center, National Centers for Environmental Prediction, National Weather Service, NOAA, U.S. Department of Commerce). He also gratefully acknowledges the use of data from the NOAA-CIRES-DOE Twentieth Century reanalysis Project version 3 archive, which utilizes the resources of the National Energy Research Scientific Computing Center, managed by Lawrence Berkeley National Laboratory, funded by the Office of Science of the U.S. Department of Energy under Contract No. DE-AC02–05CH11231 and utilizes the resources of the NOAA’s Remotely Deployed High-Performance Computing Systems. The Twentieth Century reanalysis project version 3 dataset is funded by the U.S. Department of Energy, Office of Science Biological and Environmental Research (BER), the National Oceanic and Atmospheric Administration Climate Program Office, and the NOAA Earth System Research Laboratory Physical Sciences Laboratory. This work uses figures prepared using a system developed at the NOAA Physical Sciences Laboratory, Boulder, Colorado, from their website at https://psl.noaa.gov (accessed on 29 September 2026). The author also thanks the Deutsche Wetterdienst for providing the 6-hourly British Met Office analysis data at https://www.wetter3.de/archivukmetdt.html (accessed on 29 September 2026) and acknowledges the use of an AI-based language model (DeepSeek-V4.1-Flash) during a preliminary stage of analyzing Hovmöller diagrams. The author is grateful to the Editor and the three anonymous reviewers whose recommendations improved this paper.
Conflicts of Interest
The author declares no conflict of interests.
References
- Blunden, J.; Arndt, D.S. (Eds.) State of the Climate in 2012. Bull. Am. Meteorol. Soc. 2013, 94, S1–S238. [Google Scholar]
- WMO. WMO Statement on the Status of the Global Climate in 2012; WMO-No. 1108; World Meteorological Organization: Geneva, Switzerland, 2013; 33p. [Google Scholar]
- Parry, S.; Marsh, T.; Kendon, M. 2012: From Drought to Floods in England and Wales. Weather 2013, 68, 268–274. [Google Scholar] [CrossRef] [Scilit]
- Kendon, M.; Marsh, T.; Parry, S. The 2010–2012 Drought in England and Wales. Weather 2013, 68, 88–95. [Google Scholar] [CrossRef] [Scilit]
- Marsh, T.J.; Parry, S.; Kendon, M.C.; Hannaford, J. The 2010-12 Drought and Subsequent Extensive Flooding; Centre for Ecology & Hydrology: Oxfordshire, UK, 2013; 54p. [Google Scholar]
- Mühr, B.; Ehmann, C.; Bissolli, P.; Obregón, A.; Nitsche, H.; Parker, D. Middle East, in State of the Climate in 2012. Bull. Am. Meteorol. Soc. 2013, 94, S171–S180. [Google Scholar]
- Wilcox, L.J.; Yiou, P.; Hauser, M.; Lott, F.C.; van Oldenborgh, G.J.; Colfescu, I.; Dong, B.; Hegerl, G.; Shaffrey, L.; Sutton, R. Multiple Perspectives on the Attribution of the Extreme European Summer of 2012 to Climate Change. Clim. Dyn. 2017, 50, 3537–3555. [Google Scholar] [CrossRef] [Scilit]
- Rowell, D.P.; Jones, R.G. Causes and Uncertainty of Future Summer Drying over Europe. Clim. Dyn. 2006, 27, 281–299. [Google Scholar] [CrossRef] [Scilit]
- Rowell, D.P. Sources of Uncertainty in Future Changes in Local Precipitation. Clim. Dyn. 2011, 39, 1929–1950. [Google Scholar] [CrossRef] [Scilit]
- Boé, J.; Terray, L.; Cassou, C.; Najac, J. Uncertainties in European Summer Precipitation Changes: Role of Large-Scale Circulation. Clim. Dyn. 2008, 33, 265–276. [Google Scholar] [CrossRef] [Scilit]
- Steensen, B.M.; Myhre, G.; Byrom, R.; Gjermundsen, A.; Jouan, C.; Stjern, C.W. European Summer Precipitation. Atmos. Chem. Phys. 2026, 26, 2041–2054. [Google Scholar] [CrossRef] [Scilit]
- Chan, W.C.H.; Shepherd, T.G.; Facer-Childs, K.; Darch, G.; Arnell, N.W. Storylines of UK Drought Based on the 2010–2012 Event. Hydrol. Earth Syst. Sci. 2022, 26, 1755–1777. [Google Scholar] [CrossRef] [Scilit]
- Deng, K.-Q.; Azorin-Molina, C.; Yang, S.; Hu, C.-D.; Zhang, G.-F.; Minola, L.; Vicente-Serrano, S.; Chen, D. Shifting of Summertime Weather Extremes in Western Europe During 2012–2020. Adv. Clim. Change Res. 2022, 13, 218–227. [Google Scholar] [CrossRef] [Scilit]
- Peterson, T.C.; Hoerling, M.P.; Stott, P.A.; Herring, S. (Eds.) Explaining Extreme Events of 2012 from a Climate Perspective. Bull. Am. Meteorol. Soc. 2013, 94, S1–S74. [Google Scholar]
- Tett, S.F.B.; Deans, K.; Mazza, E.; Mollard, J. Are recent wet northwestern European summers a response to sea ice retreat? Bull. Am. Meteorol. Soc. 2013, 94, S32–S35. [Google Scholar]
- Screen, J.A. Influence of Arctic sea ice on European summer precipitation. Environ. Res. Lett. 2013, 8, 04401. [Google Scholar] [CrossRef] [Scilit]
- Sparrow, S.N.; Huntingford, C.; Massey, N.R.; Allen, M.R. The use of a very large atmospheric model ensemble to assess potential anthropogenic influence on the UK summer 2012 high rainfall totals. Bull. Am. Meteorol. Soc. 2013, 94, S36–S38. [Google Scholar]
- Yiou, P.; Cattiaux, J. Contribution of atmospheric circulation to wet north European summer of 2012. Bull. Amer. Meteorol. Soc. 2013, 94, S39–S41. [Google Scholar]
- Otto, F.E.L.; Rosier, S.M.; Allen, M.R.; Massey, N.R.; Rye, C.J.; Quintana, J.I. Attribution Analysis of High Precipitation Events in Summer in England and Wales over the Last Decade. Clim. Change 2014, 132, 77–91. [Google Scholar] [CrossRef] [Scilit][Green Version]
- Dong, B.; Sutton, R.T.; Shaffrey, L.; Wilcox, L.J. Attribution of 2012 Extreme Climate Events: Does Air-Sea Interaction Matter? Clim. Dyn. 2020, 55, 1225–1245. [Google Scholar] [CrossRef] [Scilit]
- Dong, B.; Sutton, R.T.; Woollings, T.; Hodges, K. Variability of the North Atlantic Summer Storm Track: Mechanisms and Impacts on European Climate. Environ. Res. Lett. 2013, 8, 034037. [Google Scholar] [CrossRef] [Scilit]
- Folland, C.K.; Knight, J.; Linderholm, H.W.; Fereday, D.; Ineson, S.; Hurrell, J.W. The Summer North Atlantic Oscillation: Past, Present, and Future. J. Clim. 2009, 22, 1082–1103. [Google Scholar] [CrossRef] [Scilit]
- Dong, B.; Sutton, R.; Woollings, T. The extreme European summer 2012. Bull. Amer. Meteorol. Soc. 2013, 94, S28–S31. [Google Scholar]
- Zhang, R.; Knutson, T.R. The role of global climate change in the extreme low summer Arctic sea ice extent in 2012. Bull. Amer. Meteorol. Soc. 2013, 9, S23–S26. [Google Scholar]
- Simpson, I.; Hanna, E.; Baker, L.; Sun, Y.; Wei, H.L. North Atlantic Atmospheric Circulation Indices: Links with Summer and Winter Temperature and Precipitation in North-West Europe, Including Persistence and Variability. Int. J. Climatol. 2024, 44, 902–922. [Google Scholar] [CrossRef] [Scilit]
- NOAA National Centers for Environmental Information. Monthly Synoptic Discussion for June 2012. 2012. Available online: https://www.ncei.noaa.gov/access/monitoring/monthly-report/synoptic/201206 (accessed on 29 September 2026).
- Volosciuk, C.; Maraun, D.; Semenov, V.A.; Tilinina, N.; Gulev, S.K.; Latif, M. Rising Mediterranean Sea Surface Temperatures Amplify Extreme Summer Precipitation in Central Europe. Sci. Rep. 2016, 6, 32450. [Google Scholar] [CrossRef] [Scilit] [PubMed]
- Avsar, N.B.; Jin, S.; Kutoğlu, Ş.H. Interannual Variations of Sea Surface Temperature in the Black Sea. In Proceedings of the IGARSS 2018-2018 IEEE International Geoscience and Remote Sensing Symposium, Valencia, Spain, 22–27 July 2018; pp. 5617–5620. [Google Scholar] [CrossRef] [Scilit]
- Sacu, S.; Sen, O.; Erdik, T.; Ozturk, I. Sea surface temperature and marine heatwave variability in interconnected basins: The Black-Marmara-Aegenean Seas. Dyn. Atmos. Ocean. 2025, 110, 101555. [Google Scholar] [CrossRef] [Scilit]
- Wen, Z.; Saemian, P.; Xu, F.; Sun, W.; Tourian, M.J. Black Sea Level Variability and Its Driving Factors in the Last Two Decades. Geophys. J. Int. 2025, 243, ggaf316. [Google Scholar] [CrossRef] [Scilit]
- Meredith, E.P.; Maraun, D.; Semenov, V.A.; Park, W. Evidence for added value of convection-permitting models for studying changes in extreme precipitation. J. Geophys. Res. Atmos. 2015, 120, 12500–12513. [Google Scholar] [CrossRef] [Scilit]
- Meredith, E.P.; Semenov, V.A.; Maraun, D.; Park, W.; Chernokulsky, A.V. Crucial role of Black Sea warming in amplifying the 2012 Krymsk precipitation extreme. Nat. Geosci. 2015, 8, 615–619. [Google Scholar] [CrossRef] [Scilit]
- Polonskii, A.B.; Serebrennikov, A.N. Formation of Positive Sea Surface Temperature Anomalies in the Black Sea. Russ. Meteorol. Hydrol. 2024, 49, 212–220. [Google Scholar] [CrossRef] [Scilit]
- Siegel, H.; Gerth, M. Development of sea surface temperature (SST) in the Baltic Sea 2012. In HELCOM Baltic Sea Environment Fact Sheet; Leibniz Institute for Baltic Sea Research Wartemude: Rostock, Germany, 2013. [Google Scholar]
- Xue, Y.; Hu, Z.; Kumar, A.; Banzon, V.; Smith, T.M.; Rayner, N.A. 2012 State of the Climate: Sea Surface Temperature. Bull. Am. Meteorol. Soc. 2013, 94, S47–S50. [Google Scholar]
- D’Andrea, F.; Duvel, J.P.; Rivière, G.; Vautard, R.; Cassou, C.; Cattiaux, J.; Coumou, D.; Faranda, D.; Happé, T.; Jézéquel, A.; et al. Summer Deep Depressions Increase Over the Eastern North Atlantic. Geophys. Res. Lett. 2024, 51, e2023GL104435. [Google Scholar] [CrossRef] [Scilit]
- Johnson, S.E.A.; Ye, H.; Fetzer, E.J.; Li, J. Satellite-Observed Precipitation and Total Column Water Vapor. Front. Environ. Sci. 2024, 12, 1338678. [Google Scholar] [CrossRef] [Scilit]
- Hovmöller, E. The Trough-and-Ridge Diagram. Tellus 1949, 1, 62–66. [Google Scholar] [CrossRef] [Scilit]
- Slivinski, L.C.; Compo, G.P.; Sardeshmukh, P.D.; Whitaker, J.S.; McColl, C.; Allan, R.J.; Brohan, P.; Yin, X.; Smith, C.A.; Spencer, L.J.; et al. An Evaluation of the Performance of the Twentieth Century Reanalysis Version 3. J. Clim. 2021, 34, 1417–1438. [Google Scholar] [CrossRef] [Scilit]
- Rolph, G.; Stein, A.; Stunder, B. Real-Time Environmental Applications and Display sYstem: READY. Environ. Model. Softw. 2017, 95, 210–228. [Google Scholar] [CrossRef] [Scilit]
- Stein, A.F.; Draxler, R.R.; Rolph, G.D.; Stunder, B.J.B.; Cohen, M.D.; Ngan, F. NOAA’s HYSPLIT Atmospheric Transport and Dispersion Modeling System. Bull. Am. Meteorol. Soc. 2015, 96, 2059–2077. [Google Scholar] [CrossRef] [Scilit]
- Draxler, R.R. Evaluation of an Ensemble Dispersion Calculation. J. Appl. Meteorol. Climatol. 2003, 42, 308–317. [Google Scholar] [CrossRef] [Scilit]
- Achberger, C.; Mühr, B.; Ehmann, C.; Bissolli, P.; Parker, D.; Kennedy, J. [Regional climate] Scandinavian and Baltic countries [in “State of the Climate 2012”]. Bull. Am. Meteorol. Soc. 2013, 94, S175–S176. [Google Scholar]
- Webb, S.D. Heavy rainfall in and around Aberystwyth on 8-9 June 2012. Weather 2013, 68, 162–165. [Google Scholar] [CrossRef] [Scilit]
- de Feiter, V.S.; Strickland, J.M.I.; Garcia-Marti, I. Advancing Data Quality Assurance with Machine Learning: A Case Study on Wind Vane Stalling Detection. Atmosphere 2025, 16, 129. [Google Scholar] [CrossRef] [Scilit]
- Clark, M.R.; Webb, J.D.C. A Severe Hailstorm across the English Midlands on 28 June 2012. Weather 2013, 68, 284–291. [Google Scholar] [CrossRef] [Scilit]
- Almond, C. Heavy rain and flooding in southwest England on 6–7 July 2012 Weather–July 2013. Weather 2013, 68, 171–175. [Google Scholar] [CrossRef] [Scilit]
- Bulygina, O.N.; Korshunova, N.N.; Razuvayev, V.N. [Regional climates] Russia [«Climate conditions in 2012»]. Bull. Am. Meteorol. Soc. 2013, 94, S184–S187. [Google Scholar]
- Kotlyakov, V.M.; Desinov, L.V.; Dolgov, S.V.; Koronkevich, N.I.; Likhacheva, E.A.; Makkaveev, A.N.; Medvedev, A.A.; Rudakov, V.A. Flooding of July 6–7, 2012, in the Town of Krymsk. Reg. Res. Russ. 2013, 3, 32–39. [Google Scholar] [CrossRef] [Scilit]
- Stewart, S.R. Tropical Cyclone Report Hurricane Chris (AL032012) 18–22 June 2012 National Hurricane Center, 2012, 16p. Available online: https://www.nhc.noaa.gov/data/tcr/AL032012_Chris.pdf (accessed on 29 September 2026).
- Maier-Gerber, M.; Riemer, M.; Fink, A.H.; Knippertz, P.; Di Muzio, E.; McTaggart-Cowan, R. Tropical Transition of Hurricane Chris (2012) over the North Atlantic Ocean: A Multiscale Investigation of Predictability. Mon. Weather Rev. 2019, 147, 951–970. [Google Scholar] [CrossRef] [Scilit]
- Bell, G.; Goldenberg, S.; Blake, E.; Landsea, C.; Schemm, J.; Pasch, R.; Kimberlain, T. The 2012 North Atlantic Hurricane Season a Climate Perspective; Climate Prediction Center/NOAA/NWS/NCEP: Riverdale Park, MD, USA, 2013; 13p. [Google Scholar]
- Kimberlain, T.B. Tropical Storm Debby (AL042012) 23–27 June 2012 National Hurricane Center Tropical Cyclone Report. 7 January 2013; 51p. Available online: http://www.nhc.noaa.gov/data/tcr/AL042012_Debby.pdf (accessed on 29 September 2026).
- Ray, E.; Rosenlof, K.H. Hydration of the upper troposphere by tropical cyclones. J. Geophis. Res. 2007, 112, D12311. [Google Scholar] [CrossRef] [Scilit]
- Pérez–Alarcón, A.; Coll-Hidalgo, P.; Fernández–Alvarez, J.C.; Sorí, R.; Nieto, R. Moisture Sources for Precipitation Associated with Major Hurricanes During 2017 in the North Atlantic Basin. J. Geophys. Res. Atmos. 2022, 127, e2021JD035554. [Google Scholar] [CrossRef] [Scilit]
- Powell, C.W.; Haynes, P.H.; Ming, A.D.; Taylor, J.R. Moisture Transport by Convective Overshoots in the Tropical Tropopause Layer. Weather 2025, 80, 206–213. [Google Scholar] [CrossRef] [Scilit]
- Sainsbury, E.M.; Schiemann, R.K.H.; Hodges, K.I.; Baker, A.J.; Shaffrey, L.C.; Bhatia, K.T. Why Do Some Post-Tropical Cyclones Impact Europe? Mon. Weather Rev. 2022, 150, 2553–2571. [Google Scholar] [CrossRef] [Scilit]
- Krichak, S.O.; Alpert, P.; Dayan, M. The role of atmospheric processes associated with Hurricane Olga in the December 2001 floods in Israel. J. Hydrometeorol. 2004, 5, 1259–1270. [Google Scholar] [CrossRef] [Scilit][Green Version]
- Krichak, S.O.; Alpert, P.; Dayan, M. An evaluation of the role of Hurricane Olga (2001) in an extreme rainy event in Israel using dynamic tropopause map. Meteorog. Atmos. Phys. 2006, 98, 35–53. [Google Scholar] [CrossRef] [Scilit]
- Krichak, S.O.; Feldstein, S.B.; Alpert, P.; Gualdi, S.; Scoccimarro, E.; Yano, J.-I. Discussing the role of tropical and subtropical moisture sources in cold season extreme precipitation events in the Mediterranean region from a climate change perspective. Nat. Hazards Earth Syst. Sci. 2016, 16, 269–285. [Google Scholar] [CrossRef] [Scilit]
- Lavers, D.A.; Villarini, G. The nexus between atmospheric rivers and extreme precipitation across Europe. Geophys. Res. Lett. 2013, 40, 3259–3264. [Google Scholar] [CrossRef] [Scilit]
- Kamae, Y.; Imada, Y.; Kawase, H.; Mei, W. Atmospheric Rivers Bring More Frequent and Intense Extreme Rainfall Events Over East Asia Under Global Warming. Geophys. Res. Lett. 2021, 48, e2021GL096030. [Google Scholar] [CrossRef] [Scilit]
- Stoffels, R.; Benedict, I.; Papritz, L.; Selten, F.; Weijenborg, C. Precipitation, Moisture Sources and Transport Pathways Associated with Summertime North Atlantic Deep Cyclones. Weather Clim. Dyn. 2025, 6, 1743–1768. [Google Scholar] [CrossRef] [Scilit]
- Yano, J.I.; Martínez-Alvarado, O. Co-Development of a Cyclone Family and an Atmospheric River over the North Atlantic: A Synoptic Evolution with Associated Moisture Transports. Weather 2025, 80, 376–386. [Google Scholar] [CrossRef] [Scilit]
- Liu, T.; Chen, Y.; Chen, S.; Li, W.; Zhang, A. Mechanisms of the Transport Height of Water Vapor by Tropical Cyclones on Heavy Rainfall. Weather Clim. Extrem. 2023, 41, 100587. [Google Scholar] [CrossRef] [Scilit]
- Draxler, R.R. The Use of Global and Mesoscale Meteorological Model Data to Predict the Transport and Dispersion of Tracer Plumes over Washington, D.C. Weather Forecast 2006, 21, 383–394. [Google Scholar] [CrossRef] [Scilit]
- Wypych, A.; Bochenek, B.; Rózycki, M. Atmospheric Moisture Content over Europe and the Northern Atlantic. Atmosphere 2018, 9, 18. [Google Scholar] [CrossRef] [Scilit]
- Spensberger, C.; Konstali, K.; Spengler, T. Moisture Transport Axes: A Unifying Definition for Tropical Moisture Exports, Atmospheric Rivers, and Warm Moist Intrusions. Weather Clim. Dyn. 2025, 6, 431–446. [Google Scholar] [CrossRef] [Scilit]
- Champion, A.J.; Blenkinsop, S.; Li, X.F.; Fowler, H.J. Synoptic-Scale Precursors of Extreme U.K. Summer 3-Hourly Rainfall. J. Geophys. Res. Atmos. 2019, 124, 4477–4489. [Google Scholar] [CrossRef] [Scilit] [PubMed]
- Dickinson, T.A.; Richman, M.B.; Furtado, J.C. Subseasonal-to-Seasonal Extreme Precipitation Events in the Contiguous United States: Generation of a Database and Climatology. J. Clim. 2021, 34, 7571–7586. [Google Scholar] [CrossRef] [Scilit]
- Schroers, M.A.; Martin, E. Verification of Atmospheric Variables in S2S Project Models during Extended Extreme Precipitation Events. Weather Forecast. 2026, 41, 3–21. [Google Scholar] [CrossRef] [Scilit]
- Feldmann, M.; Domeisen, D.I.V.; Martius, O. A Pan-European Analysis of Large-Scale Drivers of Severe Convective Outbreaks. Weather Clim. Dyn. 2025, 6, 1089–1106. [Google Scholar] [CrossRef] [Scilit]
- Chan, K.T.F.; Chan, J.C.L. Tropical cyclone recurvature: An intrinsic property? Geophys. Res. Lett. 2016, 43, 8769–8774. [Google Scholar] [CrossRef] [Scilit]
- Pohorsky, R.; Röthlisberger, M.; Grams, C.M.; Riboldi, J.; Martius, O. The Climatological Impact of Recurving North Atlantic Tropical Cyclones on Downstream Extreme Precipitation Events. Mon. Weather Rev. 2019, 147, 1513–1532. [Google Scholar] [CrossRef] [Scilit]
- Haarsma, R.J.; Hazeleger, W.; Severijns, C.; de Vries, H.; Ster, A.; Bintanja, R.; van Oldenborgh, G.J.; van den Brink, H.W. More hurricanes to hit western Europe due to global warming. Geophys. Res. Lett. 2013, 40, 1783–1788. [Google Scholar] [CrossRef] [Scilit]
- Hawcroft, M.; Walsh, E.; Hodges, K.; Zappa, D. Significantly increased extreme precipitation expected in Europe and North America from extratropical cyclones. Environ. Res. Lett. 2018, 13, 124006. [Google Scholar] [CrossRef] [Scilit]
- Gimeno-Sotelo, L.; Fernández-Alvarez, J.C.; Nieto, R.; Vicente-Serrano, S.M.; Gimeno, L. The Increasing Influence of Atmospheric Moisture Transport on Hydrometeorological Extremes in the Euromediterranean Region with Global Warming. Commun. Earth Environ. 2024, 5, 604. [Google Scholar] [CrossRef] [Scilit]
- Gimeno-Sotelo, L.; Gimeno, L. Concurrent Extreme Events of Atmospheric Moisture Transport and Continental Precipitation: The Role of Landfalling Atmospheric Rivers. Atmos. Res. 2022, 278, 106356. [Google Scholar] [CrossRef] [Scilit]
- Ng, K.S.; Bianco, E.; Hodges, K.; Leckebusch, G.C. Is Europe under UNSEEN risk of cyclones of tropical origin? Geophys. Res. Lett. 2026; in press. [CrossRef] [Scilit]
- Groisman, P.Y.; Knight, R.W.; Easterling, D.R.; Karl, T.R.; Hegerl, G.C.; Razuvaev, V.N. Trends in intense precipitation in the climate record. J. Clim. 2005, 18, 1326–1350. [Google Scholar] [CrossRef] [Scilit]
- Baker, A.J.; Hodges, K.I.; Schiemann, R.K.H.; Vidale, P.L. Historical variability and lifecycles of North Atlantic midlatitude cyclones originating in the tropics. J. Geophys. Res. Atmos. 2021, 126, e2020JD033924. [Google Scholar] [CrossRef] [Scilit]
- Pryakhina, G.; Rasputina, V.; Svirepov, S. Modelling of a Lake Outburst as a Result of the Development of Piping. Water 2024, 16, 1379. [Google Scholar] [CrossRef] [Scilit]
- Rasputina, V.A.; Pryakhina, G.V.; Ganyushkin, D.A.; Bantcev, D.V.; Griga, S.A.; Svirepov, S.S. The Outburst of Dammed Lake Maashey (North-Chuya Ridge, Central Altai). Ice Snow 2024, 64, 189–201. [Google Scholar] [CrossRef] [Scilit]
- Imada, Y.; Watanabe, M.; Mori, M.; Kimoto, M.; Shiogama, H.; Ishii, M. 2013: Contribution of atmospheric circulation change to the heavy rainfall in southwestern Japan. Bull. Amer. Meteorol. Soc. 2013, 94, S51–S55. [Google Scholar]
- Duan, W.; He, B.; Takara, K.; Luo, P.; Nover, D.; Yamashiki, Y.; Huang, W. Anomalous Atmospheric Events Leading to Kyushu’s Flash Floods, July 11–14, 2012. Nat. Hazards 2014, 73, 1255–1267. [Google Scholar] [CrossRef] [Scilit]
- Wang, K.; Wang, L.; Wei, Y.-M.; Ye, M. Beijing Storm of July 21, 2012: Observations and Reflections. Nat. Hazards 2013, 67, 969–974. [Google Scholar] [CrossRef] [Scilit]
- Zhang, Y.; Hong, Y.; Wang, X.; Gourley, J.J.; Xue, X.; Saharia, M.; Ni, G.; Wang, G.; Huang, Y.; Chen, S. Hydrometeorological Analysis and Remote Sensing of Extremes: Was the July 2012 Beijing Flood Event Detectable and Predictable by Global Satellite Observing and Global Weather Modeling Systems? J. Hydrometeorol. 2015, 16, 381–395. [Google Scholar] [CrossRef] [Scilit]
- Zhou, T.; Song, F.; Lin, R.; Chen, X.; Chen, X. The 2012 North China floods: Explaining an extreme rainfall event in the context of a longer-term drying tendency. Bull. Amer. Meteorol. Soc. 2013, 94, S49–S51. [Google Scholar]
- Dirmeyer, P.A.; Brubaker, K.L. Characterization of the Global Hydrologic Cycle from a Back-Trajectory Analysis of Atmospheric Water Vapor. J. Hydrometeorol. 2007, 8, 20–37. [Google Scholar] [CrossRef] [Scilit]
- Si, D.; Ding, Y. Oceanic Forcings of the Interdecadal Variability in East Asian Summer Rainfall. J. Clim. 2016, 29, 7633–7649. [Google Scholar] [CrossRef] [Scilit]
- Piao, J.; Chen, W.; Chen, S.; Gong, H.; Zhang, Q. Summer Water Vapor Sources in Northeast Asia and East Siberia Revealed by a Moisture-Tracing Atmospheric Model. J. Clim. 2020, 33, 3883–3899. [Google Scholar] [CrossRef] [Scilit]
Disclaimer/Publisher’s Note: The statements, opinions and data contained in all publications are solely those of the individual author(s) and contributor(s) and not of MDPI and/or the editor(s). MDPI and/or the editor(s) disclaim responsibility for any injury to people or property resulting from any ideas, methods, instructions or products referred to in the content. |
© 2026 by the author. Licensee MDPI, Basel, Switzerland. This article is an open access article distributed under the terms and conditions of the Creative Commons Attribution (CC BY) license.