


Abstract
Rainfed smallholder farming systems in semi-arid tropical climates are highly vulnerable to drought, threatening food security and rural livelihoods. This study evaluates drought variability, severity, and temporal periodicity from 1981 to 2021 across representative Sudano-Sahelian locations in the Centre-Est and Centre-Sud regions of Burkina Faso and the Upper East Region of Ghana. Monthly precipitation and temperature data were used to calculate the Standardized Precipitation–Evapotranspiration Index (SPEI) at 1-, 3-, 6-, and 12-month timescales. Continuous Wavelet Transform (CWT) was applied to identify recurrent drought periodicities, while temporal trend analysis and spatial interpolation assessed spatiotemporal variability. Drought frequency (months with SPEI < −0.5) ranged from 6% to 35%, while the spatial frequency of prolonged drought episodes lasting at least four consecutive months ranged from 11% to 39%. Wavelet analysis revealed dominant drought cycles between 15 and 64 months, together with shorter intra-seasonal oscillations. Seasonal analysis showed that drought also occurs during the wet season, coinciding with critical crop growth stages. Wet-season drought occurrence was slightly higher than dry-season occurrence, highlighting the potential for moisture deficits during critical crop growth periods. Integrating multi-timescale drought monitoring with periodicity analysis into early-warning systems can strengthen drought preparedness and support climate-resilient agricultural management in semi-arid West Africa.
1. Introduction
Climate change continues to exert profound economic and social impacts across Africa through its influence on hydroclimatic variability, agricultural productivity, and food security [1,2,3]. In tropical West Africa, rising temperatures, recurrent droughts, and increasing rainfall variability have intensified climate-related risks for rainfed smallholder farming systems, which constitute the primary livelihood for much of the rural population [4,5]. Although the impacts of climate change have been widely documented at continental and regional scales, considerable uncertainty remains regarding the temporal evolution and local characteristics of drought in data-scarce semi-arid environments, limiting the effectiveness of climate-risk assessment and agricultural decision-making [6,7].
Rainfall across West Africa is strongly controlled by the West African Monsoon system, resulting in a highly seasonal climate, with most precipitation occurring between July and September and peaking in August [8,9,10]. However, substantial spatial and interannual variability in monsoon onset, cessation, and rainfall distribution creates considerable uncertainty in the duration and reliability of the growing season [11]. These variations are further modulated by large-scale modes of climate variability, including the Atlantic Multidecadal Variability (AMV) and the El Niño–Southern Oscillation (ENSO), which influence monsoon intensity, rainfall distribution, and the occurrence of prolonged dry spells across the Sudano-Sahelian region [9,12].
Drought in West Africa results from the combined influence of precipitation deficits and increasing atmospheric evaporative demand associated with rising temperatures [13,14,15]. Recent studies demonstrate that continued warming has intensified drought conditions across the Sahel, even during years with near-normal rainfall, highlighting the limitations of precipitation-based drought assessments [13,14,15]. Consequently, agricultural droughts are increasingly governed by persistent soil moisture deficits resulting from the interaction between reduced precipitation and enhanced evapotranspiration rather than rainfall anomalies alone. This has strengthened the need for drought indicators that integrate both precipitation supply and atmospheric demand when evaluating drought dynamics in semi-arid climates [15,16].
Meteorological drought also plays a critical role in accelerating land degradation through reduced soil moisture availability, increased soil erosion, and declining ecosystem resilience. Across Sub-Saharan Africa, recurrent drought and rainfall variability have been identified as important drivers of land degradation, but sustainable land management practices can partially mitigate these impacts [17,18]. Improved characterization of drought variability is therefore essential for supporting sustainable land and water management and strengthening the resilience of rainfed agricultural systems.
Among the available drought indicators, the Standardized Precipitation–Evapotranspiration Index (SPEI) has become one of the most widely used because it integrates precipitation with atmospheric evaporative demand, providing a physically meaningful assessment of drought conditions across multiple accumulation timescales [16,19]. Short accumulation periods capture rapidly developing droughts that affect crop establishment and growth, whereas longer accumulation periods reflect persistent hydrological deficits [16,19]. However, droughts are not only characterized by their severity and duration but also by recurrent temporal behavior. Identifying these temporal periodicities is important for understanding drought recurrence and improving climate-risk forecasting. Continuous Wavelet Transform (CWT) analysis provides an effective framework for detecting dominant drought periodicities and their temporal evolution under non-stationary climatic conditions [20,21]. CWT was first applied independently to the SPEI-12 time series at each of the 16 representative meteorological data points to assess local spatial variability in drought periodicity. For the regional analysis, the monthly SPEI-12 values of the MDPs within each study region were averaged at each time step to construct one representative regional SPEI-12 series for the Upper East, Centre-Est, and Centre-Sud regions. CWT was then applied separately to these three regional series using the same wavelet settings and significance-testing procedure.
Despite the increasing application of SPEI for drought assessment in West Africa, important gaps remain in characterizing drought across multiple temporal dimensions. Previous applications have largely focused on drought magnitude, frequency, or spatial variability, while less attention has been given to the combination of multi-timescale drought assessment with the temporal recurrence of drought conditions. In particular, the integration of short- and long-timescale SPEI with wavelet-based identification of recurrent drought periodicities remains limited for transboundary Sudano-Sahelian agricultural regions. This limits understanding of whether drought conditions occur mainly as short-term seasonal fluctuations, prolonged episodes, or recurrent multi-annual patterns, and how these characteristics vary across locations within rainfed farming systems. We hypothesized that drought characteristics would vary across temporal scales and locations, with longer SPEI accumulation periods capturing more persistent drought conditions, and that drought occurrence would exhibit recurrent seasonal and multi-annual periodicities. Accordingly, this study aimed to (i) quantify long-term (1981–2021) drought variability and severity using SPEI at multiple timescales, (ii) assess the spatial and temporal distribution of drought events across representative locations in Burkina Faso and Ghana, and (iii) identify dominant drought periodicities using Continuous Wavelet Transform analysis. By integrating these complementary dimensions, the study provides a combined assessment of drought variability, persistence, spatial heterogeneity, and recurrence across the Burkina Faso–Ghana Sudano-Sahelian transition.
2. Materials and Methods
2.1. Study Area
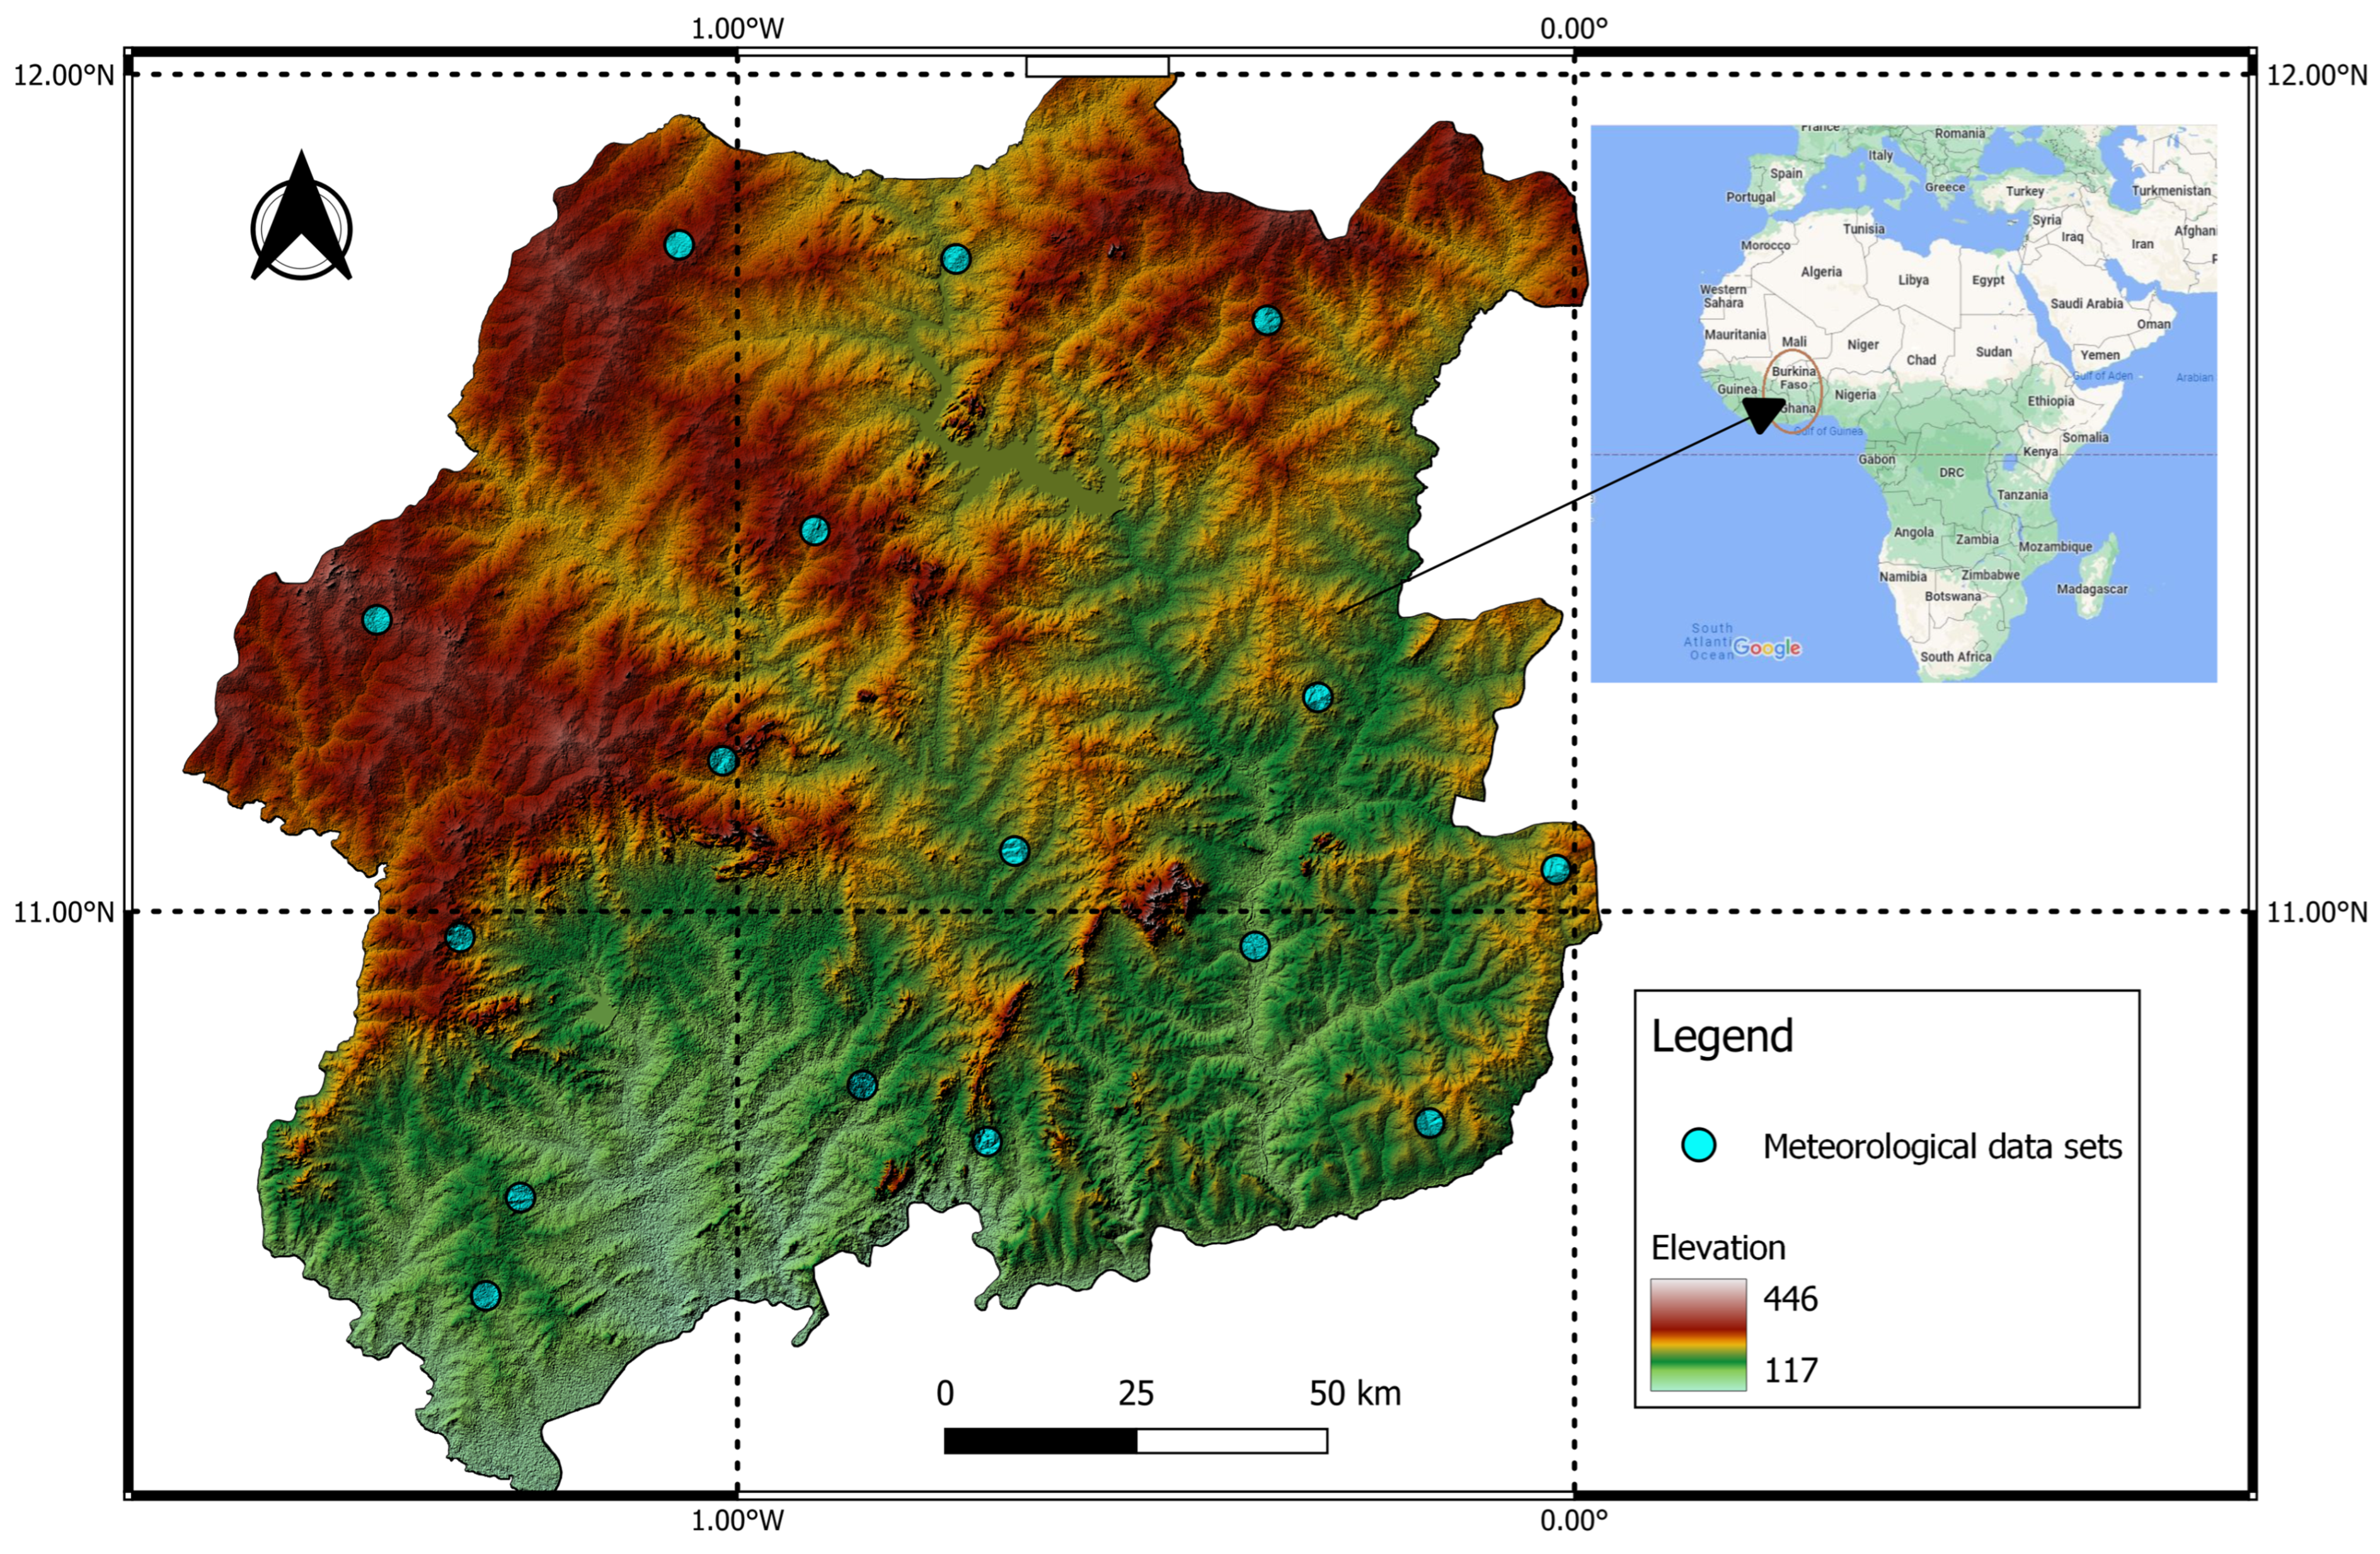
The study was conducted in the Centre-Est and Centre-Sud regions of Burkina Faso and the Upper East Region of Ghana, located within the Sudano-Sahelian climatic zone of West Africa, predominantly north of approximately 9° N [22] (Figure 1). The study area extends approximately from 10.54° to 11.80° N and from 1.43° W to 0.02° W longitude, encompassing a transboundary semi-arid corridor representative of the Sudano-Sahelian agroecological zone. Rather than covering the entire administrative regions, the analysis was based on 16 representative meteorological grid points distributed across the geographic extent of the three study regions to capture spatial variability in climatic conditions. Four points were located in Centre-Sud, four in Centre-Est, and eight in the Upper East Region of Ghana. Burkina Faso and Ghana were selected because the Centre-Est and Centre-Sud regions of Burkina Faso and the Upper East Region of Ghana form a contiguous transboundary Sudano-Sahelian corridor with comparable semi-arid climatic conditions and predominantly rainfed smallholder farming systems. The cross-border study area provides an opportunity to assess drought variability across a shared agroclimatic transition while capturing spatial differences in rainfall and drought behavior between northern Burkina Faso and northern Ghana.
Figure 1.
Location of the study regions and the 16 meteorological data points used in the analysis across the Upper East Region of Ghana and the Centre-Est and Centre-Sud regions of Burkina Faso. The enlarged symbols indicate the locations of the meteorological data points.
The climate is tropical semi-arid and characterized by a unimodal rainfall regime, with a rainy season extending from April to October and a dry season from November to March. Annual rainfall ranges from approximately 700 mm in the northern parts of the study area to about 1200 mm in the south, with pronounced interannual variability [10,11,23]. Mean annual potential evapotranspiration (PET) ranges from approximately 1800 to 2200 mm yr−1, frequently exceeding annual precipitation and resulting in persistent soil moisture deficits [5,24,25]. Daily maximum temperatures commonly exceed 35 °C during the pre-monsoon period (March–May), whereas minimum temperatures decline to approximately 18 °C during December and January.
Agriculture is predominantly rainfed, with more than 85% of households relying on crop and livestock production for their livelihoods [4,26]. The principal crops are sorghum, millet, maize, and groundnut, cultivated mainly on ferruginous tropical soils that are highly susceptible to erosion and nutrient depletion [18,27]. Livestock production, particularly cattle, goats, and sheep, provides an important source of income and helps buffer households against drought-related crop losses [28,29]. The combination of high climatic variability, limited irrigation infrastructure, and recurrent droughts makes the region highly vulnerable to land degradation and agricultural production risks, highlighting the importance of understanding multi-timescale drought dynamics to support climate-resilient agricultural management and drought adaptation strategies [4,5,30].
2.2. Data Sources
Monthly climate data spanning January 1981 to December 2021 were obtained from two complementary gridded datasets selected for their demonstrated reliability and suitability for climate monitoring in West Africa. Because no single dataset provides optimal performance for all meteorological variables, precipitation and temperature-related variables were obtained from different sources according to their documented strengths.
Monthly precipitation data were obtained from the Climate Hazards Group InfraRed Precipitation with Station (CHIRPS v2.0) data, which combines satellite-derived rainfall estimates with available ground-based observations at a spatial resolution of 0.05° (~5 km) [31]. Local meteorological station records from Burkina Faso and Ghana were reviewed; however, their spatial and temporal coverage was insufficient for long-term regional analysis. Consequently, CHIRPS v2.0 was adopted as the primary precipitation dataset. Previous evaluations have demonstrated that CHIRPS accurately represents monthly and seasonal rainfall variability across the Sahelian and Sudano-Sahelian regions and performs comparably to, or better than, other widely used satellite-based precipitation products [31,32,33].
Monthly maximum and minimum air temperature together with extraterrestrial radiation were obtained from the European Centre for Medium-Range Weather Forecasts (ECMWF) ERA5-Land reanalysis dataset, which provides physically consistent land-surface variables at a spatial resolution of 0.1° (~9 km) [34]. ERA5-Land was selected because of its temporal completeness, physical consistency, and suitability for evapotranspiration estimation.
Potential evapotranspiration (PET) was calculated from ERA5-Land maximum and minimum temperature and extraterrestrial radiation using the Hargreaves–Samani equation [35], a method widely applied in semi-arid environments where meteorological observations required for more complex evapotranspiration models are often unavailable. Recalculating PET ensured methodological consistency for the Standardized Precipitation–Evapotranspiration Index (SPEI) computation throughout the 1981–2021 study period. The Hargreaves–Samani method is temperature-based and does not account for humidity, wind speed, or actual radiation.
Climate data were extracted for sixteen representative meteorological grid points distributed across the Centre-Est and Centre-Sud regions of Burkina Faso and the Upper East Region of Ghana (Table 1). The points were selected to provide spatial coverage of climatic variability across the geographic extent of the three study regions, with four points in Centre-Sud, four in Centre-Est, and eight in the Upper East Region. The points were not linked to individual meteorological stations or arranged as a regular geometric grid; instead, the geographic coordinates listed in Table 1 define the specific locations used to extract data from the gridded CHIRPS and ERA5-Land datasets. Although CHIRPS and ERA5-Land are gridded datasets, analyses were conducted using data extracted from these representative grid-point locations. CHIRPS was used exclusively for precipitation, whereas ERA5-Land provided the temperature and radiation variables required for PET estimation and SPEI computation. Spatial interpolation was applied solely for visualization and mapping of drought characteristics and was not used to generate analytical inputs.
Table 1.
Geographic coordinates of the sixteen representative meteorological grid points (MDPs) used for climatic analyses across the Centre-Est and Centre-Sud regions of Burkina Faso and the Upper East Region of Ghana. Climate data were extracted from CHIRPS v2.0 and ERA5-Land at these locations.
2.3. Data Analysis
The climatic characteristics of the study area were assessed by analyzing long-term rainfall and temperature variability over the period 1981–2021. Interannual rainfall variability was first evaluated using the Rainfall Anomaly Index (RAI), which quantifies deviations of annual precipitation from the long-term mean according to:
where Pi is the annual precipitation in year i, is the long-term mean annual precipitation, is the mean of the ten highest annual precipitation values, and is the mean of the ten lowest annual precipitation values and i denotes the year of observation. The factor ±3 scales positive and negative anomalies separately following van Rooy [36]. while subsequent work has evaluated modified forms of the RAI for drought and precipitation-extreme assessment [37].
Interannual rainfall variability was further quantified using the coefficient of variation (CV):
where σ is the standard deviation of annual precipitation. Following commonly adopted climatological criteria, rainfall variability was classified as low ( < 20%), moderate (20% ≤ < 40%), or high ( ≥ 40%), Such climatic variability can have important implications for agricultural and water-resource systems [38].
Long-term trends in annual precipitation and temperature were evaluated using the non-parametric Mann–Kendall (MK) test together with Sen’s slope estimator [39]. Before assessing trend significance, lag-1 serial autocorrelation was examined for each annual time series because positive serial dependence can inflate the variance of the MK statistic and lead to overestimation of trend significance. The significance of lag-1 autocorrelation was evaluated at the 95% confidence level. For series showing significant serial dependence, an autocorrelation-adjusted MK procedure based on trend-free pre-whitening was applied, whereas series without significant serial autocorrelation were evaluated using the standard MK test. The same autocorrelation assessment and corresponding MK procedure were applied to the annual Rainfall Anomaly Index (RAI) series. Sen’s slope estimator was used to represent the direction and magnitude of the identified trends in the figures. All statistical analyses were performed in R statistical software (version 4.3.2). Meteorological drought conditions were quantified using the Standardized Precipitation–Evapotranspiration Index (SPEI), which incorporates both precipitation supply and atmospheric evaporative demand [16]. Potential evapotranspiration (PET) was estimated from ERA5-Land monthly maximum and minimum air temperature and extraterrestrial radiation using the Hargreaves–Samani equation:
where is the mean monthly air temperature (°C); and are the monthly maximum and minimum air temperatures (°C), respectively; and is extraterrestrial radiation (MJ m−2 day−1). The Hargreaves–Samani formulation is an empirical temperature-based approach in which extraterrestrial radiation represents the available energy associated with the astronomical position of the Earth, while the difference between maximum and minimum temperature provides an indirect indication of atmospheric drying conditions. The empirical coefficient in the formulation represents the calibrated relationship between these temperature and radiation terms and reference evapotranspiration under conditions where humidity, wind speed, and measured radiation are unavailable. Thus, the formulation provides a practical estimate of atmospheric evaporative demand using readily available temperature and radiation variables. Although ERA5-Land provides PET as a model output, PET was recalculated using the Hargreaves–Samani formulation to ensure methodological consistency throughout the 1981–2021 study period and to minimize uncertainties associated with land-surface parameterizations. This temperature-based approach is widely applied in semi-arid regions where humidity and wind-speed observations are limited [35]. The Hargreaves–Samani equation first provides PET in mm day−1. Monthly PET was obtained by multiplying the daily PET estimate by the number of days in each month.
Monthly climatic water balance () was calculated as:
where is the monthly climatic water balance (mm), is monthly precipitation (mm) and is monthly potential evapotranspiration (mm). The resulting climatic water-balance series was fitted to a log-logistic probability distribution using the L-moments method [40] to derive standardized SPEI values. SPEI was computed at 1-, 3-, 6-, and 12-month accumulation periods to characterize short-term agricultural drought, seasonal drought, and longer-term hydrological drought conditions.
Drought severity was classified following Yue et al. [41] as: no drought (SPEI > −0.5), mild drought (−1.0 ≤ SPEI ≤ −0.5), moderate drought (−1.5 ≤ SPEI < −1.0), severe drought (−2.0 ≤ SPEI < −1.5), and extreme drought (SPEI < −2.0). These categories were subsequently used to quantify drought frequency, severity, and intensity across all accumulation timescales. Drought months and drought events were distinguished in the analysis. A drought month was defined as an individual monthly SPEI value below the drought threshold. For event-based analysis, consecutive months meeting the drought criterion were treated as a single continuous drought event rather than as separate events. Each event was characterized by its duration (number of consecutive months), minimum SPEI value, and corresponding drought-severity class. This event-based definition was applied when identifying prolonged and severe-to-extreme drought episodes from the SPEI-12 series.
To assess whether drought frequency changed systematically over time, the annual proportion of drought conditions identified from SPEI-12 was calculated for each year of the study period. Drought frequency was defined as the proportion of annual SPEI-12 observations below the drought threshold (SPEI-12 < −0.5). The resulting annual drought-frequency series was evaluated using the Mann–Kendall test and Sen’s slope estimator at the 95% confidence level. This analysis was used to distinguish statistically significant long-term changes from interannual or episodic variations in drought occurrence. Seasonal and regional differences in drought occurrence were assessed using generalized estimating equations (GEEs) with a binomial distribution and logit link, accounting for repeated observations within locations. Season and region were included as explanatory factors, with interaction terms used to assess whether seasonal differences varied among regions. Statistical significance was evaluated at the 95% confidence level.
Spatial patterns of drought characteristics were mapped using the Inverse Distance Weighted (IDW) interpolation method implemented in ArcGIS Pro 3.2. IDW estimates values at unsampled locations as a weighted average of surrounding observations, with weights inversely proportional to the squared distance from the prediction location [42,43]. The method was selected because of its suitability for relatively sparse observation networks typical of semi-arid environments. Spatial interpolation was used exclusively for visualization of drought frequency, severity, and intensity and was not employed to generate analytical inputs. Because the interpolation was based on 16 representative grid points, the resulting continuous surfaces were interpreted as visual representations of broad spatial patterns rather than as independently validated estimates at unsampled locations.
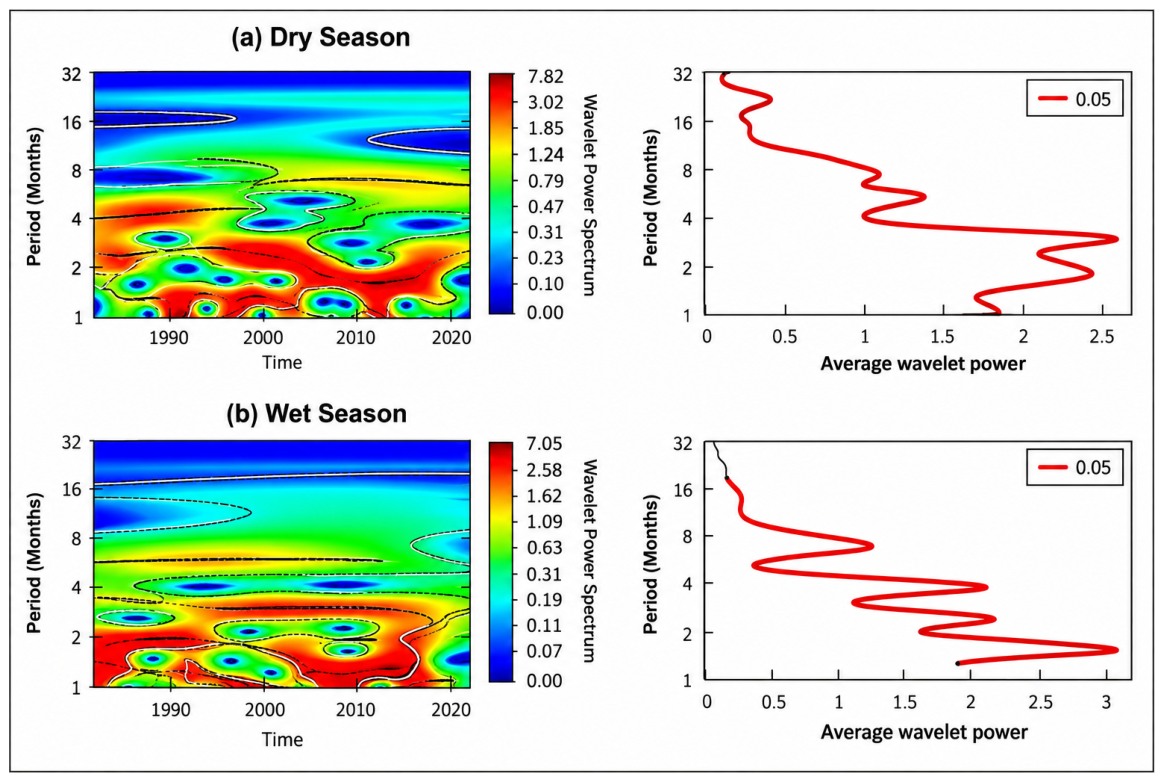
For the seasonal wavelet analysis, the monthly SPEI-3 series were divided into wet-season (April to October) and dry-season (November to March) observations. The corresponding monthly observations were extracted for each season and retained in chronological order before applying the continuous wavelet transform. Because the underlying SPEI-3 series had monthly temporal resolution, the resulting wavelet periods were expressed in months. Recurrent drought periodicities were investigated using Continuous Wavelet Transform (CWT) analysis applied to the 12-month SPEI time series at each meteorological grid point. CWT was selected instead of conventional Fourier spectral analysis because drought variability is potentially non-stationary, meaning that the dominant periodicities may change in strength and occurrence over time. Fourier analysis provides the frequency composition of the complete time series but does not retain the temporal location of individual oscillations. In contrast, CWT provides a time–frequency representation that allows the timing, persistence, and changes in strength of drought periodicities to be identified. This temporal localization was particularly important for distinguishing seasonal oscillations from intermittent multi-annual drought cycles during the 1981–2021 period. The Morlet wavelet was adopted as the mother wavelet following Torrence and Compo [21]. CWT decomposes the time series into time-frequency space, allowing for the identification of dominant periodicities and their temporal evolution under non-stationary climatic conditions. Statistical significance was evaluated against a red-noise background spectrum at the 95% confidence level following Fang et al. and Li et al. [20,44]. All wavelet analyses were performed using the WaveletComp package in R (version 1.1).
3. Results
3.1. Long-Term Climatic Trends (1981–2021)
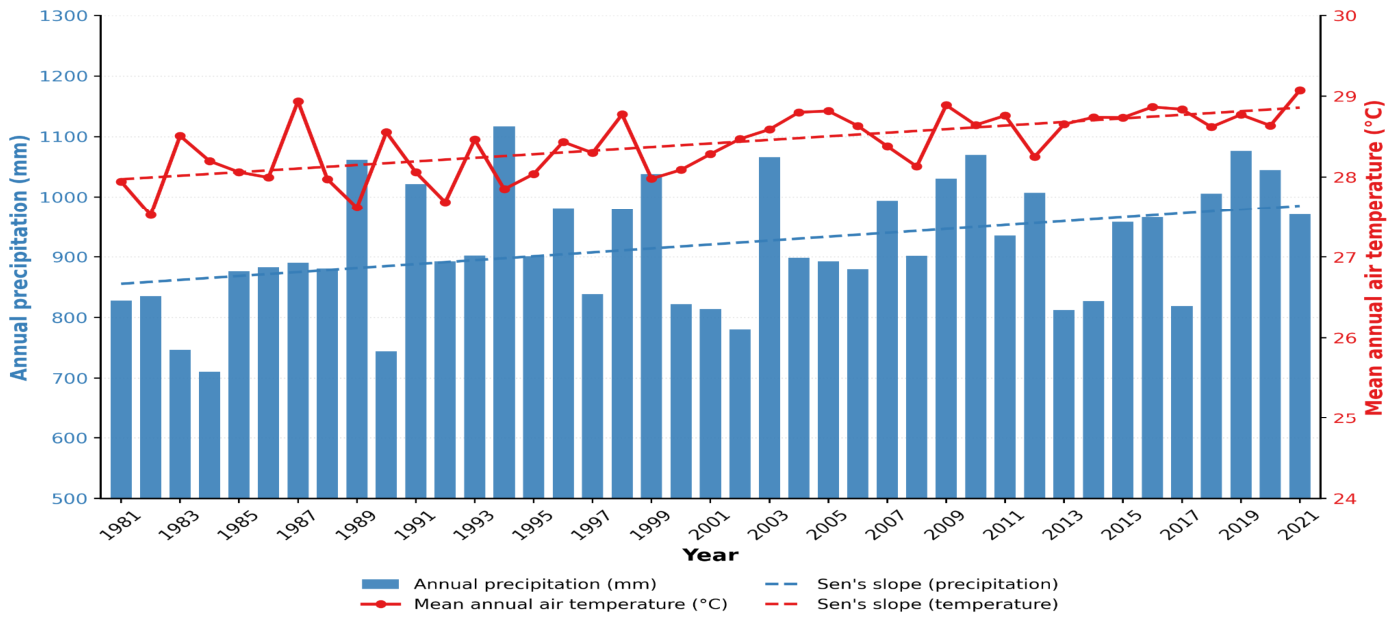
The long-term climatic record (1981–2021) for the Centre-Est and Centre-Sud regions of Burkina Faso and the Upper East Region of Ghana indicates pronounced interannual rainfall variability accompanied by a significant warming trend (Figure 2). Annual mean rainfall exhibited substantial year-to-year fluctuations, with notably wet years, including 1988, 1999, 2010, and 2018, exceeding the long-term mean by more than 20%, whereas dry years such as 1983, 2002, and 2013 recorded rainfall deficits exceeding 20%. At the decadal scale, severe rainfall deficits characterized the 1980s, followed by partial recovery during the 1990s and moderately wetter conditions after the mid-2000s, although considerable interannual variability persisted throughout the study period. These fluctuations are consistent with variations in the West African Monsoon system and the influence of large-scale climate modes, including the Atlantic Multidecadal Variability (AMV) and the El Niño–Southern Oscillation (ENSO) [9,16,33,45,46].
Figure 2.
Interannual variability in annual precipitation (blue bars) and mean annual air temperature (red line) across the Centre-Est and Centre-Sud regions of Burkina Faso and the Upper East Region of Ghana during 1981–2021. Dashed lines represent Sen’s slope estimates for annual precipitation and mean annual air temperature.
The annual rainfall series exhibited weak positive lag-1 autocorrelation (r1 = 0.097), which was not statistically significant (p = 0.550). Mean annual air temperature showed stronger positive lag-1 autocorrelation (r1 = 0.311), although this was also marginally non-significant at the 95% confidence level (p = 0.051). Thus, neither annual rainfall nor temperature exhibited statistically significant serial dependence during the 1981–2021 period.
Trend analysis indicated a statistically significant positive trend in annual rainfall (Sen’s slope = +3.24 mm yr−1; z = 2.44; p = 0.015). In contrast, mean annual air temperature increased significantly by approximately 0.89 °C during the study period (Sen’s slope = +0.022 °C yr−1; z = 4.39; p < 0.001). The warming trend became more pronounced after the early 2000s and is consistent with previously reported temperature increases across the Sahel and Sudano-Sahelian regions [45,46,47].
The combination of statistically significant increases in both temperature and annual rainfall suggests that the increase in rainfall totals has occurred alongside substantial warming. However, the significant increase in annual rainfall does not necessarily indicate reduced drought risk, because pronounced interannual rainfall variability persisted throughout the study period. Increasing temperature may also enhance atmospheric evaporative demand and therefore contribute to greater water stress even when annual precipitation totals increase. These climatic characteristics are important for understanding drought variability and the vulnerability of rainfed agricultural systems across the study area.
3.2. Rainfall Anomaly and Variability
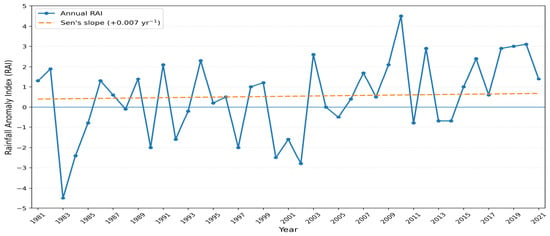
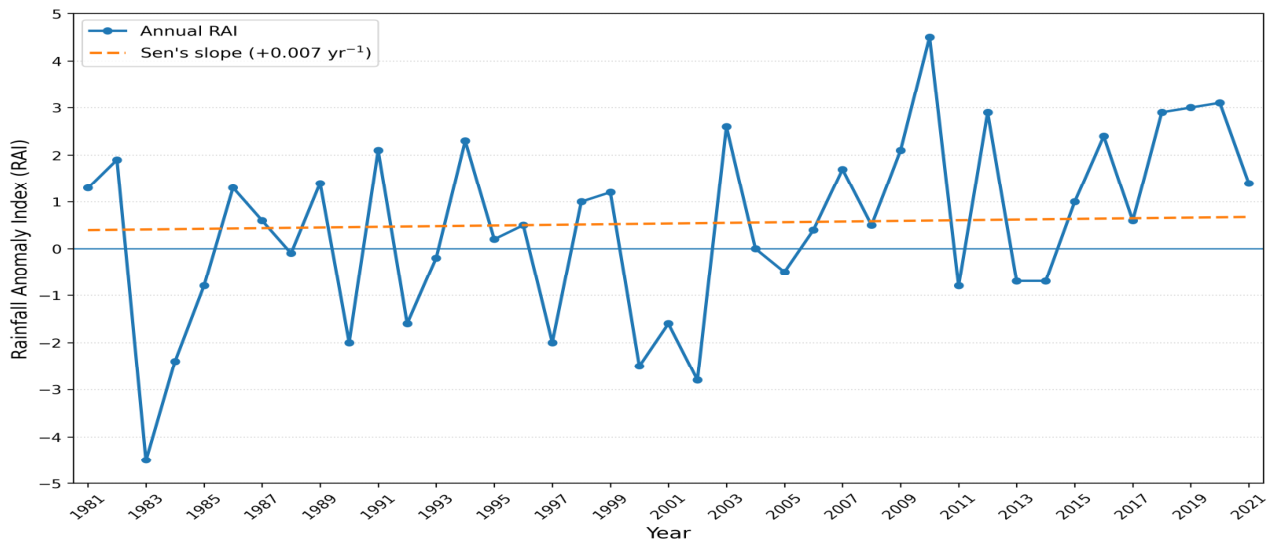
The Rainfall Anomaly Index (RAI) illustrates pronounced interannual variability in rainfall across the study area during 1981–2021 (Figure 3). Strong negative anomalies (RAI < −1.5) occurred during the early 1980s, early 2000s, and mid-2010s, corresponding to major regional drought episodes associated with weakened West African Monsoon circulation and anomalous sea-surface temperature conditions in the tropical Atlantic and Pacific Oceans [16,33]. In contrast, marked positive anomalies (RAI > +2) were observed in 1988, 1994, 2003, 2010, 2012, 2018, and 2020, indicating years of above-average rainfall. The annual RAI series exhibited weak positive lag-1 autocorrelation (r1 = 0.101), which was not statistically significant (p = 0.535), indicating no significant serial dependence in the RAI series during the 1981–2021 period.
Figure 3.
Rainfall Anomaly Index (RAI) showing interannual rainfall variability across the Centre-Est and Centre-Sud regions of Burkina Faso and the Upper East Region of Ghana during 1981–2021. The solid blue line represents the annual RAI, while the dashed line represents the Sen’s slope trend estimate.
The long-term RAI exhibited a weak positive trend (Figure 3), suggesting a partial recovery in rainfall following the prolonged droughts of the 1970s and 1980s. However, the trend was not statistically significant (Sen’s slope = +0.007 yr−1; z = 0.95; p > 0.05), indicating that rainfall remained highly variable throughout the study period despite a slight upward tendency. This finding agrees with previous studies reporting a gradual recovery of rainfall across the Sahel accompanied by persistent interannual variability [45,48,49].
Although average rainfall has shown signs of recovery, the recurrence of large positive and negative anomalies demonstrates that rainfall variability remains a dominant characteristic of the regional climate. Such variability has important implications for rainfed agriculture because consecutive dry years can substantially reduce soil moisture availability and increase the risk of crop failure. Spatially, more frequent negative rainfall anomalies were observed across the Centre-Est and Centre-Sud regions of Burkina Faso than in the Upper East Region of Ghana, indicating greater climatic variability and shorter effective rainy seasons in the northern Burkina Faso locations. Nevertheless, the Upper East Region also experiences irregular intra-seasonal dry spells that can disrupt crop development during critical growth stages, thereby increasing agricultural vulnerability across the entire study area [14].
3.3. Spatial Distribution of Rainfall and Rainfall Variability
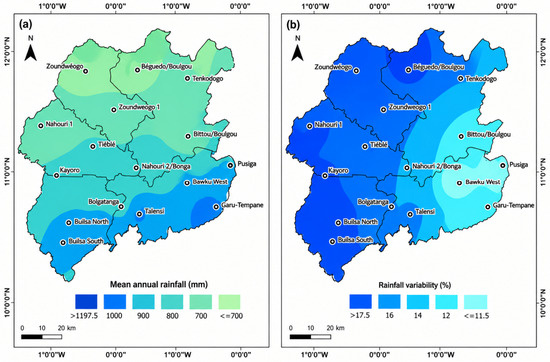
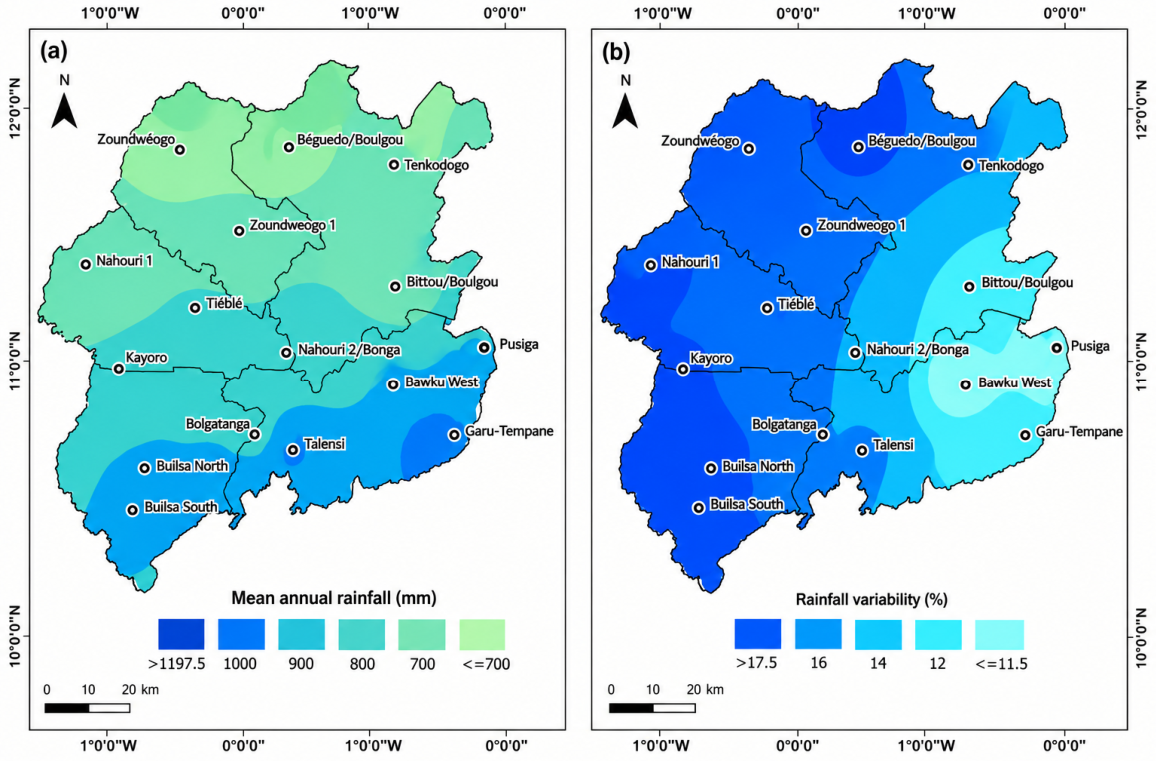
The spatial distribution of mean annual precipitation and interannual rainfall variability during 1981–2021 reveals distinct geographic patterns across the study area (Figure 4). Mean annual precipitation exhibits a clear north-to-south increasing gradient, with the northern parts of the study area receiving approximately 700–800 mm of rainfall annually, while precipitation progressively increases southwards to more than 1100 mm. This spatial pattern is consistent with the latitudinal influence of the West African Monsoon, whereby rainfall generally increases towards the south because of stronger and more persistent monsoon penetration [8,10,11,18,45,47]. Such spatial variability is consistent with previous evidence from the wider Sudano-Sahelian zone, where substantial spatial differences in rainfall amounts and trends have also been reported [45].
Figure 4.
Spatial distribution of (a) mean annual precipitation (mm) and (b) interannual rainfall variability expressed as the coefficient of variation (CV, %) across the Centre-Est and Centre-Sud regions of Burkina Faso and the Upper East Region of Ghana during 1981–2021.
Interannual rainfall variability, expressed as the coefficient of variation (CV), ranged from approximately 11.5% to 17.5% across the study area (Figure 4b). The highest variability occurred in localized areas, particularly in the western and northern portions of the study area, whereas lower variability was observed mainly in the eastern districts. These results indicate considerable spatial heterogeneity in rainfall reliability, suggesting that some locations experience substantially greater year-to-year fluctuations than others. Such variability increases the uncertainty of seasonal rainfall and elevates the risk of agricultural drought, particularly in rainfed farming systems, where crop production depends on the timing and distribution of rainfall [11,17,20,23,25,46].
The combined spatial patterns of rainfall amount and variability have important implications for agricultural management. Areas receiving relatively low annual precipitation together with high interannual variability are particularly vulnerable to soil moisture deficits and crop water stress because even modest rainfall reductions can substantially shorten the effective growing season. Conversely, although wetter areas generally receive more reliable rainfall, they remain susceptible to delayed rainfall onset, early cessation of the rainy season, and intra-seasonal dry spells that can adversely affect crop development. These findings highlight the importance of location-specific drought monitoring and adaptive agricultural management to strengthen the resilience of rainfed smallholder farming systems across the Sudano-Sahelian region [4,28].
3.4. Drought Temporal Characteristics
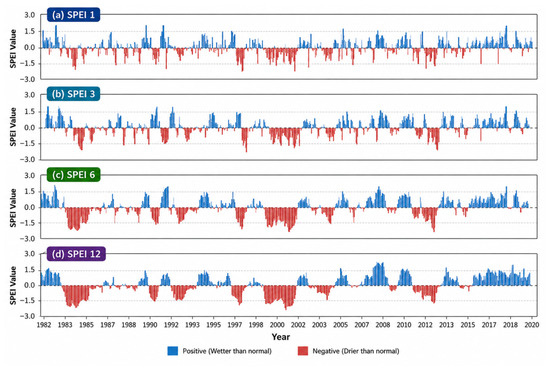
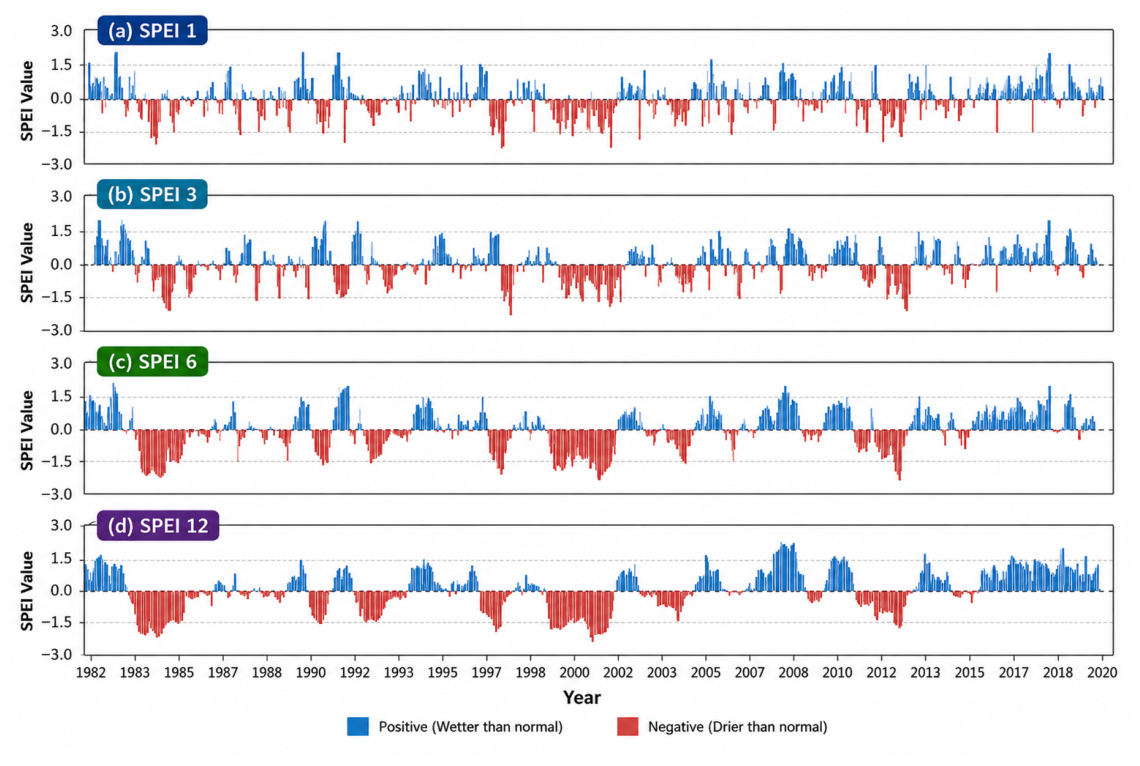
The Standardized Precipitation–Evapotranspiration Index (SPEI) revealed clear differences between short-term and long-term drought dynamics across the study area during 1981–2021 (Figure 5). Short accumulation periods (SPEI-1 and SPEI-3) exhibited frequent fluctuations between wet and dry conditions, reflecting rapid responses to short-term rainfall deficits and increased atmospheric evaporative demand. Severe and extreme droughts (SPEI < −1.5) occurred most frequently during the 1980s and 2010s, averaging four to five events per decade, compared with only two to three events during the 1990s and 2000s. These short-duration droughts are particularly important for rainfed agriculture because they can coincide with critical crop growth stages, including germination, flowering, and grain filling, resulting in substantial yield reductions despite near-normal seasonal rainfall totals [24,29].
Figure 5.
Monthly standardized precipitation-evapotranspiration index (SPEI) time series for the study area during 1981–2021 at accumulation periods of 1, 3, 6, and 12 months. Positive values indicate wetter-than-normal conditions, whereas negative values indicate drier-than-normal conditions.
In contrast, longer accumulation periods (SPEI-6 and SPEI-12) identified fewer but more persistent drought episodes extending over multiple seasons or years. Prolonged drought conditions were particularly evident during the early 1980s (1982–1987), early 2000s (2001–2003), and mid-2010s (2013–2017), indicating pronounced temporal variability in drought occurrence. These events coincide with documented Sahelian drought episodes and are consistent with the combined influence of reduced precipitation and increased atmospheric evaporative demand, which can contribute to sustained soil moisture deficits [15,45,46].
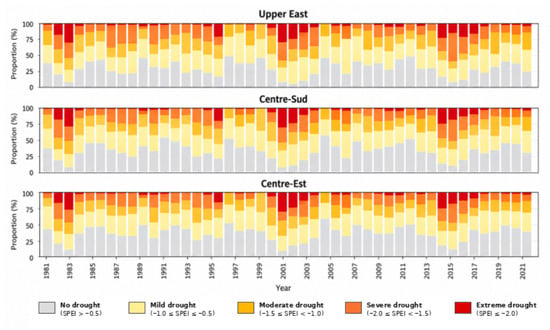
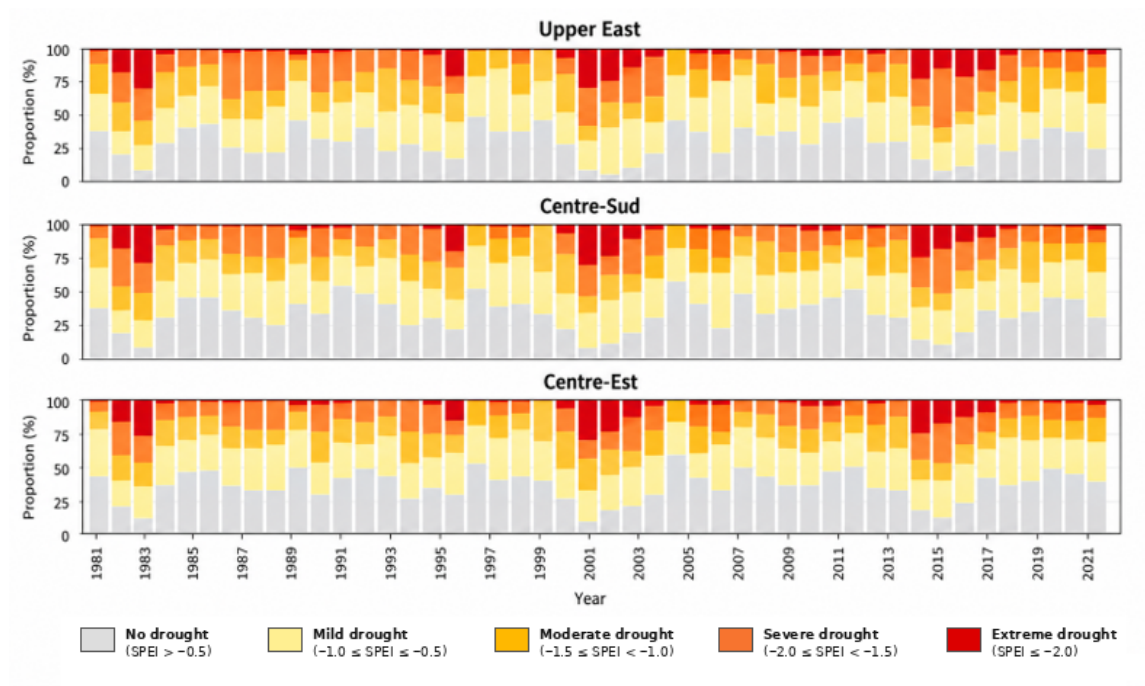
The temporal distribution of drought severity showed substantial interannual variability, with severe and extreme drought conditions particularly evident during the early 2000s and after 2010 (Figure 6). Higher drought frequencies were observed during selected years, particularly 2000 (62.78%), 2001 (64.44%), and 2002 (74.44%). However, the formal trend analysis of annual drought frequency showed no statistically significant long-term trend (Mann–Kendall Z = −0.82, p = 0.415; Sen’s slope = −0.171 percentage points yr−1). Thus, the concentration of drought conditions during particular periods represents temporal variability rather than a statistically significant increase in drought frequency. The Upper East Region experienced the greatest persistence of drought conditions over the study period, reflecting its greater exposure to interannual climatic variability. Although drought severity varied among regions, the widespread occurrence of drought during 2002–2003 indicates the influence of large-scale climatic forcing across the entire study area [4,17].
Figure 6.
Annual proportion (%) of drought severity categories derived from SPEI-12 for the Upper East Region of Ghana and the Centre-Sud and Centre-Est regions of Burkina Faso during 1981–2021. Drought categories are classified as no drought, mild, moderate, severe, and extreme drought.
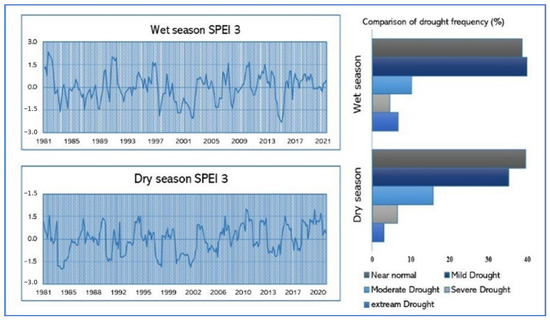
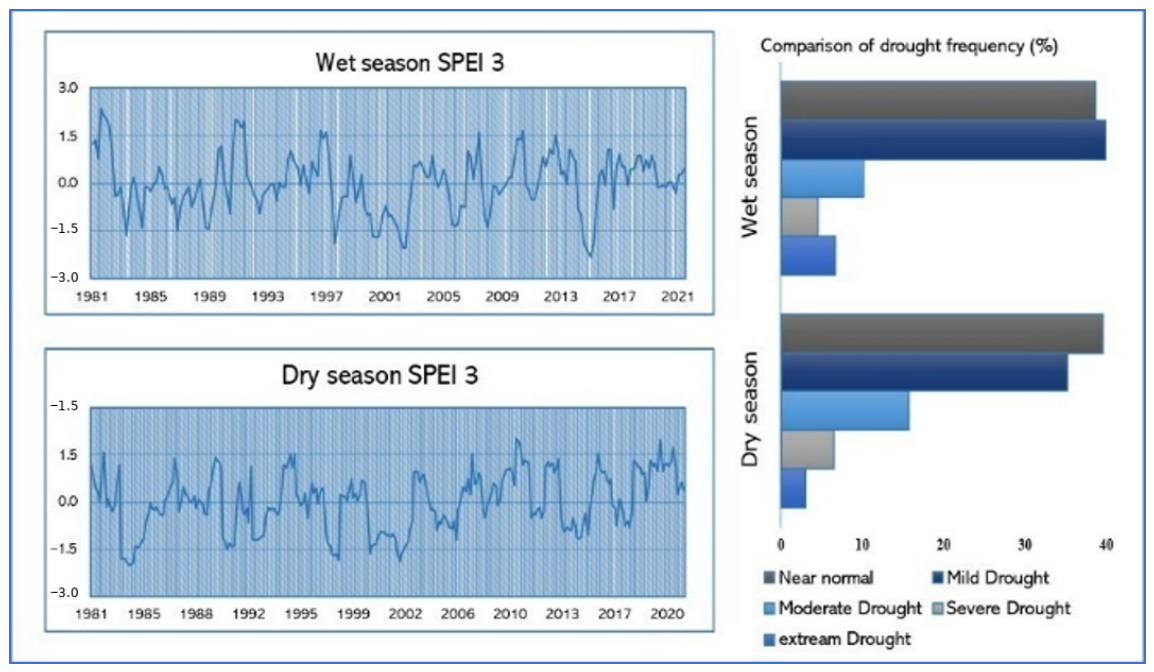
Seasonal analysis based on SPEI-3 indicated that drought occurred during both the wet and dry seasons (Figure 7). Overall drought occurrence was slightly higher during the wet season (31.25%) than during the dry season (29.85%), and this difference was statistically significant (GEE, p = 0.002). Moderate-to-extreme drought conditions (SPEI-3 < −1.0) were also more frequent during the wet season than during the dry season (18.12% versus 15.76%, p < 0.001). However, the differences in severe-to-extreme and extreme drought occurrence were not statistically significant (p = 0.075 and p = 0.161, respectively). Severe wet-season droughts were observed during 2002 and 2014, demonstrating that substantial moisture deficits can occur during the principal growing season. Such events may increase the risk of agricultural drought because they coincide with periods of high crop water demand and can substantially reduce yields despite the occurrence of seasonal rainfall [24,26].
Figure 7.
Seasonal drought characteristics derived from SPEI-3 during 1981–2021. The left panels show the temporal evolution of wet-season and dry-season SPEI-3 values, while the right panel compares the frequency (%) of drought severity classes between the two seasons.
The most severe drought events identified using SPEI-12 are summarized in Table 2. Consecutive monthly SPEI-12 values meeting the severe-to-extreme drought criterion were grouped as a single continuous event. The major events occurred primarily during 1983–1984 and 2002–2003, with event duration and minimum SPEI values used to characterize their persistence and severity. The most negative SPEI-12 value reached −2.24 in the Centre-Est Region. These droughts occurred simultaneously across the three study regions, indicating the influence of large-scale climatic drivers, including the Atlantic Multidecadal Variability (AMV) and the El Niño–Southern Oscillation (ENSO) [14]. The prolonged duration of these events suggests that recovery frequently required multiple seasons, increasing the cumulative impacts on soil moisture availability and agricultural production.
Table 2.
Major continuous severe and extreme drought events identified using the 12-month Standardized Precipitation–Evapotranspiration Index (SPEI-12) across the Centre-Est and Centre-Sud regions of Burkina Faso and the Upper East Region of Ghana during 1983–2021. Consecutive months meeting the severe-to-extreme drought criterion were treated as a single continuous drought event.
The drought patterns identified using SPEI are consistent with previous studies employing the Standardized Precipitation Index (SPI) and the Palmer Drought Severity Index (PDSI) across West Africa. Both SPI and PDSI identify major drought episodes during the early 1980s and early 2000s, followed by partial recovery and episodic drought conditions after 2010 [12,20,26,46,47]. However, because SPEI incorporates atmospheric evaporative demand, it captures drought intensification associated with rising temperatures that is not represented by SPI, while providing greater temporal sensitivity than PDSI for assessing agriculturally relevant drought in semi-arid environments [15,50].
3.5. Spatial Characteristics of Drought
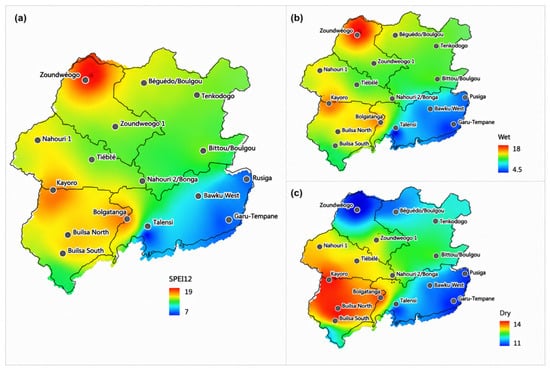
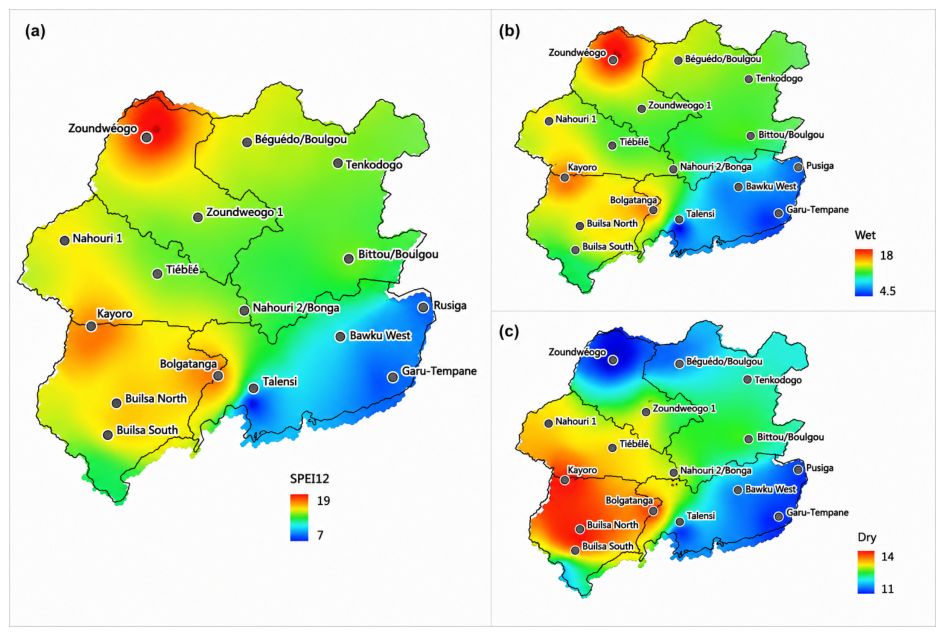
Spatial analysis of drought frequency based on SPEI-12 revealed marked spatial variability across the study area (Figure 8a). The highest drought frequencies, exceeding 19 events during the 1981–2021 period, occurred primarily in the northwestern and western parts of the study area, including portions of Zoundweogo and Boulgou in Burkina Faso. In contrast, southeastern locations, particularly Talensi and Pusiga in the Upper East Region of Ghana, experienced the lowest drought frequencies, with approximately 7–11 drought events over the study period.
Figure 8.
Spatial distribution of drought frequency during 1981–2021 derived from (a) annual SPEI-12, (b) wet-season SPEI-3, and (c) dry-season SPEI-3.
Seasonal analysis further demonstrated distinct differences between wet- and dry-season drought occurrence (Figure 8a–c). Drought frequency showed modest seasonal differences across the study area, with slightly higher overall drought occurrence during the wet season than during the dry season. This difference was statistically significant (GEE, p = 0.002). The higher wet-season occurrence highlights that moisture deficits can develop even during the principal rainy season, when crop water demand is high. These spatial patterns are consistent with previous studies linking drought occurrence in West Africa to variability in the West African Monsoon and the latitudinal migration of the Intertropical Convergence Zone [8,45].
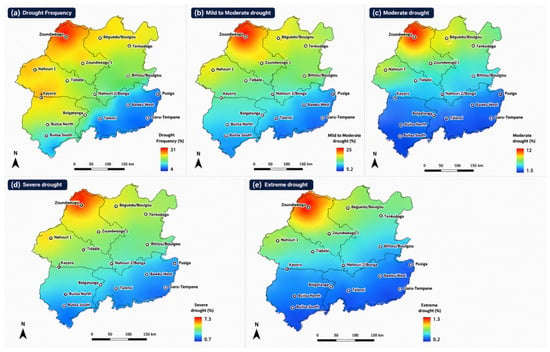
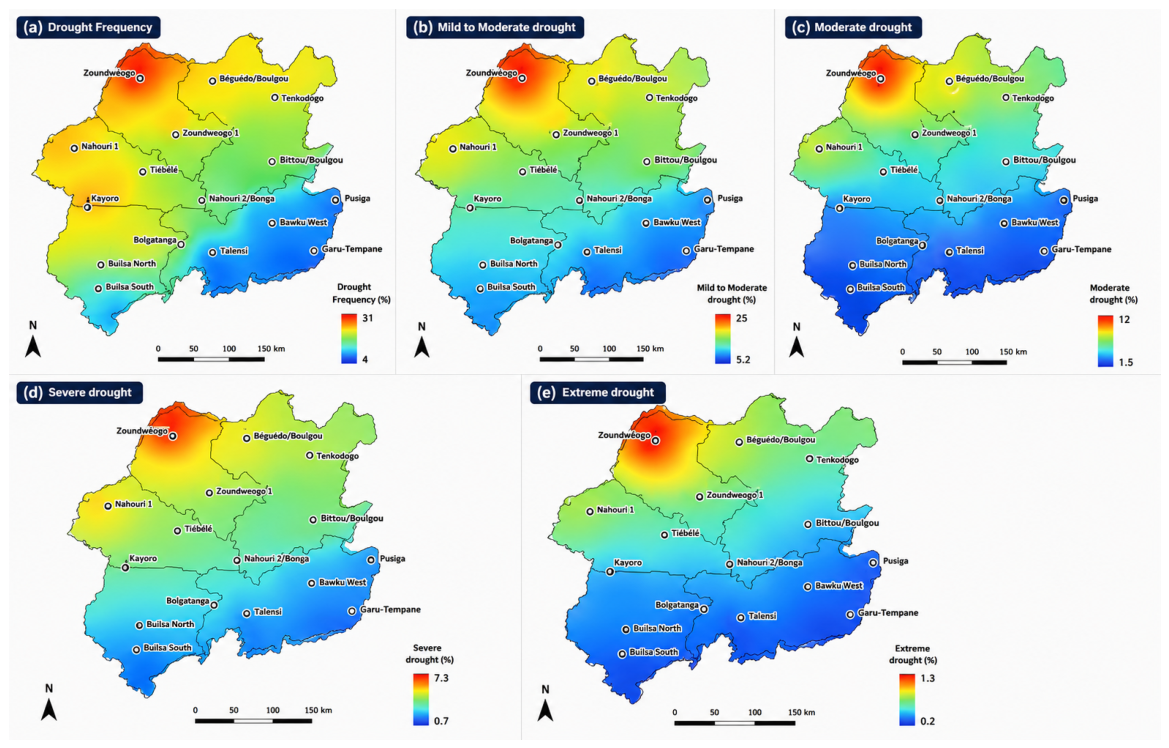
The spatial distribution of drought severity further highlights regional differences in drought occurrence (Figure 9). However, the formal analysis did not detect a statistically significant difference in overall drought occurrence among the Centre-Est, Centre-Sud, and Upper East regions (GEE, p = 0.539). Overall drought frequency ranged from approximately 6% to 35% across the study area. Mild drought represented the most common drought category, whereas moderate drought occurred less frequently but remained widespread across northern Burkina Faso and parts of the Upper East Region of Ghana. Severe drought occurred in approximately 6.2–7.3% of observations, while extreme drought was relatively uncommon (<1.3%) and was largely confined to major regional drought episodes, such as 1983–1984 and 2002–2003. The relatively low occurrence of extreme drought is consistent with previous studies showing that the most severe Sahelian droughts are associated with persistent anomalies in large-scale atmospheric circulation and sea-surface temperatures [14,46].
Figure 9.
Spatial distribution of overall drought frequency and drought severity categories derived from SPEI-12 during 1981–2021.
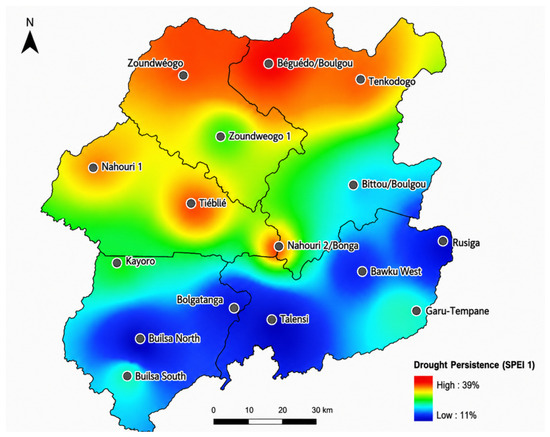
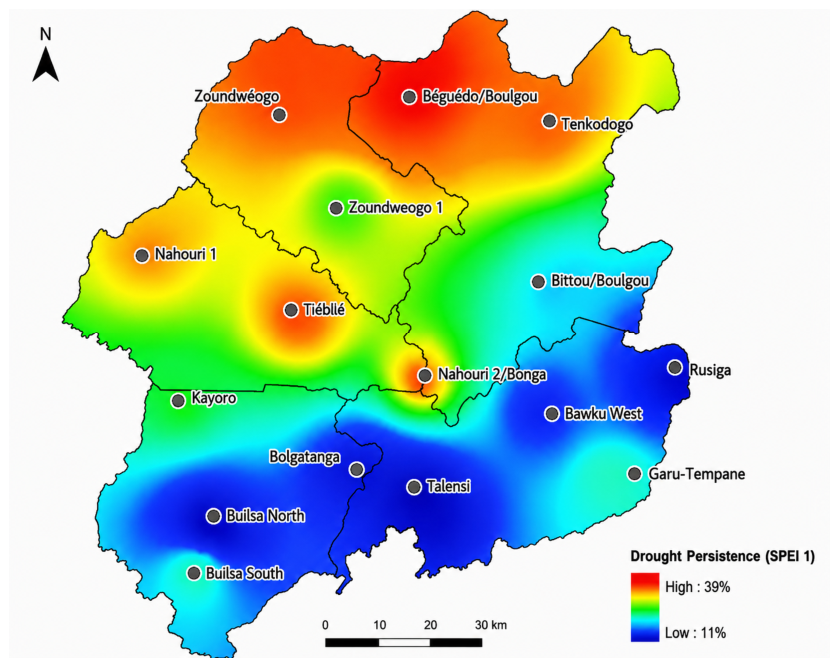
Drought persistence, defined as the occurrence of prolonged drought episodes lasting four or more consecutive months, also exhibited pronounced spatial variability (Figure 10). The highest drought persistence values (up to 39%) were concentrated in the northwestern portion of the study area, particularly around Beguedo/Boulgou and Zoundweogo. Conversely, southeastern locations, including Talensi and Pusiga, recorded the lowest drought intensity values (approximately 11%), indicating fewer prolonged drought events.
Figure 10.
Spatial distribution of drought persistence derived from SPEI-1 during 1981–2021. Drought persistence represents the frequency of prolonged drought episodes lasting four or more consecutive months.
The combined patterns of drought frequency, severity, and persistence identify the northwestern portion of the study area as the region most exposed to prolonged meteorological drought. This combination of frequent, severe, and persistent drought conditions increases the vulnerability of rainfed agricultural systems and highlights priority areas for drought adaptation, water-resource management, and climate-resilient agricultural planning [4,28].
3.6. Drought Periodicity
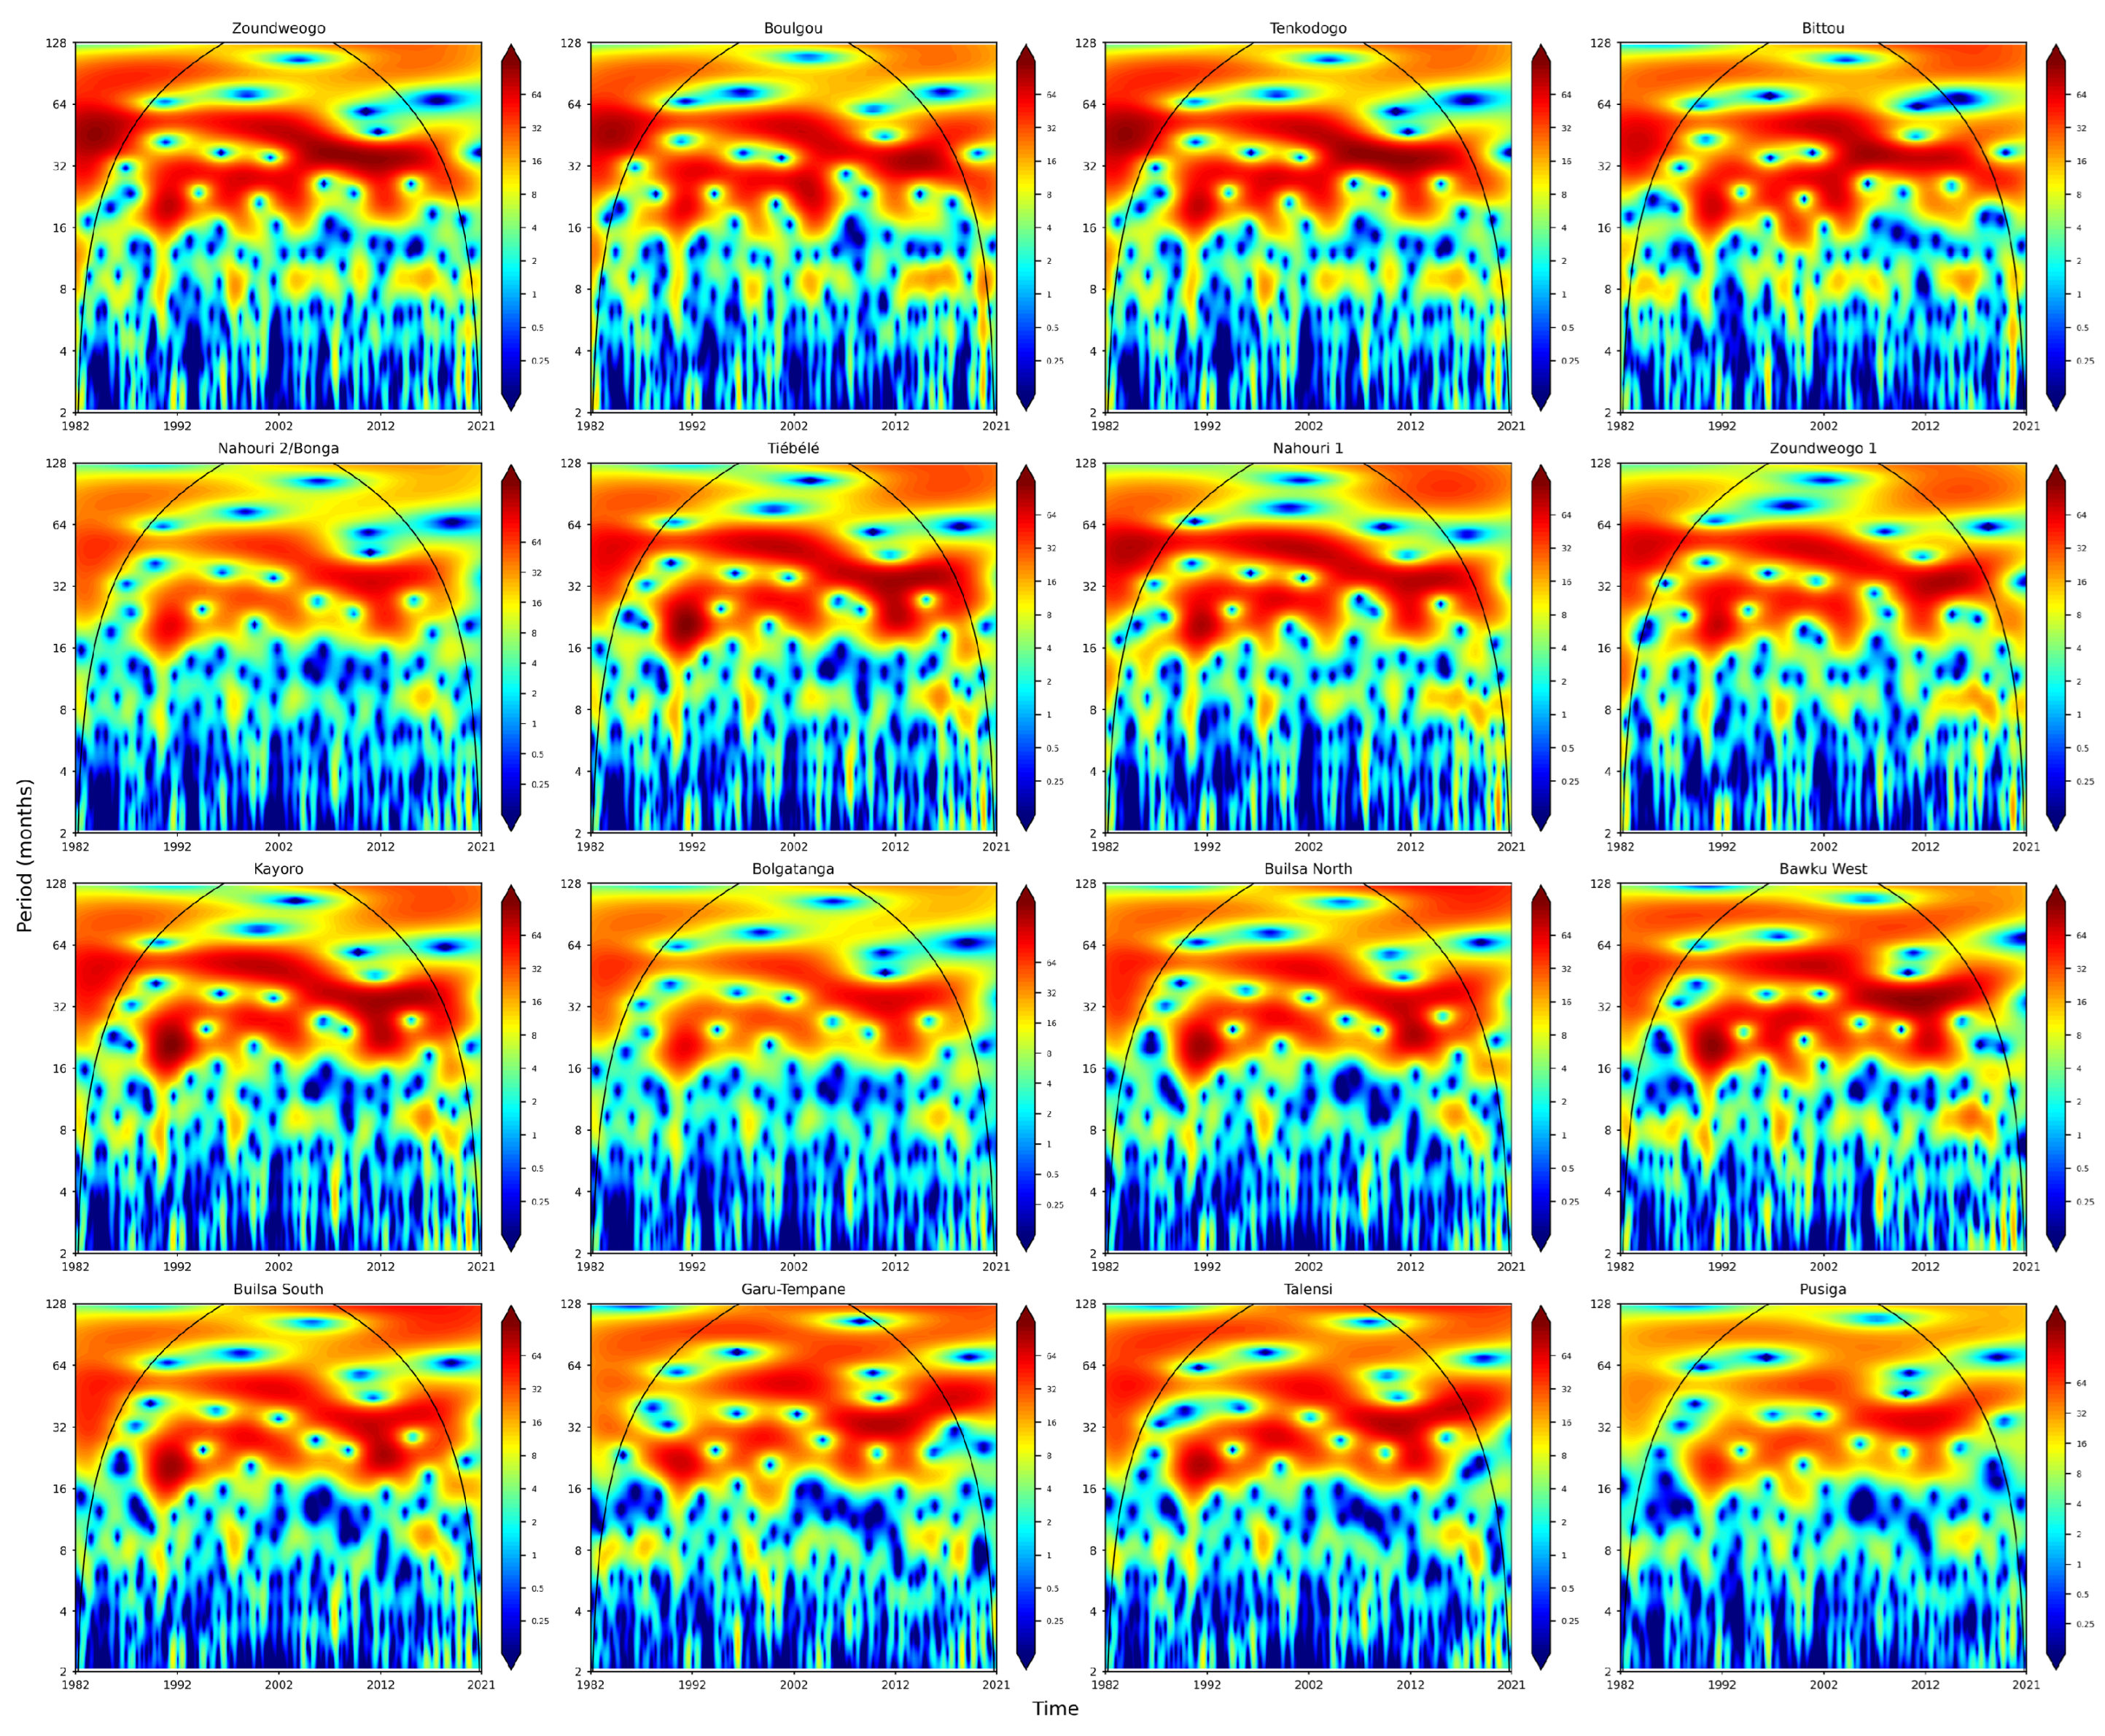
Continuous Wavelet Transform (CWT) analysis of the SPEI-12 time series revealed recurrent drought periodicities across all three study regions, although the dominant frequencies varied spatially (Figure 11). To first assess spatial variability, CWT analysis was conducted independently for the 16 meteorological data points (MDPs), as shown in Figure 11. The MDP-level analysis revealed recurrent multiannual oscillations across the study area, with dominant periodicities generally concentrated between approximately 31 and 50 months. Most MDPs exhibited dominant periodicities around 33–35 months, whereas Nahouri 1, Zoundweogo 1, and Garu-Tempane showed stronger dominant periodicities of approximately 49–50 months. Additional shorter- and longer-period oscillations were also observed at several locations, indicating spatial differences in the timing and strength of drought variability.
Figure 11.
Continuous Wavelet Transform (CWT) power spectra of the 12-month Standardized Precipitation–Evapotranspiration Index (SPEI-12) for the 16 meteorological data points during 1981–2021. The panels show the spatial variability in drought periodicities across the study area. Black contours denote statistically significant periodicities at the 95% confidence level, and the curved line indicates the cone of influence.
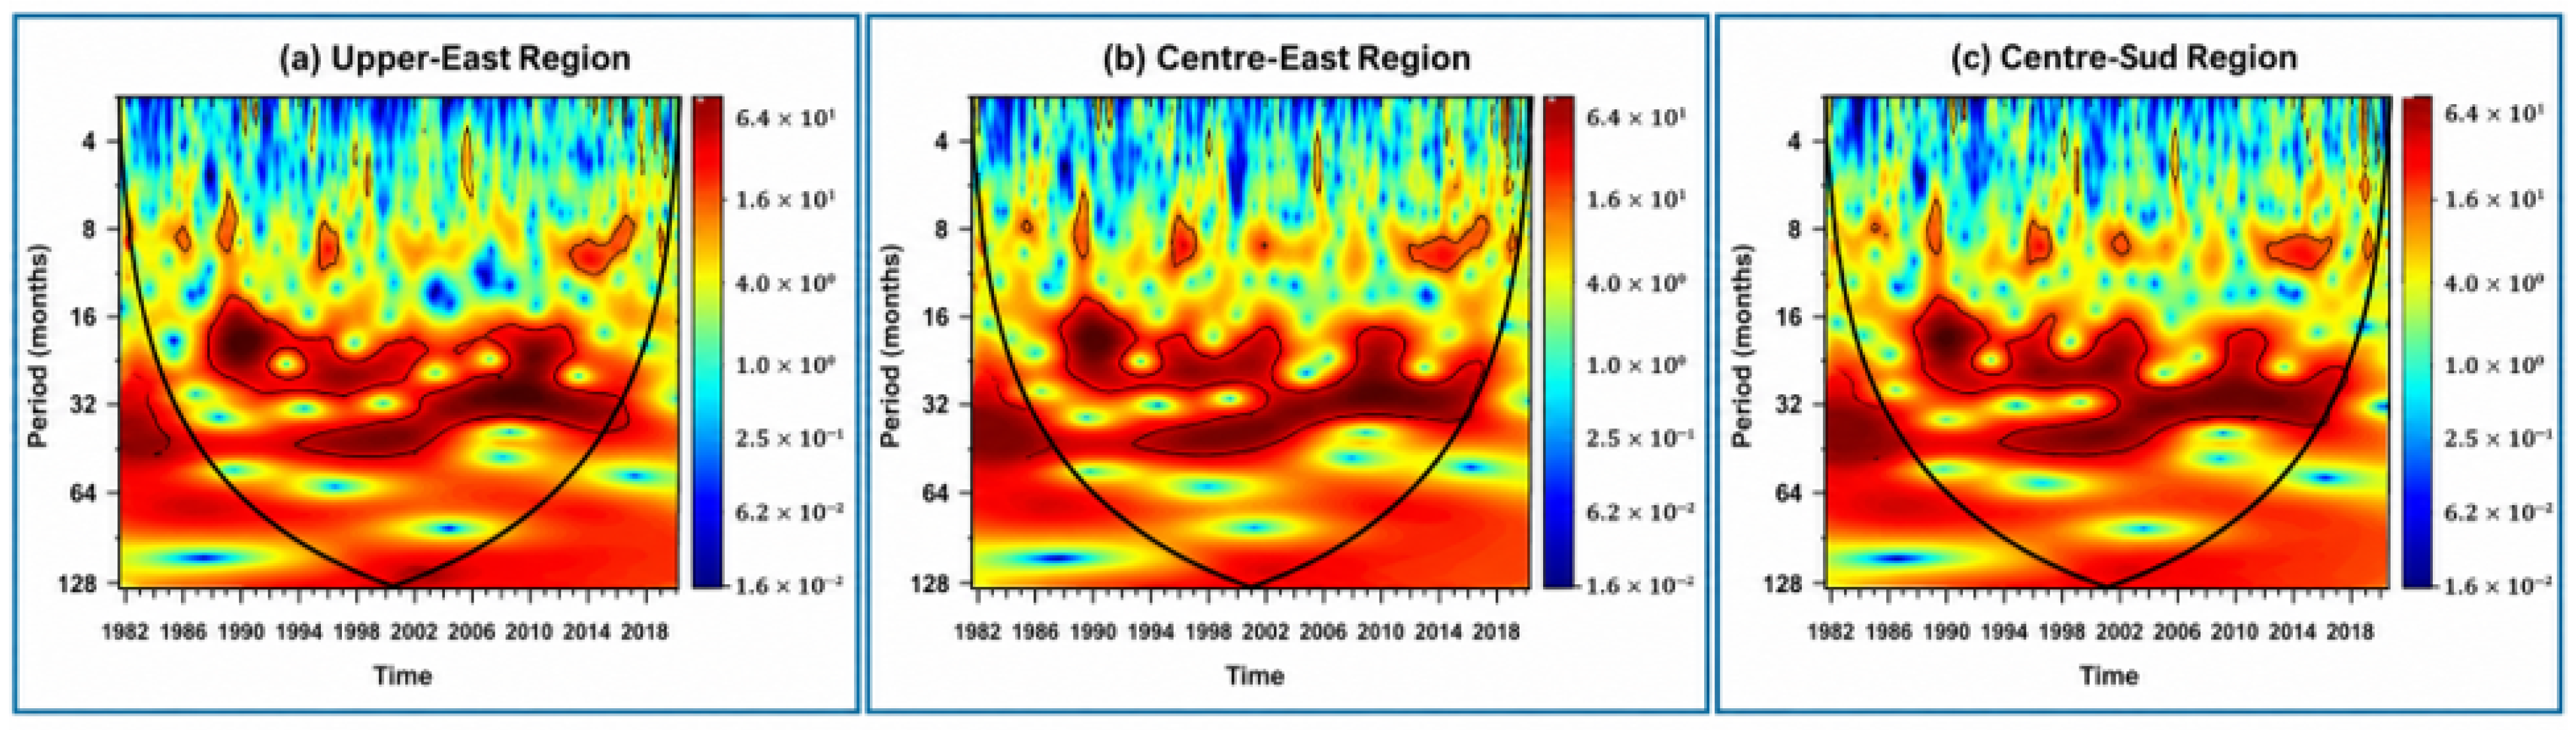
The station-level results were then synthesized at the regional scale (Figure 12). The Upper East Region exhibited the strongest and most persistent drought cycles, with dominant periodicities ranging from approximately 8 to 32 months between the mid-1980s and early 2000s. The regional spectra also showed substantial multiannual wavelet power extending beyond 32 months, particularly during the earlier part of the record and around the 2000s. Longer multi-year oscillations of 32–64 months were also evident during the early 1980s and around 2000, indicating prolonged drought recurrence. The Centre-Est and Centre-Sud regions displayed similar patterns, with multiannual oscillations extending broadly across the approximately 15–64-month range, together with shorter oscillations of 6–11 months occurring intermittently throughout the study period. These recurring drought cycles occur at timescales that are broadly consistent with periodicities previously reported for major modes of climate variability in West Africa, including the Atlantic Multidecadal Variability (AMV) and the El Niño–Southern Oscillation (ENSO) [14,46]. However, the CWT identifies recurrent temporal patterns and does not by itself establish a causal relationship with these climate modes.
Figure 12.
Continuous Wavelet Transform (CWT) power spectra of the 12-month Standardized Precipitation-Evapotranspiration Index (SPEI-12) for the study regions during 1981–2021. Black contours denote statistically significant periodicities (95% confidence level), and the curved black line indicates the cone of influence.
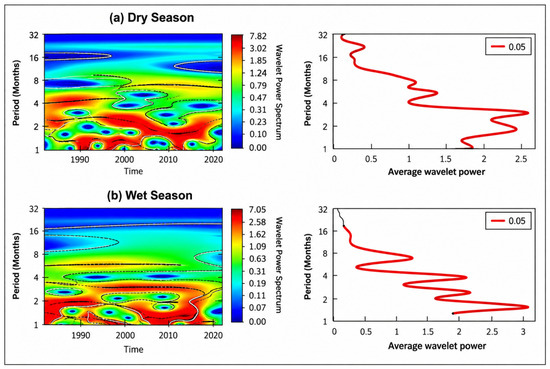
Seasonal wavelet analysis further demonstrated clear differences between wet- and dry-season drought behavior (Figure 13). During the dry season, dominant periodicities ranged from approximately 2 to 9 months, with occasional longer oscillations extending to about 16 months, indicating recurrent short-term droughts interspersed with prolonged dry periods. In contrast, the wet season was characterized primarily by shorter periodicities of 1–6 months, reflecting intra-seasonal variability in rainfall and fluctuations in the West African Monsoon. Although these wet-season droughts were generally shorter in duration, they can substantially affect crop establishment and reproductive development when they coincide with critical stages of the growing season [24,26].
Figure 13.
Continuous Wavelet Transform (CWT) power spectra (left) and corresponding global wavelet spectra (right) for the study area during 1981–2021. Black contours indicate statistically significant periodicities (95% confidence level), and the global wavelet spectra show the average wavelet power across time.
The wavelet analysis demonstrates that drought variability in the study area is governed by both short-term (1–9 months) and multiannual periodicities. The MDP-level analysis identified dominant multiannual oscillations mainly around 31–50 months, while the regional spectra showed significant variability across a broader multiannual range extending toward approximately 64 months. Short-term oscillations primarily influence seasonal soil moisture availability and crop development, whereas longer periodicities may increase the likelihood of repeated drought exposure and reduce recovery opportunities for rainfed agricultural systems. These findings highlight the value of integrating multi-timescale drought monitoring into early-warning systems, seasonal climate advisories, crop management, and long-term adaptation planning to enhance the resilience of smallholder farming systems in semi-arid West Africa [4,28].
3.7. Practical Implications for Decision-Making and Adaptation in Rainfed Smallholder Systems
Rainfed smallholder farming systems in the Sudano-Sahelian region operate under high climatic variability, making agricultural production highly sensitive to recurrent drought. The results of this study demonstrate that drought risk is characterized not only by isolated extreme events but also by recurrent seasonal and multi-annual drought cycles. The identification of drought periodicities ranging from 1–9 months and 15–64 months indicates that farmers are repeatedly exposed to drought conditions that can progressively reduce their capacity to recover between events.
Short-term droughts occurring during the growing season primarily affect operational decisions such as planting dates, crop establishment, re-sowing, and crop selection. In contrast, longer-term drought recurrence influences strategic decisions, including investment in soil and water conservation, adoption of drought-tolerant crop varieties, and long-term management of soil fertility. Repeated drought exposure can reduce farmers’ willingness to invest in agricultural inputs and increase risk-averse management strategies, limiting productivity and slowing recovery following drought events [6,17].
These findings highlight the importance of integrating multi-timescale drought information into agricultural advisory and early-warning systems. While seasonal forecasts and rainfall monitoring remain essential for short-term farm management, information on recurrent drought periodicities can support medium-term planning related to crop diversification, water harvesting, and conservation agriculture [11,28]. Such an approach would improve preparedness by enabling farmers and extension services to anticipate not only the onset of drought but also periods of elevated drought recurrence.
At the policy level, the observed spatial variability and recurrent drought patterns emphasize the need for location-specific adaptation strategies rather than uniform regional interventions. Integrating drought recurrence information into climate services, agricultural extension, climate-index insurance, and drought-risk financing could strengthen the resilience of rainfed smallholder farming systems and support more proactive drought management across semi-arid West Africa.
4. Discussion
4.1. Drought Variability Under a Warming Climate
The absence of a significant long-term trend in drought frequency, despite the observed warming, suggests that drought risk in the study area is expressed primarily through changes in drought intensity, timing, and persistence rather than through a simple monotonic increase in drought occurrence. This distinction is important for agricultural systems because a stable long-term frequency does not necessarily imply stable drought impacts. Increasing atmospheric evaporative demand can amplify the effects of rainfall deficits and accelerate soil-moisture depletion, particularly during periods when crop water requirements are high. Similar evidence from the Sahel indicates that warming can intensify drought stress even where precipitation totals show partial recovery [13,15,50].
4.2. Multi-Timescale Drought Dynamics and Agricultural Implications
The contrasting behavior across SPEI accumulation periods demonstrates that drought should not be treated as a single temporal phenomenon in rainfed agricultural systems. Short accumulation periods are more relevant to rapid fluctuations in crop water availability, whereas longer accumulation periods integrate moisture deficits over several months and therefore provide a broader indication of cumulative hydrological stress. This temporal complementarity is particularly important in semi-arid environments, where a short rainfall interruption during the growing season may have immediate effects on crops even when seasonal rainfall totals remain near normal, while successive deficits can progressively reduce soil-moisture recovery between seasons. Similar distinctions between short-term agricultural drought and longer-term drought processes have been reported in other semi-arid environments [7,50].
The results therefore support the use of multiple SPEI timescales rather than reliance on a single drought indicator. In addition, the incorporation of atmospheric evaporative demand gives SPEI an advantage over precipitation-only indices when assessing drought under a warming climate. This is particularly relevant for rainfed agriculture because increasing temperature can increase water demand even when precipitation does not decline substantially [12,23,50]. Compared with precipitation-only indices such as SPI, SPEI incorporates atmospheric evaporative demand and can therefore capture drought signals associated with changes in temperature and evaporative demand. Consequently, SPEI better reflects drought conditions affecting rainfed agriculture under contemporary climate change, while also providing greater temporal flexibility than longer-term indices such as PDSI [12,23,50].
4.3. Spatial Heterogeneity of Drought Risk
The spatial heterogeneity observed across the study area indicates that drought exposure is strongly conditioned by the regional rainfall gradient and the reliability of seasonal moisture supply. Rather than representing a uniform regional hazard, drought risk reflects differences in the timing, amount, and persistence of rainfall, with additional influence from atmospheric evaporative demand. The spatial patterns are consistent with the strong north–south rainfall gradient associated with the penetration and seasonal persistence of the West African Monsoon and the latitudinal migration of the Intertropical Convergence Zone (ITCZ) [44,47].
From an agricultural perspective, this spatial heterogeneity means that drought adaptation should be geographically targeted. Areas experiencing recurrent moisture deficits may require greater emphasis on soil and water conservation, drought-tolerant crops, and water-harvesting measures, whereas areas with comparatively lower drought exposure may benefit from strategies focused on managing intra-seasonal rainfall variability. Thus, the spatial information provided by the interpolation is useful not simply for describing where drought occurs, but for identifying areas where adaptation resources and climate services may be prioritized.
4.4. Drought Periodicity and Implications for Early-Warning Systems
The wavelet analysis indicates that drought variability operates across multiple temporal scales rather than following a single recurring cycle. The coexistence of seasonal and multi-annual signals suggests that drought risk arises from both short-term fluctuations in moisture availability and longer periods of elevated hydroclimatic stress. This finding is important because the management implications of these timescales differ: seasonal signals are more relevant to operational agricultural decisions, whereas multi-annual recurrence is more relevant to preparedness, resource planning, and recovery strategies.
The correspondence between the identified periodicities and timescales previously associated with major modes of climate variability, including the Atlantic Multidecadal Variability (AMV) and El Niño–Southern Oscillation (ENSO), provides a plausible climatic context for the observed recurrence [47,48]. However, the present analysis does not establish a causal teleconnection between these climate modes and drought occurrence. The wavelet results should therefore be interpreted as evidence of recurrent temporal structure rather than direct attribution to specific climate drivers. The identification of both seasonal and multi-annual drought periodicities has important practical implications. Conventional drought monitoring systems primarily focus on current climatic conditions, whereas incorporating information on recurrent drought cycles could strengthen medium-term preparedness by supporting improved seasonal planning, drought-risk assessment, and agricultural advisory services.
4.5. Implications for Adaptation and Future Research
The combined evidence from the temporal, spatial, and wavelet analyses indicates that drought should be viewed as a recurrent climatic process rather than as isolated extreme events. For rainfed smallholder farming systems, repeated drought exposure may progressively reduce resilience by limiting soil moisture recovery, increasing production uncertainty, and discouraging investment in agricultural inputs.
These findings highlight the importance of integrating multi-timescale drought indicators into climate services and early-warning systems. Short-term indicators can support operational decisions such as planting dates and crop management, whereas medium- and long-term drought information can guide strategic investments in soil and water conservation, drought-tolerant crop varieties, and water-harvesting practices [4,11,28].
Several limitations should also be acknowledged. The analysis relied on gridded climate datasets because long-term observational records were not consistently available across the study area. Although CHIRPS and ERA5-Land have been widely validated in West Africa, uncertainties remain, particularly in regions with sparse meteorological observations. Furthermore, drought was assessed using climatic indicators only; direct relationships with crop yields, soil moisture observations, and household livelihoods were beyond the scope of this study. Future research should integrate drought indicators with agricultural production data and downscaled climate projections to improve anticipatory drought-risk management and evaluate adaptation strategies under future climate change.
5. Conclusions
This study provides a comprehensive assessment of drought variability, severity, spatial distribution, and temporal periodicity across the Centre-Est and Centre-Sud regions of Burkina Faso and the Upper East Region of Ghana during 1981–2021 using the Standardized Precipitation–Evapotranspiration Index (SPEI).
The results demonstrate that drought is a persistent feature of the regional climate, with pronounced temporal variability and higher drought frequencies during selected periods, particularly the early 2000s, but without a statistically significant long-term increase in overall drought frequency. Spatial analyses revealed considerable heterogeneity in rainfall, rainfall variability, drought frequency, severity, and intensity, resulting in marked differences in drought exposure across the study area. Areas characterized by lower rainfall and greater interannual variability experienced more frequent and persistent drought conditions, highlighting important spatial differences in agricultural vulnerability.
Multi-timescale SPEI analysis showed that short-term droughts can occur during critical crop development stages, increasing the risk of agricultural drought even during years with near-average seasonal rainfall. Continuous Wavelet Transform (CWT) analysis further identified recurrent drought periodicities ranging from 1 to 9 months and from 15 to 64 months, indicating recurrent temporal variability in drought occurrence across seasonal and multi-annual timescales. These recurring periodicities may increase the likelihood of repeated drought exposure, potentially limiting recovery opportunities and increasing production risks in rainfed smallholder farming systems.
The findings highlight the value of integrating multi-timescale drought monitoring into early-warning systems, climate services, and agricultural decision support. Combining short-term drought indicators with information on medium- and long-term drought recurrence can improve drought preparedness and support more effective adaptation strategies, including optimized planting calendars, soil and water conservation measures, drought-tolerant crop varieties, and targeted climate-risk management.
Future research should strengthen the linkage between drought indicators and agricultural outcomes, including crop productivity, soil moisture dynamics, and household livelihoods. Integrating future climate projections with drought periodicity analyses would further improve anticipatory drought-risk management and support climate-resilient agricultural planning in semi-arid West Africa.
Funding
This research received no external funding.
Institutional Review Board Statement
Not applicable.
Informed Consent Statement
Not applicable.
Data Availability Statement
The data supporting the findings of this study are publicly available. Monthly precipitation data were obtained from the Climate Hazards Group InfraRed Precipitation with Stations (CHIRPS v2.0) dataset (https://www.chc.ucsb.edu/data/chirps (accessed on 5 September 2025), and temperature data were obtained from the Copernicus Climate Data Store (ERA5-Land) (https://cds.climate.copernicus.eu (accessed on 5 September 2025)). The processed datasets generated during the current study are available from the corresponding author upon reasonable request.
Acknowledgments
The author acknowledges the University of Sassari (UNISS), the Desertification Research Centre (NRD), and the EU Horizon 2020 EWA-BELT Project (Grant Agreement No. 862848), “Linking East and West African Farming Systems Experience into a BELT of Sustainable Intensification”, coordinated by the Desertification Research Centre of the University of Sassari, for their institutional and collaborative support. The author also thanks the Climate Hazards Center, University of California, Santa Barbara, for providing the CHIRPS v2.0 precipitation dataset and the European Centre for Medium-Range Weather Forecasts (ECMWF), through the Copernicus Climate Data Store, for providing the ERA5-Land reanalysis dataset.
Conflicts of Interest
The author declares no conflicts of interest.
Abbreviations
The following abbreviations are used in this manuscript:
| Abbreviation | Definition |
| AMV | Atlantic Multidecadal Variability |
| CHIRPS | Climate Hazards Group InfraRed Precipitation with Station Data |
| CV | Coefficient of Variation |
| CWT | Continuous Wavelet Transform |
| ECMWF | European Centre for Medium-Range Weather Forecasts |
| ENSO | El Niño–Southern Oscillation |
| ERA5-Land | Fifth-generation ECMWF Land Reanalysis |
| IDW | Inverse Distance Weighted |
| ITCZ | Intertropical Convergence Zone |
| PET | Potential Evapotranspiration |
| RAI | Rainfall Anomaly Index |
| SPEI | Standardized Precipitation–Evapotranspiration Index |
| SPI | Standardized Precipitation Index |
| PDSI | Palmer Drought Severity Index |
References
- Carleton, T.A.; Hsiang, S.M. Social and economic impacts of climate. Science 2016, 353, aad9837. [Google Scholar] [CrossRef] [Scilit] [PubMed]
- Fitzpatrick, R.G.J.; Parker, D.J.; Marsham, J.H.; Rowell, D.P.; Jackson, L.S.; Finney, D.; Deva, C.; Tucker, S.; Stratton, R. How a typical West African day in the future climate compares with current climate conditions. Clim. Change 2020, 163, 267–296. [Google Scholar] [CrossRef] [Scilit]
- Fonjong, L.; Matose, F.; Sonnenfeld, D.A. Climate change in Africa: Impacts, adaptation, and policy responses. Glob. Environ. Change 2024, 78, 102912. [Google Scholar] [CrossRef] [Scilit]
- Affoh, R.; Zheng, H.; Dangui, K.; Dissani, B.M. The impact of climate variability and change on food security in sub-Saharan Africa: Perspective from panel data analysis. Sustainability 2022, 14, 759. [Google Scholar] [CrossRef] [Scilit]
- Sultan, B.; Gaetani, M. Agriculture in West Africa in the twenty-first century: Climate change and impacts scenarios, and potential for adaptation. Front. Plant Sci. 2016, 7, 1262. [Google Scholar] [CrossRef] [Scilit] [PubMed]
- Krishna Prabhakar, S.V.R. Implications of regional droughts and transboundary drought risks on drought monitoring and early warning: A review. Climate 2022, 10, 124. [Google Scholar] [CrossRef] [Scilit]
- Ndayiragije, J.M.; Li, F. Effectiveness of drought indices in the assessment of different types of droughts. Climate 2022, 10, 125. [Google Scholar] [CrossRef] [Scilit]
- Nicholson, S.E. The West African Sahel: A review of recent studies on rainfall variability. ISRN Meteorol. 2013, 2013, 453521. [Google Scholar] [CrossRef] [Scilit]
- Quagraine, K.A.; Nkrumah, F.; Klein, C.; Klutse, N.A.B.; Quagraine, K.T. West African summer monsoon precipitation variability as represented by reanalysis datasets. Climate 2020, 8, 111. [Google Scholar] [CrossRef] [Scilit]
- Bodjrènou, R.; Sintondji, L.O.; Comandan, F. Revealing the spatiotemporal precipitation patterns of ECMWF fifth-generation reanalyses since the mid-20th century in West Africa. Environ. Adv. 2025, 20, 100636. [Google Scholar] [CrossRef] [Scilit]
- Tefera, M.L.; Seddaiu, G.; Carletti, A.; Awada, H. Rainfall variability and drought in West Africa: Challenges and implications for rainfed agriculture. Theor. Appl. Climatol. 2025, 156, 41. [Google Scholar] [CrossRef] [Scilit]
- Diatta, S.; Fink, A.H. Statistical relationship between remote climate indices and West African monsoon variability. Int. J. Climatol. 2014, 34, 3348–3367. [Google Scholar] [CrossRef] [Scilit]
- Dai, A. Drought under global warming: A review. WIREs Clim. Change 2011, 2, 45–65. [Google Scholar] [CrossRef] [Scilit]
- Masih, I.; Maskey, S.; Mussá, F.E.F.; Trambauer, P. A review of droughts on the African continent. Hydrol. Earth Syst. Sci. 2014, 18, 3635–3649. [Google Scholar] [CrossRef] [Scilit]
- Gaona, J.; Quintana-Seguí, P.; Escorihuela, M.J.; Boone, A.; Llasat, M.C. Interactions between precipitation, evapotranspiration and soil-moisture-based indices to characterize drought. Nat. Hazards Earth Syst. Sci. 2022, 2022, 1–30. [Google Scholar] [CrossRef] [Scilit]
- Beguería, S.; Vicente-Serrano, S.M.; Reig, F.; Latorre, B. Standardized precipitation evapotranspiration index (SPEI) revisited: Parameter fitting, evapotranspiration models, tools, datasets and drought monitoring. Int. J. Climatol. 2014, 34, 3001–3023. [Google Scholar] [CrossRef] [Scilit]
- Tefera, M.L. Land degradation and the upper hand of sustainable agricultural intensification in sub-Saharan Africa: A systematic review. J. Agric. Rural Dev. Trop. Subtrop. 2024, 125, 63–83. [Google Scholar] [CrossRef] [Scilit]
- Shiferaw, B.; Tesfaye, K.; Kassie, M.; Abate, T.; Prasanna, B.M.; Menkir, A. Managing vulnerability to drought and enhancing livelihood resilience in sub-Saharan Africa: Technological, institutional and policy options. Weather Clim. Extrem. 2014, 6, 67–79. [Google Scholar] [CrossRef] [Scilit]
- Liu, C.; Yang, C.; Yang, Q.; Wang, J. Spatiotemporal drought analysis by the SPI and SPEI in Sichuan Province, China. Sci. Rep. 2021, 11, 1280. [Google Scholar] [CrossRef] [Scilit] [PubMed]
- Li, Y.; Wen, Y.; Lai, H.; Zhao, Q. Drought response analysis based on cross wavelet transform and mutual entropy. Alex. Eng. J. 2020, 59, 1223–1231. [Google Scholar] [CrossRef] [Scilit]
- Torrence, C.; Compo, G.P. A practical guide to wavelet analysis. Bull. Am. Meteorol. Soc. 1998, 79, 61–78. [Google Scholar] [CrossRef] [Scilit]
- Bodjrènou, R.; Sintondji, L.O.; Sambieni, S.K.; Tidjani, N.; Koyo, P.; Avossè, A.; Comandan, F. Analysis of current and future climate variability and drought recurrence in Benin, West Africa. J. Water Clim. Change 2025, 16, 2297–2316. [Google Scholar] [CrossRef] [Scilit]
- Sanogo, S.; Fink, A.H.; Omotosho, J.B.; Ba, A.; Redl, R.; Ermert, V. Spatio-temporal characteristics of rainfall recovery in West Africa. Int. J. Climatol. 2015, 35, 4589–4605. [Google Scholar] [CrossRef] [Scilit]
- Blakeley, S.L.; Sweeney, S.; Husak, G.; Harrison, L.; Funk, C.; Peterson, P.; Osgood, D.E. Identifying precipitation and reference evapotranspiration trends in West Africa to support drought insurance. Remote Sens. 2020, 12, 2432. [Google Scholar] [CrossRef] [Scilit]
- Nouaceur, Z.; Murarescu, O. Rainfall variability and trend analysis of rainfall in West Africa (Senegal, Mauritania, Burkina Faso). Water 2020, 12, 1754. [Google Scholar] [CrossRef] [Scilit]
- Röhrig, F.; Gloy, N.; von Loeben, S.C.; Gornott, C.; Arumugam, P.; Aschenbrenner, P.; Baek, H.-R.-L.; Bado, I.; Chemura, A.; Habtemariam, L.T.; et al. Climate Risk Analysis for Identifying and Weighing Adaptation Strategies for the Agricultural Sector in Burkina Faso; Potsdam Institute for Climate Impact Research (PIK): Potsdam, Germany, 2021. [Google Scholar] [CrossRef]
- Issahaku, A.R.; Campion, B.B.; Edziyie, R. Rainfall and temperature variability in northern Ghana. Earth Space Sci. 2016, 3, 284–294. [Google Scholar] [CrossRef] [Scilit]
- Egeru, A.; Wasonga, O.; Kyagulanyi, J.; MacOpiyo, L.; Mburu, J.; Tabuti, J.R.S. Spatio-temporal dynamics of forage and land cover changes in Karamoja sub-region, Uganda. Pastoralism 2014, 4, 6. [Google Scholar] [CrossRef] [Scilit]
- Alemayehu, T.; Assogba, G.M.; Gabbert, S.; Giller, K.E.; Hammond, J.; Arouna, A.; Dossou-Yovo, E.R.; Ven, G.W.V.D. Farming systems, food security and farmers’ awareness of ecosystem services in inland valleys: A study from Côte d’Ivoire and Ghana. Front. Sustain. Food Syst. 2022, 6, 892818. [Google Scholar] [CrossRef] [Scilit]
- Yiran, G.A.B.; Stringer, L.C. Spatio-temporal analyses of impacts of multiple climatic hazards in a savannah ecosystem of Ghana. Clim. Risk Manag. 2016, 14, 11–26. [Google Scholar] [CrossRef] [Scilit]
- Funk, C.; Peterson, P.; Landsfeld, M.; Pedreros, D.; Verdin, J.; Shukla, S.; Harrison, L.; Rowland, J.; Hoell, A.; Michaelsen, J. The Climate Hazards InfraRed Precipitation with Stations (CHIRPS). Sci. Data 2015, 2, 150066. [Google Scholar] [CrossRef] [Scilit] [PubMed]
- Dembélé, M.; Zwart, S.J. Evaluation and comparison of satellite-based rainfall products in Burkina Faso, West Africa. Int. J. Remote Sens. 2016, 37, 3995–4014. [Google Scholar] [CrossRef] [Scilit]
- Toté, C.; Patricio, D.; Boogaard, H.; van der Wijngaart, R.; Tarnavsky, E.; Funk, C. Evaluation of satellite rainfall estimates for drought and flood monitoring in Mozambique. Remote Sens. 2015, 7, 1758–1776. [Google Scholar] [CrossRef] [Scilit]
- Muñoz-Sabater, J.; Dutra, E.; Agustí-Panareda, A.; Albergel, C.; Arduini, G.; Balsamo, G.; Boussetta, S.; Choulga, M.; Harrigan, S.; Hersbach, H.; et al. ERA5-Land: A state-of-the-art global reanalysis dataset for land applications. Earth Syst. Sci. Data 2021, 13, 4349–4383. [Google Scholar] [CrossRef] [Scilit]
- Hargreaves, G.H.; Samani, Z.A. Reference crop evapotranspiration from temperature. Appl. Eng. Agric. 1985, 1, 96–99. [Google Scholar] [CrossRef] [Scilit]
- van Rooy, M.P. A rainfall anomaly index independent of time and space. Notos 1965, 14, 43–48. [Google Scholar]
- Hänsel, S.; Schucknecht, A.; Matschullat, J. The modified rainfall anomaly index (mRAI)—Is this an alternative to the standardized precipitation index (SPI) in evaluating future extreme precipitation characteristics? Theor. Appl. Climatol. 2016, 123, 827–844. [Google Scholar] [CrossRef] [Scilit]
- Hare, W. Assessment of Knowledge on Impacts of Climate Change Contribution to the Specification of Art. 2 of the UNFCCC; WBGU (German Advisory Council on Global Change): Berlin, Germany, 2003. [Google Scholar]
- Gilbert, R.O. Statistical Methods for Environmental Pollution Monitoring; Van Nostrand Reinhold: New York, NY, USA, 1987. [Google Scholar]
- Ahmad, M.I.; Sinclair, C.D.; Werritty, A. Log-logistic flood frequency analysis. J. Hydrol. 1988, 98, 205–224. [Google Scholar] [CrossRef] [Scilit]
- Yue, Y.; Liu, H.; Mu, X.; Qin, M.; Wang, T.; Wang, Q.; Yan, Y. Spatial and temporal characteristics of drought and its correlation with climate indices in Northeast China. PLoS ONE 2021, 16, e0259774. [Google Scholar] [CrossRef] [Scilit] [PubMed]
- Achilleos, G.A. The inverse distance weighted interpolation method and error propagation mechanism—Creating a DEM from an analogue topographical map. J. Spat. Sci. 2011, 56, 283–304. [Google Scholar] [CrossRef] [Scilit]
- Maleika, W. Inverse distance weighting method optimization in the process of digital terrain model creation based on data collected from a multibeam echosounder. Appl. Geomat. 2020, 12, 397–407. [Google Scholar] [CrossRef] [Scilit]
- Fang, Y.; Qian, H.; Chen, J.; Xu, H. Characteristics of spatial-temporal evolution of meteorological drought in the Ningxia Hui Autonomous Region of Northwest China. Water 2018, 10, 992. [Google Scholar] [CrossRef] [Scilit]
- Nicholson, S.E. On the question of the recovery of the rains in the West African Sahel. J. Arid Environ. 2005, 63, 615–641. [Google Scholar] [CrossRef] [Scilit]
- Usman, M.; Nichol, J.E.; Ibrahim, A.T.; Buba, L.F. A spatio-temporal analysis of trends in rainfall from long-term satellite rainfall products in the Sudano-Sahelian zone of Nigeria. Agric. For. Meteorol. 2018, 260–261, 273–286. [Google Scholar] [CrossRef] [Scilit]
- Samset, B.H.; Zhou, C.; Fuglestvedt, J.S.; Lund, M.T.; Marotzke, J.; Zelinka, M.D. Steady global surface warming from 1973 to 2022 but increased warming rate after 1990. Commun. Earth Environ. 2023, 4, 400. [Google Scholar] [CrossRef] [Scilit]
- Nicholson, S.E.; Some, B.; Kone, B. An analysis of recent rainfall conditions in West Africa, including the rainy seasons of the 1997 El Niño and the 1998 La Niña years. J. Clim. 2000, 13, 2628–2640. [Google Scholar] [CrossRef] [Scilit]
- Nicholson, S.E.; Funk, C.; Fink, A.H. Rainfall over the African continent from the 19th through the 21st century. Glob. Planet. Change 2018, 165, 114–127. [Google Scholar] [CrossRef] [Scilit]
- Vicente-Serrano, S.M.; Beguería, S.; López-Moreno, J.I. A multiscalar drought index sensitive to global warming: The standardized precipitation evapotranspiration index. J. Clim. 2010, 23, 1696–1718. [Google Scholar] [CrossRef] [Scilit]

Disclaimer/Publisher’s Note: The statements, opinions and data contained in all publications are solely those of the individual author(s) and contributor(s) and not of MDPI and/or the editor(s). MDPI and/or the editor(s) disclaim responsibility for any injury to people or property resulting from any ideas, methods, instructions or products referred to in the content. |
© 2026 by the author. Licensee MDPI, Basel, Switzerland. This article is an open access article distributed under the terms and conditions of the Creative Commons Attribution (CC BY) license.