


Abstract
This study investigates the impact of assimilating Advanced Scatterometer (ASCAT) Level-2 surface soil moisture retrievals into the Application of Research to Operations at Mesoscale (AROME) model, the operational numerical weather prediction system of the Hungarian Meteorological Service. The Level-2 retrievals are geophysical soil moisture estimates derived from satellite radar backscatter observations and represent the uppermost soil layer (approximately 0–5 cm). Data assimilation is performed using a Simplified Extended Kalman Filter (SEKF) within the SURFEX surface modeling platform. In the reference configuration (REF), the same SEKF framework is applied, as used operationally for the assimilation of 2 m temperature and relative humidity observations. A second experiment (ASCAT) extends this configuration by additionally assimilating ASCAT surface soil moisture retrievals. The experimental period covers May–October 2023. The objective of the study is to quantify the added value of ASCAT soil moisture assimilation relative to the REF experiment, which does not assimilate ASCAT retrievals. Results indicate a systematic improvement in root-zone soil moisture and soil temperature, suggesting that the assimilation of surface soil moisture observations propagates beneficially to deeper soil layers. Verification against in situ and model-derived diagnostics shows a positive impact on near-surface atmospheric variables, particularly for 2 m temperature and humidity during nighttime conditions. Furthermore, precipitation verification reveals a measurable improvement, suggesting a beneficial influence of improved land–atmosphere coupling on short-range forecasts.
1. Introduction
Soil moisture is a key variable controlling the exchange of water and energy between the land surface and the atmosphere and plays a fundamental role in weather forecasting, hydrological prediction, and climate monitoring through its influence on evapotranspiration, runoff, and vegetation development [1,2]. Several studies have demonstrated that accurate representation of soil moisture can improve the simulation of near-surface meteorological variables, particularly during periods of strong land–atmosphere coupling, when soil moisture variations substantially modify the partitioning of surface energy between latent and sensible heat fluxes and thereby affect near-surface temperature, humidity, and boundary layer development [3].
Land surface models (LSMs) have a good representation of soil moisture, but their performance is often limited by uncertainties in model parameterizations and initial conditions [4,5]. These errors can propagate and accumulate during model integration, resulting in systematic biases in simulated soil moisture states. Therefore, the assimilation of observational data into land surface models is essential for improving the accuracy and reliability of land surface analyses [6,7].
The data assimilation combines observations with model background information, with their relative contributions determined by the assumed background and observation error statistics [8,9]. In land surface data assimilation, the assimilation of conventional and non-conventional (e.g., satellite) observations into land surface models is commonly performed using Kalman filtering methods, including the Extended Kalman Filter (EKF), the Simplified Extended Kalman Filter (SEKF), and the Ensemble Kalman Filter (EnKF) approaches. The EKF propagates forecast error covariances using a tangent-linear approximation of the nonlinear model dynamics. The SEKF further reduces computational costs by employing simplified estimates of the model sensitivities. In contrast, the EnKF estimates forecast error statistics from an ensemble of model realizations, with error covariances being approximated from the ensemble statistics rather than propagated explicitly. These approaches have been shown to be effective for soil moisture assimilation [7,10,11].
In situ soil moisture measurements provide high-quality datasets; however, they remain sparse and unevenly distributed and limited in their representativeness of regional and global soil moisture conditions [12]. Consequently, land data assimilation systems often rely on indirect observations, such as 2 m temperature and relative humidity, which contain information on soil moisture through land–atmosphere interactions [11,13]. Satellite remote sensing also offers a reliable alternative with frequent and spatially extensive observations of near-surface soil moisture [14]. In particular, active microwave sensors operating in the C-band have demonstrated a strong sensitivity to changes in surface soil moisture (≤5 cm depth) [15]. The soil moisture product derived from the EUMETSAT ASCAT instrument has become one of the most widely used satellite soil moisture datasets due to its temporal consistency, extensive spatial coverage, and continuous operational availability [16].
Several studies have reported improvements in soil moisture analyses, vegetation-related variables, and land–atmosphere exchanges following the assimilation of ASCAT soil moisture and other satellite-derived products, such as leaf area index (LAI) [17,18,19]. These investigations focused on long-term offline experiments, where the impact of the observations can be evaluated over extended periods.
In an operational numerical weather prediction environment, the requirements are different. The effectiveness of soil moisture assimilation must be evaluated within a fully coupled forecasting system, where the computational efficiency, and its impact on the forecast are of primary importance. Although ASCAT soil moisture has been used in many land data assimilation systems, its influence is highly dependent on factors such as meteorological model, observation operators, bias correction methodology, and local climatic conditions. Furthermore, the representation of the relationship between the surface soil layer observed by ASCAT and the deeper soil reservoirs simulated by surface models remains a challenge in the assimilation process. Despite these challenges, several publications have demonstrated the benefits of assimilating ASCAT soil moisture observations [5,7,20,21].
The AROME (Application of Research to Operations at Mesoscale) numerical weather prediction model has been used at the Hungarian Meteorological Service since 2010 [22] and it combines the ALADIN (Aire Limitée Adaptation dynamique Développement InterNational) dynamical core, Meso-NH physics, and the SURFEX (SURFace Externalisée) land surface model. The SURFEX includes dedicated land data assimilation capabilities and has been widely used in both research and operational applications. In the Hungarian operational implementation, surface analysis was initially based on an optimal interpolation (OI) scheme, in which 2 m temperature and relative humidity observations were assimilated to update soil temperature and moisture states. Since 2022, however, the SEKF has been implemented operationally for the assimilation of screen-level atmospheric observations [23].
This study investigates the assimilation of MetOp-B ASCAT soil moisture observations within the AROME–SURFEX land data assimilation system using SEKF. First, the ASCAT data processing and assimilation methodology are described. The satellite-derived soil moisture estimates are then evaluated against in situ measurements from two regions of Hungary. The impact of ASCAT assimilation is assessed through a comparison of experiments performed with and without ASCAT observations, with particular emphasis on analysis increments and Jacobian matrices. Finally, the effects of the assimilation on forecast performance are examined.
2. Model Description and Verification Metrics
In this section, the AROME numerical weather prediction model and the coupled land model, SURFEX, are presented (Section 2.1). The surface data assimilation method, SEKF is discussed in more detail in Section 2.2. The applied verification approaches are introduced in Section 2.3.
2.1. The AROME Model
The regional model used for the assimilation experiments was the AROME (Application of Research to Operations at Mesoscale), which is the operational numerical weather prediction (NWP) system of the Hungarian Meteorological Service (HungaroMet, Budapest, Hungary) [22,24].
AROME is a non-hydrostatic, spectral limited area model built upon the ALADIN spectral dynamical core [25]. The model employs a hybrid vertical coordinate and a spectral discretization with bi-periodic domain extension with elliptical truncation of the bi-Fourier spectral representation. The time integration is performed with a semi-implicit semi-Lagrangian time integration scheme. The horizontal diffusion is treated with the semi-Lagrangian horizontal diffusion scheme (SLHD) [26], and lateral boundary conditions are imposed using Davies-type relaxation. The lateral boundary conditions are provided by the European Centre for Medium-Range Weather Forecast / Integrated Forecast System (ECMWF/IFS) with a 1-hourly coupling frequency.
The physical parametrization schemes are derived from the Meso-NH French research model. The cloud microphysical processes are described using the ICE3 bulk one-moment microphysical scheme [27]. The turbulence and shallow convections are described using the eddy-diffusivity mass-flux (EDMF) framework. The surface processes are computed using the SURFEX (SURFace Externalisée) [28] externalized surface modeling platform. SURFEX applies a tiling approach in which each grid cell is partitioned into four surface types: vegetation, sea, urban areas, and lake. Surface energy and water fluxes are calculated separately for each tile. The nature tile is simulated using the ISBA (Interaction Soil–Biosphere–Atmosphere) scheme [29,30], which resolves the exchanges of heat and moisture between the soil–vegetation–snow continuum and the overlying atmosphere. In ISBA, a three-layer soil configuration is used (0–1 cm surface layer, 0–2 m root zone, and 2–3 m deep soil layer). The soil temperature and water content prognostic variables are computed using the force–restore method, in which external forcing (e.g., radiative fluxes and precipitation) is balanced by a relaxation term driving the system toward equilibrium.
Physiographic surface characteristics are prescribed from standard databases: Global Multi-resolution Terrain Elevation Data 2010 for orography, ECOCLIMAP-II for land covers, and Harmonized World Soil Database for soil texture [31,32,33].
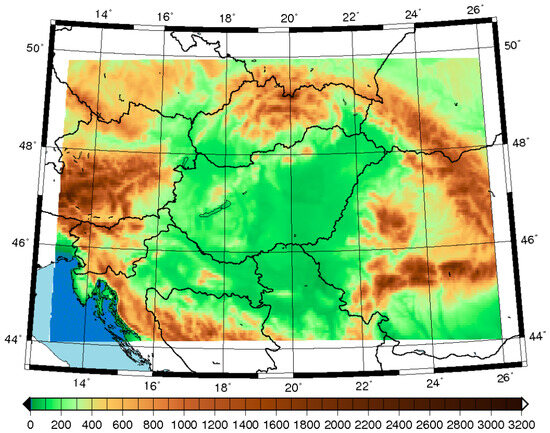
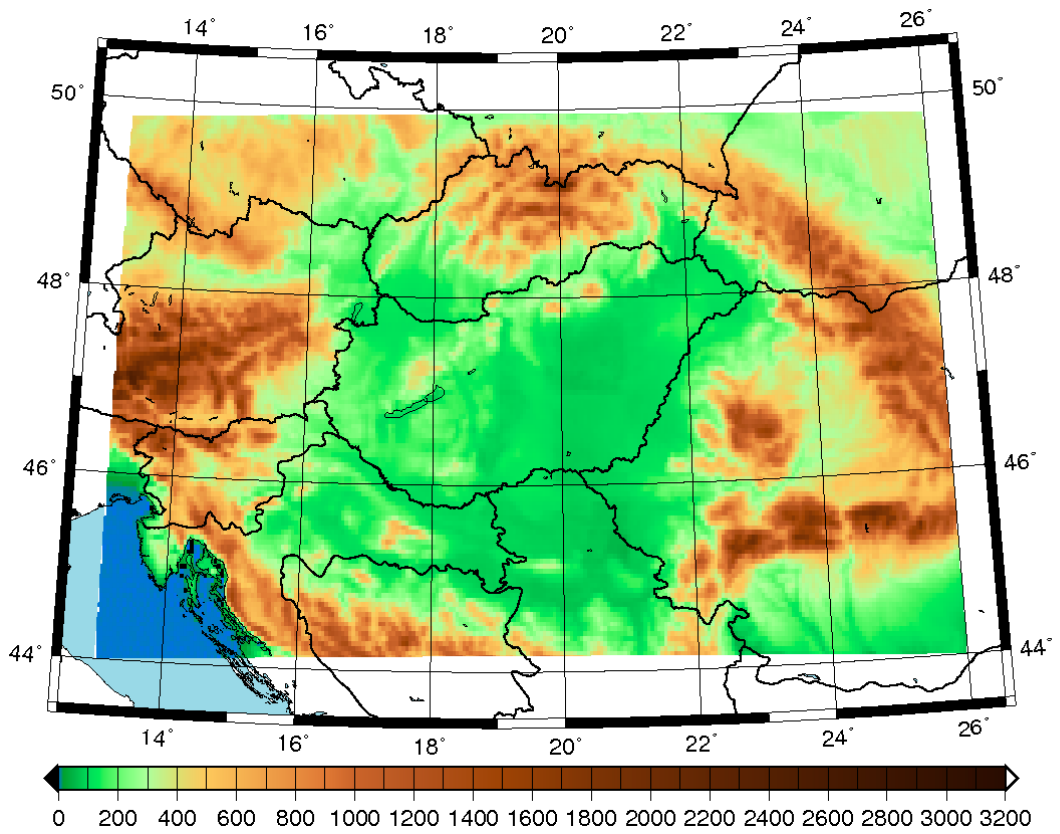
The model domain (Figure 1) has a horizontal grid spacing of 2.5 km and 60 vertical levels.
Figure 1.
Topography ([m] above sea level) of the operational AROME/HU domain.
2.2. Surface Data Assimilation in AROME
AROME uses a three-dimensional variational data assimilation (3D-Var) in upper air and a Simplified Extended Kalman Filter (SEKF) at the surface with a 3-hourly cycle and a 3-hourly assimilation window [34]. The atmospheric and land analysis generate the initial conditions for a coupled short-range forecast, which provides a first guess for both the atmospheric and the land surface analysis.
The pseudo-observations of 2 m air temperature and relative humidity are generated at each grid point by interpolating the synoptic observations using the optimal interpolation method. Subsequently, the soil moisture and soil temperature analyses are based on the SEKF and use the soil moisture products derived from ASCAT, as well as the pseudo-observations from the screen-level analysis. The SEKF is a one-dimensional system that is computed independently for each grid point:
where xa,i represents the analysis model state at an i-th grid point, xb,i denotes the background (first guess), yi is the observation vector and represents the nonlinear observation operator that projects the model values into the observation space. K is the Kalman gain, which provides the linear combination of the model variables and the observations, and it is expressed as:
where B and R are the background and observation error covariance matrices, respectively, and H is a linear observation operator expressed as a matrix through a Jacobian estimation calculated using the finite difference method by perturbing each component xi,j of the control vector x, where j denotes the control variable and i the grid point index. In this study, we use the SEKF, a simplified version of the EKF, in which the background error covariance matrix (B) is kept constant in time and R is assumed to be constant. The elements of the matrix H at a given time t, corresponding to the m-th observation and j-th element of the control vector at i-th grid point, can be approximated using a finite difference method such as:
where xt is the control vector at time t and is a small perturbation applied to the j-th control variable.
2.3. Verification Metrics
Point-wise verification was conducted over Hungary using SYNOP observations. Scorecards were generated using the HARP (Hirlam-Aladin R Package for verification version 0.2.2) [35] and include several statistical measures of screen-level parameters, such as bias, mean absolute error (MAE), and root mean square error (RMSE).
The performance of the categorical precipitation forecasts was evaluated using the Equitable Threat Score (ETS) and the Frequency Bias Index (FBI) for point-based verification and the Fractions Skill Score (FSS) for spatial verification. The precipitation skill scores are evaluated against radar measurements.
2.3.1. Equitable Threat Score
The Equitable Threat Score (ETS, also known as the Gilbert Skill Score) was used to evaluate categorical precipitation forecasts. The ETS quantifies the skill of forecasts for events exceeding a specified threshold by accounting for hits that would be expected to occur purely by random chance [36]. The ETS is defined as:
where H denotes the number of correctly forecasted events (hits), Hr is number of hits expected by random chance, F is number of false alarms, and M is the number of missed events. The ETS ranges from −1/3 to 1, where 1 indicates a perfect forecast, 0 corresponds to no skill relative to random chance, and negative values indicate performance worse than random forecasting.
2.3.2. Frequency Bias Index
The Frequency Bias Index (FBI) or BIAS was used to quantify the relative frequency of forecasted events compared to observed events [37]. The FBI evaluates whether the forecasting system systematically overestimates or underestimates event occurrence. The index is defined as:
where H denotes the number of hits, F is the number of false alarms, and M is the number of misses. An FBI value greater than 1 indicates overforecasting, whereas a value less than 1 indicates underforecasting. A value equal to 1 denotes an unbiased forecast frequency; however, it does not necessarily imply high forecast accuracy.
2.3.3. Fractions Skill Score
The Fractions Skill Score (FSS) is a spatial verification metric primarily used to evaluate high-resolution precipitation forecasts. It was introduced to address the double penalty problem inherent in traditional grid point verification methods [38].
Instead of comparing forecasts and observations at individual grid points, FSS evaluates the fraction of threshold-exceeding events within a defined spatial neighborhood. This approach takes into account displacement errors and evaluates the structural agreement between the forecast and observed fields in a scale-dependent manner. It compares the fractional coverage of events in windows of defined size surrounding the observations and forecasts:
where ff,i is a forecast fraction of the events in the grid box i, fo,i is the observed fraction of the events in grid point i, and N is the total number of grid points. The FSS ranges from 0 to 1, where 1 indicates perfect agreement.
FSS was calculated for precipitation thresholds of 1, 5, 10, and 20 mm, representing the precipitation intensity from stratiform to convective. Forecast lead times of +6, +12, +18, and +24 h were considered.
3. Data
3.1. ASCAT Soil Moisture Data Preprocessing
The soil moisture satellite product is derived from the Advanced Scatterometer (ASCAT) instrument aboard the Meteorological Operational (MetOp) satellites operated by the European Organization for the Exploitation of Meteorological Satellites (EUMETSAT). MetOp-B is a quasi-polar orbiting satellite at an altitude of approximately 800 km and has been providing measurements since 2012 [39]. ASCAT is a C-band radar instrument, operating at a frequency of 5.255 GHz, designed to measure radar backscatter from the Earth’s surface. The ASCAT Level-2 soil moisture product is derived from radar backscatter observations and represents the relative moisture conditions in the uppermost soil layer, which is approximately 0–5 cm. ASCAT passes over Central Europe twice daily, around 07:00 and 19:00 UTC, allowing the retrieval of near-real-time surface soil moisture observations with a spatial resolution of around 25 km. These EUMETSAT soil moisture observations are used within the framework of the Satellite Application Facility on Support to Operational Hydrology and Water Management (H-SAF) [40].
In this study, we used the disaggregated H08 product, with static downscaling parameters estimated from Advanced Synthetic Aperture Radar (ASAR) data acquired by the Environmental Satellite (ENVISAT) [41]. The derived soil moisture product represents the degree of saturation in the upper 1–2 cm of the soil and ranges between the extremes corresponding to completely dry conditions and a fully saturated water capacity, and the values are expressed as percentages over the European region at a horizontal resolution of 1 km [42,43]. The raw backscatter measurements, obtained at several incidence angles and from three separate radar beams, are linearly regressed to produce a single equivalent backscatter value at a 40° incidence angle. Furthermore, quality control of the observations is important to exclude measurements prone to gross errors. We therefore avoid wetlands, mountainous regions, and snow-covered areas where the relationship between backscatter measurements and soil moisture is weaker.
Since raw satellite observations are not directly suitable for use in surface data assimilation, comprehensive preprocessing is required to ensure consistency and reliability. These preprocessing steps are as follows:
- Regridding: The first step is to interpolate the raw data onto the Lambert conformal grid used by the AROME model with the Climate Data Operators (CDOs) tool [44]. The first-order conservative remapping method was applied, which preserves the integral of extensive quantities during the interpolation process.
- Unit conversion: AROME requires volumetric soil moisture (SSM) rather than percentage soil moisture (SM):where wmax and wmin are the volumetric soil moisture values calculated from the model climatology for several years.
- Bias correction: Systematic differences exist between soil moisture estimates derived from ASCAT observations and those simulated by the AROME model. These differences, or biases, arise from a variety of sources, including differences in spatial resolution, land cover inconsistency, and model parameterizations as well as uncertainties in the satellite retrieval algorithms. To ensure that the satellite data are consistent with the model climatology, the ASCAT soil moisture observations must be calibrated prior to assimilation. For this purpose, we apply the Cumulative Distribution Function (CDF) matching technique, which adjusts the statistical distribution of the satellite-derived soil moisture values to match that of the model. This approach reduces the inconsistencies between the two datasets and provides a harmonized input for data assimilation [45]:where , and are coefficients, SSMmod denotes the soil moisture values for the model, and SSMsat represents the original and SSMsat ′ represents the bias-corrected satellite measurements. For the CDF matching procedure, the mean and standard deviation must be calculated for both the observations and the model data, preferably over a longer time period. In this study, these statistics were computed for the period from 1 November 2018 to 31 May 2024. The parameters p1 and p2 can be derived either for the entire period or on a seasonal or monthly basis; in this study the seasonal approach was chosen.
- Filtering: After correcting for systematic error, further filtering of the data is necessary. For example, we discard satellite measurement for which the retrieval soil moisture error exceeds 8%. The estimated error is provided with the ASCAT Level-2 product. Other possible criteria include excluding observations over complex terrain or water surfaces [46,47], although this additional filtering was not applied in the present study.
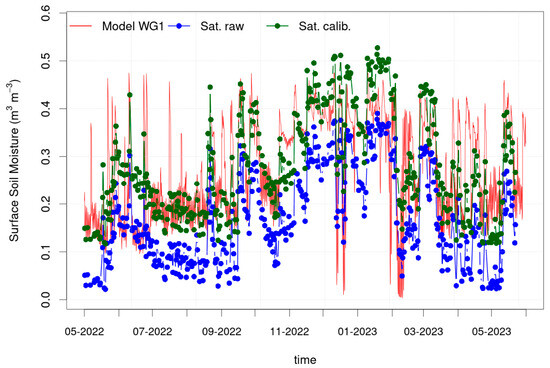
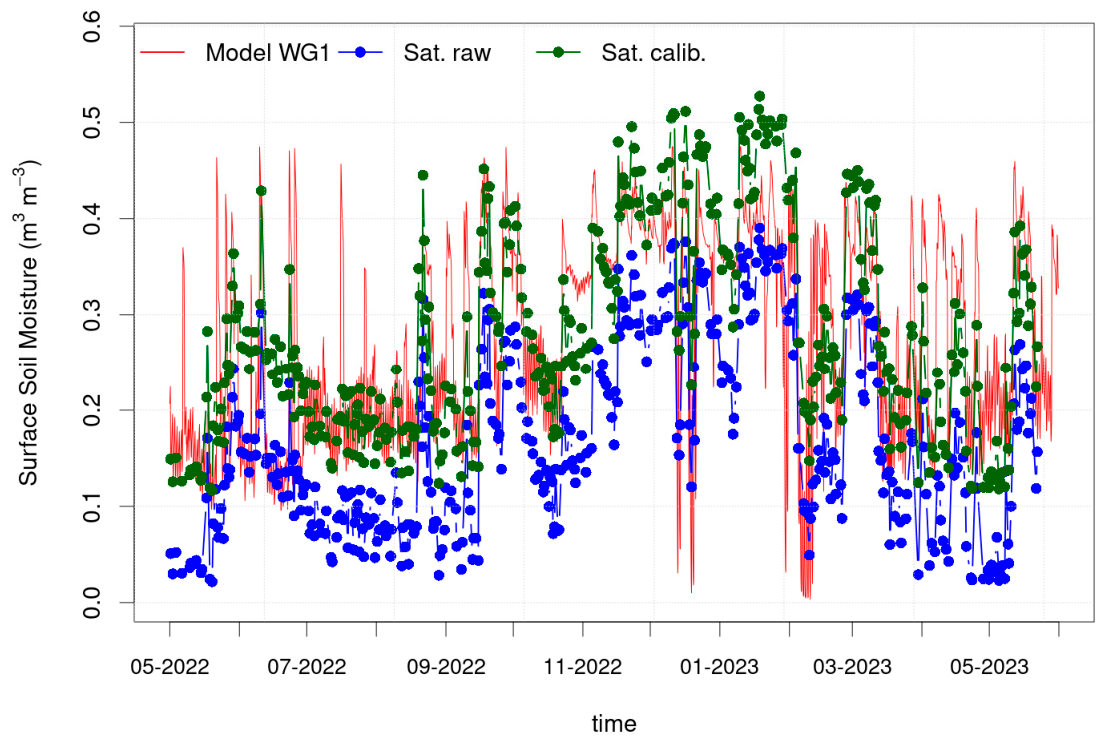
Time series of the CDF matching at the Dávod (46.00° N, 18.94° E) grid point are shown in Figure 2. After applying the seasonal CDF matching, the calibrated satellite soil moisture values are brought into closer agreement with the model soil moisture.
Figure 2.
Time series of modeled and satellite-derived soil moisture at the Dávod station (46.00° N, 18.94° E) from May 2022 to May 2023.
Table 1 summarizes the statistical characteristics of the measured (ASCAT) and modeled soil moisture values over the AROME domain for 1–31 May 2023. ASCAT raw refers to the original ASCAT measurements expressed as percentages, while ASCAT pre-CDF and ASCAT post-CDF denote the rescaled ASCAT volumetric soil moisture values [m3m−3] before and after CDF matching, respectively. As expected, prior to CDF, the ASCAT soil moisture exhibits a much higher median than AROME, whereas the mean, standard deviation, and maximum values are of comparable magnitude. Following CDF matching, the median of ASCAT volumetric soil moisture shows improved agreement with the model. However, the maximum value becomes overestimated, indicating an amplification of extreme wet values, associated with a well-known limitation of CDF-based rescaling methods. The CDF matching may overestimate soil moisture due to bias propagation from the reference data distribution [48].
Table 1.
Statistical comparison of ASCAT-derived and modeled soil moisture over the AROME domain for 1–31 May 2023.
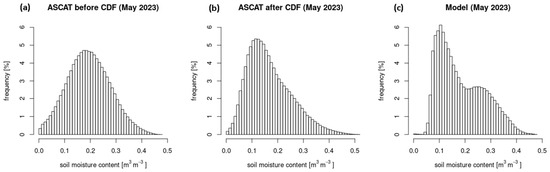
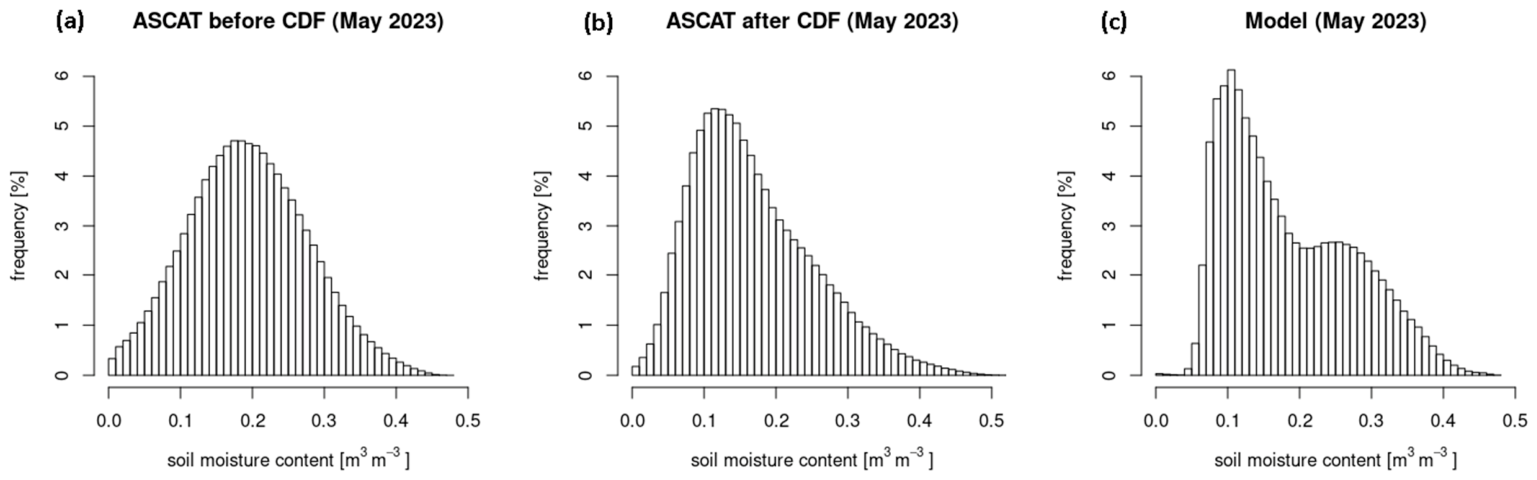
Figure 3 presents histograms of surface soil moisture for the entire AROME domain in May 2023. Soil moisture content has a wide dynamic range, with values occasionally falling below the wilting point and exceeding the field capacity. The figure compares the rescaled pre-CDF (Figure 3a) and post-CDF (Figure 3b) ASCAT measurements with the modeled soil moisture (Figure 3c), where the model simulation does not include the assimilation of ASCAT observations. The distributions of the pre-CDF and post-CDF ASCAT datasets differ significantly. The pre-CDF distribution is relatively symmetric, with a peak near 0.20 m3m−3, whereas the post-CDF distribution is shifted toward lower values, peaking around 0.13 m3m−3, in closer agreement with the modeled soil moisture distribution. Consistently with the summary statistics in Table 1, approximately half of the pre-CDF measurements are below 0.19 m3m−3, while after CDF matching the median decreases to about 0.15 m3m−3. This shift indicates that CDF matching effectively adjusts the central tendency of the satellite-derived soil moisture toward that of the model, albeit at the expense of an overestimation of the upper tail of the distribution. Similar behavior has been reported in previous studies applying CDF matching to satellite soil moisture datasets [46,49].
Figure 3.
Histograms of surface soil moisture for the entire AROME domain in May 2023 for (a) rescaled pre-CDF ASCAT, (b) rescaled post-CDF ASCAT, and (c) modeled soil moisture from a simulation without ASCAT data assimilation.
Furthermore, the bimodal distribution of modeled soil moisture suggests the presence of two preferred hydrological regimes (dry and wet states), likely driven by model parameterizations and threshold-like processes. In contrast, the ASCAT-derived soil moisture shows a more unimodal distribution, reflecting spatial heterogeneity.
3.2. In Situ Measurements
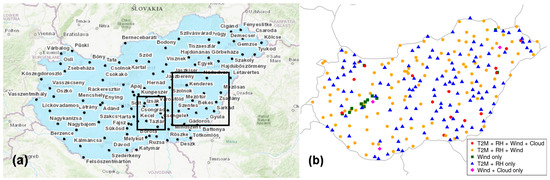
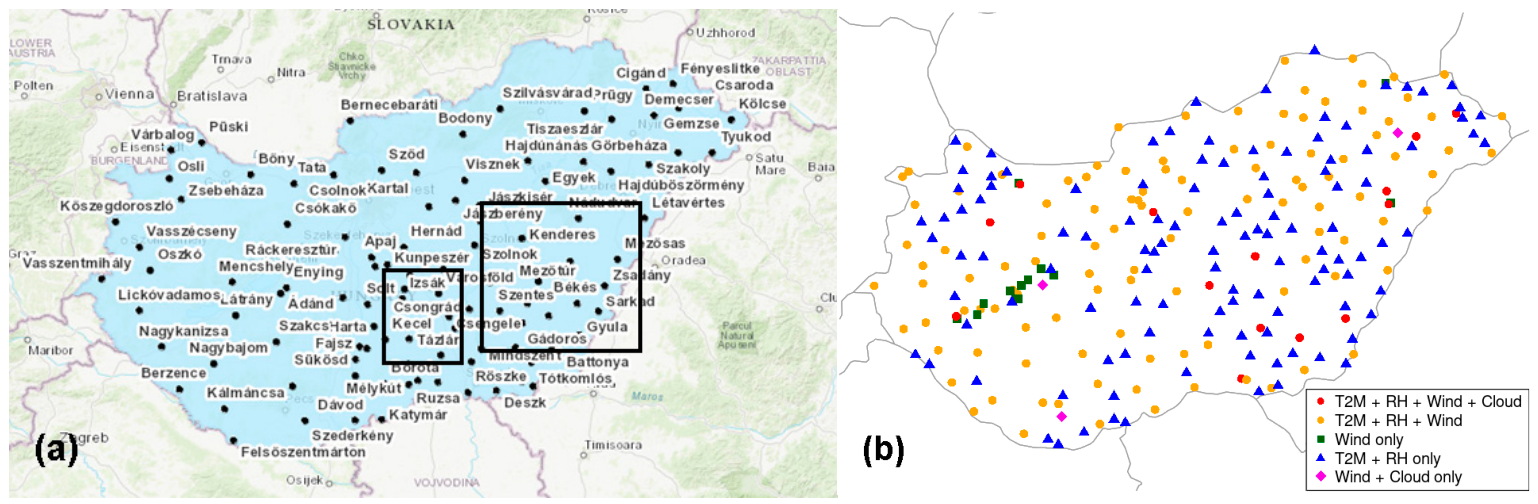
The soil in situ soil measurement data used in this study are provided by the Operational Drought and Water Scarcity Monitoring System (aszalymonitoring.vizugy.hu). Soil temperature and soil moisture measurements from 116 stations are available at multiple depths (10, 20, 30, 45, 60, and 75 cm) with hourly temporal resolution [50]. In addition, basic meteorological parameters, such as air temperature, relative humidity, and precipitation, are also provided. Figure 4a illustrates the full network of monitoring stations across Hungary. The selection of monitoring station sites was achieved by several criteria to ensure representativeness and reliability. Stations were located in agriculturally utilized areas, preferably on arable land, with soil type typical of the surrounding region. In addition, the locations had to be free from inland water, avoiding the complex topography, and located far from operational meteorological stations to prevent data redundancy.
Figure 4.
(a) Sites of the Operational Drought and Water Scarcity Monitoring System for soil temperature and soil moisture, along with the analyzed areas for sandy (left rectangle) and clay (right rectangle) soils and (b) the HungaroMet SYNOP stations used for validation of meteorological parameters.
The validation of 2 m temperature, relative humidity, 10 m wind speed and sky cover fraction is based on the SYNOP network of the HungaroMet (Figure 4b). There are over 240 stations provide temperature and relative humidity observations, over 140 stations provide wind speed observations and around 20 stations provide visually observed cloud cover data.
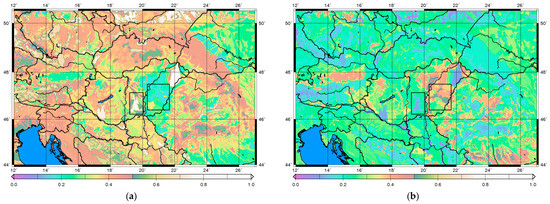
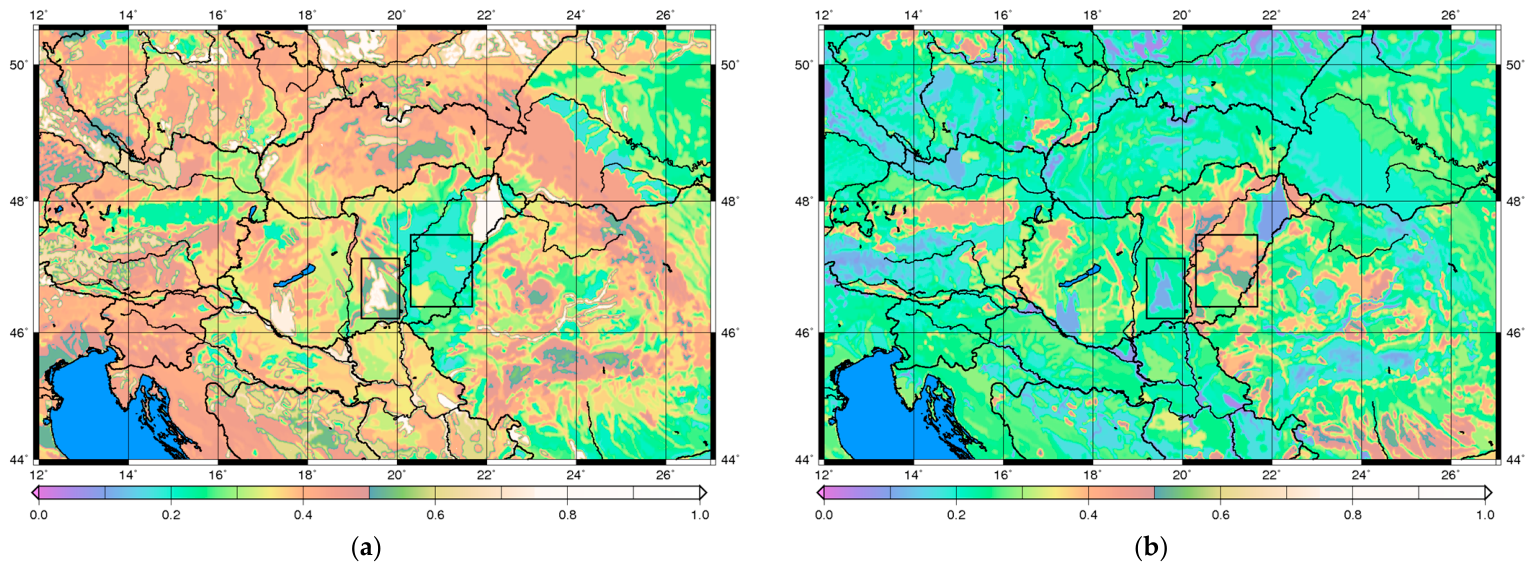
The model analysis and forecast evaluation for soil moisture and soil temperature were conducted in two sub-areas with different soil characteristics (Figure 5). The eastern, framed sub-area is predominantly composed of clay-loam soils, while the central sub-area of the country is characterized by sandy soils. These different soil types are relevant to this study because clay-loam soils typically exhibit higher water retention and slower drainage, while sandy soils drain faster and retain less moisture. Therefore, analyzing both sub-areas allows us to assess the performance of satellite and model soil moisture data under different hydrological conditions and soil textures.
Figure 5.
Spatial distribution of sand fraction (a) and clay fraction (b) in the AROME model soil texture and the analyzed areas for sandy (left rectangle) and clay (right rectangle) soils.
4. Experimental Setups
Forecasts from the reference model run (REF) have been used to quantify the impact of the ASCAT assimilation. In the REF experiment, 2 m temperature and relative humidity observations were assimilated, while in the ASCAT experiment, satellite observations were additionally used. REF and ASCAT experiments were conducted from May to October 2023 with a week-long spin-up period (23–30 April 2023). As mentioned earlier, the observation error matrix is assumed to be static and diagonal. The diagonal elements correspond to a standard deviation of 1 K for 2 m temperature and 7% for 2 m relative humidity, and these values were applied in both experiments. In the ASCAT experiment, surface soil moisture observations derived from ASCAT were additionally assimilated. The standard deviation of ASCAT observation error was 0.1 × (wfc − wwilt) m3m−3, where wfc and wwilt denote the volumetric water content at field capacity and at the wilting point, respectively. This formulation scales the observation error with the local soil water holding capacity, thereby accounting for differences in soil texture and the dynamic range of soil moisture.
The background errors were assumed to be identical for the REF and ASCAT experiments. The standard deviations assigned to the background error covariance matrix were 0.1 × (wfc − wwilt) m3m−3 for the superficial total water content (WG1), 0.15 × (wfc − wwilt) m3m−3 for the root-zone water content (WG2), and 2 K for soil temperature in both layers (TG1 and TG2).
The perturbation magnitudes must be sufficiently small to maintain the validity of the linear approximation used in the estimation of the Jacobian of the observation operator. In this study, perturbations of 10−4 m3m−3 were applied for soil moisture and 10−5 K for soil temperature. These values were selected as a compromise between preserving the linearity assumption and avoiding numerical precision issues in the finite difference approximation used in the SEKF.
Regarding the computation of the Jacobians, the linearity check method described in [13] was applied. In this approach, both positive and negative perturbations are introduced for each control variable, and their effects on the model output are compared to ensure a linear response.
The main model and data assimilation settings used in the REF and ASCAT experiments are summarized in Table 2.
Table 2.
Model and data assimilation settings used in the REF and ASCAT experiments.
5. Results
This section shows the evaluation of the initial soil conditions in comparison to in situ soil moisture and soil temperature measurements. Then the components (first guess departure, analysis increments, Jacobians) of the SEKF method are shown for the REF and ASCAT cases. Finally, the effect of ASCAT soil moisture assimilation on forecasts of precipitation and screen-level variables are analyzed using verification scores against station and radar measurements.
5.1. Comparison to In Situ Measurements
5.1.1. Soil Moisture
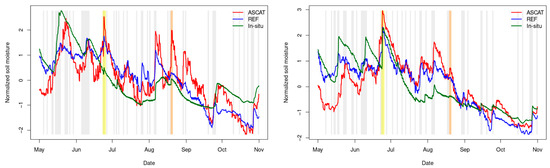
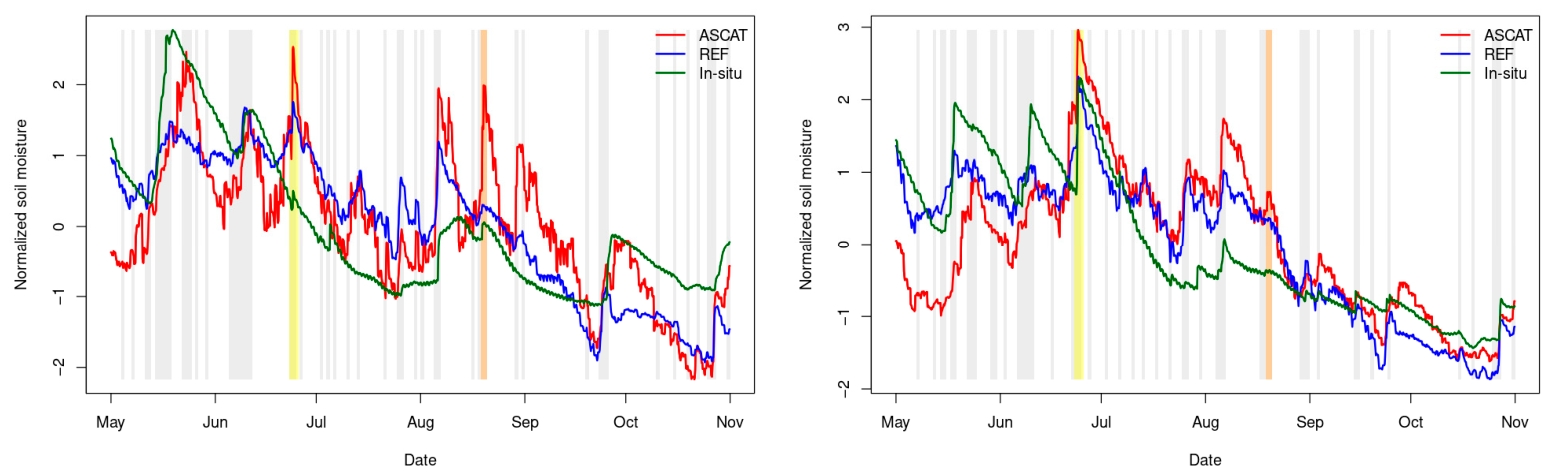
The temporal evolution of observed and modeled soil moisture is shown for the period from May to October 2023 for the two study areas in Figure 6. In situ measurements obtained at a depth of 30 cm are compared with modeled soil moisture analyses representative of the root zone. It should be noted that a direct quantitative comparison between observations and model results is not straightforward, since the model provides soil moisture integrated over the entire root zone, whereas the in situ observations represent volumetric water content at a specific depth. To facilitate comparison of temporal variability and dynamics of soil moisture, all soil moisture time series (both modeled and in situ) were standardized by subtracting their mean and dividing by their standard deviation. Normalization does not affect the relative timing or variability of the signals but allows a direct comparison of their temporal evolution of wetting and drying events across datasets. In the standardized representation, positive values indicate wetter than average soil conditions, whereas negative values correspond to drier than average conditions.
Figure 6.
Temporal evolution of average normalized soil moisture in the sandy soil area (a) and in the clay soil area (b) from May to October 2023. Grey shaded areas indicate precipitation events. Yellow and orange shaded areas highlight the selected case study periods discussed in Section 5.1.
Figure 6 illustrates the temporal evolution of average normalized soil moisture in the sandy soil area (left), and in the clay soil area (right). The grey shading columns indicate precipitation periods exceeding 1 mm day−1. The ASCAT experiment showed an improved representation of soil moisture dynamics during May and June 2023, with amplitudes closer to in situ. It followed rapid wetting events better, showing improved timing as well as more a realistic magnitude of the peaks. During mid- and late summer, the two simulations showed broadly similar temporal behavior; however, the REF simulation provided reduced peak amplitudes, resulting in a smoother soil moisture evolution while the ASCAT experiment tended to overestimate variability. In autumn, both models deviated from the in situ observations; they became too dry and showed excessively large negative anomalies.
In clay soils, the ASCAT-based experiment shows a pronounced underestimation of soil moisture during early May, while the REF simulation remains closer to the in situ observations. During June, the behavior becomes more dynamic. While both simulations capture the general temporal variability, the ASCAT experiment shows a strong overestimation during late June, likely associated with rapid wetting events, whereas the REF simulation provides a more damped response. During July and August, both simulations follow the overall drying trend; however, the ASCAT-based simulation tends to produce wetter conditions compared to the in situ observations, indicating a slight positive bias. In autumn, the temporal evolution of soil moisture showed good agreement between the modeled and observed time series, indicating an improved representation of soil moisture dynamics during this period.
The model versions generally captured soil moisture increases associated with large rainfall events accurately and with appropriate timing. A closer look at specific events highlights some notable differences. The models overestimated the intensity of the thunderstorm event on 23–24 June 2023 (highlighted in yellow column in Figure 6) in the sandy area, where only a smaller amount of rainfall occurred in reality. In the clay area, both measurements and models accurately indicated the abundant rainfall.
Another illustrative case occurred on 19 August 2023 at 09:00 UTC (highlighted in orange column in Figure 6). The ASCAT-derived measurement was relatively high in the sandy area (0.27 m3m−3 after CDF matching), and this signal was reflected in the assimilated soil moisture. No similarly large soil moisture values were observed in the clay area, and the ASCAT measurement was not exceptionally high there either. Only light, showery rainfall occurred in both areas during that period, according to both the models and observations.
Over the five-month simulation period, the correlation between the modeled and in situ soil moisture was 0.71 for the REF experiment and 0.61 for the ASCAT experiment in the sandy area and 0.85 and 0.65, respectively, in the clay area.
5.1.2. Soil Temperature
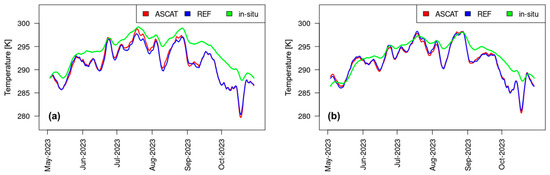
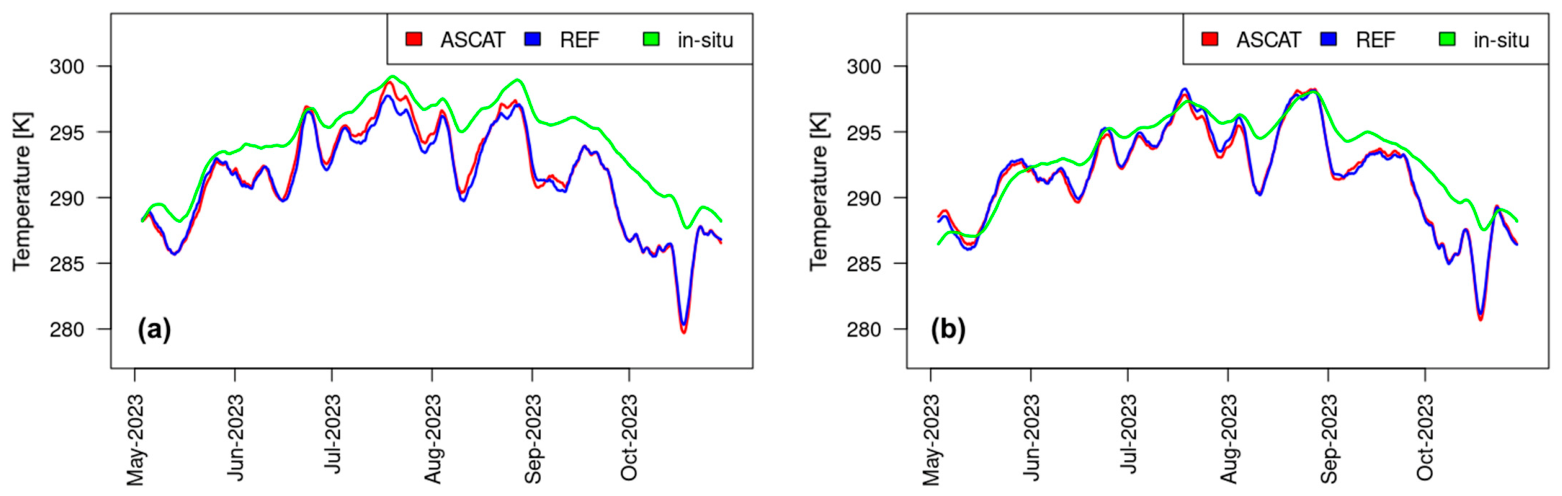
Figure 7 shows the temporal evolution of average soil temperature in the sandy soil area (left) and in the clay soil area (right) from May to October 2023. The in situ soil temperature values were taken at a depth of 30 cm, while the model analyses represent the root zone (TG2). Five-day moving averages were computed for datasets to smooth short-term fluctuations and better reveal the longer-term trends. During the simulation period, the models generally underestimated the measured temperatures. Both warming and cooling phases were captured with appropriate timing by the models; however, the magnitude of these variations was substantially larger in the simulations than in the observations. While the in situ measurements show temperature changes of 2–3 K, the model experiments indicate variations of up to 5–6 K. A pronounced cooling event occurred on 6 August 2023, when daytime air temperatures were already autumn-like, ranging between 295 and 297 K.
Figure 7.
Temporal evolution of average soil temperature in the sandy soil area (a) and in the clay soil area (b) from May to October 2023 for the root zone in the model and at 30 cm depth for the measurement values.
No significant differences were observed between the experiments. However, in July, the ASCAT experiment produced slightly higher TG2 values in the sandy area compared to the REF. In contrast, in the clay area, the ASCAT experiment resulted in slightly lower TG2 values.
Statistical comparisons were performed between the analyzed and observed soil temperature values over both study areas (Table 3). The correlations were high across all experiments, suggesting that both the REF and ASCAT-based simulations accurately capture the temporal variability of soil temperature. Biases and RMSE values reveal a modest underestimation of soil temperature by both model configurations, with smaller errors in the clay soil compared to the sandy soil. Overall, the ASCAT experiment shows slightly improved performance compared to the REF simulation.
Table 3.
Statistical comparisons of REF and ASCAT experiments.
5.2. First Guess Departure over the Entire Domain
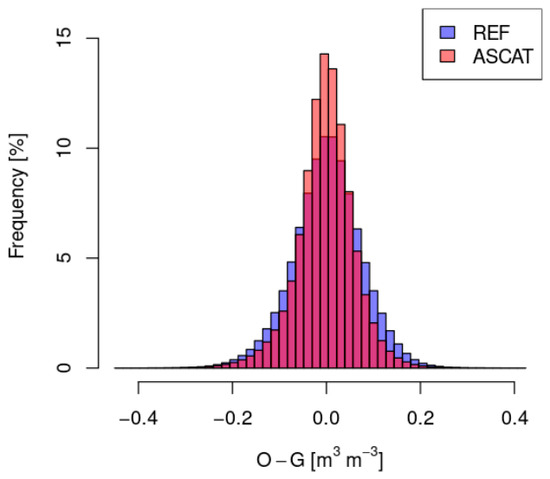
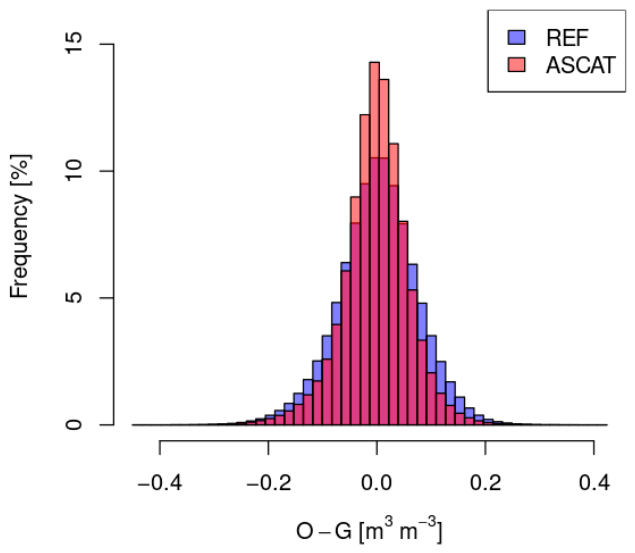
To evaluate the impact of ASCAT assimilation on the background soil moisture, first guess departures (observation minus guess, O–G) were computed for each analysis time and their distributions were analyzed for the REF and ASCAT-based experiments (Figure 8). Compared to the REF experiment, the ASCAT-based experiment shows reduced O–G bias and a narrower distribution, indicating an improved consistency between the background state and ASCAT observations. In the histogram computed over the five-month period, the REF distribution is slightly shifted towards higher values compared to ASCAT. Additional analysis indicates that this overall shift is mainly driven by the summer months, when the model tends to be wetter than ASCAT (positive O–G). In contrast, in May and October, the distributions are shifted toward lower values compared to ASCAT, suggesting slightly drier model conditions during spring and autumn.
Figure 8.
Surface soil moisture first guess departure (observation-first guess: O–G) histogram for May–October 2023.
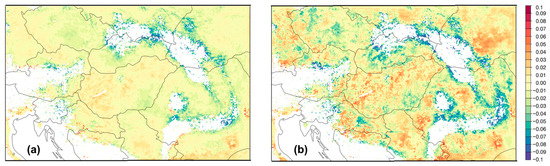
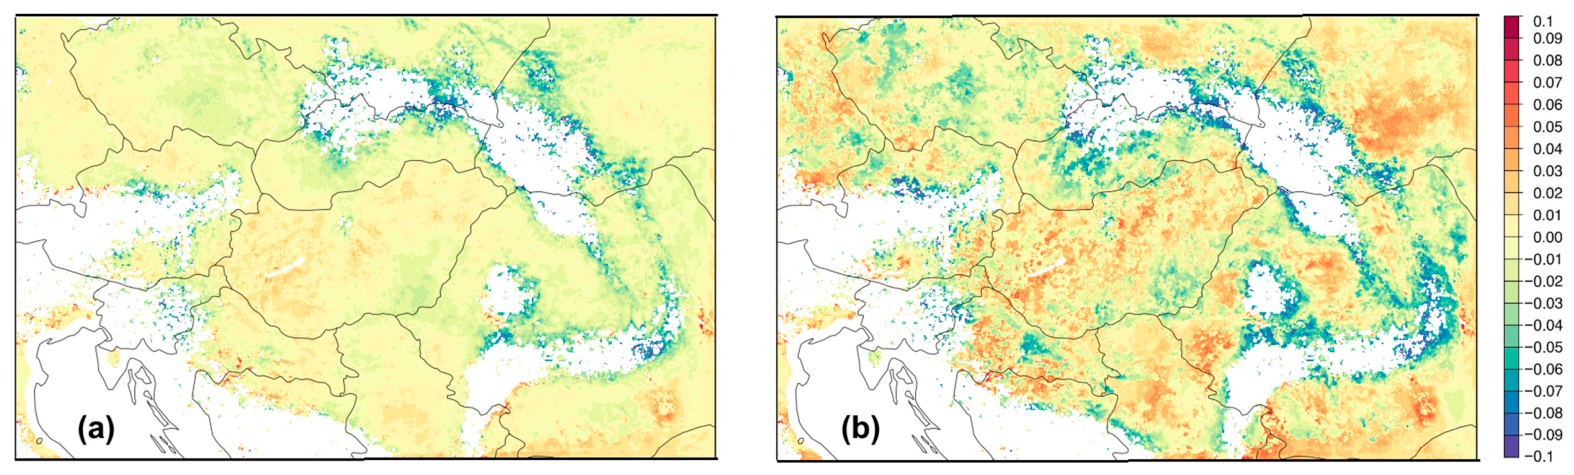
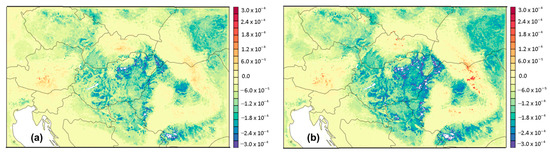
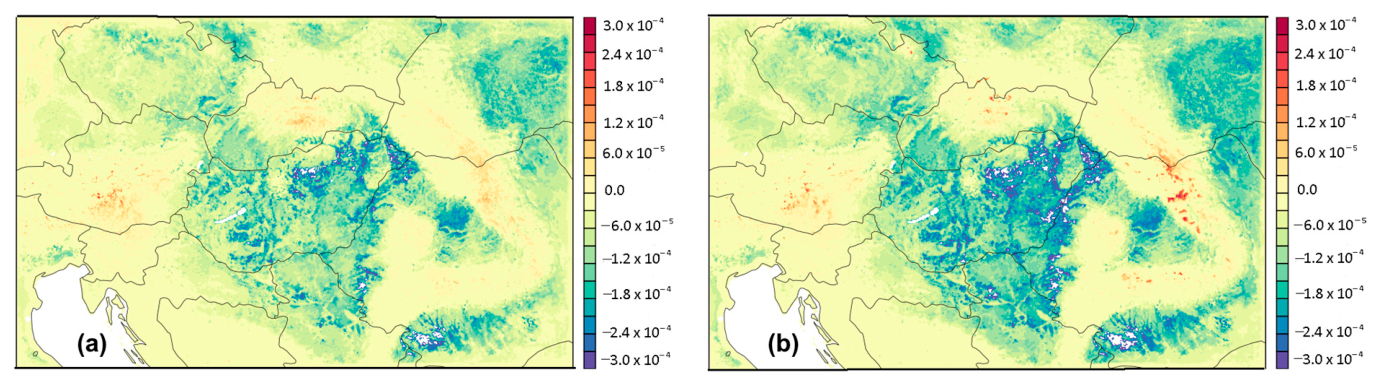
The spatial distribution of the mean surface soil moisture first guess departures shows predominantly positive values over most parts of Hungary in the REF dataset, with negative values appearing mainly over the southeastern region of the country (Figure 9). This indicates that, on average, the observations are higher than the model background over most areas, while the model tends to overestimate observations in the southeast. In the case of the ASCAT experiment, a similar spatial pattern is visible; however, the magnitude of the differences is considerably smaller, which is also consistent with the histogram distribution. The reduced amplitude in ASCAT-based O–G values may indicate a better agreement with the model background. In addition, the differences appear to be more pronounced during the summer period, which may be related to stronger surface moisture variability, increased evaporation, and enhanced soil–atmosphere coupling.
Figure 9.
Spatial distribution of the mean surface soil moisture first guess departures [m3 m−3] for the ASCAT experiment (a) and the REF experiment (b) for May–October 2023.
5.3. Analysis Increments over the Entire Domain
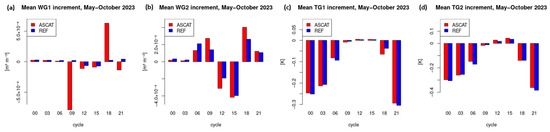
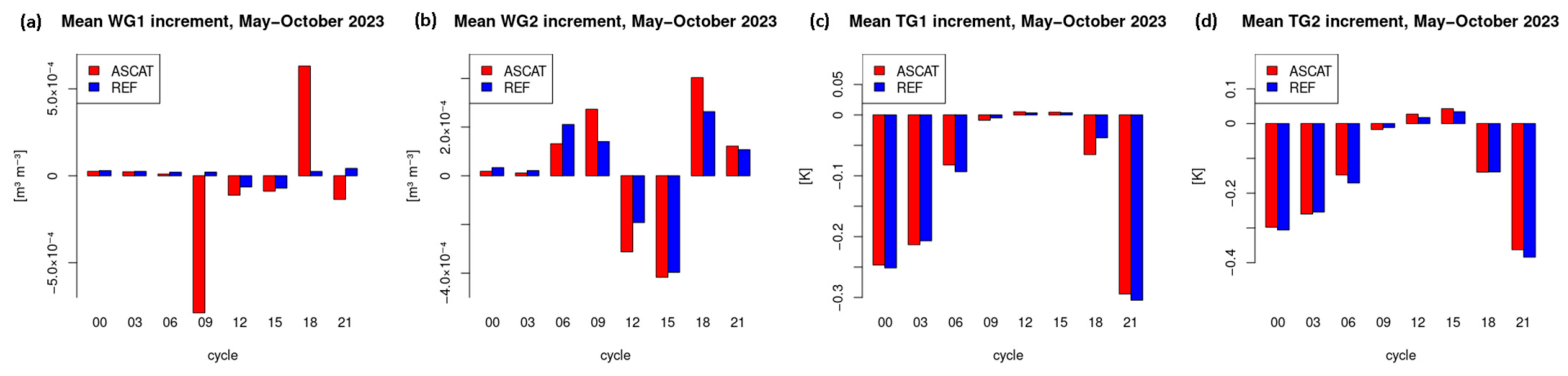
Next, we compare the differences between the ASCAT and the REF analysis increments. Figure 10 shows the analysis increments for soil temperature and soil moisture as a function of the analysis cycles, averaged over the entire study period and all grid points within the domain. As expected, ASCAT observations primarily affect soil moisture, particularly the surface layer. It is evident that when satellite measurements are available over the area—at 09 and 18 UTC—the increments in the ASCAT experiment are highest, significantly exceeding those in the REF run. Negative increments at 09 UTC indicate that the model is generally too wet in the morning, likely due to limited early-morning evaporation, whereas ASCAT detects a drier surface as the drying process begins after sunrise. In contrast, the positive increments at 18 UTC suggest that the model tends to dry out too much by the late afternoon, while ASCAT observations indicate higher surface soil moisture. In the root zone, ASCAT has a stronger effect than REF, with a similar temporal extent. At 12 and 15 UTC, the increments are negative, while they are positive at other times. The largest added value from ASCAT is observed at 09, 12, and 18 UTC, as the surface corrections propagate downward through the soil profile via model dynamics.
Figure 10.
Analysis increments for soil moisture (a) WG1 and (b) WG2 and soil temperature (c) TG1 and (d) TG2 in different analysis times averaged for the entire domain for the period May–October 2023.
The soil temperature increments are negative for both model versions and for both soil layers at night. During the day, the increments are close to zero in the surface soil layer and slightly positive in the root zone. The surface assimilation helps to reduce the model overestimation of near-surface temperature at night. During the day, the assimilation provides little added value, as the bias in near-surface temperature is already small. The surface energy balance is better represented by the model, and the observations provide limited additional information. ASCAT data introduce only a minor adjustment compared to the SYNOP-based REF experiment, with a slightly larger difference in the surface soil temperature increment observed at 18 UTC.
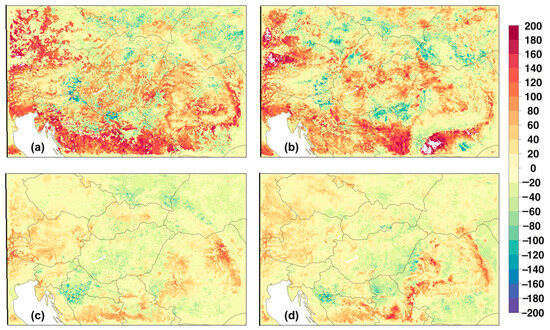
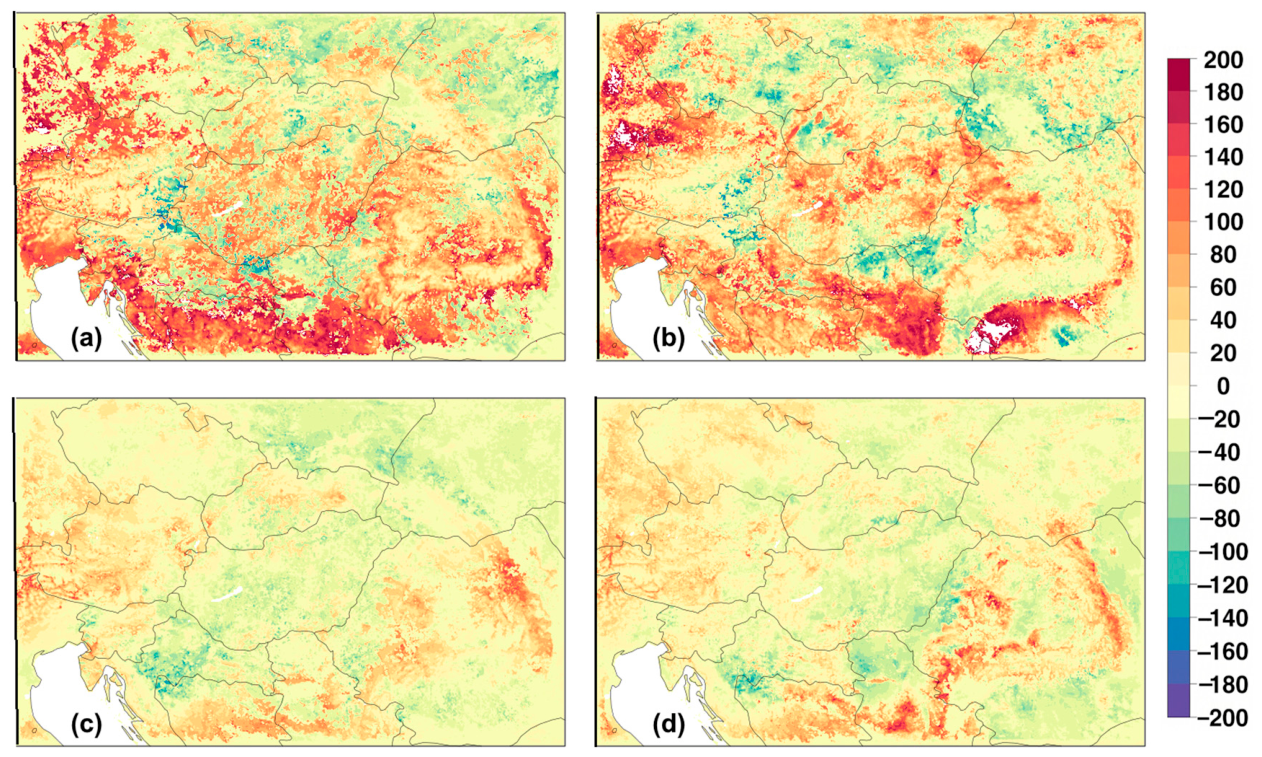
Accumulated soil moisture increments provided by the REF and ASCAT experiments over the months of July 2023 and October 2023 are depicted in Figure 11. During the summer period, the analysis increments are predominantly positive and exceed 100 mm over most parts of the domain, especially in the western and southern regions. Hungary can also be classified as an area with positive increments. For context, these increments are of the same order of magnitude as typical monthly precipitation totals, highlighting the substantial impact of the data assimilation. The mean absolute increment over the entire domain is 61 mm in the REF experiment and 53 mm in the ASCAT experiment.
Figure 11.
Accumulated soil moisture increments [mm] in the root zone over the months of July 2023 (top) and October 2023 (bottom) produced by REF (a,c) and by the ASCAT experiment (b,d).
Negative increments are also present, for instance in Serbia and Romania and in northeastern Ukraine, as well as in the eastern part of the Czech Republic and the southern part of Poland. The spatial patterns of positive and negative increments are generally similar in both experiments, although some local differences can be observed—for example, along the southern section of the Serbian–Romanian border, the REF experiment produced a positive increment, whereas the ASCAT experiment showed a small negative one.
The pattern also differs in the increments of the two experiments; in the ASCAT experiment, these transitions are smoother than in the reference experiment, where only SYNOP data were assimilated. The smoother increases observed in the ASCAT experiment are likely due to the wider spatial coverage and the satellite data footprint (~25 km). In contrast, the point-based SYNOP observations produce more localized and discontinuous corrections.
In October, the increments are much smaller, which is related to reduced surface fluxes and weaker soil moisture variability during the autumn season. The mean absolute increment was 27 mm in the ASCAT experiment and 25 mm in the REF experiment. In Hungary, the increments are mostly negative in the REF experiment, while they are slightly positive over the western part of the country in the ASCAT experiment, indicating that the assimilation of ASCAT data leads to wetter conditions in this region. It can also be observed that in mountainous regions, the ASCAT experiment shows larger increments than the REF, because the satellite data provide dense, spatially continuous information that captures local soil moisture variability, whereas the point-based SYNOP observations are sparse in complex terrain.
5.4. Jacobians of Observation Operators over the Entire Domain
The Jacobians of the observation operators were computed within both experiments, and their spatial variability was examined over the entire domain. As shown earlier, the analysis of the diurnal cycle reveals different responses of screen-level parameters to variations in soil moisture and soil temperature. The influence of soil moisture is more pronounced during nighttime, whereas the impact of soil temperature is stronger during daytime conditions [13].
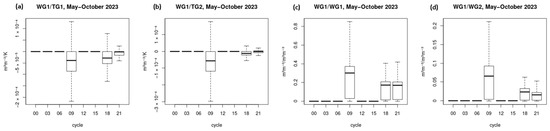
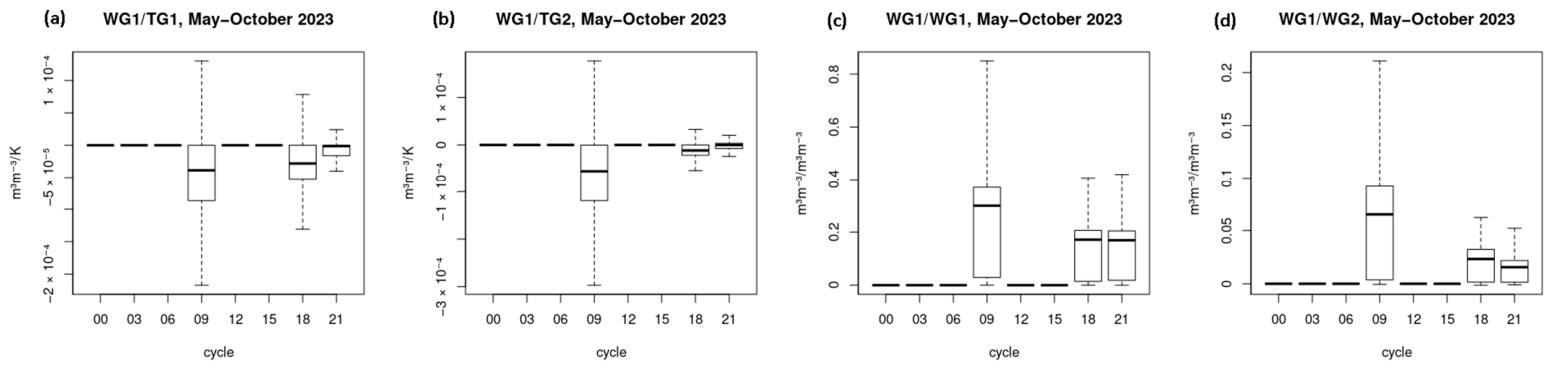
Figure 12 shows the boxplot distribution of the Jacobians for , , , and calculated from the ASCAT experiment over the whole domain and averaged for May–October 2023 across all analysis times (00, 03, 06, 09, 12, 15, 18, and 21 UTC). The figure presents the Jacobians for both the superficial soil layer and the root zone.
Figure 12.
Boxplots of averaged Jacobians over the domain for (a) , (b) , (c) , (d) for May–October 2023.
The Jacobians and are positive (Figure 12c,d), indicating the strong vertical coupling between the superficial and root-zone soil moisture layers. The positive sign of reflects the influence of deeper soil moisture conditions on the superficial layer through vertical moisture exchange processes. The largest responses occur at 09 UTC, with relatively greater temporal variability in the superficial layer, as expected due to rapid near-surface thermal and moisture changes.
The response of the superficial soil moisture to soil temperature is mainly negative, indicating that an increase in the soil temperature leads to a decrease in the superficial soil moisture. However, the coupling between the soil moisture and the soil temperature is more complex and can also be positive. This feature is primarily observed over high-altitude mountainous regions (Figure 13). In these regions, the coupling between soil temperature and soil moisture differs from those over lowland areas, likely due to specific surface and atmospheric conditions characteristic of complex terrain. The mountainous areas are often characterized by distinct radiation regimes, lower air temperatures, and different soil and vegetation properties, which may modify the local energy balance and land–atmosphere interactions. As a result, the sign and magnitude of the Jacobians can differ substantially from those over flatter terrain.
Figure 13.
Averaged Jacobian maps of (a), (b) for May–October 2023.
5.5. Impacts on Forecasts of Precipitation and Screen-Level Variables
Screen-level parameters were verified for May–October 2023 based on model forecasts provided by the REF and ASCAT experiments. The period was generally warmer than the 1991–2020 climatology, with particularly warm conditions in July, September, and October. Precipitation varied considerably in time and space, with wetter conditions in May and August and drier conditions in July and September.
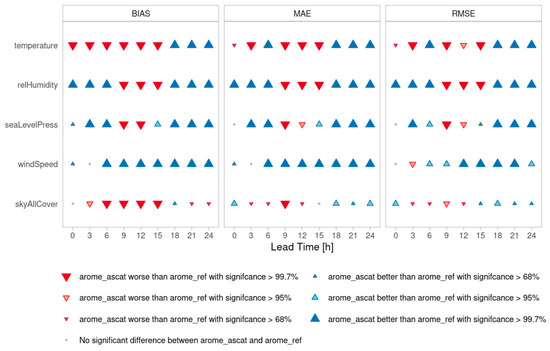
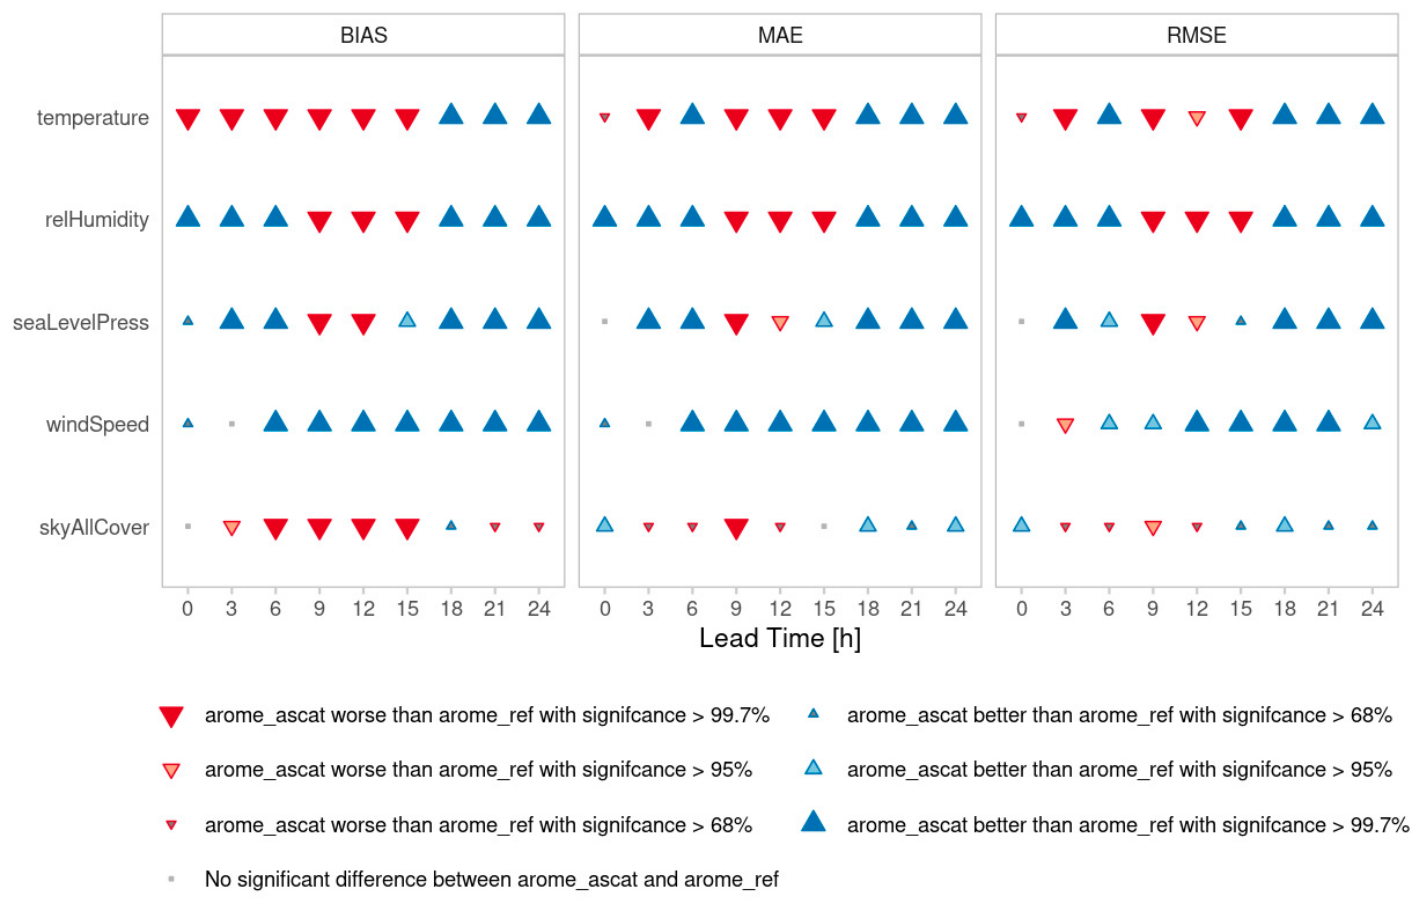
Figure 14 illustrates the scorecards for various statistics of screen-level parameters, for T2M, Rh2M, mean sea-level pressure (MSLP), 10 m wind speed, and cloud cover. These metrics were evaluated up to a +24 h lead time and averaged over 5-month periods for Hungary. The blue triangles indicate improvements for the ASCAT compared to the REF, with their size reflecting the level of statistical significance. Only the 00 UTC runs were evaluated in this study.
Figure 14.
Scorecards of screen-level variables for the period from May to October 2023.
There were notable improvements for the ASCAT at the 99% confidence level across various parameters:
- Wind speed at 10 m showed consistent improvements in bias, MAE, and RMSE across all forecast ranges, indicating that the ASCAT experiment provides more accurate forecasts of wind speed compared to the REF experiment. In particular, ASCAT reduced the magnitude of the daytime 10 m wind speed bias during summer. Soil moisture assimilation can modify both the magnitude and spatial distribution of surface heating, thereby affecting boundary layer stability, turbulent mixing, momentum transport, and cloud formation. A possible explanation for the improved wind speed scores is that reduced thermal contrasts weakened buoyancy-driven local circulations and wind accelerations, while reduced daytime surface heating weakened the downward transport of momentum, and consequently reduced near-surface wind speed errors.
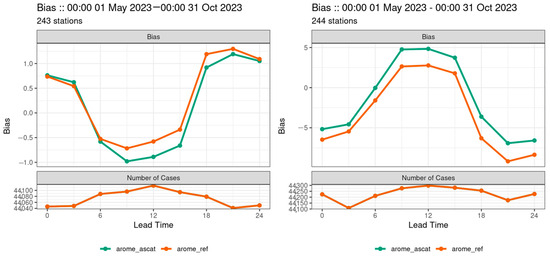
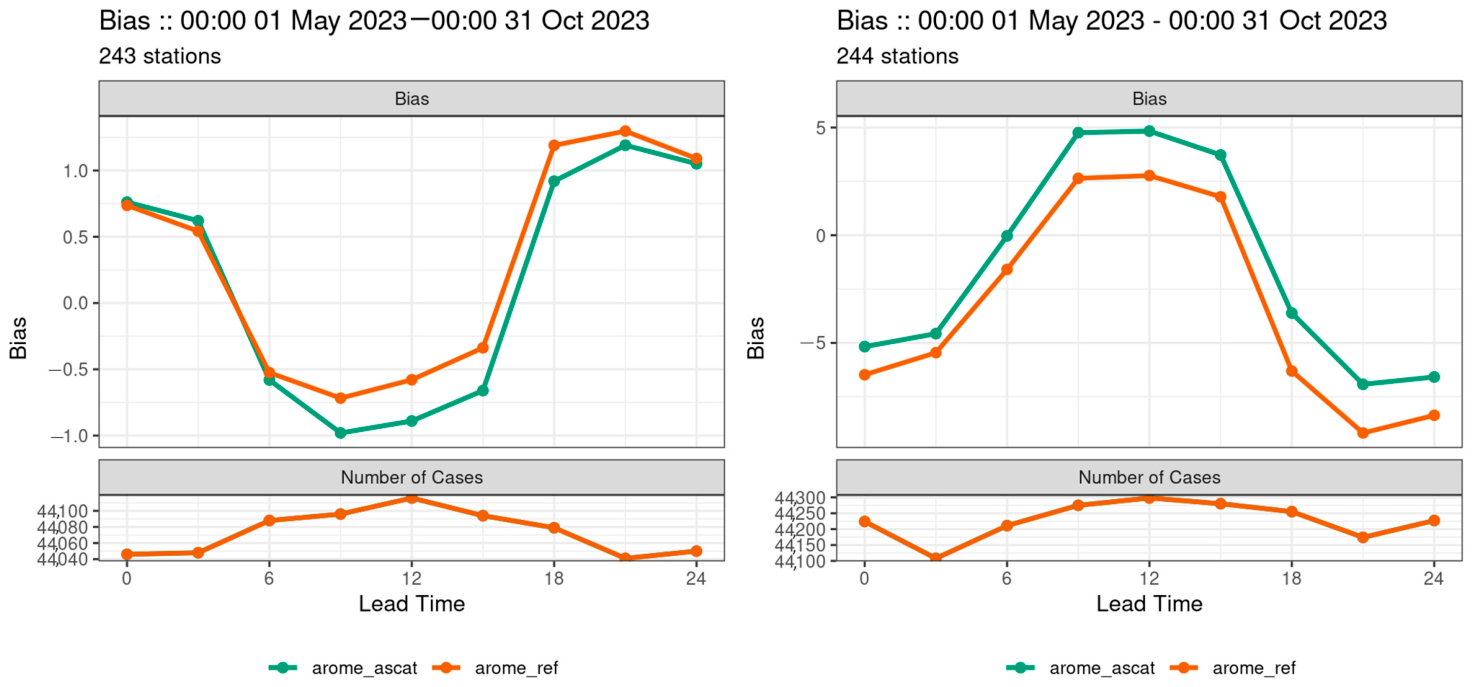
- For T2M, the ASCAT experiment showed slightly (0.2–0.3 K) degraded performance during daytime, with a tendency to underestimate temperature more than REF, while at nighttime the positive bias is reduced compared to REF. A direct comparison of the 3-hourly analyzed T2M fields confirmed that ASCAT generally produced lower near-surface temperatures than REF, with a mean ASCAT–REF difference of −0.085 K over the full diurnal cycle and −0.151 K at 12–18 UTC. The improvements in MAE and RMSE occurred during the night and early-morning hours, likely due to stronger land–atmosphere coupling under stable boundary layer conditions, while the enhanced daytime mixing weakens the effect of soil moisture on near-surface temperature (Figure 15a, on the left shows the diurnal cycle of bias).
- For MSLP, the ASCAT experiment showed a deterioration in bias, MAE, and RMSE during the middle of the day, followed by improved performance later in the forecast period.
- For Rh2M, all statistics improved during nighttime hours, with the ASCAT experiment reducing negative bias compared to REF. During daytime, however, the additional soil moisture introduced by ASCAT slightly increased the positive bias, reflecting the diurnal variation in land–atmosphere coupling (Figure 15b)
- For cloud cover, the impact was mixed: the daytime bias was increased, RMSE differences were mostly neutral during daytime, and a slight RMSE improvement occurred at night. The increased positive daytime bias may be related to the simultaneous cooling and moistening of the near-surface atmosphere in the ASCAT experiment. Lower temperature and higher moisture content increase relative humidity and may bring the model atmosphere closer to saturation, thereby favoring more frequent or more extensive diagnosed cloud formation.
Figure 15.
Bias for 2 m temperature (a) and for 2 m relative humidity (b) for the period from May to October 2023 (only 0 UTC runs). Orange: REF (without ASCAT), green: ASCAT-based experiment.
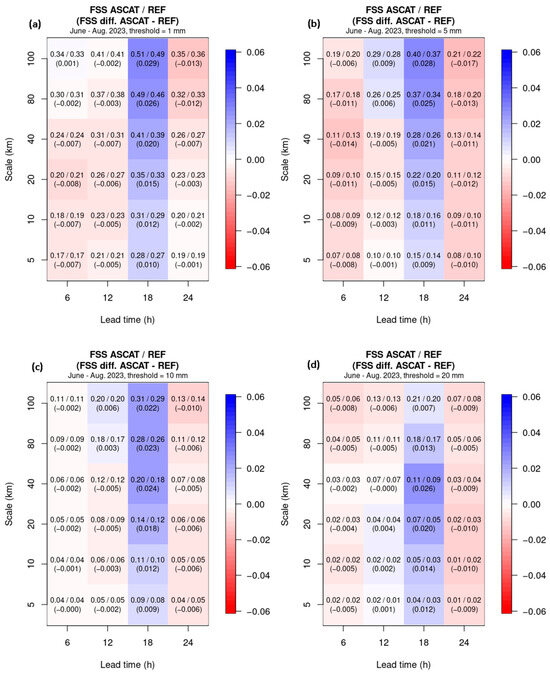
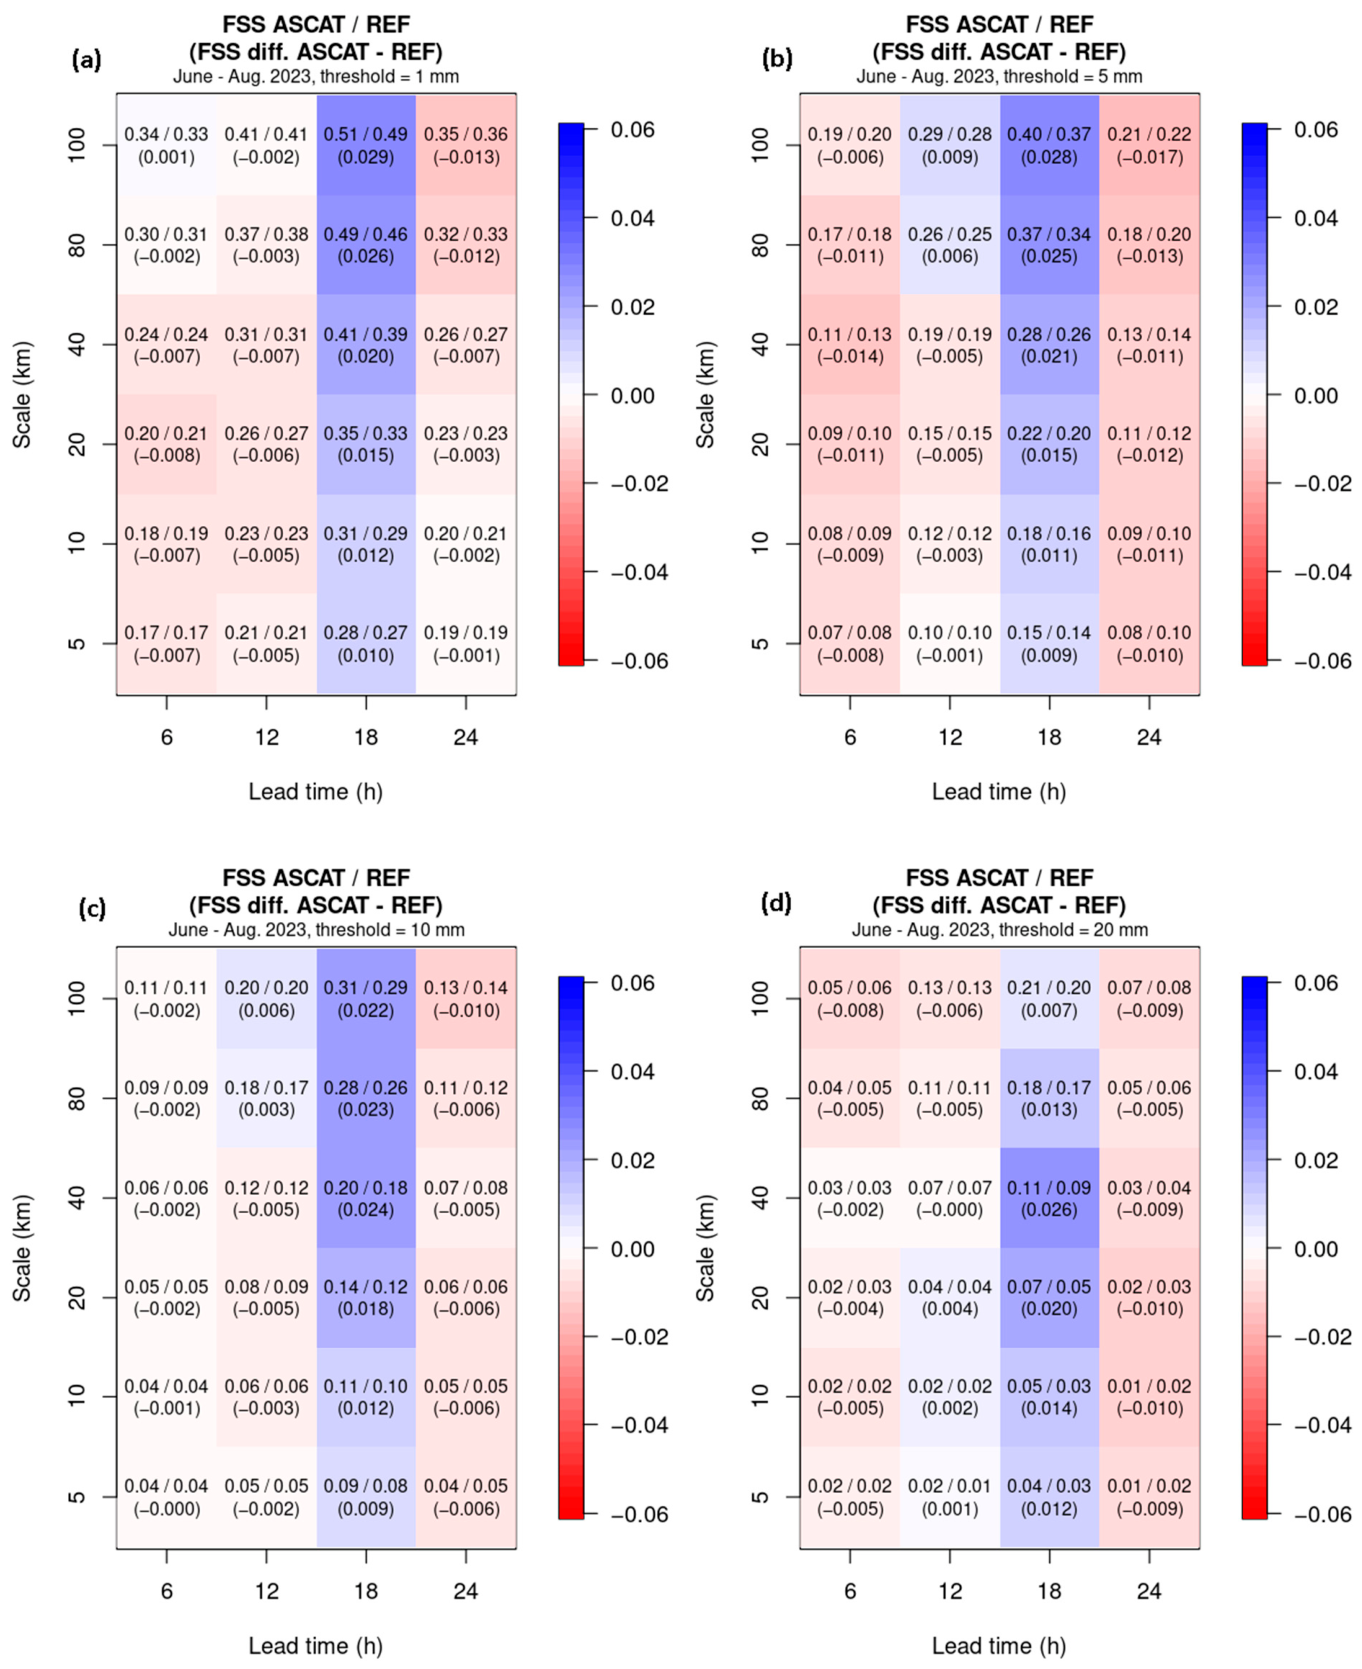
Precipitation verification for the period 1 June–31 August 2023 was performed using six-hour accumulated forecasts and corresponding radar-derived precipitation estimates. The radar data were available over the Carpathian Basin at 1 km spatial resolution and were aggregated to the model grid prior to verification. The Fractions Skill Score (FSS), a spatial verification metric, was applied to evaluate forecast performance over different spatial scales. FSS was calculated for both the REF and ASCAT experiments. In Figure 16, FSS differences are shown, where blue indicates higher skill of ASCAT and red indicates better performance of the REF experiment. Improved skill (blue shading) is primarily confined to the 12–18 UTC period, suggesting that ASCAT data assimilation enhances forecast performance mainly during the afternoon. This positive signal may be related to the time required for the assimilated soil moisture information to influence surface fluxes, boundary layer development, and the evolution of the convective processes. In contrast, during morning and nighttime periods, differences are neutral or slightly negative, indicating little to no benefit, or even slight degradation, compared to the REF experiment.
Figure 16.
Fractions Skill Score (FSS) for 6 h accumulated precipitation at thresholds of 1, 5, 10, and 20 mm (a–d) for +6, +12, +18, and +24 h forecast lead times during June–August 2023.
As expected, FSS increases with spatial scale, reflecting improved skill as small-scale errors are smoothed out. The maximum FSS (0.51) was observed at a 100 km scale and 1 mm threshold. Overall, these results suggest that the positive impact of ASCAT data assimilation is highly situation-dependent and temporally variable. The improvement in forecast skill is mainly limited to the afternoon period, which is consistent with previous studies showing that data assimilation effects are often flow-dependent and short-lived, with the largest impact occurring during convectively active conditions [5,7,47].
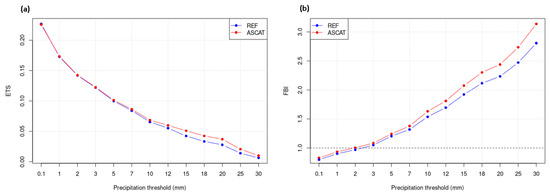
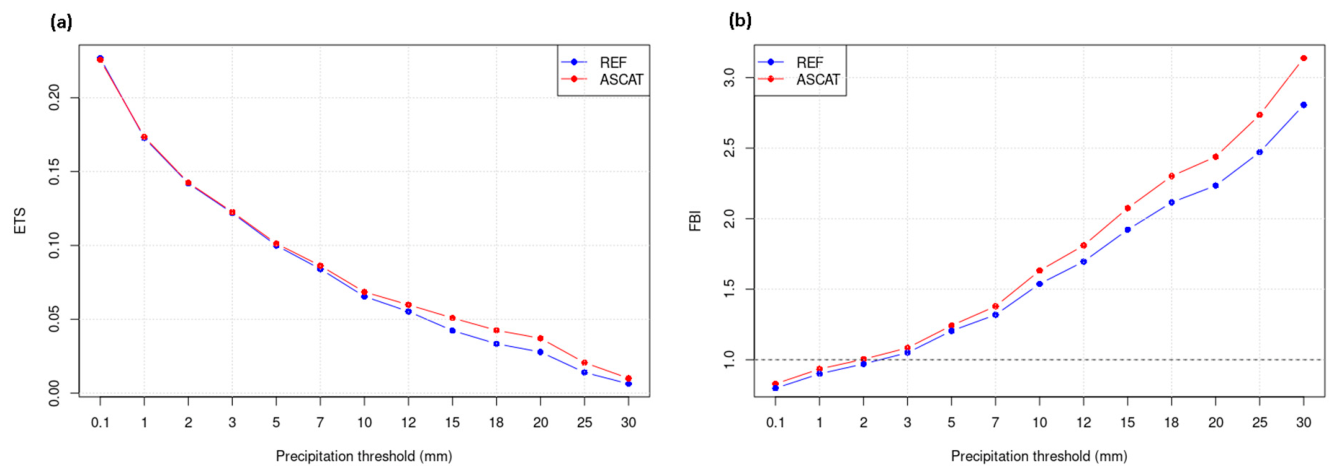
The Equitable Threat Score (ETS) and Frequency Bias Index (FBI) were calculated between the radar observations and modeled 6 h accumulated precipitation fields for the 12–18 UTC period (Figure 17). At higher precipitation thresholds, the ASCAT experiment showed higher ETS values, whereas at lower thresholds the differences between the experiments are small. Examination of the contingency table components indicated that ASCAT produced more hits and fewer misses than REF at all thresholds, with the relative increase in hits becoming particularly pronounced for intense precipitation (hits = 2731/3743, misses = 25,261/24,249 for REF/ASCAT at 20 mm threshold). However, ASCAT also produced more false alarms (false alarms = 59,828/64,541 for REF/ASCAT at 20 mm threshold). The larger absolute increase was the main reason for the higher FBI values above 2–3 mm. Thus, ASCAT improved the detection of intense precipitation events, but this improvement was accompanied by more false alarms and a stronger positive FBI at the higher thresholds. This behavior may reflect a stronger triggering of precipitation processes in the model when soil moisture conditions are better constrained by the ASCAT data.
Figure 17.
Equitable Threat Score (a) and Frequency Bias Index (b) calculated between the radar observations and modeled 6 h accumulated precipitation fields for the 12–18 UTC period for June–August 2023.
6. Discussion
6.1. Limitations of the SYNOP-Based SEKF Configuration
Previous works [10,13] clearly demonstrated that the assimilation of screen-level observations using an SEKF can improve the evolution of the soil moisture and soil temperature in the AROME model compared to the former optimal interpolation-based method, OI-MAIN. However, since the implementation of the new model version in operations, some shortcomings of the SYNOP-based SEKF configuration (REF) have become apparent.
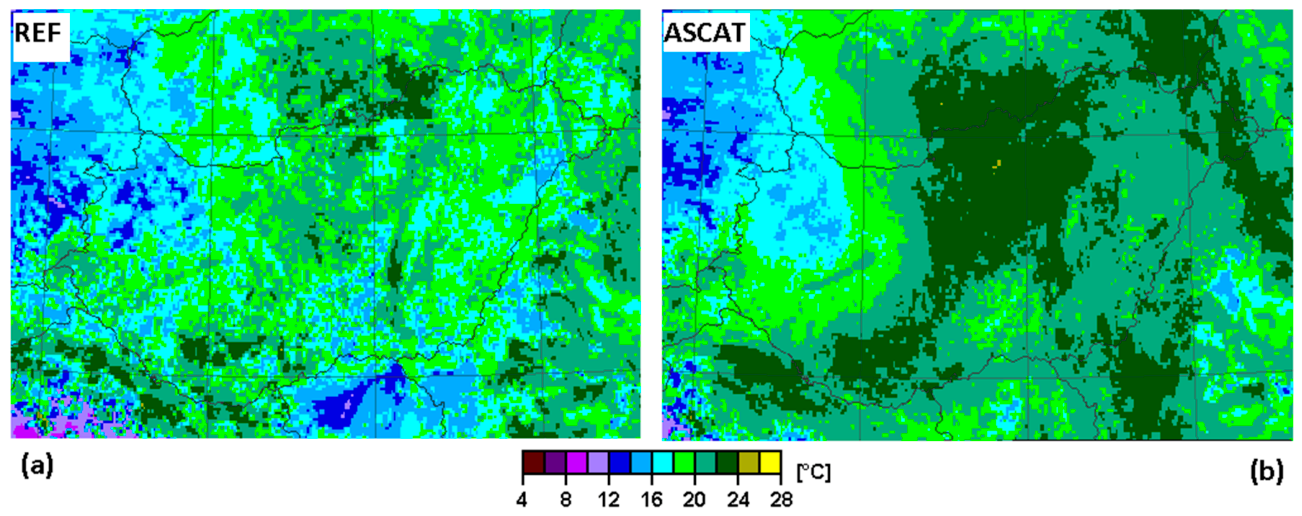
During hot summer days around midday (e.g., 12 UTC), the REF experiment occasionally shows strong grid-to-grid variability in 2 m dew point temperature, with differences of several degrees over short distances (Figure 18). This characteristic is probably related to the strong sensitivity of evapotranspiration to soil moisture under high-temperature conditions. Small differences in superficial soil moisture can lead to large contrasts in the surface latent heat flux due to moisture stress in vegetation, which in turn produces localized variations in boundary layer humidity [51,52]. As a result, patchy patterns could develop in the 2 m dew point field, even when the corresponding variations in soil moisture and soil temperature are less pronounced. Such behavior is much less evident in the ASCAT experiment, suggesting that the assimilation of ASCAT soil moisture leads to a more consistent soil moisture field and more stable surface fluxes.
Figure 18.
The 12 h 2 m dew point [°C] forecasts for the REF (a) and ASCAT (b) experiments, valid at 12 UTC on 23 June 2023.
6.2. Sensitivity of the Assimilation System to Error Settings
Soil moisture analyses are known to be highly sensitive to the specification of background and observation errors in the data assimilation system, and sensitivity experiments with different error settings are therefore commonly performed to determine appropriate configurations [53,54]. We tested different values for observation and model errors of soil moisture in the surface assimilation to assess the sensitivity of the system to these settings. Increasing the model errors (from 0.1 and 0.15 to 0.4 and 0.2 × (wfc − wwilt) m3m−3) and the observation errors (from 0.1 to 0.4 × (wfc − wwilt) m3m−3) resulted in high variability in the spatial distribution of soil moisture, with very wet and very dry areas occurring next to each other. This configuration produced unrealistic small-scale spatial fluctuations, indicating that overly large error assumptions allow the assimilation system to apply excessive local corrections relative to the model background.
In contrast, when the model and observation errors were reduced for soil moisture, the analysis increments became very small, indicating that the system relied more strongly on the model background and applied only limited corrections from the observations. This response indicates that the specification of background and observation errors plays a crucial role in controlling the balance between model and observational information in the assimilation system. Among the tested configurations, the intermediate error setting used in the final ASCAT experiment provided the most suitable balance between the background and observational information. It allowed meaningful soil moisture corrections without producing unrealistic small-scale spatial variability. It can therefore be regarded as the preferred configuration within the range of errors examined in this study. These findings are consistent with the results of [55], which used a similar AROME–SURFEX system with SEKF data assimilation.
6.3. Demonstrating the Added Value of Surface Data Assimilation Compared to the Open-Loop Experiment (Without Surface Data Assimilation)
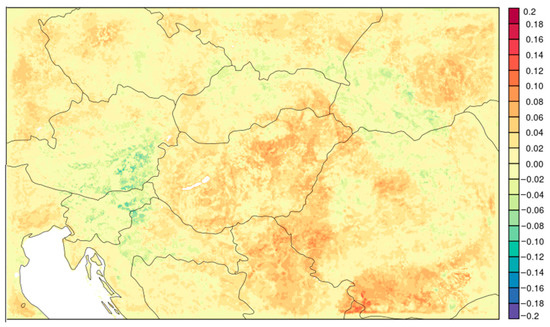
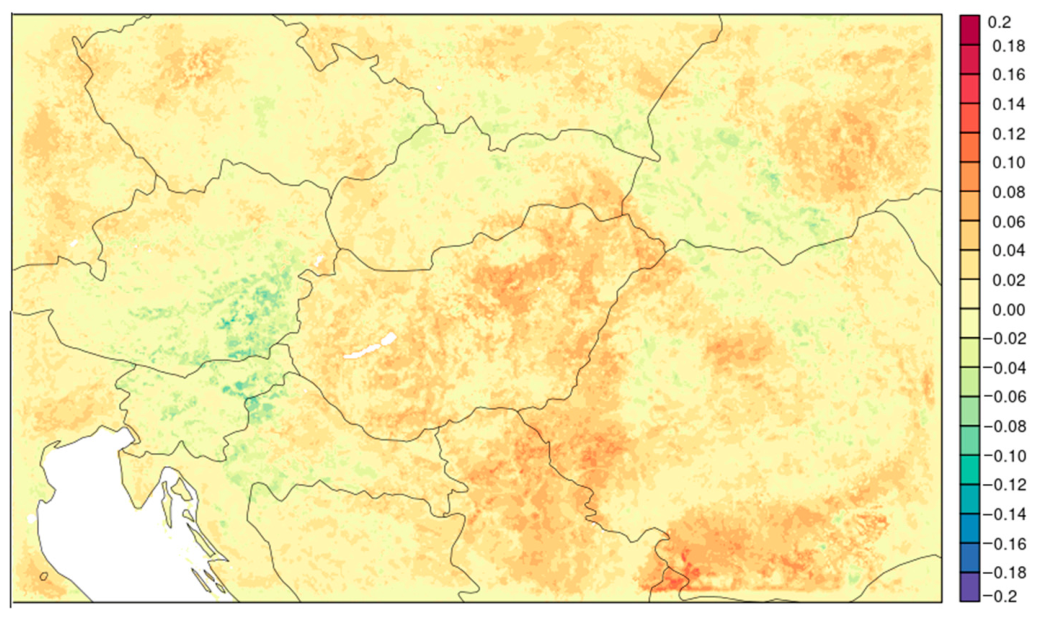
To illustrate the impact of land data assimilation, an open-loop experiment was conducted without surface data assimilation, while upper air data assimilation remained active. The soil prognostic variables were updated from one cycle to the next using the background fields only. During summer, both the bias and the RMSE of 2 m temperature exceeded 1–2 K relative to the experiments using surface data assimilation. At the same time, a substantial underestimation of 2 m relative humidity was observed. As a result, the soil became excessively dry and warm by the end of summer. The seasonal mean difference in root-zone soil moisture between the data assimilation and open-loop experiments (Figure 19) shows that surface data assimilation maintains a systematically wetter soil state during summer. This reduced soil moisture in the open-loop simulation limits evapotranspiration and latent heat fluxes, enhancing sensible heating and leading to warm and dry near-surface biases. This response is consistent with previous studies that have shown a strong coupling between soil moisture, and near-surface atmospheric conditions, particularly during the warm season when land–atmosphere interactions are strongest [20,47,56].
Figure 19.
Summer mean root-zone soil moisture difference [m3 m−3] between the data assimilation experiment and the open-loop simulation.
During autumn, however, the soil moisture content and soil temperature gradually recovered owing to lower evaporative demand and more frequent precipitation events. As a result, the differences between the open-loop and surface-assimilating experiments decreased substantially.
7. Conclusions and Perspectives
This study investigated the assimilation of MetOp-B ASCAT soil moisture observations within the AROME–SURFEX land data assimilation system using the Simplified Extended Kalman Filter. The results show that ASCAT observations can be successfully integrated into the operational system and provide additional information on the near-surface soil moisture state. The ASCAT data are available in near-real time, which makes them attractive for operational applications; however, the assimilation framework itself introduces additional computational cost due to the preprocessing of satellite observations.
Experiments with and without ASCAT assimilation indicate physically consistent modifications of the analyzed soil moisture and soil temperature fields, supported by analysis increments, Jacobian matrices and sensitivity diagnostics. These changes are associated with improvements in forecast skill, particularly for screen-level parameters. For precipitation, the impact was also assessed using the Fractions Skill Score (FSS), which confirmed the beneficial effect of ASCAT soil moisture assimilation on forecast quality. Overall, the results demonstrate that ASCAT soil moisture observations can improve land surface analyses and forecasts in an operational numerical weather prediction environment.
Future work will focus on the use of alternative satellite soil moisture products, such as H28 or H122, as potential replacements for the discontinued H08 product. Another promising direction is the direct assimilation of ASCAT Level-1 backscatter observations using dedicated observation operators, including emerging machine-learning-based approaches for observation operator and Jacobian estimation [57,58,59]. In addition, further developments could explore more advanced data assimilation frameworks, such as ensemble-based methods (e.g., EnKF), which would allow a more consistent treatment of flow-dependent uncertainties [4,6,60]. Furthermore, the current ISBA force–restore soil scheme could be replaced by more physically based configurations, such as ISBA-DIF, which provide a more realistic multi-layer soil moisture representation [61].
Author Contributions
Conceptualization, H.T.; methodology, H.T., B.S. and H.B.; software, H.T.; validation, H.T., B.S. and H.B.; formal analysis, H.T., B.S. and H.B.; investigation, H.T., B.S. and H.B.; resources, H.T.; data curation, H.T.; writing—original draft preparation, H.T.; writing—review and editing, H.T., H.B. and B.S.; visualization, H.T.; supervision, H.B. and B.S.; project administration, H.T.; funding acquisition, H.T. All authors have read and agreed to the published version of the manuscript.
Funding
This research received no external funding.
Institutional Review Board Statement
Not applicable.
Informed Consent Statement
Not applicable.
Data Availability Statement
The AROME and SURFEX simulation data used in this study are stored locally at the HungaroMet Hungarian Meteorological Service.
Acknowledgments
The authors wish to thank Matjaz Licar, Ildikó Szenyán, Patricia de Rosnay, David Fairbairn, Christoph Herbert and Sebastian Hahn for their contributions to the implementation of the ASCAT assimilation and the validation of the SEKF within AROME-SURFEX. The authors also gratefully acknowledge their valuable support and insightful discussions throughout this work. They also gratefully acknowledge Gabriella Szépszó for her useful ideas and comments to improve the paper. Finally, the authors express their sincere gratitude to the two anonymous reviewers for their detailed and valuable reviews.
Conflicts of Interest
The authors declare no conflicts of interest.
References
- Koster, R.D.; Dirmeyer, P.A.; Guo, Z.; Bonan, G.; Chan, E.; Cox, P.; Gordon, C.T.; Kanae, S.; Kowalczyk, E.; Lawrence, D.; et al. Regions of strong coupling between soil moisture and precipitation. Science 2004, 305, 1138–1140. [Google Scholar] [CrossRef] [Scilit] [PubMed]
- Vereecken, H.; Huisman, J.A.; Bogena, H.; Kollet, S.; Javaux, M.; van der Kruk, J.; Vanderborght, J. Soil hydrology: Recent methodological advances, challenges, and perspectives. Water Resour. Res. 2015, 51, 2616–2633. [Google Scholar] [CrossRef] [Scilit]
- Koster, R.D.; Mahanama, S.P.; Yamada, T.J.; Balsamo, G.; Berg, A.A.; Boisserie, M.; Dirmeyer, P.A.; Doblas-Reyes, F.J.; Drewitt, G.; Gordon, C.T.; et al. The Second Phase of the Global Land–Atmosphere Coupling Experiment: Soil Moisture Contributions to Subseasonal Forecast Skill. J. Hydrometeorol. 2011, 12, 805–822. [Google Scholar] [CrossRef] [Scilit]
- Reichle, R.H.; McLaughlin, D.B.; Entekhabi, D. Hydrologic data assimilation with the Ensemble Kalman Filter. Mon. Weather Rev. 2002, 130, 103–114. [Google Scholar] [CrossRef] [Scilit]
- Draper, C.; Mahfouf, J.-F.; Calvet, J.-C.; Martin, E.; Wagner, W. Assimilation of ASCAT near-surface soil moisture into the SIM hydrological model. Hydrol. Earth Syst. Sci. 2011, 15, 3829–3841. [Google Scholar] [CrossRef] [Scilit]
- Reichle, R.H.; Crow, W.T.; Koster, R.D.; Sharif, H.O.; Mahanama, S.P.P. Contribution of soil moisture retrievals to land data assimilation products. Geophys. Res. Lett. 2008, 35, L01404. [Google Scholar] [CrossRef] [Scilit]
- de Rosnay, P.; Drusch, M.; Vasiljevic, D.; Balsamo, G.; Albergel, C.; Isaksen, L. A simplified Extended Kalman Filter for the global operational soil moisture analysis at ECMWF. Q. J. R. Meteorol. Soc. 2013, 139, 1199–1213. [Google Scholar] [CrossRef] [Scilit]
- Daley, R. Atmospheric Data Analysis; Cambridge University Press: Cambridge, UK, 1991. [Google Scholar]
- Kalnay, E. Atmospheric Modeling, Data Assimilation and Predictability; Cambridge University Press: Cambridge, UK, 2003. [Google Scholar]
- Mahfouf, J.-F.; Bergaoui, K.; Draper, C.; Bouyssel FTaillefer, F.; Taseva, L. A comparison of two off-line soil analysis schemes for assimilation of screen level observations. J. Geophys. Res. 2009, 114, D08105. [Google Scholar] [CrossRef] [Scilit]
- Fairbairn, D.; de Rosnay, P.; Browne, P.A. The New Stand-Alone Surface Analysis at ECMWF: Implications for Land–Atmosphere DA Coupling. J. Hydrometeor. 2019, 20, 2023–2042. [Google Scholar] [CrossRef] [Scilit]
- Dorigo, W.A.; Wagner, W.; Hohensinn, R.; Hahn, S.; Paulik, C.; Xaver, A.; Jackson, T. The International Soil Moisture Network: A data hosting facility for global in-situ soil moisture measurements. Hydrol. Earth Syst. Sci. 2011, 15, 1675–1698. [Google Scholar] [CrossRef] [Scilit]
- Tóth, H.; Szintai, B.; Breuer, H. Development of Surface Data Assimilation Using Simplified Extended Kalman Filter in AROME Model in Hungary. Atmosphere 2025, 16, 709. [Google Scholar] [CrossRef] [Scilit]
- Wagner, W.; Blöschl, G.; Pampaloni, P.; Calvet, J.-C.; Bizzarri, B.; Wigneron, J.-P.; Kerr, Y. Operational readiness of microwave remote sensing of soil moisture for hydrologic applications. Hydrol. Res. 2007, 38, 1–20. [Google Scholar] [CrossRef] [Scilit]
- Naeimi, V.; Scipal, K.; Bartalis, Z.; Hasenauer, S.; Wagner, W. An improved soil moisture retrieval algorithm for ERS and METOP scatterometer observations. IEEE Trans. Geosci. Remote Sens. 2009, 47, 1999–2013. [Google Scholar] [CrossRef] [Scilit]
- Dorigo, W.; Wagner, W.; Albergel, C.; Albrecht, F.; Balsamo, G. ESA CCI Soil Moisture for improved Earth system understanding: State-of-the-art and future directions. Remote Sens. Environ. 2017, 203, 185–215. [Google Scholar] [CrossRef] [Scilit]
- Barbu, A.L.; Calvet, J.-C.; Mahfouf, J.-F.; Lafont, S. Integrated ASCAT surface soil moisture and GEOV1 leaf area index into the SURFEX modelling platform: A land data assimilation application over France. Hydrol. Earth Syst. Sci. 2014, 18, 173–192. [Google Scholar] [CrossRef] [Scilit]
- Albergel, C.; Munier, S.; Leroux, D.J.; Dewaele, H.; Fairbairn, D.; Barbu, A.L.; Gelati, E.; Dorigo, W.; Faroux, S.; Meurey, C.; et al. Sequential assimilation of satellite-derived vegetation and soil moisture products using SURFEX_v8.0: LDAS-Monde assessment over the Euro-Mediterranean area. Geosci. Model Dev. 2017, 10, 3889–3912. [Google Scholar] [CrossRef] [Scilit]
- Tóth, H.; Szintai, B. Assimilation of Leaf Area Index and Soil Water Index from Satellite Observations in a Land Surface Model in Hungary. Atmosphere 2021, 12, 944. [Google Scholar] [CrossRef] [Scilit]
- Gómez, B.; Charlton-Pérez, C.L.; Lewis, H.; Candy, B. The Met Office Operational Soil Moisture Analysis System. Remote Sens. 2020, 12, 3691. [Google Scholar] [CrossRef] [Scilit]
- Herbert, C.; de Rosnay, P.; Weston, P.; Fairbairn, D. Towards unified land data assimilation at ECMWF: Soil and snow temperature analysis in the SEKF. Q. J. R. Meteorol. Soc. 2024, 150, 4133–4155. [Google Scholar] [CrossRef] [Scilit]
- Szintai, B.; Szűcs, M.; Randriamampianina, R.; Kullman, L. Application of the AROME non-hydrostatic model at the Hungarian Meteorological Service: Physical parameterizations and ensemble forecasting. Időjárás 2015, 119, 241–265. [Google Scholar]
- Tóth, H.; Tóth, B. Implementation of Simplified Extended Kalman Filter in the operational AROME/HU. Accord. Newsl. 2022, 3, 15–20. [Google Scholar]
- Seity, Y.; Brousseau, P.; Malardel, S.; Hello, G.; Bénard, P.; Bouttier, F.; Lac, C.; Masson, V. The AROME-France Convective-Scale Operational Model. Mon. Weather Rev. 2011, 139, 976–991. [Google Scholar] [CrossRef] [Scilit]
- Bubnová, R.; Hello, G.; Bénard, P.; Geleyn, J.-F. Integration of the fully elastic equations cast in the hydrostatic pressure terrain-following in the framework of the ARPEGE/ALADIN NWP system. Mon. Weather Rev. 1995, 123, 515–535. [Google Scholar] [CrossRef] [Scilit]
- Vána, F.; Bénard, P.; Geleyn, J.-F.; Simon, A.; Seity, Y. Semi-Lagrangian advection scheme with controlled damping: An alternative to nonlinear horizontal diffusion in a numerical weather prediction model. Q. J. R. Meteorol. Soc. 2008, 134, 523–537. [Google Scholar] [CrossRef] [Scilit]
- Gerard, L.; Piriou, J.-M.; Brozkova, R.; Geleyn, J.-F. Cloud and Precipitation Parameterization in a Meso-Gamma-Scale Operational Weather Prediction Model. Mon. Weather Rev. 2009, 137, 3960–3977. [Google Scholar] [CrossRef] [Scilit]
- Le Moigne, P.; Besson, F.; Martin, E.; Boé, J.; Boone, A.; Decharme, B.; Etchevers, P.; Faroux, S.; Habets, F.; Lafaysse, M.; et al. The latest improvements with SURFEX v8.0 of the Safran–Isba–Modcou hydrometeorological model for France. Geosci. Model Dev. Discuss. 2020, 13, 3925–3946. [Google Scholar] [CrossRef] [Scilit]
- Noilhan, J.; Mahfouf, J.-F. The ISBA land surface parameterisation scheme. Glob. Planet. Change 1996, 13, 145–159. [Google Scholar] [CrossRef] [Scilit]
- Calvet, J.-C.; Noilhan, J.; Roujean, J.-L.; Bessemoulin, P.; Cabelguenne, M.; Olioso, A.; Wigneron, J.-P. An interactive vegetation SVAT model tested against data from six contrasting sites. Agric. For. Meteorol. 1998, 92, 73–95. [Google Scholar] [CrossRef] [Scilit]
- Danielson, J.J.; Gesch, D.B. Global Multi-Resolution Terrain Elevation Data 2010 (GMTED2010): U.S. Geological Survey Open-File Report; Open-File Report 2011–1073; U.S. Geological Survey: Reston, VA, USA, 2011; 26p. [Google Scholar]
- Faroux, S.; Kaptué Tchuenté, A.T.; Roujean, J.-L.; Masson, V.; Martin, E.; Le Moigne, P. ECOCLIMAP-II/Europe: A twofold database of ecosystems and surface parameters at 1 km resolution based on satellite information for use in land surface, meteorological and climate models. Geosci. Model Dev. 2013, 6, 563–582. [Google Scholar] [CrossRef] [Scilit]
- FAO; IIASA. Harmonized World Soil Database Version 2.0; FAO: Rome, Italy; International Institute for Applied Systems Analysis (IIASA): Laxenburg, Austria, 2023. [Google Scholar] [CrossRef] [Scilit]
- Tóth, H.; Homonnai, V.; Mile, M.; Várkonyi, A.; Kocsis Zs Szanyi, K.; Tóth, G.; Szintai, B.; Szépszó, G. Recent developments in the data assimilation of AROME/HU numerical weather prediction model. Időjárás 2021, 125, 521–553. [Google Scholar] [CrossRef] [Scilit]
- Deckmyn, A.; Mets, A.; Yazgi, D. New version of harpSpatial. Accord. Newsl. 2024, 5, 49–55. [Google Scholar]
- Mesinger, F.; Black, T.L. On the impact on forecast accuracy of the step-mountain (eta) vs. sigma coordinate. Meteor. Atmos. Phys. 1992, 50, 47–60. [Google Scholar] [CrossRef] [Scilit]
- Wilks, D.S. Statistical Methods in the Atmospheric Sciences, 2nd ed.; Academic Press: New York, NY, USA, 2006; 630p. [Google Scholar]
- Roberts, N.M.; Lean, H.W. Scale-Selective Verification of Rainfall Accumulations from High-Resolution Forecasts of Convective Events. Mon. Weather Rev. 2008, 136, 78–97. [Google Scholar] [CrossRef] [Scilit]
- Bartalis, Z.; Wagner, W.; Naeimi, V.; Hasenauer, S.; Scipal, K.; Bonekamp, H.; Figa, J.; Anderson, C. Initial soil moisture retrievals from the METOP-a advanced scatterometer (ASCAT). Geophys. Res. Lett. 2007, 34, L20401. [Google Scholar] [CrossRef] [Scilit]
- Brocca, L.; Melone, F.; Moramarco, T.; Wagner, W. ASCAT soil wetness index validation through in-situ and model data. Remote Sens. Environ. 2010, 114, 2361–2371. [Google Scholar] [CrossRef] [Scilit]
- Wagner, W.; Pathe, C.; Doubkova, M.; Sabel, D.; Bartsch, A.; Hasenauer, S.; Blöschl, G.; Scipal, K.; Martínez-Fernández, J.; Löw, A. Temporal Stability of Soil Moisture and Radar Backscatter Observed by the Advanced Synthetic Aperture Radar (ASAR). Sensors 2008, 8, 1174–1197. [Google Scholar] [CrossRef] [Scilit] [PubMed]
- Brocca, L.; Crow, W.T.; Ciabatta, L.; Massari, C.; de Rosnay, P.; Enenkel, M. A Review of the Applications of ASCAT Soil Moisture Products. IEEE J. Sel. Top. Appl. Earth Obs. Remote Sens. 2017, 10, 2285–2306. [Google Scholar] [CrossRef] [Scilit]
- El Hajj, M.; Baghdadi, N.; Zribi, M.; Rodríguez-Fernández, N.; Wigneron, J.P.; Al-Yaari, A.; Al Bitar, A.; Albergel, C.; Calvet, J.-C. Evaluation of SMOS, SMAP, ASCAT and Sentinel-1 Soil Moisture Products at Sites in Southwestern France. Remote Sens. 2018, 10, 569. [Google Scholar] [CrossRef] [Scilit]
- Schulzweida, U. CDO User Guide (Version 2.6.1). Max Planck Institute for Meteorology. 2026. Available online: https://code.mpimet.mpg.de/projects/cdo/embedded/cdo.pdf (accessed on 25 June 2026).
- Scipal, K.; Drusch, M.; Wagner, W. Assimilation of a ERS scatterometer derived soil moisture index in the ECMWF numerical weather prediction system. Adv. Water Resour. 2008, 31, 1101–1112. [Google Scholar] [CrossRef] [Scilit]
- Mahfouf, J.-F. Assimilation of satellite-derived soil moisture from ASCAT in a limited-area NWP model. Q. J. R. Meteorol. Soc. 2010, 136, 784–798. [Google Scholar] [CrossRef] [Scilit]
- Schneider, S.; Wang, Y.; Wagner, W.; Mahfouf, J.F. Impact of ASCAT Soil Moisture Assimilation on Regional Precipitation Forecasts: A Case Study for Austria. Mon. Weather Rev. 2014, 142, 1525–1541. [Google Scholar] [CrossRef] [Scilit]
- Lee, J.H.; Im, J. A Novel Bias Correction Method for Soil Moisture and Ocean Salinity (SMOS) Soil Moisture: Retrieval Ensembles. Remote Sens. 2015, 7, 16045–16061. [Google Scholar] [CrossRef] [Scilit]
- Dharssi, I.; Steinle, P.; Candy, B. Towards a Kalman Filter Based Land Surface Data Assimilation Scheme for ACCESS; CAWCR Technical Report 54; The Centre for Australian Weather and Climate Research: Melbourne, Australia, 2012. Available online: http://www.cawcr.gov.au/technical-reports/CTR_054.pdf (accessed on 25 June 2026).
- Fiala, K.; Barta, K.; Benyhe, B.; Fehérváry, I.; Lábdy, J.; Sipos, G.; Győrffy, L. Operatív aszály- és vízhiánykezelő monitoring rendszer. Hidrol. Közlöny 2018, 98, 14–24. [Google Scholar]
- Noilhan, J.; Planton, S. A simple parametrization of land surface processes for meteorological models. Mon. Weather Rev. 1989, 117, 536–549. [Google Scholar] [CrossRef] [Scilit]
- Seneviratne, S.I.; Corti, T.; Davin, E.D.; Hirschi, M.; Jaeger, E.B.; Lehner, I.; Orlowsky, B.; Teuling, A.J. Investigating soil moisture–climate interactions in a changing climate: A review. Earth Sci. Rev. 2010, 99, 125–161. [Google Scholar] [CrossRef] [Scilit]
- Muñoz-Sabater, J.; De Rosnay, P.; Albergel, C.; Isaksen, L. Sensitivity of Soil Moisture Analyses to Contrasting Background and Observation Error Scenarios. Water 2018, 10, 890. [Google Scholar] [CrossRef] [Scilit]
- Fairbairn, D.; Barbu, A.L.; Mahfouf, J.-F.; Calvet, J.-C.; Gelati, E. Comparing the ensemble and extended Kalman filters for in-situ soil moisture assimilation with contrasting conditions. Hydrol. Earth Syst. Sci. 2015, 19, 4811–4830. [Google Scholar] [CrossRef] [Scilit]
- Vural, J.; Schneider, S.; Bauer-Marschallinger, B.; Haslinger, K. Assimilation of the SCATSAR-SWI with SURFEX: Impact of local observation errors in Austria. Mon. Weather Rev. 2021, 149, 773–791. [Google Scholar] [CrossRef] [Scilit]
- Kolassa, J.; Reichle, R.H.; Liu, Q.; Cosh, M.; Bosch, D.D.; Caldwell, T.G.; Colliander, A.; Holifield Collins, C.; Jackson, T.J.; Livingston, S.J. Data Assimilation to Extract Soil Moisture Information from SMAP Observations. Remote Sens. 2017, 9, 1179. [Google Scholar] [CrossRef] [Scilit] [PubMed]
- Aires, F.; Weston, P.; de Rosnay, P.; Fairbairn, D. Statistical approaches to assimilate ASCAT soil moisture information—I. Methodologies and first assessment. Q. J. R. Meteorol. Soc. 2021, 147, 1823–1852. [Google Scholar] [CrossRef] [Scilit]
- Corchia, T.; Bonan, B.; Rodríguez-Fernández, N.; Colas, G.; Calvet, J.-C. Assimilation of ASCAT Radar Backscatter Coefficients over Southwestern France. Remote Sens. 2023, 15, 4258. [Google Scholar] [CrossRef] [Scilit]
- Shan, X.; Steele-Dunne, S.; Hahn, S.; Wagner, W.; Bonan, B.; Albergel, C.; Calvet, J.C.; Ku, O. Assimilating ASCAT normalized backscatter and slope into the land surface model ISBA-A-gs using a Deep Neural Network as the observation operator: Case studies at ISMN stations in western Europe. Remote Sens. Environ. 2024, 308, 114167. [Google Scholar] [CrossRef] [Scilit]
- Blyverket, J.; Hamer, P.D.; Bertino, L.; Albergel, C.; Fairbairn, D.; Lahoz, W.A. An Evaluation of the EnKF vs. EnOI and the Assimilation of SMAP, SMOS and ESA CCI Soil Moisture Data over the Contiguous US. Remote Sens. 2019, 11, 478. [Google Scholar] [CrossRef] [Scilit]
- Decharme, B.; Boone, A.; Delire, C.; Noilhan, J. Local evaluation of the Interaction between Soil Biosphere Atmosphere soil multilayer diffusion scheme using four pedotransfer functions. J. Geophys. Res. 2011, 116, D20126. [Google Scholar] [CrossRef] [Scilit]

Disclaimer/Publisher’s Note: The statements, opinions and data contained in all publications are solely those of the individual author(s) and contributor(s) and not of MDPI and/or the editor(s). MDPI and/or the editor(s) disclaim responsibility for any injury to people or property resulting from any ideas, methods, instructions or products referred to in the content. |
© 2026 by the authors. Licensee MDPI, Basel, Switzerland. This article is an open access article distributed under the terms and conditions of the Creative Commons Attribution (CC BY) license.