


Abstract
The increasing global demand for clean energy has established wind power as a leading solution for sustainable electricity generation. The efficiency and reliability of wind turbines are strongly influenced by blade design, which governs both aerodynamic performance and structural integrity. In this study, a wind turbine blade based on the National Advisory Committee for Aeronautics (NACA) 4412 airfoil was developed for composite manufacturing, with variations in laminate layers (4, 8, 12, and 16) to optimize stiffness, strength, and weight. To reduce prototyping costs and development time, the structural response under operational loads was simulated using ANSYS Workbench 2025 R1. The Taguchi method was employed to minimize the number of experimental trials, considering three factors at four levels each. A multi-objective optimization was then performed to minimize tip deformation and maximum stress while ensuring a safe failure index. The results indicated that force distance was the most influential factor, followed by laminate configuration, while force magnitude had a comparatively smaller effect within the tested range. The configuration with a force of 15 N, a force distance of 60 cm, and 12 laminate layers achieved a composite desirability of 0.9413, leading to a significant reduction in deformation and stress while maintaining structural safety. These findings validate the effectiveness of the proposed design and optimization framework and provide practical guidelines for the development of high-performance composite wind turbine blades.
1. Introduction
Wind energy is one of the most mature technologies and fastest growing sources of energy; it is highly scalable, has low operating costs and has little impact on the environment during operation [1,2]. Wind turbines [3] are the key technology for capturing this resource and have undergone major development in terms of design, materials, and control techniques to achieve better performance and reliability in various locations and climates [4,5,6]. During the last two decades, composites (glass fiber-reinforced polymers (GFRPs) [7] and carbon fiber-reinforced polymers (CFRPs) [8]) have become the principal materials for blade construction because of their high strength-to-weight ratio and high stiffness resistance to corrosion under harsh environmental exposure conditions [9]. The design of modern blades incorporates improved computational modeling, laminate theory [10], and manufacturing techniques such as vacuum-assisted resin transfer molding or prepreg layup, with the result that even longer utility-scale turbines of over 80 m can be produced with high quality and repeatability [11,12].
Bending [13] and torsion [14] coupling effects occur because of the anisotropic and heterogeneous characteristics of fiber-reinforced laminates [15], making the prediction of natural frequencies and mode shapes more difficult than that of isotropic structures [16]. Variable geometry designs [17], where the chord length, twist [18,19], and thickness vary across the span, also affect the stiffness and mass distribution and shift the resonant properties of the blade [20]. The blades are exposed to a large spectrum of dynamic loads, such as aerodynamic variations, gravitational forces, and, in certain instances, local forces that can stimulate individual vibration [21] modes under normal operating conditions [22,23]. If the excitation frequencies match the natural frequencies of the blade, there is a possibility of excessive vibrations [24,25] that accelerate fatigue damage and shorten the service life [26]. Therefore, modal [27,28] and harmonic [29,30] analyses are needed to ensure accuracy, and failure prediction strategies are needed to identify resonance hazards early in the design stage. This requires the use of advanced numerical modeling, material customization, and optimization techniques in modern composite blade design [31].
Numerical simulation [32,33] is now an inseparable part of contemporary wind turbine blade engineering, as it helps to close the divide between concept design and a real prototype [34]. Simulation provides a means to reduce the occurrence of unforeseen resonance and material failure during service by accurately predicting natural frequencies [35,36], mode shapes [37], harmonic response, and localized stress distributions [38,39].
In an effort to advance wind turbine technology, numerous studies have focused on the integrated optimization of blade design. In a significant contribution to this field, Yao et al. [40] conducted a comprehensive study on the aero-structural design and optimization of a 50 MW wind turbine with blades exceeding 250 m. Their findings were substantial, demonstrating that the optimized design could achieve a blade mass reduction of over 25% and a cost reduction of 30%. The optimization of blade tip geometry has been a persistent focus in aerodynamic research to mitigate tip vortex losses and enhance overall turbine performance. Madsen et al. [41] presented a high-fidelity, CFD-based framework for designing curved blade tips. Their results demonstrated that an optimized curved tip can improve aerodynamic efficiency and power production without compromising the structural integrity of the blade. Cardamone et al. [42] proposed a novel design methodology that integrates multi-fidelity analysis with surrogate-based optimization. Their approach leverages low-fidelity models for rapid design space exploration and high-fidelity simulations for refining the most promising candidates. To compare different modal analysis methods, Teter and Gawryluk [43] conducted experimental and numerical modal analyses on a fixed rotor with three active composite blades. The blades were made of a glass-epoxy laminate, on which active macrofiber composite elements were mounted. Their results showed very good agreement between the experimental data and the numerical simulations, with the relative difference between the numerical and experimental results for the complete rotor being approximately 6%.
While numerous studies have advanced the design, analysis, and optimization of wind turbine blades, the majority have focused on configurations with fixed geometry, examining parameters such as material composition, stiffness tailoring, or aerodynamic performance in isolation. As a result, the specific effects of spanwise-varying geometry (particularly blades incorporating progressive twists along their length) remain comparatively underexplored in the literature. The present work addresses this gap by investigating a one-meter-long, variable-geometry GFRP blade in multiple thickness configurations, realized through varying layer counts, and subjecting it to comprehensive modal and harmonic response analyses.
In this study, a wind turbine blade is designed based on the National Advisory Committee for Aeronautics (NACA) 4412 airfoil profile [44], incorporating a spanwise variation in cross-sectional dimensions and a progressive twist of 15° from the root to the tip. The blade is modeled as a composite structure using GFRP with multiple thickness configurations achieved through varying layer counts. High-fidelity finite element analysis is employed to evaluate the blade under harmonic loading applied at different positions along the span, accompanied by a modal analysis to determine natural frequencies and assess resonance phenomena. The investigation integrates structural optimization to minimize tip deflection and reduce peak stress while ensuring compliance with strength and stability constraints.
2. Materials and Methods
2.1. Geometric Design of the Blade
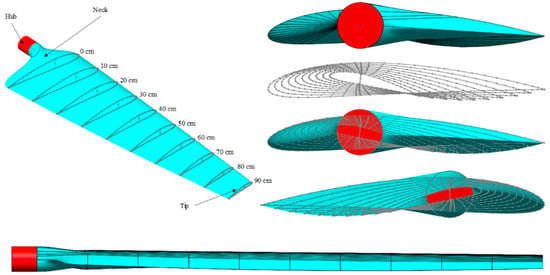
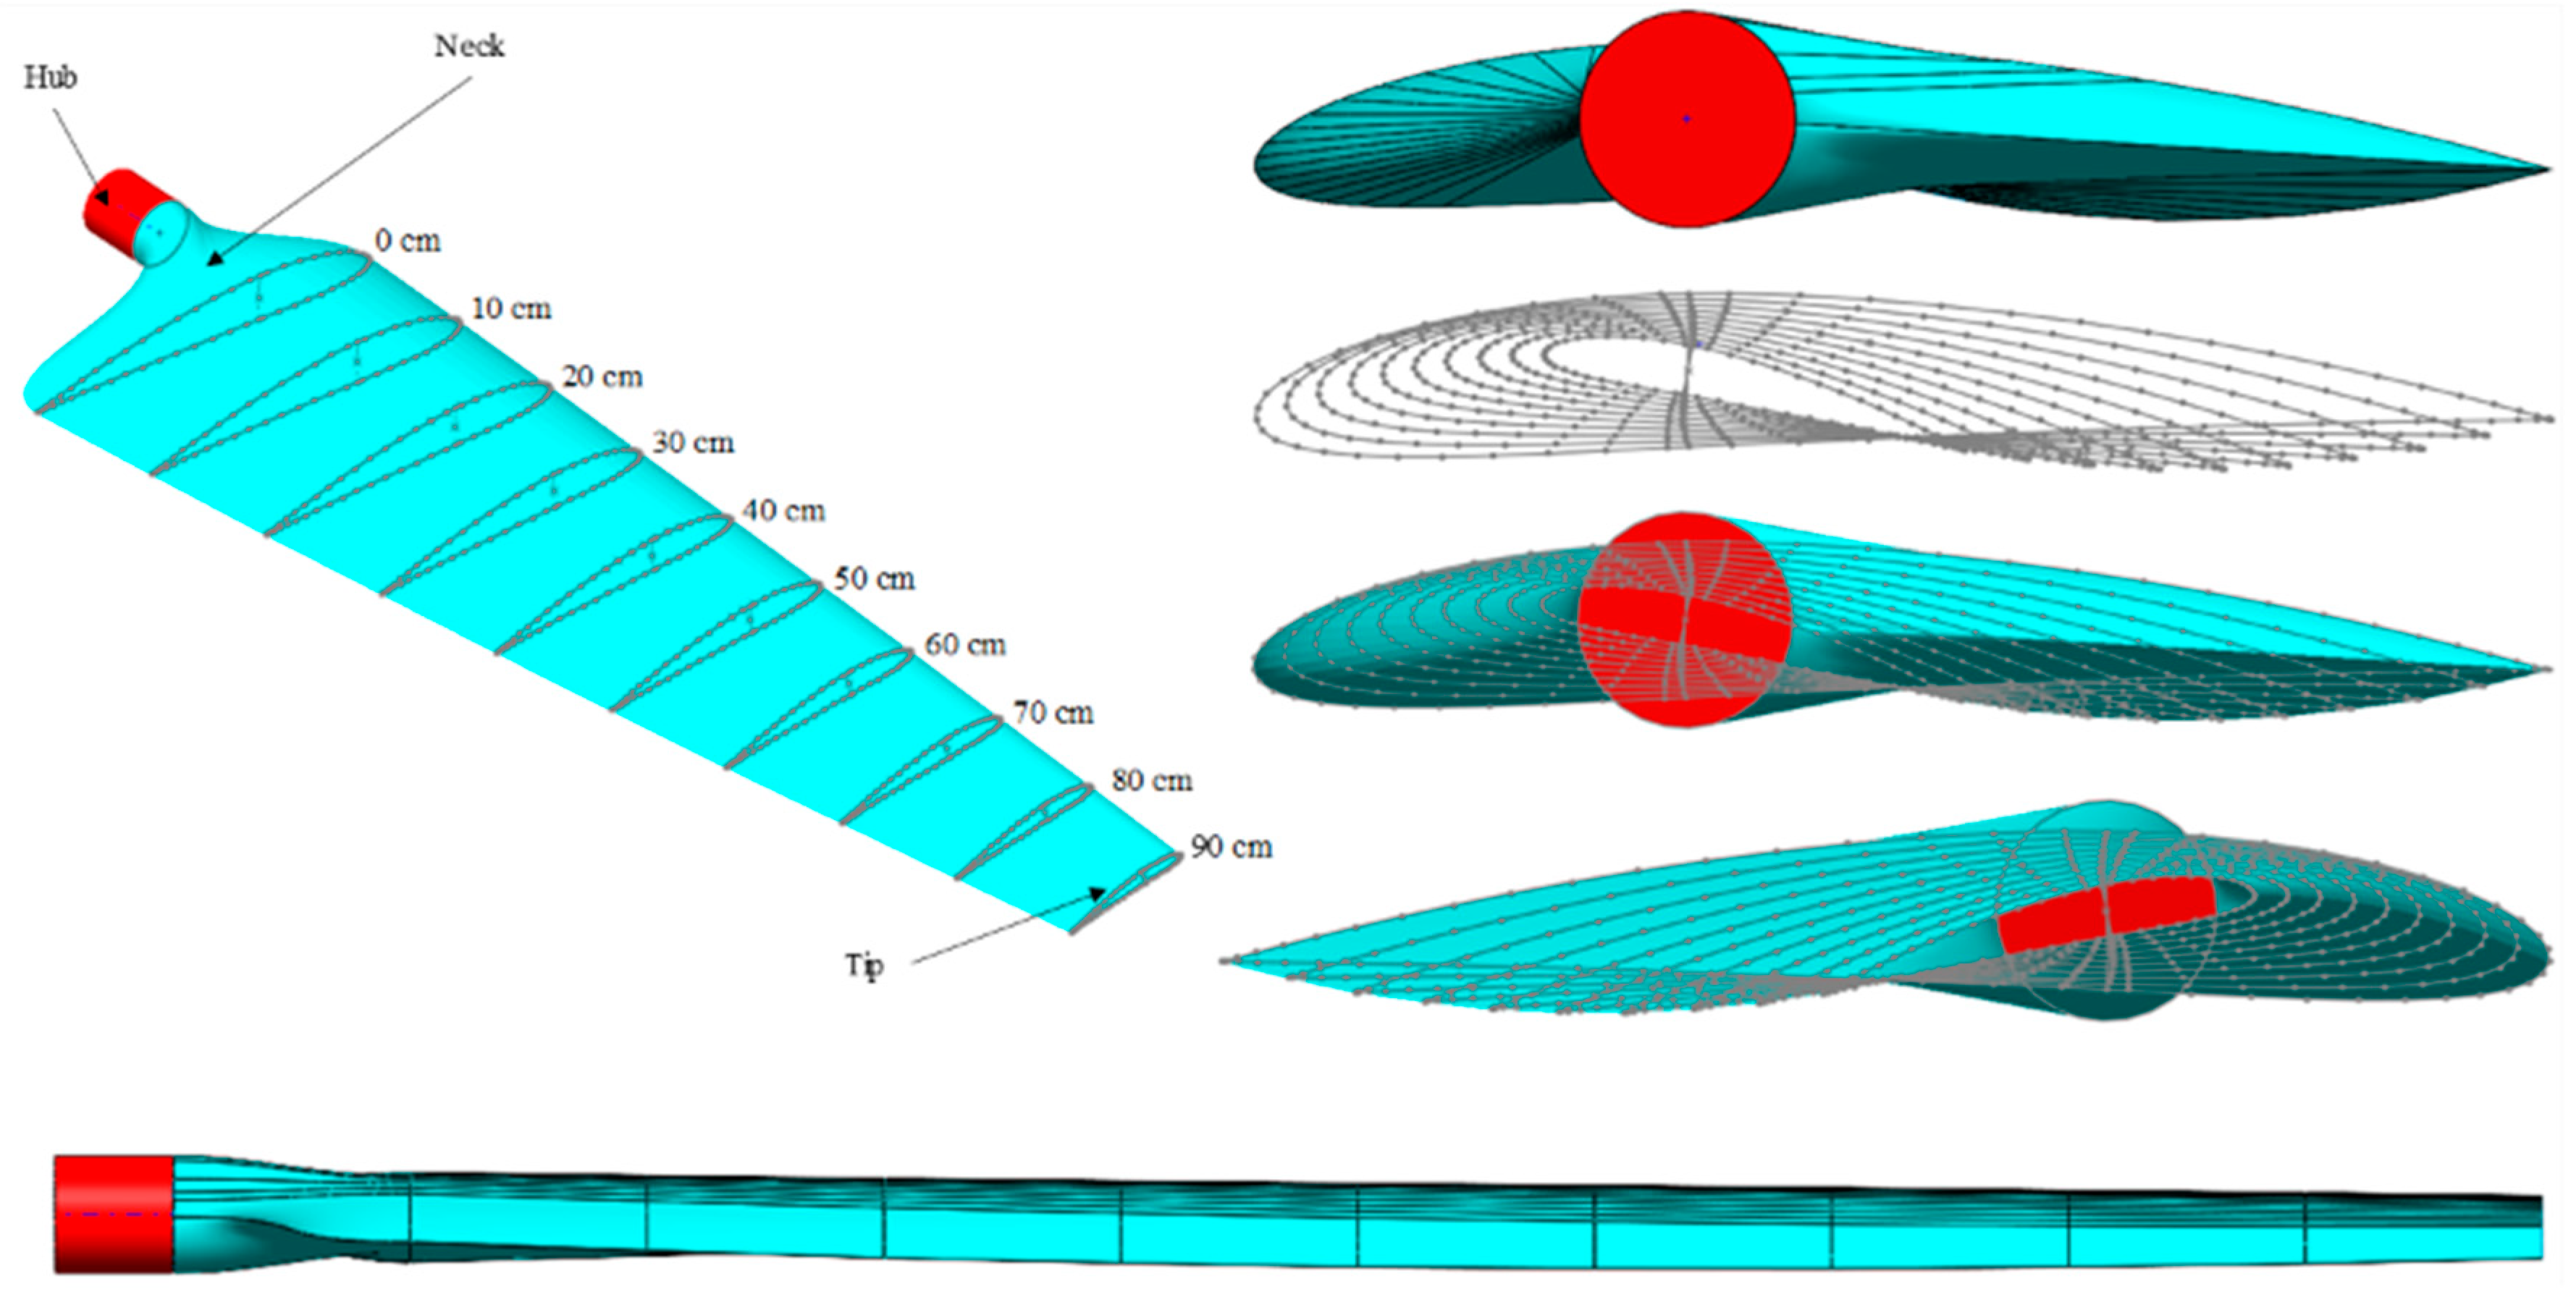
In the present study, a custom wind turbine blade was designed based on the NACA 4412 airfoil profile, which was used as the reference cross-sectional geometry along the blade span. The blade geometry was generated by varying the chord length and progressively rotating the airfoil cross-sections from the root to the tip, with a total twist angle of 15° over the blade span, to provide a suitable aerodynamic and structural configuration. The blade has a total length of 100 cm, with the first 10 cm forming the neck section, which serves as the interface for attachment to the turbine rotor or hub. The remaining 90 cm, extending toward the tip, is divided into nine equal segments of 10 cm each.
The NACA 4412 airfoil was selected as the reference cross-sectional profile for the blade design due to its well-established use in wind turbine and aerodynamic applications and the availability of reliable geometric data and previous studies in the literature. The airfoil coordinates were obtained from a publicly available airfoil database and used to generate the blade cross-sections. The NACA 4412 profile itself was maintained along the blade span; however, the cross-sectional geometry was scaled according to the spanwise chord distribution and progressively rotated to introduce the prescribed twist angle. Therefore, the custom blade developed in this study does not represent a uniform NACA 4412 extrusion. Instead, it is a three-dimensional blade geometry generated from the NACA 4412 reference profile through spanwise scaling and rotation, with the chord length and twist angle varying from the root toward the tip, as specified in Table 1.
Table 1.
Spanwise distributions of the twist angle, chord length, and measurement position along the 100 cm blade.
The wind turbine blade was designed via SolidWorks 2025, and the resulting geometry is illustrated in Figure 1. As shown, the blade consists of several distinct parts, including the shell, neck, root, tip, and hub.
Figure 1.
Geometry of the designed wind turbine blade based on the NACA 4412 airfoil profile.
2.2. Material Properties and Layup Configuration
In the present study, the blade structure utilized a unidirectional GFRP composite with an epoxy resin matrix. Compared with woven fabrics, the glass fibers used are unidirectional, with an area weight of 400 g/m2, which is selected for its superior tensile properties, high stiffness in the fiber direction, and favorable handling during manufacturing. This choice also offers a better strength-to-weight ratio and more predictable mechanical behavior under uniaxial loading, making it particularly suitable for the primary load-bearing regions of the blade. The mechanical properties of the epoxy resin and the glass fibers are summarized in Table 2.
Table 2.
Mechanical properties of glass fibers and epoxy resin.
To define the composite lamina in ANSYS ACP, the homogenized orthotropic material properties were obtained using ANSYS Material Designer. In this approach, the constituent properties of dry glass fiber and epoxy resin were introduced at the microscale, and a representative volume element was generated to evaluate the equivalent lamina properties. A fiber volume fraction of was assumed, which is consistent with the resin infusion manufacturing route adopted in this study. The homogenization process provided the effective orthotropic engineering constants required for finite element modeling, including the elastic moduli, shear modulus, Poisson’s ratio, and density. These equivalent lamina properties were then directly imported into the ANSYS ACP module for structural analysis. The resulting homogenized properties are listed in Table 3.
Table 3.
Homogenized orthotropic engineering properties of the glass/epoxy lamina used in ANSYS ACP, obtained from ANSYS Material Designer.
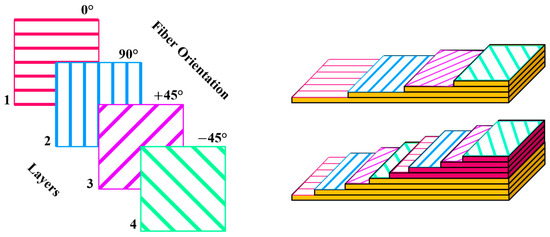
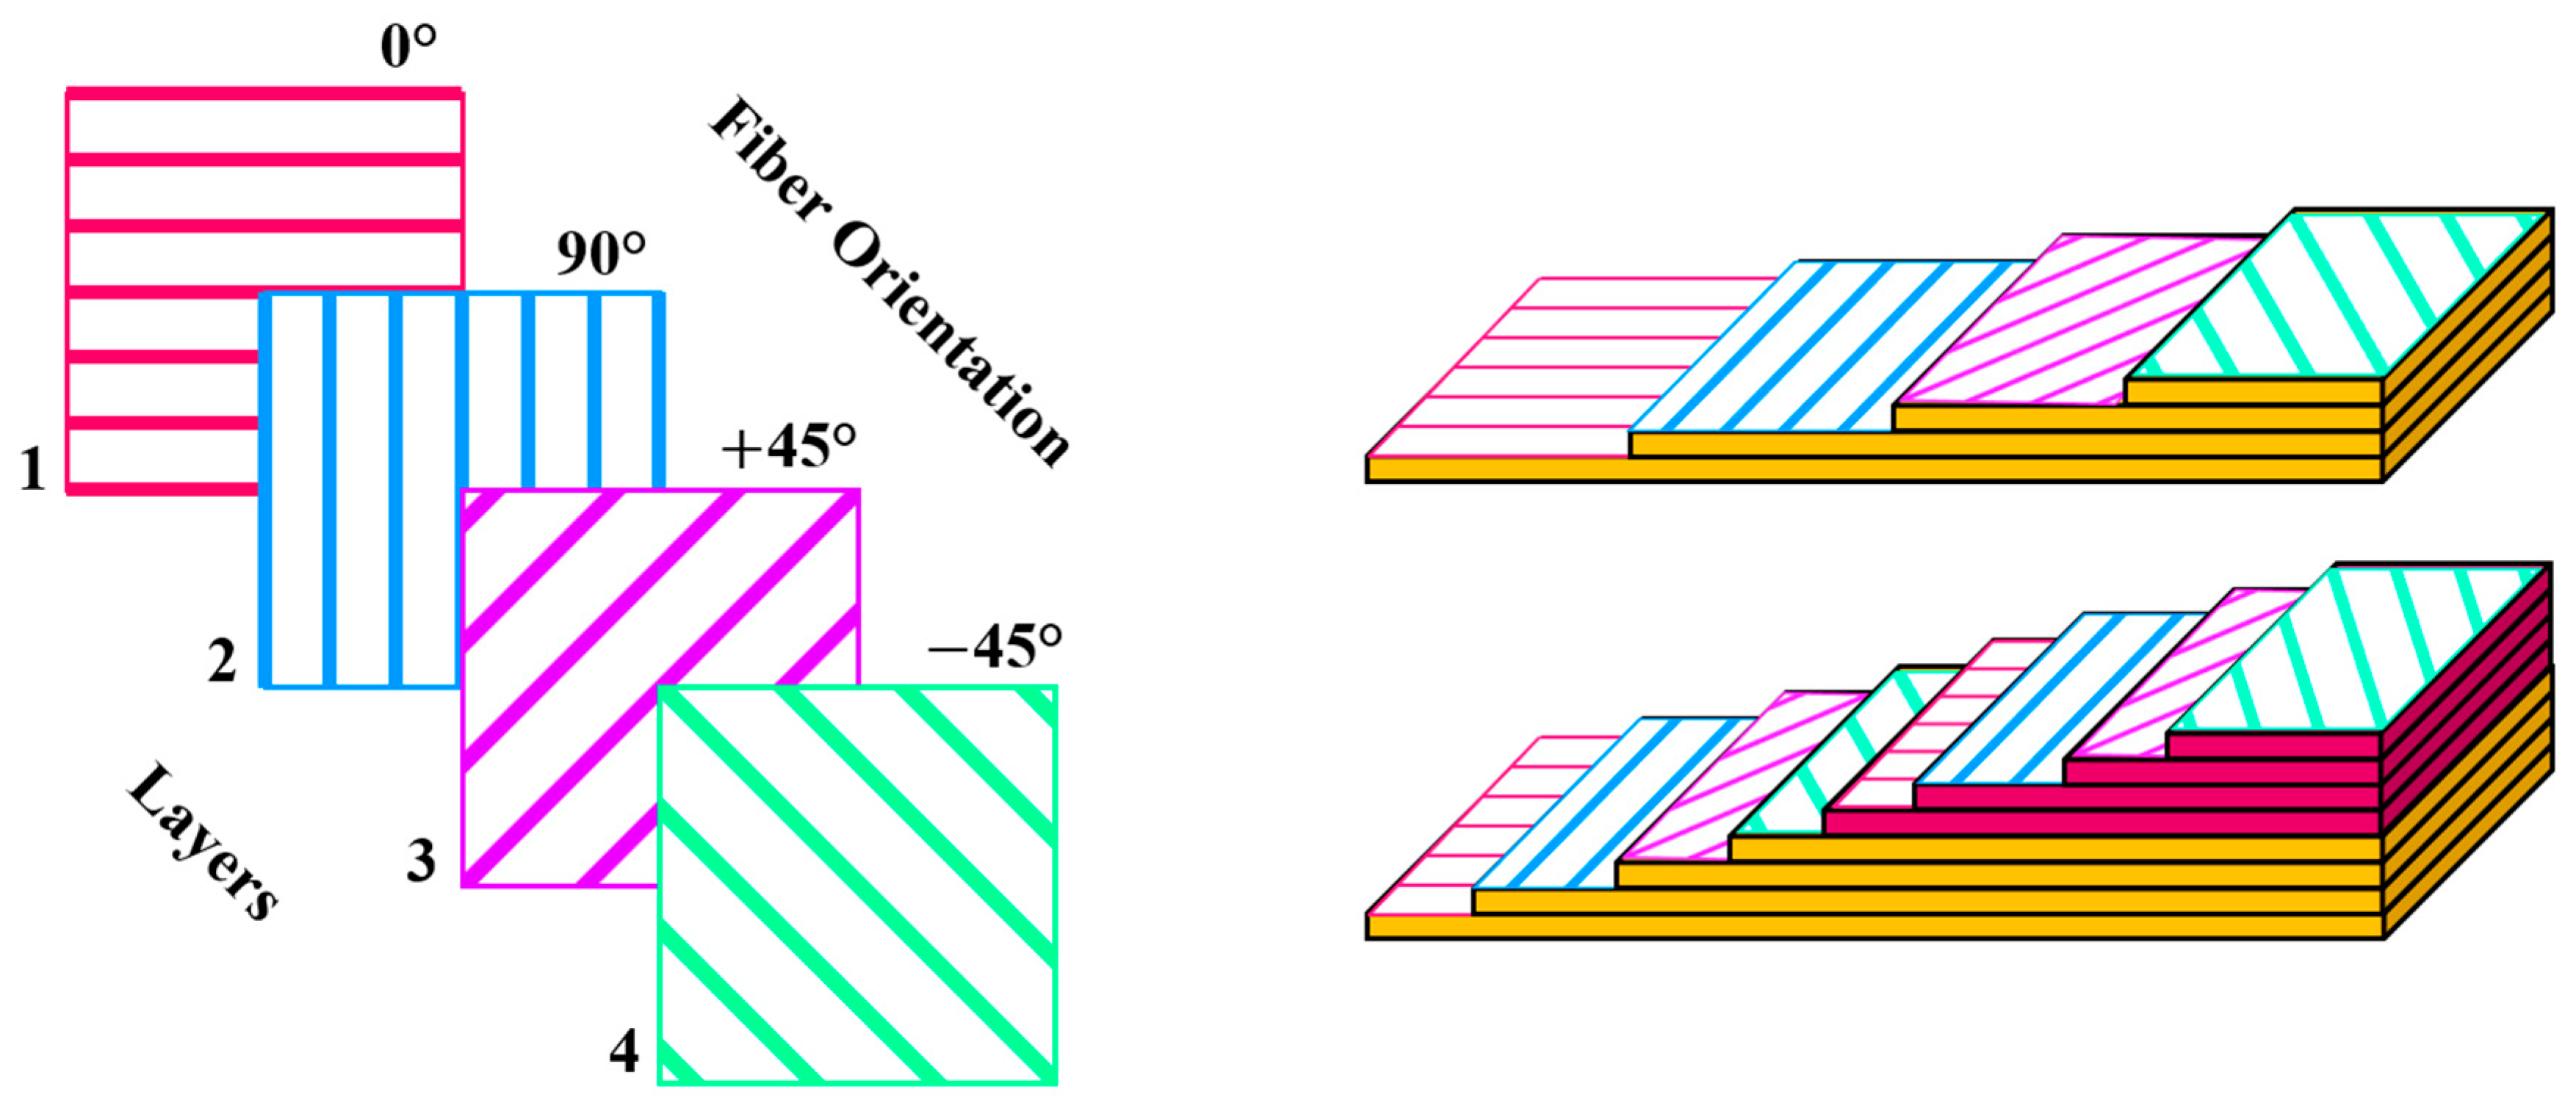
The stacking sequence of composite laminates plays a critical role in determining their mechanical performance, including stiffness, strength, and resistance to different loading conditions. By strategically orienting fibers in different directions, laminates can be personalized to carry loads under multiple loading conditions and improve structural stability under complex stress states. This study incorporates a 15° pre-twist and a specific stacking sequence (0°, 90°, +45°, and −45° as showed in Figure 2) as fixed design parameters to model a realistic turbine blade, while the optimization focuses on the influence of load conditions and the number of laminate layers. This configuration was selected based on the expected loading behavior of the blade, where the 0° and 90° layers primarily contribute to resistance against bending and axial loading, while the +45° and −45° layers contribute to torsional stiffness and resistance to shear and twisting. Four laminate configurations were investigated, consisting of 1, 2, 3, and 4 repetitions of this sequence, corresponding to total layer counts of 4, 8, 12, and 16 layers, respectively. The effect of increasing the number of laminate layers on the structural stiffness and dynamic response was subsequently evaluated through experimental tensile testing, finite element analysis, and modal and harmonic response analyses.
Figure 2.
Configuration of a four-layer laminate showing fiber orientations: Layer 1 at 0°, Layer 2 at 90°, Layer 3 at +45°, and Layer 4 at −45°.
For each laminate configuration, three specimens were fabricated using the same layup pattern to ensure repeatability and reliability of the experimental measurements. The specimens were subjected to uniaxial tensile testing using a 5-ton universal testing machine in accordance with ASTM D3039, a standard test method for determining the tensile properties of polymer matrix composite materials reinforced with high-strength fibers. The test specimens had dimensions of 200 mm × 20 mm, with the thickness varying according to the number of composite layers. During testing, 50 mm of each specimen at both ends was clamped using aluminum grips, leaving a 100 mm gauge length between the grips. The tensile tests were conducted at a crosshead speed of 20 mm/min. The experimental force–displacement responses obtained from the three specimens for each laminate configuration were recorded and subsequently used for comparison with the corresponding finite element simulation results to validate the numerical model.
The selected material system and layup configuration were designed to provide a suitable balance between stiffness, strength, and weight for the composite blade. The influence of the laminate configuration on these structural characteristics was subsequently assessed through the experimental and numerical analyses presented in the following sections.
2.3. Finite Element Model Setup
The numerical analysis was conducted using a sequential finite element framework to evaluate the structural and dynamic response of the composite wind turbine blade and to identify an optimized configuration. The overall numerical procedure consisted of four main stages: (1) development of the composite blade model and definition of the laminate layup in ANSYS ACP, (2) modal analysis to determine the natural frequencies and corresponding mode shapes, (3) harmonic response analysis to evaluate the blade response under the loading conditions defined by the Design of Experiments (DOE), and (4) multi-objective optimization based on the obtained structural response parameters. The main engineering response parameters considered in the numerical analyses were the maximum stress and maximum tip displacement, while the failure index (FI) was subsequently considered as an additional criterion in the optimization process. This framework was used to investigate the effects of the number of composite layers, force magnitude, and force application distance on the dynamic structural performance of the blade.
To evaluate the structural response of the wind turbine blade under aerodynamic and harmonic loading, a finite element model was developed via ANSYS Workbench integrated with the ACP (Ansys Composite pre-post) module.
The blade geometry, initially designed in SolidWorks, was imported into the ANSYS Workbench environment for meshing and structural analysis. To enhance accuracy in the critical connection region between the blade and the aluminum hub, a refined mesh was applied using the contact region feature, with a local element size of 5 mm. In the ANSYS ACP Pre environment, the composite blade was modeled via layup sets consisting of 4, 8, 12, and 16 layers, following the orientation sequence of 0°, 90°, +45°, and −45°, respectively. In the modal analysis setup within ANSYS, six fundamental mode shapes were targeted, and the solver was configured to extract the first six natural frequencies. A fixed support boundary condition was applied at the blade root, representing the connection point to the turbine hub. Once the boundary conditions and composite layup were defined, modal analysis was executed to obtain the natural frequencies and corresponding deformation modes.
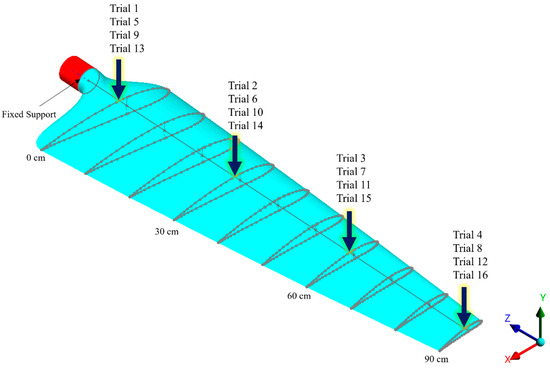
In this study, DOE was employed to investigate the influence of the layer count, applied load magnitude, and load position on the structural response of the composite blade, enabling a more informed and optimized design process. The first input parameter considered in the DOE is the magnitude of the applied force. On the basis of the specific geometry of the blade, the following force levels were selected: 15 N, 22.5 N, 30 N, and 37.5 N. The second input parameter, referred to as force distance, represents the location at which the external force is applied along the blade span. To capture the influence of the load position on the structural response, four levels were defined: 0 cm, 30 cm, 60 cm, and 90 cm from the blade root. The third input parameter is the number of layers, which is defined at four levels: 4, 8, 12, and 16 layers. Given that the experimental setup involves three input factors, each defined at four levels, the Taguchi method was selected as a suitable approach for designing the experiments. Using the Taguchi method and defining the input parameters within Minitab 18, the experimental design was constructed on the basis of an L16 orthogonal array. The amplitude of the harmonic force and its application location were defined according to the Force and Force Distance parameters specified in the DOE matrix presented in Table 4.
Table 4.
Taguchi L16 orthogonal array for the DOE.
The designed experiments were developed specifically for implementation in the harmonic response analysis, ensuring that all simulation conditions align precisely with the defined DOE matrix. Accordingly, 16 simulation trials must be performed in ANSYS to cover all the combinations specified by the Taguchi L16 array.
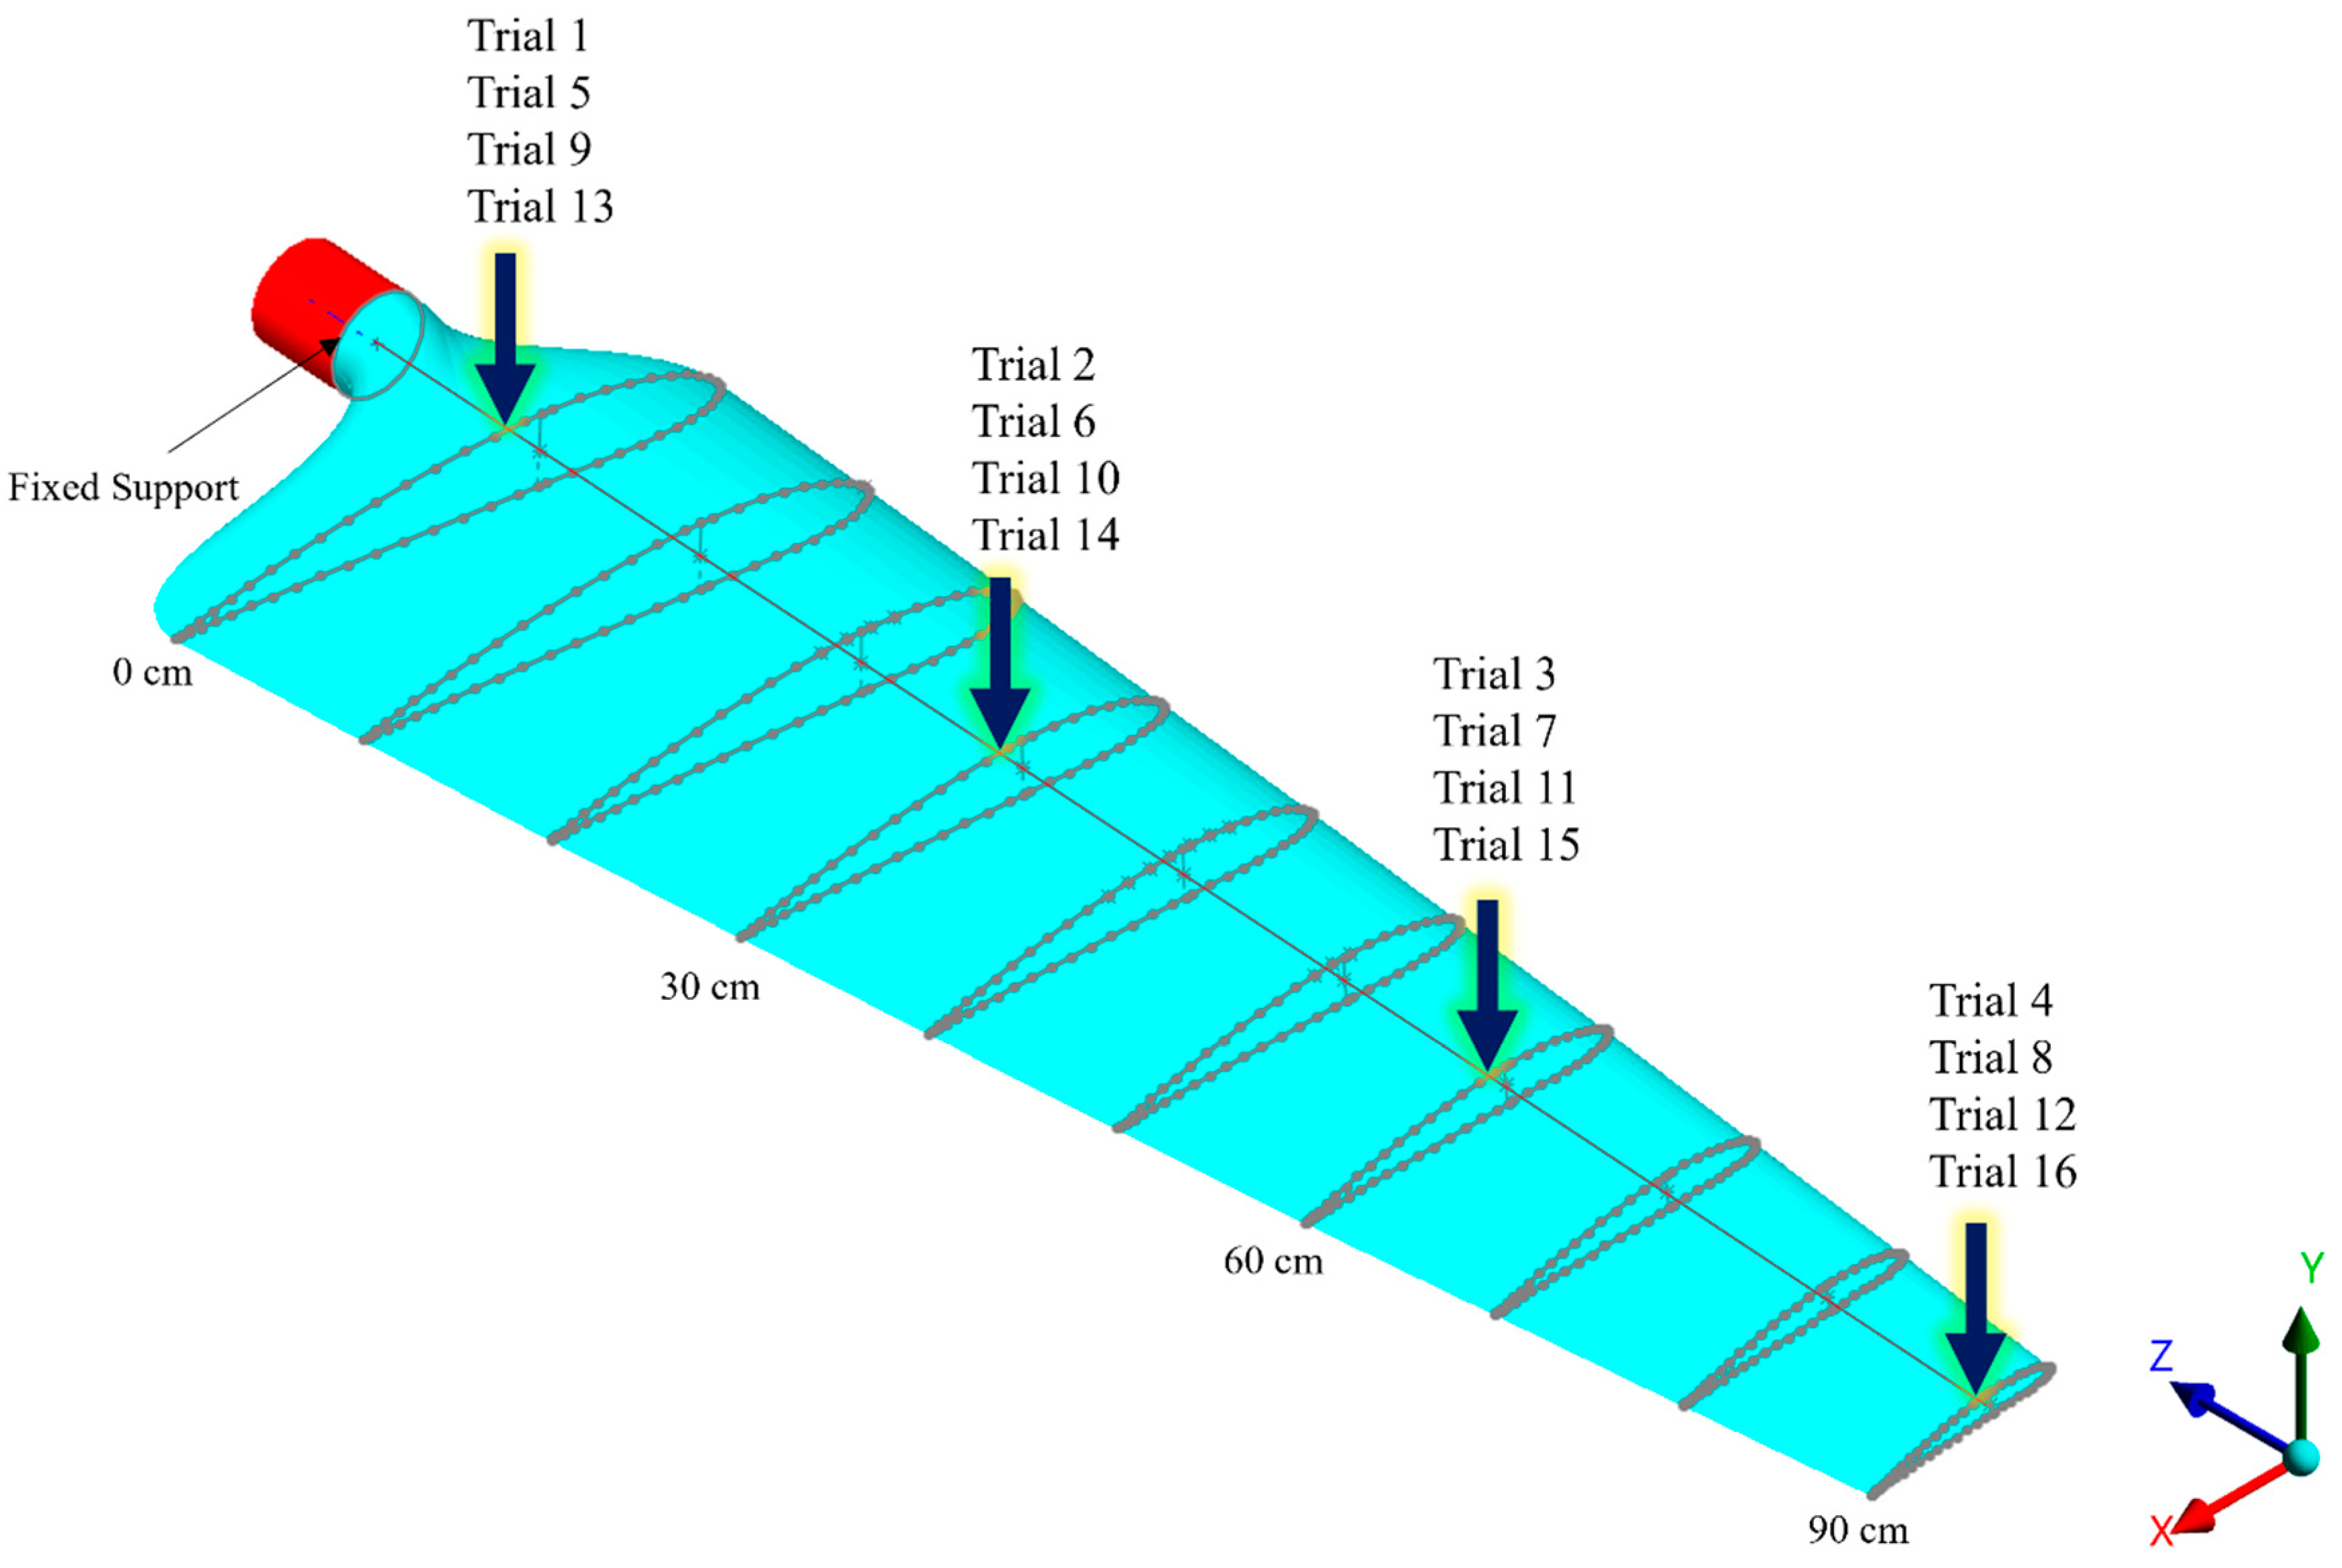
The harmonic response analysis was coupled with the results obtained from the modal analysis and the composite layup defined in ANSYS ACP Pre. The frequency ranges considered for the harmonic loading were selected based on the first six natural frequencies obtained from the modal analysis for each blade configuration. Accordingly, a frequency range of 0–200 Hz was considered for the 4-layer blade, while frequency ranges of 0–250 Hz and 0–300 Hz were considered for the 8- and 12-layer blades and the 16-layer blade, respectively. These frequency ranges were selected to cover the relevant natural frequencies identified from the modal analysis while limiting the computational domain to the frequency range of interest, thereby reducing the computational time and overall analysis cost. In the harmonic response analysis, a constant modal damping ratio of 1% was assumed to account for the inherent damping of the glass/epoxy composite structure. The amplitude of the applied harmonic force and its location were determined based on the DOE results presented in Table 4. The fixed support condition at the blade root, previously defined in the modal setup, was retained. Harmonic loads were applied in the negative Y-direction at various spanwise positions along the blade, as specified by the experimental design. The boundary conditions applied in the harmonic response simulations are illustrated in Figure 3, in accordance with the Taguchi experimental design.
Figure 3.
Boundary conditions and loading configurations applied in the harmonic response analysis, based on the Taguchi experimental design. The fixed support at the blade root and force application points along the span are illustrated.
The primary engineering response parameters (EDPs) extracted from the harmonic response analysis were the maximum stress and maximum tip displacement in the Y-direction. For each simulation trial, the maximum stress over the blade domain was recorded as Max Stress (MPa), while the maximum deformation amplitude at the blade tip in the Y-direction was recorded as Max Displacement (mm). These response parameters were subsequently used to evaluate the dynamic structural performance of the blade and as objective responses in the multi-objective optimization process.
In this study, the failure behavior of the composite blade under dynamic loading was evaluated using the ANSYS ACP Post module. Two failure criteria, namely the Maximum Stress criterion and the Tsai-Wu criterion, were considered to assess the integrity of the composite plies under the applied loading conditions. The FI was used as a quantitative measure of the proximity of the composite material to the corresponding failure criterion. In general, an FI value below 1 indicates that the predicted stress state remains below the defined failure limit, whereas an FI value equal to or greater than 1 indicates that the corresponding failure criterion has been reached or exceeded, respectively. Therefore, lower FI values represent a greater margin from the predicted failure condition and a lower possibility of failure. For each simulation case defined by the DOE matrix, the corresponding maximum FI value was extracted from the ANSYS ACP Post results and recorded as an additional response parameter for the subsequent optimization process.
A target FI of 0.5 was selected as a conservative design target, corresponding to a predicted failure index below the critical threshold of 1. This target was selected to maintain a margin from the onset of the predicted failure condition while simultaneously allowing the optimization to achieve low stress and displacement responses. The selection of an intermediate FI target also prevents the optimization from focusing solely on minimizing the FI at the expense of other structural performance criteria.
To identify the most efficient configuration of the composite blade under dynamic loading, a multi-objective optimization process was conducted via Minitab 18.
3. Results and Discussion
3.1. Validation of the Numerical Model
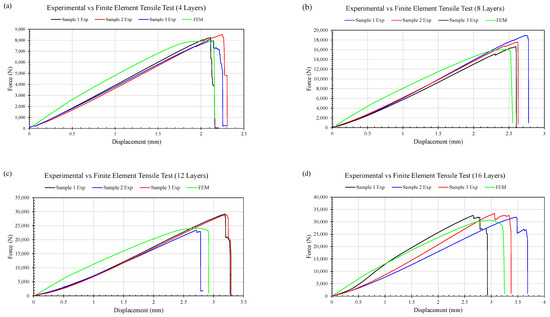
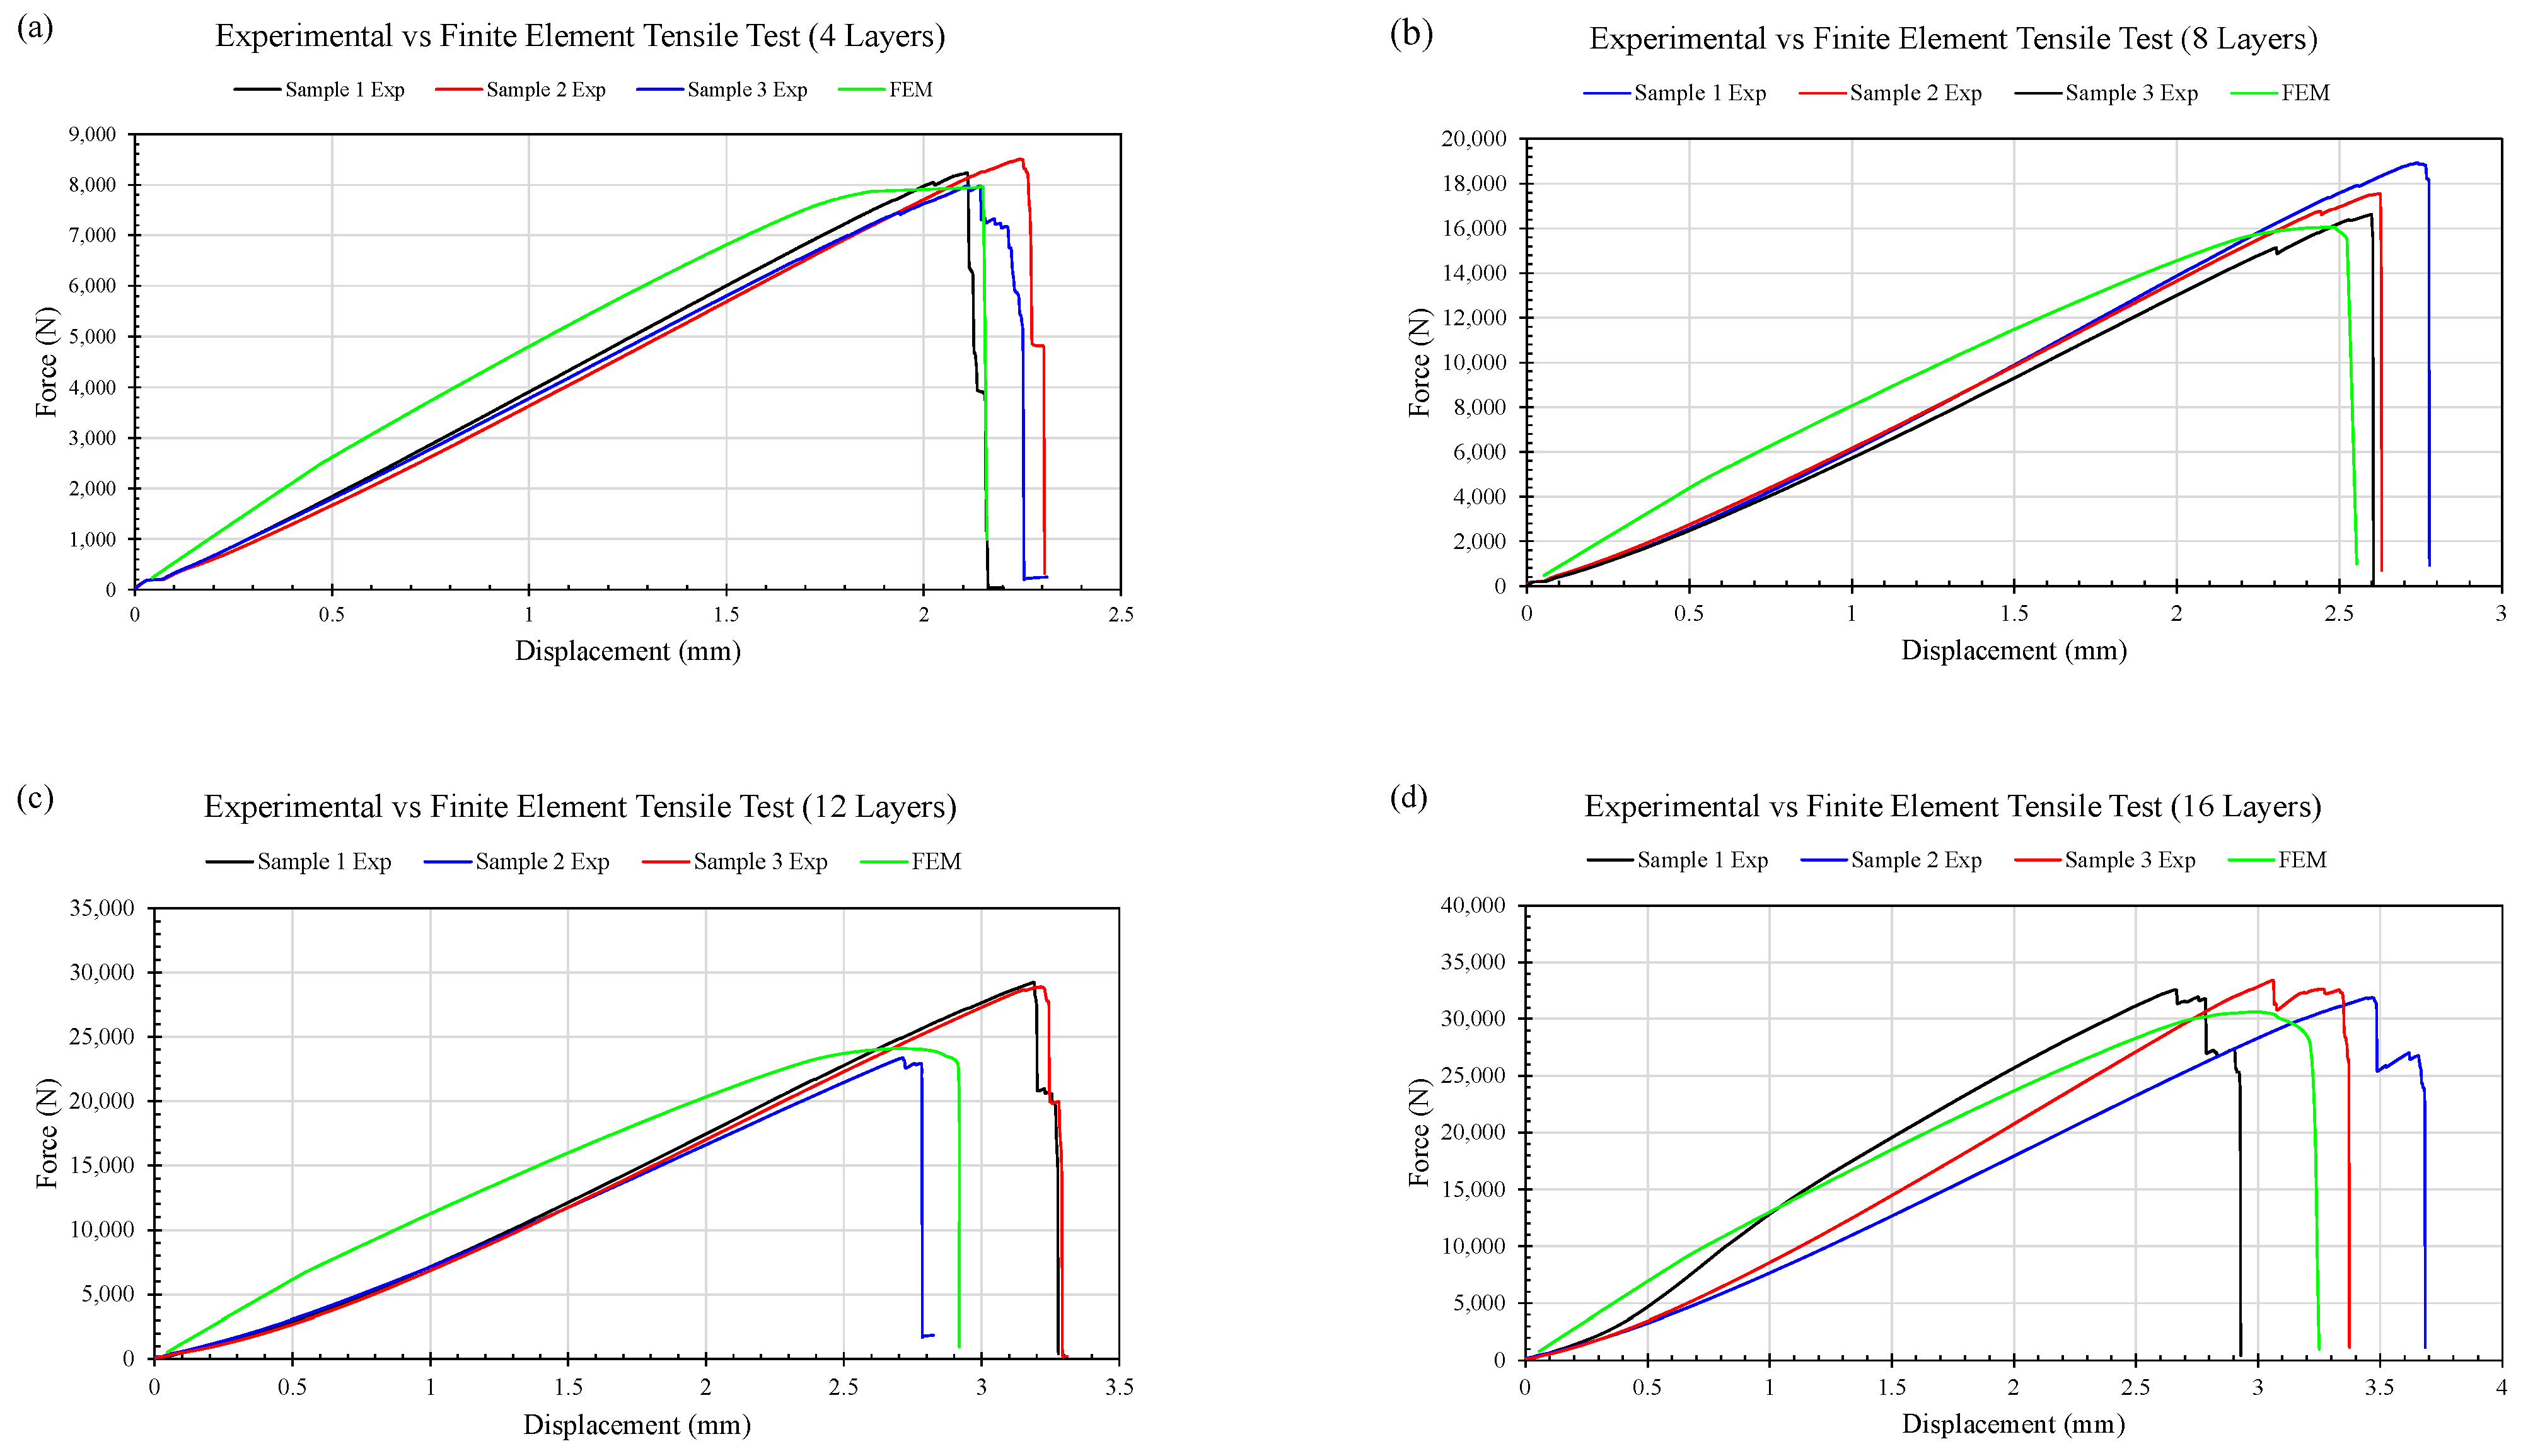
In the present work, the finite element model developed in ANSYS was validated against experimental tensile test results. To achieve this goal, simple uniaxial tensile analyses were performed on composite samples with four different laminate configurations (4, 8, 12, and 16 layers), replicating the geometry and boundary conditions of the physical tests. For each case, the force–displacement response was extracted from the simulation and compared directly with the corresponding experimental curve. The percentage error between the numerical and experimental results was calculated to assess the model’s predictive accuracy. The comparison, presented in Figure 4, demonstrates the level of correlation between the finite element simulations and the laboratory measurements, forming the basis for confirming the reliability of the numerical model for subsequent analyses.
Figure 4.
Comparison of experimental and finite element force–displacement curves for composite tensile specimens with different laminate configurations: (a) 4 layers, (b) 8 layers, (c) 12 layers, and (d) 16 layers.
For the error calculation, the peak force values were taken as the primary comparison metric. Specifically, the peak forces obtained from the three experimental tensile tests were averaged and compared with the peak force predicted by the finite element simulation. For the 4-layer configuration (Figure 4a), the average peak force of the three experimental samples was 8242.833 N, whereas the corresponding peak force from the numerical model was 8113.3 N. This resulted in a calculated error of 1.57%, indicating excellent agreement between the experimental measurements and the simulation for this configuration. For the 16-layer configuration (Figure 4d), the average peak force obtained from the three experimental samples was 32,615.8 N, whereas the corresponding peak force predicted by the finite element simulation was 30,631 N. This results in a calculated error of 6.09%, reflecting a good level of agreement between the numerical and experimental results and confirming the model’s ability to capture the tensile response of the thickest laminate configuration tested.
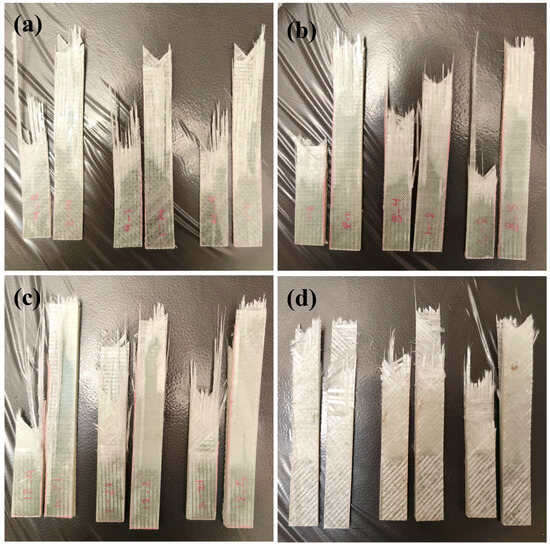
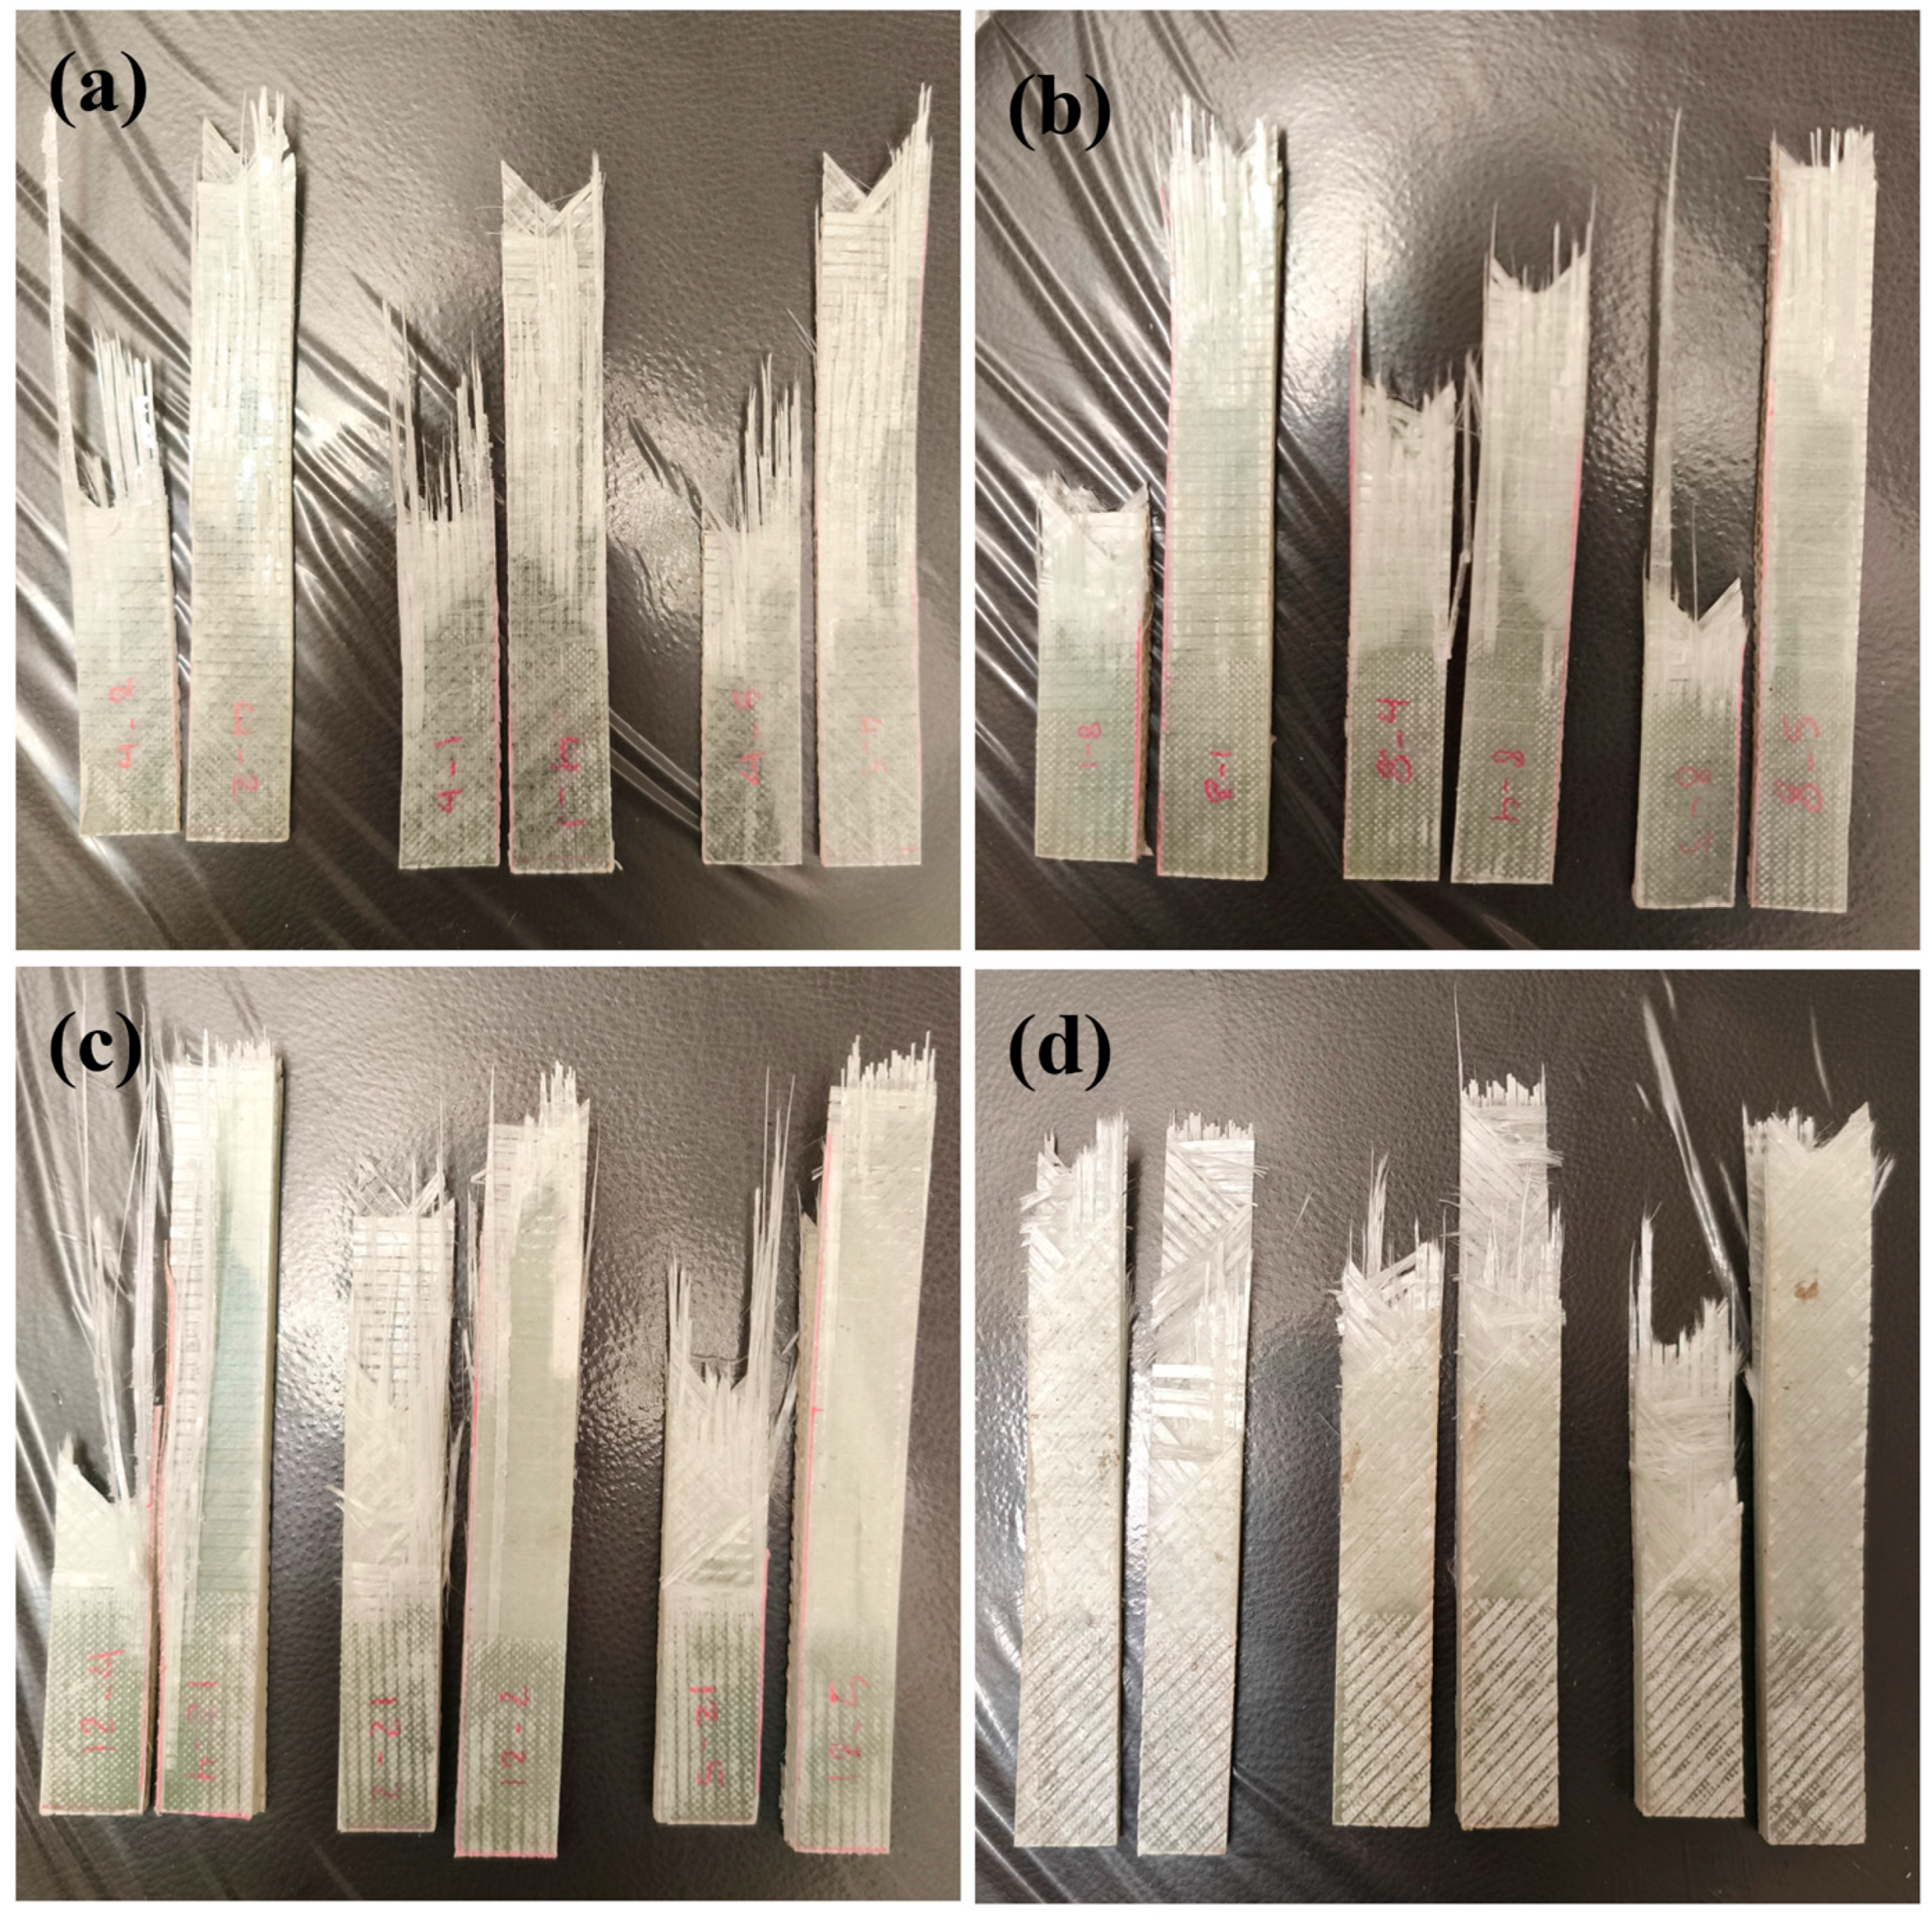
Overall, since the calculated error for most configurations is less than approximately 10%, the finite element model can be considered sufficiently accurate, and its simulation results can be considered reliable for further analysis. Figure 5 presents representative images of the 4-, 8-, 12-, and 16-layer composite samples after tensile testing, illustrating the fracture patterns observed and concluding the validation stage of this study.
Figure 5.
Post-tensile test appearance of composite specimens: (a) 4 layers, (b) 8 layers, (c) 12 layers, and (d) 16 layers.
3.2. Mesh Independence Study
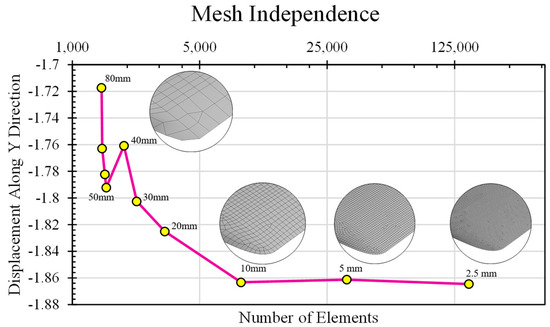
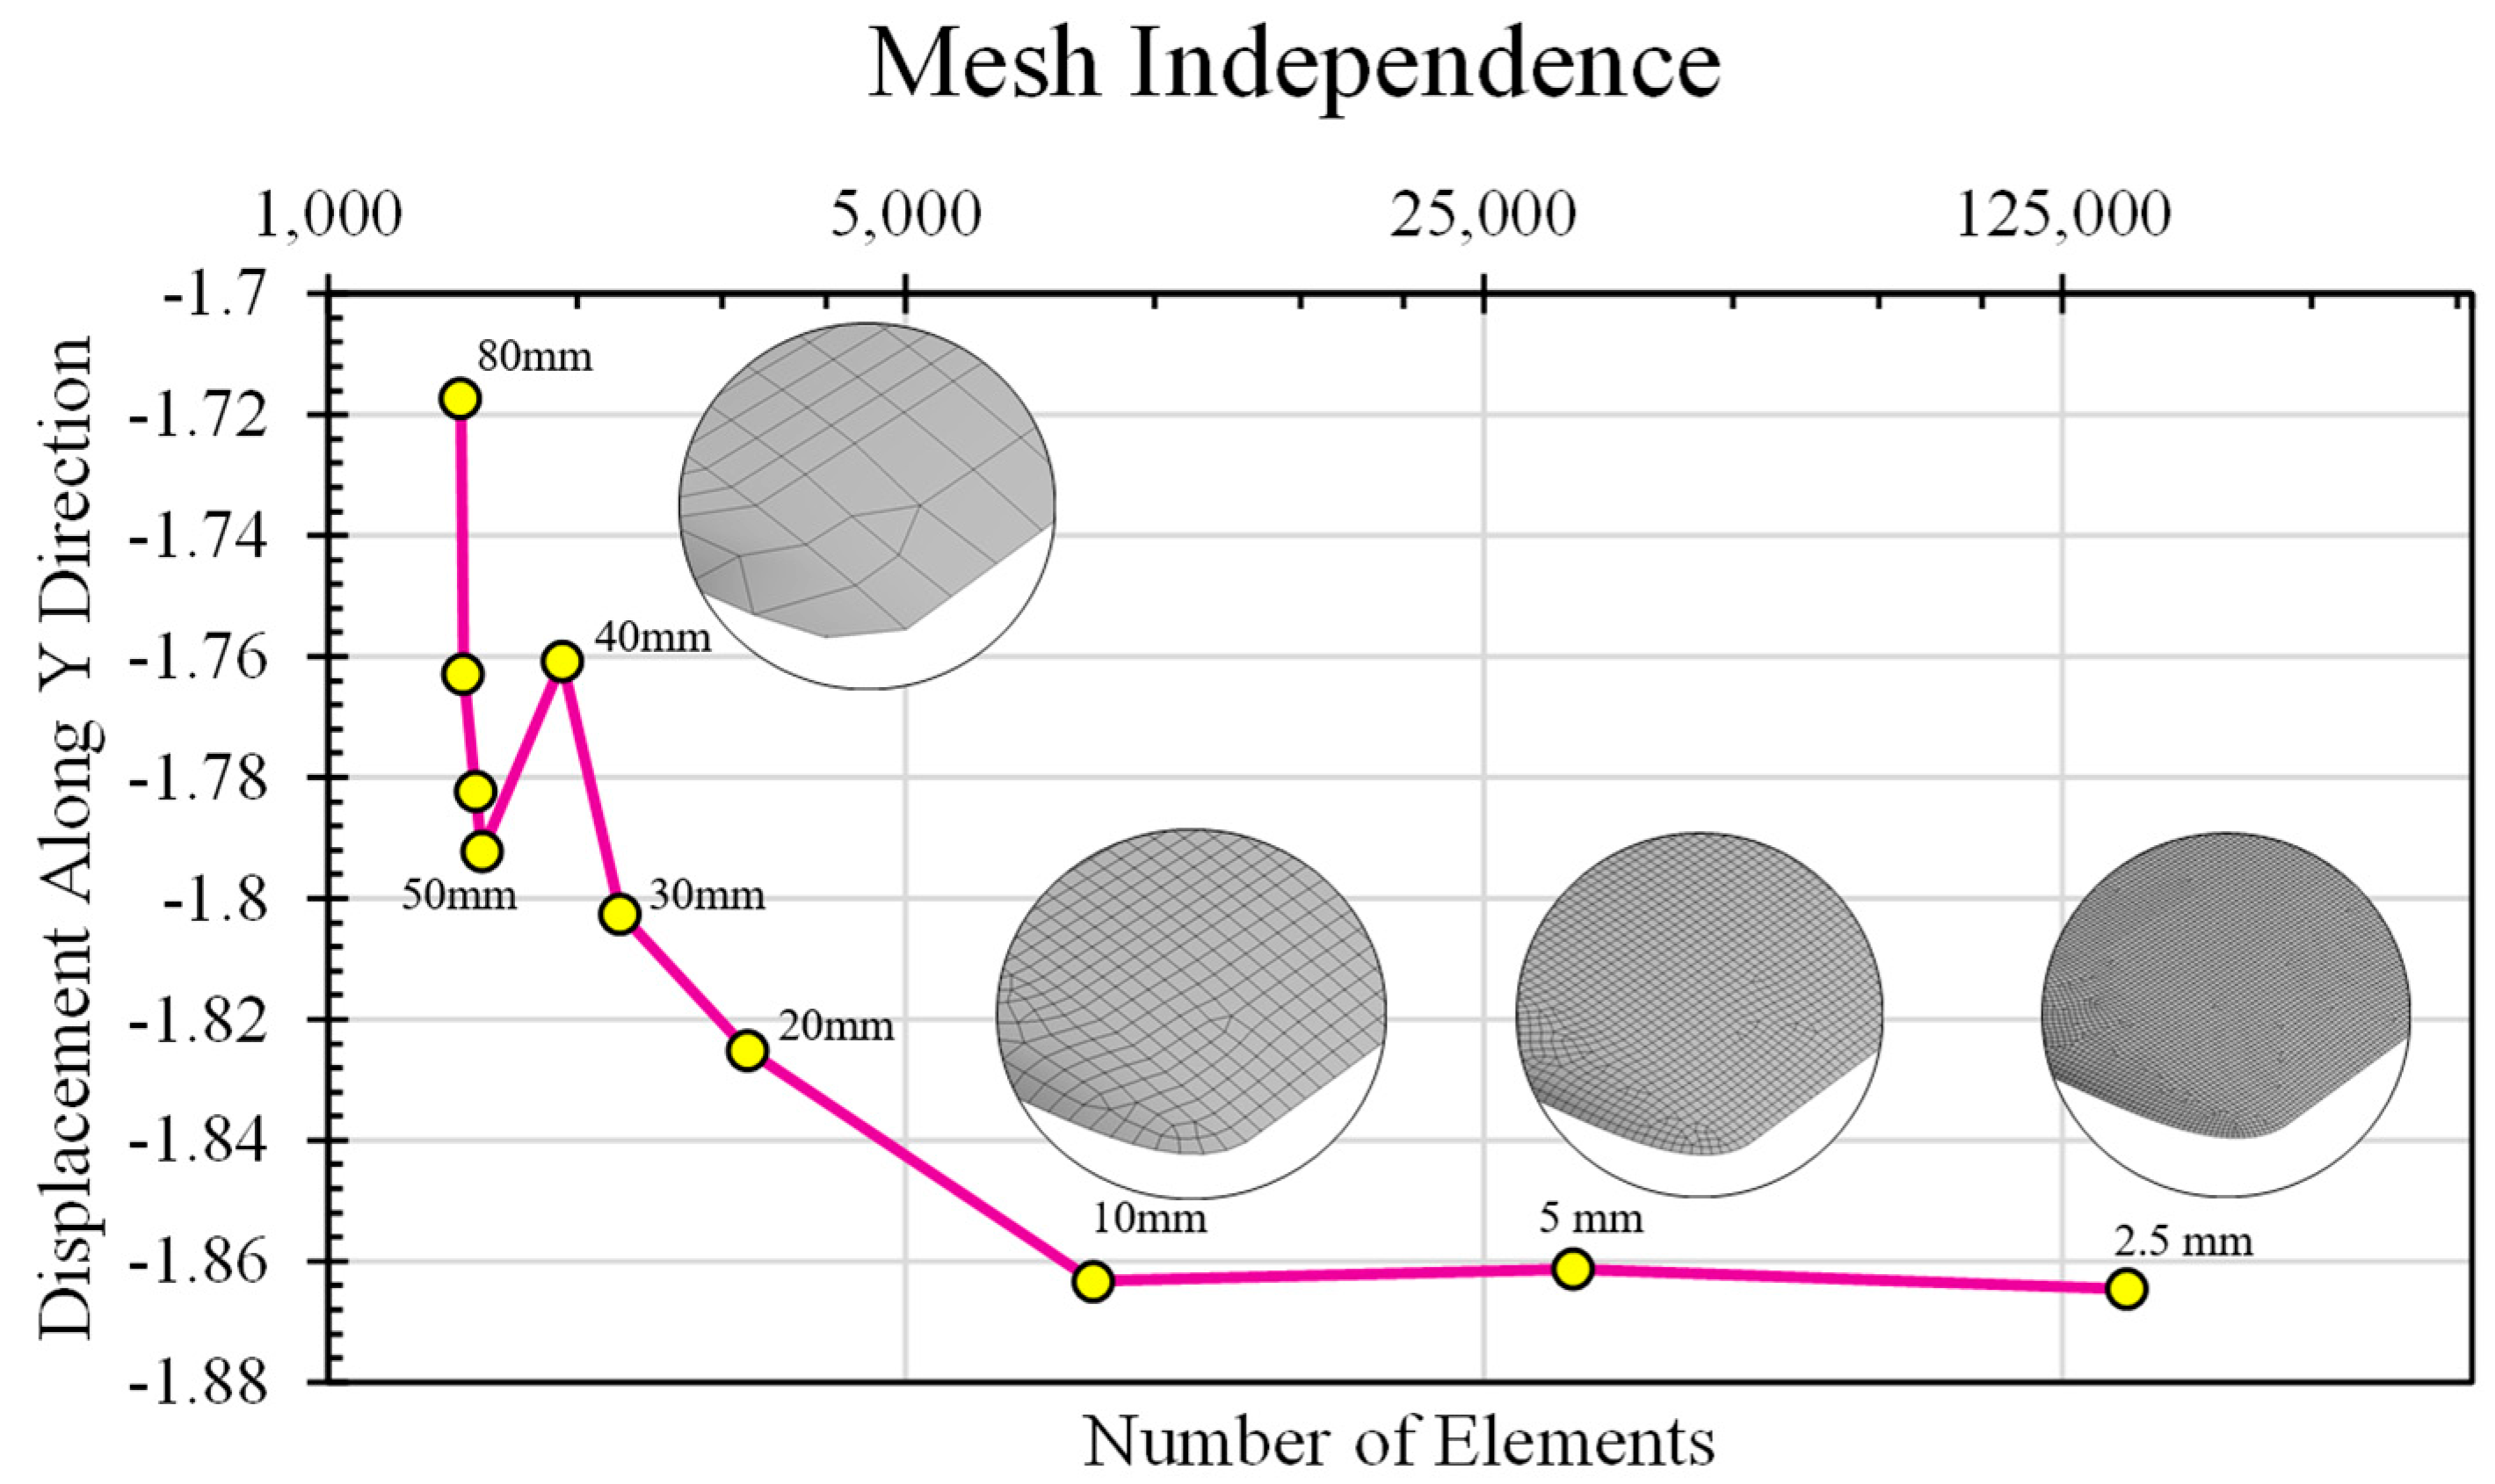
The mesh independence analysis began with a coarse mesh size of 80 mm, which was progressively refined to 70 mm, 60 mm, 50 mm, 40 mm, 30 mm, 20 mm, 10 mm, 5 mm, and finally 2.5 mm. The selected mesh type was a hexahedral (rectangular) element configuration, chosen for its superior accuracy in capturing structural behavior compared with tetrahedral elements in this geometry. The total number of elements corresponding to each mesh size is presented in Figure 6.
Figure 6.
Mesh independence based on tip displacement convergence under a 37.5 N tip load.
Figure 6 shows the variation in tip displacement in the Y direction under a constant load of 37.5 N applied at the blade tip in the negative Y direction for different mesh sizes. As the mesh is refined from 80 mm down to 2.5 mm, the displacement values converge toward a stable result. Significant changes are observed for coarse meshes, whereas beyond a mesh size of approximately 10 mm, the variation in displacement becomes negligible. This shows that the numerical solution has converged, and further refinement does not significantly improve the accuracy. Therefore, a mesh size of 10 mm was selected as the optimal choice, offering high accuracy while reducing the computational time compared with that of finer meshes.
3.3. Modal Analysis Results
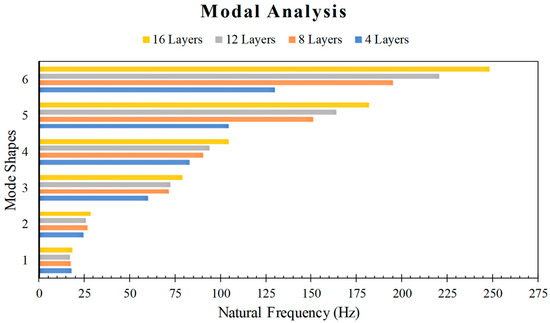
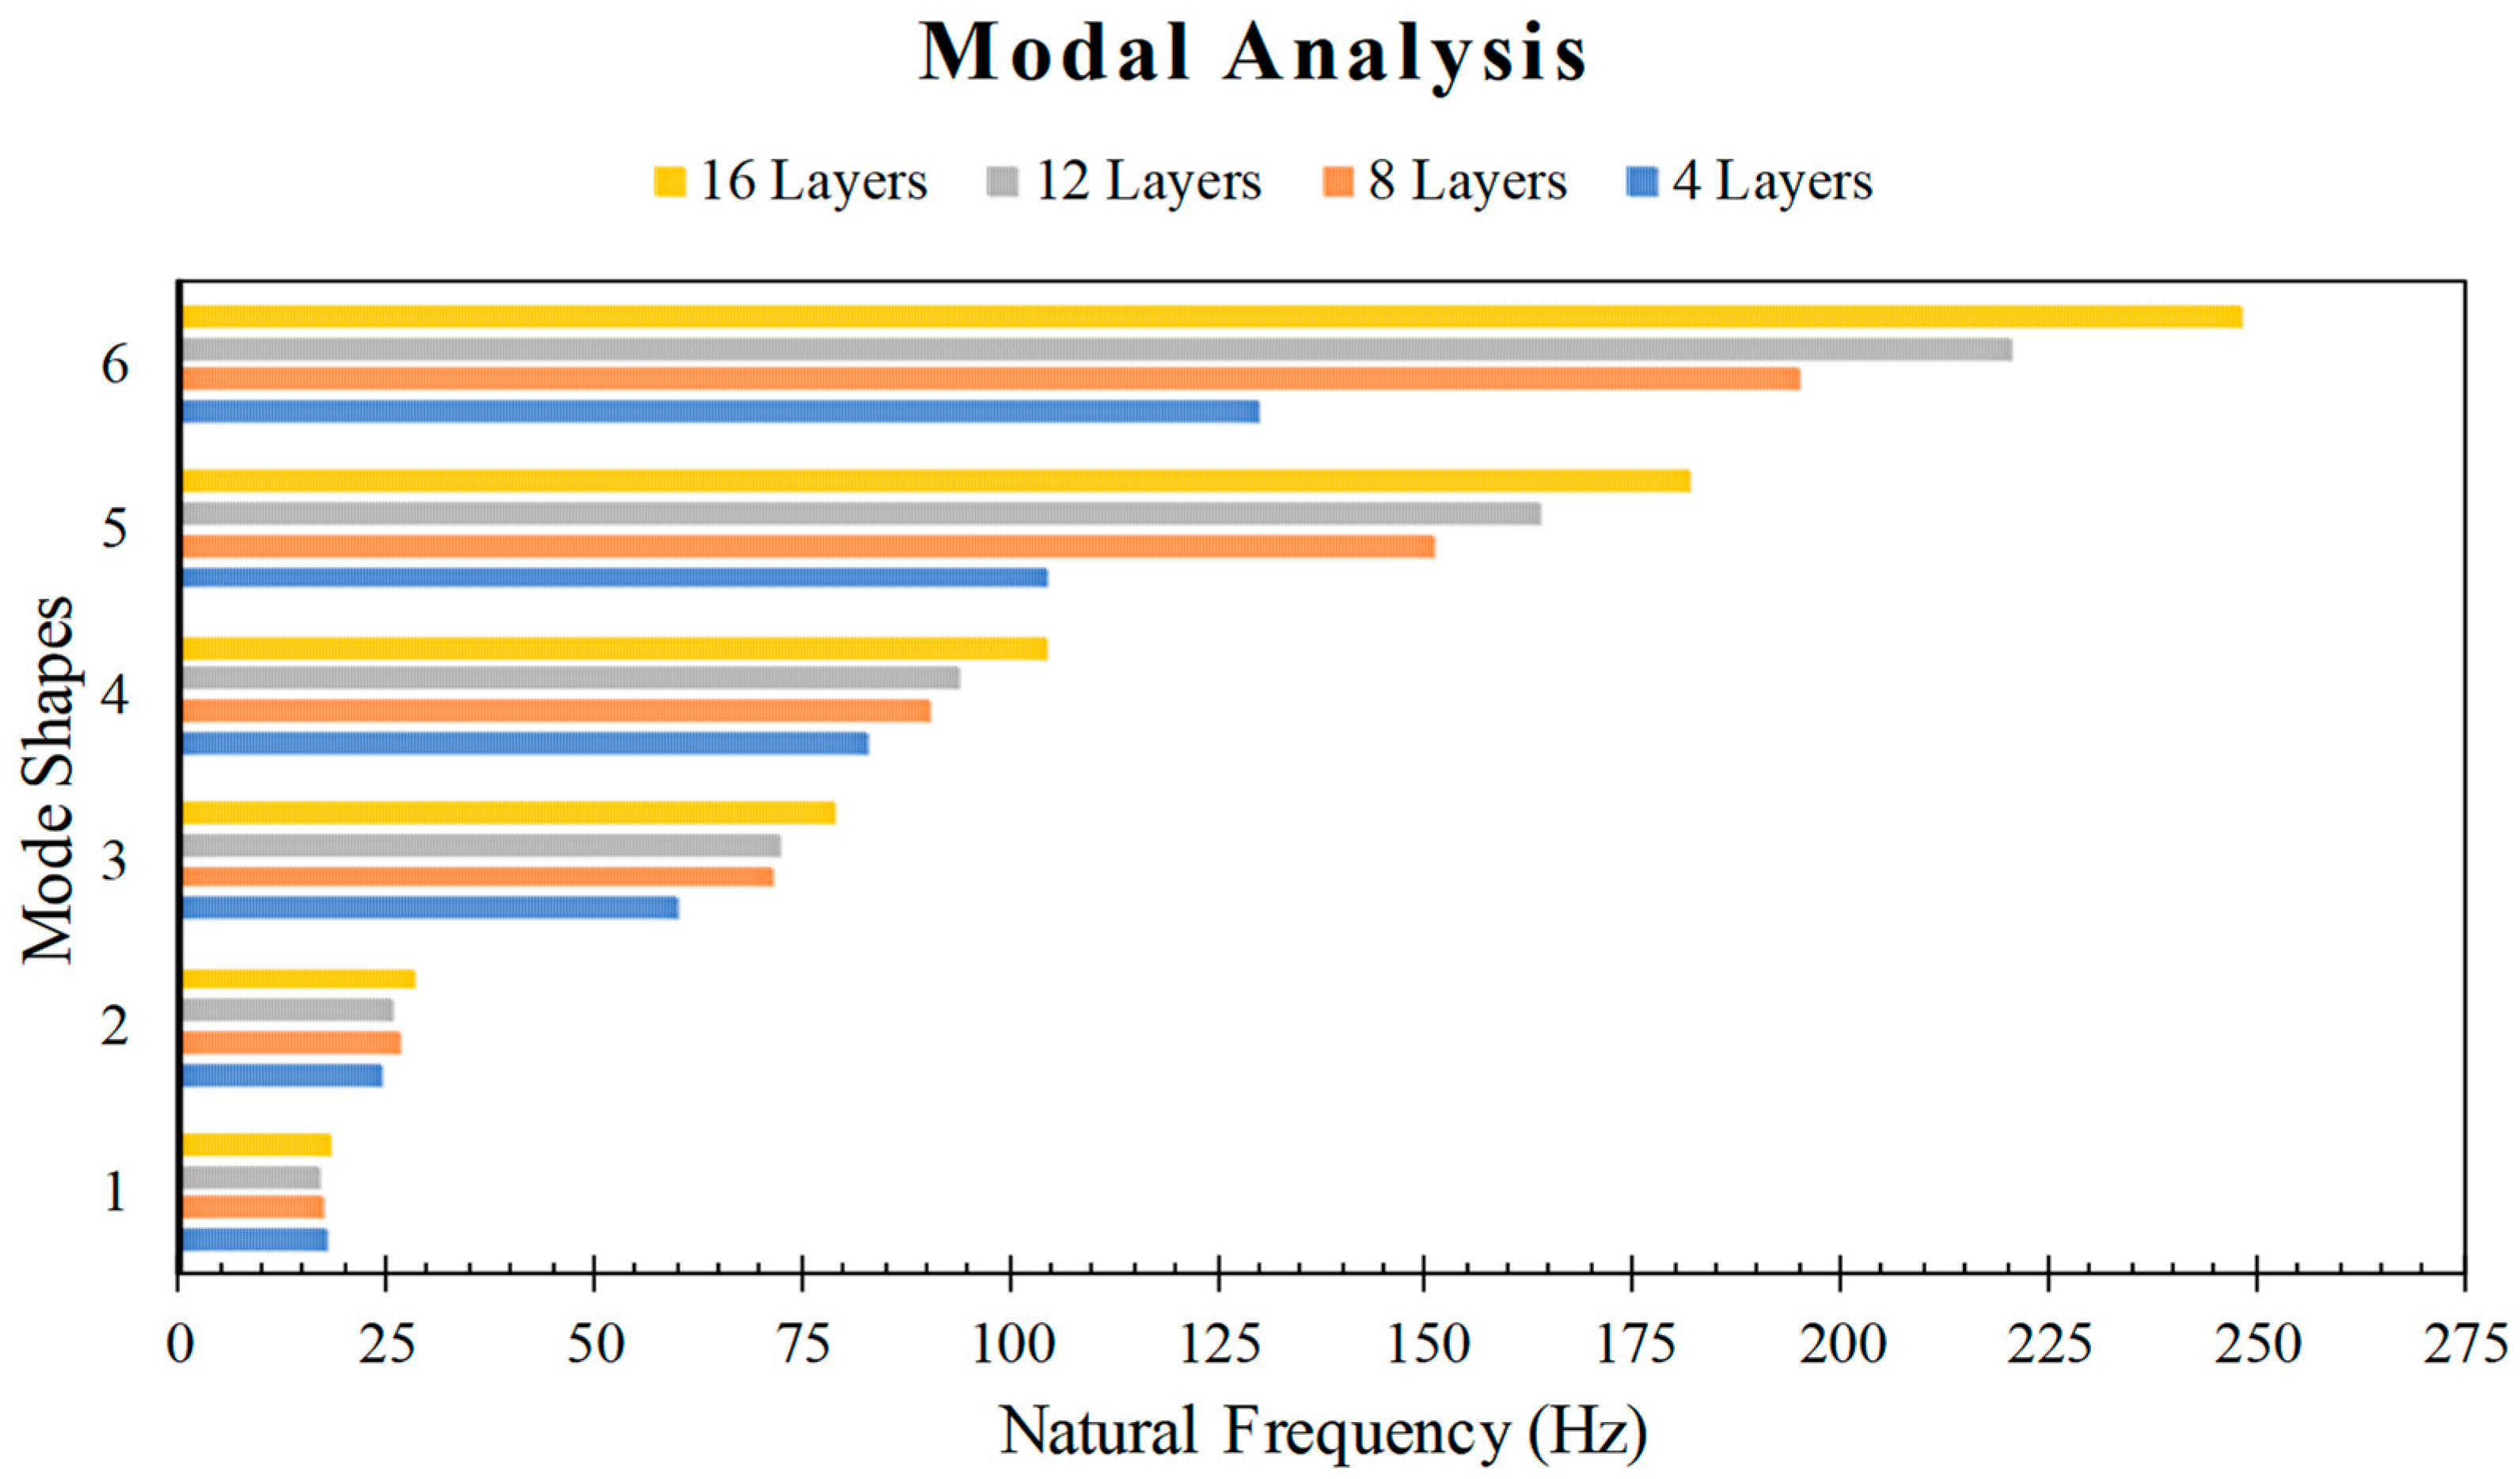
As shown in Figure 7, increasing the number of layers generally leads to a significant increase in the natural frequencies. However, the trend is not strictly monotonic across all six modes. According to Table 5, Modes 1 and 2 exhibit slight non-monotonic variations (e.g., the drop observed between 8 and 12 layers). This non-monotonic behavior is attributed to the mode-dependent competition between the increase in structural stiffness and the added mass, which is more noticeable in the lower-order modes. The most pronounced growth is observed in the higher-order modes (Modes 5 and 6), where the overall stiffness enhancement significantly outweighs the mass addition, resulting in a substantial frequency increase.
Figure 7.
First six natural frequencies for composite blade configurations with 4, 8, 12, and 16 layers, illustrating the increase in modal frequencies with higher layer counts.
Table 5.
Natural frequencies (Hz) of the first six mode shapes for the composite blades with 4, 8, 12, and 16 layers obtained from modal analysis.
The 16-layer configuration consistently results in the highest natural frequencies, indicating the greatest resistance to dynamic deformation, whereas the 4-layer configuration results in the lowest values, reflecting its reduced stiffness.
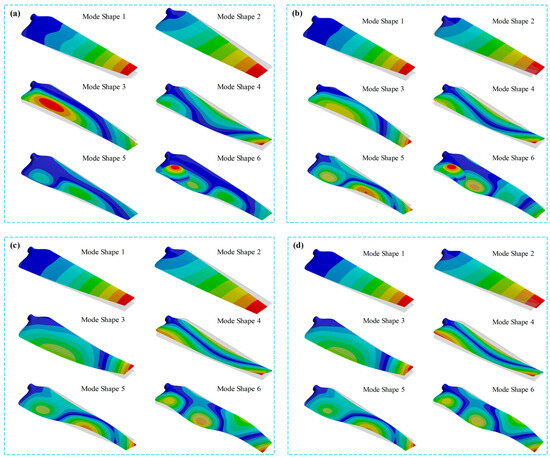
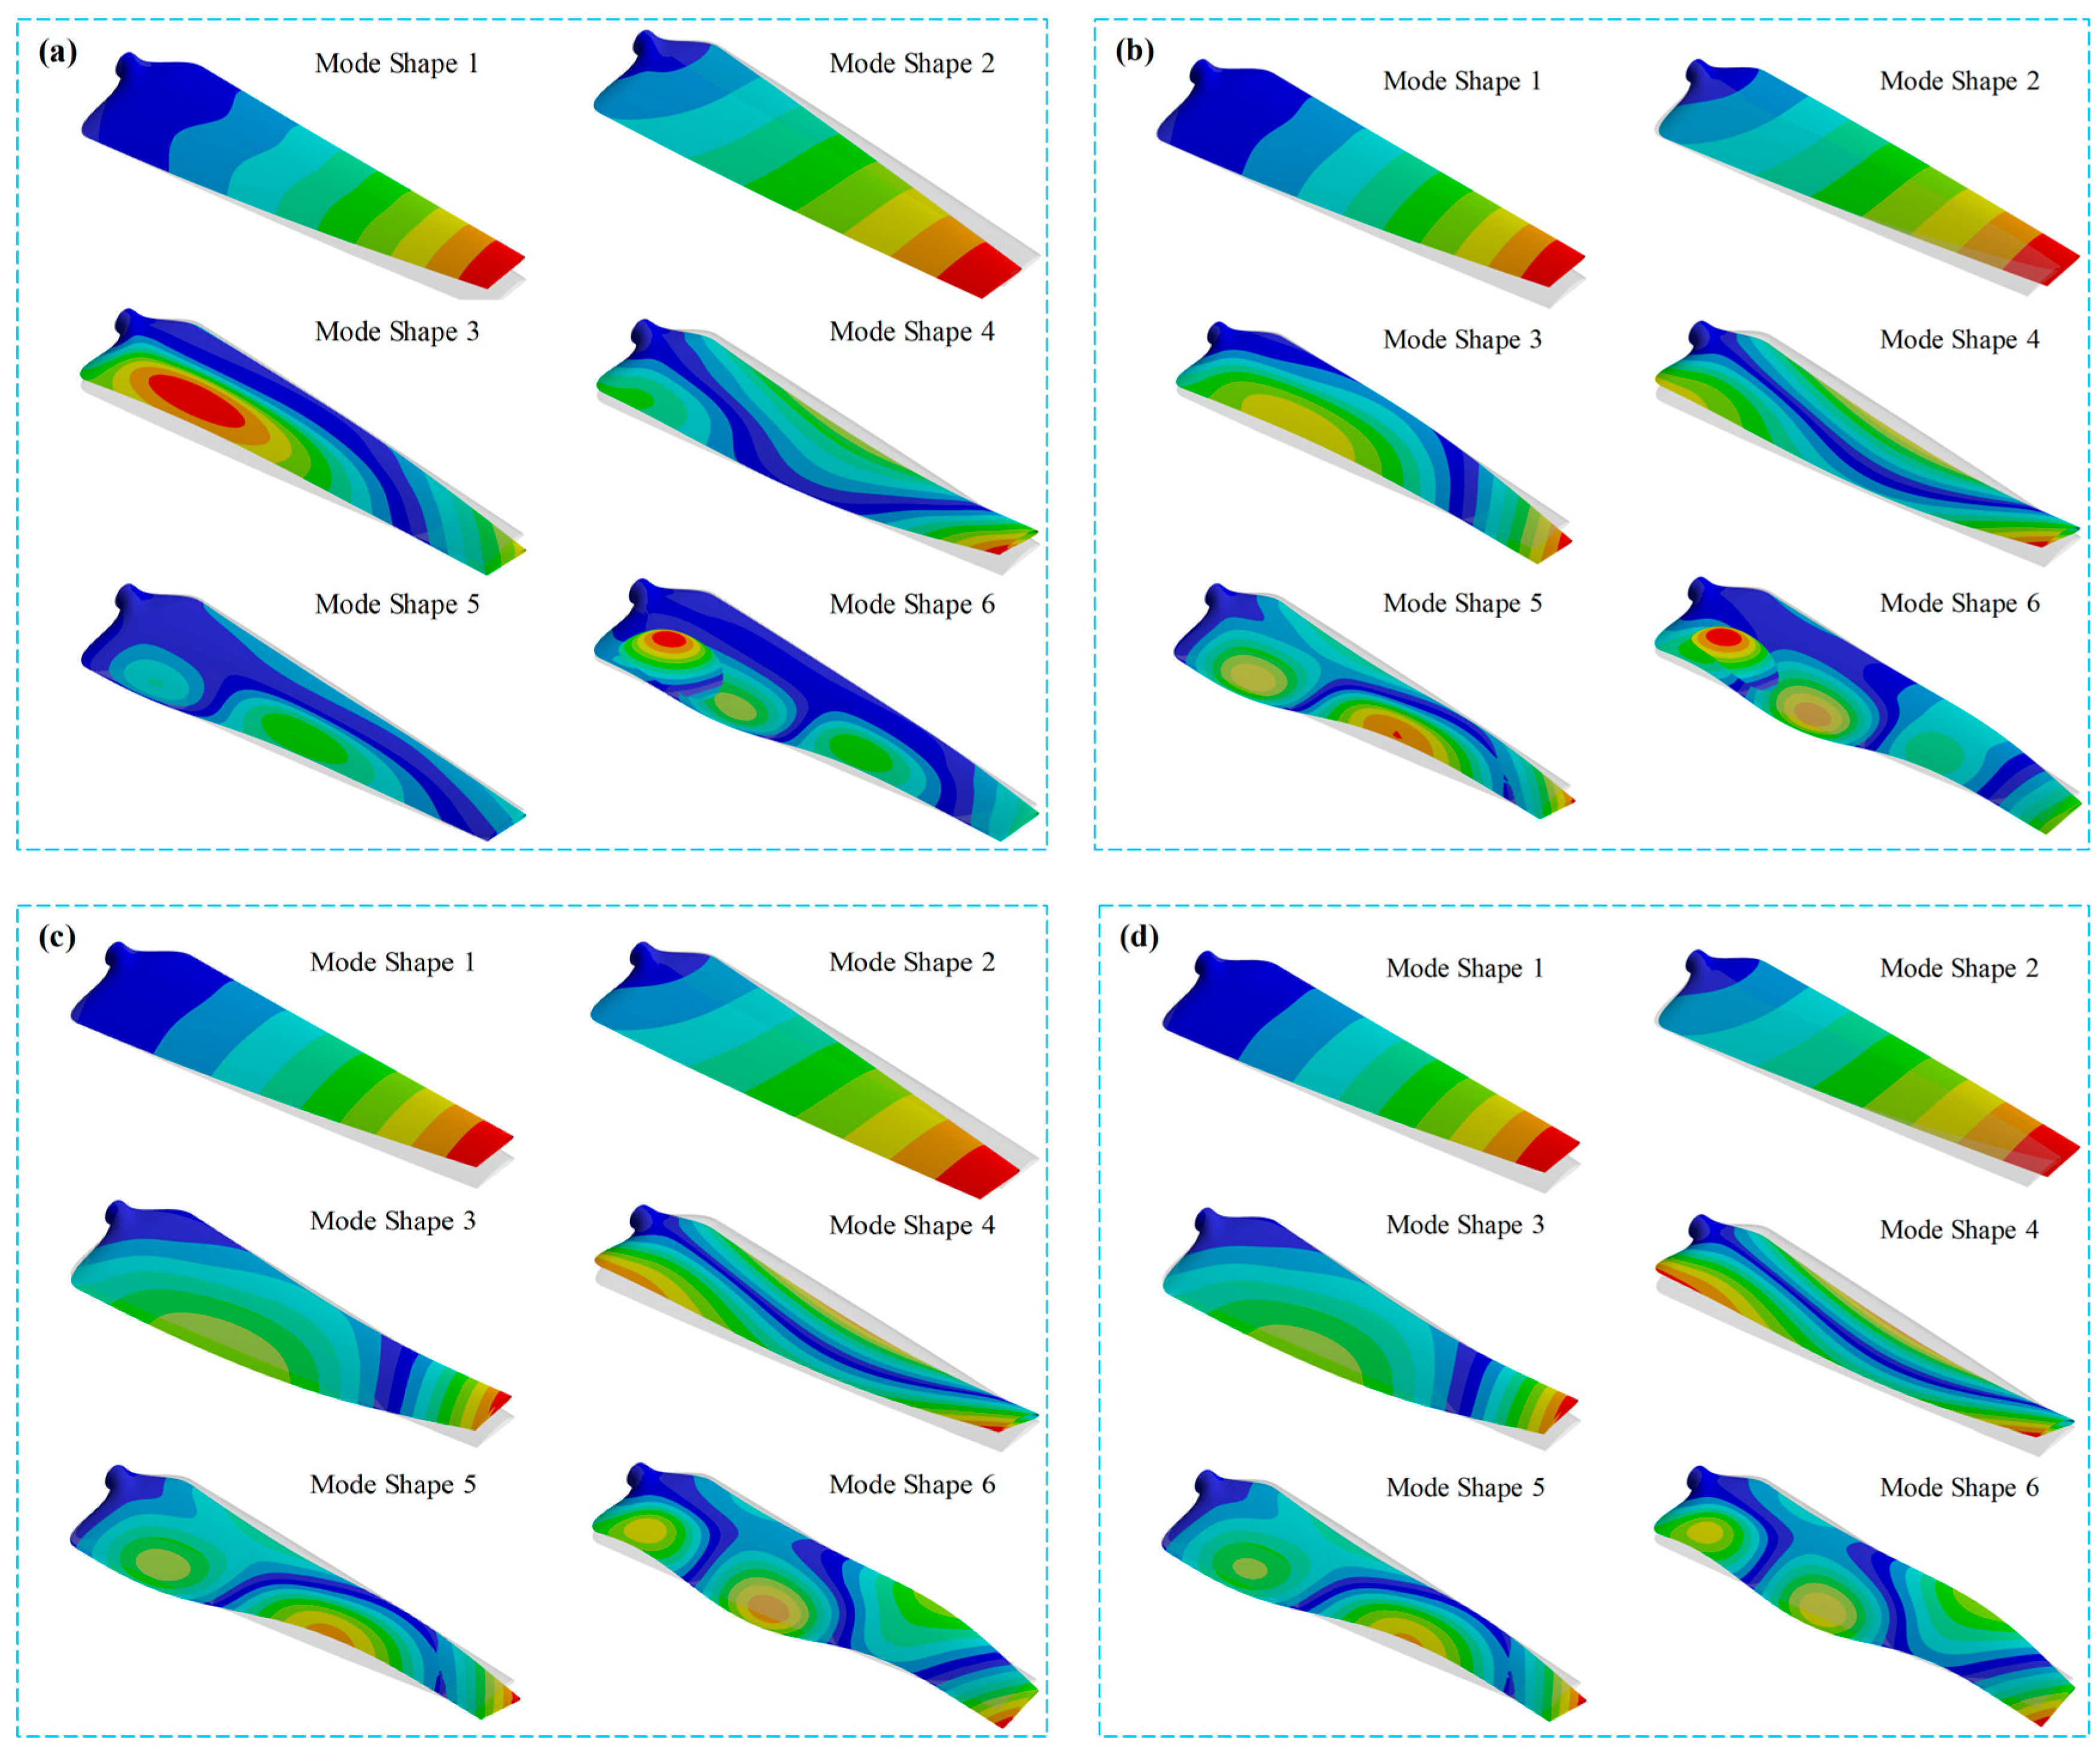
The mode shapes corresponding to the first six natural frequencies for the composite blades with different layer counts are presented in Figure 8. Figure 8a, Figure 8b, Figure 8c, and Figure 8d illustrate the deformation patterns for the 4-, 8-, 12-, and 16-layer configurations, respectively. Each set contains six mode shapes, ranging from the fundamental bending mode to higher-order bending and torsional modes. The color contours represent the relative displacement magnitude, with blue indicating minimal displacement and red indicating maximum displacement.
Figure 8.
First six mode shapes of the composite blade for (a) 4 layers, (b) 8 layers, (c) 12 layers, and (d) 16 layers, illustrating deformation patterns from the fundamental bending mode to high-er-order bending and torsional modes.
The increase in natural frequencies with increasing layer count is primarily associated with the enhanced stiffness of the composite blade. Although a higher natural frequency does not directly indicate higher material strength, it reflects improved structural stiffness and dynamic resistance. The increased stiffness reduces the blade deformation under dynamic loading and shifts the resonance conditions toward higher excitation frequencies, thereby reducing the susceptibility to excessive vibration when the operating frequency is sufficiently separated from the natural frequencies. Therefore, the higher natural frequencies observed in the thicker laminate configurations indicate improved dynamic structural performance and resistance to resonance-induced deformation. The structural strength and failure resistance, however, are further evaluated through the stress and FI results presented in the subsequent sections.
3.4. Harmonic Response Results
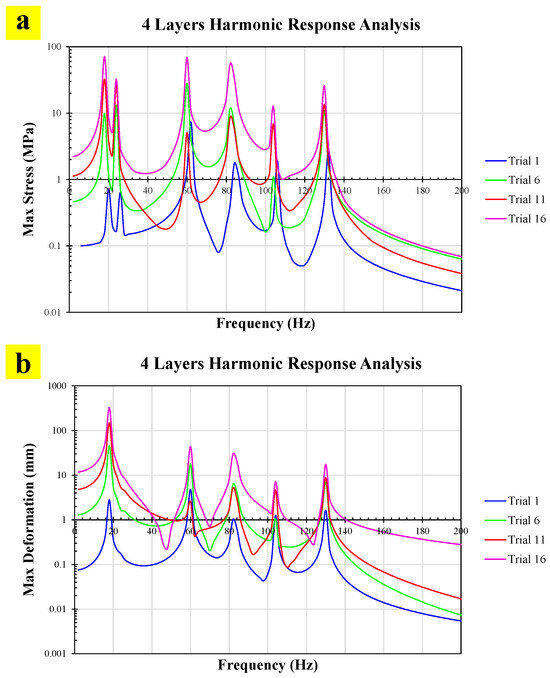
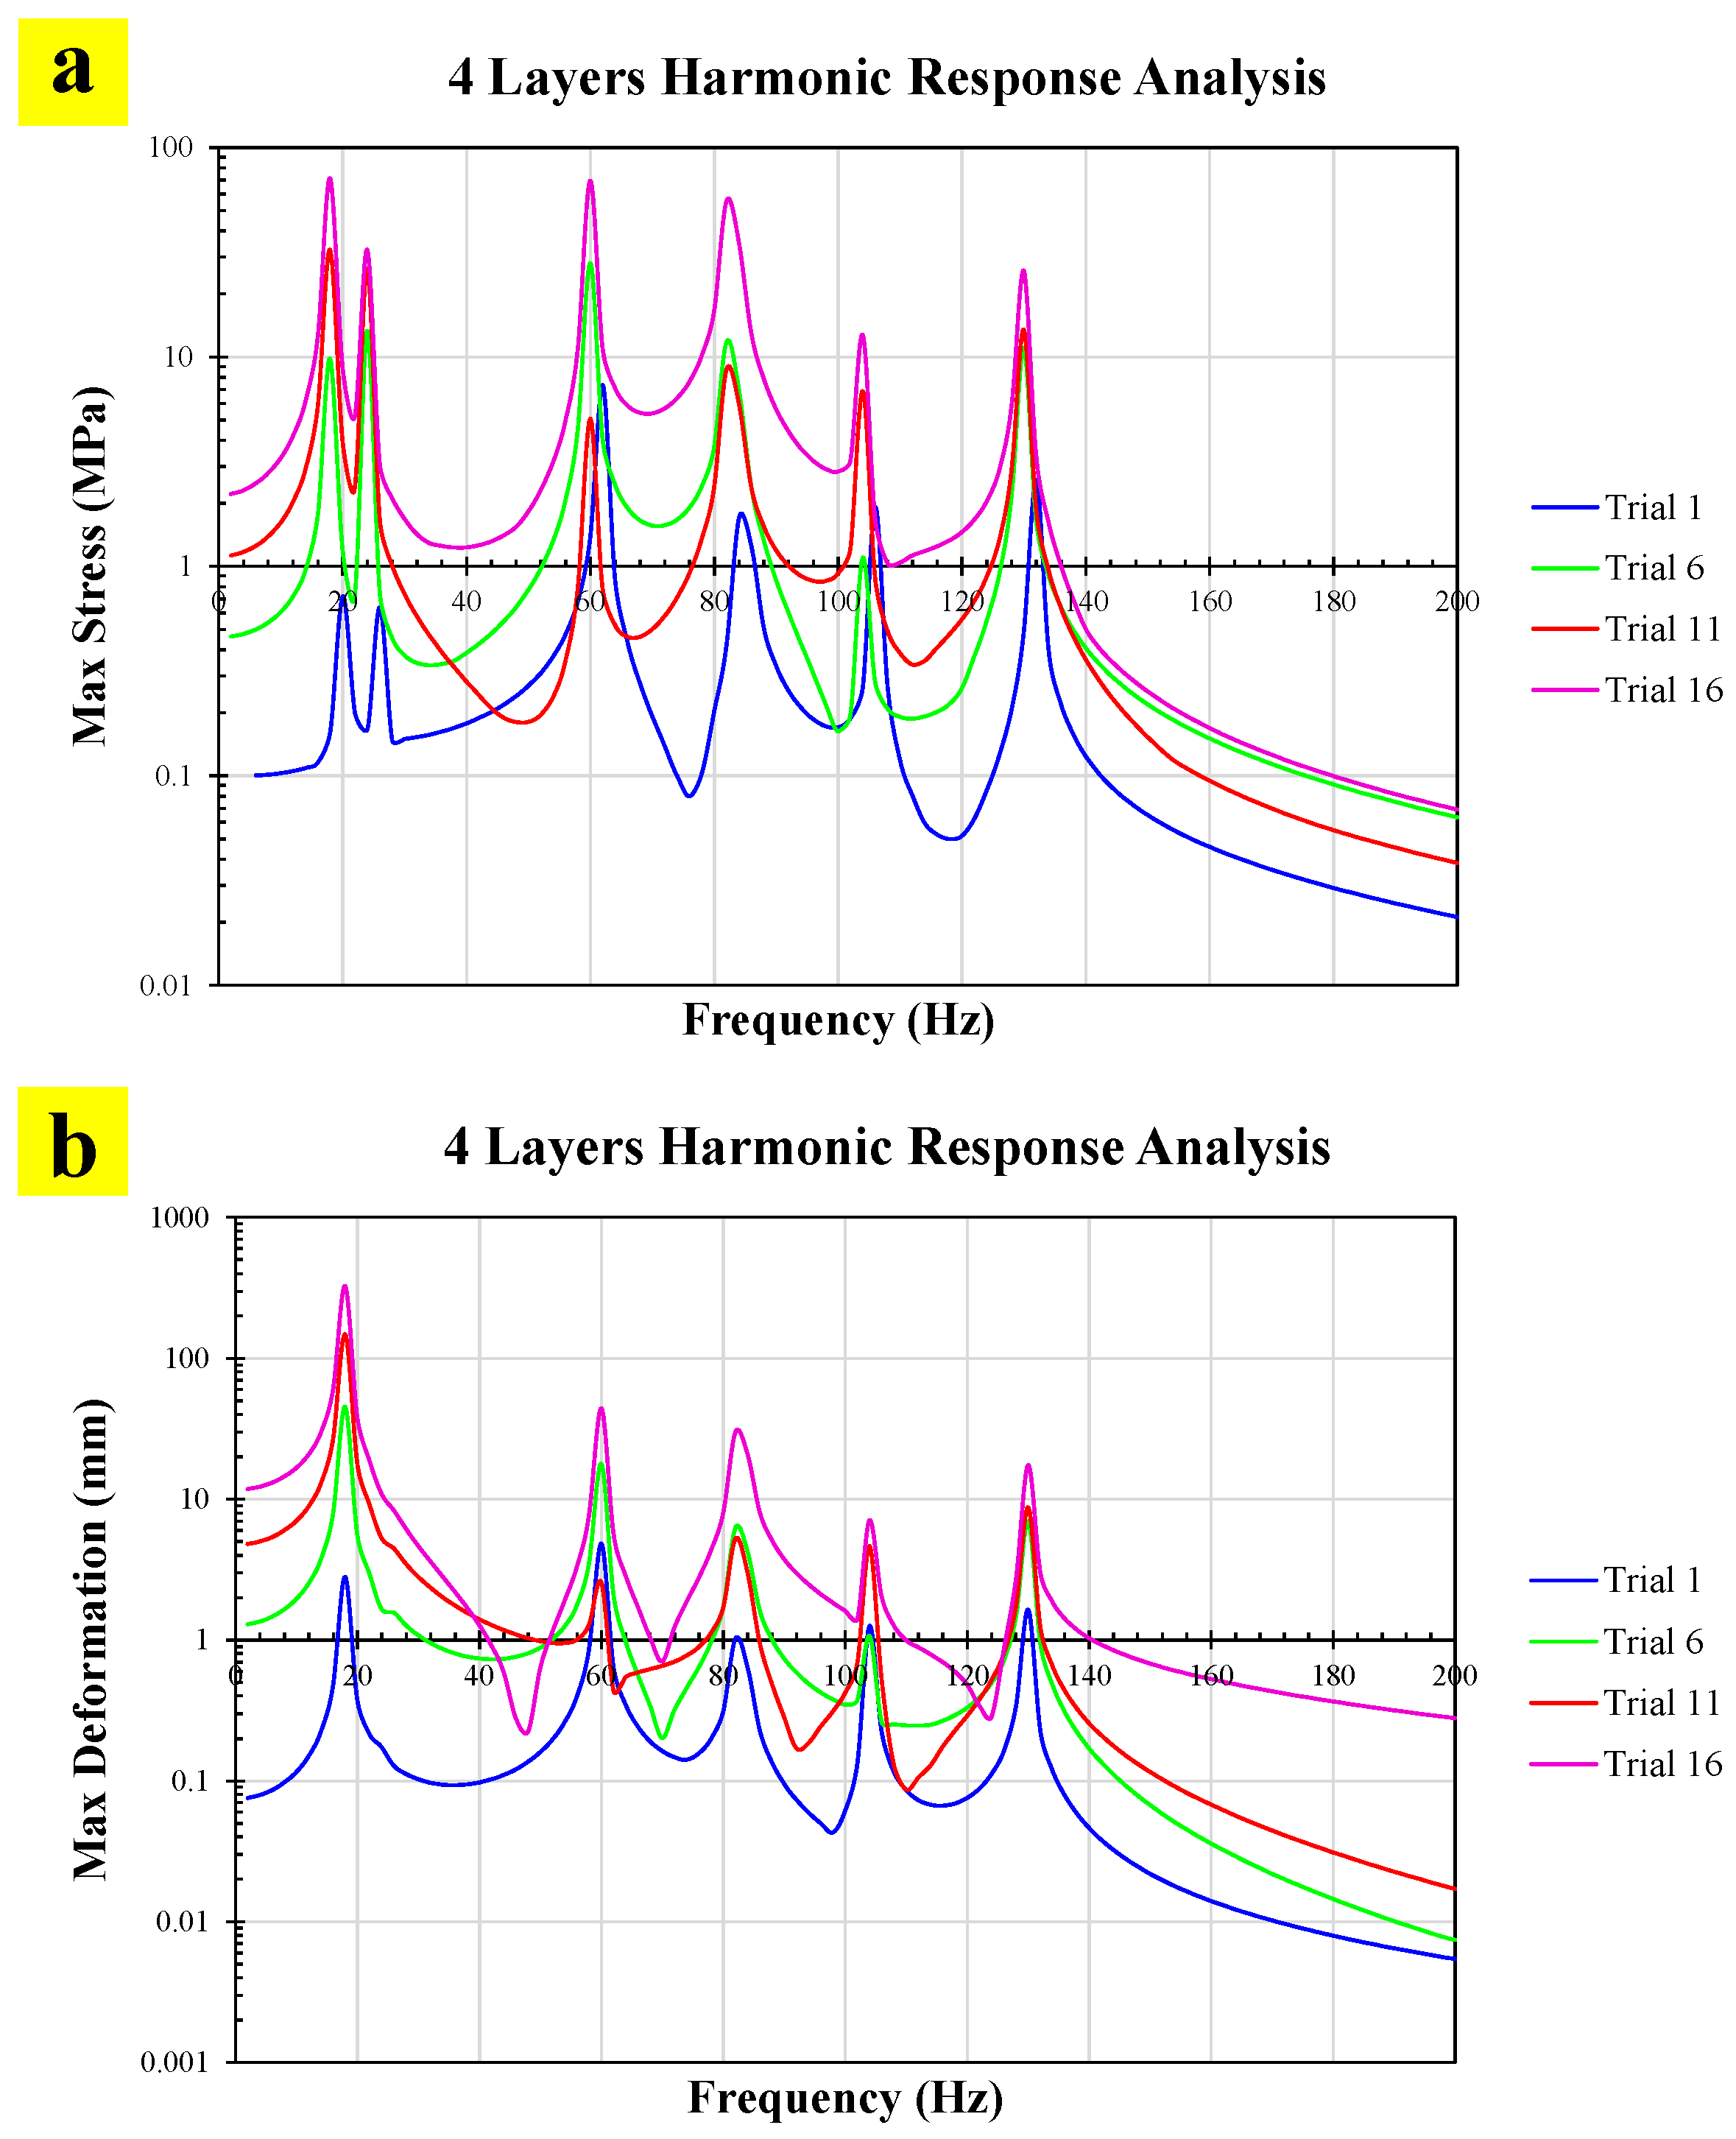
In this section, the results are presented in terms of Max Stress, Max Displacement, and corresponding excitation frequencies at which these peaks occur. These parameters are compared across different layer configurations to assess the influence of the laminate thickness on the blade’s dynamic performance and to identify configurations that minimize resonance-induced amplification. The harmonic response results for the 4-layer composite blade are presented in Figure 9. On the basis of the modal analysis, which identified natural frequencies in the range of approximately 17 Hz–130 Hz, harmonic analysis was performed over 0 Hz–200 Hz to ensure that all potential resonance peaks were captured. Figure 9a shows the variation in Max Stress with frequency, whereas Figure 9b presents the corresponding Max Displacement.
Figure 9.
Harmonic response of the 4-layer composite blade: (a) Max Stress vs. frequency and (b) Max Displacement vs. frequency, for an excitation range of 0–200 Hz.
In Figure 9a, distinct peaks in the maximum stress response are observed near the natural frequencies identified in the modal analysis, confirming the resonance behavior of the structure. The highest stress peak occurs at the first natural frequency, with subsequent modes producing smaller but still notable stress responses. Figure 9b reveals a similar trend for the displacement amplitude, where the largest displacement occurs in the first mode and decreases for higher modes due to increased stiffness and reduced modal participation. The results indicate that the 4-layer configuration, which has the lowest stiffness among the studied cases, experiences relatively high displacement amplitudes and significant stress peaks at resonance. This makes it more prone to vibration-induced fatigue or failure if it operates near its natural frequency.
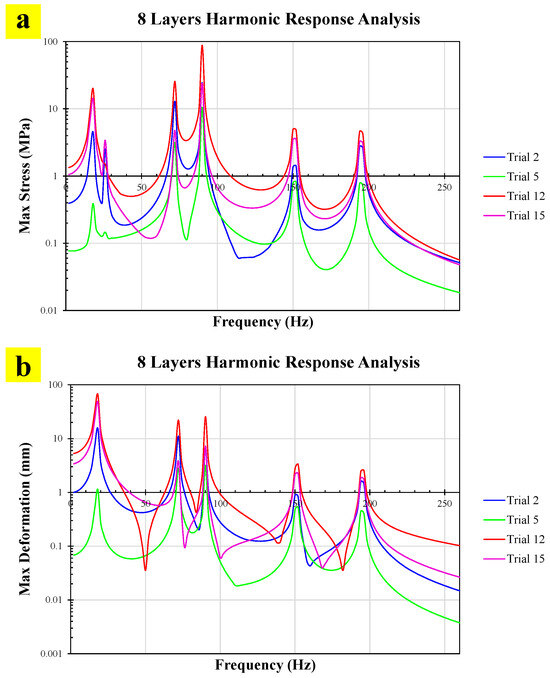
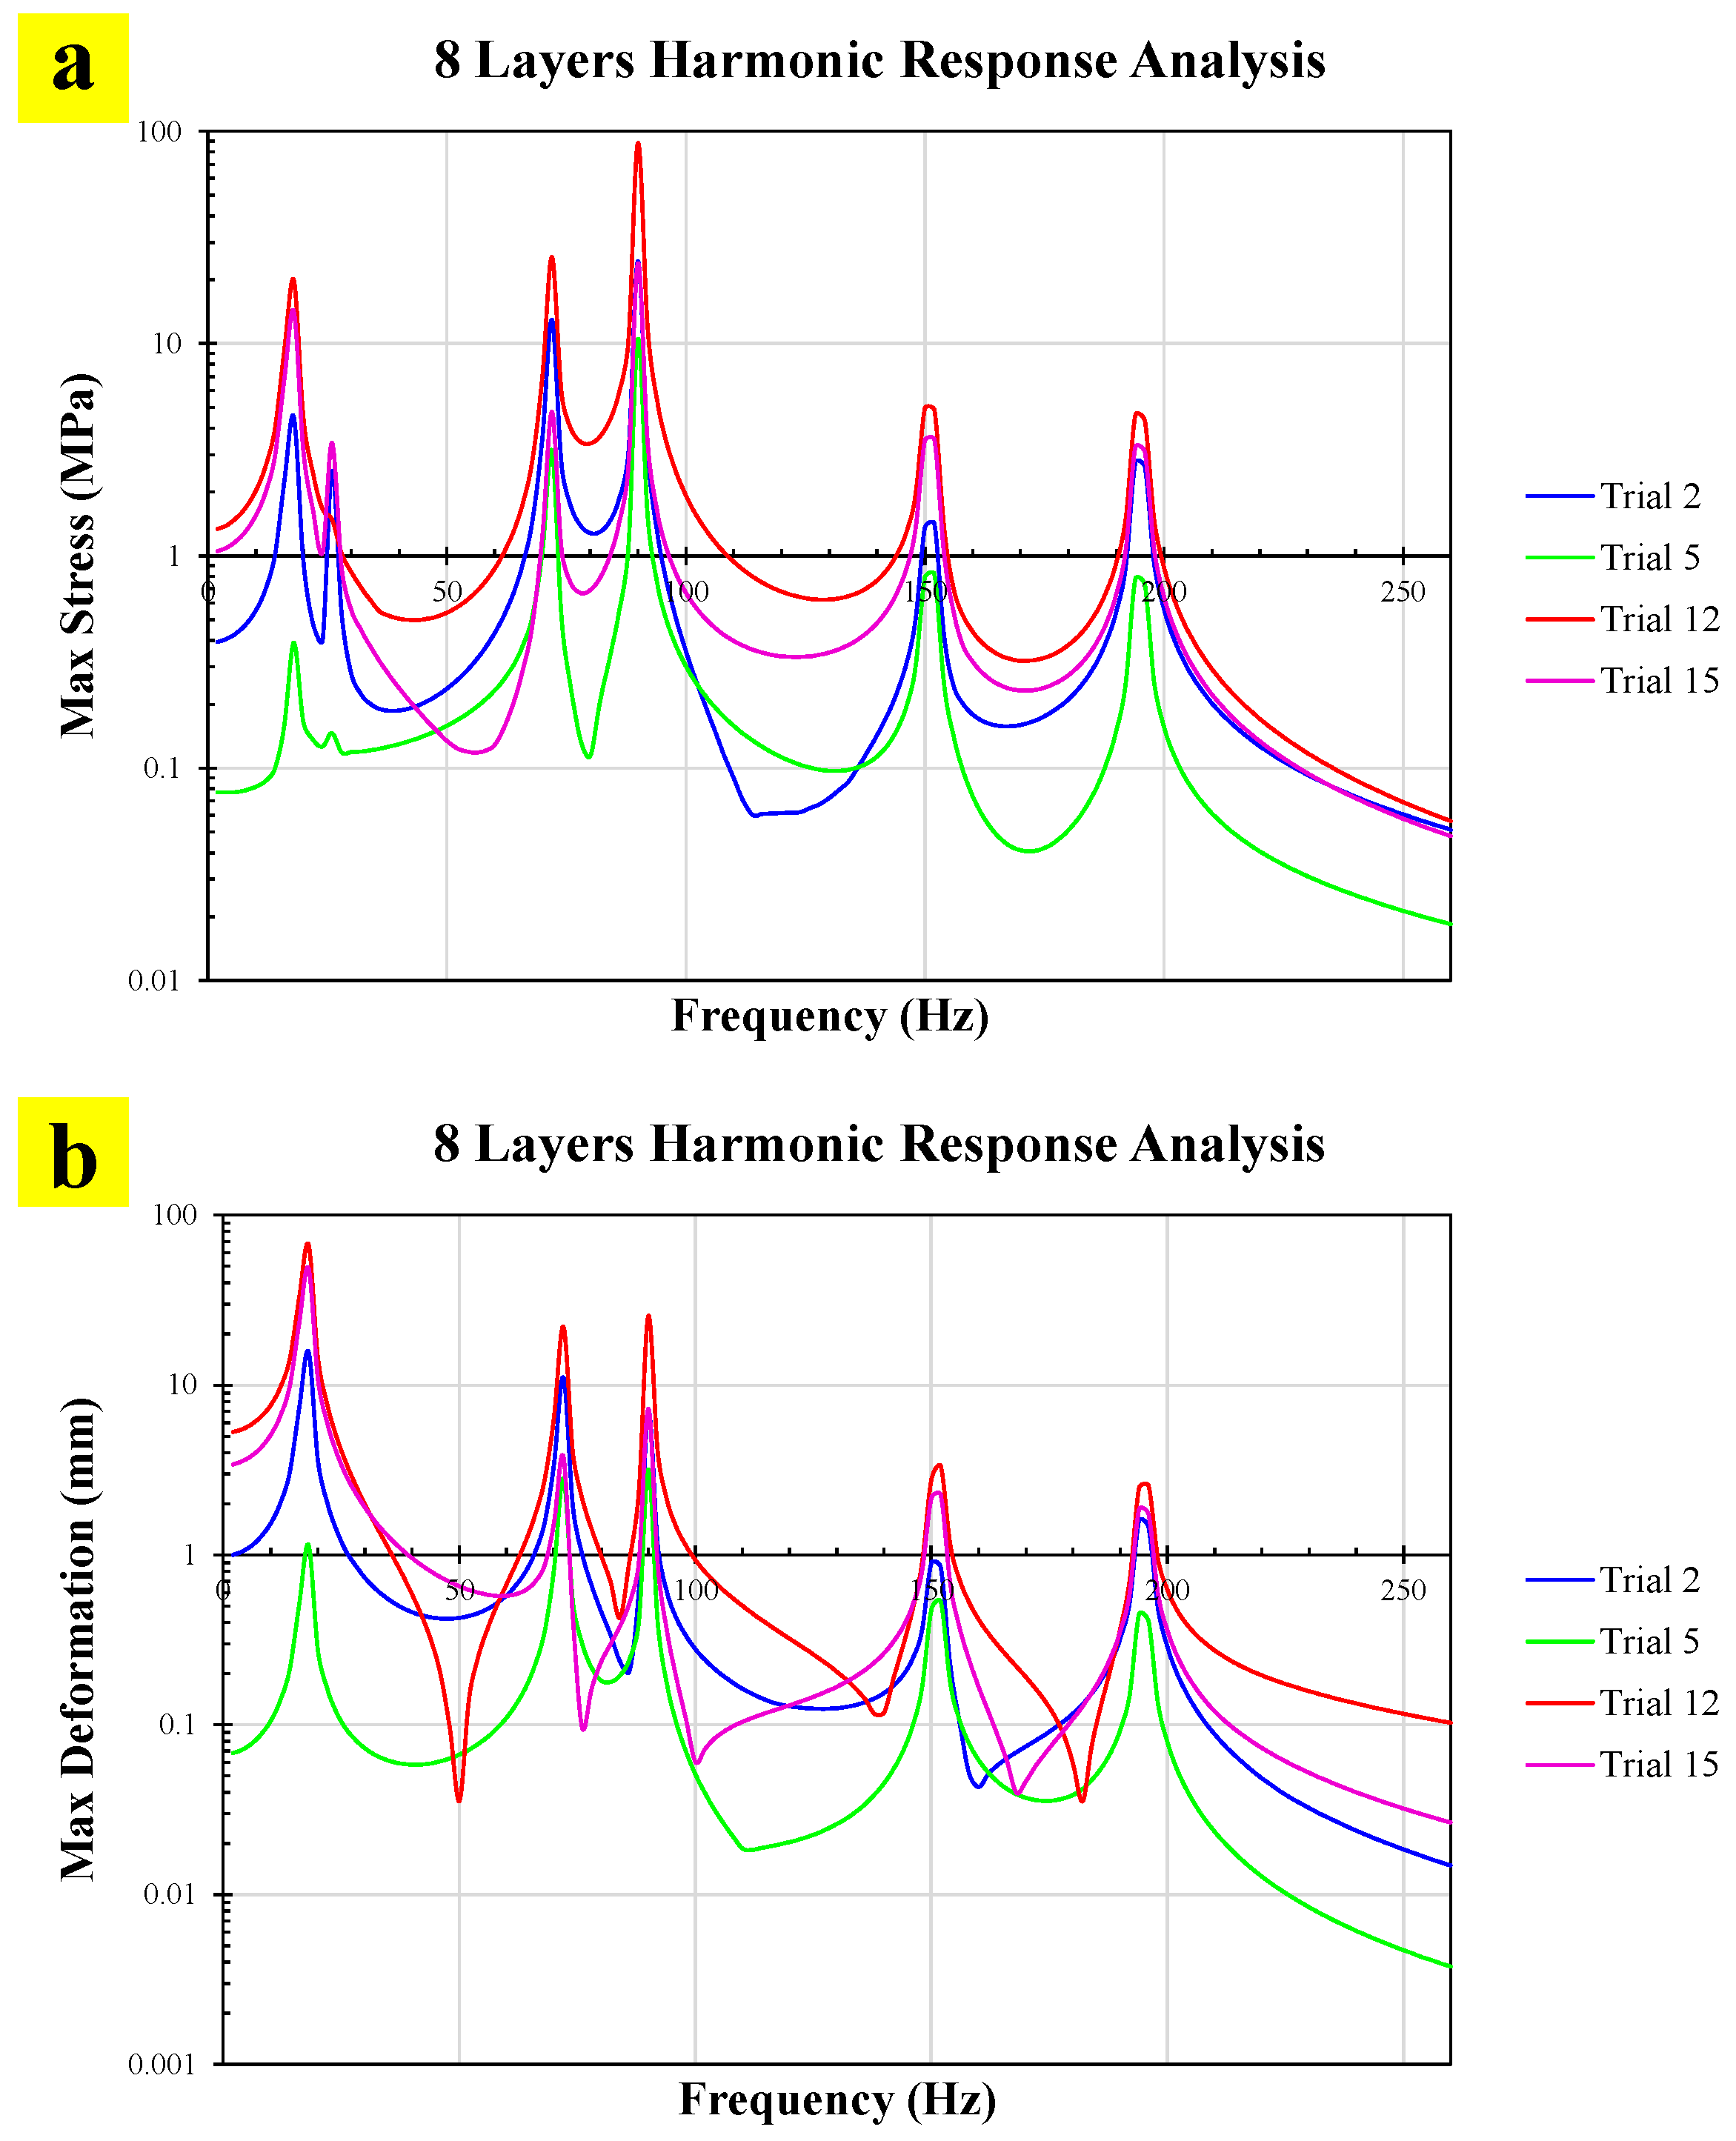
The harmonic response results for the 8-layer composite blade are presented in Figure 10. On the basis of the modal analysis, which identified natural frequencies within the range of approximately 17 Hz–195 Hz, harmonic analysis was performed over a frequency range of 0 Hz–250 Hz to capture all possible resonance peaks. Figure 10a shows the variation in Max Stress with frequency, whereas Figure 10b presents the corresponding Max Displacement.
Figure 10.
Harmonic response of the 8-layer composite blade: (a) Max Stress vs. frequency and (b) Max Displacement vs. frequency, for an excitation range of 0–250 Hz.
In Figure 10a, the Max Stress response for the 8-layer composite blade shows that Trial 12 results in the highest stress amplitude among all the tested cases. The most prominent stress peak occurs at the fourth mode shape, corresponding to the natural frequency of 90.247 Hz, indicating that this mode is the most critical for stress concentration in this configuration. In contrast, Figure 10b reveals that the Max Displacement does not occur in the same mode. Instead, the largest displacement is observed at the first mode shape, corresponding to the natural frequency of 17.387 Hz. This behavior reflects the fact that lower-order bending modes typically produce larger global deflections. In contrast, higher-order modes (such as the fourth mode) can induce localized deformation patterns that result in higher stress levels without necessarily causing the largest overall displacement. These findings highlight the importance of evaluating both stress and displacement responses in harmonic analysis, as the most critical mode for structural integrity (in terms of stress) may differ from the mode producing the largest deflection. For the 8-layer configuration, operational frequencies near 17.387 Hz and 90.247 Hz should be avoided to minimize the risk of excessive vibration and potential damage.
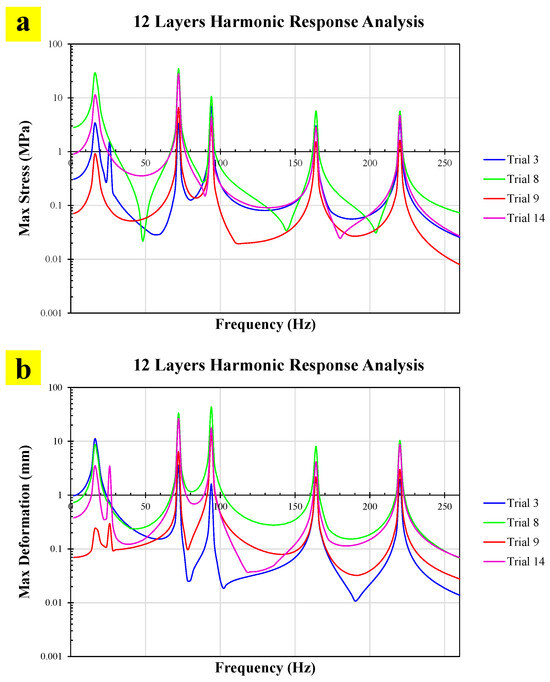
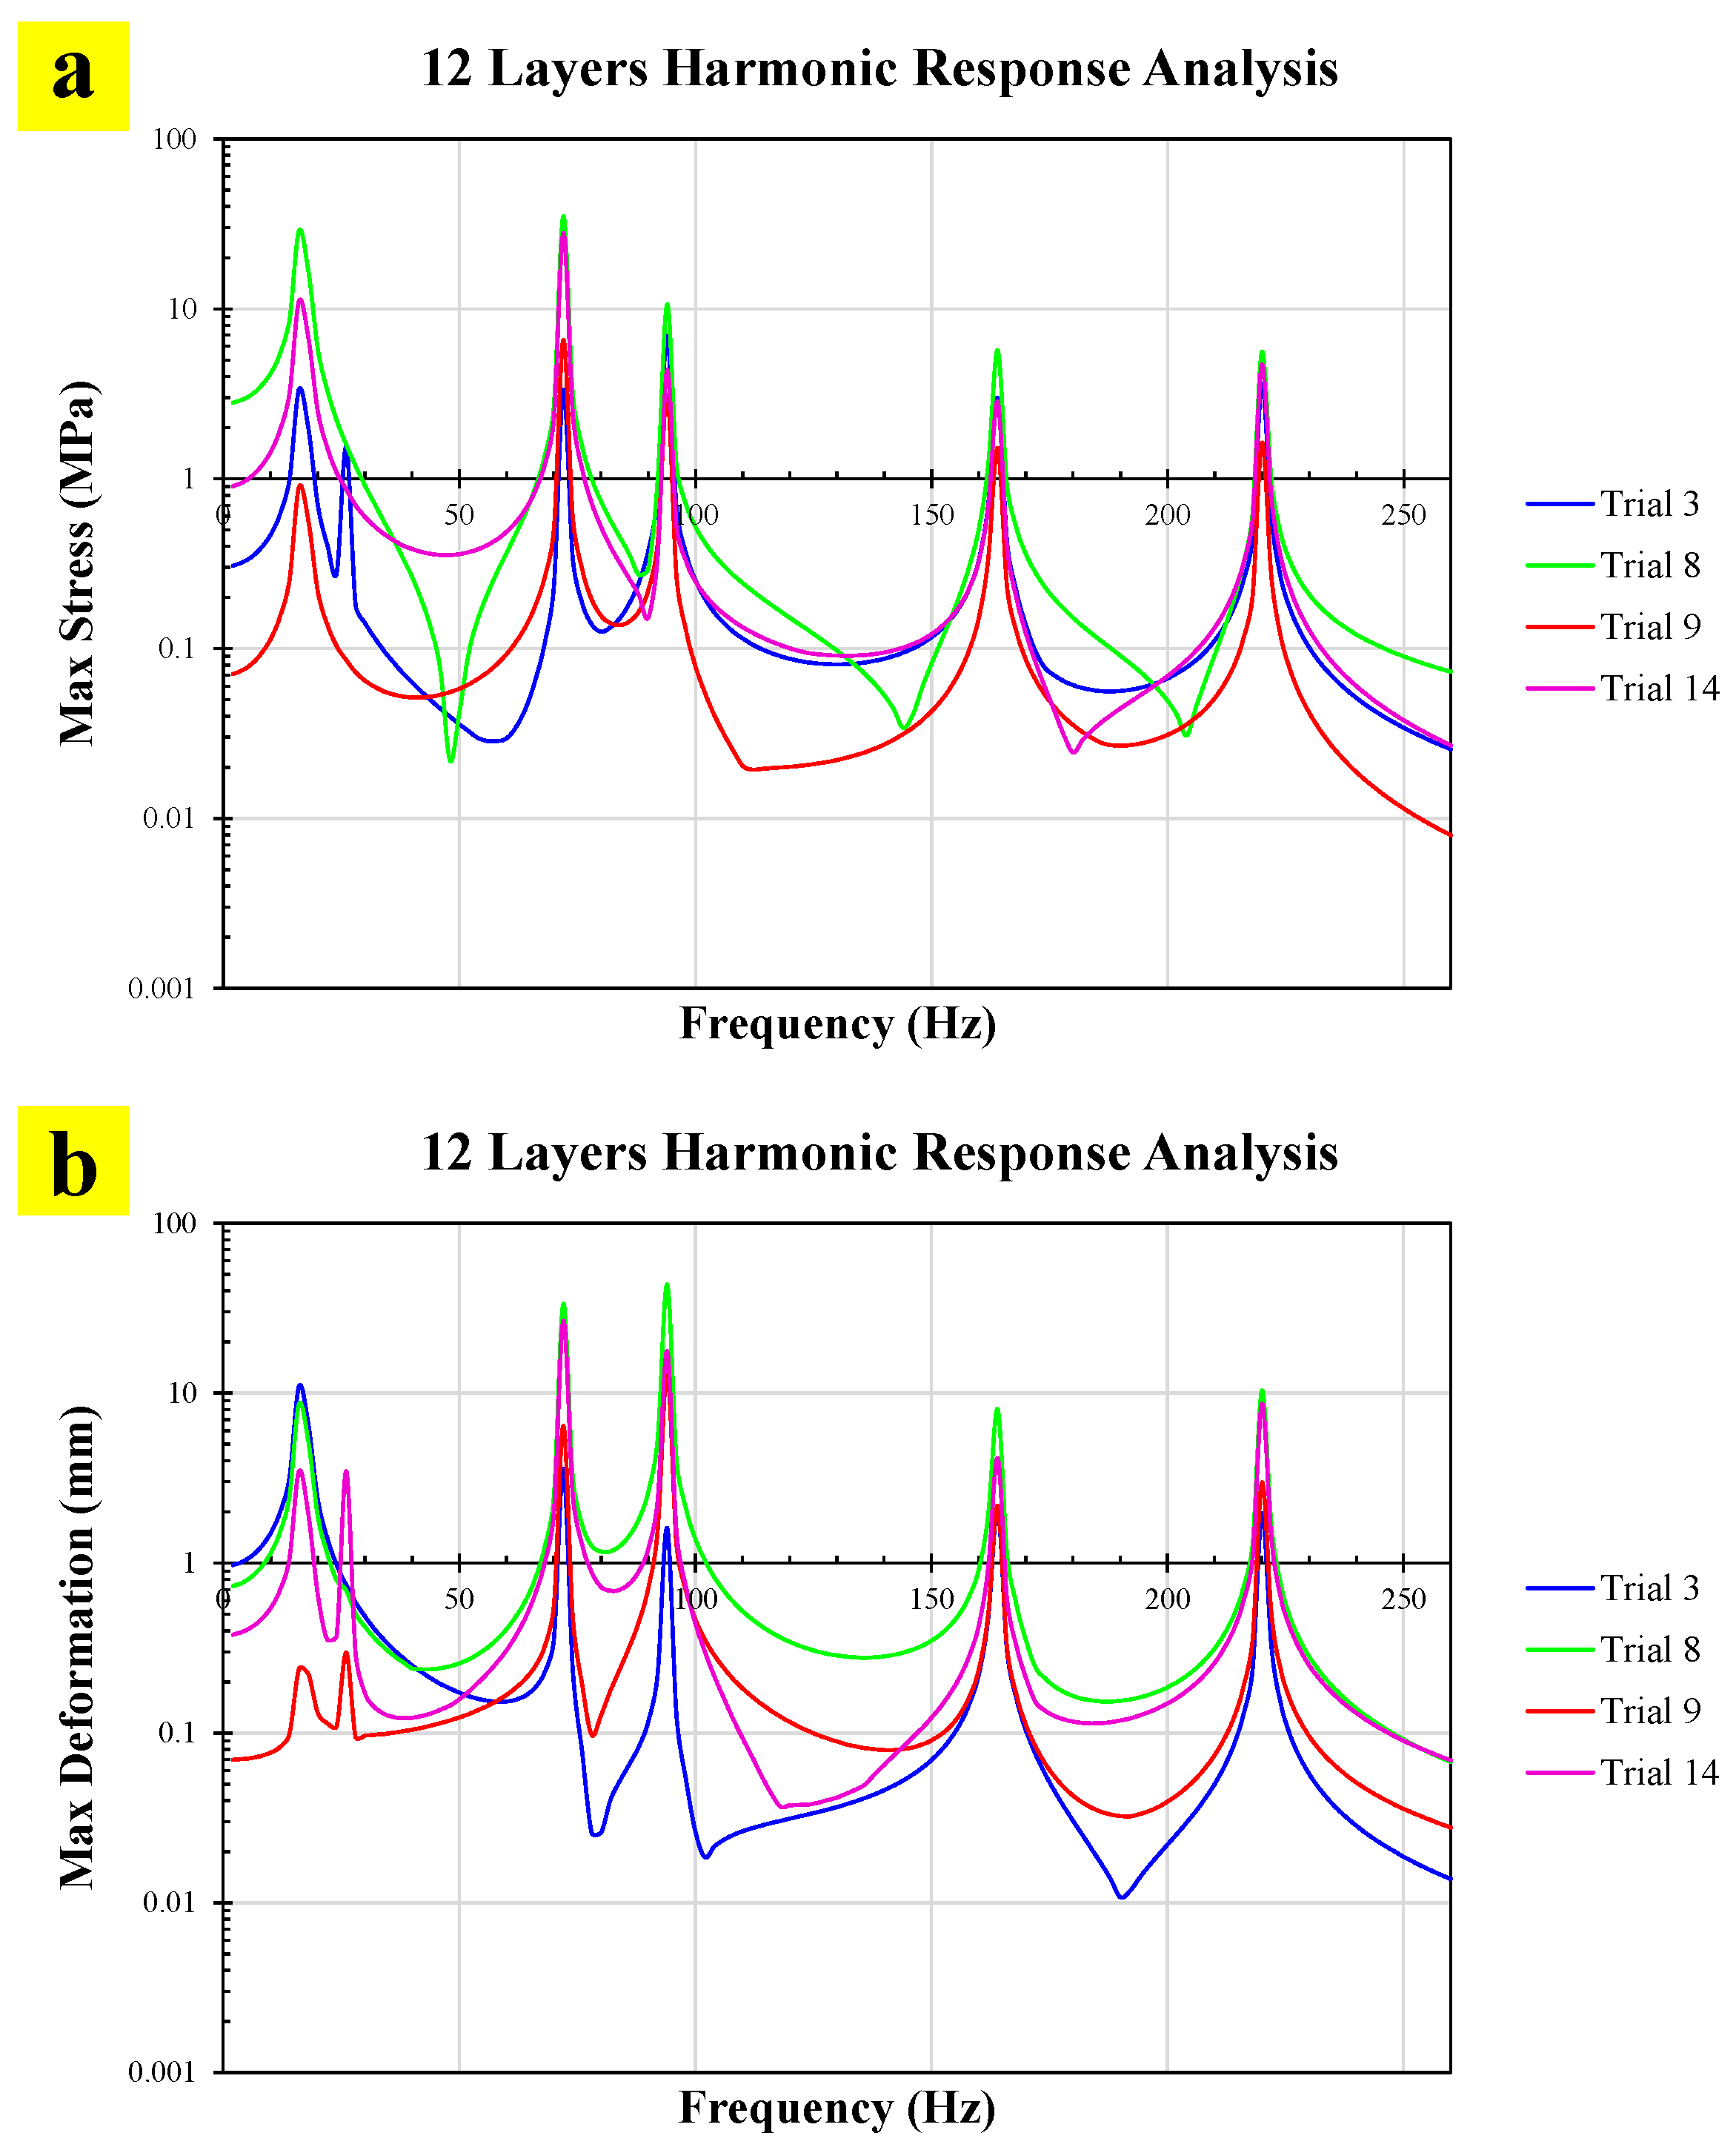
The harmonic response results for the 12-layer composite blade are shown in Figure 11. According to the modal analysis, the natural frequencies for this configuration range from approximately 16 Hz (first mode) to 221 Hz (sixth mode). To ensure that all possible resonance peaks were captured, harmonic analysis was performed over a frequency range of 0 Hz–250 Hz.
Figure 11.
Harmonic response of the 12-layer composite blade: (a) Max Stress vs. frequency and (b) Max Displacement vs. frequency, for an excitation range of 0–250 Hz.
In Figure 11a, which presents the Max Stress versus frequency, Trial 8 consistently results in the highest stress amplitudes among all the tested trials. The most prominent stress peak for Trial 8 occurs at a frequency corresponding to one of the higher mode shapes, indicating a critical resonance condition for stress concentration in this configuration. Figure 11b, which shows the Max Displacement, also identifies Trial 8 as producing the largest displacement response. However, the Max Displacement occurs at the first mode shape (approximately 16 Hz), which is typical for bending-dominated modes that produce large global deflections. Higher-order modes, while generating smaller overall displacements, can still produce significant localized stresses, as shown in Figure 11a. This behavior reinforces the importance of evaluating both stress and displacement in harmonic analysis: the mode that governs the maximum stress is not necessarily the same as the mode that produces the maximum displacement. For the 12-layer configuration, operational frequencies near the first mode (~16 Hz) and the critical higher-order mode identified for stress peaks should be avoided to minimize the risk of resonance-induced damage.
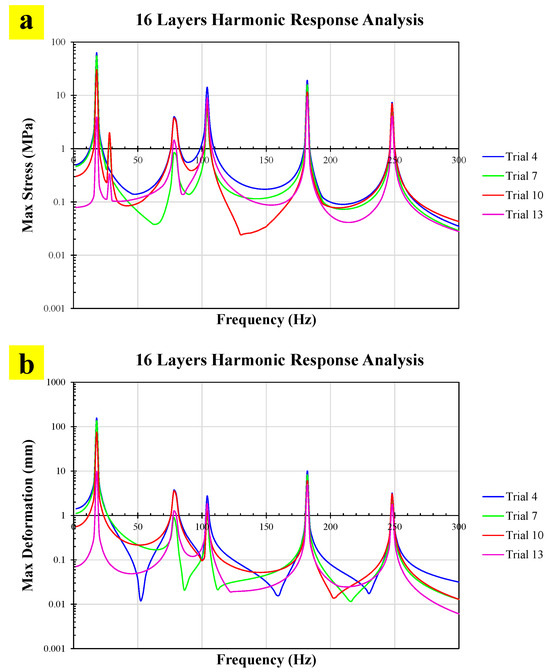
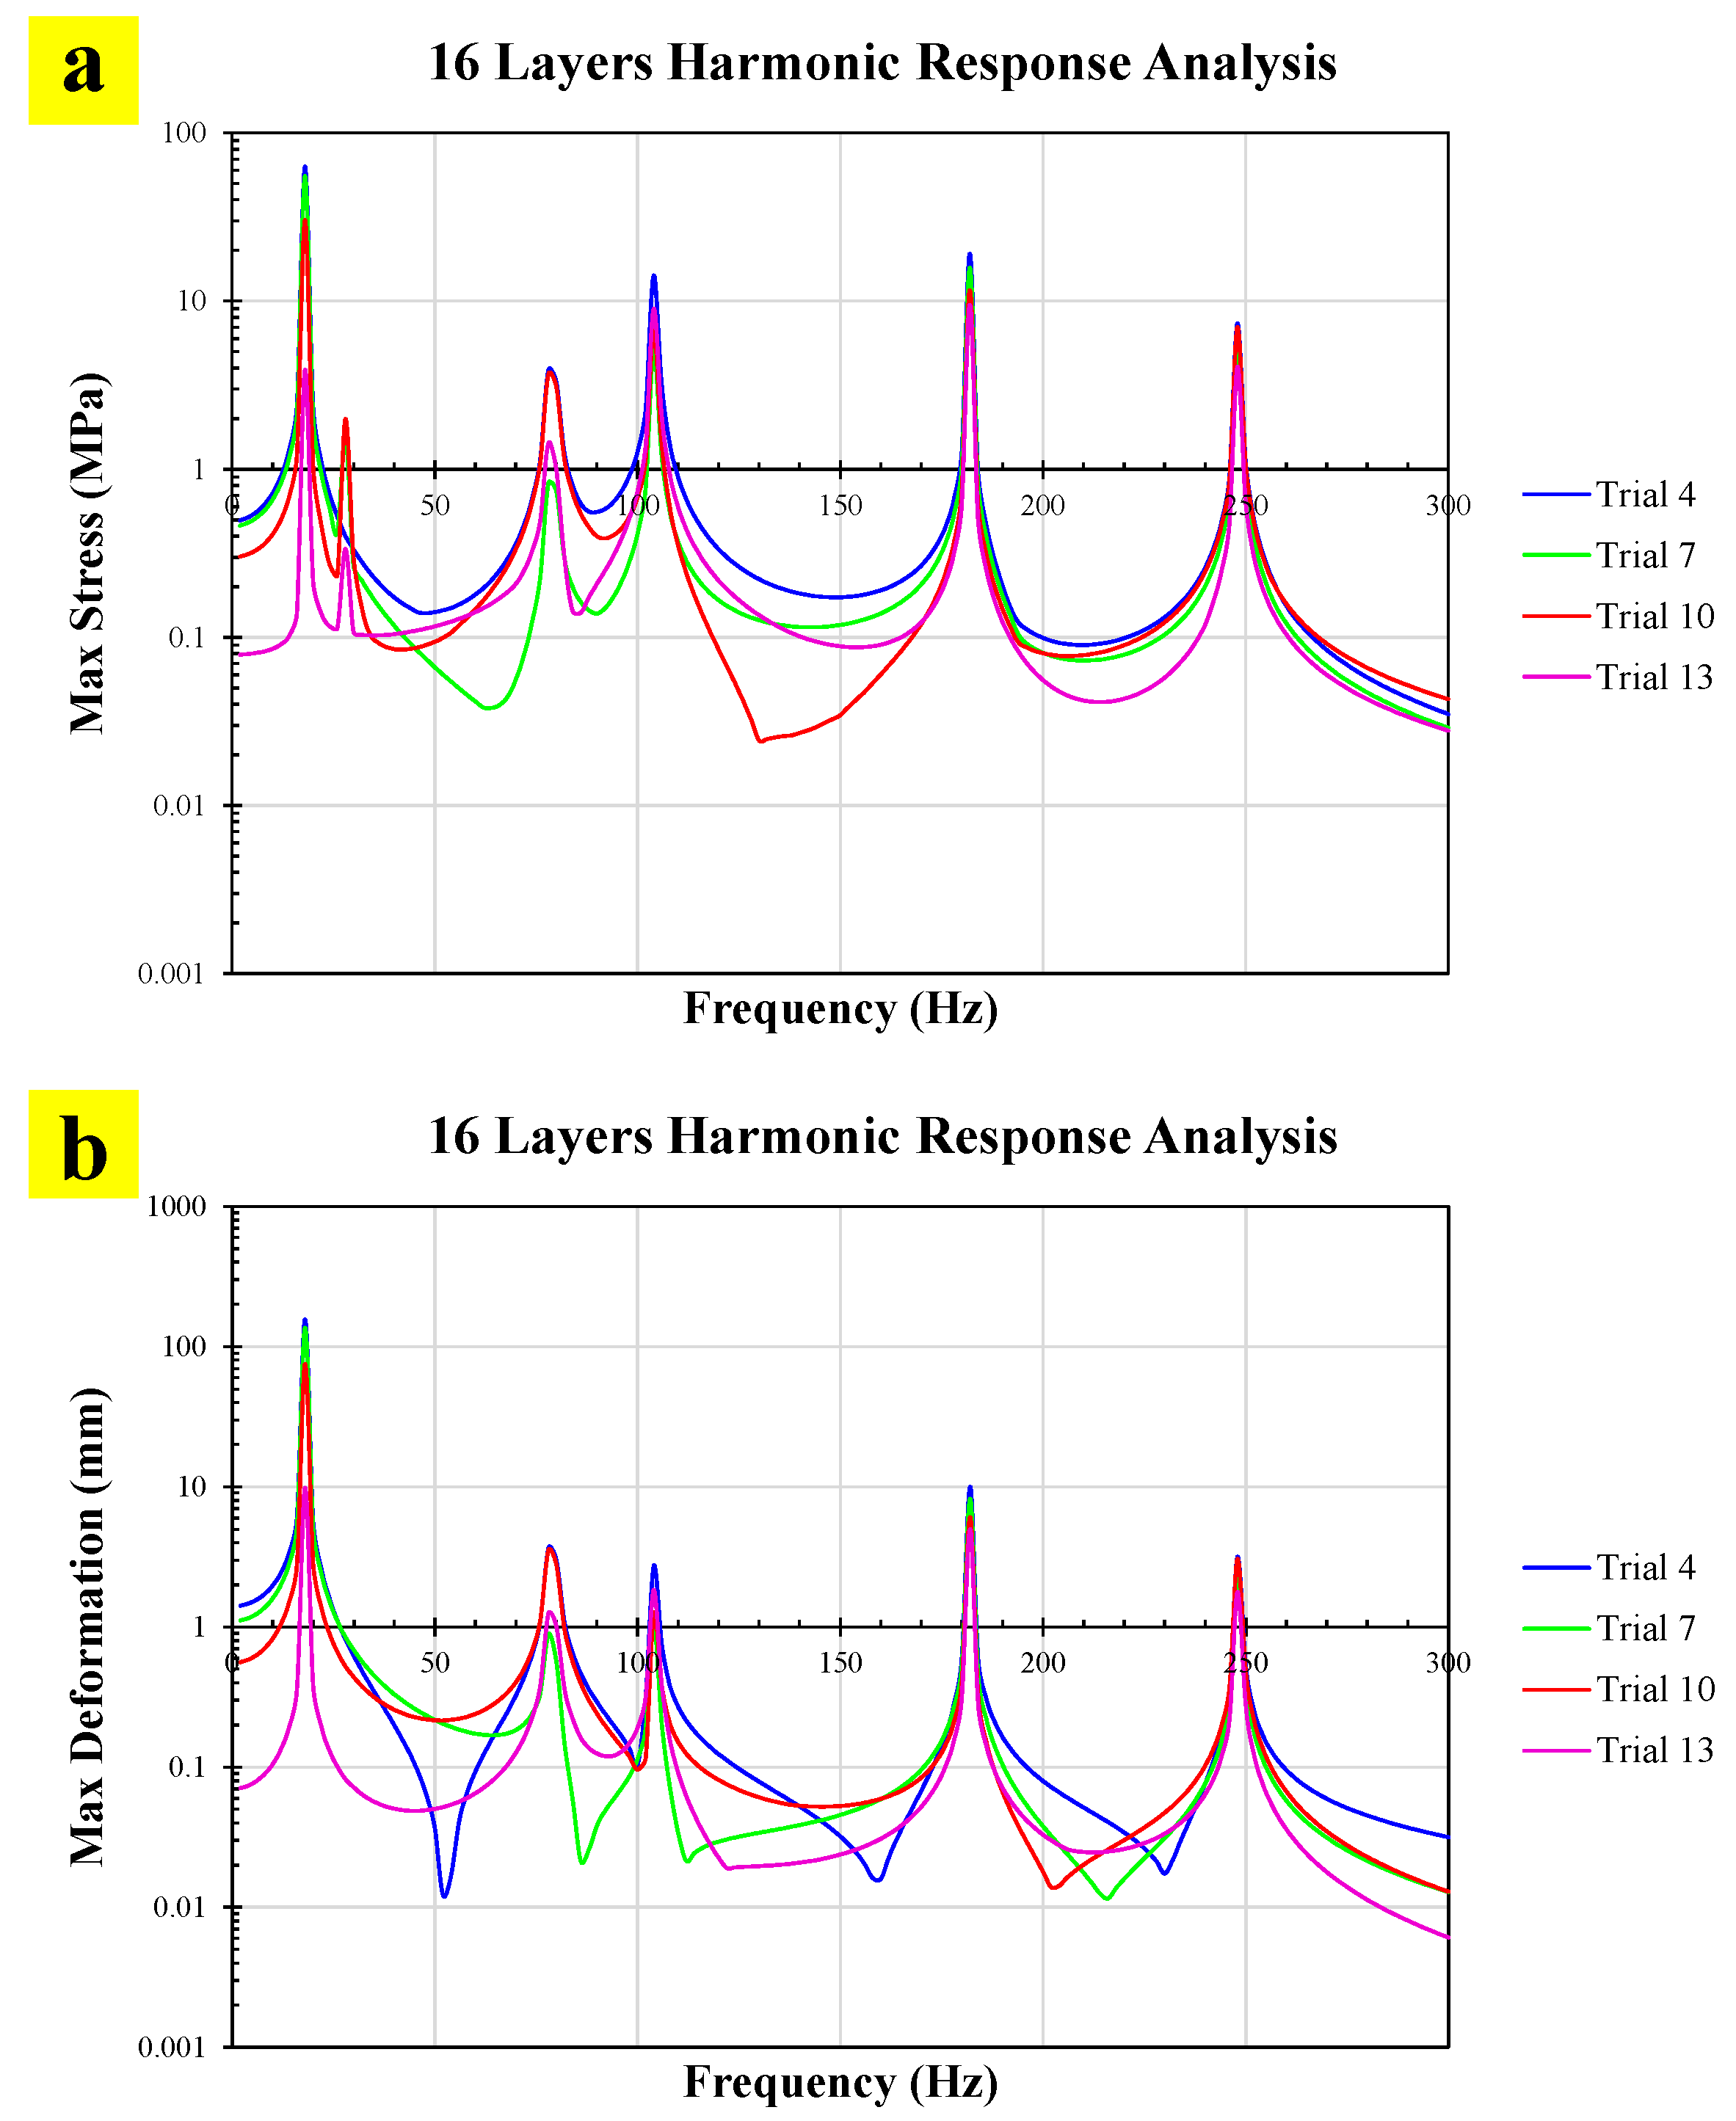
The harmonic response results for the 16-layer composite blade are shown in Figure 12. According to the modal analysis, the natural frequencies for this configuration range from approximately 18 Hz (first mode) to 249 Hz (sixth mode). To ensure that all possible resonance peaks were captured, harmonic analysis was performed over a frequency range of 0 Hz–300 Hz.
Figure 12.
Harmonic response of the 16-layer composite blade: (a) Max Stress vs. frequency and (b) Max Displacement vs. frequency, for an excitation range of 0–300 Hz.
In Figure 12a, which presents the Max Stress versus frequency, Trial 4 results in the highest stress among all the tested trials. The most prominent stress peak for Trial 4 occurs at the first mode shape (approximately 18 Hz), indicating that the fundamental bending mode is the most critical for stress concentration in this configuration. Figure 12b, which shows the Max Displacement, reveals a similar pattern: Trial 4 again produces the largest displacement response, with the peak also occurring at the first mode shape. The alignment of both Max Stress and Max Displacement at the first mode suggests that, for the 16-layer configuration, the fundamental bending mode dominates the dynamic response. While the increased stiffness of the thicker laminate reduces the overall amplitude compared with that of the thinner laminate, operating near the first natural frequency (~18 Hz) should still be avoided to prevent excessive vibration and potential fatigue damage.
Compared with the other configurations, increasing the layer count generally reduced both the displacement and stress at resonance, reflecting the greater stiffness of thicker laminates. The 4-layer blade exhibited the highest displacement response and notable stress peak, making it the most susceptible to resonance-induced damage. The 8-layer configuration showed a balanced improvement, with reduced amplitudes and better resistance to dynamic loading. The 12-layer blade further lowered the displacement but still exhibited significant stress peaks in specific modes, highlighting the need for careful frequency avoidance. The 16-layer configuration, with the highest stiffness, demonstrated the lowest overall amplitudes; however, both the maximum stress and displacement still occurred in the first mode (~18 Hz), underscoring that even the stiffest design remains vulnerable if it is excited near its fundamental frequency.
3.5. Multi-Objective Optimization Outcomes
A multi-objective optimization approach was employed to improve multiple performance criteria of the composite blade simultaneously. The optimization was formulated with three primary objectives: (i) minimizing the Max Stress, (ii) minimizing the Max Displacement, and (iii) targeting an intermediate value for the FI. The overall response values obtained from the design of the experiments and subsequent simulations, which form the basis for the optimization process, are summarized in Table 6.
Table 6.
Summary of the simulation results for all the DOE trials, including the input factor levels and corresponding output responses for Max Displacement, Max Stress, and FI.
Following the Taguchi L16 design of experiments, 16 numerical simulations were performed and the corresponding response parameters, including Max Stress, Max Displacement, and FI, were obtained and summarized in Table 6. These three response parameters were subsequently used in a multi-objective optimization process performed in Minitab 18. A General Linear Model (GLM) and analysis of variance (ANOVA) were employed to evaluate the effects of the design factors on the response parameters and to support the optimization process. The optimization was formulated to minimize Max Stress and Max Displacement while targeting an FI of 0.5. The resulting response models were then used to determine the combination of force magnitude, force distance, and number of layers that provided the highest overall composite desirability. The ANOVA results used to evaluate the significance of the input factors and their effects on the response parameters are presented in Table 7.
Table 7.
ANOVA results showing the statistical significance and contribution of each factor to the variability of the output response.
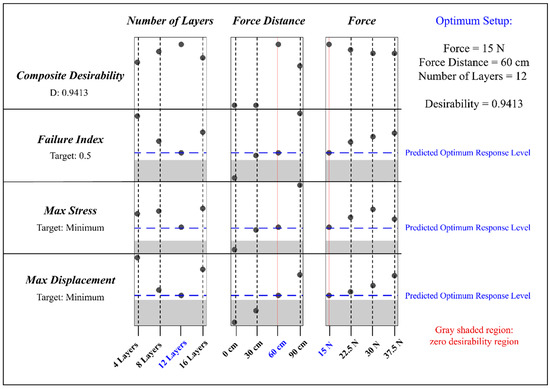
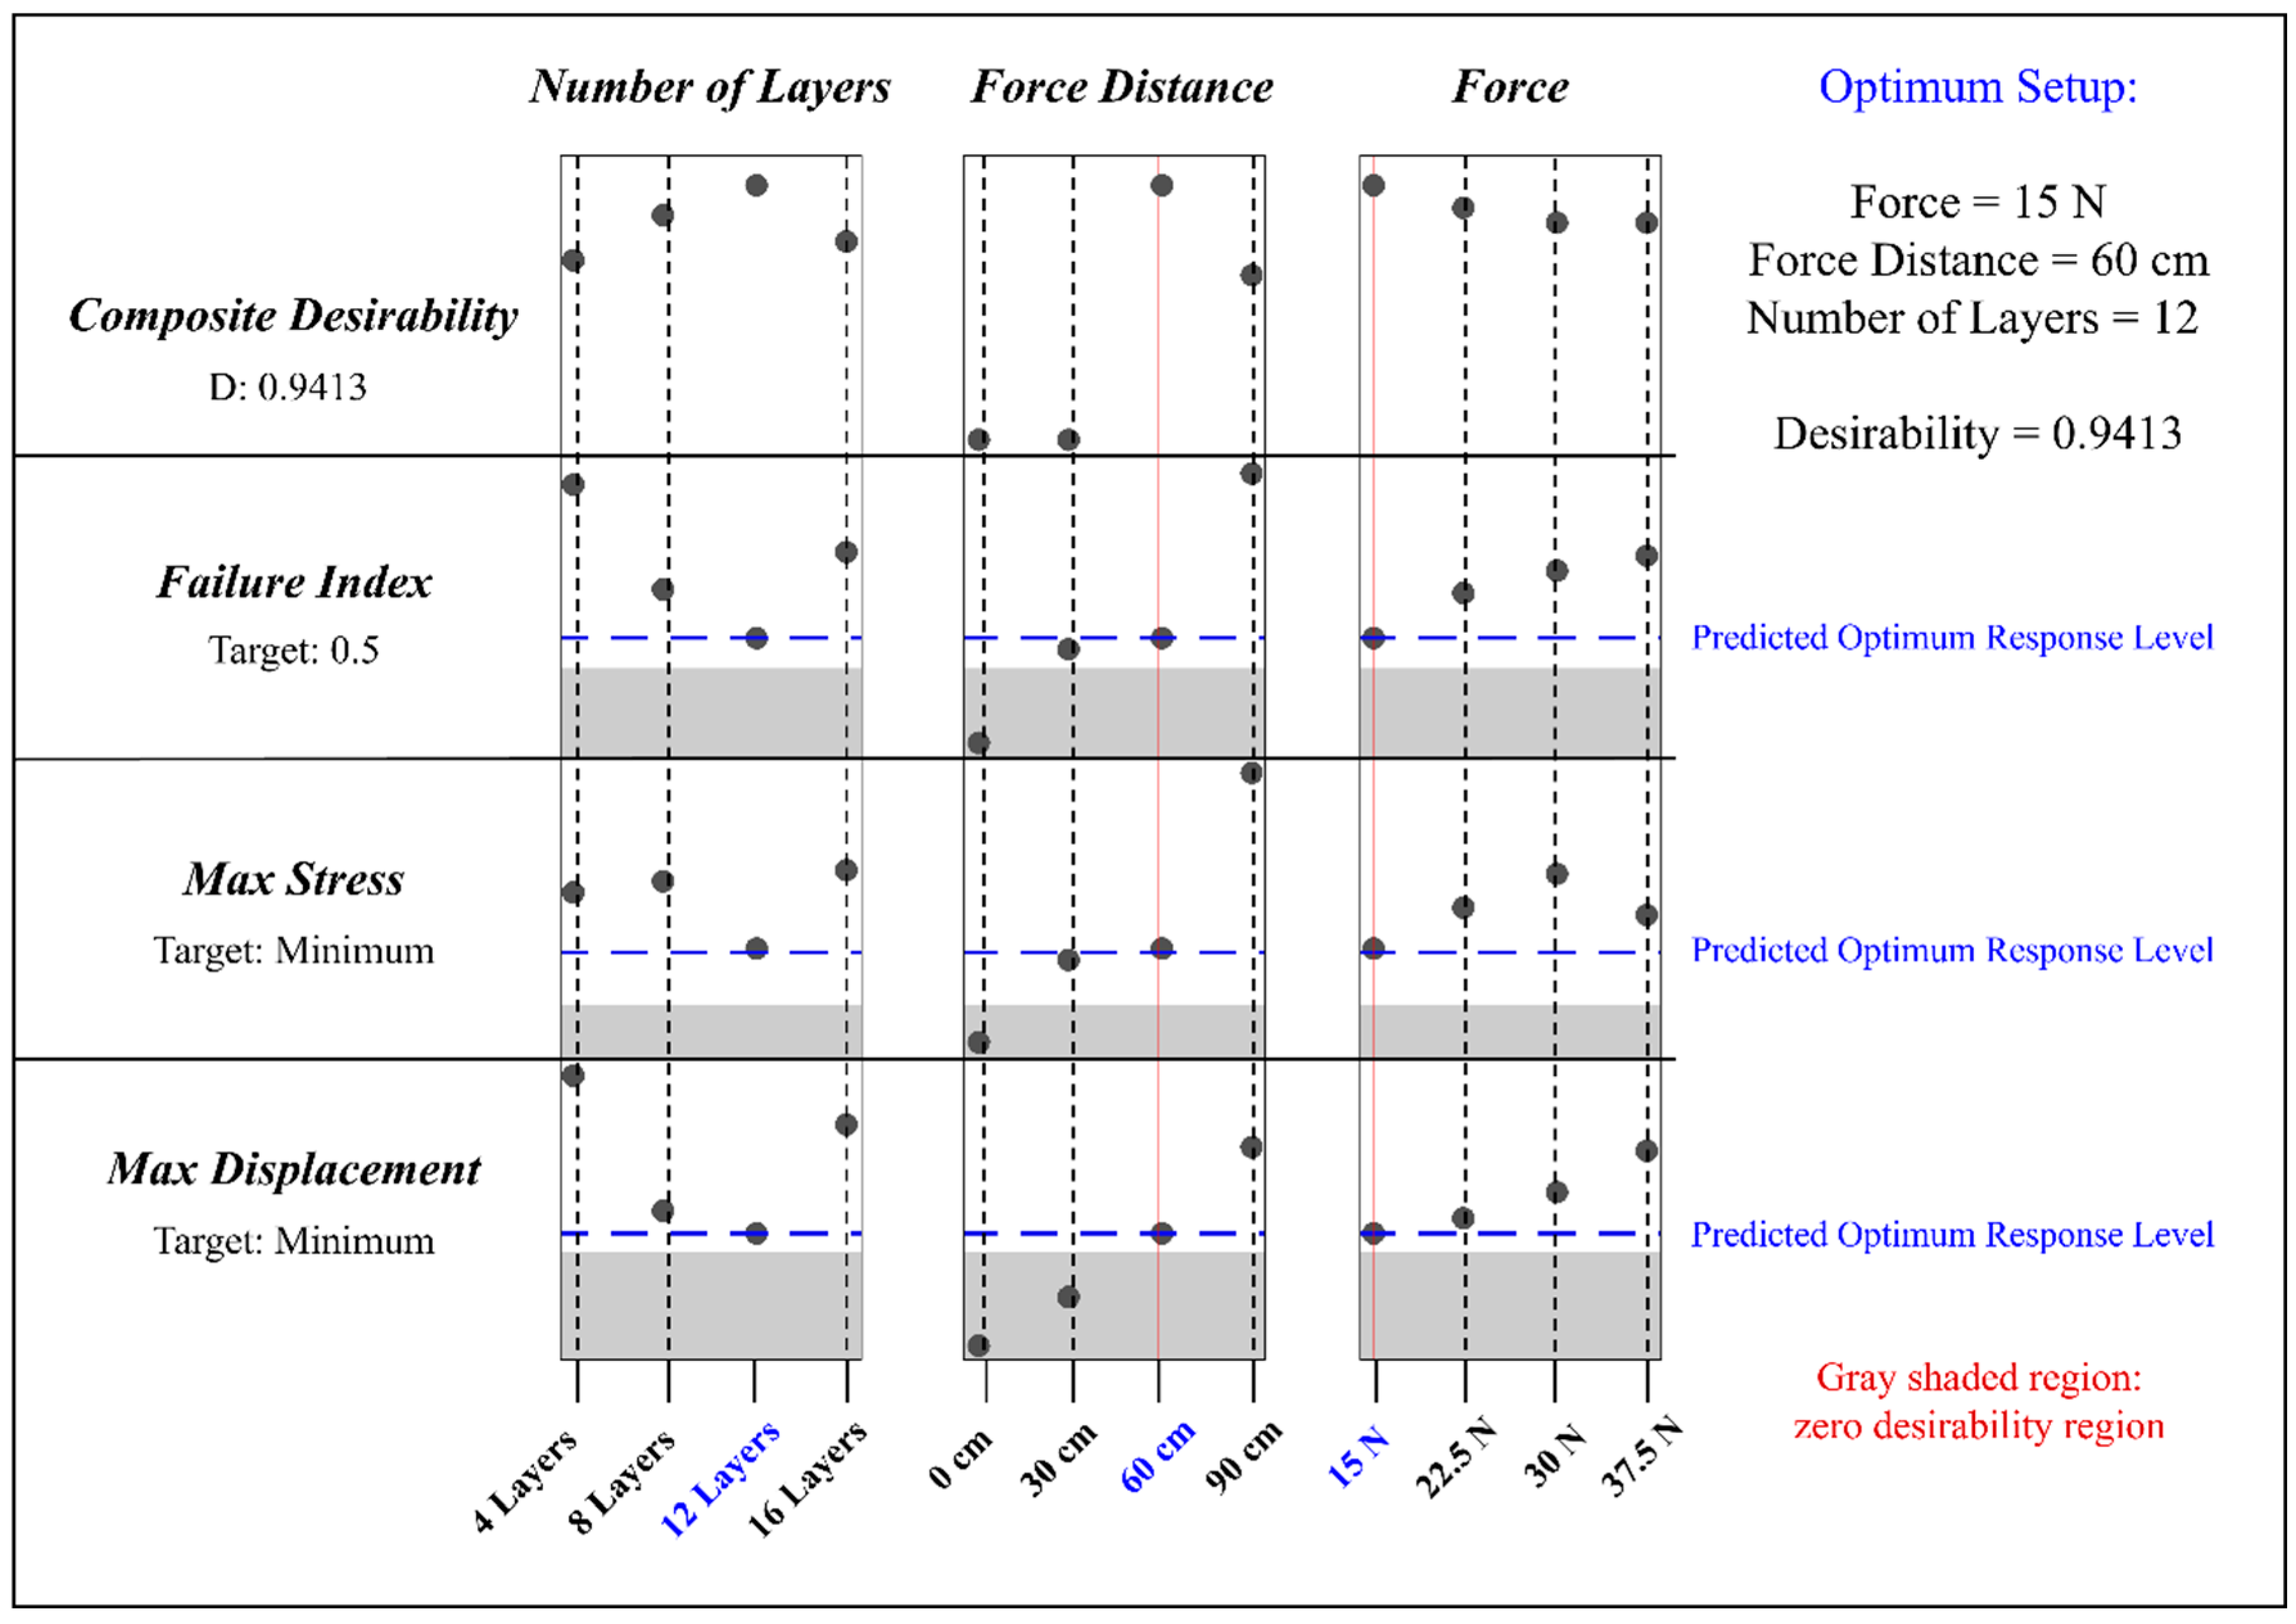
Following the multi-objective optimization process (aimed at minimizing both Max Stress and Max Displacement while targeting a mid-range value for the FI), the optimized results are presented in Figure 13.
Figure 13.
Response optimizer plot showing the optimum design condition of 12 laminate layers, 60 cm load application distance, and 15 N applied force, with a composite desirability of 0.9413. Blue dashed lines indicate predicted optimum response levels, and gray shaded regions represent zero-desirability ranges.
Figure 13 presents the multi-objective optimization output generated using Minitab 18. The plot summarizes the optimal levels of the input factors and the corresponding predicted responses, including Max Stress, Max Displacement, and FI, together with the individual desirability values and the overall composite desirability. The optimization yielded a composite desirability of 0.9413, indicating that the selected parameter combination satisfies the defined objectives to a very high degree.
The optimal settings were force = 15 N, force distance = 60 cm, and number of layers = 12. Under these conditions, the predicted FI is 0.7460 (d = 0.97965), which is close to the target value of 0.50 and remains within the safe operating range. The Max Stress is reduced to 10.8592 MPa, and the Max Displacement is lowered to 13.8934 mm, both of which represent substantial improvements over the nonoptimized cases.
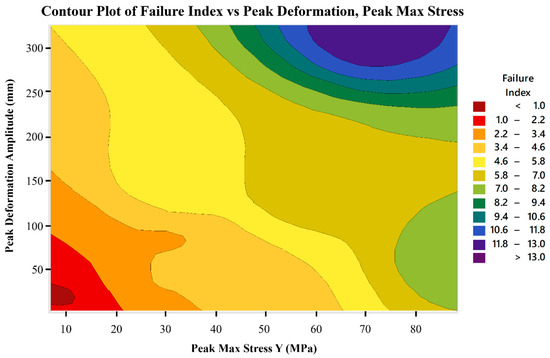
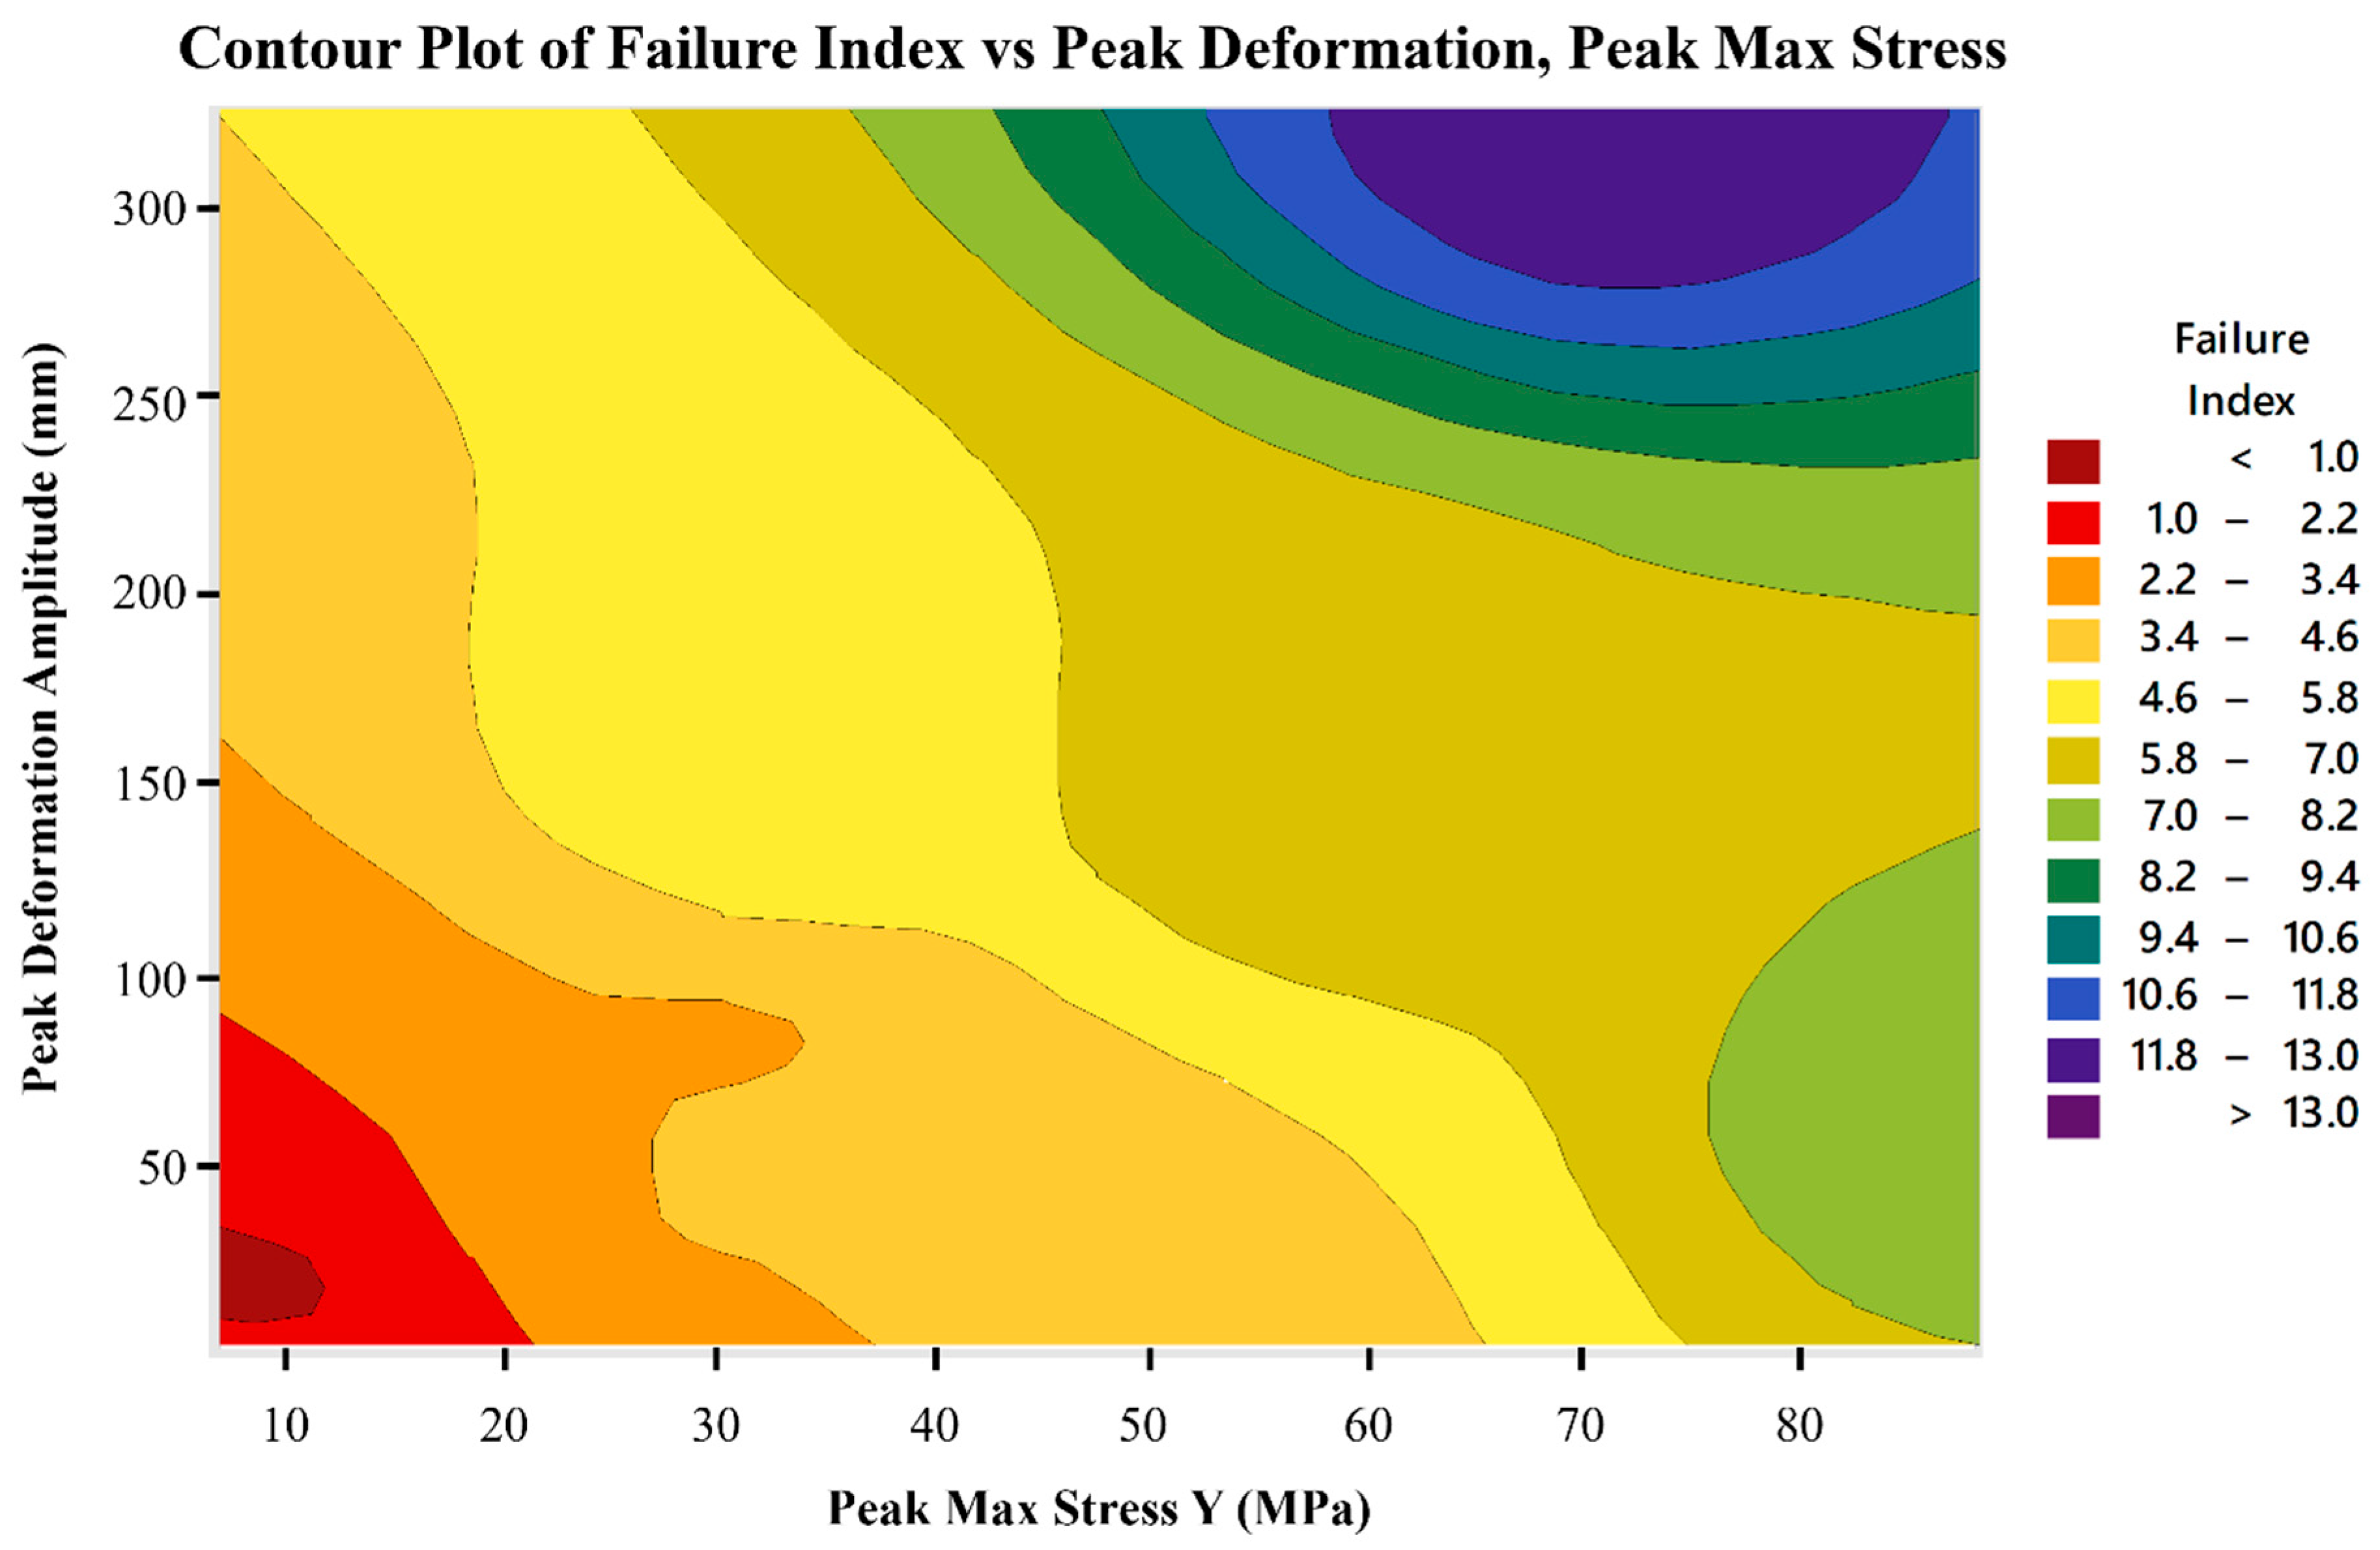
Figure 14 presents the optimization contour plot generated in Minitab 18, illustrating the relationship between Max Stress and Max Displacement and the corresponding variation in the FI within the investigated response space. The contour regions provide a visual representation of the predicted response behavior and indicate areas associated with lower or higher FI values.
Figure 14.
Contour plot illustrating the relationship between Max Stress and Max Displacement amplitude, with the FI represented by color gradients, highlighting safe and critical operating regions within the design space.
The contour plot provides a visual map of how combinations of stress and deformation influence the FI. The regions shaded in darker red correspond to FIs < 1.0, indicating safe operating conditions. As the color transitions from orange, yellow, or green to blue, the FI increases, indicating a progressively increased risk of structural failure.
From the plot, it is evident that:
- The low-stress and low-deformation zones (bottom-left region) consistently yield FI values below 1, representing the most desirable operating range.
- High stress and/or high deformation zones (upper-right region) are associated with FI values well above the safe limit, indicating critical conditions.
- The gradient pattern confirms that both stress and deformation contribute jointly to the failure risk and that controlling either parameter alone is insufficient for ensuring safety (both must be maintained within acceptable limits).
The multi-objective optimization successfully identified a parameter combination that achieves a high composite desirability (0.9413) by minimizing stress and deformation while keeping the FI within the targeted range. The contour plot further validates these results by visually confirming that the optimized point lies within the low-risk region of the design space.
These findings demonstrate that a balanced approach (simultaneously addressing stiffness, strength, and controlled failure risk) is essential for achieving an optimal composite blade design. The integration of DOE, S/N analysis, ANOVA, regression modeling, and multi-objective optimization provides a robust framework for guiding future design improvements and ensuring reliable structural performance under operational loading conditions.
To clearly establish the novelty and scientific contribution of the present research, Table 8 presents a comparative benchmarking of this study against recent literature regarding methodology, structural evaluation, and optimization criteria.
Table 8.
Summary of key contributions and methodological differences between the present work and previous research.
While the dynamic behavior of SWT blades has been widely studied, most of the existing literature focuses either on pure material comparisons under fatigue loading (Kumar et al. [46]) or basic linear modal and harmonic responses without integrating systematic structural failure criteria (Lagdani et al. [48]). Furthermore, studies that attempt structural optimization often limit their scope to varying ply angles (Wang et al. [45]) without evaluating the coupled sensitivities of operational parameters. The present study addresses this gap by combining ANSYS ACP modeling, modal/harmonic analysis, and a rigorous DOE framework. By systematically evaluating the structural responses under varying layer counts (4 to 16 plies), load magnitudes, and load distances, this research identifies the critical role of load application distance as the dominant factor over force magnitude. Ultimately, a multi-objective optimization approach was employed, pinpointing the 12-layer GFRP configuration under a 15 N load at 60 cm from the root as the optimal operational state (Composite Desirability = 0.9413), successfully balancing structural stiffness with a safe FI.
4. Conclusions
This study presented an integrated numerical–statistical framework for the structural analysis and optimization of a GFRP composite wind turbine blade based on the NACA 4412 airfoil. Finite element modal and harmonic response analyses were combined with DOE, ANOVA, regression modeling, and desirability-based multi-objective optimization to systematically investigate the effects of key design parameters on the dynamic and structural performance of the blade. The primary response parameters considered were Max Displacement, Max Stress, and the FI.
The main findings of this study can be summarized as follows:
- Force distance was identified as the most influential parameter, showing statistical significance at the 95% confidence level (p = 0.013). Increasing the distance from the blade root increased the bending effect, resulting in higher stress levels, larger deformation amplitudes, and increased FI values.
- The number of laminate layers was the second most significant factor affecting structural performance. Increasing the layer count improved the blade stiffness and load-carrying capability, while the 4-layer configuration exhibited comparatively lower structural performance. The 12- and 16-layer configurations generally demonstrated improved structural and dynamic behavior.
- Force magnitude did not show a statistically significant independent effect within the investigated range, although it contributed to variations in the stress and deformation responses.
- The multi-objective optimization identified an optimal configuration consisting of 12 laminate layers, a force magnitude of 15 N, and a force distance of 60 cm, achieving a composite desirability of 0.9413. This configuration provided a balanced response considering Max Stress, Max Displacement, and FI.
From a wind engineering and wind energy application perspective, the results demonstrate that the structural and dynamic characteristics of composite turbine blades are important for reliable operation under varying loading conditions. Increased blade stiffness and appropriate control of the natural frequencies can reduce excessive deformation and the probability of resonance-induced vibration, which may contribute to maintaining the intended blade geometry and improving structural reliability during operation. Therefore, the structural optimization of the blade is not only relevant to its strength and durability but also provides an important basis for achieving reliable and efficient wind turbine operation. The proposed optimization framework can consequently support early-stage blade design by identifying suitable structural configurations while considering the effects of loading conditions and laminate architecture.
While the point load approach effectively isolates structural behavior for optimization purposes, it is acknowledged that this does not capture the full range of dynamic, aero-elastic, and operational loads experienced in-service.
Overall, the optimized configuration provides a balanced trade-off between stiffness, structural strength, and failure resistance and represents a practical basis for manufacturing-oriented composite blade design rather than a purely theoretical solution. Future work should extend the proposed framework by incorporating additional design variables, such as fiber orientation, stacking sequence, and geometric modifications, together with more realistic aerodynamic, fatigue, and transient dynamic loading conditions, supported by further experimental validation.
Author Contributions
Conceptualization, J.K.M. and S.Y.E.; methodology, J.K.M.; software, J.K.M.; validation, J.K.M. and S.Y.E.; formal analysis, J.K.M.; investigation, J.K.M.; resources, S.Y.E.; data curation, J.K.M.; writing—original draft preparation, J.K.M.; writing—review and editing, J.K.M. and S.Y.E.; visualization, J.K.M.; supervision, S.Y.E.; project administration, S.Y.E.; funding acquisition, S.Y.E. All authors have read and agreed to the published version of the manuscript.
Funding
This research received no external funding.
Institutional Review Board Statement
Not applicable.
Informed Consent Statement
Not applicable.
Data Availability Statement
The datasets generated during and/or analyzed during the current study are available from the corresponding author upon request.
Conflicts of Interest
The authors declared no potential conflicts of interest with respect to the research, authorship, and/or publication of this article.
References
- Majewski, P.; Florin, N.; Jit, J.; Stewart, R.A. End-of-life policy considerations for wind turbine blades. Renew. Sustain. Energy Rev. 2022, 164, 112538. [Google Scholar] [CrossRef] [Scilit]
- Sahri, Y.; Tamalouzt, S.; Belaid, S.L.; Bajaj, M.; Belkhier, Y.; Singh, A.R.; El-Naggar, M.F.; Kamel, S. Effectiveness analysis of twelve sectors of DTC based on a newly modified switching table implemented on a wind turbine DFIG system under variable wind velocity. Ain Shams Eng. J. 2023, 14, 102221. [Google Scholar] [CrossRef] [Scilit]
- Liu, Y.; Li, N.; Wang, P.; Wang, T.; Zhou, J.; Qin, Z.; Chu, F. A review of vibration analysis and suppression for wind turbine blades: State of the art, challenges and perspectives. Thin-Walled Struct. 2025, 218, 114095. [Google Scholar] [CrossRef] [Scilit]
- Dhandapani, N.; Arul, K.; Kalyanasundaram, G.; Sourirajan, L.; Arputharaj, B.S.; Al-Mdallal, Q.M.; Alam, M.M.; Ganesan, B.; Raja, V. A hybrid troposkein wind turbine with piezoelectric energy harvesting patches and solar panels: Design and performance evaluations. Ain Shams Eng. J. 2025, 16, 103277. [Google Scholar] [CrossRef] [Scilit]
- Ahmed, M.A.; Bayoumi, M.A. A novel deep learning-based control for voltage sag prediction and DVR–LVRT coordination in grid-connected wind turbine systems. Ain Shams Eng. J. 2026, 17, 103882. [Google Scholar] [CrossRef] [Scilit]
- Yusuf, A.O.; Hasan, M.A.; Khalil, E. Vibration mitigation of wind turbines with tuned liquid damper using fluid-structure coupling analysis. Int. J. Dyn. Control 2024, 12, 3517–3533. [Google Scholar] [CrossRef] [Scilit]
- Khan, M.N.A.; Tüfekci, M. Structural Topology Optimisation of a Composite Wind Turbine Blade Under Various Constraints. Wind 2025, 5, 23. [Google Scholar] [CrossRef] [Scilit]
- Olivera, A.F.; Chica, E.L.; Colorado, H.A. Evaluation of thermoplastic composites for the manufac-ture of H-Darrieus wind Turbine blades on a laboratory scale. J. Mater. Res. Technol. 2025, 37, 1310–1323. [Google Scholar] [CrossRef] [Scilit]
- Elhenawy, Y.; Fouad, Y.; Marouani, H.; Bassyouni, M. Simulation of glass fiber reinforced polypro-pylene nanocomposites for small wind turbine blades. Processes 2021, 9, 622. [Google Scholar] [CrossRef] [Scilit]
- Schilling, J.C.; Mittelstedt, C. Closed-form postbuckling analysis of shear-deformable composite laminated panels. Arch. Appl. Mech. 2024, 95, 17. [Google Scholar] [CrossRef] [Scilit]
- Mishnaevsky, L., Jr. Root causes and mechanisms of failure of wind turbine blades: Overview. Material 2022, 15, 2959. [Google Scholar] [CrossRef] [Scilit] [PubMed]
- Lololau, A.; Soemardi, T.P.; Purnama, H.; Polit, O. Composite multiaxial mechanics: Laminate design optimization of taper-less wind turbine blades with ramie fiber-reinforced polylactic acid. Int. J. Technol. 2021, 12, 1273–1287. [Google Scholar] [CrossRef] [Scilit]
- Zhao, X.; Jiang, W.; Liang, Z.; Zhao, Y. Passive load reduction performance of bend-twist coupling in large flexible wind turbine blades. Compos. Struct. 2025, 371, 119421. [Google Scholar] [CrossRef] [Scilit]
- Tamayo-Avendaño, J.M.; Patiño-Arcila, I.D.; Nieto-Londoño, C.; Sierra-Pérez, J. Fluid–structure in-teraction analysis of a wind turbine blade with passive control by bend–twist coupling. Energies 2023, 16, 6619. [Google Scholar] [CrossRef] [Scilit]
- Cardoso, R.L.B.; Ramos, R.P.B.; Filha, E.M.L.; Ribeiro, M.M.; Candido, V.S.; Rodrigues, J.d.S.; Silva, D.S.; Junio, R.F.P.; Monteiro, S.N.; Fujiyama, R.T. Modelling and analysis of jute fiber reinforced epoxy composite in the development of wind blade for low intensity winds. J. Mater. Res. Technol. 2024, 28, 3619–3630. [Google Scholar] [CrossRef] [Scilit]
- Zhuang, Y.; Yuan, G. Study on coupled mode flutter parameters of large wind turbine blades. Sci. Rep. 2024, 14, 12804. [Google Scholar] [CrossRef] [Scilit] [PubMed]
- Prince, S.A.; Badalamenti, C.; Georgiev, D. Experimental investigation of a variable geometry vertical axis wind turbine. Wind Eng. 2021, 45, 904–920. [Google Scholar] [CrossRef] [Scilit]
- Hoskoti, L.; Misra, A.; Sucheendran, M.M. Modal analysis of a rotating twisted and tapered Rayleigh beam. Arch. Appl. Mech. 2021, 91, 2535–2567. [Google Scholar] [CrossRef] [Scilit]
- Chandran, P.A.; Kumar, C.P.S. Vibration analysis of rotating pre-twisted curved blades under thermal environment. Int. J. Dyn. Control 2022, 11, 919–927. [Google Scholar] [CrossRef] [Scilit]
- Lu, L.; Wu, H.; Wu, J. A case study for the optimization of moment-matching in wind turbine blade fatigue tests with a resonant type exciting approach. Renew. Energy 2021, 174, 769–785. [Google Scholar] [CrossRef] [Scilit]
- Saram, M.U.; Yang, J. A review of aeroelastic instabilities and resonance effects in wind turbine blade dynamics. Wind Eng. 2026, 50, 709–736. [Google Scholar] [CrossRef] [Scilit] [PubMed]
- Russo, S.; Contestabile, P.; Bardazzi, A.; Leone, E.; Iglesias, G.; Tomasicchio, G.R.; Vicinanza, D. Dy-namic loads and response of a spar buoy wind turbine with pitch-controlled rotating blades: An experimental study. Energies 2021, 14, 3598. [Google Scholar] [CrossRef] [Scilit]
- El-Naggar, M.; Sayed, A.; Elshahed, M.; El-Shimy, M. Optimal maintenance strategy of wind turbine subassemblies to improve the overall availability. Ain Shams Eng. J. 2023, 14, 102177. [Google Scholar] [CrossRef] [Scilit]
- Draiche, K.; Madenci, E.; Özkılıç, Y.O.; Tlidji, Y.; Althaqafi, E.; Tounsi, A.; Kaci, A. A new kinematic model for free vibration response of functionally graded sandwich curved beams. Arch. Appl. Mech. 2026, 96, 12. [Google Scholar] [CrossRef] [Scilit]
- Tronstad, L.M.; Weschler, M.; Storey, A.M.; Handley, J.; Tronstad, B.P. Vibrations from Wind Turbines Increased Self-Pollination of Native Forbs, and White Bases Attracted Pollinators: Evidence Along a 28 km Gradient in a Natural Area. Wind 2025, 5, 15. [Google Scholar] [CrossRef] [Scilit]
- Kumar, J.; Panchore, V.; Rajak, D.K.; Joshi, T. Dynamic Properties and Vibration Response of Polymer Matrix Composites: Mechanisms, Influences, and Applications in Engineering. Polym. Adv. Technol. 2025, 36, e70039. [Google Scholar] [CrossRef] [Scilit]
- van Vondelen, A.A.; Navalkar, S.T.; Iliopoulos, A.; van der Hoek, D.C.; van Wingerden, J.W. Damping identification of offshore wind turbines using operational modal analysis: A review. Wind Energy Sci. 2022, 7, 161–184. [Google Scholar] [CrossRef] [Scilit]
- Harger, A.; Carmo, L.H.S.; Gay Neto, A.; Simos, A.N.; Franzini, G.R.; Vieira, G.H.R. Modal analysis of 15 MW semi-submersible floating wind turbine: Investigation on the main influences in natural vibration. Wind 2023, 3, 548–566. [Google Scholar] [CrossRef] [Scilit]
- Chen, Y.; Griffith, D.T. Blade mass imbalance identification and estimation for three-bladed wind turbine rotor based on modal analysis. Mech. Syst. Signal Process. 2023, 197, 110341. [Google Scholar] [CrossRef] [Scilit]
- Van Lieu, P.; Luu, G.T. Static bending, free and forced vibration responses of organic nanobeams in a temperature environment. Arch. Appl. Mech. 2023, 93, 3947–3963. [Google Scholar] [CrossRef] [Scilit]
- Li, J.; Dao, M.H.; Le, Q.T. Data-driven modal parameterization for robust aerodynamic shape opti-mization of wind turbine blades. Renew. Energy 2024, 224, 120115. [Google Scholar] [CrossRef] [Scilit]
- Gong, J.; Yuan, C.; Huang, X.; Tian, W.; Li, L.; Song, J. RVE-Based Finite Element Analysis of Mechan-ical Properties and Damage Evolution in 2D Woven Carbon Fiber Composites. J. Mater. Res. Technol. 2026, 41, 6074–6092. [Google Scholar] [CrossRef] [Scilit]
- Dewangan, M.K.; Panigrahi, S.K. Finite element analysis of hybrid 3D orthogonal woven composite subjected to ballistic impact with multi-scale modeling. Polym. Adv. Technol. 2021, 32, 964–979. [Google Scholar] [CrossRef] [Scilit]
- Chikhradze, N.M.; Marquis, F.D.; Abashidze, G.S. Hybrid fiber and nanopowder reinforced compo-sites for wind turbine blades. J. Mater. Res. Technol. 2015, 4, 60–67. [Google Scholar] [CrossRef] [Scilit]
- Jiang, H.; Jiang, Y.; Xiang, J. Quantitative detection of multiple damages in wind turbine blade based on the operating deflection shape and natural frequencies. Ocean Eng. 2023, 278, 114387. [Google Scholar] [CrossRef] [Scilit]
- Agwa, A.M.; Elamy, M.I. Modeling Power Curve of Wind Turbine Using Support Vector Regression with Dynamic Analysis. Wind 2025, 5, 20. [Google Scholar] [CrossRef] [Scilit]
- Tan, X.; Liu, S.; Tang, Y.-Q. Free vibration of a pipe conveying fluid constituted by the standard solid viscoelastic model: X. Int. J. Dyn. Control. 2025, 13, 86. [Google Scholar] [CrossRef] [Scilit]
- Jiang, T.; Guo, X.; Zhang, Y.; Li, D. Study and Quantitative Analysis of Mode Localization in Wind Turbine Blades. J. Mar. Sci. Eng. 2023, 12, 67. [Google Scholar] [CrossRef] [Scilit]
- del Prado, Z.J.G.; Morais, M.V.G.; Martins, Y.L.D.; Avila, S.M. Nonlinear analysis of a wind turbine tower with a tuned liquid column damper (TLCD). Arch. Appl. Mech. 2024, 94, 2417–2430. [Google Scholar] [CrossRef] [Scilit]
- Yao, S.; Chetan, M.; Griffith, D.T.; Escalera Mendoza, A.S.; Selig, M.S.; Martin, D.; Kianbakht, S.; Johnson, K.; Loth, E. Aero-structural design and optimization of 50 MW wind turbine with over 250-m blades. Wind Eng. 2022, 46, 273–295. [Google Scholar] [CrossRef] [Scilit]
- Madsen, M.H.A.; Zahle, F.; Horcas, S.G.; Barlas, T.K.; Sørensen, N.N. CFD-based curved tip shape de-sign for wind turbine blades. Wind Energy Sci. 2022, 7, 1471–1501. [Google Scholar] [CrossRef] [Scilit]
- Cardamone, R.; Broglia, R.; Papi, F.; Rispoli, F.; Corsini, A.; Bianchini, A.; Castorrini, A. Aerodynamic design of wind turbine blades using multi-fidelity analysis and surrogate models. Int. J. Turbomach. Propuls. Power 2025, 10, 16. [Google Scholar] [CrossRef] [Scilit]
- Teter, A.; Gawryluk, J. Experimental modal analysis of a rotor with active composite blades. Compos. Struct. 2016, 153, 451–467. [Google Scholar] [CrossRef] [Scilit]
- Dhakal, S.; Bhattarai, K.R.; Sanjay, M. Computational analysis of the aerodynamic performance of NACA 4412 and NACA 23012 airfoils. Int. Res. J. Eng. Technol. 2023, 10, 12. [Google Scholar] [CrossRef] [Scilit] [PubMed]
- Cai, X.; Pan, P.; Zhu, J.; Gu, R. The analysis of the aerodynamic character and structural response of large-scale wind turbine blades. Energies 2013, 6, 3134–3148. [Google Scholar] [CrossRef] [Scilit]
- Wang, Q.; Li, X.; Wei, K.; Jiang, M. Dynamical analysis of wind turbine blades based on harmonic re-sponse. J. Vibroeng. 2019, 21, 1251–1259. [Google Scholar] [CrossRef] [Scilit]
- Kumar, M.S.; Krishnan, A.S.; Vijayanandh, R. Vibrational fatigue analysis of NACA 63215 small horizontal axis wind turbine blade. Mater. Today Proc. 2018, 5, 6665–6674. [Google Scholar] [CrossRef] [Scilit]
- Veludurthi, A.; Bolleddu, V. Experimental study on modal and harmonic analysis of small wind tur-bine blades using NACA 63-415 aerofoil cross-section. Energy Eng. 2020, 117, 49–61. [Google Scholar] [CrossRef] [Scilit]
- Lagdani, O.; Tarfaoui, M.; Nachtane, M.; Trihi, M.; Laaouidi, H. Modal analysis of an iced offshore composite wind turbine blade. Wind Eng. 2022, 46, 134–149. [Google Scholar] [CrossRef] [Scilit]

Disclaimer/Publisher’s Note: The statements, opinions and data contained in all publications are solely those of the individual author(s) and contributor(s) and not of MDPI and/or the editor(s). MDPI and/or the editor(s) disclaim responsibility for any injury to people or property resulting from any ideas, methods, instructions or products referred to in the content. |
© 2026 by the authors. Licensee MDPI, Basel, Switzerland. This article is an open access article distributed under the terms and conditions of the Creative Commons Attribution (CC BY) license.