


Abstract
Assessing metastatic potential (MP) based on morphological parameters of cancer cells is a promising direction in experimental oncology. The shape of a cell often correlates with an invasive phenotype, characterized by greater elongation and decreased roundness. An analytical module based on the Omnipose neural network has been developed for automated morphometric analysis of cancer cells. The module performs cell segmentation on brightfield images and calculates eight morphological parameters (area, perimeter, axes, circularity, aspect ratio, roundness) without requiring special preprocessing or staining. Validation on 65 cells from breast cancer cell lines with high and low metastatic potential (MP) demonstrated high accuracy: the deviation from manual measurements did not exceed 5% for dimensional parameters and 11% for shape parameters. The module revealed statistically significant morphological differences between the high- and low-MP cells. The developed solution can serve as a foundation for the quantitative assessment of metastatic potential in experimental oncology.
1. Introduction
Oncological diseases remain one of the leading causes of death worldwide: for instance, in 2022, nearly 20 million new cancer cases and 9.7 million deaths were recorded, and the lifetime risk of developing the disease remains high [1]. It has been noted that metastases, rather than the primary tumors themselves, pose the greatest danger, as metastases disrupt organ function and cannot be treated locally [2]. Therefore, early assessment of metastatic potential is a priority task in modern oncology, since the appearance of circulating tumor cells in the bloodstream aggravates the course of the disease and leads to the spread of the disease even in localized forms of cancer [3].
In recent years, increasing attention has been paid to morphological parameters of cells as accessible and informative biomarkers of the invasive phenotype [4,5]. Cell shape often correlates with the invasive phenotype, characterized by greater elongation and reduced roundness [6,7]. Metastatic cells are characterized by a more elongated morphology, as confirmed by quantitative morphometric parameters [6,8].
Furthermore, it has been shown that cells at the leading edge of the wound possess a more elongated morphology and form a greater number of protrusions compared to peripheral cells [9]. High-metastatic cells also demonstrate higher anisotropy of actin filaments (0.18 vs. 0.07 in low-metastatic cells), indicating greater cytoskeletal organization characteristic of the invasive phenotype [9,10].
However, systematic and accurate extraction of the data from large arrays of microscopic images remains a nontrivial task due to the lack of specialized software modules that would allow automatic segmentation of cells and computation of a comprehensive set of morphometric parameters. Among the existing neural network algorithms for cell segmentation, the most widely used are U-Net, based on pixel-wise classification [11]; StarDist, which predicts radial distances to the cell boundary from a center pixel along fixed directions [12]; and Cellpose, which uses spatial gradient vector flow fields [13]. In contrast, Omnipose employs a vector flow field based on the Euclidean distance transform, making it robust for segmenting dense clusters and cells with complex morphology, including bacteria and neurons [14]. In its original evaluation, Omnipose outperformed earlier methods such as U-Net and Cellpose 1.0 on bacterial and mixed cell-type datasets across standard segmentation metrics [14], though recent benchmarks show that newer generalist models have since matched or surpassed it on diverse datasets [15]. In terms of inference speed, Omnipose is generally slower than standard U-Net due to its computationally intensive postprocessing step [14]. Omnipose is actively used in cancer research for segmenting cancer cells in dense cultures and complex microenvironments, where traditional algorithms (Cellpose, StarDist) fail due to overlapping and deformed cells [14,16,17].
Omnipose demonstrated accurate results in phenotypic screening on the LIVECell dataset, which contains dense, label-free cultures of cancer cell lines, as well as in working with heterogeneous microtumors and their microenvironments [16,17].
In particular, the algorithm has been applied to analyze the invasiveness of cancer cells in 3D matrices, enabling quantitative assessment of morphological changes during metastasis [12,18]. In this study, we compared cell morphology in 2D culture on a stiff substrate; other conditions (matrix stiffness, topography, 3D culture, etc.) were not examined.
Our goal was to develop a specialized software module for complete morphometric analysis of cells that extends and improves the Omnipose neural network. This module automatically extracts quantitative morphometric parameters (area, perimeter, form factor, elongation, roundness, etc.) for each cell, since the analysis of these parameters can provide a statistical assessment of phenotypic changes and the likelihood of transition to an invasive type.
2. Materials and Methods
2.1. Cell Culture
In this work, two commercially available epithelial human breast cancer cell lines with high (MDA-MB-231) and low (MCF7) metastatic potential, obtained from the American Type Culture Collection (ATCC, Manassas, VA, USA), were used. MDA-MB-231 and MCF7 cells were cultured in DMEM (Thermo Fisher Scientific, Gibco, Waltham, MA, USA) imasupplemented with 10 vol% fetal bovine serum (Dia-M, Moscow, Russia), 1 vol% L-glutamine (OOO NPP PanEco, Moscow, Russia), 1 vol% penicillin–streptomycin (OOO NPP PanEco, Moscow, Russia), and 1 vol% sodium pyruvate (OOO NPP PanEco, Moscow, Russia). All cell lines were cultured at 37 °C, 5% CO2, and high humidity. Cells were frozen at early passages (3–5) from the original ATCC stock; for experiments, cells were thawed and used at passages 7–30. Twenty-four hours prior to imaging, cells were seeded onto 386-well flat-bottom plates (Corning Incorporated, Corning, NY, USA) at a density of 100,000 cells/mL, which yielded approximately 1000 closely situated but not monolayer-forming cells per well. No surface coating was used; cells were cultured directly on the culture plastic. Images were acquired using an ImageXpress Micro XL System (Molecular Devices LLC, San Jose, CA, USA) inverted microscope equipped with a 40×/0.60 NA air-immersion, long working distance objective, in transmitted light mode; specifically, brightfield images were used for the morphometric analysis in the present study. Imaging was performed on live, unfixed cells at room temperature using the built-in camera of the microscope; no cell staining was used.
2.2. Module Implementation
Custom Python code was integrated into the pre-trained Omnipose model [14,19]. The developed analytical module is an image processing pipeline implemented in Python (version 3.9; Python Software Foundation, Wilmington, DE, USA) using the deep learning libraries PyTorch (version 1.12; Meta AI Research, Menlo Park, CA, USA) and OpenCV (version 4.7; OpenCV Foundation, Santa Clara, CA, USA).
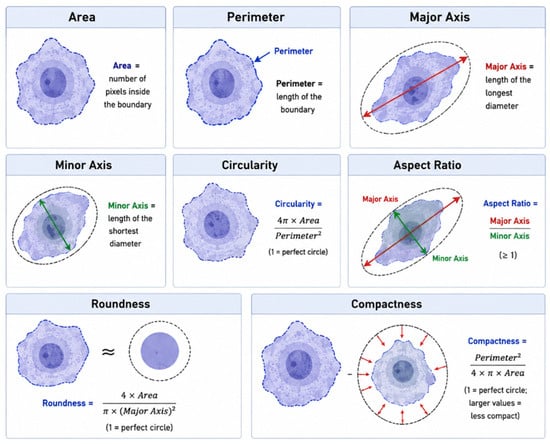
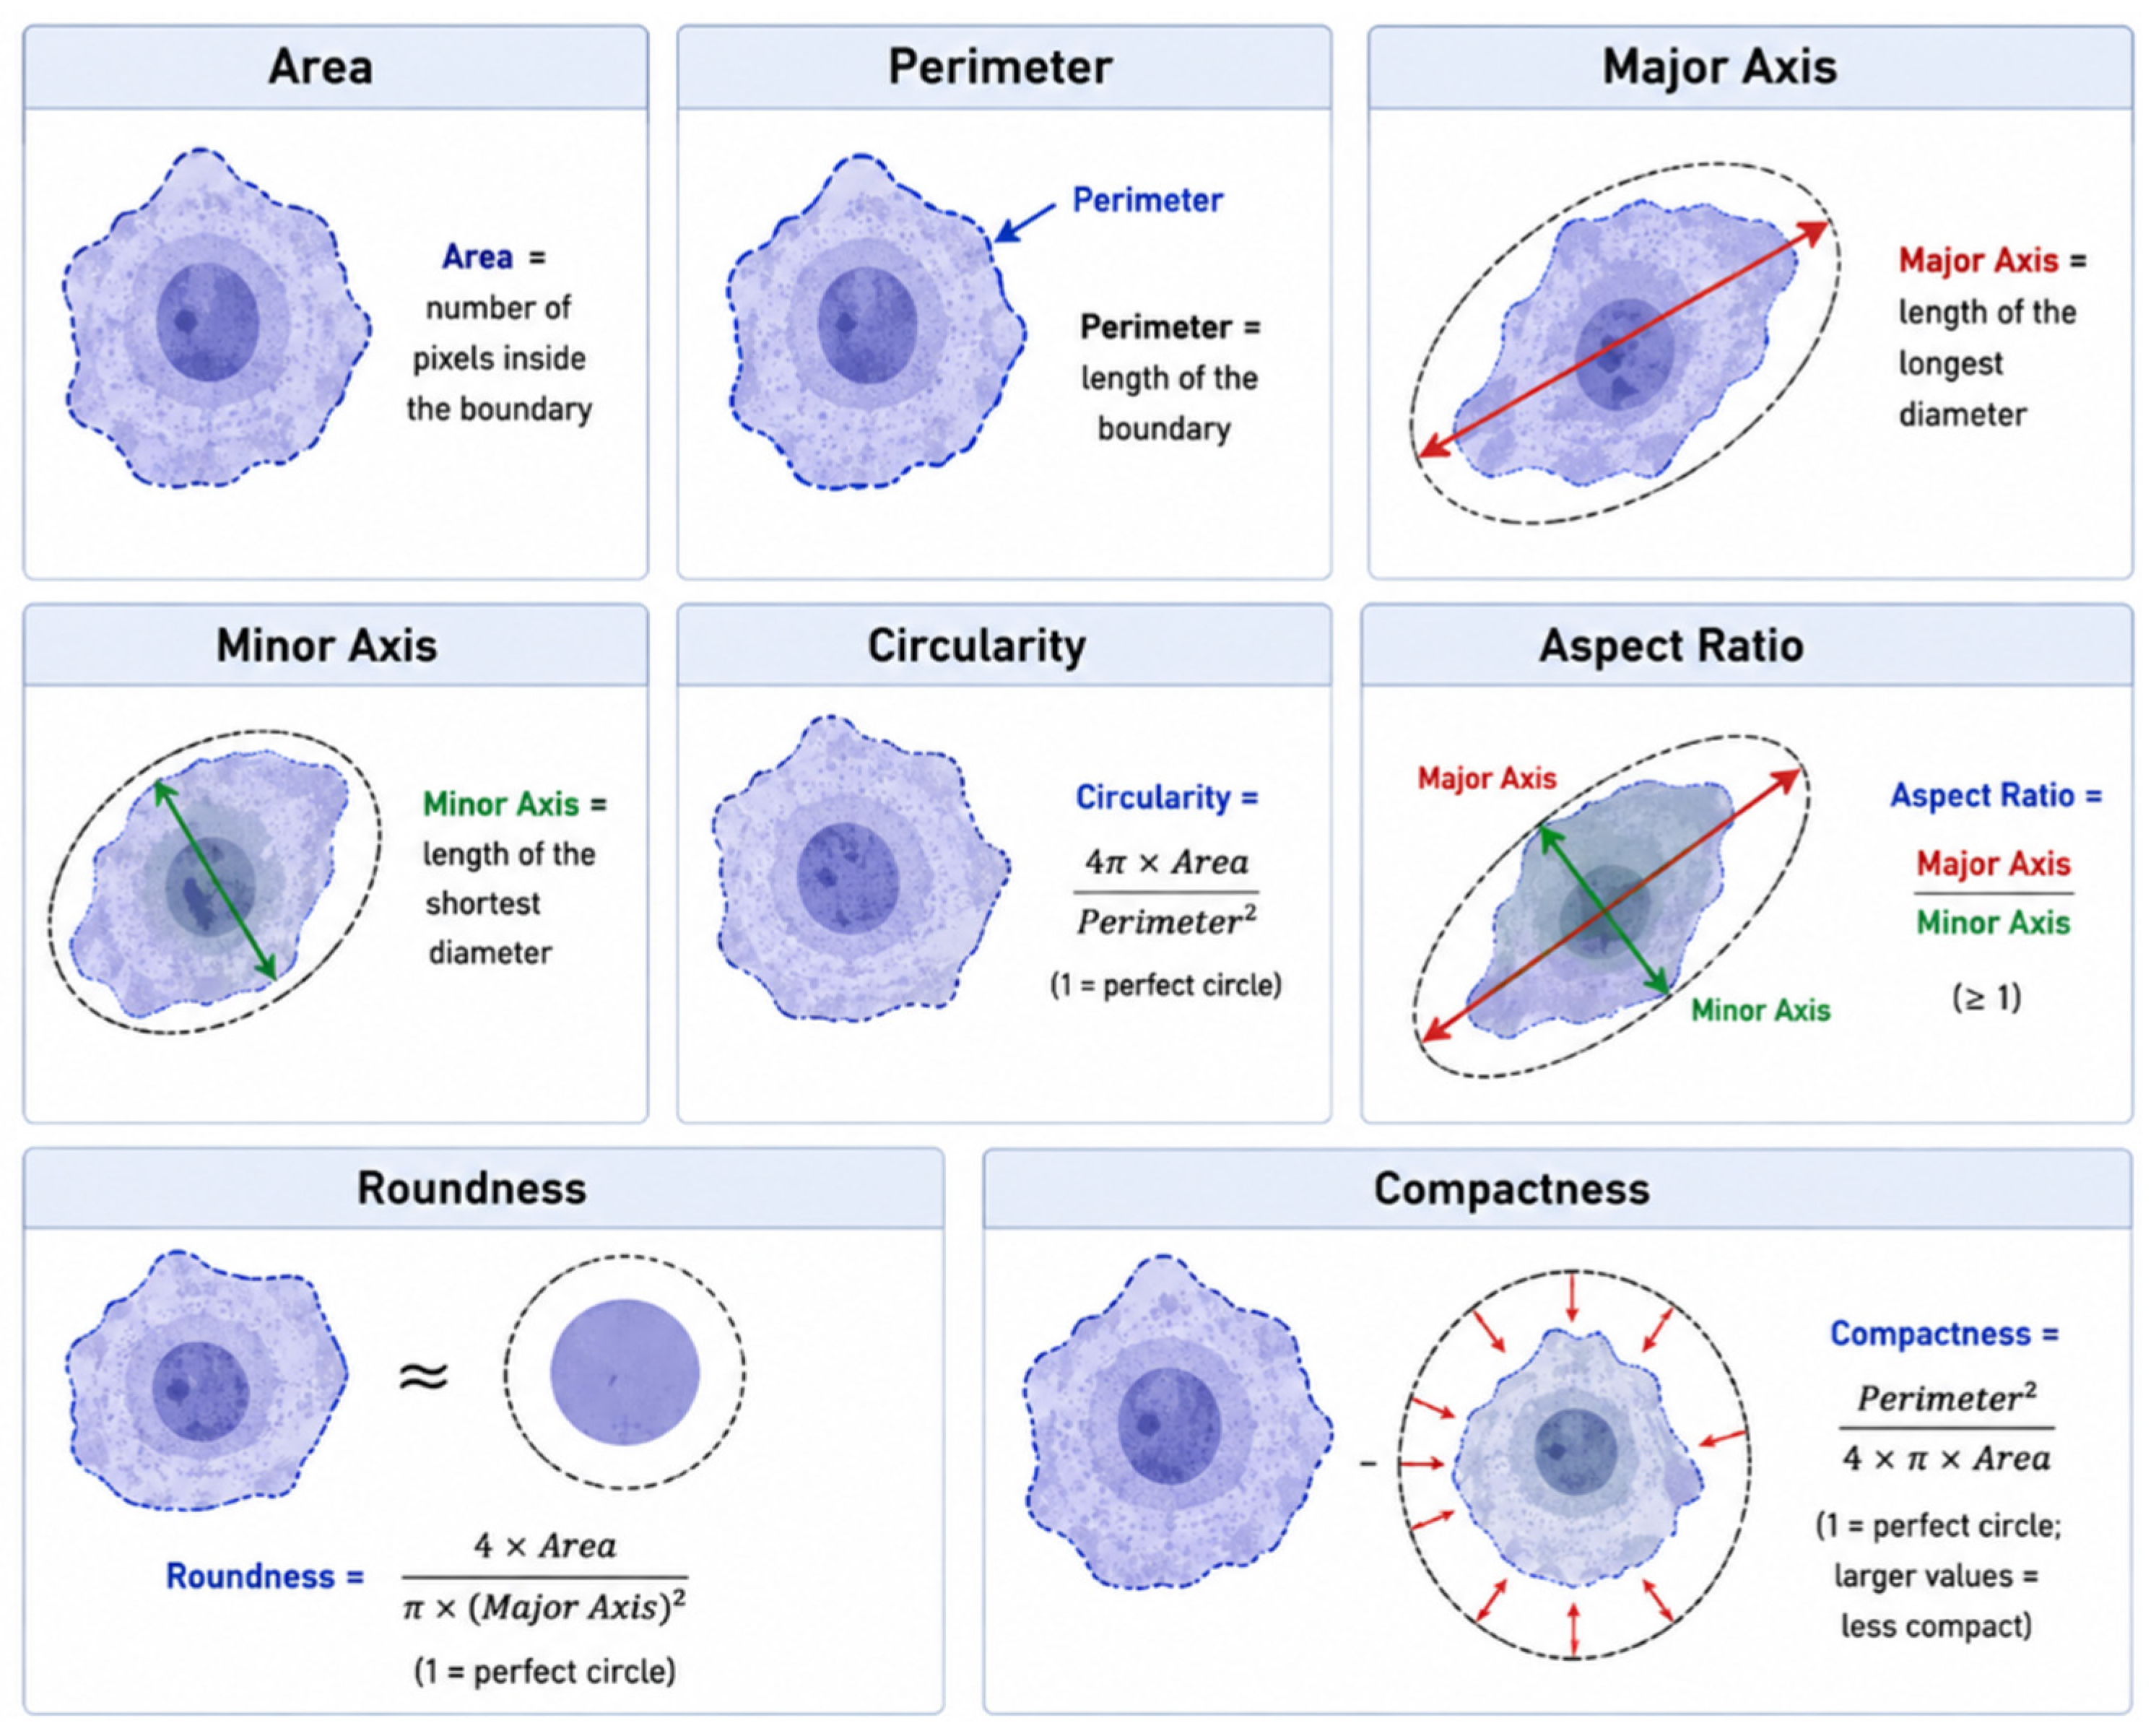
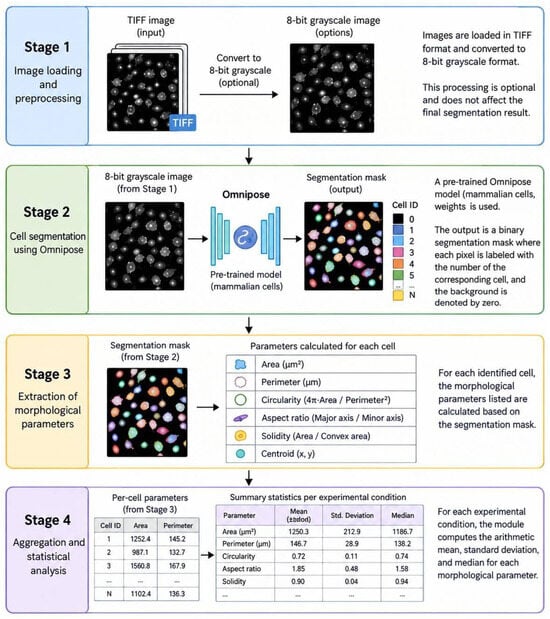
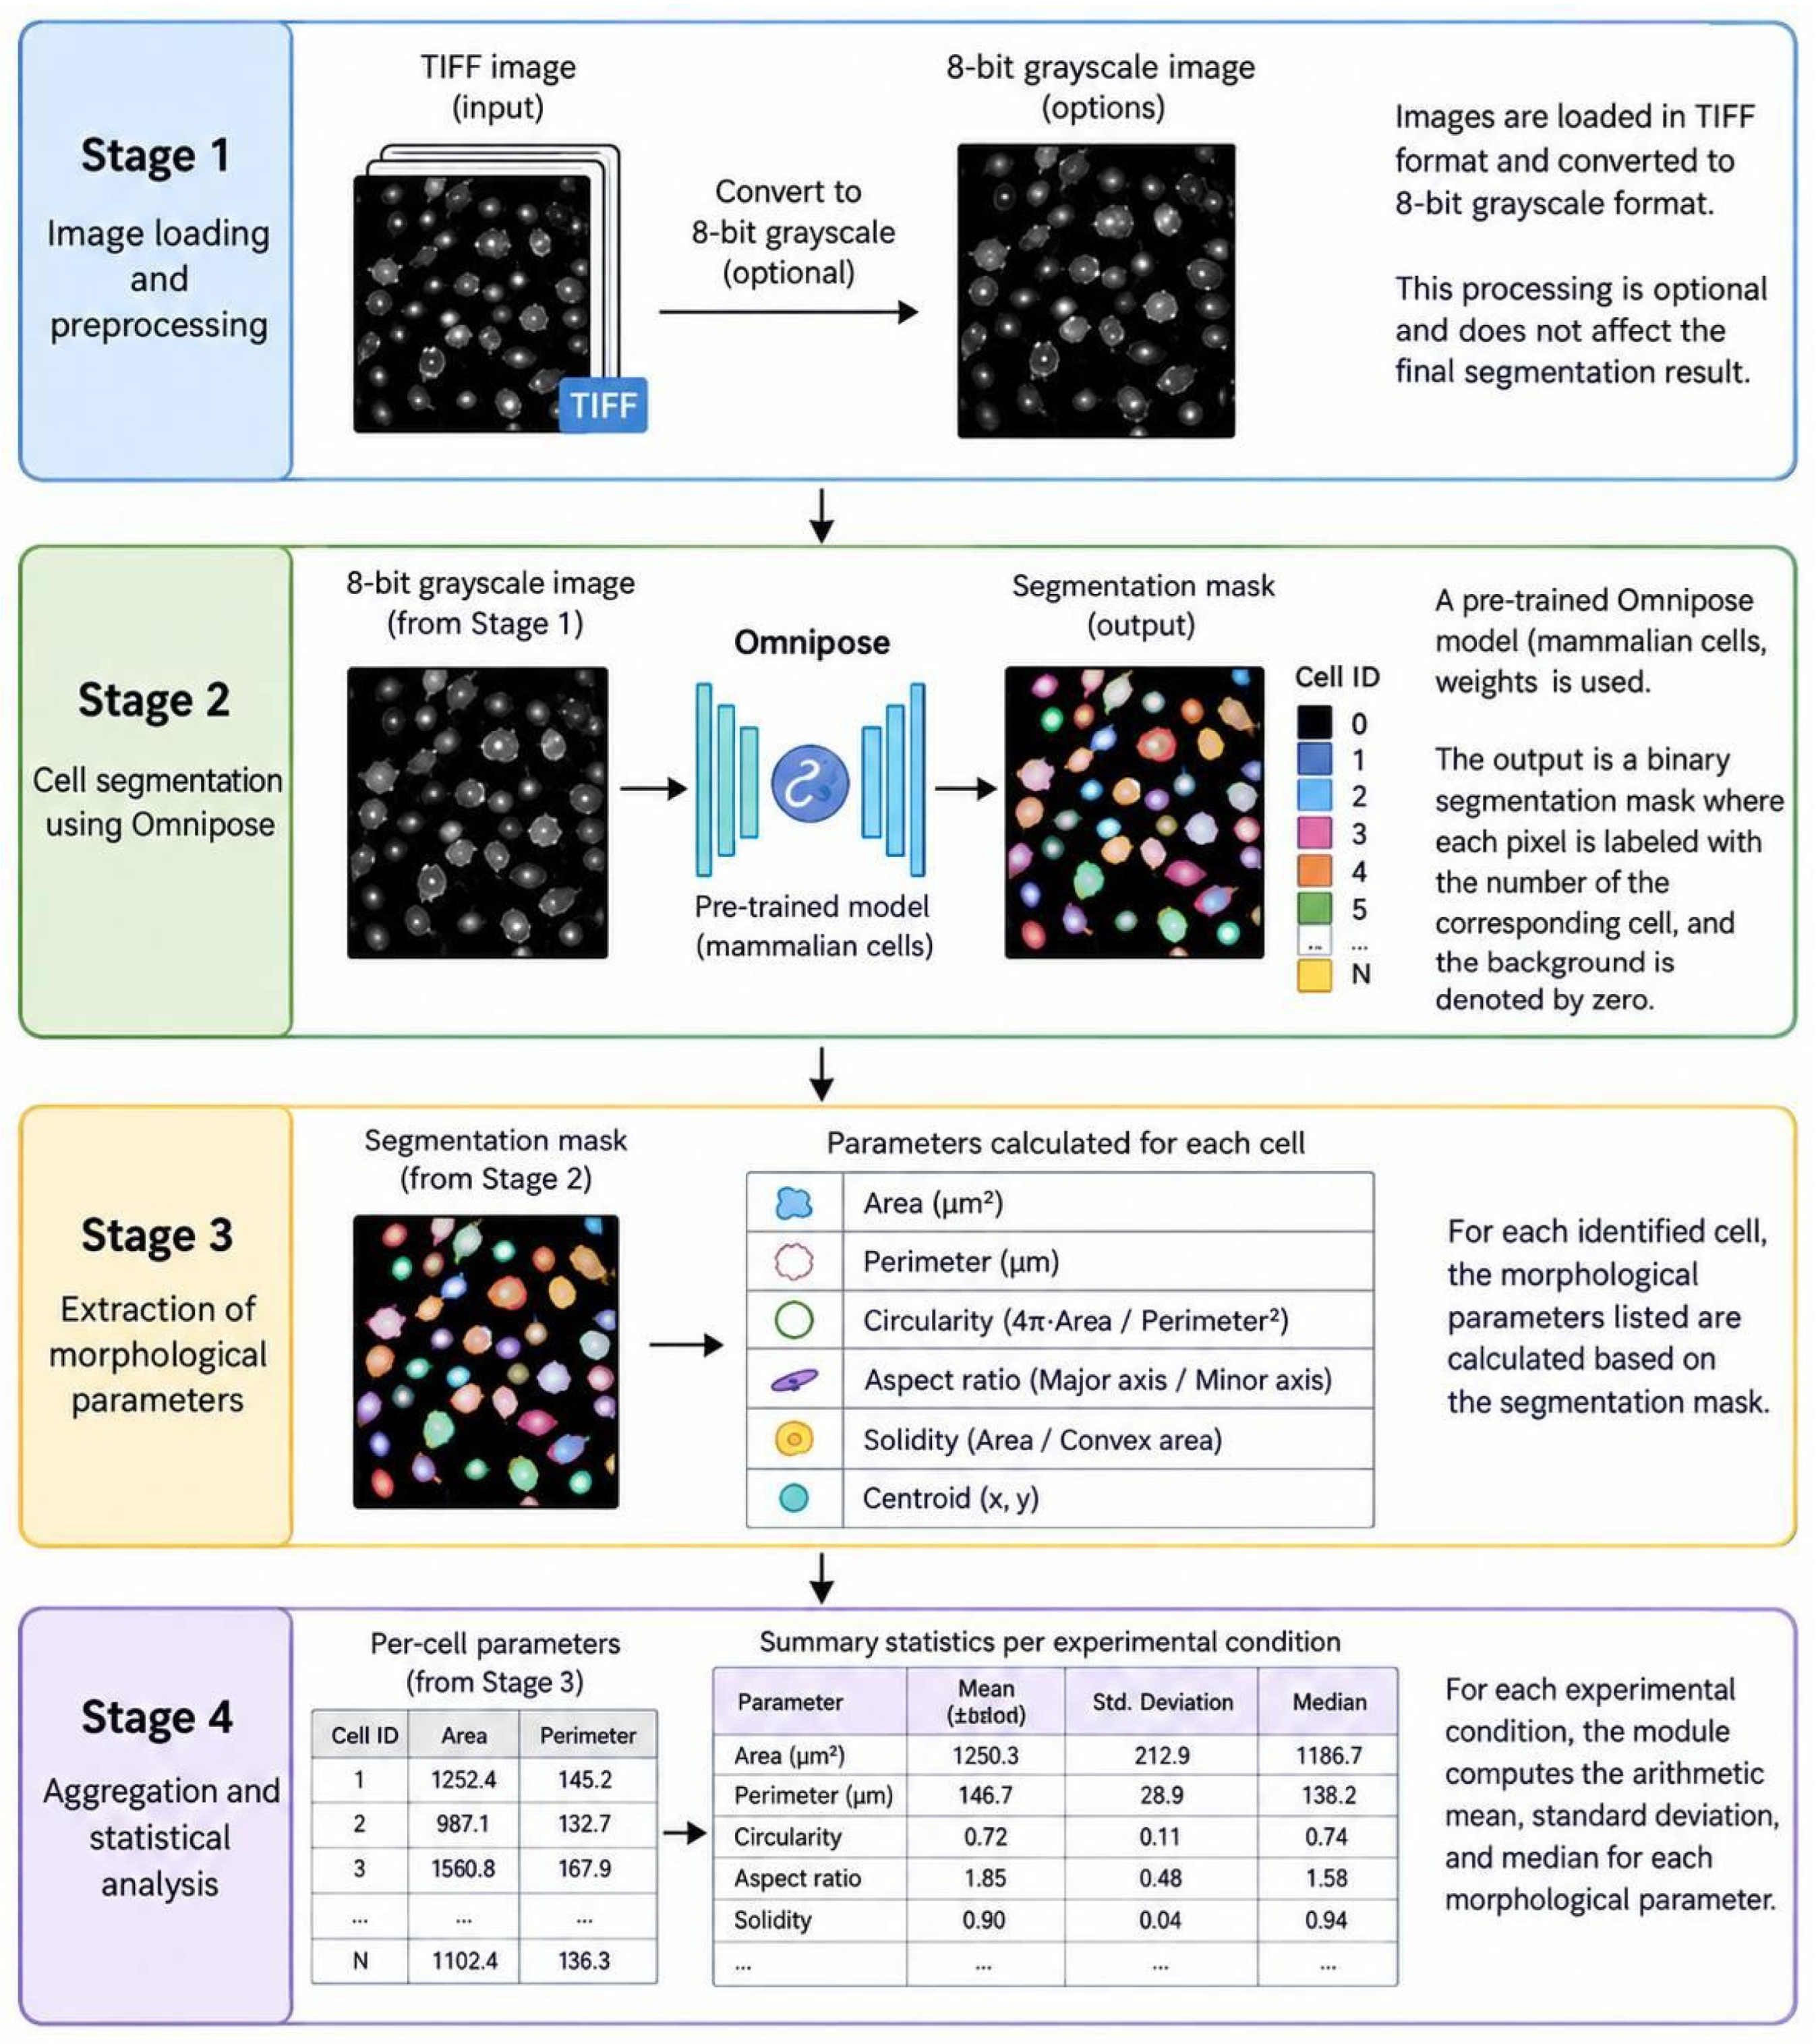
Cell image analysis is based on the calculation of cell parameters (Figure 1). Each parameter is calculated by the module in several sequential steps (Figure 2). To improve visualization, noise and brightness are corrected at the initial stages; segmentation is then performed, resulting in a binary mask of the detected objects. Since the automatic segmentation algorithm is not perfect, users can manually correct cell contours using a brush and eraser. After the corrections are loaded, the module performs a final recalculation and outputs the metric table.
Figure 1.
The principle of calculating key morphometric parameters based on cell contours. The principle of calculating key morphometric parameters based on cell contours is illustrated. For each cell, geometric characteristics—area, perimeter, and the major and minor axes of the fitted ellipse—are automatically determined. Area and perimeter reflect cell size, while the major and minor axes describe its elongation. These are used to compute dimensionless shape coefficients—circularity, aspect ratio, roundness, and compactness—which allow assessment of the cell’s deviation from a perfect circle and its geometric compactness. In the Compactness panel, red arrows indicate the deviation of the actual cell contour from a perfect circle. All parameters were calculated automatically from binary segmentation masks.
Figure 2.
Overview of the automated image analysis pipeline. The workflow includes image preprocessing (intensity normalization and background noise suppression), cell segmentation using the Omnipose neural network, extraction of morphological features of individual cells, and aggregation of the measured parameters into summary statistics. The data obtained serve as the basis for comparative analysis of phenotypic changes.
Assessment of metastatic potential is based on morphometric parameters (Table 1): The parameters “Area” and “Perimeter” characterize the overall cell size and the irregularity of its boundary, respectively; “Major Axis” and “Minor Axis” reflect the dimensions of the approximating ellipse, indicating the maximum extent of the cell and its width in the orthogonal direction. The dimensionless indices “Circularity,” “Aspect Ratio,” “Roundness,” and “Compactness” enable statistical assessment of the deviation of cell shape from a perfect circle and the degree of its elongation, thereby making it possible to quantitatively characterize phenotypic changes for further analysis.
Table 1.
Morphometric parameters. Two groups of parameters are presented: geometric parameters that characterize cell shape and geometrical orientation-area, perimeter, and the major and minor axes of the fitted ellipse. The other type comprises dimensionless shape coefficients that assess the deviation of a cell from a perfect circle and its geometric compactness. Collectively, these features provide an objective basis for comparative analysis of cell populations under normal and pathological conditions.
2.3. Manual Processing and Validation
To validate the automatic segmentation and morphometric calculations, we used 10 brightfield images from each available human breast cancer cell line: MDA-MB-231 (high metastatic potential, triple-negative phenotype) and MCF-7 (low metastatic potential, luminal phenotype). The contours of 54 cells were manually traced using ImageJ software (version 1.54; National Institutes of Health, Bethesda, MD, USA).
Processing of microphotographs was carried out in the ImageJ program, where an individual contour was manually created for each cell by tracing its boundaries on the digital image. For each selected contour, morphological parameters (Table 1) for manual annotations were calculated using the built-in “Measure” function in ImageJ.
The values obtained for each cell were exported to a spreadsheet for subsequent statistical processing and comparative analysis with the values obtained by the module.
2.4. Statistical Analysis
To assess the accuracy of the automatic analysis, we used the mean deviation, calculating the mean absolute deviation:
- MRD—final indicator, which shows how much, on average, automatic measurements deviate from manual ones;
- n—total number of pairs of comparisons;
- Xauto—value, obtained by automatic method;
- Xmanual—value, obtained by manual method.
For statistical analysis of the results, a two-sample Student’s T-test was used: unpaired, for independent samples [20]. During the experiment, we compared the mean values of morphological parameters between two groups of cells—the highly metastatic line MDA-MB-231 and the low-metastatic line MCF-7. For each parameter, we calculated the arithmetic mean and standard deviation and then applied the t-test to test the hypothesis of equality of means between the two groups. The null hypothesis (no difference) was rejected at p > 0.05.
3. Results
3.1. The Development of an Analytical Module
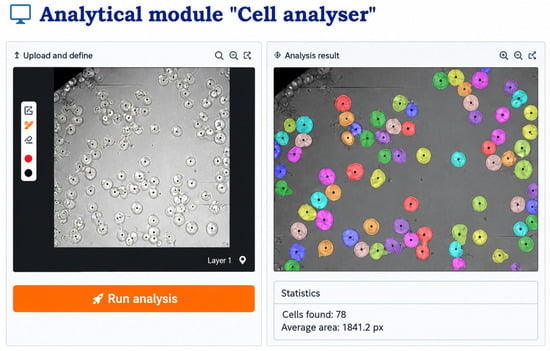
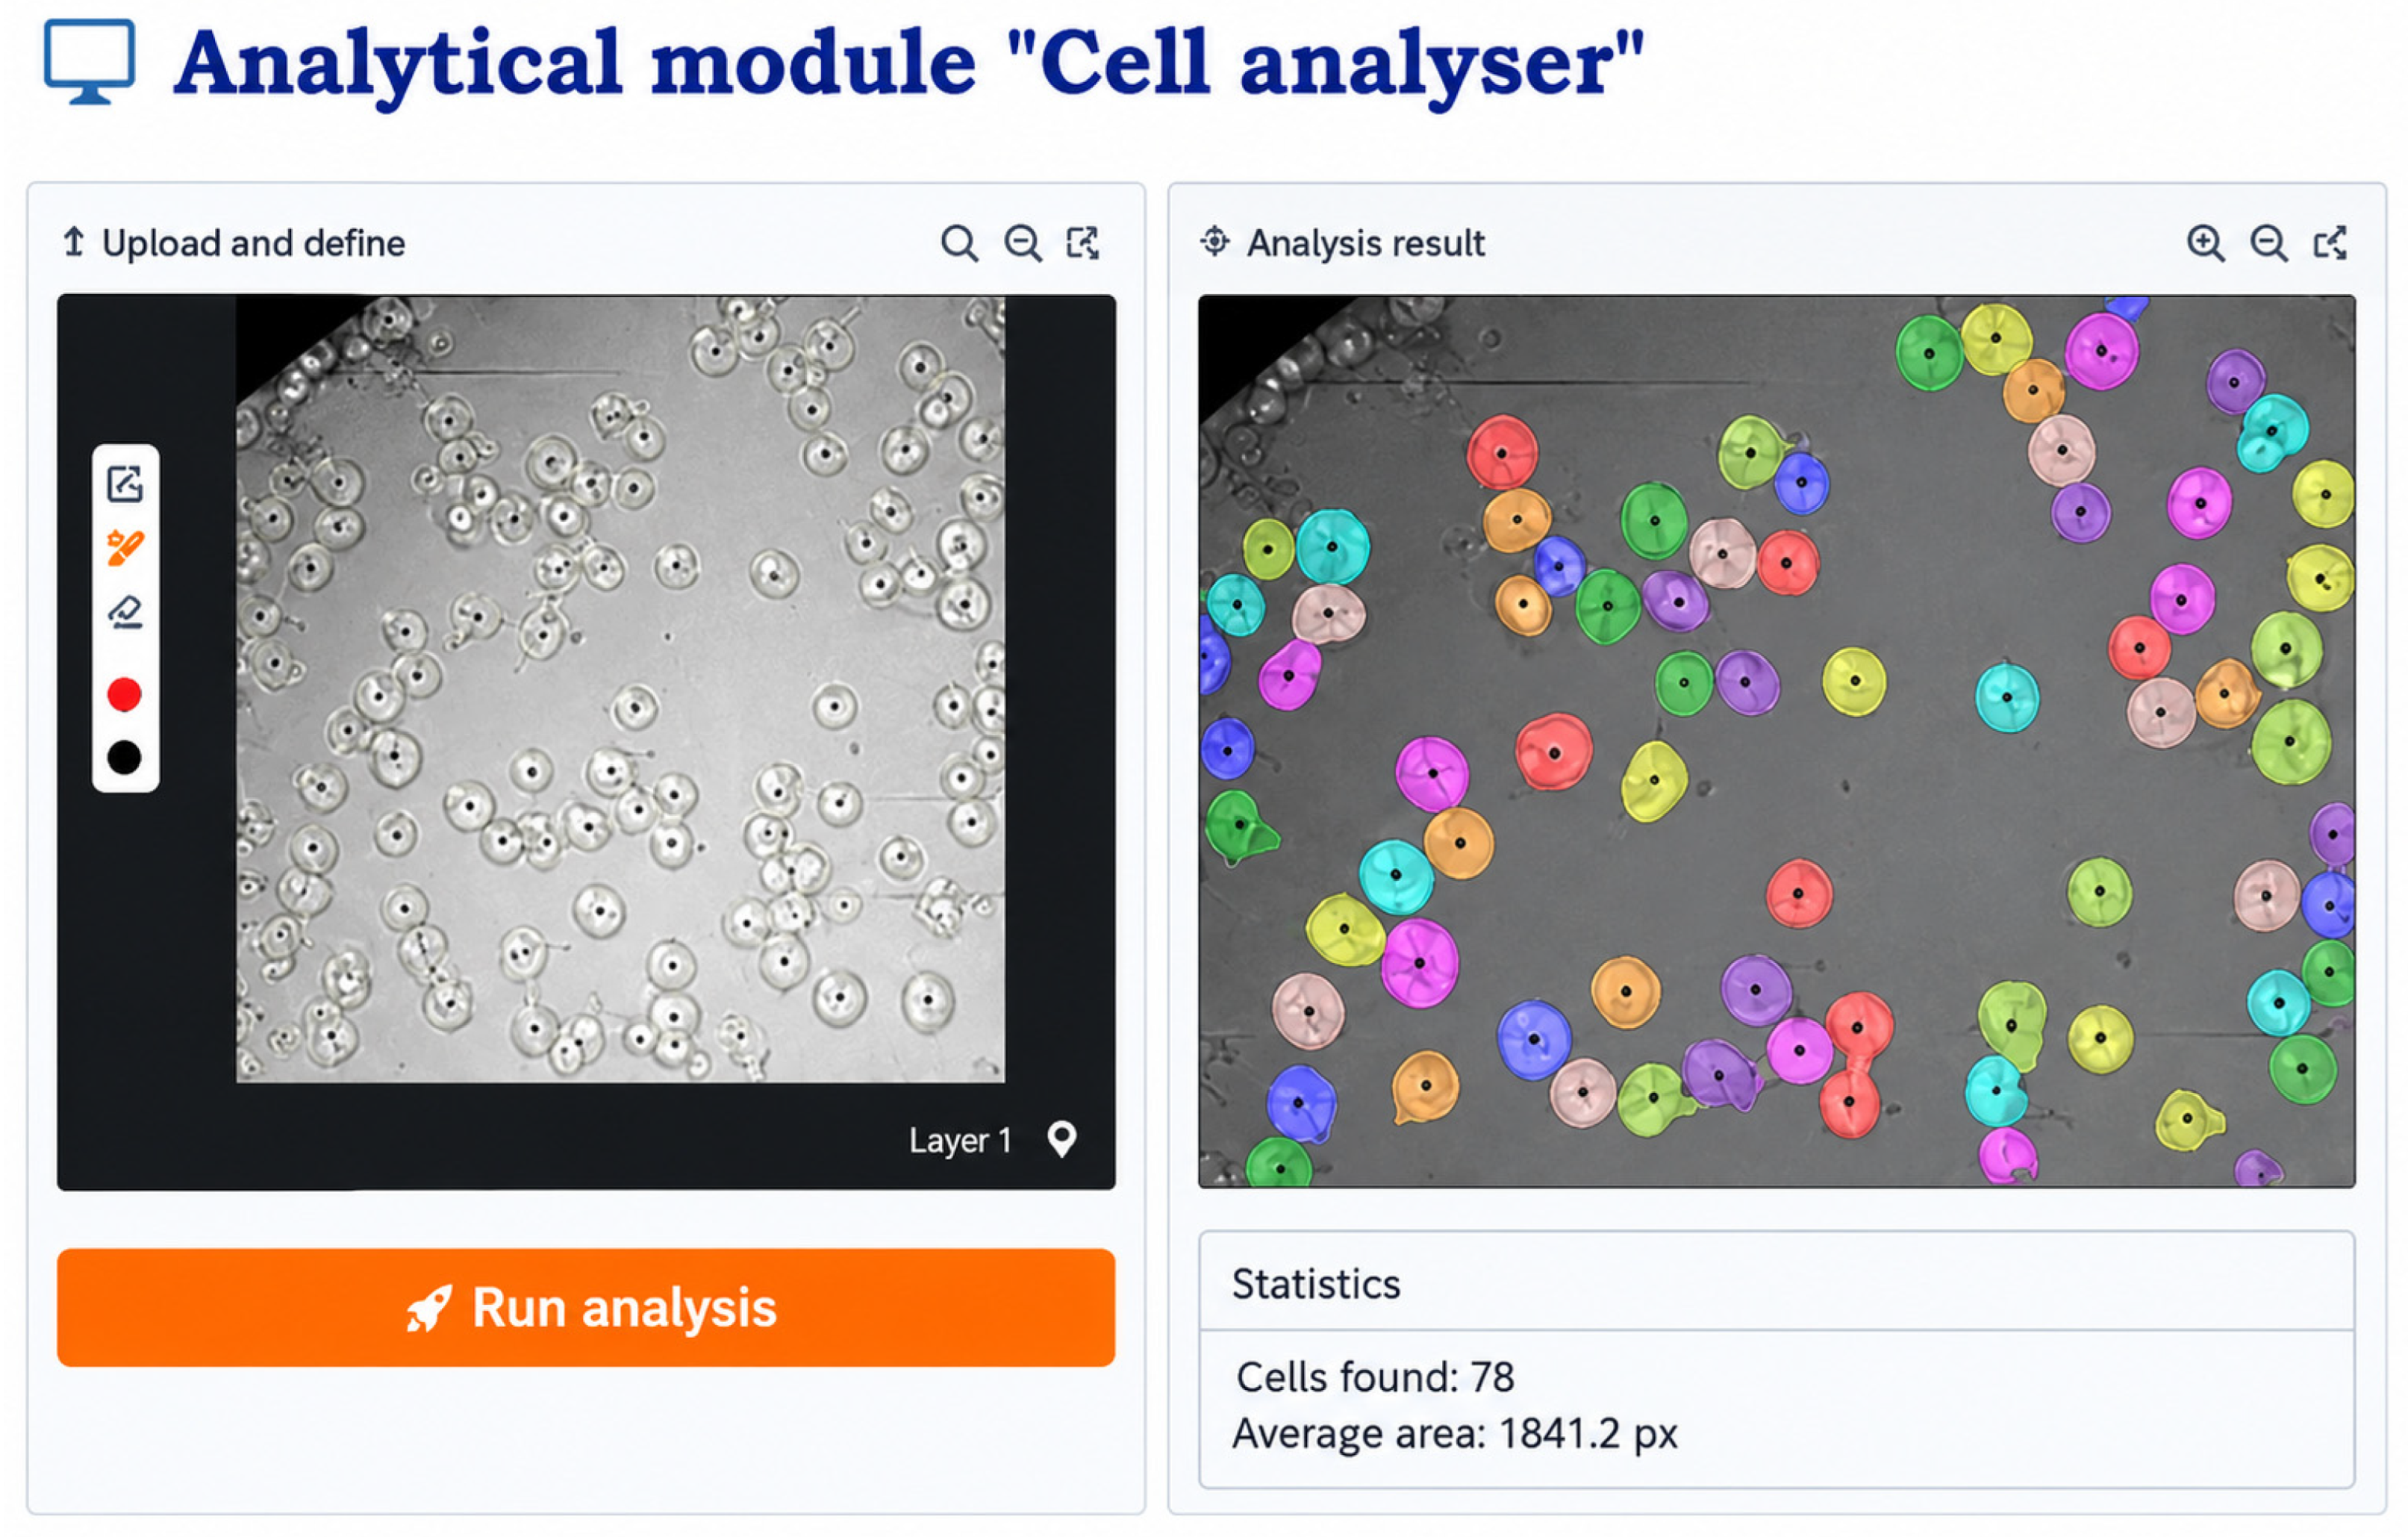
An analytical module that performs automatic cell segmentation on microscopic images with a user-friendly interface was developed (Figure 3). The module includes a manual correction feature that allows users to refine the detected contours when necessary, enabling 100% accuracy while maintaining high analysis speed. Thus, the combination of automated and manual modes provides researchers with a flexible tool that combines the efficiency of machine learning with the reliability of expert validation.
Figure 3.
The “Cell analyzer” module is designed for automated and manual analysis of cellular images. The original photograph is loaded into the right window, and after analysis is run, a binary mask map highlighting the detected cells appears in the left window. Each colored region represents an individual cell identified by the algorithm. The left panel provides manual correction tools: a brush for adding cells, an eraser for removing them, and a size adjuster. At the bottom of the interface, contour metrics such as area and perimeter of each detected object are displayed.
3.2. Cell Segmentation and Morphological Parameters Calculation
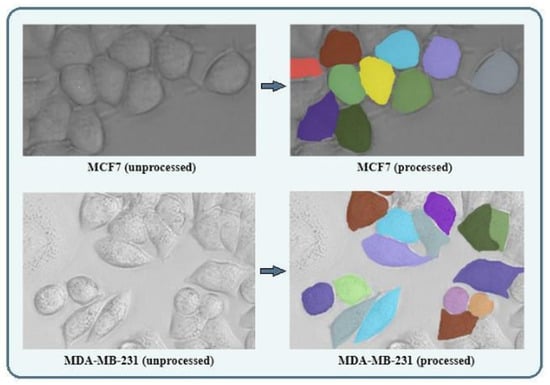
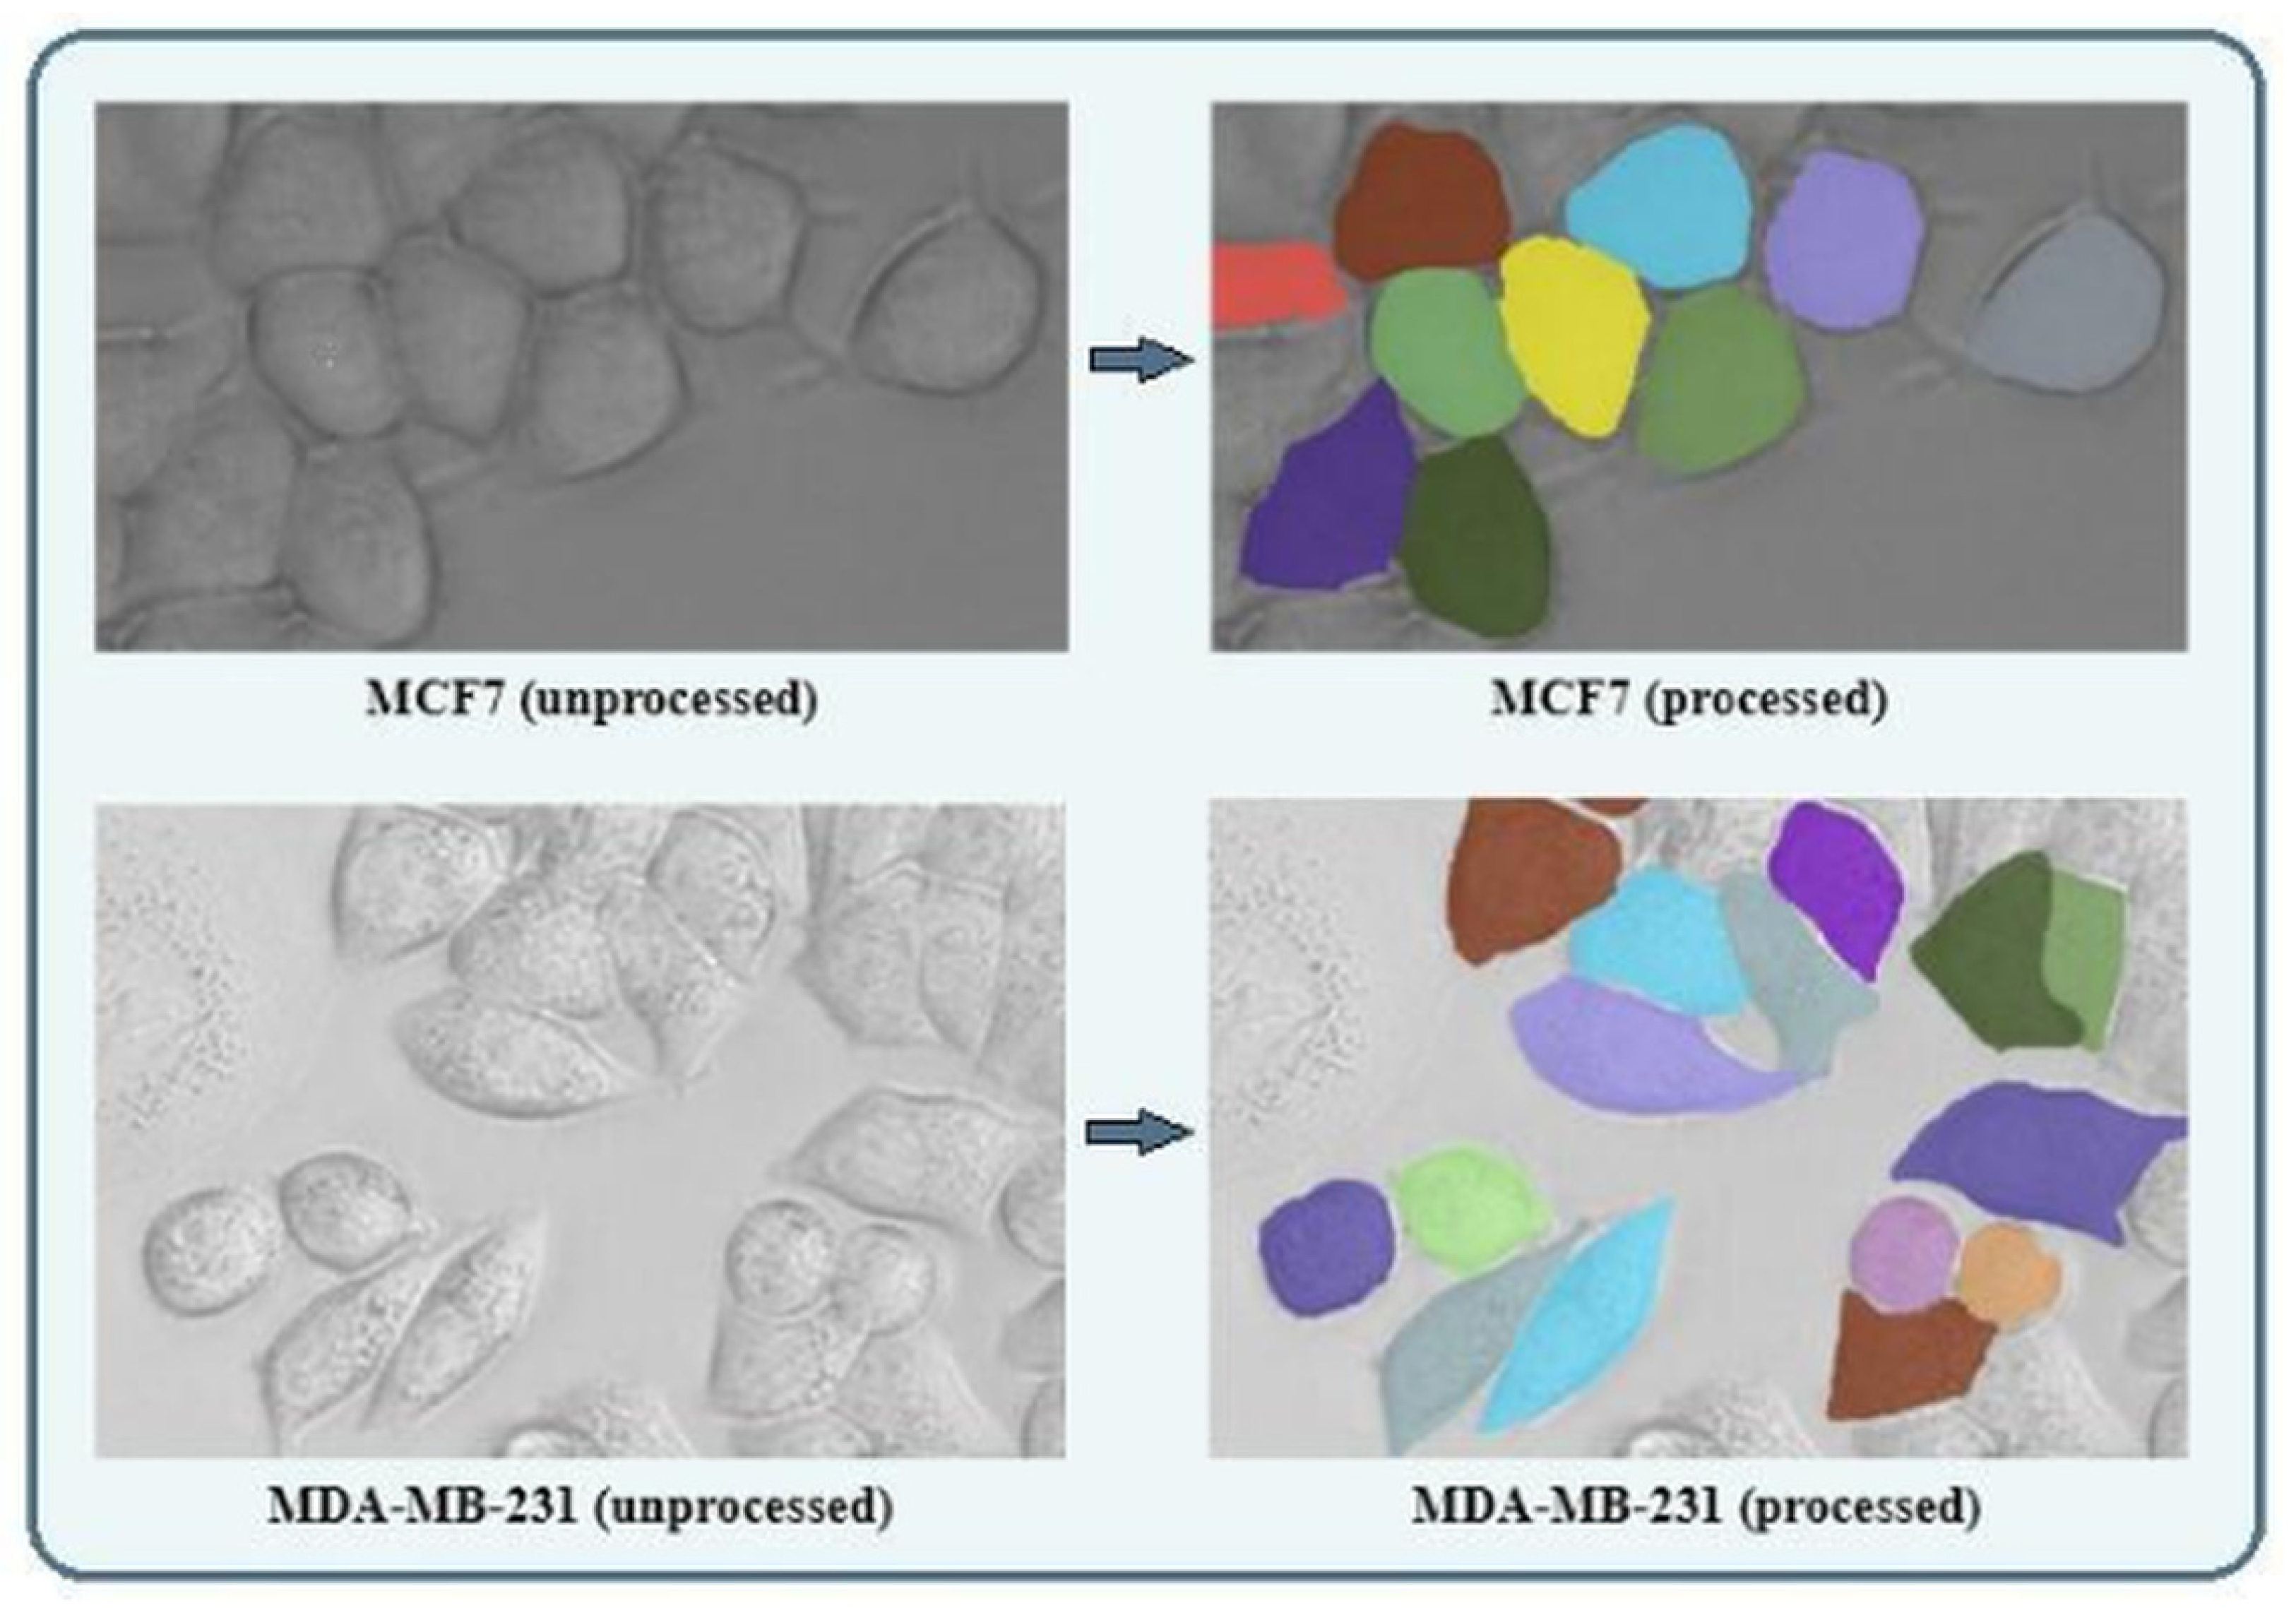
The cell recognition accuracy of the Omnipose neural network reached 82%, confirming the high reliability of the approach. To further enhance the accuracy, the manual segmentation mask correction feature has been added to the module; it allows users to adjust the segmentation mask by individually refining automatically detected cell contours when necessary. The resulting binary masks are overlaid onto the original brightfield images, allowing visual assessment of how accurately the automatically generated contours match the actual cell boundaries (Figure 4).
Figure 4.
Representative brightfield images analyzed in this study: original images of MCF7 cells (low metastatic potential, upper panel) and MDA-MB-231 cells (high metastatic potential, lower panel). On the right, the same images are shown after automatic segmentation by the Omnipose neural network. Each detected cell is assigned a colored binary mask by the algorithm for more convenient visual representation, after which the morphometric parameters are calculated. Scale bar = 75 µm.
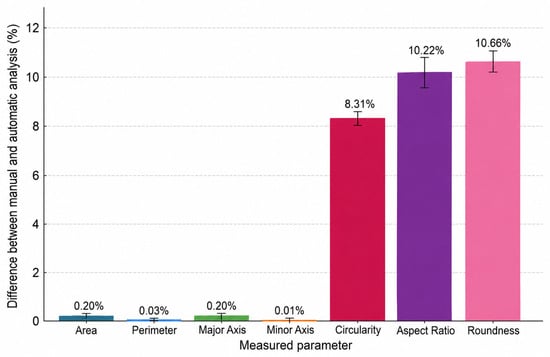
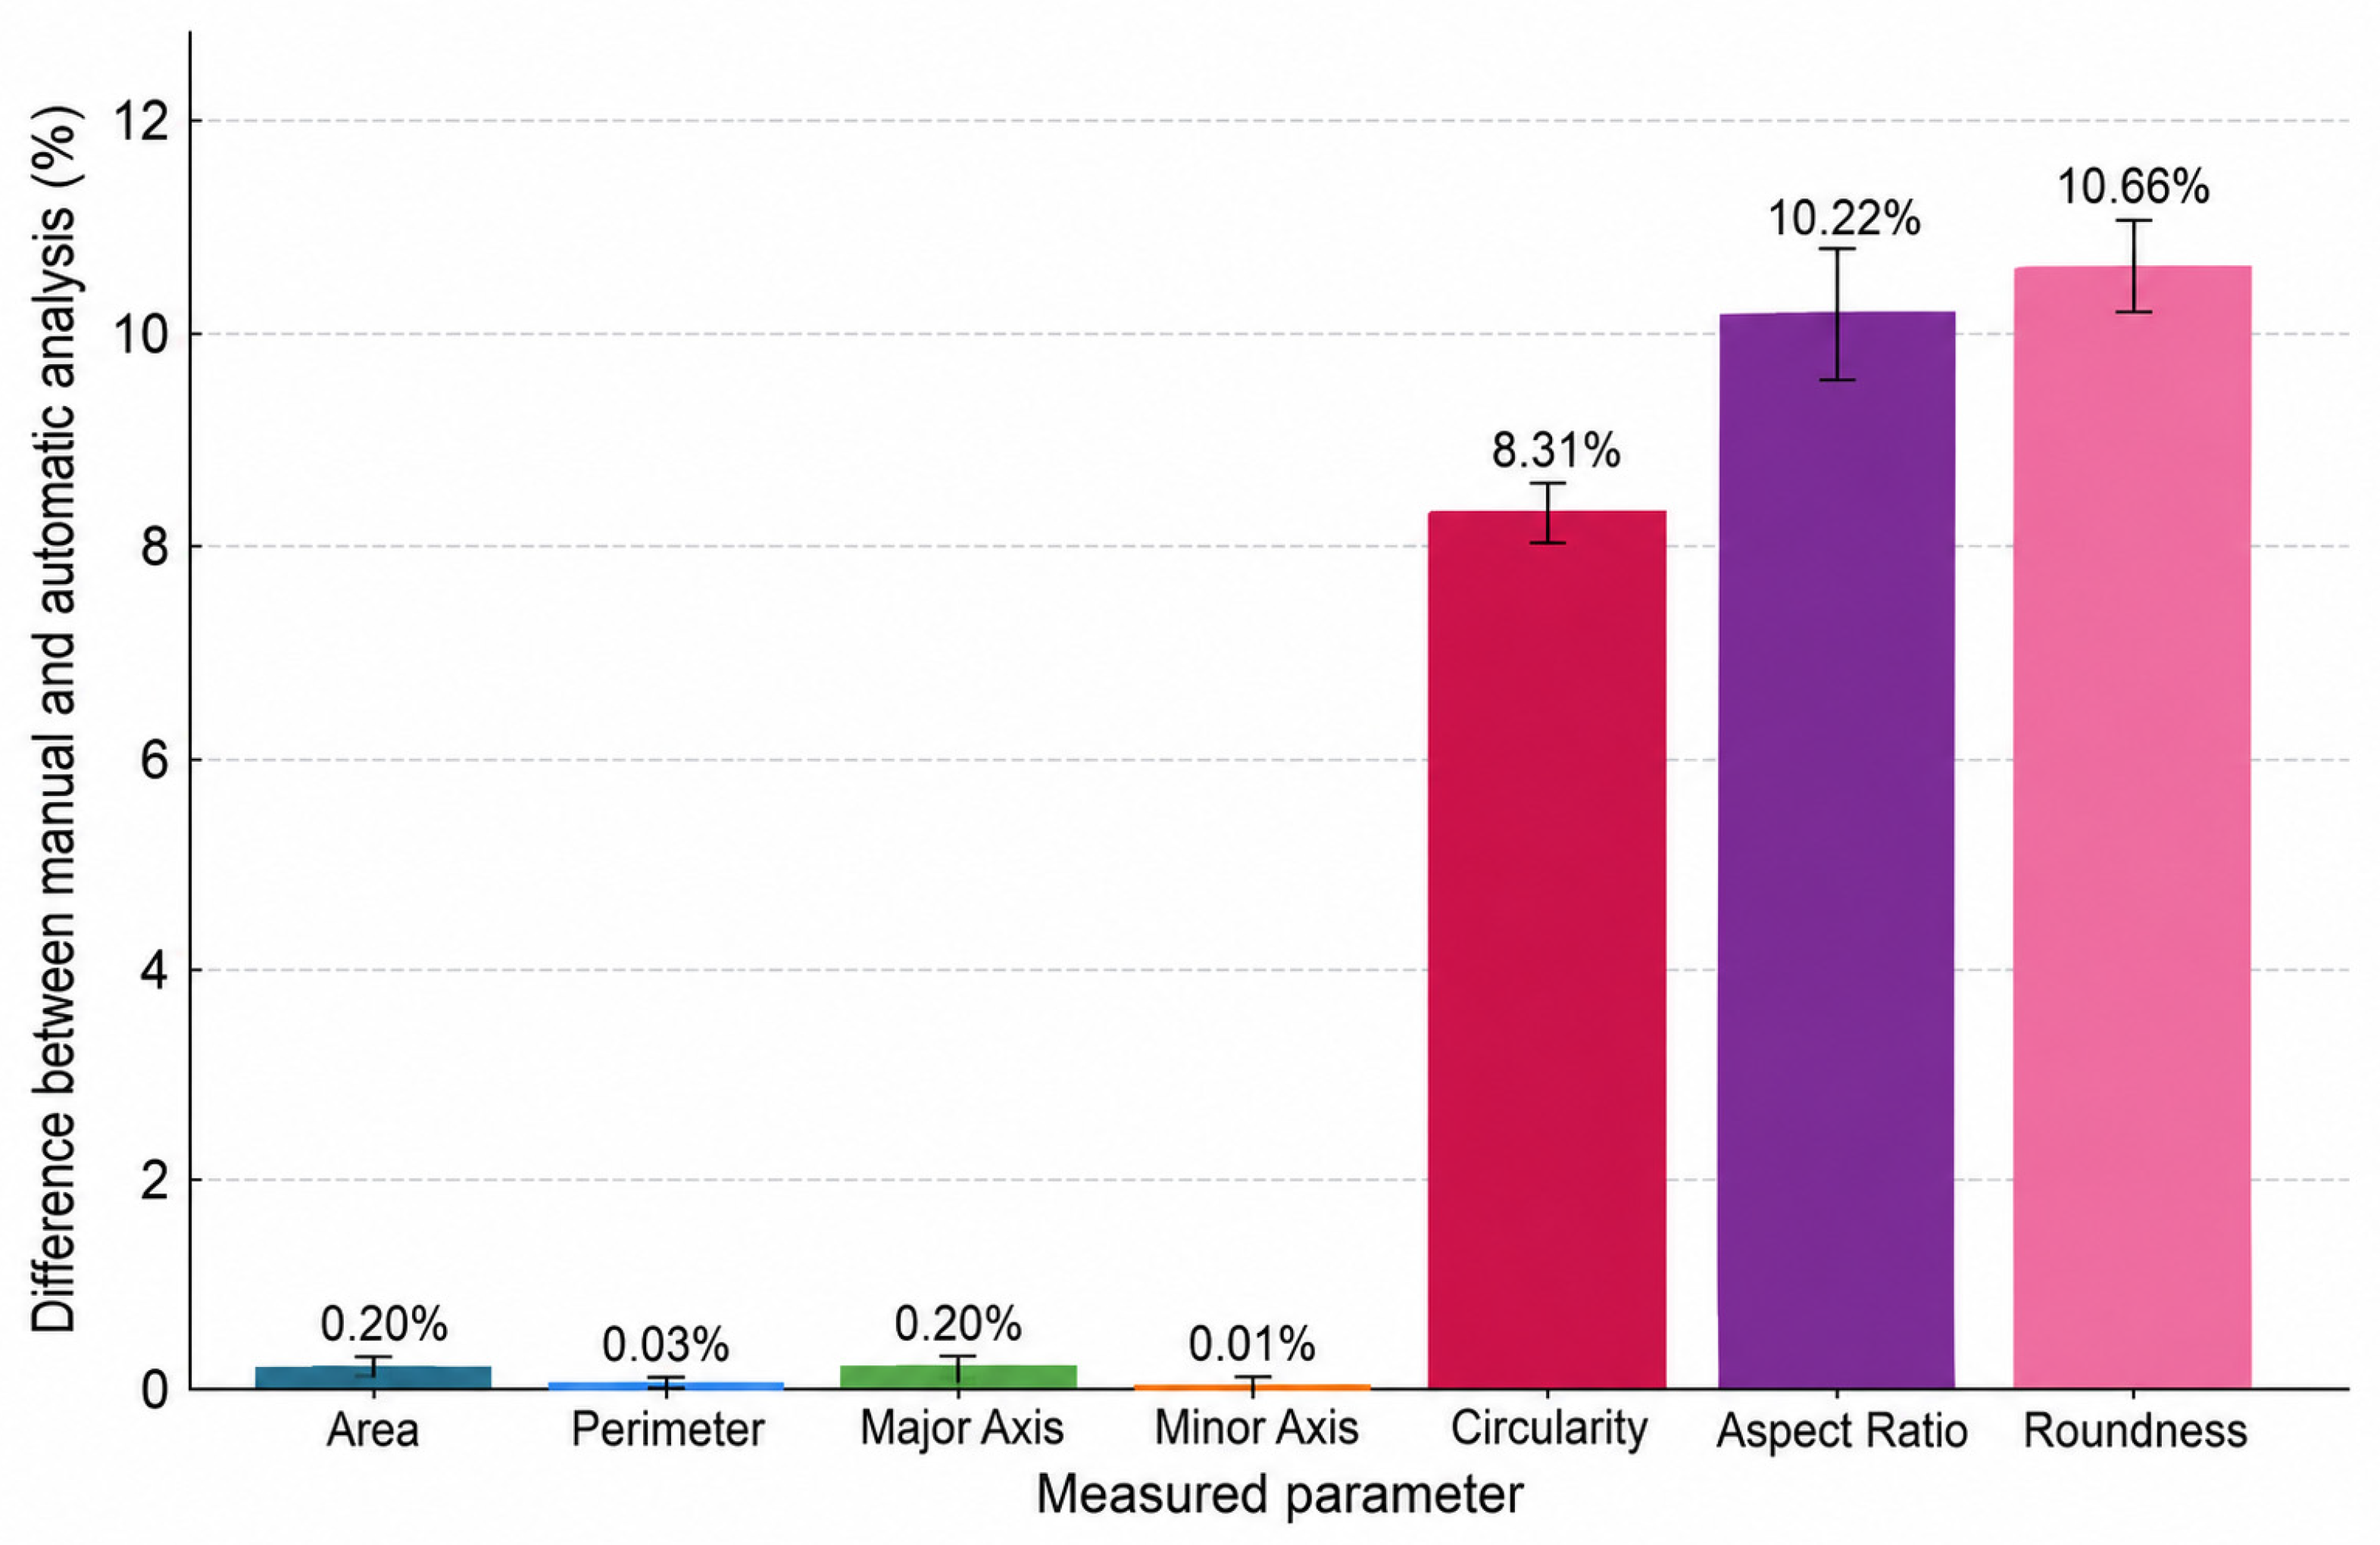
To evaluate the accuracy of the module, a comparative analysis was conducted between the cells automatically segmented by the module and the cells found during manual segmentation by an expert. For dimensional parameters (area, perimeter, major and minor axes), no deviation between manual and automatic measurements was observed. Shape parameters (circularity, aspect ratio, roundness) showed a variability up to 10.7% between automatic and manual measurements (Figure 5). This can be explained by the high sensitivity of these indicators to variations in the cell contour—even minor differences in boundary tracing can lead to noticeable changes in these parameters. Nevertheless, the obtained deviation values are within acceptable limits for biological research.
Figure 5.
Comparison of manual and automated cell image analysis. Percentage differences between manual and automated measurements are shown for cell area, perimeter, major axis, minor axis, circularity, aspect ratio, and roundness. Automatic measurements are normalized to 100%. Error bars are standard errors for 54 evaluated cells. For dimensional parameters, no statistically significant differences between the methods were detected (p > 0.05), whereas for dimensionless shape parameters (circularity, aspect ratio, roundness), statistically significant differences were found (p < 0.01).
3.3. Morphological Differences Between the High- and Low-MP Cells
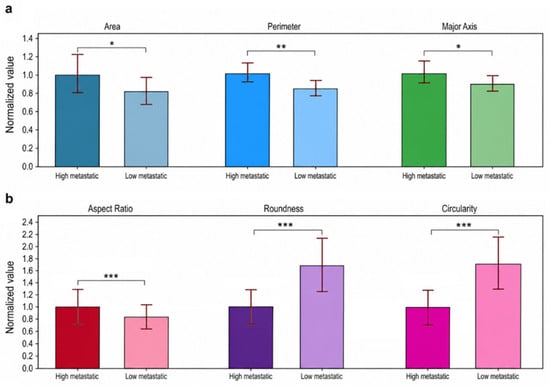
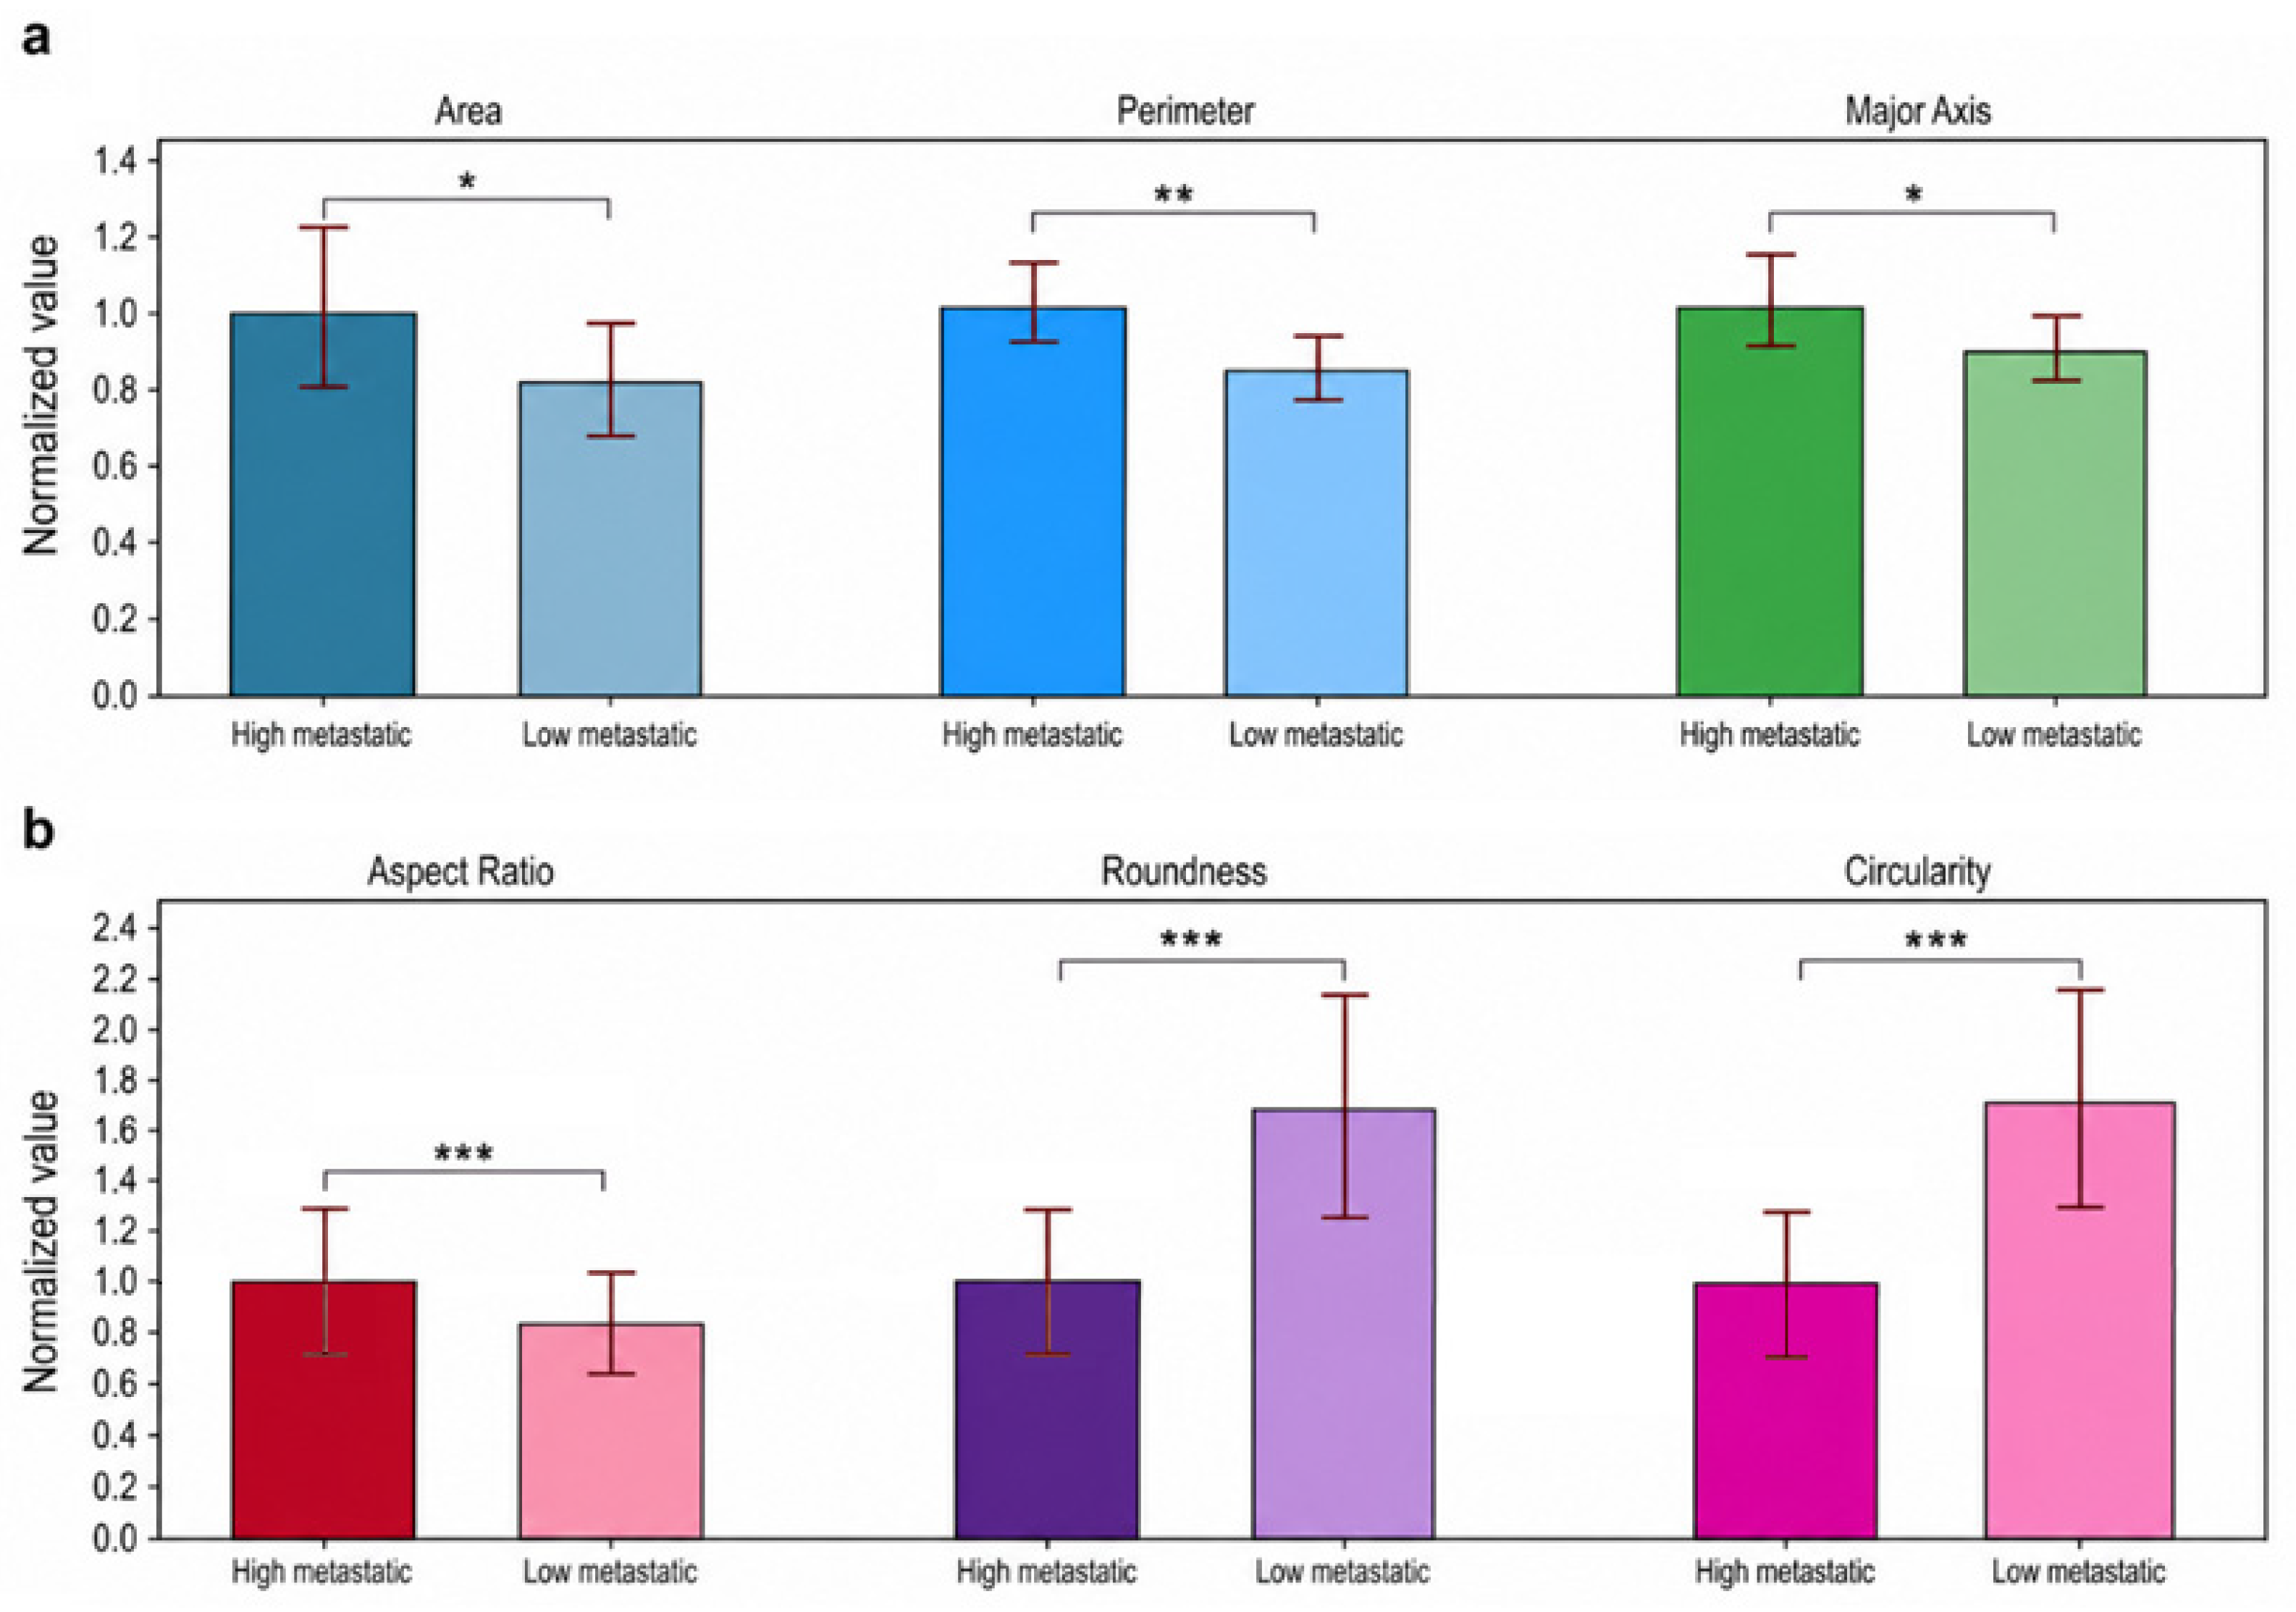
To select the parameters most sensitive to the transition to the invasive phenotype and identify features associated with invasiveness, normalized comparison plots were generated between cell lines with high and low metastatic potential. Although a clear trend toward increased area, perimeter, and major axis was observed in cells with high MP (Figure 6a), the dimensionless parameters-roundness, aspect ratio, and circularity-proved to be considerably more sensitive to MP differences (p < 0.001) (Figure 6b). The aspect ratio of high-MP cells was significantly higher than that of low-MP cells; however, roundness and circularity were decreased. This analysis aims to determine whether dimensionless shape descriptors, such as aspect ratio and circularity, can serve as reliable indicators for predicting metastatic behavior.
Figure 6.
The normalized mean values of (a) geometric parameters—area, perimeter, and major axis and (b) dimensionless shape parameters—aspect ratio, roundness, and circularity—for breast cancer cell lines with high metastatic potential (MDA-MB-231) and low metastatic potential (MCF-7). Error bars—are standard errors for 21 high-MP cells and 33 low-MP cells. The statistical difference is: *—p < 0.05, **—p < 0.01, ***—p < 0.001.
4. Discussion
The segmentation pipeline was based on the Omnipose architecture, which has been successfully applied to cell image analysis, demonstrating high segmentation accuracy for objects with complex morphology and dense cell populations [14]. An important advantage of the developed approach is the ability to work with standard brightfield images without the need for fluorescent staining, which simplifies sample preparation and reduces research costs. The developed automated morphometric analysis module significantly reduces image processing time compared to manual segmentation. Despite the high quality of automatic segmentation (82%), the algorithm still produces two types of errors: it may miss some cells and falsely detect non-cellular objects as cells. Therefore, at the current stage, expert supervision cannot be completely excluded: the specialist is required to manually verify all segmented boundaries, remove false positives, and add missing cell contours to ensure the correctness of the final data. Therefore, a manual correction function was incorporated into the software, which remains considerably faster than traditional manual analysis.
The greatest differences between automatic and manual measurements (8–11%) were observed for dimensionless shape descriptors (roundness, aspect ratio, circularity), whereas for dimensional parameters (area, perimeter, axis lengths) no difference was observed. This is consistent with published data: deviations of 6% for automated cell counting in HT29 cells and 17% for Kc167 cells were reported, while inter-operator variability reached 11% and 16%, respectively [21], confirming the greater variability of subjective assessments of complex morphological parameters.
Although automated measurements of shape descriptors show some deviation from manual analysis (differences less than 11%), the obtained results remain valid, since these errors are substantially smaller than the phenotypic differences between mesenchymal and epithelial cells [21,22,23]. Both cell lines—MDA-MB-231 and MCF-7—originate from mammary carcinoma and thus have epithelial origin [24]. However, as a result of tumor progression, they have acquired fundamentally different phenotypes: MCF-7 retains an epithelial, organoid-type growth pattern with tight cell–cell junctions, whereas MDA-MB-231 exhibits a mesenchymal, spindle-shaped phenotype with loss of polarity and increased migratory activity [25]. Morphologically, MCF-7 cells form rounded, well-organized colonies with distinct boundaries, while MDA-MB-231 cells have an elongated, fibroblast-like shape, tend to migrate individually, and are characterized by reduced circularity and increased aspect ratio [5]. These differences are associated with alterations in actin cytoskeleton organization accompanying epithelial–mesenchymal transition (EMT): MDA-MB-231 cells show a >95% reduction in E-cadherin expression and a >10-fold increase in vimentin levels compared to MCF-7 cells [24]. E-cadherin maintains epithelial morphology by providing cell–cell contacts and polarity, whereas vimentin reorganizes the cytoskeleton, conferring a spindle-shaped morphology and enhanced migratory capacity [26,27]. In our study, the differences in three dimensionless shape parameters—circularity, aspect ratio, and roundness—between MDA-MB-231 and MCF-7 exceeded 20%, reflecting functional divergence associated with the acquisition of an invasive phenotype [4,6]. Previously, we have shown that highly metastatic MDA-MB-231 cells demonstrate increased encapsulation efficiency of 200 nm carboxylated fluorescent nanoparticles by 40% compared to low-metastatic MCF-7 cells, and thus, increased invasive potential [9]. Similarly, cell invasiveness assessed by Boyden chambers coated with Matrigel of MDA-MB-231 cells was 49% higher than for MCF-7 [28,29], confirming a direct link between mesenchymal morphology, high aspect ratio, and invasive capacity. Thus, the technical variability of automated measurements (<11%) does not compromise the ability to distinguish phenotypes with high and low invasive potential, since the biological differences between them are several-fold greater than the measurement error.
Future studies should evaluate the robustness of the identified morphological descriptors under different microenvironmental conditions, including variations in matrix stiffness, surface topography, extra-cellular matrix composition, and 3D culture systems, to determine the extent to which morphology-based discrimination of cell phenotypes is preserved across different culture conditions. Concurrently, future development of the system will focus on expanding the training dataset and fine-tuning the neural network model to improve the accuracy of automatic cell boundary detection.
5. Conclusions
In this work, an analytical module that transforms Omnipose from a segmentation tool into a platform for direct morphometric analysis of brightfield microscopic images has been developed. Comparison of automatic and manual measurements of two breast cancer lines confirmed the high accuracy of the module. The module successfully revealed statistically significant morphological differences between the highly metastatic MDA-MB-231 and the low-metastatic MCF-7, consistent with their invasive phenotypes. The developed solution requires no special image preprocessing, cell staining, or retraining of the neural network, making it a convenient and accessible tool for quantitative assessment of metastatic potential in experimental oncology.
Author Contributions
Conceptualization, A.D. and Y.M.; methodology, A.D.; software, A.D.; validation, A.D., M.P. and S.L.; formal analysis, A.D. and M.P.; investigation, M.P. and S.L.; resources, S.L.; data curation, M.P. and S.L.; writing—original draft preparation, A.D.; writing—review and editing, Y.M., M.P. and S.L.; visualization, A.D.; supervision, Y.M. and S.L.; project administration, M.P. All authors have read and agreed to the published version of the manuscript.
Funding
This work was supported by the Ministry of Science and Higher Education of the Russian Federation 075-03-2026-305 (project No. FSMG-2026-0018).
Data Availability Statement
Data are contained within the article.
Acknowledgments
AI (DeepSeek-V3) was used in the development of a module for technical consultation and quick coding, and ChatGPT (OpenAI, San Francisco, CA, USA; GPT-5.5) was used for the purposes of editing and manuscript structuring. The authors have reviewed and edited the output and take full responsibility for the content of this publication.
Conflicts of Interest
The authors declare no conflicts of interest.
References
- Bray, F.; Laversanne, M.; Sung, H.; Ferlay, J.; Siegel, R.L.; Soerjomataram, I.; Jemal, A. Global Cancer Statistics 2022: GLOBOCAN Estimates of Incidence and Mortality Worldwide for 36 Cancers in 185 Countries. CA Cancer J. Clin. 2024, 74, 229–263. [Google Scholar] [CrossRef] [Scilit] [PubMed]
- Chaffer, C.L.; Weinberg, R.A. A Perspective on Cancer Cell Metastasis. Science 2011, 331, 1559–1564. [Google Scholar] [CrossRef] [Scilit] [PubMed]
- Cristofanilli, M.; Budd, G.T.; Ellis, M.J.; Stopeck, A.; Matera, J.; Miller, M.C.; Reuben, J.M.; Doyle, G.V.; Allard, W.J.; Terstappen, L.W.M.M.; et al. Circulating Tumor Cells, Disease Progression, and Survival in Metastatic Breast Cancer. N. Engl. J. Med. 2004, 351, 781–791. [Google Scholar] [CrossRef] [Scilit] [PubMed]
- Alizadeh, E.; Castle, J.; Quirk, A.; Taylor, C.D.L.; Xu, W.; Prasad, A. Cellular Morphological Features Are Predictive Markers of Cancer Cell State. Comput. Biol. Med. 2020, 126, 104044. [Google Scholar] [CrossRef] [Scilit] [PubMed]
- Wu, P.-H.; Gilkes, D.M.; Phillip, J.M.; Narkar, A.; Cheng, T.W.-T.; Marchand, J.; Lee, M.-H.; Li, R.; Wirtz, D. Single-Cell Morphology Encodes Metastatic Potential. Sci. Adv. 2020, 6, eaaw6938. [Google Scholar] [CrossRef] [Scilit] [PubMed]
- Friedl, P.; Alexander, S. Cancer Invasion and the Microenvironment: Plasticity and Reciprocity. Cell 2011, 147, 992–1009. [Google Scholar] [CrossRef] [Scilit] [PubMed]
- Paszek, M.J.; Zahir, N.; Johnson, K.R.; Lakins, J.N.; Rozenberg, G.I.; Gefen, A.; Reinhart-King, C.A.; Margulies, S.S.; Dembo, M.; Boettiger, D.; et al. Tensional Homeostasis and the Malignant Phenotype. Cancer Cell 2005, 8, 241–254. [Google Scholar] [CrossRef] [Scilit] [PubMed]
- Pershikova, E.; Kontareva, E.; Ilyina, I.; Alexandrova, A.; Pustovalova, M.; Leonov, S.; Merkher, Y. Hypoxia Triggers Subtype-Specific Membrane Damage and Morphological Changes in Breast Cancer Cell Lines. Eng. Proc. 2026, 124, 73. [Google Scholar] [CrossRef] [Scilit]
- Merkher, Y.; Kontareva, E.; Bogdan, E.; Achkasov, K.; Maximova, K.; Grolman, J.M.; Leonov, S. Encapsulation and Adhesion of Nanoparticles as a Potential Biomarker for TNBC Cells Metastatic Propensity. Sci. Rep. 2023, 13, 12289. [Google Scholar] [CrossRef] [Scilit] [PubMed]
- Lyons, S.M.; Alizadeh, E.; Manninen, J.; Schuamberg, K.; Castle, J.; Schroder, B.; Turk, P.; Thamm, D.; Prasad, A. Changes in cell shape are correlated with metastatic potential in murine and human osteosarcomas. Biol. Open 2016, 5, 289–299. [Google Scholar] [CrossRef] [Scilit] [PubMed]
- Ronneberger, O.; Fischer, P.; Brox, T. U-Net: Convolutional Networks for Biomedical Image Segmentation. In MICCAI 2015; Springer: Cham, Switzerland, 2015; pp. 234–241. [Google Scholar] [CrossRef] [Scilit]
- Schmidt, U.; Weigert, M.; Broaddus, C.; Myers, G. Cell Detection with Star-Convex Polygons. In MICCAI 2018; Springer: Cham, Switzerland, 2018; pp. 265–273. [Google Scholar] [CrossRef] [Scilit]
- Stringer, C.; Wang, T.; Michaelos, M.; Pachitariu, M. Cellpose: A Generalist Algorithm for Cellular Segmentation. Nat. Methods 2021, 18, 100–106. [Google Scholar] [CrossRef] [Scilit] [PubMed]
- Cutler, K.J.; Stringer, C.; Lo, T.W.; Rappez, L.; Stroustrup, N.; Peterson, S.B.; Wiggins, P.A.; Mougous, J.D. Omnipose: A High-Precision Morphology-Independent Solution for Bacterial Cell Segmentation. Nat. Methods 2022, 19, 1438–1448. [Google Scholar] [CrossRef] [Scilit] [PubMed]
- Minaee, S.; Boykov, Y.; Porikli, F.; Plaza, A.; Kehtarnavaz, N.; Terzopoulos, D. Image Segmentation Using Deep Learning: A Survey. IEEE Trans. Pattern Anal. Mach. Intell. 2021, 44, 3523–3542. [Google Scholar] [CrossRef] [Scilit] [PubMed]
- Edlund, C.; Jackson, T.R.; Khalid, N.; Bevan, N.; Dale, T.; Dengel, A.; Ahmed, S.; Trygg, J.; Sjögren, R. LIVECell: A Large-Scale Dataset for Label-Free Live Cell Segmentation. Nat. Methods 2021, 18, 1038–1045. [Google Scholar] [CrossRef] [Scilit] [PubMed]
- Greenwald, N.F.; Miller, G.; Moen, E.; Kong, A.; Kagel, A.; Dougherty, T.; Fullaway, C.C.; McIntosh, B.J.; Leow, K.X.; Schwartz, M.S.; et al. Whole-Cell Segmentation of Tissue Images with Human-Level Performance Using Large-Scale Data Annotation and Deep Learning. Nat. Biotechnol. 2022, 40, 555–565. [Google Scholar] [CrossRef] [Scilit] [PubMed]
- Moen, E.; Bannon, D.; Kudo, T.; Graf, W.; Covert, M.; Van Valen, D. Deep Learning for Cellular Image Analysis. Nat. Methods 2019, 16, 1233–1246. [Google Scholar] [CrossRef] [Scilit] [PubMed]
- Cutler, K.J. Omnipose: High-Precision Cell Segmentation for Diverse Morphologies. GitHub 2022. Available online: https://github.com/kevinjohncutler/omnipose (accessed on 17 March 2026).
- Zar, J.H. Biostatistical Analysis, 5th ed.; Pearson Prentice Hall: Upper Saddle River, NJ, USA, 2010; 944p. [Google Scholar]
- Carpenter, A.E.; Jones, T.R.; Lamprecht, M.R.; Clarke, C.; Kang, I.H.; Friman, O.; Guertin, D.A.; Chang, J.H.; Lindquist, R.A.; Moffat, J.; et al. CellProfiler: Image Analysis Software for Identifying and Quantifying Cell Phenotypes. Genome Biol. 2006, 7, R100. [Google Scholar] [CrossRef] [Scilit] [PubMed]
- Caie, P.D.; Walls, R.E.; Ingleston-Orme, A.; Daya, S.; Houslay, T.; Eagle, R.; Roberts, M.E.; Carragher, N.O. High-Content Phenotypic Profiling of Drug Response Signatures across Distinct Cancer Cells. Mol. Cancer Ther. 2010, 9, 1913–1926. [Google Scholar] [CrossRef] [Scilit] [PubMed]
- McQuin, C.; Goodman, A.; Chernyshev, V.; Kamentsky, L.; A Cimini, B.; Karhohs, K.W.; Doan, M.; Ding, L.; Rafelski, S.M.; Thirstrup, D.; et al. CellProfiler 3.0: Next-Generation Image Processing for Biology. PLoS Biol. 2018, 16, e2005970. [Google Scholar] [CrossRef] [Scilit] [PubMed]
- Neve, R.M.; Chin, K.; Fridlyand, J.; Yeh, J.; Baehner, F.L.; Fevr, T.; Clark, L.; Bayani, N.; Coppe, J.-P.; Tong, F.; et al. A collection of breast cancer cell lines for the study of functionally distinct cancer subtypes. Cancer Cell 2006, 10, 515–527. [Google Scholar] [CrossRef] [Scilit] [PubMed]
- Holliday, D.L.; Speirs, V. Choosing the right cell line for breast cancer research. Breast Cancer Res. 2011, 13, 215. [Google Scholar] [CrossRef] [Scilit] [PubMed]
- Thiery, J.P.; Acloque, H.; Huang, R.Y.J.; Nieto, M.A. Epithelial–Mesenchymal Transitions in Development and Disease. Cell 2009, 139, 871–890. [Google Scholar] [CrossRef] [Scilit] [PubMed]
- Dongre, A.; Weinberg, R.A. New Insights into the Mechanisms of Epithelial–Mesenchymal Transition and Implications for Cancer. Nat. Rev. Mol. Cell Biol. 2019, 20, 69–84. [Google Scholar] [CrossRef] [Scilit] [PubMed]
- Thompson, E.W.; Paik, S.; Brünner, N.; Sommers, C.L.; Zugmaier, G.; Clarke, R.; Shima, T.B.; Torri, J.; Donahue, S.; Lippman, M.E.; et al. Association of Increased Basement Membrane Invasiveness with Absence of Estrogen Receptor and Expression of Vimentin in Human Breast Cancer Cell Lines. J. Cell. Physiol. 1992, 150, 534–544. [Google Scholar] [CrossRef] [Scilit] [PubMed]
- Blick, T.; Widodo, E.; Hugo, H.; Waltham, M.; Lenburg, M.E.; Neve, R.M.; Thompson, E.W. Epithelial Mesenchymal Transition Traits in Human Breast Cancer Cell Lines. Clin. Exp. Metastasis 2008, 25, 629–642. [Google Scholar] [CrossRef] [Scilit] [PubMed]

Disclaimer/Publisher’s Note: The statements, opinions and data contained in all publications are solely those of the individual author(s) and contributor(s) and not of MDPI and/or the editor(s). MDPI and/or the editor(s) disclaim responsibility for any injury to people or property resulting from any ideas, methods, instructions or products referred to in the content. |
© 2026 by the authors. Licensee MDPI, Basel, Switzerland. This article is an open access article distributed under the terms and conditions of the Creative Commons Attribution (CC BY) license.