Abstract
The rapid growth of solar photovoltaic (PV) capacity is increasingly reshaping the operation of electricity systems, particularly in countries where renewable energy already represents a large share of generation. In Albania, where electricity production is strongly dominated by hydropower, increasing solar penetration is expected to affect short-term system behaviour, especially in terms of variability, surplus generation, and ramping dynamics. This study investigates PV integration at the system level using hourly electricity demand data for 2024 together with PV generation profiles scaled to different capacity scenarios. PV scenarios representing installed capacities of 150, 300, and 450 MWp, based on real PV deployment data, are analysed under varying levels of hydropower dominance. The analysis combines net-load modeling, ramping assessment, and a simplified flexibility-oriented mitigation approach to evaluate operational impacts under different hydropower conditions. The results indicate that increasing PV capacity significantly modifies the net-load profile. During summer periods, high solar generation substantially reduces midday net load, creating pronounced net-load valleys, whereas winter conditions remain more strongly influenced by electricity demand. As PV penetration increases, ramping intensity also increases. For example, extreme ramp values (Q99) rise from 80.87 MW/h at 300 MWp to 111.45 MW/h at 450 MWp, while the share of hours with ramp events exceeding 100 MW/h increases from 0.05% to 2.55%. The results of a conceptual flexibility approach that limits ramps to 60 MW/h show that extreme ramp events can be effectively mitigated, while moderate variability is largely unaffected. In summary, the results show that increasing solar PV penetration shifts the main operational challenge in Albania from energy balancing toward flexibility and variability management. The findings are particularly relevant for long-term system planning in hydropower-dominated systems and highlight the growing importance of flexibility measures and surplus management under high PV penetration.
1. Introduction
Renewable energy expansion is increasingly transforming the way power systems operate around the world. In this transition, solar photovoltaic (PV) generation stands out due to its rapid growth, supported by falling technology costs, continued technological improvements, and strong policy-driven decarbonization goals [1,2,3,4]. As a result, PV has become one of the main drivers of new generation capacity additions across Europe and globally. However, the rapid expansion of PV also brings a set of operational challenges.
As solar penetration increases, its variability and intermittency begin to influence system operation more strongly. In addition, the characteristic daily profile of PV generation increasingly affects net-load behaviour [5]. At higher penetration levels, PV is no longer just an additional energy source, but begins to shape system behaviour over the course of the day. In practice, solar generation tends to peak around midday, while electricity demand is usually higher in the evening. This temporal mismatch between supply and demand creates characteristic net-load patterns commonly referred to as the “duck curve”. These patterns are characterized by reduced midday residual demand and steep ramping requirements during sunset periods [6,7,8]. These effects become more pronounced, greatly increasing the need for system flexibility and fast-response balancing resources. Many studies have examined the challenges associated with high PV penetration. Their findings show that system adequacy is becoming increasingly dependent on the ability to manage short-term variability rather than energy balance. Recent studies highlight that surplus energy during high-irradiance periods, increased reliance on curtailment or cross-border exchanges, and intensified ramping requirements are among the primary operational challenges in high-PV systems [9,10,11,12]. Some studies have shown that extreme net-load ramps can happen even when conditions are perfectly predicted, due to the way the system is set up and the high amount of solar energy that gets into it [13,14,15]. Probabilistic approaches have been increasingly adopted to characterize net-load variability and ramping behaviour, moving beyond deterministic representations of the duck curve. Probabilistic net-load distributions and ramp exceedance analysis help quantify the frequency and severity of extreme events. This is important for planning for flexibility and checking the reliability of a system [16,17,18].
Hydropower-dominated power systems represent a distinct and complex context for PV integration. Hydropower has built-in operational flexibility because it can quickly ramp up and, in some cases, store water in reservoirs. This makes it a natural fit with variable renewable energy sources [19,20,21]. However, this flexibility is not unlimited. Hydrological limitations such as reservoir management requirements, and environmental considerations can restrict hydropower’s capacity to completely compensate for PV variability [22,23,24]. Under conditions of high solar generation and strong hydropower availability, the combined output of PV and hydropower can be more than what is needed, which means that extra energy needs to be managed through curtailment, exports, or increased system flexibility [25,26,27]. High PV penetration affects not only energy balance but also short-term net-load dynamics. Variations in solar output, especially under cloudy conditions, tend to increase ramping requirements and can place additional stress on system operation [28,29,30]. Hydropower can help with some of this variability, but new research shows that it may not be enough to handle extreme ramping events in systems with limited thermal generation or limited interconnections [31,32,33]. These findings show how important it is to have extra flexible resources, such as energy storage and demand-side response.
Albania represents a relevant and timely case study for investigating the system-level impacts of increasing solar photovoltaic (PV) penetration. Hydropower is the main source of electricity in the country, making up most of the electricity generation. In normal years, hydropower makes up about 65–75% of annual production, but in wet years it can make up more than 80% and in dry years it can drop to 50–65% [34,35]. Hydropower makes up almost 95% of the total generation portfolio in terms of installed capacity, the system depends primarily on water conditions. Albania is also quickly moving toward solar PV deployment. Since 2020, installed PV capacity has increased significantly. Examples include the Karavasta (140 MW) and Spitalla (100 MW) projects, together with an increasing number of smaller installations. The International Renewable Energy Agency (IRENA) says that by the end of 2024, total installed PV capacity will have reached about 307 MW, and by 2030, it is expected to rise to about 1.07 GW. Also, the evolution of installed PV capacity in Albania is illustrated in Figure 1.
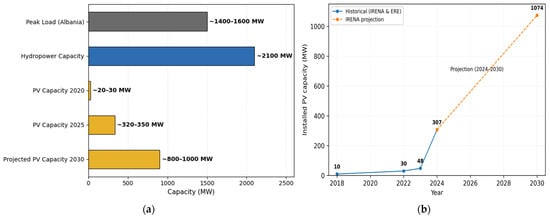
Figure 1.
(a) Solar PV capacity growth in Albania compared to peak load and hydropower capacity. (b) Evolution of installed solar photovoltaic (PV) capacity in Albania (based on IRENA data, 2018 to 2024, and projected expansion toward 2030) [36,37,38,39,40,41].
The Albanian electricity system also relies heavily on cross-border electricity trade. Albania imports electricity during dry years and exports electricity during wet years because the water cycle changes. In 2024, electricity imports made up about 30% of domestic production and about 33% of total consumption. Figure 2 illustrates electricity imports as a share of domestic production in Albania, highlighting the increasing role of cross-border exchanges under varying hydrological conditions.
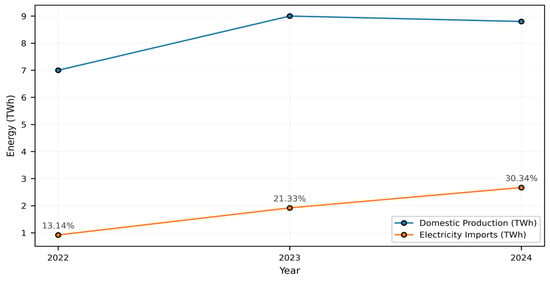
Figure 2.
Electricity imports and domestic production in Albania (2022–2024) [38,41].
The Albanian electricity system is strongly dominated by hydropower, which accounts for the majority of domestic electricity generation. In typical years, hydropower contributes approximately 65–75% of annual production, while in wet years this share can exceed 80% and in dry conditions may fall to 50–65%. In terms of installed capacity, hydropower represents nearly 95% of the total generation portfolio, highlighting the system’s strong dependence on hydrological conditions. At the same time, Albania has experienced a rapid increase in solar PV deployment, particularly after 2020, driven by large-scale projects and distributed generation. PV currently contributes approximately 3–5% of annual electricity generation, with further growth expected in the near future. Electricity trade plays a critical role in balancing the system. Due to hydrological variability, Albania alternates between export-oriented operati on during wet years and import dependence during dry conditions. Recent data indicate that electricity imports reached approximately 1.92 TWh in 2023 and increased to around 2.67 TWh in 2024, corresponding to about 21% and 30% of domestic production, respectively. These values highlight the strong interannual variability of the system and confirm that cross-border exchanges are an essential balancing mechanism. While imports and exports provide a degree of operational flexibility, increasing PV penetration is expected to alter the timing and magnitude of surplus conditions, particularly during midday hours [36,37,38,39,40,41].
The evolution of electricity imports relative to domestic production and total consumption in Albania during 2022–2024 is summarized in Table 1.

Table 1.
Electricity imports relative to domestic production and total consumption in Albania (2022–2024) [36,37,38,39,40].
Previous studies have investigated renewable energy transition and flexibility challenges in Balkan and hydropower-dominated power systems, particularly under increasing renewable penetration and growing operational variability. Existing research has mainly focused on policy development, renewable energy transition, hydropower flexibility, forecasting methods, electricity market operation, or optimization-based dispatch strategies. However, fewer studies provide a combined assessment of surplus generation, net-load variability, and ramping behavior under varying hydrological conditions using high-resolution operational data. In addition, planning-level flexibility assessment in small hydropower-dominated systems such as Albania remains comparatively limited in the existing literature [42,43,44].
Although the literature on PV integration is extensive, relatively few studies simultaneously consider surplus energy, net-load dynamics, and ramping behaviour in hydropower-dominated systems using high-resolution operational data. Many existing works focus on forecasting accuracy, distribution-level constraints, or optimization-based dispatch, while fewer studies explicitly quantify the combined effects of PV penetration and hydropower dominance from a system-level perspective. The novelty of this work lies in the combined assessment of surplus generation, net-load dynamics, and ramping behavior under different hydropower dominance conditions using high-resolution operational data for Albania. Unlike many existing PV integration studies that mainly focus on forecasting accuracy, optimization, or distribution-level impacts, this study evaluates how increasing PV penetration affects short-term system flexibility requirements in a hydro-dominated power system. The analysis also introduces a simplified flexibility-oriented ramp mitigation framework intended for planning-level assessment. In this context, the present study provides a comprehensive assessment of solar PV integration in Albania’s electricity system. Using hourly electricity demand data from the ENTSO-E Transparency Platform and PV generation profiles from PVGIS, a set of progressive PV penetration scenarios (150, 300, and 450 MWp) is evaluated under varying conditions of hydropower dominance. The analysis concentrates on net-load behaviour, surplus energy occurrence, and short-term ramping dynamics. A conceptual storage-based ramp-capping approach is introduced to evaluate the mitigation of extreme ramping events without relying on detailed technology-specific modeling. Overall, the results offer quantitative insight into surplus risk, ramp severity, and flexibility requirements, which can support more effective predictive energy management.
2. Materials and Methods
The methodological framework was used to evaluate high solar PV penetration in Albania’s electricity system and to quantify potential surplus and ramping challenges under different hydropower dominance conditions. The overall methodological framework adopted in this study is illustrated in Figure 3. The workflow integrates load data from ENTSO-E with scaled photovoltaic scenarios to construct net-load profiles and evaluate the resulting ramping dynamics:
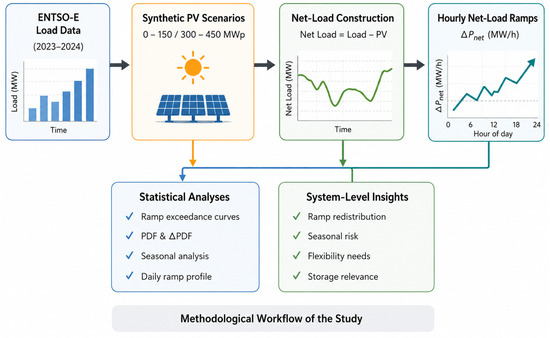
Figure 3.
Methodological workflow for PV integration analysis, including data preprocessing, PV scaling, net-load construction, and ramp and surplus evaluation.
The analysis follows a sequential workflow consisting of: (i) data preprocessing and temporal alignment, (ii) generation of scaled PV scenarios, (iii) construction of net-load time series, (iv) calculation of ramping metrics, and (v) statistical analysis of variability and extreme events. This workflow enables a systematic evaluation of surplus generation, net-load dynamics, and flexibility requirements under increasing PV penetration and varying hydropower dominance conditions. The methodological framework also allows the comparison of seasonal behaviour and the identification of extreme ramping events under different operating scenarios.
2.1. Electricity Demand Data (ENTSO-E)
The ENTSO-E Transparency Platform gave us hourly electricity demand data for Albania. This platform gives us standardized operational data for all European power systems. The dataset includes actual total load and corresponding day-ahead load forecasts, originally reported at 15 min resolution. To make sure the data was consistent with the PV generation profiles and the analysis that followed, we averaged the values within each hour to get hourly resolution. Hourly resolution was selected to ensure consistency with the PVGIS-based generation profiles and to support planning-level assessment of system-scale variability and flexibility requirements. Although short-duration intra-hour fluctuations may not be fully captured, hourly resolution remains widely used for large-scale net-load and flexibility analysis. The resulting dataset covers the whole year of 2024, including the leap day, a total of 8784 hourly observations. All ENTSO-E demand data were accessed between November and December 2025 through the ENTSO-E Transparency Platform. The original time series were reported in UTC and consistently processed at hourly resolution. No significant missing values were identified in the final dataset after temporal aggregation and alignment. ENTSO-E data is very reliable and consistent as a platform for reference for power system analysis [45].
2.2. Solar PV Generation Profiles (PVGIS–ERA5)
Hourly solar PV generation profiles were derived using the PVGIS platform, based on the PVGIS-ERA5 radiation database for a representative location in Albania (latitude 40.725° N, longitude 19.558° E). A reference photovoltaic system of 1 kWp (crystalline silicon) with standard system losses was considered [46]. PVGIS-ERA5 data were accessed between November and December 2025 and processed using the default PVGIS hourly time convention. All datasets were temporally aligned to ensure consistency between electricity demand and PV generation profiles.
The PVGIS output provides hourly PV power values, which are used as a normalized production profile and subsequently scaled to represent different installed capacity scenarios. Since PVGIS-ERA5 time series correspond to specific historical years, the resulting PV profile is treated as a representative climatological generation pattern and applied consistently to the 2024 demand dataset. To ensure temporal consistency, the non-leap PV year was aligned with the leap year 2024. The PV generation profile for February 29 was constructed by averaging the hourly values of adjacent days, while all remaining timestamps were directly mapped. This approach preserves the seasonal and diurnal structure of solar generation without introducing artificial discontinuities. The selected location is considered representative of central Albanian solar conditions and corresponds to one of the regions with the highest concentration of electricity demand and PV deployment activity in the country. Although regional climatic differences exist, Albania’s relatively limited geographic extent reduces large-scale spatial variability in solar generation for system-level assessment purposes. Hourly near-surface air temperature (ERA5-Land) was used as a supporting variable for interpreting seasonal demand behavior and the timing of PV-driven impacts. Temperature is not required for the surplus calculations but supports the discussion of seasonal effects [47].
(PV generation profiles were obtained from the PVGIS platform developed by the Joint Research Centre (JRC), European Commission, Ispra, Italy).
2.3. Solar PV Penetration Scenarios
To examine progressive PV deployment, the following PV capacity scenarios were defined: S0: 0 MWp (baseline), S1: 150 MWp, S2: 300 MWp, S3: 450 MWp.
PV generation profiles are scaled proportionally across scenarios, preserving the same temporal shape while increasing peak output.
Figure 4 shows hourly solar PV output on the day with maximum PV generation for three installed PV capacities (150, 300, and 450 MWp). All scenarios exhibit a consistent diurnal profile with linearly scaled magnitudes, confirming the physical consistency of the PV penetration scenarios. The 450 MWp case reaches a maximum output of approximately 385.9 MW (≈85.8% of installed capacity) around 10:00 UTC (≈11:00 local time). PV generation is scaled linearly from a normalized 1 kWp profile. For an installed capacity P (MWp), hourly PV output is computed as:
where the factor 1000 converts MWp to kWp. This scaling keeps the physical daily and seasonal characteristics of solar generation while making it possible to compare PV penetration levels consistently.
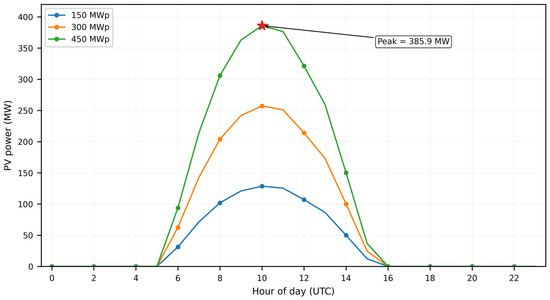
Figure 4.
Normalized daily PV generation profiles scaled to installed capacities of 150, 300, and 450 MWp. Peak output increases proportionally with installed capacity.
2.4. Hydropower Dominance Representation
Hydropower dominated electricity systems present a particularly interesting context for solar PV integration. The installed hydropower capacity exceeds 2 GW, while peak electricity demand typically ranges between approximately 1.4 and 1.6 GW according to publicly available system load statistics for Albania. Hydropower plants can provide significant operational flexibility because they can quickly ramp up and, in some cases, store water in reservoirs [38]. These features can help integrate variable renewable energy sources like solar photovoltaics. However, the interaction between hydropower production and solar generation may make things more complicated and difficult to manage.
During periods of high-water inflow, hydropower production may already be elevated. Under these conditions, additional solar generation can increase the risk of surplus energy and complicate the balance between water management and electricity production [36,37,38]. The strong year-to-year variability of Albania’s dependence on electricity imports is illustrated in Figure 5, highlighting the influence of hydrological conditions on the balance between domestic generation and cross-border electricity exchanges.
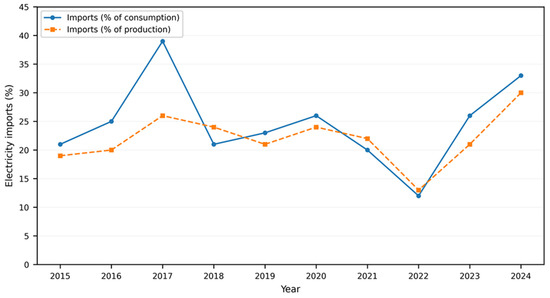
Figure 5.
Electricity import dependence in Albania (2015–2024) as a share of consumption and domestic production, illustrating strong variability driven by hydrological conditions [36,37].
The data show that the amount of electricity that Albania depends on imports changes a lot from year to year. This is mostly because changes in the water affect how much hydropower the country can make. In 2023, about 21% of the country’s electricity came from imports, and about 26% of its total electricity use came from imports. In 2024, the share of imports grew even more, reaching around 30% of production and 33% of consumption. This was because hydropower was less available and Albania relied more on electricity exchanges with other countries. Even though hydropower is the main source of electricity in Albania, complete hourly hydropower generation time series are not publicly available for the entire study period. To represent hydropower dominance transparently, the hydropower contribution is modelled using coverage-based scenarios.
Hydropower generation is assumed to cover a fraction α of hourly load:
where H(t) = hydropower generation (MW), L(t) = system load (MW);
Three coverage levels are considered to capture interannual hydrological variability and the associated reliance on cross-border exchanges:
- α = 0.6: dry-year/import-intensive conditions
- α = 0.7: typical conditions
- α = 0.8: wet-year/hydro-strong conditions
The selected hydropower coverage levels are intended to represent simplified operating conditions corresponding to dry, typical, and hydro-strong years based on the historical variability of electricity imports and hydropower contribution in Albania. This simplified representation is not intended to reproduce detailed reservoir dispatch or operational optimization, but rather to provide a transparent system-level framework for evaluating the interaction between PV penetration, surplus generation, and ramping behavior under varying hydrological conditions.
This approach is suitable for planning-level assessment and avoids introducing plant-level dispatch assumptions. However, the simplified hydropower representation does not explicitly include reservoir dynamics, inflow constraints, market-based dispatch decisions, or cross-border operational optimization. These aspects may influence the magnitude and timing of surplus generation and ramping events under real operating conditions.
2.5. System Balance and Surplus-Risk Metrics
2.5.1. Hourly System Balance
The system balance is defined as the difference between generation and demand, following standard formulations used in renewable integration studies [20,21]. For each combination of hydropower coverage α and PV scenario, the hourly system balance is defined as:
Substituting the hydropower representation yields:
Positive values of B(t) indicate potential surplus conditions.
2.5.2. Potential Surplus
Potential surplus is defined as:
Surplus is interpreted as a risk indicator for curtailment or export requirements under operational constraints and does not represent measured curtailment.
2.5.3. Aggregate Indicators
For each scenario, the following indicators are computed:
Number of surplus hours:
Surplus share (% of year):
Surplus energy is commonly defined as the excess of generation over demand and is associated with curtailment or export requirements [45].
Total surplus energy:
(with Δt = 1 h).
Seasonal and diurnal distributions are analyzed by grouping surplus events by month and hour-of-day. These indicators quantify the frequency, magnitude, and temporal distribution of surplus energy, following common practices in variability and flexibility assessment [21,29].
2.6. Conceptual Storage-Based Flexibility Module for Ramp Mitigation
High PV penetration increases short-term variability and can intensify residual net-load ramps. To quantify the potential benefit of additional flexibility resources, a conceptual storage-based mitigation module is introduced. This module does not simulate a specific battery technology; rather, it provides a planning-level estimate of how limiting extreme ramps could reduce operational stress through flexibility measures [48,49,50].
2.6.1. Residual Net Load and Ramp Definition
Net-load ramping and flexibility assessment are often used to see how a system behaves when there are a lot of renewable sources, especially in systems with many distributed energy sources [51,52]. When there are more renewable sources, variability and ramping needs go up a lot, which means the system needs more flexibility resources to stay reliable. Residual net load is defined as:
where α⋅L(t) represents the hydropower contribution.
The hourly ramp is:
and the absolute ramp magnitude is used to characterize ramp severity.
2.6.2. Ramp-Capping Mitigation (Conceptual Storage)
Conceptual storage is represented as a flexibility mechanism capable of limiting ramp magnitudes to a predefined threshold Rcap. In this study, Rcap = 60 MW/h is applied to quantify the mitigation of extreme ramp events. The proposed ramp-capping approach is intended as a conceptual flexibility indicator for planning-level assessment and does not represent a physically optimized storage operation strategy. The framework does not explicitly model state-of-charge dynamics, energy-capacity constraints, round-trip efficiency losses, or economic dispatch optimization. This representation isolates power-based flexibility requirements and provides an upper-bound estimate of ramp mitigation potential. Ramping requirements are evaluated using exceedance-based metrics and flexibility indicators under high renewable penetration. High-percentile values (e.g., Q90–Q99) are commonly used to characterize extreme variability and flexibility requirements in power systems with high renewable penetration [53,54].
Ramping behavior is evaluated using the following indicators: quantiles (Q90, Q95, Q99), exceedance probabilities, and threshold-based metrics (50, 60, 80, and 100 MW/h).
3. Results
3.1. Impact of PV Penetration on Net-Load Profiles
Integration of solar photovoltaic (PV) into the Albanian electricity system significantly modifies net-load behavior. As PV penetration rises from 150 MWp to 450 MWp, the daytime net load gradually drops, creating pronounced midday valleys. Figure 6 shows how increasing PV capacity affects load, PV generation, and net load for a typical winter week and summer week.
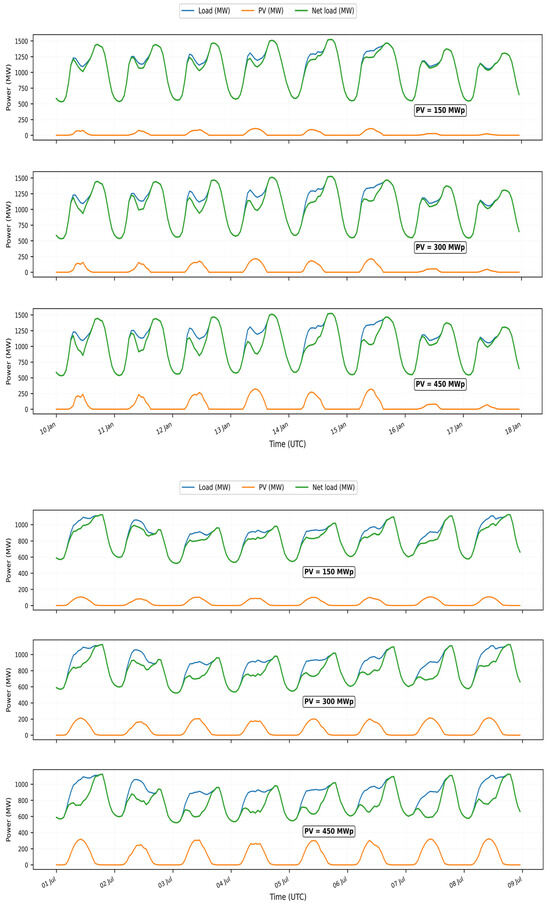
Figure 6.
Hourly electricity load, solar PV generation, and resulting net-load profiles for representative winter (top) and summer (bottom) weeks under PV capacities of 150, 300, and 450 MWp.
Progressive reduction of daytime net load is observed with increasing PV penetration, particularly during summer conditions. Increasing PV penetration progressively deepens the midday net-load valley in summer, while winter shows a reduced impact due to lower solar generation. PV penetration has a strongly seasonal impact on net-load behavior. In the summer, when solar output is high, the midday net load drops a lot, creating big valleys and making it more likely that there will be surplus conditions. In the winter, when PV output is lower, the effect is less noticeable, and net-load profiles are mostly based on demand. In Figure 7 surplus events are concentrated during midday hours, peaking between 11:00 and 13:00, corresponding to maximum solar generation.
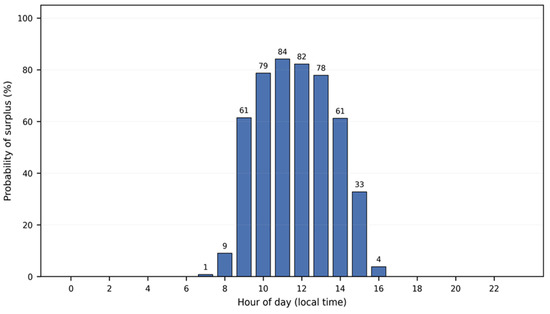
Figure 7.
Diurnal distribution of surplus probability for the high-PV scenario (PV = 450 MWp, α = 0.7). Surplus events are concentrated during midday hours, peaking between 11:00 and 13:00, corresponding to maximum solar generation.
Surplus energy is strongly seasonal, with peak values during high-irradiance months (spring and autumn) and minimal levels in winter, reflecting the variability of solar generation, as shown in Figure 8.
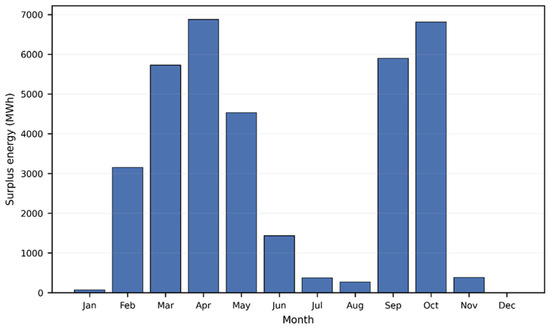
Figure 8.
Monthly surplus energy for the high-PV scenario (PV = 450 MWp, α = 0.7). Surplus energy is concentrated in high-irradiance periods, indicating strong seasonal dependence.
Figure 9 shows strong seasonal variability with higher surplus during high-irradiance periods and increased magnitude under higher hydropower contribution.
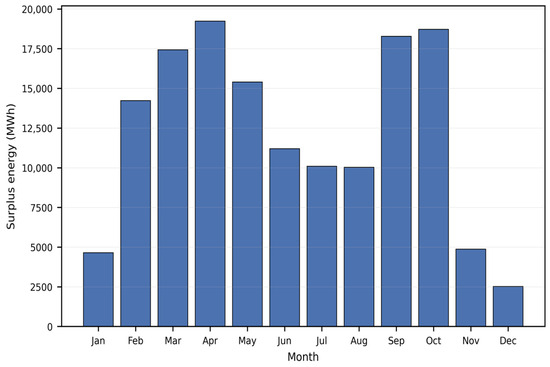
Figure 9.
Monthly surplus energy for the high-PV scenario (PV = 450 MWp, α = 0.8).
Increasing hydropower coverage from α = 0.7 to α = 0.8 (Figure 8) results in a marked amplification of surplus energy, with monthly values increasing by approximately 2–3 times, highlighting the strong sensitivity of surplus conditions to the combined contribution of hydropower and solar generation. Surplus conditions exhibit a strong temporal structure. At the daily scale, surplus events are concentrated around midday hours, coinciding with peak solar generation. At the seasonal scale, surplus energy is significantly higher during periods of increased solar irradiance, highlighting the combined influence of PV production and seasonal demand patterns. Under high PV scenarios, the net load approaches zero and, in several cases, becomes negative during peak solar production hours, indicating the occurrence of surplus conditions. This effect is particularly evident during summer periods characterized by high irradiance levels. Furthermore, under high hydropower coverage (α = 0.8), the combined contribution of hydropower and PV generation exceeds system demand more frequently, amplifying the occurrence of surplus energy. These results demonstrate that increasing PV penetration fundamentally reshapes daytime system operation and introduces new challenges related to surplus management.
3.2. Minimum Net Load and Surplus Formation
The effect of PV penetration on minimum net-load levels shows how important surplus conditions are becoming. When there is not much PV, the absolute annual minimum load stays about the same because it happens at night. Adding more PV capacity, on the other hand, lowers the minimum daytime net load by a lot. This means more solar power is being made during the day and that the midday net-load valley is getting deeper. Because of this, when PV levels are high, especially in the summer, surplus is more common and noticeable. These results show that surplus conditions are mostly a daytime thing and will become an important operational consideration as solar deployment grows.
Minimum net-load values decrease with increasing PV penetration, reflecting the growing influence of solar generation during daylight hours. The magnitude distribution of surplus events across scenarios is illustrated in Figure 10.
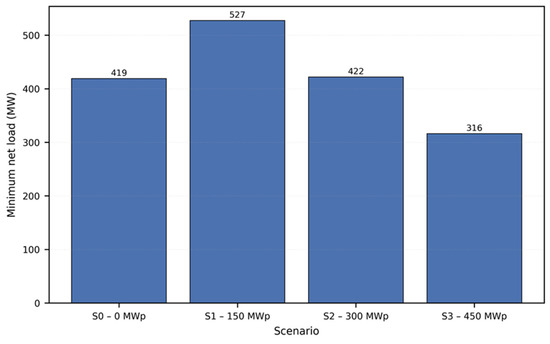
Figure 10.
Minimum net-load values across PV penetration scenarios. Increasing PV capacity reduces daytime net load, indicating growing surplus conditions.
The exceedance probability represents the relative ranking of surplus hours within each scenario, expressed as a percentage of non-zero surplus events. Surplus magnitude increases significantly with PV penetration and hydropower availability, as shown in Figure 11.
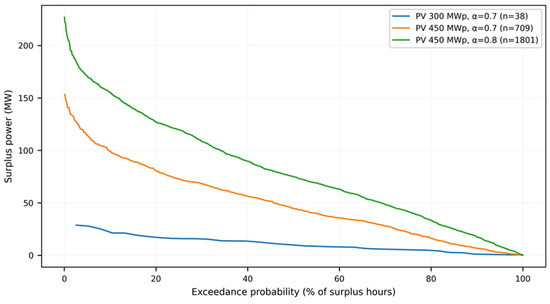
Figure 11.
Surplus duration (exceedance) curves for selected PV and hydropower scenarios, illustrating the relationship between exceedance probability and surplus magnitude. Higher PV penetration and stronger hydropower contribution increase both the frequency and severity of surplus events.
While low-PV scenarios exhibit limited surplus levels, high-PV cases produce both more frequent and larger surplus events, highlighting the growing need for effective surplus management strategies. The evolution of surplus risk across PV and hydropower scenarios is summarized in Figure 12, including surplus hours, maximum surplus, and total surplus energy. Increasing PV capacity and hydropower availability significantly amplify surplus magnitude and frequency.
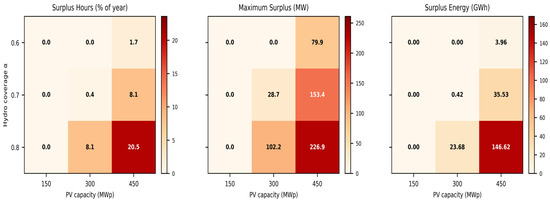
Figure 12.
Surplus energy indicators under different photovoltaic penetration levels and hydropower coverage conditions.
For lower PV penetration levels (150 MWp), no significant surplus events are observed. However, as installed PV capacity increases, surplus conditions begin to emerge, particularly when hydropower production remains high. Under the 300 MWp scenario, surplus events appear under higher hydropower coverage conditions, reaching approximately 8% of annual hours in the most extreme case. In the 450 MWp scenario, the occurrence of surplus energy increases substantially, reaching more than 20% of annual hours when hydropower availability is high. Similarly, the magnitude of surplus generation increases significantly with PV capacity. Maximum surplus values reach approximately 226 MW in the highest PV penetration scenario, while the total annual surplus energy may exceed 140 GWh under certain system conditions. Surplus risk increases nonlinearly with both PV penetration and hydropower availability. While low-PV scenarios exhibit negligible surplus, higher PV capacities result in a substantial rise in both the frequency and magnitude of surplus events.
3.3. Seasonal Characteristics of Load and Ramp Behavior
Seasonal differences in electricity demand patterns play a key role in shaping net-load variability. Figure 13 illustrates the interaction between electricity demand and net-load profiles under different PV penetration scenarios during a representative summer week.
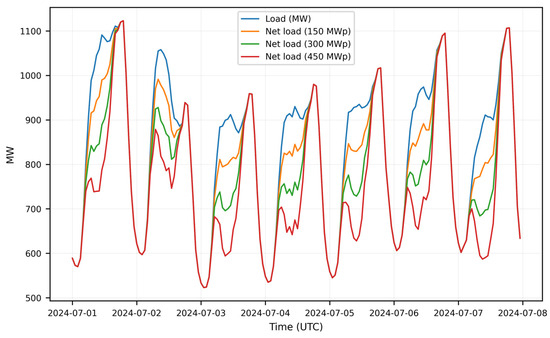
Figure 13.
Hourly load and net-load profiles for a representative summer week under PV scenarios (150, 300, 450 MWp), showing progressive deepening of the midday valley.
Seasonal differences in electricity demand patterns play a key role in shaping net-load variability. Increasing PV penetration progressively reduces daytime net load, resulting in deeper midday valleys, while night-time load remains largely unaffected. Figure 14 illustrates the average daily load profiles for winter and summer conditions, showing that winter exhibits higher evening peak demand and greater variability, while summer presents a smoother demand profile.
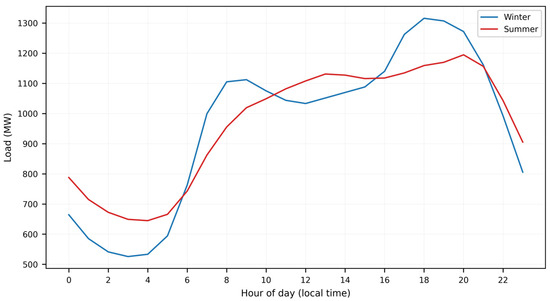
Figure 14.
Average daily electricity load profiles for winter and summer conditions based on ENTSO-E data.
Winter exhibits higher evening peak demand and greater variability, while summer shows a smoother profile with reduced morning demand and slightly lower peak levels. These seasonal characteristics directly influence ramping behavior. Statistical analysis of hourly net-load ramps indicates that winter exhibits the highest variability, with median ramp values reaching approximately 60.9 MW/h compared to 31.5 MW/h in summer. Extreme ramp values are also significantly higher in winter, with Q95 reaching approximately 207 MW/h and Q99 exceeding 260 MW/h, compared to 125 MW/h and 150 MW/h in summer, respectively. This behavior reflects the dominant role of demand-driven variability during winter periods, when PV output is limited, while summer conditions are more influenced by solar generation patterns.
3.4. Redistribution of Ramp Magnitudes Due to PV Integration
The effect of PV penetration on ramp characteristics is further illustrated through the analysis of changes in the probability density function (ΔPDF) of hourly net-load ramps. The redistribution of ramp magnitudes due to PV integration is illustrated in Figure 15.
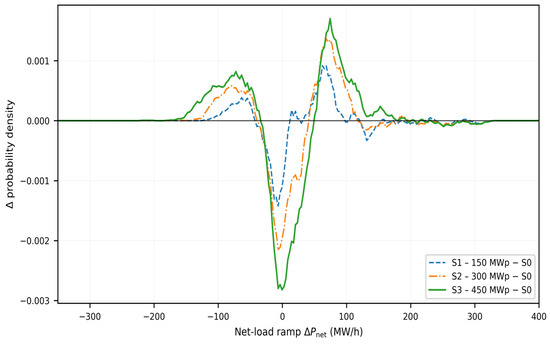
Figure 15.
Change in the probability density function (ΔPDF) of net-load ramps for increasing PV penetration relative to the no-PV case. PV integration reduces low-magnitude ramps and increases moderate ramp events.
Across all seasons, PV integration leads to a significant suppression of low-magnitude ramps (approximately 0–30 MW/h), with peak reductions reaching around −0.002 in transitional seasons. At the same time, an increase in moderate ramp magnitudes (approximately 60–120 MW/h) is observed, with ΔPDF peaks ranging between +0.0008 and +0.0015. This pattern indicates a shift in ramp occurrences across magnitudes. Low-amplitude ramps are suppressed, while moderate ramp events increase, indicating a shift from frequent small fluctuations to fewer but more significant variability events. Seasonal variations in this behaviour are shown in Figure 16.
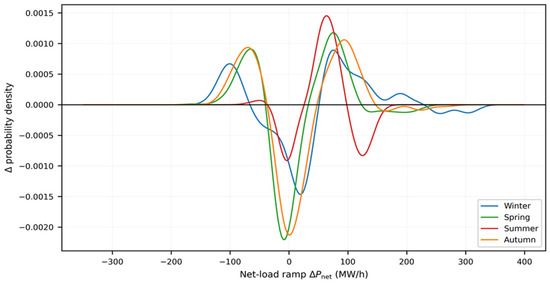
Figure 16.
Seasonal variation in the change of the net-load ramp probability density function (ΔPDF) for the 300 MWp PV scenario.
The redistribution effect varies across seasons, with stronger shifts observed during high-irradiance periods. Seasonal differences influence the redistribution of ramp magnitudes, with more pronounced shifts occurring during periods of higher solar generation. A more detailed breakdown of ramp exceedance across PV scenarios and seasons is shown in Figure 17.
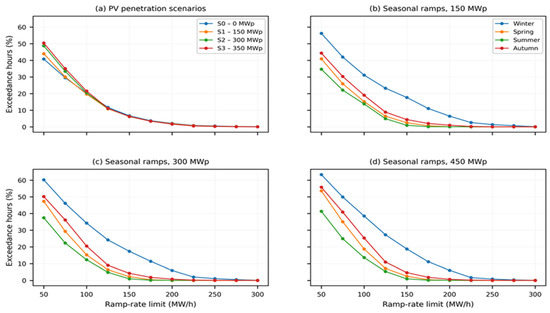
Figure 17.
(a) Percentage of hours in which the absolute hourly net-load ramp exceeds a given ramp-rate limit under four PV scenarios. (b–d) Seasonal decomposition of ramp exceedance for the 150 MWp case, highlighting seasonal differences in net-load variability and ramping frequency.
Seasonal ramp exceedance curves indicate that winter exhibits the highest frequency of large net-load ramps for a given ramp-rate limit. This behaviour is consistent with lower PV output and demand-driven ramping during winter, whereas summer PV generation primarily affects midday net-load levels and shifts ramping toward evening hours. This effect is most pronounced during summer, where PV generation strongly influences net-load dynamics, while winter exhibits a weaker but similar pattern due to lower solar output. Overall, PV integration shifts variability from frequent small fluctuations toward fewer but larger ramp events.
3.5. Ramp Exceedance and Extreme Event Behavior
Ramp exceedance analysis shows that the probability of large ramp events increases significantly with PV penetration. As installed PV capacity increases, ramp distributions shift toward higher magnitudes, particularly during evening hours when solar generation declines rapidly. The distribution of ramp exceedance and the corresponding flexibility requirements are illustrated in Figure 18. The hourly ramp rate is interpreted as an equivalent power requirement for ramp-limiting flexibility.
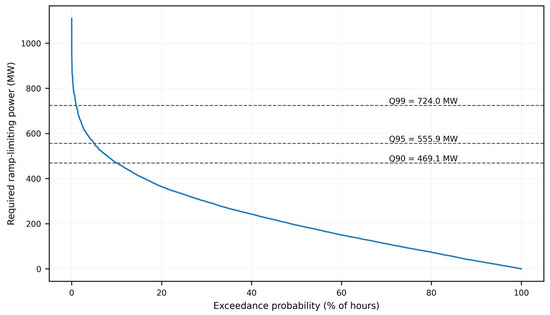
Figure 18.
Net-load ramp exceedance curve expressed as a function of exceedance probability, interpreted as a proxy for required ramp-limiting flexibility (e.g., storage power capacity).
Horizontal dashed lines indicate high-percentile ramp levels (Q90, Q95, Q99). The steep initial slope highlights the presence of extreme but infrequent ramping events, while lower ramp magnitudes dominate for higher exceedance probabilities. Seasonal analysis indicates that winter exhibits the highest frequency of extreme ramps for a given threshold, due to strong demand-driven variability. In contrast, summer PV generation reduces midday variability but contributes to sharper transitions during sunset, increasing ramp intensity during these periods. These results confirm that PV penetration introduces a nonlinear increase in ramp severity, rather than a simple proportional scaling.
3.6. Average Daily Ramp Profiles
The average daily net-load ramp profiles further highlight the impact of increasing PV penetration. Morning hours are characterized by negative ramps associated with PV ramp-up, while evening hours exhibit strong positive ramps due to PV ramp-down. The average daily distribution of net-load ramps across PV scenarios is shown in Figure 19. Increasing PV penetration intensifies morning down-ramps and evening up-ramps, highlighting the growing importance of ramping during transition periods. Net-load ramps exhibit a clear diurnal pattern, with negative ramps during morning PV ramp-up and positive ramps during evening ramp-down. As PV penetration increases, both the magnitude and steepness of these transitions become more pronounced, particularly during sunset periods.
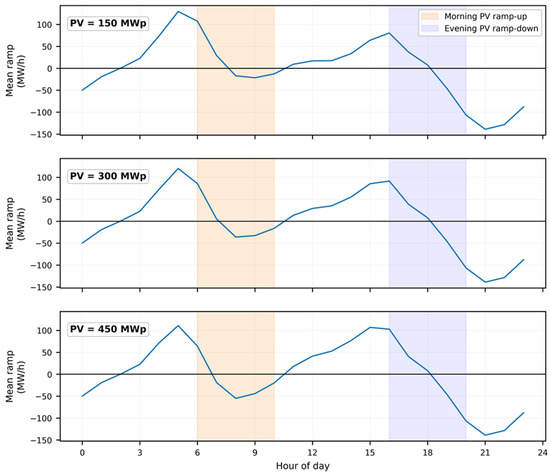
Figure 19.
Average daily net-load ramp profiles for PV capacities of 150, 300, and 450 MWp.
As PV capacity increases from 150 MWp to 450 MWp, morning down-ramps deepen and evening up-ramps become significantly steeper. This pattern indicates a nonlinear escalation of short-term flexibility requirements, especially during transition periods such as sunrise and sunset.
3.7. Extreme Ramp Metrics and Mitigation Potential
Table 2 summarizes the detailed high-percentile ramp metrics and exceedance rates for the highest PV penetration scenario (450 MWp) under typical hydropower conditions (α = 0.7).
Table 2.
Ramp severity and exceedance metrics with and without conceptual storage mitigation (PV = 450 MWp, α = 0.7).
High-percentile ramp metrics (Q90, Q95, Q99) and exceedance rates for the absolute hourly net-load ramp under the high-PV scenario (PV = 450 MWp, α = 0.7). The conceptual storage case applies a ramp-capping scheme limiting ramp magnitudes to 60 MW/h. While exceedances above 50 MW/h remain unchanged, all extreme ramp events above 60 MW/h and higher thresholds are fully eliminated. Without mitigation, hourly ramp rates increase substantially with PV penetration. For example, Q99 increases from 80.87 MW/h at 300 MWp to 111.45 MW/h at 450 MWp, while the proportion of hours exceeding 100 MW/h rises significantly. The effect of flexibility on ramp exceedance behavior is illustrated in Figure 20.
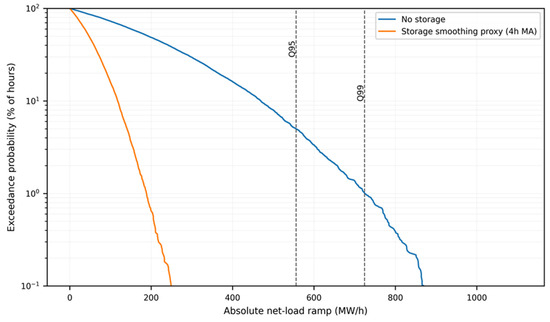
Figure 20.
Net-load ramp duration (exceedance) curves comparing the original system (no storage) and a smoothed case representing a conceptual flexibility proxy (4 h moving average).
The inclusion of flexibility significantly reduces high-magnitude ramp events and compresses the upper tail of the distribution, while moderate ramp behaviour remains relatively unchanged.
The application of a conceptual ramp-capping scheme (60 MW/h) effectively eliminates all ramp events above this threshold. Consequently, high-percentile metrics collapse to the cap level (Q95 = Q99 = 60 MW/h), while exceedances above 60 MW/h are reduced to zero. Notably, the proportion of ramps exceeding 50 MW/h remains unchanged, as the cap allows ramps within the 50–60 MW/h range. This indicates that flexibility measures primarily mitigate extreme ramp events rather than moderate variability. Overall, the results demonstrate that even simplified flexibility mechanisms can significantly reduce extreme ramping stress in high-PV scenarios. A comprehensive comparison of ramp severity and exceedance across PV penetration levels and mitigation scenarios is presented in Table 3.
Table 3.
Ramp severity (Q90–Q99) and exceedance rates for PV scenarios (300 and 450 MWp) with and without ramp-limiting flexibility (α = 0.7).
Table 3 provides a comparative overview of ramp severity and exceedance metrics across different PV penetration and mitigation scenarios. As PV penetration increases, ramp severity rises sharply. For instance, Q99 goes from 80.87 MW/h (300 MWp) to 111.45 MW/h (450 MWp), and the number of extreme ramp events also goes up a lot. Setting a ramp-limiting threshold (60 MW/h) gets rid of all ramps above this level, lowering Q95 and Q99 to the cap value. However, the proportion of ramps exceeding 50 MW/h stays the same, which shows that flexibility mostly helps with extreme events rather than moderate variability.
4. Discussion
The results suggest that increasing solar photovoltaic (PV) penetration affects the operation of the Albanian electricity system in several ways. Traditionally, system behavior has been largely determined by hydrological conditions, which define the available energy. As PV capacity increases, however, this pattern gradually starts to change. One clear outcome is the appearance of surplus conditions at higher PV levels. At 450 MWp, surplus energy is observed during a considerable part of the year and can exceed 200 MW under favorable hydrological conditions. In practice, this means that solar generation can occasionally be higher than the minimum system demand. Similar behavior has already been reported in other systems with high renewable penetration. The observed increase in ramp severity and surplus occurrence is also consistent with findings reported in previous flexibility and renewable integration studies in hydropower-dominated systems, where increasing PV penetration tends to intensify short-term operational variability and flexibility requirements.
In Albania, this effect is further influenced by hydropower operation, which cannot always be reduced freely due to water management constraints. PV integration also changes the variability of the system. The system exhibits fewer small fluctuations but more intense ramping events.
When the PV level is higher, the extreme ramp values go up, and Q99 reaches about 111 MW/h. This means that the system becomes more sensitive to rapid changes in net load. The effect is most evident during transition periods, such as sunset, when PV generation drops quickly while demand remains relatively high. When seasonal patterns are considered, these challenges do not occur uniformly throughout the year. In summer, system behavior is mainly influenced by surplus generation and the formation of pronounced midday net-load valleys. In winter, by contrast, variability is largely driven by changes in demand, leading to higher ramp magnitudes. This difference between seasons highlights the need for flexible solutions capable of managing both generation-driven and demand-driven variability. The findings indicate that hydropower alone may not be sufficient to manage the growing share of photovoltaic (PV) generation. Hydropower provides a certain degree of flexibility. However, operational constraints can limit how quickly it responds to sudden changes in net load or extended periods of surplus. This is particularly relevant in Albania, where hydro energy is the primary source of the system but cannot function continuously as a fully flexible balancing resource. The results also show that targeted flexibility measures can help in reducing overall system stress. For example, applying a ramp-limiting threshold suggests that extreme ramp events can be mitigated without major interventions. This highlights the importance of flexibility options such as energy storage and demand response in supporting system stability. At the same time, these measures mainly affect extreme conditions, while moderate variability remains largely unchanged. This means that strategies for flexibility should focus on times during periods of high operational stress, not on average operating conditions.
The results show that keeping the grid stable at high levels of PV penetration is not just a matter of normal planning. It requires a stronger focus on flexibility. Expanding grid capacity alone is unlikely to be enough, and in some cases may not even be cost-effective, especially when the main challenges are linked to short-duration solar peaks. A more practical approach is to combine different flexibility options with improved system operation in order to handle both surplus generation and rapid changes in net load.
5. Conclusions
This paper investigates the impacts of high solar photovoltaic (PV) penetration on the Albanian electricity system, with particular focus on net-load behavior, surplus generation, and ramping dynamics in a hydropower-dominated system. The results indicate that the net-load profile is significantly altered by the increase in PV capacity from 150 MWp to 450 MWp. Under high-PV scenarios, midday net load decreases substantially and, in some cases, approaches zero, leading to surplus conditions. This effect becomes particularly evident under high hydropower availability (α = 0.8), where surplus conditions occur during approximately 20.5% of the year, with peak surplus values exceeding 220 MW and total annual surplus energy surpassing 140 GWh. At the same time, PV integration substantially changes system variability. The results indicate a clear redistribution of ramp behavior, characterized by a reduction in small fluctuations and an increase in moderate and extreme ramping events. This is reflected in the increase of extreme ramp values, where Q99 rises from approximately 80.9 MW/h at 300 MWp to 111.5 MW/h at 450 MWp, together with a higher proportion of hours exceeding 100 MW/h. Seasonal analysis further shows that the impact of PV penetration strongly depends on system operating conditions. During summer periods, strong solar generation creates pronounced midday net-load valleys and increases the likelihood of surplus conditions. In winter, system variability is driven mainly by demand fluctuations, resulting in higher ramp magnitudes. The evaluation of mitigation measures shows that the use of flexibility solutions can substantially reduce operational stress. The application of a ramp-limiting threshold of 60 MW/h effectively eliminates extreme ramp events above the threshold. This reduces Q95 and Q99 to the cap value, while moderate variability remains largely unchanged. From a system perspective, the results show that increasing PV penetration gradually shifts the Albanian electricity system from a predominantly energy-limited and hydropower-dependent regime toward operation increasingly constrained by surplus generation and short-term variability. In this context, grid stability requires not only sufficient generation capacity but also the ability to handle surplus energy and rapid fluctuations in net load through dedicated flexibility solutions, such as energy storage, demand-side management, and improved operational coordination. The results also indicate that grid expansion alone may not always be sufficient or cost-effective, especially when operational problems are associated with short-duration solar peaks. In particular, flexibility requirements are expected to become most critical during high-irradiance periods and evening transition hours under high PV penetration scenarios.
This work provides a data-driven framework for assessing PV integration in hydropower-dominated systems. The findings indicate that high solar PV penetration in Albania will substantially modify system operation and increase the importance of flexibility-oriented planning and operational strategies.
Future work may include detailed hydropower dispatch modeling, including reservoir operation constraints and plant-level limitations, together with large-scale energy storage analysis and demand-side flexibility assessment. The present study is intended as a planning-level assessment of system behavior under increasing PV penetration scenarios rather than a detailed PV plant design or equipment sizing study. The use of long-term multi-year PV and hydrological datasets could further improve the robustness of the assessment by better capturing interannual variability. Further research could also investigate the economics of PV integration, including market design, price signals, and cost-effectiveness of flexibility solutions.
Author Contributions
Conceptualization, D.M. and I.B.; methodology, I.B. and D.M.; software, J.J.; validation, D.M., I.B. and V.M.; formal analysis, D.M. and V.M.; investigation, D.M.; data curation, D.M.; writing—original draft preparation, review and editing, I.B., V.M. and U.B.; visualization, D.M.; supervision, I.B.; project administration, D.M.; funding acquisition, D.M. All authors have read and agreed to the published version of the manuscript.
Funding
This research was funded by the National Agency for Scientific Research and Innovation (AKKSHI), under research project no. 944/1, dated 20 June 2025, entitled “Solar energy from large-scale photovoltaic systems in Albania: optimization methods using artificial intelligence, applications, and perspectives for future research”. The APC was funded by the National Agency for Scientific Research and Innovation (AKKSHI).
Data Availability Statement
The original contributions presented in this study are included in the article. Further inquiries can be directed to the corresponding author.
Acknowledgments
The authors would like to thank the National Agency for Scientific Research and Innovation (AKKSHI) for supporting the research activities carried out within the framework of project no. 944/1 (20 June 2025).
Conflicts of Interest
The authors declare no conflicts of interest.
Abbreviations
The following abbreviations are used in this manuscript:
| Abbreviation | Definition |
| PV | Solar Photovoltaic |
| MWp | Megawatt-peak |
| MW | Megawatt |
| MW/h | Megawatt per hour |
| kWp | Kilowatt-peak |
| ENTSO-E | European Network of Transmission System Operators for Electricity |
| PVGIS | Photovoltaic Geographical Information System |
| ERA5 | Fifth-generation ECMWF atmospheric reanalysis |
| C3S | Copernicus Climate Change Service |
| IRENA | International Renewable Energy Agency |
| INSTAT | Institute of Statistics (Albania) |
| ERE | Energy Regulatory Authority (Albania) |
| NREL | National Renewable Energy Laboratory |
| EU | European Union |
| Q90 | 90th percentile |
| Q95 | 95th percentile |
| Q99 | 99th percentile |
| Probability Density Function | |
| ΔPDF | Change in Probability Density Function |
| α | Hydropower coverage ratio |
| B(t) | System balance |
| L(t) | Load (electricity demand) |
| H(t) | Hydropower generation |
| PV(t) | Photovoltaic generation |
| Rcap | Ramp-capping threshold |
References
- International Energy Agency (IEA). Renewables 2023: Analysis and Forecast to 2028; IEA: Paris, France, 2023; Available online: https://www.iea.org/reports/renewables-2023 (accessed on 10 November 2025).
- International Energy Agency (IEA). World Energy Outlook 2023; IEA: Paris, France, 2023; Available online: https://www.iea.org/reports/world-energy-outlook-2023 (accessed on 15 November 2025).
- REN21. Renewables 2023 Global Status Report; REN21 Secretariat: Paris, France, 2023; Available online: https://www.ren21.net/reports/global-status-report/ (accessed on 17 November 2025).
- Fraunhofer ISE. Photovoltaics Report 2024; Fraunhofer Institute: Freiburg, Germany, 2024; Available online: https://www.ise.fraunhofer.de (accessed on 28 November 2025).
- Energy Institute. Statistical Review of World Energy 2023; Energy Institute: London, UK, 2023; Available online: https://www.energyinst.org/statistical-review (accessed on 2 February 2026).
- Denholm, P.; Margolis, R.M. Evaluating the limits of solar photovoltaics (PV) in traditional electric power systems. Energy Policy 2007, 35, 2852–2861. [Google Scholar] [CrossRef]
- California ISO (CAISO). What the Duck Curve Tells Us About Managing a Green Grid; CAISO: Folsom, CA, USA, 2016; Available online: https://www.caiso.com (accessed on 4 January 2026).
- Ueckerdt, F.; Brecha, R.; Luderer, G. Analyzing major challenges of wind and solar variability in power systems. Renew. Energy 2015, 81, 1–10. [Google Scholar] [CrossRef]
- Lew, D.; Brinkman, G.; Ibanez, E. The Western Wind and Solar Integration Study; NREL: Golden, CO, USA, 2012. Available online: https://www.nrel.gov (accessed on 1 January 2026).
- Morales, J.M.; Conejo, A.J.; Madsen, H.; Pinson, P.; Zugno, M. Integrating Renewables into Electricity Markets; Springer: New York, NY, USA, 2014. [Google Scholar]
- Alshahrani, A.; Omer, S.; Su, Y.; Mohamed, E.; Alotaibi, S. The technical challenges facing the integration of small-scale and large-scale PV systems into the grid: A critical review. Electronics 2019, 8, 1443. [Google Scholar] [CrossRef]
- Wu, H.; Locment, F.; Sechilariu, M. Experimental implementation of a flexible PV power control mechanism in a DC microgrid. Energies 2019, 12, 1233. [Google Scholar] [CrossRef]
- Velarde, P.; Gallego, A.J. Stochastic model predictive control for photovoltaic energy plants: Coordinating energy storage, generation, and power quality. Energies 2026, 19, 232. [Google Scholar] [CrossRef]
- Mishan, R.; Fu, X.; Hingu, C.; Ben-Idris, M. Impacts of inertia and photovoltaic integration on existing and proposed power system transient stability parameters. Energies 2025, 18, 2915. [Google Scholar] [CrossRef]
- Yamaguchi, M. Current status and future direction of photovoltaics. Appl. Sci. 2025, 15, 9416. [Google Scholar] [CrossRef]
- Choudhary, P.; Srivastava, R.K. Sustainability perspectives: A review for solar photovoltaic trends and growth opportunities. J. Clean. Prod. 2019, 227, 589–612. [Google Scholar] [CrossRef]
- Arif, S.; Rabbi, A.E.; Ahmed, S.U.; Lipu, M.S.H.; Jamal, T.; Aziz, T.; Sarker, M.R.; Riaz, A.; Alharbi, T.; Hussain, M.M. Enhancement of solar PV hosting capacity in a remote industrial microgrid: A methodical techno-economic approach. Sustainability 2022, 14, 8921. [Google Scholar] [CrossRef]
- Lopes, J.A.P.; Hatziargyriou, N.; Mutale, J.; Djapic, P.; Jenkins, N. Integrating distributed generation into electric power systems. Proc. IEEE 2007, 95, 118–138. [Google Scholar] [CrossRef]
- Bollen, M.H.J.; Hassan, F. Integration of Distributed Generation in the Power System; Wiley-IEEE Press: Hoboken, NJ, USA, 2011. [Google Scholar]
- Iweh, C.D.; Gyamfi, S.; Tanyi, E.; Effah-Donyina, E. Distributed generation and renewable energy integration into the grid: Prerequisites, push factors, practical options, issues and merits. Energies 2021, 14, 5375. [Google Scholar] [CrossRef]
- Rostampour, V.; Badings, T.S.; Scherpen, J.M.A. Demand flexibility management for buildings-to-grid integration with uncertain generation. Energies 2020, 13, 6532. [Google Scholar] [CrossRef]
- Ali, S.S.; Choi, B.J. State-of-the-art artificial intelligence techniques for distributed smart grids: A review. Electronics 2020, 9, 1030. [Google Scholar] [CrossRef]
- Uruel-Sanz, J.; Perpiñán-Lamigueiro, O. Power flow analysis in urban distribution networks with implementation of grid-connected photovoltaic systems. Solar 2022, 2, 32–51. [Google Scholar] [CrossRef]
- Zisos, A.; Sakki, G.-K.; Efstratiadis, A. Mixing renewable energy with pumped hydropower storage: Design optimization under uncertainty and other challenges. Sustainability 2023, 15, 13313. [Google Scholar] [CrossRef]
- Gorenstein Dedecca, J.; Ansarin, M.; Bene, C.; van Delzen, T.; van Nuffel, L.; Jagtenberg, H. Increasing Flexibility in the EU Energy System: Technologies and Policies to Enable the Integration of Renewable Electricity Sources; European Parliament: Luxembourg, 2025; Available online: http://www.europarl.europa.eu/supporting-analyses (accessed on 19 February 2026).
- Yang, Y.; Blaabjerg, F.; Wang, H. Power control flexibilities for grid-connected PV inverters. Energies 2018, 11, 1353. [Google Scholar] [CrossRef]
- Wang, J.; Zhong, H.; Xia, Q. Review of flexibility requirements in power systems. Energies 2017, 10, 1040. [Google Scholar] [CrossRef]
- Korab, R.; Połomski, M.; Smołka, M. Evaluating the Risk of Exceeding the Normal Operating Conditions of a Low-Voltage Distribution Network due to Photovoltaic Generation. Energies 2022, 15, 1969. [Google Scholar] [CrossRef]
- Sinsel, S.R.; Riemke, R.L.; Hoffmann, V.H. Challenges and solution technologies for the integration of variable renewable energy sources—A review. Renew. Energy 2020, 145, 2271–2285. [Google Scholar] [CrossRef]
- Zsiborács, H.; Baranyai, N.H.; Vincze, A.; Zentkó, L.; Birkner, Z.; Máté, K.; Pintér, G. Intermittent Renewable Energy Sources: The Role of Energy Storage in the European Power System of 2040. Electronics 2019, 8, 729. [Google Scholar] [CrossRef]
- Kabir, M.N.; Mishra, Y.; Ledwich, G. Impact of PV on distribution networks. Renew. Energy 2014, 62, 468–477. [Google Scholar] [CrossRef]
- Paatero, J.V.; Lund, P.D. Effects of large-scale photovoltaic power integration on electricity distribution networks. Renew. Energy 2007, 32, 216–234. [Google Scholar] [CrossRef]
- Gaudard, L.; Romerio, F. The Future of Hydropower in Europe: Interconnecting Climate, Markets and Policies. Environ. Sci. Policy 2014, 37, 172–181. [Google Scholar] [CrossRef]
- Zakeri, B.; Syri, S. Electrical energy storage systems: A comparative life cycle cost analysis. Renew. Sustain. Energy Rev. 2015, 42, 569–596. [Google Scholar] [CrossRef]
- Lund, H.; Mathiesen, B.V. Energy System Analysis of 100% Renewable Energy Systems—The Case of Denmark in Years 2030 and 2050. Energy 2009, 34, 524–531. [Google Scholar] [CrossRef]
- INSTAT. Balance of Electric Power 2023; Institute of Statistics: Tirana, Albania, 2024. Available online: https://www.instat.gov.al/media/13066/balance-of-electric-power-2023.pdf (accessed on 10 January 2026).
- INSTAT. Balance of Electric Power 2024; Institute of Statistics: Tirana, Albania, 2025. Available online: https://www.instat.gov.al/en/themes/environment-and-energy/energy/publication/2024/balance-of-electric-power-q3-2024/ (accessed on 12 January 2026).
- ERE. Annual Report 2023; Energy Regulatory Authority: Tirana, Albania, 2024. Available online: https://www.ere.gov.al (accessed on 21 December 2025).
- Energy Community Secretariat. Albania Energy Sector Report; Energy Community Secretariat: Vienna, Austria, 2023; Available online: https://www.energy-community.org (accessed on 22 December 2025).
- World Bank. Western Balkans Energy Outlook; World Bank: Washington, DC, USA, 2022; Available online: https://www.worldbank.org (accessed on 6 January 2026).
- International Renewable Energy Agency (IRENA). Renewable Capacity Statistics 2024; IRENA: Abu Dhabi, United Arab Emirates, 2024; Available online: https://www.irena.org/Publications/2024/Mar/Renewable-Capacity-Statistics-2024 (accessed on 19 January 2026).
- Đurašković, J.; Konatar, M.; Radović, M. Renewable energy in the Western Balkans: Policies, developments and perspectives. Energy Rep. 2021, 7, 481–490. [Google Scholar] [CrossRef]
- Wang, Y.; Levin, T.; Kwon, J.; Baker, E. The value of hydropower flexibility for electricity system decarbonization. Energy Rep. 2025, 13, 2711–2721. [Google Scholar] [CrossRef]
- Dunjic, S.; Pezzutto, S.; Zubaryeva, A. Renewable energy development trends in the Western Balkans. Renew. Sustain. Energy Rev. 2016, 65, 1026–1032. [Google Scholar] [CrossRef]
- ENTSO-E Transparency Platform. Available online: https://transparency.entsoe.eu (accessed on 10 November 2025).
- European Commission, Joint Research Centre. PVGIS—Photovoltaic Geographical Information System. Available online: https://ec.europa.eu/jrc/en/pvgis (accessed on 5 November 2025).
- Copernicus Climate Change Service (C3S). ERA5-Land Hourly Data from 1950 to Present. Available online: https://cds.climate.copernicus.eu (accessed on 1 November 2025).
- National Renewable Energy Laboratory (NREL). The Role of Energy Storage and Demand Response in Renewable Energy Integration; NREL: Golden, CO, USA, 2010. Available online: https://docs.nrel.gov/docs/fy10osti/48247.pdf (accessed on 15 December 2025).
- Sreekumar, S.; Yamujala, S.; Sharma, K.C.; Bhakar, R.; Simon, S.P.; Rana, A.S. Flexible ramp products: A solution to enhance power system flexibility. Renew. Sustain. Energy Rev. 2022, 159, 112429. [Google Scholar] [CrossRef]
- Wang, Q.; Hodge, B.-M. Enhancing power system operational flexibility with flexible ramping products: A review. IEEE Trans. Ind. Inform. 2017, 13, 1652–1664. [Google Scholar] [CrossRef]
- Rizi, E.T.; Rastegar, M.; Forootani, A. Power System Flexibility Analysis Using Net-Load Forecasting Based on Deep Learning Considering Distributed Energy Sources and Electric Vehicles. Comput. Electr. Eng. 2024, 117, 109305. [Google Scholar] [CrossRef]
- Poncela, M.; Purvins, A.; Chondrogiannis, S. Pan-European Analysis on Power System Flexibility. Energies 2018, 11, 1765. [Google Scholar] [CrossRef]
- Zhao, Y.; Hu, S.; Wang, Y.; Cao, L.; Yang, J. Assessing Flexibility by Ramping Factor in Power Systems with High Renewable Energy Proportion. Int. J. Electr. Power Energy Syst. 2024, 155, 109680. [Google Scholar] [CrossRef]
- Cui, M.; Zhang, J.; Florita, A.; Hodge, B.M. Characterizing and Analyzing Ramping Events in Wind Power, Solar Power, Load, and Net Load. Renew. Energy 2017, 111, 227–244. [Google Scholar] [CrossRef]


Disclaimer/Publisher’s Note: The statements, opinions and data contained in all publications are solely those of the individual author(s) and contributor(s) and not of MDPI and/or the editor(s). MDPI and/or the editor(s) disclaim responsibility for any injury to people or property resulting from any ideas, methods, instructions or products referred to in the content. |
© 2026 by the authors. Licensee MDPI, Basel, Switzerland. This article is an open access article distributed under the terms and conditions of the Creative Commons Attribution (CC BY) license.