


Abstract
Long-term fishery records are essential for detecting ecological change in data-limited freshwater systems. We analyzed 64 years (1961–2024) of commercial landings for ten fish categories from Lake Volvi, Greece, combining temporal, multivariate, forecasting and catch-only approaches. Total landings fell 89.8%, from 620 t in 1962 to 63.3 t in 2024. Six categories declined significantly after autocorrelation correction, whereas Gibel carp increased; excluding a documented reporting discontinuity left the decline and all diversity trends unchanged. Changepoints in landings (~1971, ~1978, ~2002) did not coincide with a compositional boundary at 1990/1991, so production decline and reorganization were not synchronous. Composition differed strongly among three a priori periods (PERMANOVA R2 = 0.656, p = 0.001), reflecting a shift from native dominants to a low-production assemblage increasingly influenced by non-native Gibel carp; diversity increased while recorded richness showed no trend. Eight series yielded viable catch-only fits. Estimated terminal biomass lay below one-fifth of BMSY for six, irrespective of terminal year, whereas exploitation ratios were strongly terminal-year dependent: five of eight changed Kobe quadrant between 2022 and 2024, owing to carried-forward values in the final two years. Severe depletion of the native taxa is therefore the robust stock-status finding; single-year exploitation classifications remain conditional on terminal year.
1. Introduction
Freshwater ecosystems occupy a very small fraction of the Earth’s surface, yet they support a disproportionately rich biota, including approximately one-third of all vertebrate species, and provide food, livelihoods, and ecosystem services that are tightly connected to surrounding landscapes [1,2]. That ecological concentration also makes freshwater fishes highly vulnerable: overexploitation, pollution, hydrological alteration, habitat degradation, and non-native species act jointly rather than independently, and their effects are often strongest where endemism and hydrological fragmentation limit replacement or recolonization [1,3]. Freshwater biodiversity is now declining at rates far exceeding those documented for terrestrial or marine systems [2,4]. The Mediterranean Basin is a particularly clear example of this conservation challenge because its freshwater fish fauna is characterized by high endemism and by persistent exposure to water extraction, drought, pollution, dams, and introduced species [5]. Greece is within this regional hotspot, and its freshwater fishes have long been examined from biodiversity, fishery, and habitat perspectives [6]. A recent national synthesis recorded 122 fish taxa in 170 lentic ecosystems for which information was available, estimated that 37.23% of those taxa were threatened, and emphasized that fish composition remains unknown for a large proportion of Greek standing waters [7]. Long-term, system-specific evidence is therefore essential for translating a broad regional concern into defensible local conservation and fishery decisions.
Long-term information of this kind remains rare for Greek lakes: a 120-year reconstruction of Lake Kastoria is one of the few examples demonstrating the scale of compositional and functional change that can accumulate in such a system [8]. Comparable long-term information is needed for other important Greek lakes, particularly where fish communities support both conservation values and commercial fisheries.
Fishery landings provide one of the few consistently available historical archives for many inland systems. They are not, however, neutral proxies for fish abundance: landings reflect biomass and recruitment together with fishing effort, gear selectivity, market demand, regulation, reporting practices, and changes in targeting. Catch-only assessment models can extract useful information from such series, but simulation and comparative studies have repeatedly shown that their performance depends on the shape of the catch history, the realism of productivity and depletion assumptions, and the quality of independent priors [9,10,11,12]. Consequently, landings are most defensibly interpreted as records of fishery removals and relative production signals, rather than as unbiased estimates of population biomass. This distinction is central in data-limited lake fisheries, where formal survey time series, effort data, age composition, and long-term catch-per-unit-effort records are commonly unavailable.
Lake Volvi (40°41′ N, 23°30′ E), northern Greece, is an appropriate system in which to address this problem. As a warm-monomictic, eutrophic Mediterranean lake within the protected Koronia–Volvi wetland complex and the Natura 2000 network, it supports a rich ichthyofaunal assemblage of at least 24 documented species, including native and endemic taxa together with introduced and translocated species [6,7,13]. The lake holds exceptional conservation significance as the sole habitat of the Macedonian shad (Alosa macedonica), a landlocked alosid endemic listed as Critically Endangered on the IUCN Red List [14,15,16], and of the Volvi bleak (Alburnus volviticus), classified as Endangered [17]. The lake has supported a historically important commercial fishery operated primarily by professional fishers using gill nets and trammel nets, with catches historically dominated by native cyprinids such as bream (Abramis brama), common carp (Cyprinus carpio), and roach (Rutilus rutilus), alongside predators including pike (Esox lucius), European perch (Perca fluviatilis), and wels catfish (Silurus glanis), as well as the catadromous European eel (Anguilla anguilla) [18,19]. Ecological research has also established that the lake supports a complex food web and functionally differentiated fish guilds: an ecosystem model described the structure and functioning of the lentic food web [18], while seasonal diet analysis showed that several abundant fishes occupy relatively narrow trophic niches and partition prey resources by season and body size [20]. More recently, the establishment and rapid numerical expansion of invasive species, notably pumpkinseed (Lepomis gibbosus) and Gibel carp (Carassius gibelio), has highlighted the potential for invasion-driven reorganization of littoral assemblages and for competitive overlap with native species [13,21]. Despite this rich but fragmented evidence base, the lake still lacks a unified analysis of how species-specific fishery production, assemblage composition, diversity, and data-limited stock status have changed across the full modern fishery record. Catch-only stock status has previously been estimated for five commercially important taxa [22], but not alongside the assemblage-level, diversity, and state-space evidence required to interpret it.
A comprehensive assessment of such a long record requires complementary approaches because change may be gradual, nonlinear, abrupt, or expressed primarily through shifts in assemblage composition. We therefore combined trend analysis, flexible temporal modelling, changepoint detection, multivariate community analysis, diversity metrics, state–space modelling, forecasting, and catch-only stock assessment. Together, these approaches allow long-term changes in production, composition, diversity, temporal dynamics, predictability, and stock-status signals to be examined from different perspectives.
Catch-only stock assessment can provide useful screening-level information where conventional abundance and effort data are unavailable [10,11,12,13,23]. However, such estimates depend on catch-history structure and prior assumptions and should therefore be interpreted cautiously. In the present study, taxa with viable CMSY2 trajectories are assessed using their estimated biomass and exploitation ratios, whereas taxa without viable trajectories are classified as indeterminate rather than assigned unsupported stock-status categories.
Here, we analyze a 64-year annual landing time series for ten commercially recorded fish taxa from Lake Volvi, spanning 1961–2024. The study integrates complementary analyses to address six questions: (i) how total and species-specific landings changed over six decades; (ii) whether temporal dynamics were gradual, nonlinear, or punctuated by statistically supported changepoints; (iii) whether the composition and dominance structure of the fishery assemblage shifted among distinct periods; (iv) how richness, evenness, and effective diversity changed through time; (v) whether taxa exhibited coherent or divergent long-term dynamics; and (vi) what near-term trajectories and data-limited stock-status signals can be supported by the available information. Because an anomalously low total-landings observation occurred in 1979, all major interpretations are evaluated with explicit attention to the influence of that year rather than allowing a single observation to determine the conclusions. This design separates robust temporal patterns from short-term anomalies and distinguishes evidence about fishery production from stronger claims about underlying population biomass.
2. Materials and Methods
The analyses are reported at two levels. Trend, nonlinear and changepoint analysis, multivariate composition and diversity, and catch-only stock assessment constitute the primary assessment and are reported in full below. State–space modelling, forecasting and stationarity testing are supporting analyses: they are used to check the consistency of the primary results and to establish what the landing record cannot resolve, and their detailed output is given in the Supplementary Materials.
2.1. Study Area and Data Sources
Lake Volvi (40°40′59″ N, 23°19′59″ E) is a large, warm-monomictic natural lake in the Mygdonia Basin of northern Greece (Figure 1). Together with Lake Koronia, it forms the “Lakes Volvi & Koronia” Ramsar wetland (Site No. 57), designated in 1975 [24]. Lake Volvi is commonly reported as the second-largest natural lake in Greece. Its morphometric estimates vary somewhat among sources and survey dates, but recent fisheries and ecosystem studies describe a surface area of approximately 67–75 km2, a maximum depth of approximately 23 m, a mean depth of about 13.5 m, and a catchment of roughly 1247 km2 [18,19]. The lake drains eastward to the Strymonikos Gulf through the Richios River and the Rentina gorge.
Figure 1.
Bathymetric and topographic map of Lake Volvi, northern Greece.
The fish fauna includes native and introduced taxa, and the lake has a longstanding artisanal fishery that is socially and economically important to local communities [13,19,25]. Fishing is conducted mainly by small-scale fishers using passive gear, including gill nets, trammel nets, fyke nets, and longlines; industrial trawling is not conducted in the lake. Because the present study is based on annual reported landings rather than survey catches, terms such as “assemblage composition,” “diversity,” and “stock status” are used throughout as landing-based descriptors and assessment indicators, not as direct measures of true abundance, biological species richness, or unbiased stock biomass.
Annual landings for 1979 (99,200 kg) were flagged as a potential reporting or observation anomaly because the value was markedly lower than in neighboring years. The observation was retained in all primary analyses, and its influence was evaluated by repeating Mann–Kendall tests after its exclusion. A second sensitivity analysis addressed a potentially reconstructed or systematically affected 1999–2012 taxon-level record by repeating species-specific Mann–Kendall trends, diversity analyses, PERMANOVA, and PERMDISP after excluding this interval; CMSY2 and the forecasting models were not refitted on the censored series. Both are sequential biomass-dynamics formulations in which each year’s state is propagated from the preceding year, so deleting a contiguous 14-year block is not a missing-data problem but a mis-specification: the 2013 biomass would be projected as though it followed 1998, and the resulting reference points would describe a fishery that never existed. The exclusion is also not uniformly feasible; Gibel carp is fitted over 1999–2022, so removal of 1999–2012 would delete 14 of its 24 observations and leave the series unassessable. The terminal-year ratios that determine the status classifications are instead set by the 2013–2022 record, which lies entirely outside the questionable interval.
A third feature concerns the final two years of the archive: seven of the ten categories carry identical values in 2023 and 2024 (common bream, Macedonian shad, roach, northern pike, European eel, European perch and wels catfish), a pattern diagnostic of carried-forward rather than independently collected reporting. Because CMSY2 status classifications are determined entirely by terminal-year ratios, a terminal year inside that block propagates the duplication directly into the quantities that define stock status. All status estimates reported here therefore use 2022, the last year not affected by the duplication, and the dependence of the classifications on that choice is quantified in Section 3.4 and Table S7.
2.2. Trend, Nonlinear, and Time-Series Analysis
Monotonic trends in total landings, all ten landing categories, and annual diversity metrics were screened with the Mann–Kendall test [26,27]. Because serial correlation can inflate trend significance in environmental time series, the Hamed and Rao variance correction [28,29] was applied to total landings and to the ten landing categories and is reported as the primary result for those series. The correction was not extended to the annual diversity metrics or to any of the sensitivity analyses; classical Mann–Kendall p-values are reported for those and are identified as such wherever they appear. Trends are interpreted alongside the generalized additive models, changepoint analyses, and the 1979 sensitivity analysis rather than as standalone proof of population change.
Trend magnitude was estimated with Sen’s median slope and its 95% confidence interval [30]. Series were classified as increasing when τ > 0 and p < 0.05, decreasing when τ < 0 and p < 0.05, and otherwise as having no statistically supported monotonic trend. Slopes are reported in kg year−1 for landing series and in index units year−1 for diversity metrics.
Ten-year forecasts for 2025–2034 were generated for total landings and eight named taxa. All forecasts were produced in metric tons. Forecasts are projections of the landing series under its historical statistical structure, not predictions of fish biomass or management outcomes. ARIMA models were selected in the forecast package [23,31]. For full-series fits, an exhaustive search was used, with model selection by the corrected Akaike information criterion (AICc). Forecasts were produced with 80% and 95% prediction intervals. Residual autocorrelation was examined with a Ljung–Box test [32] (Table S5).
Additional models were exponential smoothing state–space models (ETSs) [33], the Theta method [34], and three benchmarks: naïve random walk, random walk with drift, and the historical mean. An equally weighted ensemble was calculated as the arithmetic mean of the available ARIMA, ETS, and Theta point forecasts [35].
Forecast accuracy was assessed by rolling-origin cross-validation [36] with an initial training window of ten years and a five-year forecast horizon. ARIMA was refitted with the faster stepwise search inside cross-validation. Errors were summarized on the metric ton scale as root mean squared error (RMSE), mean absolute error (MAE), and mean absolute scaled error (MASE) [37]. The best model for each series was selected by the lowest cross-validated RMSE. A win by the naïve benchmark was retained as a valid result indicating limited predictable temporal structure.
Structural changes in total annual landings were assessed with three complementary methods so that inference would not depend on a single segmentation algorithm.
First, the pruned exact linear time (PELT) algorithm was used to detect simultaneous changes in mean and variance under a Normal test statistic [38,39]. The modified Bayesian information criterion (MBIC) was used as the penalty because it is more conservative than an ordinary BIC penalty in multiple-changepoint settings and reduces over-segmentation [40].
Second, Bai–Perron multiple structural-break analysis was applied to a linear regression of total landings on year, with a minimum segment length of five observations and the number of breaks selected by BIC [41,42]. Third, piecewise linear regression was fitted using the segmented package [43], with the number of breakpoints selected by BIC over candidate models with one to four breaks rather than fixed a priori.
These methods answer different questions: PELT locates shifts in the mean and variance of a piecewise-constant process, whereas Bai–Perron and segmented regression locate changes in the parameters of linear segments in year. Exact agreement on break years is therefore not expected, and the number of breaks returned by each method is not itself an estimate of the number of ecological regimes. The final interpretation emphasized years at or near which more than one method indicated change, rather than the raw number of breaks from any one method.
As a complementary descriptive diagnostic, annual catch anomalies were calculated as deviations from the 1961–2024 mean, and a centered five-year rolling mean was computed with the zoo package [44] to visualize low-frequency fluctuations.
2.3. Data-Limited Stock Assessment
Catch-only stock assessment was performed with the CMSY2 method [9,45] as implemented in the datalimited2 package [46]. The CMSY++ variant [45] has been applied to five Volvi taxa elsewhere [22]. CMSY2 uses Monte Carlo filtering of plausible intrinsic growth rate (r) and carrying-capacity (K) combinations, constrained by catch history and prior ranges for relative biomass, to estimate MSY, BMSY, FMSY, and terminal B/BMSY and F/FMSY. All ten landing categories had at least 15 non-zero years and therefore entered the assessment step. The “Other species” aggregate was retained because it met the data criterion, but its estimates were interpreted only as a category-level screening indicator.
Resilience priors were assigned from life-history categories used in FishBase [47]: very low for European eel; low for northern pike and wels catfish; medium for common bream, Macedonian shad, common carp, and the aggregate category; and high for roach, European perch, and Gibel carp. Each series was analyzed from its first non-zero year through 2022, the terminal year used for all reported status classifications; catches were expressed in metric tons, so Gibel carp was assessed on 1999–2022 (24 years) and all other categories on the full record to 2022. Because cmsy2() is not reproducible under a fixed seed, every series was fitted twelve times and is summarized by the replicate median with the observed range. To quantify the influence of the duplicated final years, each converged series was additionally refitted with the catch history truncated at 2024, again twelve times, and the two sets of terminal ratios and quadrant assignments were compared (Section 3.4, Table S7).
For taxa with viable CMSY2 trajectories, terminal status was plotted in Kobe space using B/BMSY and F/FMSY [48]. Where terminal catch was zero, F/FMSY is undefined rather than low; such series are reported as depleted with indeterminate exploitation status and are excluded from quadrant assignment.
Quadrants were assigned from the terminal-year point estimates using the rule implemented in the analysis code: sustainable (B/BMSY ≥ 1, F/FMSY ≤ 1), overfishing (B/BMSY ≥ 1, F/FMSY > 1), recovering (B/BMSY < 1, F/FMSY ≤ 1), and overfished with overfishing (B/BMSY < 1, F/FMSY > 1). Because a point estimate alone can place a stock in a quadrant that its uncertainty does not support, the 95% credible intervals returned by CMSY2 for terminal B/BMSY and F/FMSY were extracted from the model output and used to qualify every assignment: where a credible interval spans the reference value of 1, the quadrant assignment is reported as statistically unresolved rather than as a status determination.
Where terminal catch is zero, F/FMSY is undefined rather than low, because it is computed as terminal catch divided by terminal biomass. Such series are reported as depleted with indeterminate exploitation status and are excluded from quadrant assignment altogether, rather than being assigned to the recovering quadrant by default. Two series meet this condition at one terminal year but not the other: wels catfish at 2022 and European eel at 2024.
2.4. Landing Composition, Diversity, and Cross-Correlation
Multivariate composition analyses used the annual matrix of the ten landing categories, after retaining columns with non-zero totals (all ten were retained). Thus, “community composition” here means the composition of reported landing categories, including the aggregate category, rather than the complete landing composition. Values were Hellinger-transformed before ordination to reduce the influence of dominant landings and to provide an appropriate transformation for subsequent Euclidean- and Bray–Curtis-based analyses [49]. Analyses were conducted primarily with vegan [50].
Principal component analysis (PCA) was fitted to the Hellinger-transformed matrix as an unconstrained redundancy analysis [51]. Years were plotted as site scores and landing categories as loadings, with points colored by year and symbolized by the three descriptive periods.
Non-metric multidimensional scaling (NMDS) was performed on Bray–Curtis dissimilarities calculated from the Hellinger-transformed matrix, using two dimensions, up to 200 random starts, and the fixed random seed [52]. Stress was interpreted using conventional thresholds, with values below 0.10 indicating an excellent two-dimensional representation and values below 0.20 generally acceptable [53]. Period-specific 75% Student-t ellipses were overlaid for visualization. Applying Bray–Curtis dissimilarity to Hellinger-transformed values is a compound transformation; it was retained for consistency across the ordination, permutational and clustering analyses, and dissimilarities are accordingly interpreted as relative-composition distances rather than as raw Bray–Curtis distances on landed mass.
Differences among the three descriptive periods were tested by permutational multivariate analysis of variance (PERMANOVA) with Bray–Curtis dissimilarity and 999 permutations [54]. The global model used period as the sole factor, and all pairwise period comparisons were fitted with the same dissimilarity and permutation count. R2 was reported as an effect-size measure. Pairwise p-values are unadjusted for multiplicity and are used descriptively, because the period factor was fixed a priori and the analysis was not designed as a formal multiple-testing experiment. Homogeneity of multivariate dispersion among periods was evaluated using betadisper() based on the same Bray–Curtis dissimilarity matrix, with distances calculated to group medians. Differences in dispersion were tested using a permutation test with 999 permutations. Because the full dataset showed significant heterogeneity of dispersion, the PERMANOVA and PERMDISP analyses were additionally repeated after excluding the potentially reconstructed 1999–2012 reporting interval as a sensitivity analysis. Because years form an ordered, autocorrelated sequence, the PERMANOVA was additionally tested under a restricted permutation scheme of cyclic series shifts, which preserves temporal dependence. With 64 years, the design admits 63 non-trivial shifts; together with the observed ordering, these give 64 distinguishable arrangements, which were enumerated completely, so the minimum attainable p-value is 1/64 = 0.0156.
Years were also grouped by agglomerative hierarchical clustering of Bray–Curtis dissimilarities using Ward’s minimum-variance criterion as implemented by Ward.D2 [55]. The gap statistic was calculated with 500 bootstrap reference datasets and the Tibs2001SEmax selection rule [56], with the diagnostic search allowing up to ten clusters; the reference distribution generated by clusGap is Euclidean-based, whereas the clustering function itself used Bray–Curtis dissimilarity, so the two are not fully commensurate. The rule selected the upper boundary of the search (k = 10); that is, it did not identify an interior optimum, and a ten-cluster partition of 64 years has no parsimonious ecological interpretation. The dendrogram was therefore cut at six clusters purely as a visual aid; this cut is reported as an interpretability constraint and is not presented as a statistically supported number of compositional groups. A heatmap of min–max-scaled annual landings was used to visualize category contributions to the resulting year clusters.
Annual diversity was calculated from the same ten-column landing matrix used in the ordination analyses. The metrics were Shannon diversity (H′) [57], Simpson diversity (1 − D) [58], observed category richness (S), and Pielou evenness (J′ = H′/ln S) [59].
Hill numbers were computed at q = 0, 1, and 2 [60,61]: q = 0 equals observed category richness; q = 1 is exp(H′), the effective number of common categories; and q = 2 is 1/(1 − D), the effective number of dominant categories. These measures provide a common effective-number scale [62]. Because q = 0 is identical to S and q = 1 is a monotone function of H′, the seven reported metrics represent four independent quantities; where both members of such a pair are tested, the two tests are not independent evidence and are reported together. Because the matrix includes the aggregate “Other species” column and has a maximum of ten categories, q = 0 and S should not be interpreted as biological species richness. All diversity results quantify diversity and evenness of recorded landing composition is sensitive to reported zeros in 1999–2012.
Temporal trajectories of the seven diversity metrics were smoothed separately with Gaussian GAMs using the mgcv package [63], with REML and a thin-plate spline with k = 8. Monotonic trends were also screened with Mann–Kendall tests and Sen’s slopes, with the exception that the Hamed and Rao variance correction was not applied; classical p-values are reported for the diversity metrics. Because these indices are computed from the same autocorrelated landing matrix, they are themselves serially dependent, so the reported p-values are uncorrected in that respect and are not directly comparable with the corrected values reported for the landing series. Confidence intervals for Sen’s slopes were not retained for the diversity metrics. Boxplots by the three descriptive periods were used for visual comparison.
Lagged associations among the nine named taxa were explored with pairwise cross-correlation functions (CCFs) for all 36 taxon pairs at lags from −10 to +10 years [64]. The aggregate category was excluded. Following the ccf() convention, a coefficient at lag k describes the correlation between the first series at time t + k and the second series at time t, so negative lags indicate that the first-named taxon leads. Approximate 95% reference bounds were calculated as ±1.96/√n, with n = 64, giving ±0.245.
2.5. State–Space Modelling, Temporal Clustering, and Stationarity
A multivariate autoregressive state-space (MARSS) model was fitted simultaneously to the nine named taxa using the MARSS package [65]. The aggregate category was excluded. Annual landings in kilograms were transformed as log(x + 0.01) to retain zero observations. The fitted model represented each taxon’s latent log-landing state as a random walk with taxon-specific drift.
All candidate models shared B = identity (density-independent state dynamics), U = unequal (taxon-specific drift), Z = identity and A = zero, so that each latent state maps one-to-one onto its observed series. The constraints placed on Q and R were not fixed a priori, because they determine the precision with which individual drift rates can be estimated: with both matrices constrained to “diagonal and equal”, a single process variance and a single observation variance are shared across all nine taxa, and every drift coefficient therefore carries an identical standard error by construction. Four specifications were fitted, crossing “diagonal and equal” against “diagonal and unequal” for Q and for R, and compared by AICc. Off-diagonal terms were fixed at zero in all four, so process and observation errors were treated as taxon-specific but mutually independent; the model does not estimate covariance in process error among taxa.
The unconstrained specification (Q and R both diagonal and unequal) returned the lowest AICc but did not converge, nor did the Q-equal/R-unequal alternative. Inference was therefore based on the best-supported converged structure, Q = diagonal and unequal with R = diagonal and equal, in which each taxon has its own drift and its own process variance while sharing a common observation variance. All state estimates and drift coefficients derive from the selected specification.
Parameters were estimated by expectation–maximization. Standard errors and approximate two-sided Wald p-values were calculated from drift/SE ratios; these are asymptotic approximations and are reported as such.
Discrete temporal structure in named-taxon landings was explored by K-means clustering of years. The matrix contained the nine named taxa; the aggregate category was excluded. Each taxon column was z-standardized so that high-volume and low-volume taxa contributed on comparable scales, and clustering used Euclidean distance on the standardized matrix. Candidate numbers of clusters were inspected using the gap statistic using up to 8 clusters and 200 bootstrap replicates.
Cluster separation was summarized by mean silhouette width [66]. Cluster diagnostics and silhouette summaries were produced with factoextra and cluster [67,68].
The stationarity properties of total landings and all ten landing categories were examined with the Augmented Dickey–Fuller (ADF) test, whose null hypothesis is a unit root [69], and the Kwiatkowski–Phillips–Schmidt–Shin (KPSS) test, using the tseries package [70,71]. The ADF test was run against the stationary alternative with the default lag order, trunc((n − 1)^(1/3)); the KPSS test was run against the level-stationarity null only, and no trend-stationarity variant was fitted.
All analyses were run in R 4.6.1 [72], with state-space modelling performed in MARSS, catch-only assessment in datalimited2, GAM smoothing in mgcv [63], and multivariate community analyses in vegan.
3. Results
3.1. Data Structure, Quality Control, and Production Trends
Total annual landings were highly variable across the record (Figure 2a). The year 1979 was flagged as a potential reporting anomaly because the recorded total was only 99.2 t, against 296.7 t in 1978 and 236.1 t in 1980.
Figure 2.
Six decades of total fish landings and catch anomalies in Lake Volvi, 1961–2024. (a) Annual total landings (metric tons), with the anomalous 1979 observation highlighted in red. (b) Annual deviations from the 1961–2024 long-term mean, overlaid with the five-year centered rolling mean, showing sustained positive anomalies until the late 1970s, a transition through the 1980s, and persistent negative anomalies thereafter.
The 1979 reduction was not confined to one or two taxa but affected all ten categories simultaneously and in similar proportion, a pattern more consistent with incomplete reporting or a truncated fishing season than with a synchronous ecological event. The observation was retained in all primary analyses, and its influence on monotonic-trend inference was evaluated separately by refitting the Mann–Kendall tests without 1979.
Across the full archive, total landings reached a maximum of 619.7 t in 1962 and a minimum of 11.2 t in 2007, and stood at 63.3 t in 2024, 89.8% below the 1962 maximum. Decadal means, standard deviations, coefficients of variation, and ranges are summarized in Table 1.
Table 1.
Decadal summary of total fish landings in Lake Volvi, 1961–2024. The 1960s (n = 9) and 2020s (n = 5) are incomplete decades; all others comprise ten years. CV is expressed as a percentage of the decadal mean.
Mean decadal landings fell from 473.3 t in the 1960s to a minimum of 15.8 t in the 2000s, an order-of-magnitude reduction, while the coefficient of variation rose from 19.0% to a maximum of 36.9% in the 2010s. Decadal means recovered from 15.8 t in the 2000s to 42.3 t in the 2010s and 47.0 t in the 2020s, approximately a threefold increase over the decadal minimum. This partial recovery in reported yield was driven almost entirely by common carp and Gibel carp and was not accompanied by any recovery of the historically dominant native taxa. Decadal statistics for the 1960s and 2020s are based on nine and five years, respectively; all other decades comprise ten years.
Species-specific landing trajectories were strongly heterogeneous, and the taxa dominating the historical catch differed almost completely from those dominating recent decades.
During 1961–1979, the fishery was dominated by roach (mean 191.3 t yr−1; 44.0% of landings) and Macedonian shad (120.6 t yr−1; 27.7%), with European perch (43.3 t yr−1; 10.0%) and common bream (33.7 t yr−1; 7.8%) contributing most of the remainder; Gibel carp was absent from the record. During 1980–1998, roach remained the largest single component (40.7 t yr−1; 35.3%), but common bream rose to second place in relative terms (29.1 t yr−1; 25.2%) as Macedonian shad collapsed to 10.1% of landings. During 1999–2024, the two carp species accounted for over half of all reported landings, Gibel carp 9.0 t yr−1 (27.5%), and common carp 8.4 t yr−1 (25.9%), followed by European perch (13.2%), roach (11.0%), and common bream (9.7%), while Macedonian shad and European eel had fallen to 3.9% and 0.3%, respectively.
Relative to their individual historical maxima, mean landings in 2020–2024 were 99.9% lower for European eel (peak 69.8 t in 1967), 99.5% lower for both Macedonian shad (397.6 t in 1964) and wels catfish (16.8 t in 1967), 98.9% lower for roach (388.1 t in 1971), 98.3% lower for common bream (130.7 t in 1967), 94.3% lower for European perch (69.7 t in 1971), and 88.9% lower for northern pike (16.1 t in 1981). Common carp was the sole taxon whose maximum fell in the terminal year of the record (22.4 t in 2024), and Gibel carp, first recorded in 1999, peaking at 24.1 t in 2014, averaged 13.1 t yr−1 over 2020–2024. European eel was recorded as zero in 2023 and 2024, and the final-year CMSY2 fit for European eel accordingly estimated zero fishing mortality. Wels catfish was recorded in only 17 of 64 years, was absent from the landings for 45 consecutive years (1978–2022) and reappeared at 192 kg in 2023–2024.
Both absolute and proportional catch composition showed a clear temporal reorganization (Figure 3). The early record was characterized by a native-dominated assemblage; later years were shaped by the near-disappearance of formerly important native taxa and by the rise of common and Gibel carp. The identity of the dominant taxa continued to change, and the 2010s–2020s partial recovery in total yield represents a compositionally different fishery rather than a return toward the historical state. The Spearman rank-correlation matrix among the ten recorded categories is provided as a supplementary visual summary of co-varying landing histories; because these series are autocorrelated and non-stationary, individual coefficients are descriptive and are not interpreted as evidence of causal species interactions.
Figure 3.
Temporal restructuring of absolute and relative catch composition in Lake Volvi, 1961–2024. (a) Stacked annual landings by taxon (metric tons). (b) Proportional contribution of each taxon to annual landings. Together the panels separate change in fishery magnitude from change in assemblage composition; the residual “Other species” category is excluded from both panels.
3.2. Monotonic Trends, Nonlinear Trajectories, and Changepoints
Mann–Kendall tests and Sen’s slope estimates were computed for total landings and all ten catch series over 1961–2024 (Table 2). Of the ten landing categories, six showed statistically significant monotonic declines (common bream, Macedonian shad, roach, northern pike, European eel, and “Other species”; all p < 0.001), one showed a significant increase (Gibel carp; τ = 0.692, p < 0.001), and three showed no statistically supported monotonic trend (common carp; τ = 0.089, p = 0.548; perch −0.319, p = 0.089; wels catfish −0.478, p = 0.093). Total landings declined significantly (τ = −0.682, p < 0.0026) at a Sen’s slope of −7449.7 kg yr−1 (95% CI −8968.4 to −5950.0), equivalent to −7.45 t yr−1 (95% CI −8.97 to −5.95). The steepest declines by rank correlation were those of Macedonian shad (τ = −0.708), roach (τ = −0.635), and European eel (τ = −0.609); the largest absolute rates of loss were for roach (−2440.2 kg yr−1), Macedonian shad (−1083.5 kg yr−1), and common bream (−570.7 kg yr−1).
Table 2.
Mann–Kendall trend tests and Sen’s slope estimates for total and taxon-specific landings in Lake Volvi, 1961–2024. Significance codes refer to the Hamed and Rao corrected p-value, which is the primary result: *** p < 0.001; ** p < 0.01; ns, not significant at α = 0.05. Sen’s slope and its 95% confidence interval are in kg yr−1. † Significant ordinal decline under the classical test, but Sen’s slope is not estimable because 47 of 64 years are zeros (see text).
Generalized additive models were fitted to total landings and the nine named taxa to characterize nonlinear temporal structure that a monotonic test cannot represent.
A Tweedie family with a log link and identity transformation of the response was successfully fitted for all ten series; no fallback to the log1p-Gaussian or untransformed-Gaussian specifications was required. The year smooth was statistically significant for every series (all p < 0.001). Deviance explained ranged from 59.7% (common carp) to 96.2% (total landings), and from 59.7% to 95.8% (Gibel carp) among the nine named taxa. Adjusted R2 ranged from 0.151 for wels catfish, reflecting the zero-dominated structure of that series, to 0.891 for Gibel carp and 0.938 for total landings. Effective degrees of freedom ranged from 4.65 (perch) to 14.08 (northern pike), confirming that most trajectories were strongly nonlinear rather than approximately linear.
The pre-specified single refit at k = 20 was triggered for five series (common bream, Macedonian shad, common carp, northern pike, and perch). After that refit, the basis-dimension check remained inadequate for four of them, common bream (k-index = 0.795, p = 0.042), Macedonian shad (0.726, p = 0.006), common carp (0.603, p = 0.002), and perch (0.508, p < 0.001), indicating a residual short-timescale structure that a single thin-plate smooth of year does not capture. Because the script applied only one refit by design, these four smooths should be read as descriptive summaries of the low-frequency trajectory rather than as fully adequate models of interannual variation. The remaining six series passed the basis check (k-index 0.779–1.113, p ≥ 0.070). Series containing extended zero stretches, particularly Gibel carp (38 zero years) and wels catfish (47 zero years), should be interpreted with additional caution because single smooth terms are sensitive to sparse non-zero observations.
Species-level trend classifications were also largely robust to exclusion of the potentially reconstructed 1999–2012 interval. Total landings and all eight categories classified as declining under the classical test in the full dataset remained significantly declining, while Gibel carp remained significantly increasing. Common carp was the only exception: its full-series trend (τ = 0.089, p = 0.305) became significantly positive after exclusion of 1999–2012 (τ = 0.222, p = 0.024). As in the 1979 analysis, this comparison rests on classical p-values before and after exclusion, because the Hamed and Rao variance correction was not re-applied to the censored series; the count of eight therefore refers to the uncorrected test, and the corresponding full-series count under the correction reported as our primary result is six (Table 2). The two taxa responsible, European perch and wels catfish, decline more steeply on exclusion of the interval (τ = −0.320 to −0.410 and −0.478 to −0.513 respectively) rather than less, but because their full-series significance does not survive the correction, their classification in the censored series is not established either. The common carp values are likewise uncorrected, so the emergence of a significant positive trend on exclusion is best read as evidence that this taxon’s classification is sensitive to the reporting interval rather than as a corrected test of trend. The absence of a monotonic trend for common carp in the complete archive should therefore be interpreted cautiously. A consolidated account of this exclusion test, covering total landings, composition and diversity as well as the taxon-specific trends, is given in Section 3.7 and Table S6.
Trend classifications were likewise insensitive to the coding of the structural zeros. Re-coding the thirteen roach and four common carp zeros recorded within 1999–2012 as missing changed neither classification: roach remained in a significant decline with a steeper rank correlation (τ = −0.635 to −0.728; p < 0.001 in both cases), and common carp remained without a statistically supported trend (τ = 0.089 to 0.137; p = 0.305 to 0.124). The four annual diversity indices are invariant to this re-coding by construction and are unchanged.
The three changepoint procedures converged on several broad transition periods, although they differed markedly in resolution (Figure 4). PELT applied to simultaneous changes in mean and variance under an MBIC penalty identified seven changepoints (1978, 1984, 1988, 1994, 1999, 2002, and 2009). Bai–Perron multiple structural-break analysis of total landings on year, with a minimum segment length of five years and the number of breaks selected by BIC, returned four breakpoints (1965, 1971, 1978, and 2002). Segmented regression, with the number of breakpoints selected by BIC, returned three breakpoints at 1973, 1980 and 2002. BIC decreased by 14.5 units from two to three breakpoints (1594.07 to 1579.60) and was effectively unchanged at four (1579.29, ΔBIC = 0.31), and Davies’ test confirmed a significant non-constant slope (p = 1.0 × 10⁻¹³); three breakpoints is additionally the only competitive solution whose segments all satisfy the five-observation minimum length imposed on the Bai–Perron analysis (Table S10). Agreement across methods, rather than the raw number of breaks from any one method, identified three transition windows: the early 1970s (Bai–Perron 1971, segmented 1973), the late 1970s (PELT 1978, Bai–Perron 1978, segmented 1980), and the early 2000s (PELT 1999 and 2002, Bai–Perron 2002, segmented 2002). Each window is therefore supported by at least two independent procedures.
Figure 4.
Changepoint consensus in total Lake Volvi landings, 1961–2024. Annual total landings with breakpoints from three independent detection procedures shown as distinct line types: PELT (red dashed; 1978, 1984, 1988, 1994, 1999, 2002, 2009), Bai–Perron (blue dotted; 1965, 1971, 1978, 2002), and segmented regression with the number of breakpoints selected by BIC (purple long-dash; 1973, 1980, 2002).
K-means clustering of z-standardized taxon-specific landings was run with k = 3, specified a priori for interpretability after inspection of elbow and gap-statistic diagnostics. The resulting partition did not, however, correspond to three sequential production regimes. Cluster 1 (n = 28 years) comprised 1961–1990 except for 1967 and 1979 and had a mean total of 333.7 t yr−1 (range 93.8–619.7 t). Cluster 2 (n = 35 years) comprised 1991–2024 plus the anomalous year 1979 and had a mean total of 42.8 t yr−1 (range 11.2–99.2 t). Cluster 3 contained the single year 1967 (458.7 t), which is separated from its neighbors by a simultaneous collapse of Macedonian shad (1.2 t, against 113.1 t in 1966 and 87.8 t in 1968) and unusually high common bream (130.7 t), European eel (69.8 t), and wels catfish (16.8 t). The overall mean silhouette width was 0.365, with well-separated structure in cluster 2 (0.499), weaker structure in cluster 1 (0.210), and an undefined value of 0 for the singleton cluster 3.
With the full archive, the unsupervised temporal clustering supports a two-state description of the fishery, a high-production state up to 1990 and a low-production state from 1991 onward, together with two outlier years (1967 and 1979), rather than three sequential regimes. This outcome is conditional on retaining 1967; however, excluding that year resolves three sequential production regimes (Section 3.8). It is notable that the 1990/1991 boundary identified by clustering does not coincide with any of the three cross-method changepoint windows in total landings. This is not a contradiction: the changepoint analyses were applied to total landings, whereas the clustering used the standardized nine-taxon composition matrix, in which each taxon contributes equally regardless of tonnage. The divergence indicates that compositional reorganization and production decline were not perfectly synchronous. Regime centroids are given in Table 3.
Table 3.
Mean landings (t yr−1) by taxon for each k-means temporal regime, Lake Volvi, 1961–2024. Clustering used z-standardized landings of the nine named taxa; the residual “Other species” category was excluded. Cluster 3 comprises the single year 1967.
3.3. Catch-Only Stock Status
These are model-based indicators derived from the catch history and life-history priors, not measurements of stock size or fishing mortality; they indicate which stocks the available evidence suggests are most depleted and are not a confirmation of biological status.
All ten-catch series met the minimum requirement of at least 15 non-zero years (17 years for wels catfish, 26 for Gibel carp, and 51–64 for the remaining taxa) and were submitted to CMSY2. Each series was fitted from its first non-zero year onward, so the Gibel carp assessment covers 1999–2022 and all others 1961–2022. Convergent reference-point estimates were obtained for eight series. CMSY2 failed for roach and for European perch and failed in the same way for both: under default biomass priors, the Monte Carlo filter retained a single viable r–k pair, below the minimum required for a defensible fit, and the pre-specified relaxation of the initial and terminal biomass ranges returned zero viable pairs. Roach and perch are therefore classified as indeterminate from catch-only information rather than assigned unsupported stock-status categories.
Because roach is recorded as an exact zero for thirteen years within 1999–2012 despite non-zero landings before and after, the assessment was repeated with those values re-coded as missing. CMSY2 again returned no viable r–k pairs, under both default and relaxed biomass ranges. The failure is therefore a property of the roach catch trajectory rather than of how the missing years were entered, although this test rests on a single fit and cmsy2() is not reproducible under a fixed seed.
At the 2022 terminal year, five of the eight converged series fell in the overfished-and-overfishing quadrant: common bream (B/BMSY = 0.089, F/FMSY = 4.78), northern pike (0.191, 6.06), European eel (0.090, 1.07), Gibel carp (0.953, 1.10) and the residual “Other species” category (0.116, 3.38). Common carp was estimated at or just above its biomass reference point with exploitation above FMSY (1.011, 1.65), placing it in the overfishing quadrant. Macedonian shad had an estimated biomass well below its reference level, with estimated exploitation below FMSY (0.063, 0.445). Wels catfish had zero reported landings in 2022, so its exploitation ratio is undefined; it is reported as depleted (B/BMSY = 0.077) with indeterminate exploitation status and is excluded from quadrant assignment. No series was classified as sustainable at this terminal year.
Quadrant assignment was invariant across the twelve replicate fits for every series except common carp, whose biomass ratio straddles the reference level (replicate range 0.992–1.023) and which was assigned to the overfishing quadrant in nine of twelve replicates and to overfished-and-overfishing in the remaining three. European eel is a second marginal case: its exploitation ratio spans unity across replicates (0.998–1.183), so the direction of its exploitation signal is not resolved even though its depletion is. These replicate ranges describe the reproducibility of the Monte Carlo filter and are narrower than the credible limits reported in Table S4; they are not interchangeable with them. The terminal (2022) Kobe assessment showed a marked contrast between the historically important native taxa and the two carp species (Table 4; Figure 5).
Table 4.
CMSY2 catch-only assessment results for Lake Volvi taxa at the 2022 terminal year. r, intrinsic rate of increase; K, carrying capacity; BMSY and FMSY, biomass and fishing mortality at maximum sustainable yield. Values are medians of twelve replicate fits with the replicate range in parentheses, because cmsy2() is not reproducible under a fixed seed. Each series was fitted from its first non-zero year through 2022: 1999–2022 for Gibel carp and 1961–2022 for all other categories. Roach and European perch are indeterminate; no viable r–k trajectory was obtained under default or relaxed priors. Wels catfish had zero reported landings in 2022, so its exploitation ratio is undefined and it is excluded from quadrant assignment. FMSY is reported as 0.5 r where B > ½BMSY; where B/BMSY < 0.5, CMSY2 reduces r and FMSY linearly and the reported ratio is computed against the reduced value. Ninety-five percent credible limits are given in Table S4; the dependence of these classifications on the terminal year is given in Table S7.
Figure 5.
Terminal-year (2022) stock-status Kobe plot for Lake Volvi taxa assessed with CMSY2. Points are medians of twelve replicate fits and bars the observed replicate range, on a square-root F/FMSY axis so that the cluster near the reference level remains legible. Background shading marks the four Kobe quadrants and dashed lines the reference ratios of 1. Wels catfish is plotted as an open symbol on the F/FMSY = 0 axis: its reported landings in 2022 were zero, so its exploitation ratio is undefined rather than low, and it is excluded from quadrant assignment. Roach and European perch are not plotted because no viable CMSY2 solution was obtained. Replicate ranges describe the reproducibility of the Monte Carlo filter and are narrower than the credible limits in Table S4; several of those limits span the reference lines, so point positions should not be read as resolved classifications. The dependence of these positions on the terminal year is shown in Table S7.
Uncertainty around these classifications is substantial and asymmetric. Ninety-five percent credible limits from a single 2022 reference fit are given in Table S4; its point estimates differ from the replicate medians in Table 4, but it assigns every series to the same Kobe quadrant. Depletion is the better-resolved axis: the upper credible limit on B/BMSY lies below the reference level for all six depleted series, and below 0.40 for five of them (common bream 0.184, wels catfish 0.184, Macedonian shad 0.192, European eel 0.193, “Other species” 0.355), the exception being northern pike at 0.564. Exploitation is less well resolved.
The F/FMSY interval excludes the reference level for common bream (2.59–18.59), northern pike (1.97–41.03) and common carp (1.40–3.50), and for Macedonian shad falls just below it (0.128–0.999). It spans unity for European eel (0.51–4.51), Gibel carp (0.89–2.39) and the “Other species” aggregate (0.99–15.97), so the direction of the exploitation signal is unresolved for those three. The biomass ratios of the two carps are likewise unresolved (common carp 0.478–1.195; Gibel carp 0.441–1.191), with Gibel carp being the least resolved series of all, with both intervals spanning the reference level; this is consistent with the terminal-year instability reported in Section 3.4. Wels catfish has no exploitation estimate because its reported catch in 2022 was zero.
Estimated intrinsic growth rates spanned an order of magnitude and were consistent with the assigned resilience priors, ranging from r = 0.062 yr−1 for European eel (very low resilience) to r = 1.19 yr−1 for Gibel carp (high resilience), with intermediate values for northern pike (0.212), wels catfish (0.260), “Other species” (0.285), common bream (0.333), Macedonian shad (0.376), and common carp (0.566). Estimated MSY ranged from 2.88 t for wels catfish and 5.94 t for northern pike to 35.3 t for common bream and 310 t for Macedonian shad. The Macedonian shad estimate exceeds current total landings from the entire lake (63.3 t in 2024) by a factor of five and reflects the magnitude of the historical fishery rather than contemporary productivity. All values are catch-only, prior-dependent estimates and should be used as screening-level indicators rather than as stand-alone management reference points.
3.4. Sensitivity of Terminal Status to the Choice of Terminal Year
Because seven of the ten categories carry identical values in 2023 and 2024, each converged series was refitted with the catch history truncated at 2024 and compared with the 2022 fits that are reported above (Table S7). Five of the eight series change Kobe quadrant between the two terminal years. Macedonian shad moves from recovering at 2022 to overfished at 2024, as its reported catch rises from 1.12 t to 3.95 t; common carp moves from overfishing to sustainable; Gibel carp moves from overfished-and-overfishing to sustainable; European eel moves from overfished-and-overfishing to depleted with indeterminate exploitation, with its catch falling from 231 kg to zero; and wels catfish moves in the opposite direction, from depleted with indeterminate exploitation to overfished, with its catch rising from zero to the 192 kg that is itself one of the duplicated values.
The instability is confined to the exploitation axis and to the two expanding carps. Terminal B/BMSY for the six historically important taxa changes by less than 0.04 between terminal years and remains below 0.2 throughout (common bream 0.089 and 0.084; Macedonian shad 0.063 and 0.066; northern pike 0.191 and 0.152; European eel 0.090 and 0.089; wels catfish 0.077 and 0.076; “Other species” 0.116 and 0.128), and for these six the estimated productivity parameters are likewise stable, with carrying capacity differing by at most 4.7% and MSY by at most 10.7%. For common carp and Gibel carp, by contrast, carrying capacity differs by 40.4% and 23.0% and MSY by the same proportions, because a catch history that is still rising constrains the upper limb of the production curve only weakly; their apparent change in status follows from that re-estimation of K rather than from any change in the fishery.
Two implications follow. First, the depletion of the historically dominant native taxa is a robust result that does not depend on the duplicated final years. Second, single-year exploitation classifications in this fishery are not robust, and the Kobe quadrant of any individual taxon should be read as conditional on the terminal year rather than as a determination of stock status. We therefore base the management discussion below on the depletion signal and on the direction of the long-term trends, and treat the quadrant labels as screening indicators only.
3.5. Multivariate Composition, Diversity, and State–Space Dynamics
Principal component analysis of Hellinger-transformed catch composition showed a strongly directional trajectory of annual landing states through ordination space (Figure S1a; Figure 6). The first two axes explained 70.6% of the compositional variation (PC1 = 56.4%, PC2 = 14.2%), with PC3 accounting for a further 11.7%. PC1 was effectively a time axis: annual scores moved almost monotonically from the negative end of the axis in the 1960s to the positive end in the 2020s, with little revisitation of earlier landing-composition states. Taxon loadings on PC1 identified the compositional contrast underlying this gradient, with roach (−0.240), Macedonian shad (−0.109), and European eel (−0.090) defining the historical negative end, and Gibel carp (+0.240), common carp (+0.130), and perch (+0.081) defining the contemporary positive end. Common bream, wels catfish, and the residual category had near-zero PC1 loadings and contributed little to the primary gradient.
Figure 6.
Multivariate reorganization of the Lake Volvi landing assemblage, 1961–2024. NMDS ordination of Bray–Curtis dissimilarities computed from Hellinger-transformed annual composition (stress = 0.0992), with years grouped by period and 75% Student-t tolerance ellipses overlaid. Points represent years and are colored by year; taxon scores identify the compositional gradients separating periods.
Non-metric multidimensional scaling based on Bray–Curtis dissimilarity corroborated the PCA pattern with an excellent two-dimensional fit (stress = 0.0992). Years assigned to the three descriptive periods, 1961–1979, 1980–1998, and 1999–2024, occupied distinct regions of ordination space, with 75% Student-t tolerance ellipses providing a visual summary of separation (Figure S1b; Figure 6).
PERMANOVA confirmed a strong period effect on landing composition (R2 = 0.656, pseudo-F = 58.1, p = 0.001 under free permutation of years). Because annual landings are serially dependent, the test was repeated under the restricted scheme of cyclic series shifts. The effect size and pseudo-F are unchanged by construction, and the permutation p-value was 0.0156. This is the smallest value attainable: the scheme admits 63 non-trivial shifts, which, with the observed ordering, give 64 distinguishable arrangements, all of which were enumerated, so p cannot fall below 1/64. The restricted result therefore represents the strongest evidence this scheme can provide, and the period effect survives a null distribution that preserves temporal autocorrelation. Importantly, this qualification did not overturn the compositional result. When the potentially reconstructed 1999–2012 interval was excluded, the period effect remained highly significant and increased slightly in magnitude (R2 = 0.685, p = 0.001), whereas dispersion heterogeneity disappeared (PERMDISP F = 0.360, p = 0.721). The temporal differentiation of landing composition is therefore robust to exclusion of the questionable reporting interval and, in the sensitivity dataset, cannot be attributed to heterogeneous multivariate dispersion. These comparisons are tabulated in Table S6b and discussed together with the remaining exclusion tests in Section 3.7.
Hierarchical clustering provided a finer-grained description of compositional turnover. The gap statistic selected ten clusters, the upper boundary of the diagnostic search, which was considered excessively fragmented for a 64-year time-ordered dataset; the partition was therefore capped at six clusters for interpretability, and the dendrogram and accompanying min–max-scaled heatmap present that six-cluster solution (Figure S4). This clustering is exploratory and operates at a different resolution from the two other temporal groupings used here: the k-means partition, specified at k = 3 but resolving into two substantive states separated at 1990/1991 together with the singleton year 1967, and the three a priori periods imposed in the PERMANOVA (Table 5).
Table 5.
PERMANOVA tests of temporal differences in the composition of recorded landings, Lake Volvi, 1961–2024, based on Bray–Curtis dissimilarities of Hellinger-transformed data with 999 permutations. Pairwise p-values are reported descriptively because the period factor was fixed a priori; p = 0.001 is the minimum attainable value with 999 permutations. The global test was additionally run under a restricted scheme of cyclic series shifts, which returned p = 0.0156, the minimum attainable under complete enumeration of the 64 distinguishable arrangements.
Seven annual diversity metrics were calculated from the ten-column catch-composition matrix: Shannon diversity (H′), Simpson diversity (1 − D), observed category richness (S), Pielou’s evenness (J′), and Hill numbers of orders q = 0, 1, and 2. Hill q = 0 is numerically identical to observed richness, while q = 1 and q = 2 express Shannon and Simpson diversity as effective numbers of categories. Annual values for all 64 years are provided in Table S1.
These indices were calculated from annual proportions of reported landings and therefore describe diversity and evenness among landing categories, rather than ecological diversity in the lake’s fish community. Higher Shannon or Simpson diversity or evenness indicates a more balanced distribution of reported landings among categories, which may result from declining contributions of formerly dominant taxa, changes in fishing effort, gear selectivity, market demand, or reporting practices. Such increases do not, by themselves, demonstrate increased ecological diversity or ecological recovery.
Five of the seven metrics increased significantly over the record: Shannon diversity (τ = 0.291, p < 0.001, Sen’s slope +0.0045 yr−1), Simpson diversity (τ = 0.309, p < 0.001, +0.00178 yr−1), Pielou’s evenness (τ = 0.268, p = 0.002, +0.00232 yr−1), Hill q = 1 (τ = 0.291, p < 0.001, +0.0217 yr−1), and Hill q = 2 (τ = 0.309, p < 0.001, +0.0244 yr−1). Because Hill q = 1 and q = 2 are monotone transformations of H′ and 1 − D, respectively, these five results represent two independent statistical signals, a Shannon-type and a Simpson-type signal, rather than five. These are classical p-values, uncorrected for serial dependence. Because the same correction removed two of the eight taxon-level declines detected by the uncorrected test, the two diversity signals should be read as an upper bound on the available evidence; the weakest of them, Pielou’s evenness (p = 0.002), is the most likely to be sensitive to such a correction. Observed richness and its Hill q = 0 equivalent showed no statistically supported trend (τ = −0.188, p = 0.059, Sen’s slope 0). This result is marginal rather than flat: the direction is negative, the p-value lies just above the α = 0.05 threshold, and mean richness fell from 8.79 categories in 1961–1979 to 7.89 in 1980–1998 before partially recovering to 8.12 in 1999–2024. Richness is more accurately described as showing a weak, non-significant decline than as stable, and it is in any case bounded above at ten categories and confounded by reporting practice. All seven indices retain the direction and the significance of these trends when the 1999–2012 reporting interval is excluded, with every coefficient slightly larger in the censored series (Section 3.7, Table S6a).
Period-level summaries show that the increase was concentrated in the first half of the record rather than being progressive (Figure S2). Mean Shannon diversity rose from 1.385 ± 0.144 in 1961–1979 to 1.646 ± 0.166 in 1980–1998, then fell slightly to 1.595 ± 0.189 in 1999–2024. Mean Pielou’s evenness followed the same pattern (0.638 ± 0.071; 0.797 ± 0.079; 0.766 ± 0.097), as did Hill q = 1 (4.035 ± 0.564; 5.259 ± 0.924; 5.008 ± 0.859) and Hill q = 2 (2.965 ± 0.568; 4.351 ± 0.965; 4.145 ± 0.933). All indices peaked in 1989 (H′ = 1.987; J′ = 0.955; Hill q = 1 = 7.293; Hill q = 2 = 6.692), at the end of the transition from the high-production regime. The trajectory is therefore best described as a rise to a late-1980s maximum followed by a slightly lower plateau, not as a monotone increase and not as a U-shaped decline-and-recovery.
Variability within the most recent period was high, and its extremes are diagnostic of the underlying mechanism. The record minimum for Shannon diversity, evenness, and Hill q = 1 occurred in 2014 (1.107, 0.504, and 3.026 respectively), the year in which Gibel carp alone accounted for 24.1 t of a 35.9 t total (67.2% of reported landings). Conversely, the highest recent values occurred in 2015 and 2017. Increases in landing-based evenness therefore reflect the loss of formerly dominant native taxa and the redistribution of a much smaller total catch across the remaining categories, and single-species dominance by the invader can drive evenness sharply downward within a single year.
Exclusion of the potentially reconstructed 1999–2012 interval did not alter the statistical classification of any diversity metric: Shannon, Simpson, evenness, and Hill q = 1–2 remained significantly increasing, whereas richness and Hill q = 0 remained non-significant.
As a supporting check on the trend analysis, a multivariate autoregressive state-space model was fitted simultaneously to the log-transformed landings of the nine named taxa (Table S8; Figure S3). Inference is based on the best-supported converged variance structure, taxon-specific process variance with a shared observation variance (AICc = 2372.5); the fully unconstrained specification returned a lower AICc but did not converge. Estimated annual drift was negative for six taxa, most steeply for European eel (−0.2218, equivalent to −19.89% yr−1) and Macedonian shad (−0.0689, −6.66% yr−1), and positive for Gibel carp (+0.2270, +25.49% yr−1), northern pike and common carp. The rank order agreed with the direction of the Mann–Kendall results for eight of the nine taxa; the exception is northern pike, whose marginally positive drift (+0.0094) reflects its strong mid-record maximum in 1981 and the different weighting the two methods give to early and late observations. No drift coefficient reached significance at α = 0.05 (approximate p = 0.256–0.982), so the sign and relative ranking, rather than the individual estimates, are the interpretable output of this model.
Cross-correlation functions were computed for all 36 pairwise combinations among the nine named taxa at lags of −10 to +10 years, with an approximate 95% reference interval of ±0.245 (n = 64). Thirty of the 36 pairs exceeded this bound at one or more lags (Table S2). The strongest associations were positive and concentrated among the historically dominant native taxa: roach–perch (r = +0.848 at lag −1), Macedonian shad–roach (+0.826 at lag −6), common bream–European eel (+0.780 at lag 0), European eel–wels catfish (+0.738 at lag 0), and shad–European eel (+0.717 at lag −3). Eight of the 30 pairs had negative maximum correlations. Six of these eight link Gibel carp to a declining native taxon: Gibel carp–northern pike (−0.523 at lag −6), Gibel carp–roach (−0.475 at lag −10), Gibel carp–common bream (−0.466 at lag −10), Gibel carp–European eel (−0.461 at lag −8), Gibel carp–European perch (−0.428 at lag −9), and Gibel carp–shad (−0.349 at lag −10). The remaining two are common carp–northern pike (−0.283 at lag +10) and common bream–common carp (−0.278 at lag −9). Gibel carp had one further pairing exceeding the reference bound, and it was positive: with common carp (+0.501 at lag +5), the other taxon that expanded over the same interval. The sign structure therefore separates the two expanding cyprinids from the declining natives rather than separating the invader from all native taxa. Because these series are strongly autocorrelated and non-stationary, coefficients of this magnitude are expected from the shared long-term trend alone; the bound of ±0.245 is a descriptive reference level, not a significance test, and the pairs exceeding it are reported as patterns for further investigation rather than as detected relationships.
3.6. Supporting Analyses: Forecasting, Stationarity, and Sensitivity
Forecast models were fitted to total landings and eight named taxa, comparing ARIMA, ETS, Theta, naïve random walk, random walk with drift, the historical mean and an equally weighted ensemble under rolling-origin cross-validation (Tables S3 and S5; Figure S5). No single method performed best across series: the ensemble minimized cross-validated RMSE for four taxa, the naïve forecast for four, and the Theta method for one. Absolute skill was low, and this is itself the informative result. Against the naïve benchmark that MASE normalizes to 1, only four of the nine series performed better than persistence, Macedonian shad (0.292), European eel (0.717), roach (0.896) and total landings (0.969), while the remaining five did not. The limits of extrapolation are explicit in the fitted models: the ARIMA projection for total landings falls from 41.6 t in 2025 to −25.6 t in 2034, a value inadmissible as a catch, which arises because the model extrapolates a fitted downward increment with no lower bound at zero. The ten-year projections are therefore reported as scenario envelopes conditional on the historical landings process rather than as predictions of future yield, and no conclusion of this study rests upon them.
Augmented Dickey–Fuller and Kwiatkowski–Phillips–Schmidt–Shin tests applied jointly to total landings and all ten catch series classified no series as stationary (Table S9). Six were non-stationary, common carp was inconclusive, and four rejected both nulls, which indicates disagreement between the two tests rather than positive identification of a trend-stationary process and is reported here as “conflicting”; the Macedonian shad result is strongly influenced by the 1967 collapse identified as an outlier year. Taken together, these diagnostics indicate that most Lake Volvi landing series are dominated by structural change rather than stable mean-reverting behavior, consistent with the changepoint results, with the unresolved MARSS drift estimates, and with the difficulty of outperforming naïve forecasts.
The 1979 sensitivity analysis removed the anomalous observation and repeated every Mann–Kendall test on the resulting 63-year series (Table 6). Excluding 1979 changed neither the direction nor the significance classification of any series: all eight declines that were significant under the classical test remained significantly declining, Gibel carp remained significantly increasing, and common carp remained without a statistically supported trend (p = 0.305 with 1979, p = 0.349 without). Changes in Kendall’s τ were uniformly small, with a maximum absolute shift of 0.018 for the “Other species” category (−0.593 to −0.611) and a shift of only 0.001 for total landings (−0.6822 to −0.6812).
Table 6.
Sensitivity of Mann–Kendall results to exclusion of the anomalous 1979 observation. Full series, n = 64; censored series, n = 63. No series changed trend direction or significance classification.
Because the comparison is made on classical p-values before and after exclusion, the count of eight refers to the uncorrected test; under the Hamed and Rao correction reported as our primary result the corresponding count is six, and the two taxa affected, European perch and wels catfish, are also the two whose τ shifts the least under exclusion of 1979. Monotonic-trend inference in this dataset is therefore robust to the treatment of 1979 under either variance assumption. This sensitivity analysis was deliberately targeted at monotonic trend inference, the component most directly affected by a single extreme annual value; the GAM, changepoint, ordination, diversity, MARSS, forecasting, and CMSY2 analyses were not rerun without 1979, and that scope limitation is retained in the interpretation.
3.7. Sensitivity to the 1999–2012 Reporting Interval
Because the 1999–2012 taxon-level record may be reconstructed or systematically affected by a change in reporting practice, every result that depends directly on taxon composition was recomputed with that interval excluded, reducing the series from 64 to 50 years. The exclusion was applied to the Mann–Kendall trend tests for total and taxon-specific landings, to the PERMANOVA and PERMDISP tests of period structure, and to the seven annual diversity indices; full-series and censored estimates are reported side by side in Table S6. CMSY2 and the forecasting models were not refitted on the censored series, for the reasons set out in Section 2.1. The stock-status classifications reported in Section 3.3 are determined by terminal-year biomass and exploitation ratios that rest on the 2013–2022 record, which lies entirely outside the questionable interval.
The long-term decline is unaffected by the exclusion and in fact strengthens (τ = −0.682 → −0.799; p < 0.001 in both cases). The headline reduction of 89.8% is anchored on the 1962 maximum and the 2024 terminal year, both of which lie outside 1999–2012 and is therefore invariant to the exclusion by construction.
Ten of the eleven series tested, including total landings, retain their trend classification (Table S6a). All eight categories classified as declining under the classical test remain significantly declining; the rank correlations shift in both directions on exclusion, but none loses significance, with the weakest after exclusion being northern pike (τ = −0.249, p = 0.011). Gibel carp remains significantly increasing, with a somewhat smaller coefficient (τ = 0.692 → 0.553), which is expected given that the exclusion removes 14 of the 26 years in which this taxon was recorded at all. Common carp is the single exception: a series with no monotonic trend in the full archive (τ = 0.089, p = 0.305) becomes significantly increasing once the interval is removed (τ = 0.222, p = 0.024). As noted in Section 3.2, this comparison rests on classical p-values because the Hamed and Rao variance correction was not re-applied to the censored series, so the common-carp result is best read as evidence that this taxon’s classification is sensitive to the reporting interval rather than as a corrected test of trend.
The period effect on landing composition does not weaken; it strengthens slightly (PERMANOVA R2 = 0.656 → 0.685, p = 0.001 in both cases; Table S6b). The heterogeneity of multivariate dispersion present in the full archive disappears (PERMDISP F = 4.79, p = 0.011 → F = 0.360, p = 0.721), so in the censored dataset the compositional separation cannot be attributed to unequal dispersion among periods. Excluding the questionable interval therefore removes, rather than creates, the principal statistical caveat attached to this result.
All seven indices retain both the direction and the significance of their full-series trend (Table S6a). Shannon diversity (τ = 0.291 → 0.336), Simpson diversity (0.309 → 0.370), Pielou’s evenness (0.268 → 0.339) and Hill numbers q = 1 (0.291 → 0.336) and q = 2 (0.309 → 0.370) all remain significantly increasing (p ≤ 0.002 throughout), and every censored coefficient is slightly larger than its full-series counterpart. Recorded category richness, equivalently Hill q = 0, remains without a monotonic trend (τ = −0.188, p = 0.059 → τ = −0.169, p = 0.148). The divergence between rising evenness-weighted diversity and static richness, which is central to our interpretation of compositional levelling, is therefore reproduced in the censored series.
Taken together, the exclusion leaves the four principal conclusions of this study intact: the long-term collapse of total production, the compositional reorganization from native-dominated to carp-dominated landings, the increase in evenness-weighted diversity against static recorded richness, and the depleted status of the historically dominant native taxa. The one result that is interval-dependent is the direction of the common-carp trend, which is identified as such in the Abstract, in Section 3.2 and Section 4.
3.8. Sensitivity to the Anomalous Year 1967
Because 1967 is interpreted below as a probable transcription or species-attribution error, every analysis that depends on taxon composition was recomputed on the 63-year series with that year removed (Table S11). The compositional results are unaffected. PERMANOVA retained an almost identical period effect (R2 = 0.656 → 0.670, p = 0.001 in both cases), NMDS fit was unchanged (stress = 0.0992 → 0.0983), and a Procrustes test of the reduced ordination against the full ordination with the 1967 row deleted returned a correlation of 0.9999 (p = 0.001), indicating that the compositional trajectory is not driven by this year. None of the seven diversity indices and none of the eleven landing series changed trend classification, with Kendall’s τ shifting only in the third decimal place; recorded richness remained non-significant (p = 0.059 → 0.089). Multivariate dispersion heterogeneity was not attributable to 1967 and in fact strengthened on its exclusion (PERMDISP F = 4.79 → 6.77, p = 0.011 → 0.002).
The temporal clustering, by contrast, is sensitive to this year. With 1967 removed, the k = 3 partition contains no singleton, mean silhouette width improves marginally (0.365 → 0.370), and the three clusters correspond to sequential production regimes: 1961–1978 (n = 17, mean 453.1 t yr−1, silhouette 0.121), 1980–1990 (n = 11, 149.0 t yr−1, 0.513), and 1991–2024 together with the anomalous year 1979 (n = 35, 42.8 t yr−1, 0.447). The two-state description reported in Section 3.5 is therefore contingent on retaining 1967; once it is excluded, the clustering resolves an intermediate 1980–1990 regime whose opening boundary coincides with the late-1970s changepoint window identified by all three detection procedures. The 1990/1991 boundary continues to coincide with none of them. We retain 1967 in all primary analyses, since no independent record is available against which to correct it, but the clustering result should be read as conditional on that decision.
4. Discussion
4.1. Long-Term Trajectories, Changepoints, and Regime Shifts
The six-decade landing record documents a fishery already at high yield when the archive opens (488.1 t in 1961; all-time maximum 619.7 t in 1962), followed by a decline of nearly an order of magnitude into the early 2000s. The record cannot document an expansion phase, so the trajectory analyzed here is a high-yield plateau followed by a decline rather than a complete rise-and-fall cycle. The decline did not continue uninterrupted: decadal mean landings fell from 473.3 t in the 1960s to a minimum of 15.8 t in the 2000s, then recovered to 42.3–47.0 t in the 2010s–2020s, driven almost entirely by common carp and Gibel carp (53.4% of landings, 1999–2024). The contemporary fishery is therefore a low-yield, compositionally transformed system stabilized at roughly a tenth of historical output, not one in continuing freefall, a distinction that matters for management, since the tonnage recovery was not accompanied by any improvement in the historically dominant native taxa.
Mann–Kendall tests detected significant negative trends in total landings and six of ten categories, and GAMs recovered strongly nonlinear trajectories (deviance explained 59.7–96.2%) that a monotonic test cannot represent. The 1979 value was treated as a reporting anomaly rather than a biological datum; excluding it left every trend classification unchanged (maximum shift in τ = 0.018), confirming the decline is robust and not an artefact of one observation [73]. Declines were not homogeneous. By strength of association, Macedonian shad (τ = −0.708), roach (−0.635), and European eel (−0.609) declined most steeply; by absolute rate, roach (−2440 kg yr−1), Macedonian shad (−1084), and common bream (−571) dominated. Northern pike’s decline was comparatively weak (τ = −0.336) and delayed, reaching its recorded maximum in 1981. Wels catfish showed a strong ordinal decline (τ = −0.478) but no estimable slope, 47 of 64 years are zeros, and under the Hamed and Rao correction it misses conventional significance (p = 0.093). Common carp showed no trend across the full archive, but became significantly increasing (τ = 0.222, p = 0.024) once the potentially reconstructed 1999–2012 interval was excluded. Gibel carp, absent before 1999, expanded rapidly to co-dominate contemporary catches with common carp. This reorganization, declining natives partially replaced by a non-native, high-productivity invader and a tolerant native generalist, is consistent with “fishing-down” dynamics documented in inland fisheries globally [74,75], with the historical development of Greek inland fisheries without commensurate stock assessment or effort control [76], and with serial overexploitation across Mediterranean and Black Sea fisheries [77].
Three independent change-detection frameworks applied to total landings converge on three consensus transitions: ~1971–1973 (Bai–Perron, segmented regression), ~1978–1980 (PELT, Bai–Perron, segmented regression), and ~2002 (PELT, Bai–Perron, segmented regression). We interpret the late 1970s as the transition from the high-production plateau to decline, and the turn of the millennium as a second, composition-transforming transition. K-means clustering of standardized taxon composition, however, resolved a different, two-state boundary at 1990/1991, plus outlier years 1967 and 1979, coinciding with none of the landing-based changepoints (this holds for the 1990/1991 boundary specifically, and by excluding 1967 produces a regime boundary that does align with the late-1970s window). This decoupling is informative rather than contradictory: changepoint analyses target a magnitude series dominated by high-tonnage taxa, whereas clustering targets standardized composition in which every taxon contributes equally, so production and composition change are related but not synchronous processes [73,78,79]. The year 1967 combines a collapse of Macedonian shad to 1.2 t with simultaneous record or near-record landings of common bream, European eel, and wels catfish, an implausible ecological combination best explained as a transcription or species-attribution error, alongside 1979. The ~2002 breakpoint coincides with the collapse of neighboring Lake Koronia, described in the contemporary literature as “a dying lake” [80], and with the spread of C. gibelio across Greek freshwaters [25,81], though Gibel carp’s first recorded year (1999) should not be equated with its year of biological establishment, which is better anchored by independent field evidence [13]. Although the ~2002 transition falls within the questionable interval, it is anchored independently by the documented collapse of neighboring Lake Koronia, so it is unlikely to be a reporting artefact.
4.2. Compositional Reorganization and the Rise of Carassius gibelio
NMDS ordination of Hellinger-transformed landings [49] (stress = 0.099) traced a largely unidirectional trajectory from the 1960s to 2020s with minimal revisitation of earlier assemblage states. PERMANOVA attributed 65.6% of compositional variation to time period (R2 = 0.656, pseudo-F = 58.1, p = 0.001), robust under a restricted, autocorrelation-preserving permutation scheme (p = 0.0156, the smallest value attainable with 64 cyclic shifts). PERMDISP indicated significant dispersion heterogeneity in the full archive (F = 4.79, p = 0.011), but this disappeared after excluding the 1999–2012 interval (F = 0.360, p = 0.721) while the period effect strengthened (R2 = 0.685), so the compositional signal is not an artefact of unequal dispersion or of that questionable segment. PCA (PC1 = 56.4%, PC2 = 14.2%) identified the gradient as specifically a roach–shad–eel to carp–Gibel carp replacement, not generic native decline: bream and pike had near-zero PC1 loadings despite marked absolute declines. European perch’s relative share rose (10.0% to 13.2%) even as its absolute landings fell 94.3%, showing that relative and absolute measures of change can point in opposite directions. This mirrors displacement of native assemblages by tolerant non-natives documented elsewhere in Mediterranean and European lentic systems [8,82], earlier field evidence of invasion pressure from introduced pumpkinseed in Lake Volvi itself [13], and the broader state of invasion-driven flux in Greek lentic fish faunas [7].
C. gibelio, characterized as the dominant naturalized invader of Greek freshwaters following its introduction and translocation across the country’s inland waters [25,81], first appears in Volvi landings in 1999 and is now exploited below FMSY (F/FMSY = 0.601) at biomass at or above BMSY (B/BMSY = 1.49), though the biomass ratio’s credible interval spans unity and the high estimated intrinsic growth rate (r = 1.19 yr−1) sits near the prior’s upper bound rather than being fully data-driven. Its invasion success reflects a suite of documented traits: gynogenetic plus sexual reproduction, opportunistic omnivory, and tolerance of hypoxic, eutrophic conditions [81,83], with dual reproductive modes documented [84] and hybridization with native crucian carp reported in other European waters [85], and documented experimental depression of native fish and invertebrate communities through competition and habitat modification [86,87]. Cross-correlation analysis is consistent with a replacement dynamic: Gibel carp’s six strongest associations exceeding the ±0.245 reference bound were all negative and against declining natives, from pike (−0.523) to shad (−0.349), while its only strong positive association was with common carp (+0.501), the two taxa that expanded together. These patterns reflect a shared long-term trend among strongly autocorrelated, non-stationary series and should be read as hypothesis-generating descriptions of temporal coupling, not as tests of competition or predation. The timing relative to native piscivore depletion is suggestive but only partly supported: wels catfish disappeared after 1977, more than two decades before Gibel carp appears, consistent with fishing removing predators ahead of invader establishment into vacated niche space, a pattern resembling “invasional meltdown” [88,89], though pike’s own decline was gradual through the 1990s, peaking in 1981, rather than a single antecedent collapse.
4.3. Stock Status, State–Space Dynamics, and Diversity
CMSY2 [10] converged for eight of ten catch series; roach and European perch did not, even after relaxing initial and terminal biomass priors, and are reported as indeterminate rather than forced to converge [11,23]. Six of the eight converged series returned estimated biomass far below the reference level, with B/BMSY at or below 0.191: Macedonian shad (0.063), wels catfish (0.077), common bream (0.089), European eel (0.090), the aggregate “Other species” category (0.116), and northern pike (0.191). Despite the limitations of catch-only assessments [10,11,12,90], this depletion pattern is the most robust finding: it persists across both terminal years tested; is accompanied by stable estimates of r, K, and MSY for these six series; and is broadly consistent with the Mann–Kendall, GAM, and MARSS results. Exploitation ratios provide weaker evidence because terminal F is a single-year quantity sensitive to volatile catches and to values carried forward in the final years. Five of the eight series change quadrant assignment between terminal years 2022 and 2024 (Section 3.4), and the earlier classification of common carp and Gibel carp as sustainable is not robust to terminal-year choice: neither occupies the sustainable quadrant in 2022, and their estimated carrying capacities change by more than 20% between assessments. Their biomass is therefore interpreted as near the reference level, with estimates above or below it depending on terminal-year choice, rather than as evidence of demonstrated sustainability. The roach trajectory includes twelve consecutive zeros in 1999–2010, an isolated catch of 33.3 t in 2011, and a further zero in 2012, suggesting a reporting discontinuity rather than a continuous demographic trajectory. Re-coding these zeros as missing still returned no viable r–k pairs, indicating that convergence failure was not resolved by changing their treatment. An independent CMSY++ assessment of the same archive [22] also indicated depletion of common bream and Macedonian shad (B/BMSY = 0.213 and 0.165, respectively, compared with 0.089 and 0.063 here) and estimated common carp biomass above its reference level (1.16, compared with 1.011 here). Differences in exploitation ratios between assessments should be interpreted in light of their prior specifications and terminal years.
A MARSS state–space model [65] fitted to nine taxa favored taxon-specific process variance with shared observation variance; the fully unconstrained specification returned the lowest AIC but failed to converge. European eel showed the most negative drift (≈−19.9% yr−1), followed by Macedonian shad, wels catfish, roach, common bream, and European perch; Gibel carp was the only taxon with substantial positive drift (≈+25.5% yr−1), while pike and common carp were essentially trend-free. Drift direction agreed with Mann–Kendall for eight of nine taxa; the exception, northern pike, reflects a genuine late-series recovery from near-zero landings in 2008–2014 to 2.1 t in 2023–2024 that pulls its average increment upward despite an overall decline. No individual drift reached statistical significance (approximate p = 0.256–0.982), a limit of precision given 64 annual observations and standard errors differing by almost an order of magnitude across the assemblage, not evidence of stability. The MARSS results provide corroborative rather than independent evidence of the long-term trends, as both analyses use the same landing record. Drift signs and rankings are interpreted descriptively: no individual drift was statistically significant, and differences among drift coefficients were not formally tested.
Richness (q = 0) shows a weak, non-significant decline (τ = −0.188, p = 0.059) rather than stability; several taxa were absent for extended periods (wels catfish, 45 consecutive years; roach, 13 non-consecutive years). Dominance-sensitive metrics (Shannon, Simpson, evenness, Hill q = 1 and 2) rose from 1961–1979 to a shared 1989 peak, then plateaued slightly lower, a mechanical rather than ecological pattern, since roach and shad together supplied 71.7% of early landings, and their collapse necessarily raised evenness by removing the dominants. The record minima for all three dominance metrics occurred in 2014, when Gibel carp alone supplied 67.2% of a much smaller total, showing that single-species invader dominance can drive evenness to its lowest value in six decades within a single year. Any evenness “recovery” therefore reflects the collapse of native dominants rather than ecological improvement; landing-derived diversity metrics generally conflate community structure with fishing effort, gear selectivity, and market demand [91].
4.4. Conservation Priorities, Predictability, and Interacting Drivers
A. macedonica (liparia), a landlocked, range-restricted clupeid endemic to Lake Volvi and Critically Endangered [7,92], shows the strongest decline of any taxon (τ = −0.708), a terminal B/BMSY of 0.063 at the 2022 terminal year, and an estimated MSY (310 t) roughly five times the entire lake’s 2024 landings and close to seven times its 2020s decadal mean. The depletion signal for Macedonian shad is robust across both terminal years tested (B/BMSY = 0.063 at 2022 and 0.066 at 2024). The exploitation signal is not: F/FMSY is 0.445 at the 2022 terminal year and 1.42 at 2024, with the difference reflecting reported catches of 1.12 t and 3.95 t in those years, with the latter being one of the duplicated values. Continuing overfishing can therefore be neither demonstrated nor excluded from the catch record, and the case for urgent protection rests on the depletion estimate, the strength of the long-term decline (τ = −0.708), and the species’ conservation status rather than on a terminal exploitation ratio. Its dependence on zooplankton may make Macedonian shad vulnerable to changes in prey availability [93]. Experimental evidence from other systems shows that Gibel carp can suppress large-bodied zooplankton and alter water quality, suggesting a potential additional pressure that remains untested in Lake Volvi [94]. A species-specific recovery plan, protection of nearshore gravel spawning habitat, and a July–August gillnet closure during the spawning peak [93] should be treated as an urgent priority.
European eel, Critically Endangered under IUCN criteria [95] and collapsed across its range under overfishing, habitat loss, migration barriers, and parasitism [96], shows the most negative MARSS drift of any taxon (≈−19.9% yr−1). Its last reported landing in Lake Volvi was 231 kg in 2022, and no landings were reported in 2023 or 2024. At the 2022 terminal year, the stock is severely depleted, with exploitation above the reference level (B/BMSY = 0.090, F/FMSY = 1.07); at 2024, no exploitation ratio can be estimated because a zero terminal catch makes F/FMSY undefined rather than low. Neither result should be read as evidence of demographic recovery: the disappearance of eel from the landing records indicates the cessation of reported catches, not the rebuilding of the stock. For a catadromous, panmictic species, local catch-only assessment cannot capture recruitment failure occurring at oceanic scales, and management should follow the EU Eel Regulation and ICES zero-catch advice [97,98] rather than local reference points.
Benchmarking ARIMA, ETS, Theta, and an ensemble against naïve and other forecasts under rolling-origin cross-validation showed no single best model across taxa. Only four of nine series beat the naïve benchmark (MASE < 1): Macedonian shad (0.292), European eel (0.717), roach (0.896), and total landings (0.969); the remaining five, including Gibel carp (1.924), were no better than persistence. A previously published forecast for this fishery projected continued decline or stasis for 2023–2026, but realized totals were instead among the highest since the mid-1990s [99], an out-of-sample failure consistent with the non-stationarity and unresolved MARSS drift found here. This limited forecastability sits within a wider picture of interacting drivers rather than a single cause. Sustained, historically weakly regulated fishing [6,76] remains current rather than purely historical: fishing mortality exceeds FMSY across the full credible range for common bream and northern pike. Environmental degradation compounds this pressure: Volvi is eutrophic and warm-monomictic, with a documented history of toxic cyanobacterial blooms [18,19,100], while the hydrological collapse of neighboring Ramsar-listed Lake Koronia [80] and basin-wide fish kills [101] illustrate the severity of environmental pressures in the wider basin. One possible interpretation is that biological invasion accelerated the reorganization once native piscivores were already depleted, a compound-stressor dynamic reported elsewhere in Mediterranean freshwaters [5,7] and compatible with invasional-meltdown theory [88,89]. The landing record cannot distinguish this from competition, predation, fishing pressure, eutrophication, habitat alteration, or changes in reporting and fishing practice, and these are not mutually exclusive; resolving them would require fishery-independent survey, diet and effort data. Because time series behave this unpredictably, management should not be premised on precise catch projections; effort regulation, habitat protection, and stock rebuilding are robust precisely because they do not depend on forecasting future landings [102], and the partial recovery of total landings since the 2000s should be read as a symptom of this transformed state rather than evidence of its reversal.
4.5. Limitations and Management Implications
The archive itself carries structural features that constrain interpretation: portions of 1999–2012 appear to have been reconstructed from fixed species-composition ratios, corroborated by an independent compilation reporting Gibel carp records retrievable only from 2012 onward [99], and seven of ten categories carry identical values in 2023 and 2024. The second feature is consequential rather than cosmetic: because catch-only status classification depends on terminal-year biomass and exploitation ratios, the terminal-year sensitivity analysis shows that the duplicated values are sufficient to move five of eight series between Kobe quadrants (Section 3.4). This provides a general caution for catch-only assessment of administrative landing series, where carried-forward values can materially alter stock-status classifications. These archive features affect roughly a fifth of the series and were retained but flagged throughout, since taxon-level composition, diversity indices, the roach CMSY2 failure, and terminal-year stock status all rest partly on these uncertain records. Landings are also an imperfect abundance proxy, conflating stock size with effort, gear efficiency, and market demand [91]; CMSY2 estimates are correspondingly prior-dependent and not exactly reproducible; illegal, unreported, and recreational catches are absent from the record [6]; and the aggregated “Other species” category, the least stable series in the replicate analysis, obscures divergent dynamics among minor taxa. The MARSS specification assumed density-independent dynamics and could not resolve individual drift rates at the taxon level. Future work should prioritize auditing the 1999–2012 segment and the duplicated 2023–2024 records; integrating independent abundance indices, effort records, and environmental covariates; and extending this integrated framework to other Mediterranean lakes [11,12,76].
The present study documents long-term declines in reported landings, compositional reorganization, and catch-only estimates indicating substantial depletion in several assessed categories. These findings support prioritizing independent stock assessment and evaluating recovery measures. However, the study did not evaluate management interventions or determine appropriate closure periods, mesh sizes, gear restrictions, or habitat-protection requirements. The measures proposed below draw on previous studies and general fishery-management considerations and require local evaluation before implementation. Similarly, increasing Gibel carp contributions to landings do not establish its ecological impacts or demonstrate that targeted removal would benefit native taxa.
Six decades of landings reveal two production transitions (late 1970s, early 2000s) and a compositional reorganization (~1990/1991), culminating in a low-yield state jointly dominated by a non-native invader and a tolerant generalist, with most native stocks depleted and several showing evidence of continuing overexploitation. Although terminal-year sensitivity constrains individual stock classifications, the evidence of depletion and fishing pressure supports enforceable effort controls, mesh-size regulation, gear restrictions, and seasonal closures timed to the spawning periods of pike, catfish, and liparia. Effective fishery management has repeatedly been shown to reverse stock declines when such measures are implemented and enforced [102]. Species-specific plans are required for the two Critically Endangered taxa: a liparia recovery plan centered on spawning-habitat protection and seasonal closure, and a European eel management plan aligned with the EU Eel Regulation and ICES zero-catch advice [98]. For Gibel carp, targeted, potentially marketable removal combined with monitoring of its competitive and reproductive impacts on native cyprinids offers pragmatic containment [81,87]. This carries a substantial trade-off: Gibel carp is currently the single largest component of reported landings and is estimated to be exploited below FMSY, so intensified removal would increase pressure on the category that presently sustains the fishery. Practical adoption would therefore require alternative income provision or a market development strategy.
Lake Volvi, together with Lake Koronia, forms a Ramsar Wetland of International Importance and a Natura 2000-protected national park, creating both a legal mandate and an ethical imperative to restore ecological integrity. The six-decade baseline assembled here, together with its reference points, regime chronology, and stock-status estimates, provides a quantitative foundation for developing restoration targets and evaluating future interventions. Any minimum stock thresholds derived from these estimates should remain provisional until the archive has been audited and the assessments validated against independent abundance data. More broadly, this study demonstrates that long-term landing archives, when analyzed with an integrated statistical framework and interpreted with explicit attention to their limitations, can support meaningful inference about community reorganization and stock status in data-limited inland fisheries, a need that extends across Greece and the Mediterranean region [7,20,92].
5. Conclusions
The six-decade Lake Volvi record reveals a profound restructuring of its commercial fishery. Total landings fell 89.8% between their 1962 maximum (619.7 t) and 2024, bottoming at a decadal minimum of 15.8 t yr−1 in the 2000s before recovering partially to 47.0 t yr−1 in the 2020s. Multiple analytical approaches identified major production transitions around the late 1970s and early 2000s, and a distinct compositional reorganization around 1990/1991. These changes were not uniform: after correction for serial dependence, six of ten categories—common bream, Macedonian shad, roach, northern pike, European eel, and the aggregate “Other species”—retained significant monotonic declines, led by Macedonian shad (τ = −0.708), roach (−0.635), and European eel (−0.609). European perch and wels catfish fell just short of significance after correction but remained greatly reduced in magnitude. Gibel carp, unrecorded before 1999, became a dominant component of contemporary landings alongside common carp. Multivariate analyses confirmed strong period separation (R2 = 0.656), robust under a restricted permutation scheme that returned the smallest p-value permitted by the design (p = 0.0156). The observed changes therefore represent compositional reorganization rather than a simple reduction in yield, and the recent partial tonnage recovery reflects the expansion of two eutrophication-tolerant cyprinids rather than demonstrated recovery of historically dominant native taxa.
Increases in landing-based diversity and evenness should not be interpreted as ecological recovery. These indices peaked in the late 1980s and subsequently plateaued, with later patterns shaped by declining native contributions and the invader’s growing share. Evenness reached its record low in 2014, when Gibel carp alone supplied 67% of the catch. Category richness showed a weak, non-significant decline. Catch-only assessment raised substantial concern: of the eight series with a defensible fit, six had estimated terminal biomass below one-fifth of BMSY at the 2022 terminal year (Macedonian shad 0.063, wels catfish 0.077, common bream 0.089, European eel 0.090, “Other species” 0.116, northern pike 0.191), and this depletion was reproduced at both terminal years tested. The accompanying exploitation classifications were not reproducible in the same way: five of eight series changed Kobe quadrant between terminal years 2022 and 2024. Consequently, a single terminal-year classification cannot establish that a stock is sustainable or subject to continuing overfishing, although the evidence of severe biomass depletion remained consistent. Roach and European perch remained indeterminate, representing a data limitation rather than a coding artefact.
Lake Volvi has therefore shifted from a historically high-production, native-dominated fishery to a markedly lower-production, compositionally altered state showing partial recovery in reported tonnage without demonstrated restoration of its native assemblage. Management should prioritize recovery of vulnerable native stocks, particularly the endemic Alosa macedonica and Critically Endangered Anguilla anguilla, alongside invasive-species control and stronger regulation of fishing pressure, recognizing that the landing record identifies these associations but cannot establish which mechanisms produced them. Future assessments should audit reconstructed and duplicated archive records and incorporate effort data, CPUE, fishery-independent surveys, and environmental covariates to separate abundance change from fishing and reporting variation, supporting ecosystem-based management of Lake Volvi and comparable data-limited Mediterranean lake fisheries.
Supplementary Materials
The following supporting information can be downloaded at https://www.mdpi.com/article/10.3390/hydrobiology5040038/s1, Figure S1. Multivariate reorganization of the Lake Volvi fish landing assemblage, 1961–2024: (a) PCA of Hellinger-transformed catch composition; (b) NMDS based on Bray–Curtis dissimilarity. Figure S2. Temporal dynamics of fish-landing diversity in Lake Volvi, 1961–2024. Figure S3. MARSS state estimates and species-specific drift for nine Lake Volvi taxa, 1961–2024. Figure S4. Hierarchical clustering and landing-composition heatmap for Lake Volvi, 1961–2024. Figure S5. Forecast performance and ten-year projections of Lake Volvi fish landings, 2025–2034. Table S1. Annual diversity indices for the Lake Volvi landing assemblage, 1961–2024. Table S2. Cross-correlations among the nine named Lake Volvi landing series, 1961–2024. Table S3. Cross-validated forecast accuracy for total landings and eight named Lake Volvi taxa. Table S4. Terminal-year (2022) B/BMSY and F/FMSY with 95% credible limits from a single CMSY2 reference fit for the eight successfully assessed Lake Volvi series. Table S5. ARIMA specifications for total landings and eight named Lake Volvi taxa, 1961–2024, with ten-year projections. Table S6. Sensitivity of Lake Volvi results to exclusion of the 1999–2012 reporting interval. (a) Mann–Kendall trend tests for total and taxon-specific landings and for the seven annual diversity indices; (b) multivariate tests of the three a priori periods. The full dataset comprises 64 years (1961–2024) and the censored dataset 50 years. Table S7. Sensitivity of CMSY2 terminal stock status to the choice of terminal year, Lake Volvi. Each converged series was refitted twelve times with the catch history truncated at 2022 and at 2024; values are replicate medians. Table S8. MARSS taxon-specific drift estimates for Lake Volvi, 1961–2024. Table S9. Stationarity tests for total and taxon-specific landings in Lake Volvi, 1961–2024. Table S10. Selection of the number of breakpoints in the segmented regression of total Lake Volvi landings on year, 1961–2024. Table S11. Sensitivity of Lake Volvi compositional, diversity, trend and clustering results to exclusion of the anomalous year 1967.
Author Contributions
Conceptualization, S.K. and D.K.; methodology, S.K., A.T., A.C. and D.K.; software, S.K. and D.K.; validation, S.K., A.T., D.P., A.C. and D.K.; formal analysis, S.K. and D.K.; investigation, S.K., A.T. and D.P.; resources, S.K., A.C. and D.K.; data curation, S.K.; writing—original draft preparation, S.K., A.T., D.P. and D.K.; writing—review and editing, S.K., A.T., D.P., A.C. and D.K.; visualization, S.K. and D.K.; supervision, S.K., A.C. and D.K.; project administration, S.K. and D.K. All authors have read and agreed to the published version of the manuscript.
Funding
This research received no external funding.
Institutional Review Board Statement
Not applicable.
Informed Consent Statement
Not applicable.
Data Availability Statement
The full dataset is available from the corresponding author upon reasonable request. A sample of the dataset is available at Figshare.
Acknowledgments
The authors wish to thank the Thessaloniki Fisheries Supervisory Authority for providing annual data.
Conflicts of Interest
The authors declare no conflicts of interest.
References
- Dudgeon, D.; Arthington, A.H.; Gessner, M.O.; Kawabata, Z.-I.; Knowler, D.J.; Lévêque, C.; Naiman, R.J.; Prieur-Richard, A.-H.; Soto, D.; Stiassny, M.L. Freshwater Biodiversity: Importance, Threats, Status and Conservation Challenges. Biol. Rev. 2006, 81, 163–182. [Google Scholar] [CrossRef] [Scilit] [PubMed]
- Reid, A.J.; Carlson, A.K.; Creed, I.F.; Eliason, E.J.; Gell, P.A.; Johnson, P.T.; Kidd, K.A.; MacCormack, T.J.; Olden, J.D.; Ormerod, S.J. Emerging Threats and Persistent Conservation Challenges for Freshwater Biodiversity. Biol. Rev. 2019, 94, 849–873. [Google Scholar] [CrossRef] [Scilit] [PubMed]
- Su, G.; Logez, M.; Xu, J.; Tao, S.; Villéger, S.; Brosse, S. Human Impacts on Global Freshwater Fish Biodiversity. Science 2021, 371, 835–838. [Google Scholar] [CrossRef] [Scilit] [PubMed]
- Darwall, W.; Bremerich, V.; De Wever, A.; Dell, A.I.; Freyhof, J.; Gessner, M.O.; Grossart, H.; Harrison, I.; Irvine, K.; Jähnig, S.C. The Alliance for Freshwater Life: A Global Call to Unite Efforts for Freshwater Biodiversity Science and Conservation. Aquat. Conserv. Mar. Freshw. Ecosyst. 2018, 28, 1015–1022. [Google Scholar] [CrossRef] [Scilit]
- Hermoso, V.; Clavero, M. Threatening Processes and Conservation Management of Endemic Freshwater Fish in the Mediterranean Basin: A Review. Mar. Freshw. Res. 2011, 62, 244–254. [Google Scholar] [CrossRef] [Scilit]
- Bobori, D.; Economidis, P. Freshwater Fishes of Greece: Their Biodiversity, Fisheries and Habitats. Aquat. Ecosyst. Health Manag. 2006, 9, 407–418. [Google Scholar] [CrossRef] [Scilit]
- Vardakas, L.; Koutsikos, N.; Perdikaris, C.; Petriki, O.; Bobori, D.; Zogaris, S.; Giakoumi, S.; Fitoka, E.; Tompoulidou, M.; Tsiaoussi, V. Τhe Fish Fauna in Lentic Ecosystems of Greece. Mediterr. Mar. Sci. 2022, 23, 223–265. [Google Scholar] [CrossRef] [Scilit]
- Petriki, O.; Bobori, D.C. The Compositional and Functional Diversity of a Mediterranean Urban Lake’s Fish Fauna over the Past 120 Years. Appl. Sci. 2024, 14, 6099. [Google Scholar] [CrossRef] [Scilit]
- Froese, R.; Demirel, N.; Coro, G.; Kleisner, K.M.; Winker, H. Estimating Fisheries Reference Points from Catch and Resilience. Fish Fish. 2017, 18, 506–526. [Google Scholar] [CrossRef] [Scilit]
- Ovando, D.; Free, C.M.; Jensen, O.P.; Hilborn, R. A History and Evaluation of Catch-only Stock Assessment Models. Fish Fish. 2022, 23, 616–630. [Google Scholar] [CrossRef] [Scilit]
- Sharma, R.; Winker, H.; Levontin, P.; Kell, L.; Ovando, D.; Palomares, M.L.; Pinto, C.; Ye, Y. Assessing the Potential of Catch-Only Models to Inform on the State of Global Fisheries and the UN’s SDGs. Sustainability 2021, 13, 6101. [Google Scholar] [CrossRef] [Scilit]
- Zhou, S.; Punt, A.E.; Smith, A.D.; Ye, Y.; Haddon, M.; Dichmont, C.M.; Smith, D.C. An Optimized Catch-Only Assessment Method for Data Poor Fisheries. ICES J. Mar. Sci. 2018, 75, 964–976. [Google Scholar] [CrossRef] [Scilit]
- Bobori, D.; Petriki, O.; Aftzi, C. Fish Community Structure in the Mediterranean Temperate Lake Volvi at Two Different Stages of Pumpkinseed Invasion: Are Natives in Threat? Turk. J. Fish. Aquat. Sci. 2019, 19, 1039–1048. [Google Scholar] [CrossRef] [PubMed]
- Economidis, P.; Sinis, A. Situation Taxinomique et Comparaisons Des Aloses (Pisces, Clupeidae) Provenant Des Lacs Volvi et Vistonis (Grece). Description d’une Nouvelle Sous-Espece: Alosa Caspia Vistonica. J. Nat. Hist. 1986, 20, 723–734. [Google Scholar] [CrossRef] [Scilit]
- Ford, M. The IUCN Red List of Threatened Species: Alosa Macedonica. Available online: https://www.iucnredlist.org/en (accessed on 22 August 2026).
- Giantsis, I.; Kechagia, S.; Apostolidis, A. Evaluating the Genetic Status of the IUCN Vulnerable Endemic Macedonian Shad (Alosa Macedonica, Vinciguerra, 1921) from Lake Volvi. J. Appl. Ichthyol. 2015, 31, 184. [Google Scholar] [CrossRef] [Scilit]
- Mouchlianitis, F.A.; Minos, G. Alburnus volviticus, an endemic fish species in peril due to river fragmentation and hydrological fluctuations. In Book of Abstracts of the 16th International Congress on the Zoogeography and Ecology of Greece and Adjacent Regions, Athens, Greece, 3–6 July 2025; Hellenic Zoological Society: Athens, Greece, 2025; p. 136. Available online: https://iczegar16.hzoos.gr/sites/default/files/poster_files/book_of_abstracts_16th_iczecar_2025.v30.6.pdf (accessed on 10 September 2026).
- Moutopoulos, D.K.; Stoumboudi, M.T.; Ramfos, A.; Tsagarakis, K.; Gritzalis, K.C.; Petriki, O.; Patsia, A.; Barbieri, R.; Machias, A.; Stergiou, K.I. Food Web Modelling on the Structure and Functioning of a Mediterranean Lentic System. Hydrobiologia 2018, 822, 259–283. [Google Scholar] [CrossRef] [Scilit]
- Moutopoulos, D.K.; Petriki, O.; Ramfos, A.; Stoumboudi, M.T.; Stergiou, K.I.; Bobori, D.C. Portraying Fisheries and Ecological Status of a Mediterranean Lake. Acta Ichthyol. Piscat. 2020, 50, 71–83. [Google Scholar] [CrossRef] [Scilit]
- Bobori, D.; Salvarina, I.; Michaloudi, E. Fish Dietary Patterns in the Eutrophic Lake Volvi (East Mediterranean). J. Biol. Res. 2013, 19, 139. [Google Scholar]
- Perdikaris, C.; Koutsikos, N.; Vardakas, L.; Kommatas, D.; Simonović, P.; Paschos, I.; Detsis, V.; Vilizzi, L.; Copp, G.H. Risk Screening of Non-native, Translocated and Traded Aquarium Freshwater Fishes in Greece Using Fish Invasiveness Screening Kit. Fish. Manag. Ecol. 2016, 23, 32–43. [Google Scholar] [CrossRef] [Scilit]
- Stoilas, V.; Kokkinakis, A. Assessment of the Fishing Conditions for the Most Important Species in Lake Volvi (Central Macedonia) Using the CMSY++ Method. In Proceedings of the 22nd Panhellenic Forestry Conference, Ioannina, Greece, 28 September–1 October 2025; pp. 647–653. (In Greek) [Google Scholar]
- Hyndman, R.; Athanasopoulos, G. Forecasting: Principles and Practice; OTexts: Melbourne, Australia, 2021. [Google Scholar]
- Ramsar Sites Information Service Lakes Volvi & Koronia. Ramsar Site No. 57. Available online: https://rsis.ramsar.org/ris/57 (accessed on 23 August 2026).
- Economidis, P.; Dimitriou, E.; Pagoni, R.; Michaloudi, E.; Natsis, L. Introduced and Translocated Fish Species in the Inland Waters of Greece. Fish. Manag. Ecol. 2000, 7, 239–250. [Google Scholar] [CrossRef] [Scilit]
- Kendall, M.G.; Gibbons, J.D. Rank Correlation Methods; Oxford University Press: New York, NY, USA, 1990. [Google Scholar]
- Mann, H.B. Nonparametric Tests against Trend. Econom. J. Econom. Soc. 1945, 13, 245–259. [Google Scholar] [CrossRef] [Scilit]
- Yue, S.; Pilon, P.; Phinney, B.; Cavadias, G. The Influence of Autocorrelation on the Ability to Detect Trend in Hydrological Series. Hydrol. Process. 2002, 16, 1807–1829. [Google Scholar] [CrossRef] [Scilit]
- Hamed, K.H.; Rao, A.R. A Modified Mann-Kendall Trend Test for Autocorrelated Data. J. Hydrol. 1998, 204, 182–196. [Google Scholar] [CrossRef] [Scilit]
- Sen, P.K. Estimates of the Regression Coefficient Based on Kendall’s Tau. J. Am. Stat. Assoc. 1968, 63, 1379–1389. [Google Scholar] [CrossRef]
- Hyndman, R.J.; Khandakar, Y. Automatic Time Series Forecasting: The Forecast Package for R. J. Stat. Softw. 2008, 27, 1–22. [Google Scholar] [CrossRef] [Scilit]
- Box, G.E.; Jenkins, G.M.; Reinsel, G.C.; Ljung, G.M. Time Series Analysis: Forecasting and Control; John Wiley & Sons: Hoboken, NJ, USA, 2015. [Google Scholar]
- Hyndman, R.; Koehler, A.; Ord, K.; Snyder, R. Forecasting with Exponential Smoothing: The State Space Approach; Springer: Berlin/Heidelberg, Germany, 2008. [Google Scholar]
- Assimakopoulos, V.; Nikolopoulos, K. The Theta Model: A Decomposition Approach to Forecasting. Int. J. Forecast. 2000, 16, 521–530. [Google Scholar] [CrossRef] [Scilit]
- Bates, J.M.; Granger, C.W. The Combination of Forecasts. J. Oper. Res. Soc. 1969, 20, 451–468. [Google Scholar] [CrossRef] [Scilit]
- Tashman, L.J. Out-of-Sample Tests of Forecasting Accuracy: An Analysis and Review. Int. J. Forecast. 2000, 16, 437–450. [Google Scholar] [CrossRef] [Scilit]
- Hyndman, R.J.; Koehler, A.B. Another Look at Measures of Forecast Accuracy. Int. J. Forecast. 2006, 22, 679–688. [Google Scholar] [CrossRef] [Scilit]
- Killick, R.; Fearnhead, P.; Eckley, I.A. Optimal Detection of Changepoints with a Linear Computational Cost. J. Am. Stat. Assoc. 2012, 107, 1590–1598. [Google Scholar] [CrossRef] [Scilit]
- Killick, R.; Eckley, I.A. Changepoint: An R Package for Changepoint Analysis. J. Stat. Softw. 2014, 58, 1–19. [Google Scholar] [CrossRef] [Scilit]
- Zhang, N.R.; Siegmund, D.O. A Modified Bayes Information Criterion with Applications to the Analysis of Comparative Genomic Hybridization Data. Biometrics 2007, 63, 22–32. [Google Scholar] [CrossRef] [Scilit] [PubMed]
- Bai, J.; Perron, P. Computation and Analysis of Multiple Structural Change Models. J. Appl. Econom. 2003, 18, 1–22. [Google Scholar] [CrossRef] [Scilit]
- Zeileis, A.; Leisch, F.; Hornik, K.; Kleiber, C. Strucchange: An R Package for Testing for Structural Change in Linear Regression Models. J. Stat. Softw. 2002, 7, 1–38. [Google Scholar] [CrossRef] [Scilit]
- Muggeo, V.M. Segmented: An R Package to Fit Regression Models with Broken-Line Relationships. R News 2008, 8, 20–25. [Google Scholar]
- Zeileis, A.; Grothendieck, G. Zoo: S3 Infrastructure for Regular and Irregular Time Series. J. Stat. Softw. 2005, 14, 1–27. [Google Scholar] [CrossRef] [Scilit]
- Froese, R.; Winker, H.; Coro, G.; Palomares, M.-L.; Tsikliras, A.C.; Dimarchopoulou, D.; Touloumis, K.; Demirel, N.; Vianna, G.; Scarcella, G. New Developments in the Analysis of Catch Time Series as the Basis for Fish Stock Assessments: The CMSY++ Method. Acta Ichthyol. Piscat. 2023, 53, 173–189. [Google Scholar] [CrossRef] [Scilit]
- Free, C. Datalimited2: More Stock Assessment Methods for Data-Limited Fisheries, R Package Version 0.1.0.; GitHub, Inc.: San Francisco, CA, USA, 2018.
- Froese, R.; Pauly, D. FishBase; World Wide Web Electronic Publication. Available online: https://www.fishbase.org/ (accessed on 23 August 2026).
- Punt, A.E. Harvest Control Rules and Fisheries Management. In Handbook of Marine Fisheries Conservation and Management; Oxford University Press: Oxford, UK, 2010; p. 770. [Google Scholar]
- Legendre, P.; Gallagher, E.D. Ecologically Meaningful Transformations for Ordination of Species Data. Oecologia 2001, 129, 271–280. [Google Scholar] [CrossRef] [Scilit] [PubMed]
- Oksanen, J.; Simpson, G.L.; Blanchet, F.G.; Kindt, R.; Legendre, P.; Minchin, P.R.; O’Hara, R.B.; Solymos, P.; Stevens, M.H.H.; Szoecs, E.; et al. Vegan: Community Ecology Package 2026; CRAN: Vienna, Austria, 2026. [Google Scholar]
- Legendre, P.; Legendre, L. Numerical Ecology, 3rd English ed.; Elsevier: Amsterdam, The Netherlands, 2012. [Google Scholar]
- Clarke, K.R. Non-parametric Multivariate Analyses of Changes in Community Structure. Aust. J. Ecol. 1993, 18, 117–143. [Google Scholar] [CrossRef] [Scilit]
- Clarke, K.R.; Warwick, R. Change in Marine Communities. Approach Stat. Anal. Interpret. 2001, 2, 1–168. [Google Scholar] [CrossRef] [Scilit]
- Anderson, M.J. A New Method for Non-parametric Multivariate Analysis of Variance. Austral Ecol. 2001, 26, 32–46. [Google Scholar] [CrossRef] [Scilit]
- Murtagh, F.; Legendre, P. Ward’s Hierarchical Agglomerative Clustering Method: Which Algorithms Implement Ward’s Criterion? J. Classif. 2014, 31, 274–295. [Google Scholar] [CrossRef] [Scilit]
- Tibshirani, R.; Walther, G.; Hastie, T. Estimating the Number of Clusters in a Data Set via the Gap Statistic. J. R. Stat. Soc. Ser. B Stat. Methodol. 2001, 63, 411–423. [Google Scholar] [CrossRef] [Scilit]
- Shannon, C.E. A Mathematical Theory of Communication. Bell Syst. Tech. J. 1948, 27, 379–423. [Google Scholar] [CrossRef] [Scilit]
- Simpson, E.H. Measurement of Diversity. Nature 1949, 163, 688. [Google Scholar] [CrossRef] [Scilit]
- Pielou, E.C. The Measurement of Diversity in Different Types of Biological Collections. J. Theor. Biol. 1966, 13, 131–144. [Google Scholar] [CrossRef] [Scilit]
- Hill, M.O. Diversity and Evenness: A Unifying Notation and Its Consequences. Ecology 1973, 54, 427–432. [Google Scholar] [CrossRef] [Scilit] [PubMed]
- Jost, L. Entropy and Diversity. Oikos 2006, 113, 363–375. [Google Scholar] [CrossRef] [Scilit]
- Chao, A.; Chiu, C.-H.; Jost, L. Unifying Species Diversity, Phylogenetic Diversity, Functional Diversity, and Related Similarity and Differentiation Measures through Hill Numbers. Annu. Rev. Ecol. Evol. Syst. 2014, 45, 297–324. [Google Scholar] [CrossRef] [Scilit]
- Wood, S.N. Fast stable restricted maximum likelihood and marginal likelihood estimation of semiparametric generalized linear models. J. R. Stat. Soc. Ser. B Stat. Methodol. 2011, 73, 3–36. [Google Scholar] [CrossRef] [Scilit]
- Chatfield, C. The Analysis of Time Series: An Introduction, 6th ed.; Chapman and Hall/CRC: New York, NY, USA, 2003. [Google Scholar]
- Holmes, E.E.; Ward, E.J.; Wills, K. MARSS: Multivariate Autoregressive State-Space Models for Analyzing Time-Series Data. R J. 2012, 4, 11–19. [Google Scholar] [CrossRef] [Scilit]
- Rousseeuw, P.J. Silhouettes: A Graphical Aid to the Interpretation and Validation of Cluster Analysis. J. Comput. Appl. Math. 1987, 20, 53–65. [Google Scholar] [CrossRef] [Scilit]
- Kassambara, A.; Mundt, F. Factoextra V 2.2.0: Extract and Visualize the Results of Multivariate Data Analyses 2026; CRAN: Vienna, Austria, 2026. [Google Scholar]
- Maechler, M.; Rousseeuw, P.; Struyf, A.; Hubert, M.; Hornik, K. Cluster: Cluster Analysis Basics and Extensions R Package 2026. Available online: https://CRAN.R-project.org/package=cluster (accessed on 10 September 2026).
- Dickey, D.A.; Fuller, W.A. Distribution of the Estimators for Autoregressive Time Series with a Unit Root. J. Am. Stat. Assoc. 1979, 74, 427–431. [Google Scholar] [CrossRef] [Scilit]
- Kwiatkowski, D.; Phillips, P.C.; Schmidt, P.; Shin, Y. Testing the Null Hypothesis of Stationarity against the Alternative of a Unit Root: How Sure Are We That Economic Time Series Have a Unit Root? J. Econom. 1992, 54, 159–178. [Google Scholar] [CrossRef] [Scilit]
- Trapletti, A.; Hornik, K. Tseries: Time Series Analysis and Computational Finance R Package, 2026. Available online: https://CRAN.R-project.org/package=tseries (accessed on 10 September 2026).
- R Core Team. R: A Language and Environment for Statistical Computing, Version 4.6.1; R Foundation for Statistical Computing: Vienna, Austria, 2026. Available online: https://www.R-project.org/ (accessed on 10 September 2026).
- Andersen, T.; Carstensen, J.; Hernandez-Garcia, E.; Duarte, C.M. Ecological Thresholds and Regime Shifts: Approaches to Identification. Trends Ecol. Evol. 2009, 24, 49–57. [Google Scholar] [CrossRef] [Scilit] [PubMed]
- Allan, J.D.; Abell, R.; Hogan, Z.; Revenga, C.; Taylor, B.W.; Welcomme, R.L.; Winemiller, K. Overfishing of Inland Waters. BioScience 2005, 55, 1041–1051. [Google Scholar] [CrossRef] [Scilit]
- Welcomme, R.L.; Cowx, I.G.; Coates, D.; Béné, C.; Funge-Smith, S.; Halls, A.; Lorenzen, K. Inland Capture Fisheries. Philos. Trans. R. Soc. B Biol. Sci. 2010, 365, 2881. [Google Scholar] [CrossRef] [Scilit] [PubMed]
- Moutopoulos, D.K.; Koutsikos, N.; Vardakas, L.; Perdikaris, C. A History of Greek Inland Fishery Development during 1928–2019. Fish. Manag. Ecol. 2022, 29, 681–692. [Google Scholar] [CrossRef] [Scilit]
- Tsikliras, A.C.; Dinouli, A.; Tsiros, V.-Z.; Tsalkou, E. The Mediterranean and Black Sea Fisheries at Risk from Overexploitation. PLoS ONE 2015, 10, e0121188. [Google Scholar] [CrossRef] [Scilit] [PubMed]
- Conversi, A.; Dakos, V.; Gårdmark, A.; Ling, S.; Folke, C.; Mumby, P.J.; Greene, C.; Edwards, M.; Blenckner, T.; Casini, M. A Holistic View of Marine Regime Shifts. Philos. Trans. R. Soc. B Biol. Sci. 2015, 370, 20130279. [Google Scholar] [CrossRef] [Scilit]
- Scheffer, M.; Carpenter, S.; Foley, J.A.; Folke, C.; Walker, B. Catastrophic Shifts in Ecosystems. Nature 2001, 413, 591–596. [Google Scholar] [CrossRef] [Scilit] [PubMed]
- Genitsaris, S.; Kormas, K.A.; Moustaka-Gouni, M. Microscopic Eukaryotes Living in a Dying Lake (Lake Koronia, Greece). FEMS Microbiol. Ecol. 2009, 69, 75–83. [Google Scholar] [CrossRef] [Scilit] [PubMed]
- Perdikaris, C.; Ergolavou, A.; Gouva, E.; Nathanailides, C.; Chantzaropoulos, A.; Paschos, I. Carassius gibelio in Greece: The Dominant Naturalised Invader of Freshwaters. Rev. Fish Biol. Fish. 2012, 22, 17–27. [Google Scholar] [CrossRef] [Scilit]
- Volta, P.; Jeppesen, E.; Sala, P.; Galafassi, S.; Foglini, C.; Puzzi, C.; Winfield, I.J. Fish Assemblages in Deep Italian Subalpine Lakes: History and Present Status with an Emphasis on Non-Native Species. Hydrobiologia 2018, 824, 255–270. [Google Scholar] [CrossRef] [Scilit]
- Leonardos, I.; Tsikliras, A.; Eleftheriou, V.; Cladas, Y.; Kagalou, I.; Chortatou, R.; Papigioti, O. Life History Characteristics of an Invasive Cyprinid Fish (Carassius gibelio) in Chimaditis Lake (Northern Greece). J. Appl. Ichthyol. 2008, 24, 213–217. [Google Scholar] [CrossRef] [Scilit]
- Gui, J.F.; Zhou, L. Genetic basis and breeding application of clonal diversity and dual reproduction modes in polyploid Carassius auratus gibelio. Sci. China Life Sci. 2010, 53, 409–415. [Google Scholar] [CrossRef] [Scilit] [PubMed]
- Wouters, J.; Janson, S.; Lusková, V.; Olsén, K.H. Molecular identification of hybrids of the invasive gibel carp Carassius auratus gibelio and crucian carp Carassius carassius in Swedish waters. J. Fish Biol. 2012, 80, 2595–2604. [Google Scholar] [CrossRef] [Scilit] [PubMed]
- Cucherousset, J.; Olden, J.D. Ecological Impacts of Non-Native Freshwater Fishes. Fisheries 2011, 36, 215–230. [Google Scholar] [CrossRef] [Scilit]
- Ruppert, J.L.; Docherty, C.; Neufeld, K.; Hamilton, K.; MacPherson, L.; Poesch, M.S. Native Freshwater Species Get out of the Way: Prussian Carp (Carassius gibelio) Impacts Both Fish and Benthic Invertebrate Communities in North America. R. Soc. Open Sci. 2017, 4, 170400. [Google Scholar] [CrossRef] [Scilit] [PubMed]
- Gozlan, R.E.; Britton, J.; Cowx, I.; Copp, G. Current Knowledge on Non-native Freshwater Fish Introductions. J. Fish Biol. 2010, 76, 751–786. [Google Scholar] [CrossRef] [Scilit]
- Simberloff, D.; Von Holle, B. Positive Interactions of Nonindigenous Species: Invasional Meltdown? Biol. Invasions 1999, 1, 21–32. [Google Scholar] [CrossRef] [Scilit]
- Pons, M.; Cope, J.M.; Kell, L.T. Comparing Performance of Catch-Based and Length-Based Stock Assessment Methods in Data-Limited Fisheries. Can. J. Fish. Aquat. Sci. 2020, 77, 1026–1037. [Google Scholar] [CrossRef] [Scilit]
- Pauly, D.; Christensen, V.; Dalsgaard, J.; Froese, R.; Torres, F., Jr. Fishing down Marine Food Webs. Science 1998, 279, 860–863. [Google Scholar] [CrossRef] [Scilit] [PubMed]
- Economou, A.; Giakoumi, S.; Vardakas, L.; Barbieri, R.; Stoumboudi, M.Τ.; Zogaris, S. The Freshwater Ichthyofauna of Greece-an Update Based on a Hydrographic Basin Survey. Mediterr. Mar. Sci. 2007, 8, 91–166. [Google Scholar] [CrossRef] [Scilit]
- Kleanthidis, P.; Sinis, A. Feeding Habits of the Macedonian Shad, Alosa Macedonica (Vinciguerra, 1921) in Lake Volvi (Greece): Seasonal and Ontogenetic Changes. Isr. J. Zool. 2001, 47, 213–232. [Google Scholar] [CrossRef]
- Razlutskij, V.; Mei, X.; Maisak, N.; Sysova, E.; Lukashanets, D.; Makaranka, A.; Jeppesen, E.; Zhang, X. Omnivorous carp (Carassius gibelio) increase eutrophication in part by preventing development of large-bodied zooplankton and submerged macrophytes. Water 2021, 13, 1497. [Google Scholar] [CrossRef] [Scilit]
- Pike, C.; Crook, V.; Gollock, M.; Beaulaton, L.; Belpaire, C.; Dekker, W.; Díaz, E.; Durif, C.M.; Hanel, R. Anguilla anguilla. IUCN Red List Threat. Species 2020, 2020, e.T60344A152845178. [Google Scholar] [CrossRef] [Scilit]
- Drouineau, H.; Durif, C.; Castonguay, M.; Mateo, M.; Rochard, E.; Verreault, G.; Yokouchi, K.; Lambert, P. Freshwater Eels: A Symbol of the Effects of Global Change. Fish Fish. 2018, 19, 903–930. [Google Scholar] [CrossRef] [Scilit]
- Council of the European Union. Council Regulation (EC) No 1100/2007 of 18 September 2007 establishing measures for the recovery of the stock of European eel. Off. J. Eur. Union 2007, L 248, 17–23. Available online: https://eur-lex.europa.eu/eli/reg/2007/1100/oj/eng (accessed on 12 October 2026).
- ICES. European eel (Anguilla anguilla) throughout its natural range. In Report of the ICES Advisory Committee, 2025; ICES Advice 2025, ele.2737.nea; ICES: Copenhagen, Denmark, 2025. [Google Scholar] [CrossRef]
- Stoilas, V.; Kokkinakis, A. Fishery Assessment of Lake Volvi (Northern Greece) Using Historical and Recent Data. In Proceedings of the 5th International Congress on Applied Ichthyology, Oceanography, and Aquatic Environment (HydroMediT 2024), Mytilene, Greece, 28 May–2 June 2024; pp. 819–823. [Google Scholar]
- Cook, C.M.; Vardaka, E.; Lanaras, T. Toxic Cyanobacteria in Greek Freshwaters, 1987—2000: Occurrence, Toxicity, and Impacts in the Mediterranean Region. Acta Hydrochim. Hydrobiol. 2004, 32, 107–124. [Google Scholar] [CrossRef] [Scilit]
- Petriki, O.; Patsia, A.; Vafeiadou, A.; Tekidis, I.; Michalopoulou, P.; Samartzi, S.; Mallinis, D.; Bobori, D.C. Tracking the Causes of a Mass Fish Kill at a Mediterranean River within a Protected Area. Water 2021, 13, 989. [Google Scholar] [CrossRef] [Scilit]
- Hilborn, R.; Amoroso, R.O.; Anderson, C.M.; Baum, J.K.; Branch, T.A.; Costello, C.; De Moor, C.L.; Faraj, A.; Hively, D.; Jensen, O.P. Effective Fisheries Management Instrumental in Improving Fish Stock Status. Proc. Natl. Acad. Sci. USA 2020, 117, 2218–2224. [Google Scholar] [CrossRef] [Scilit] [PubMed]
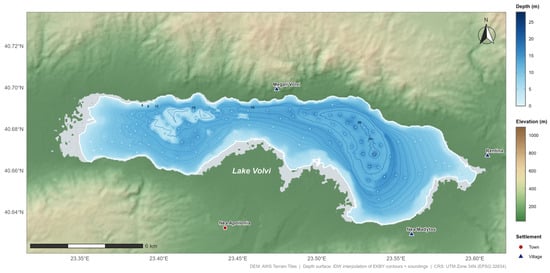
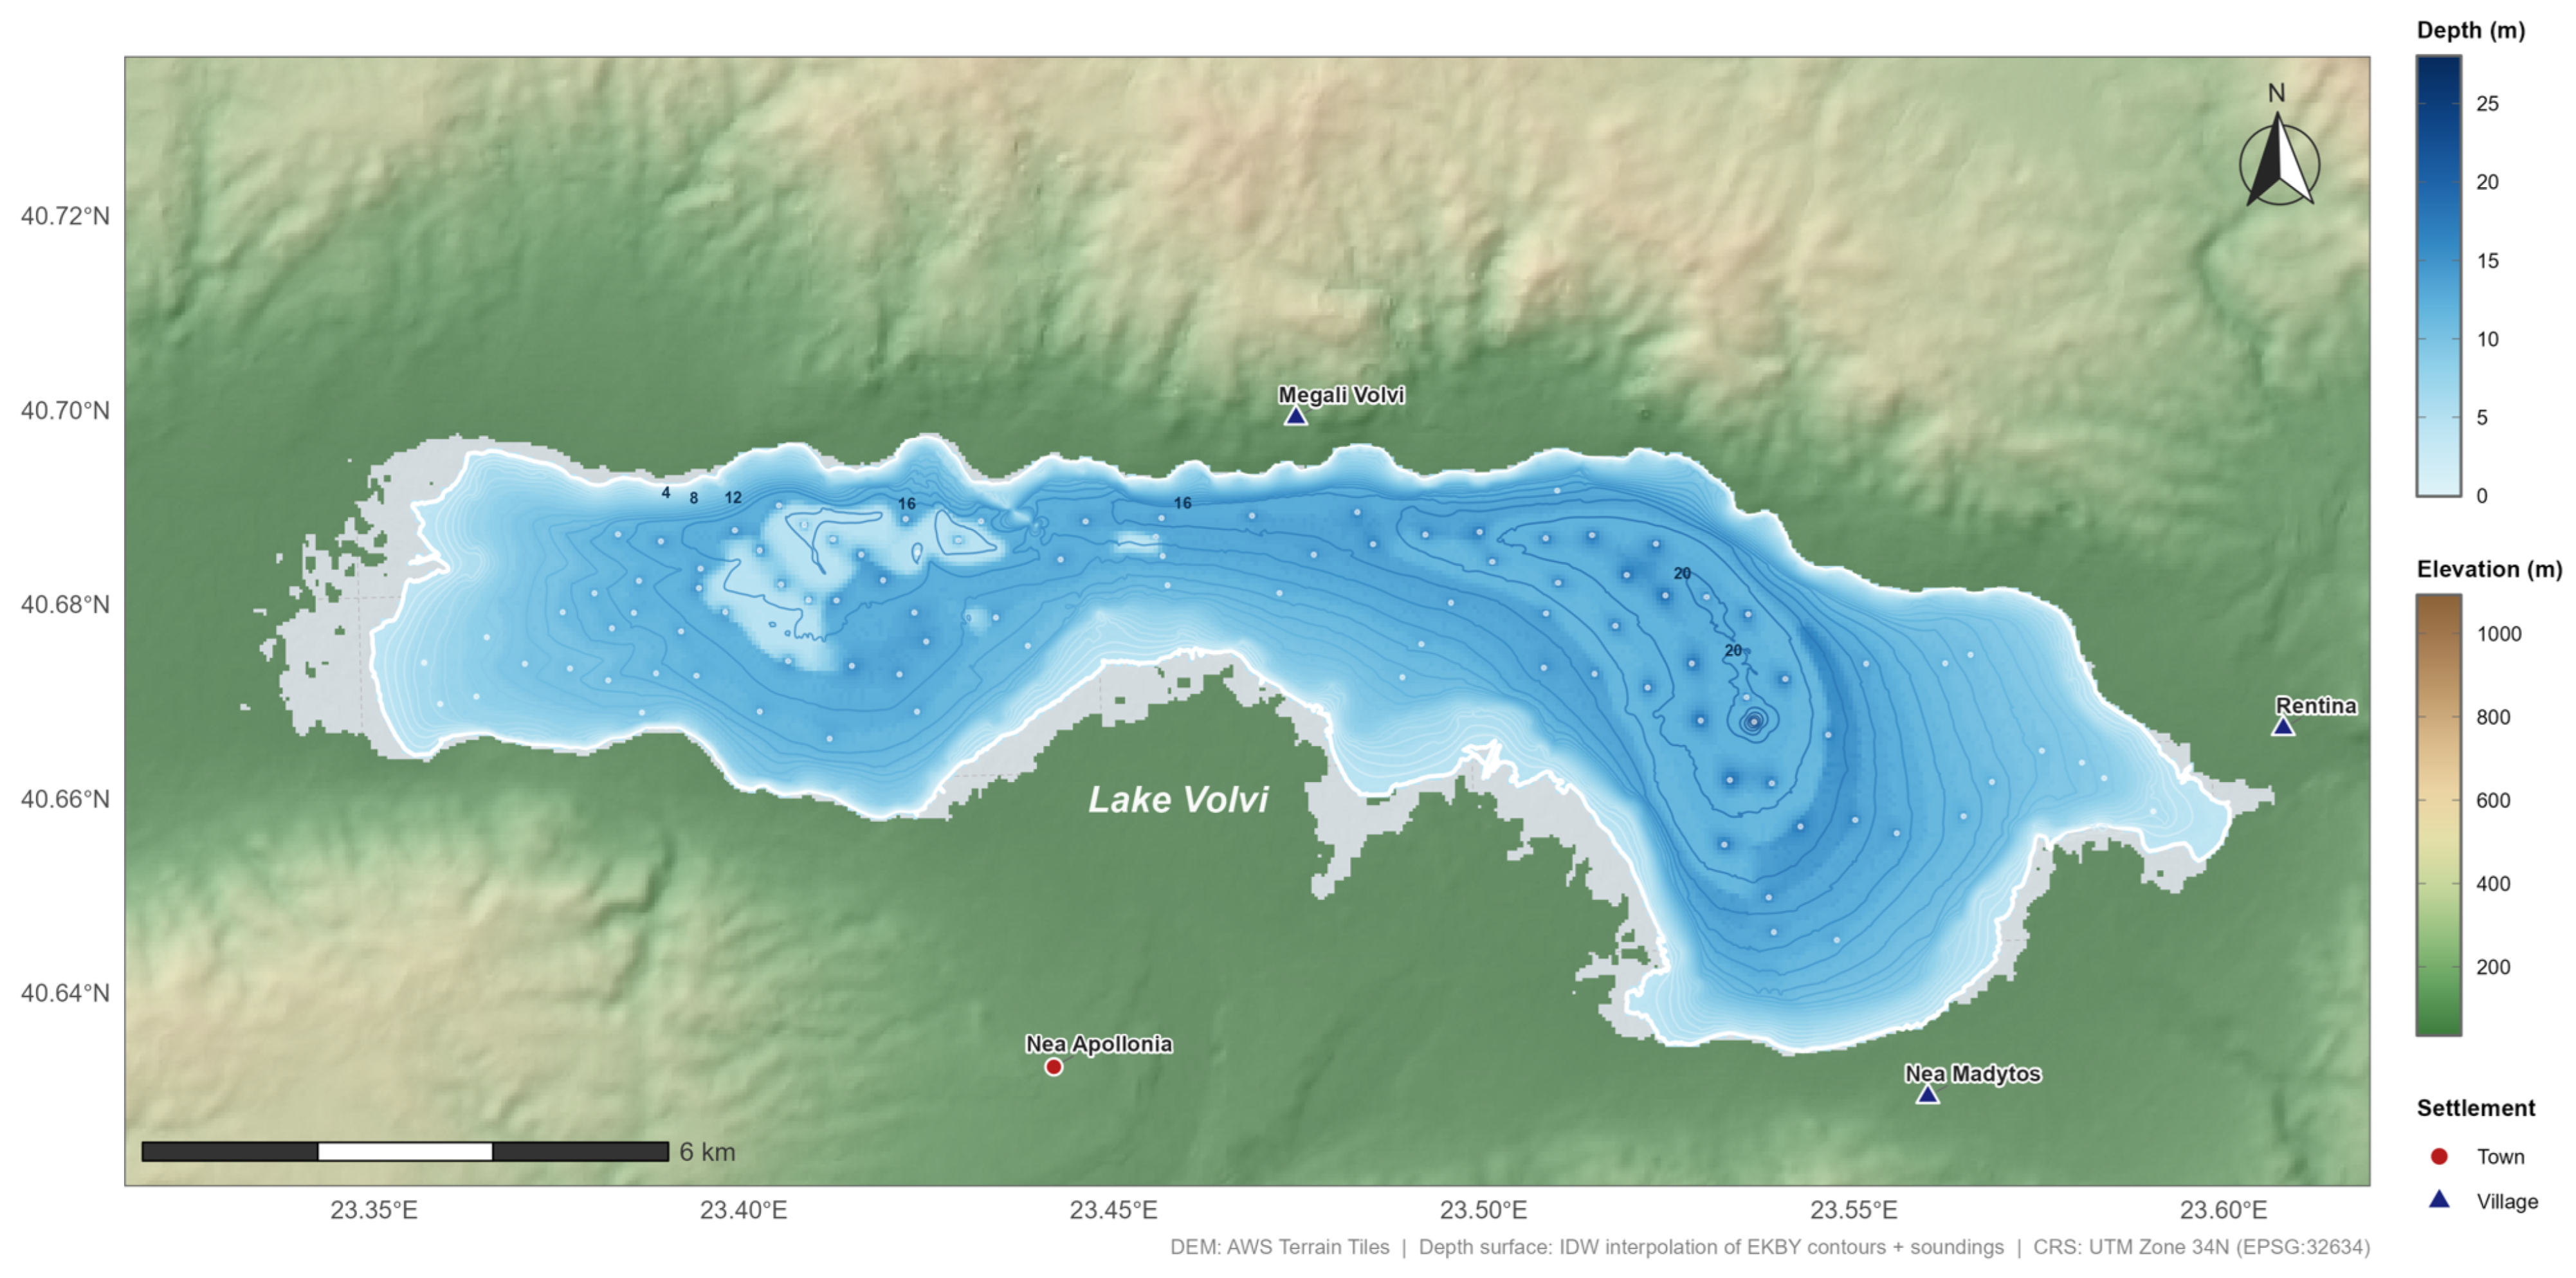
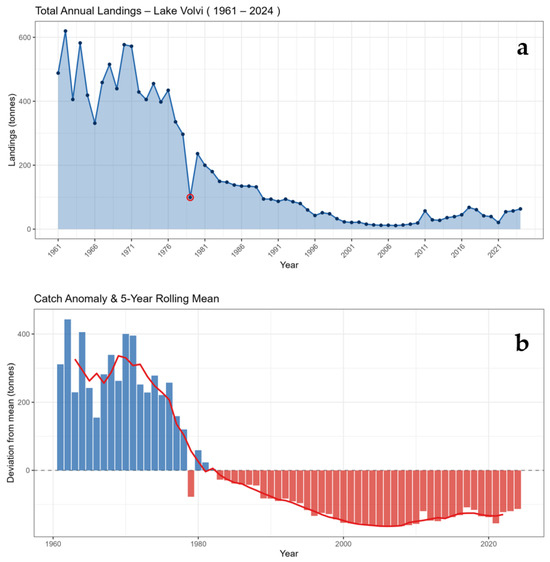
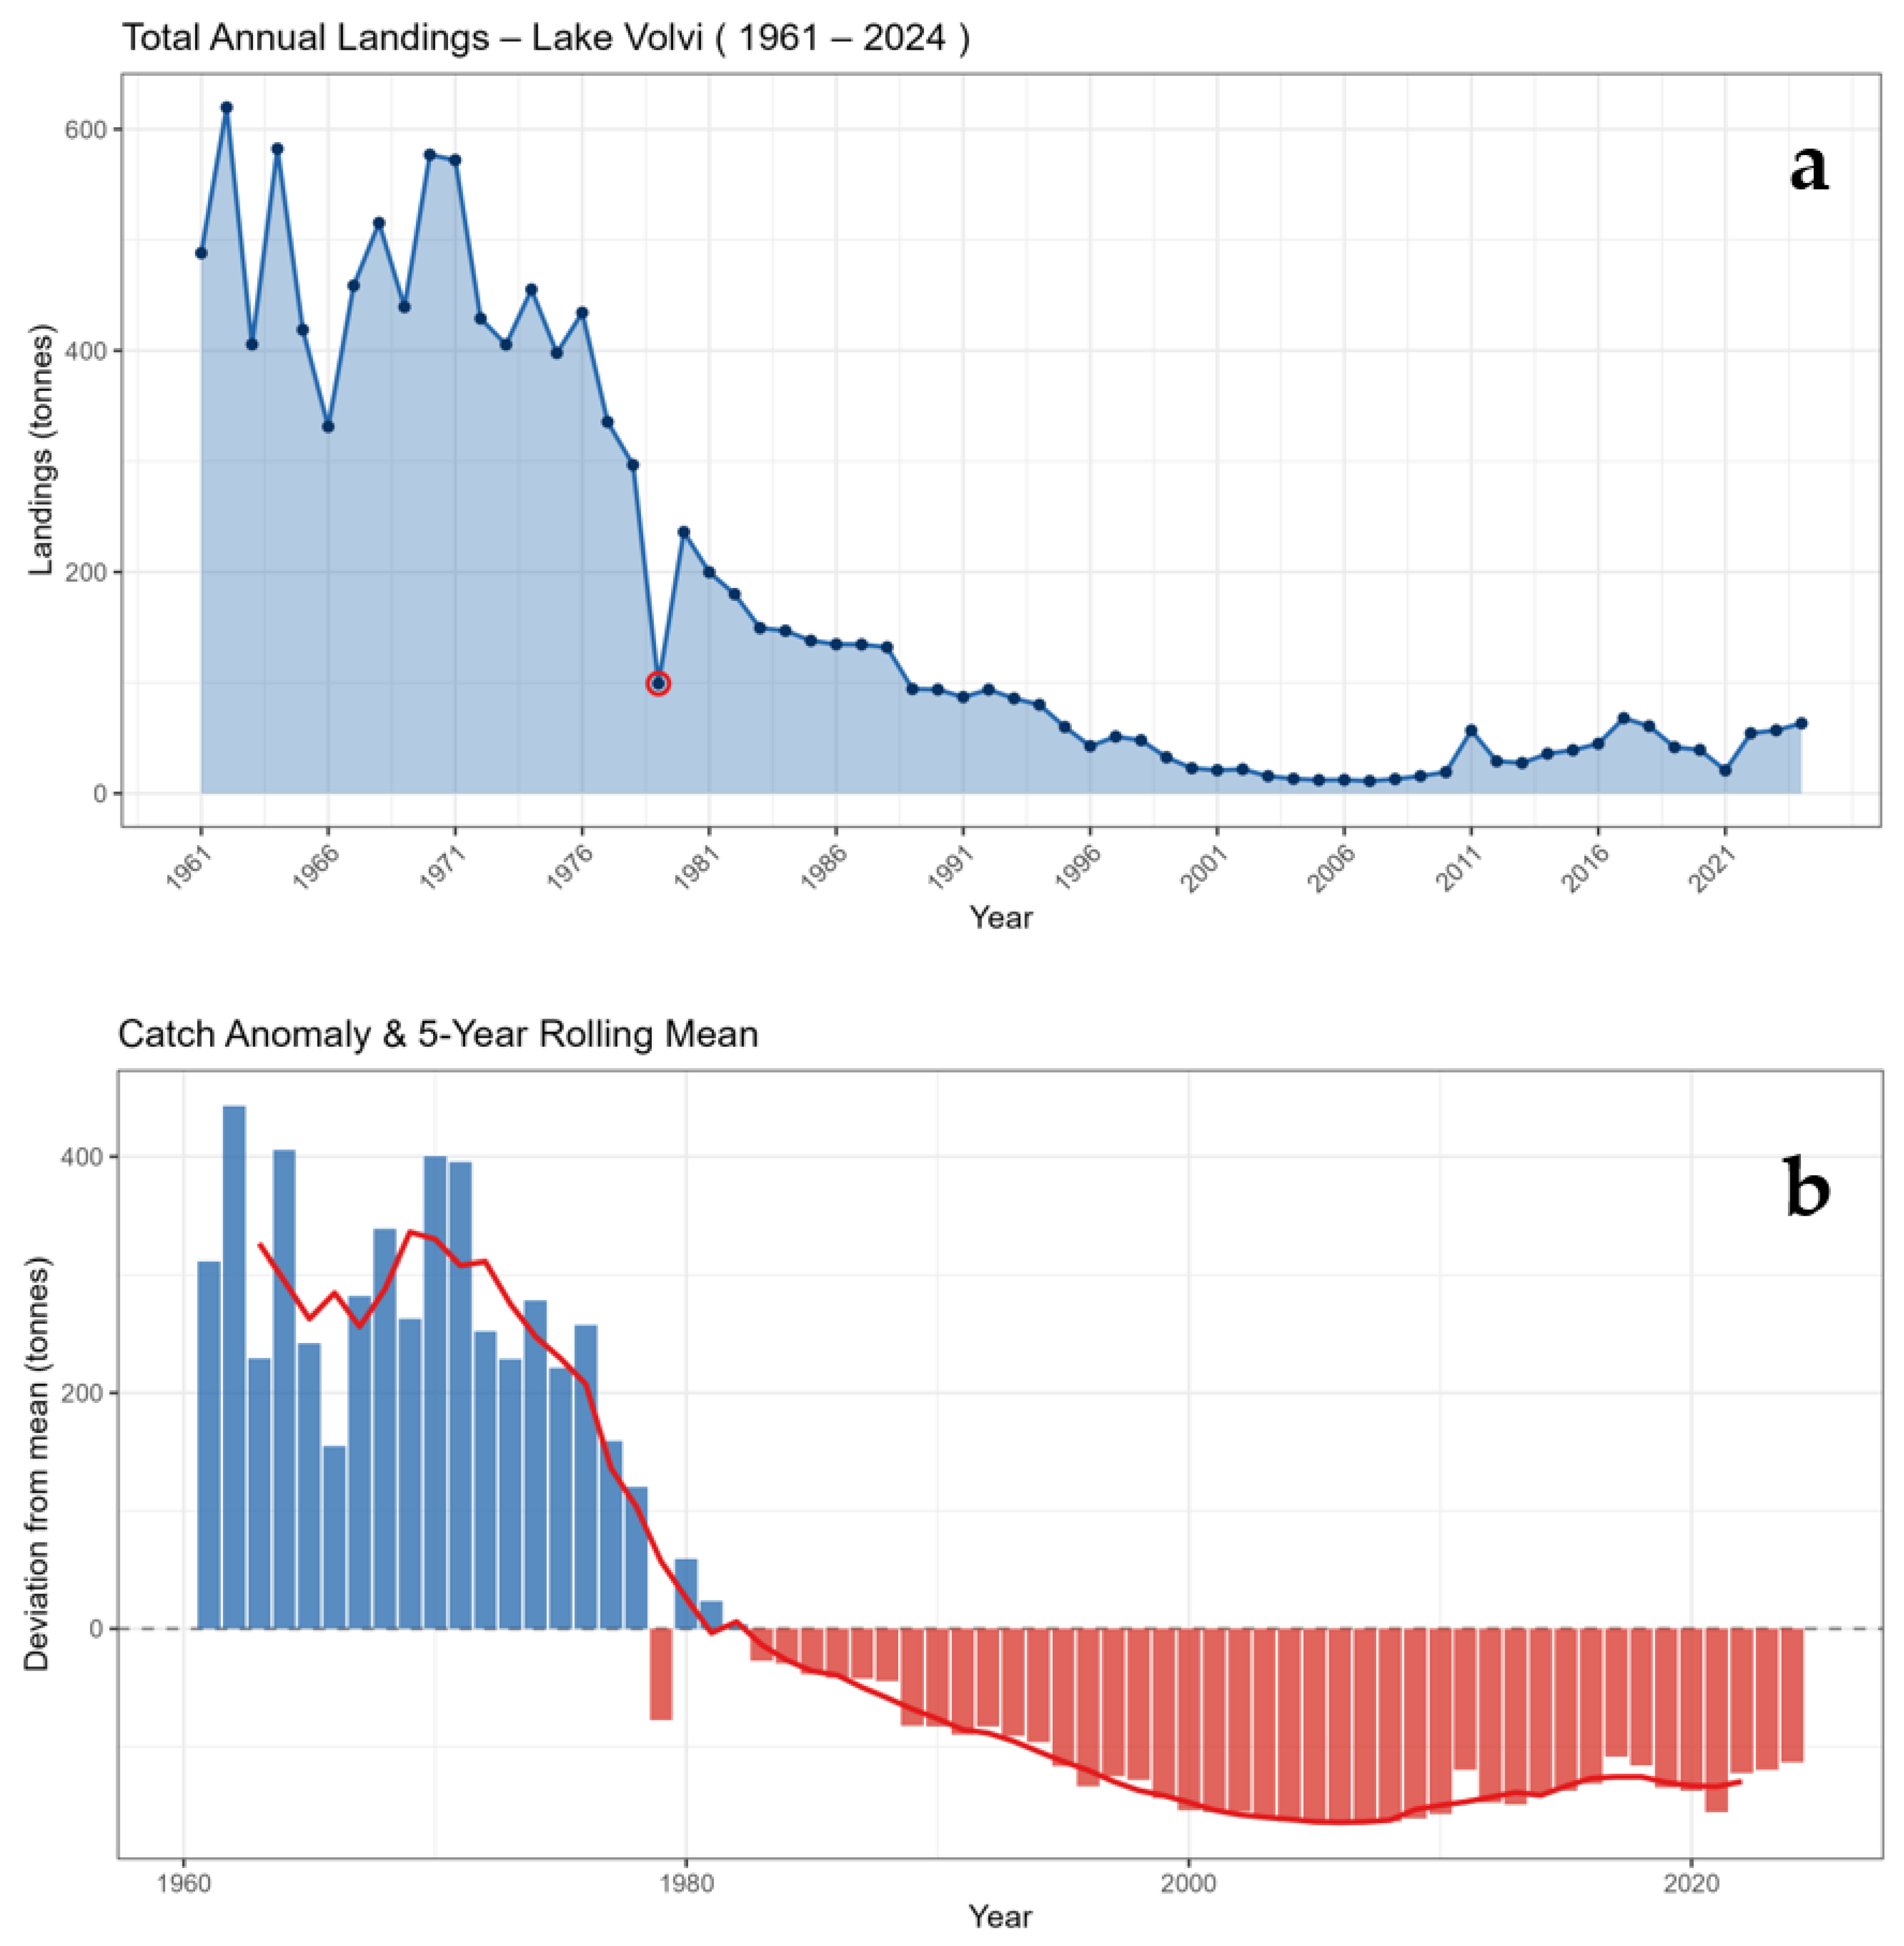
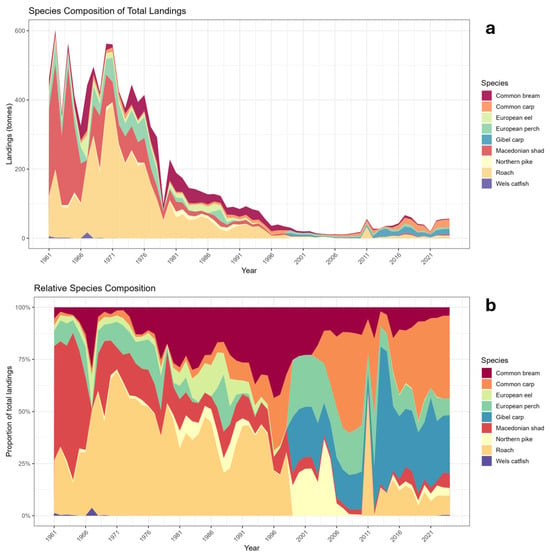
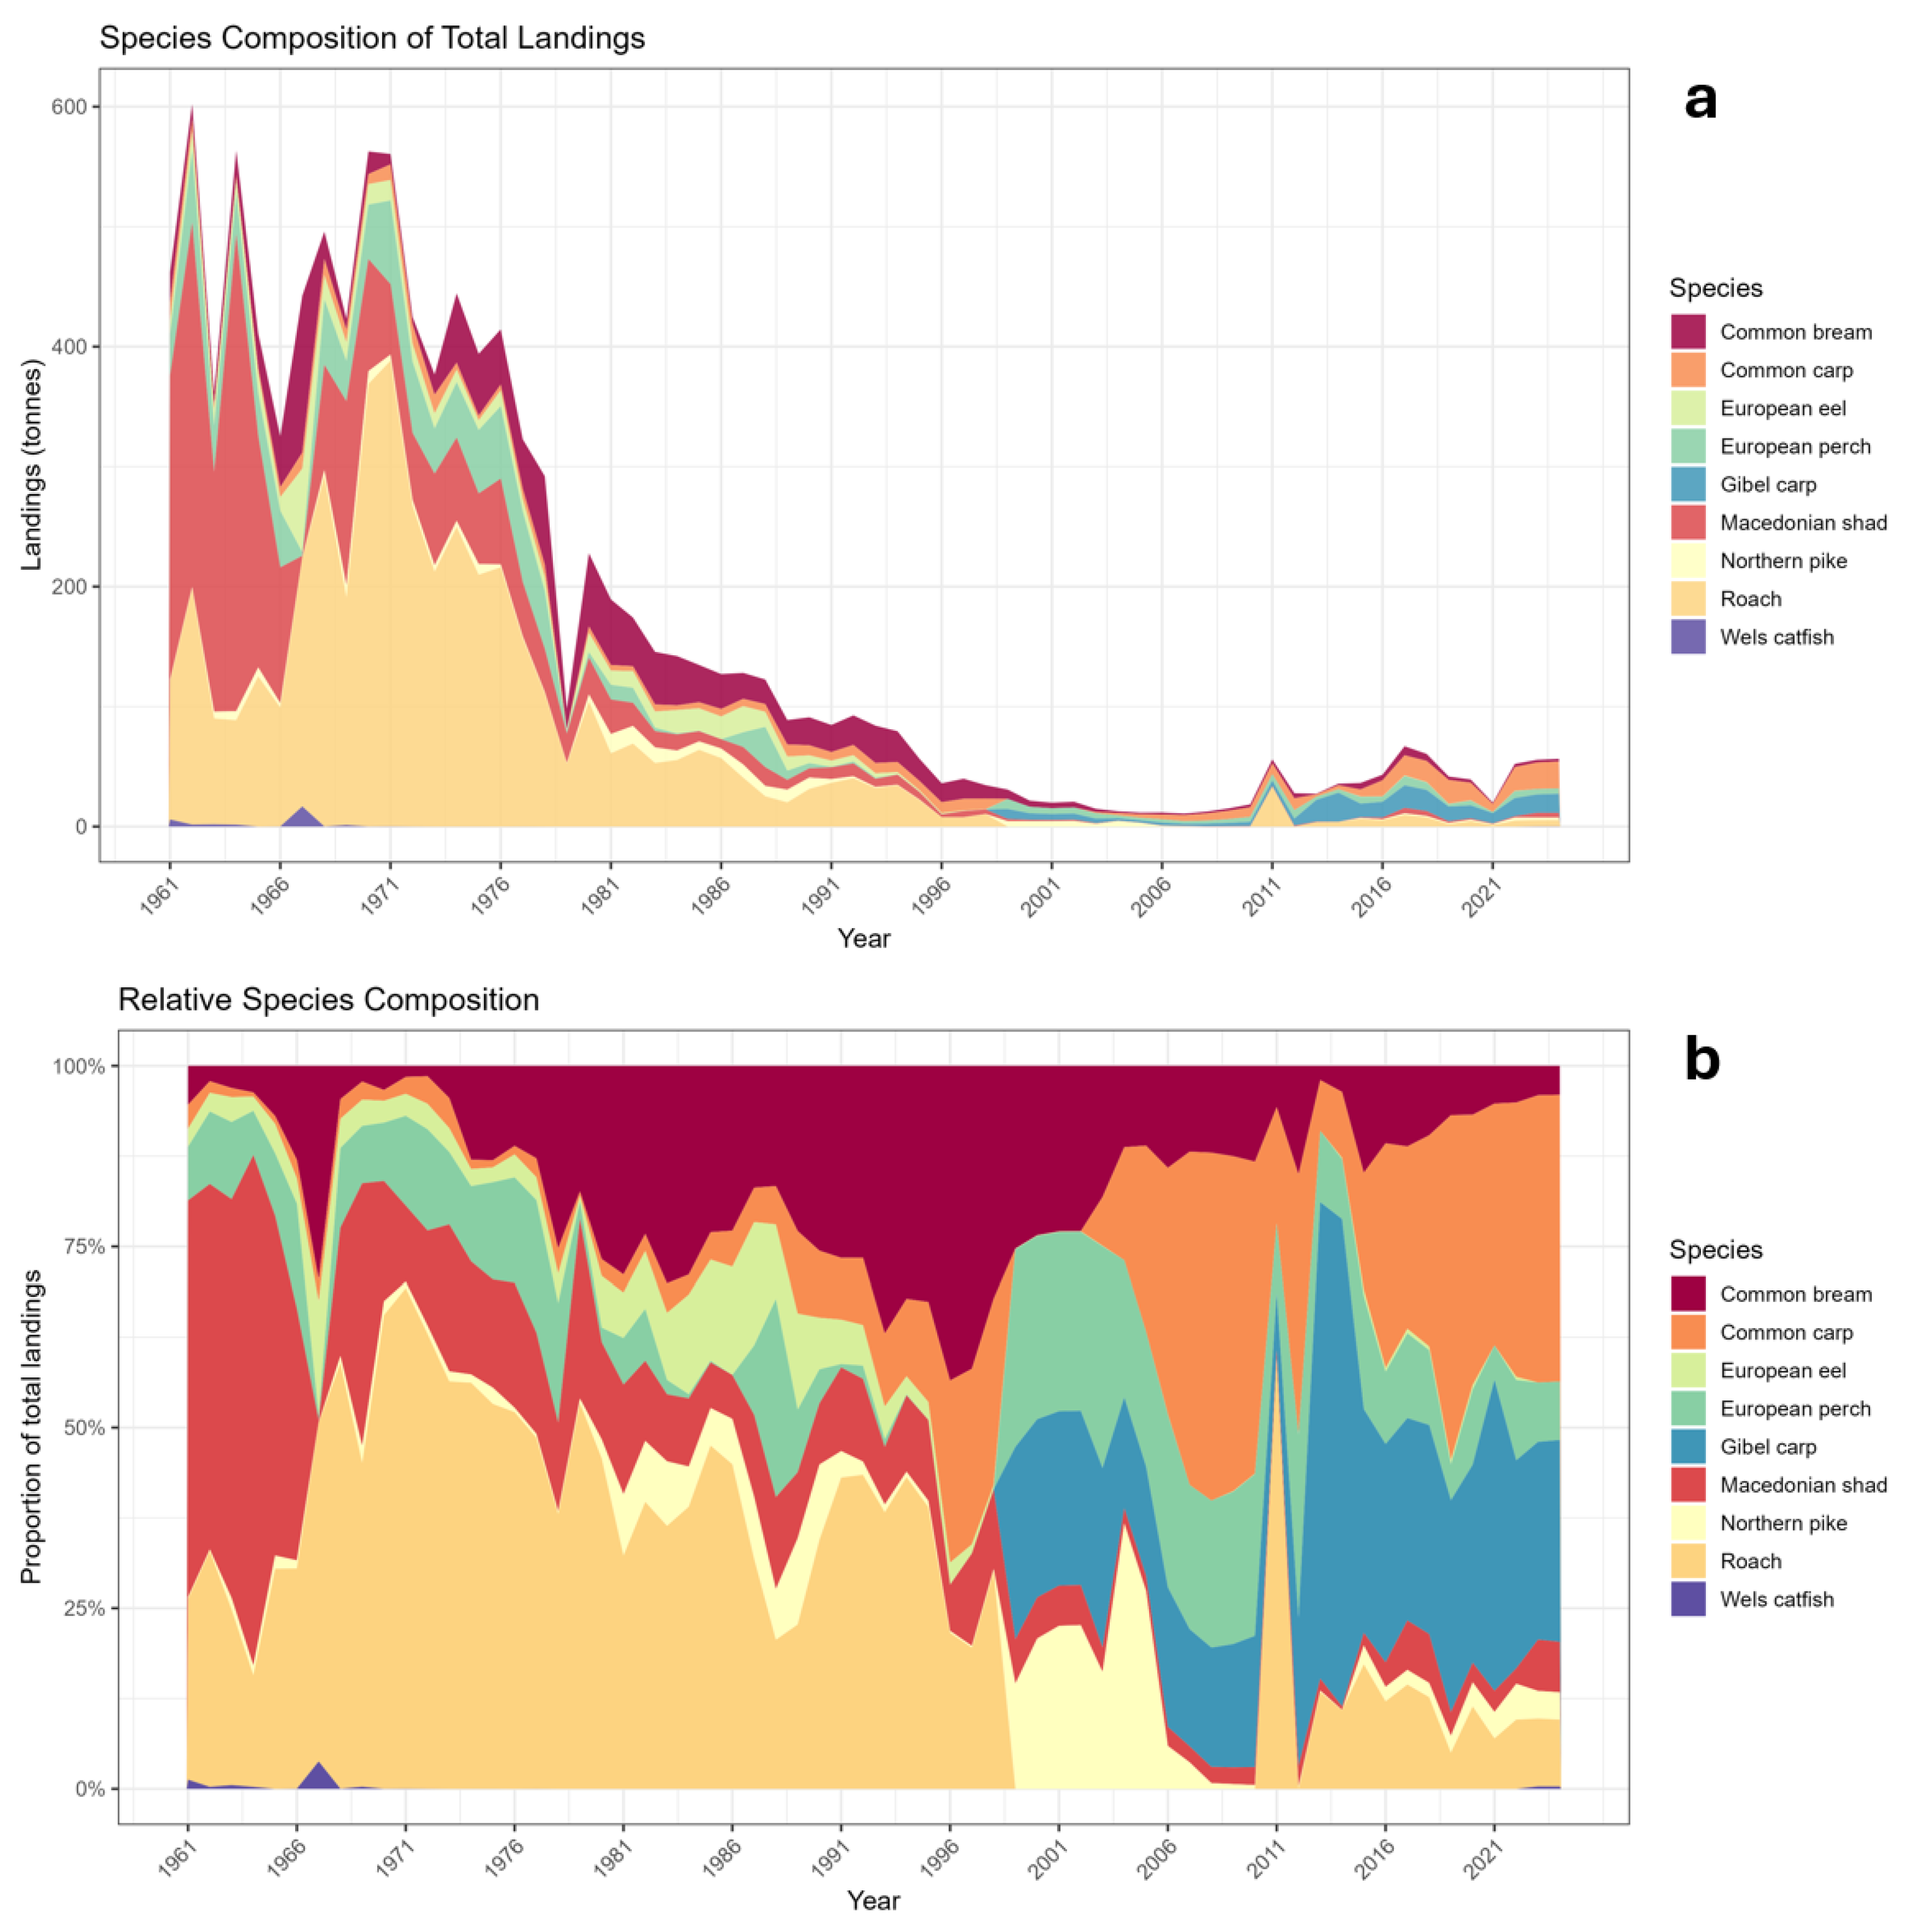
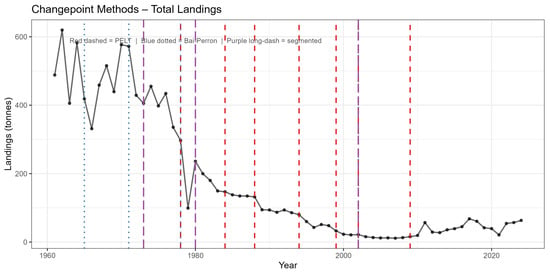
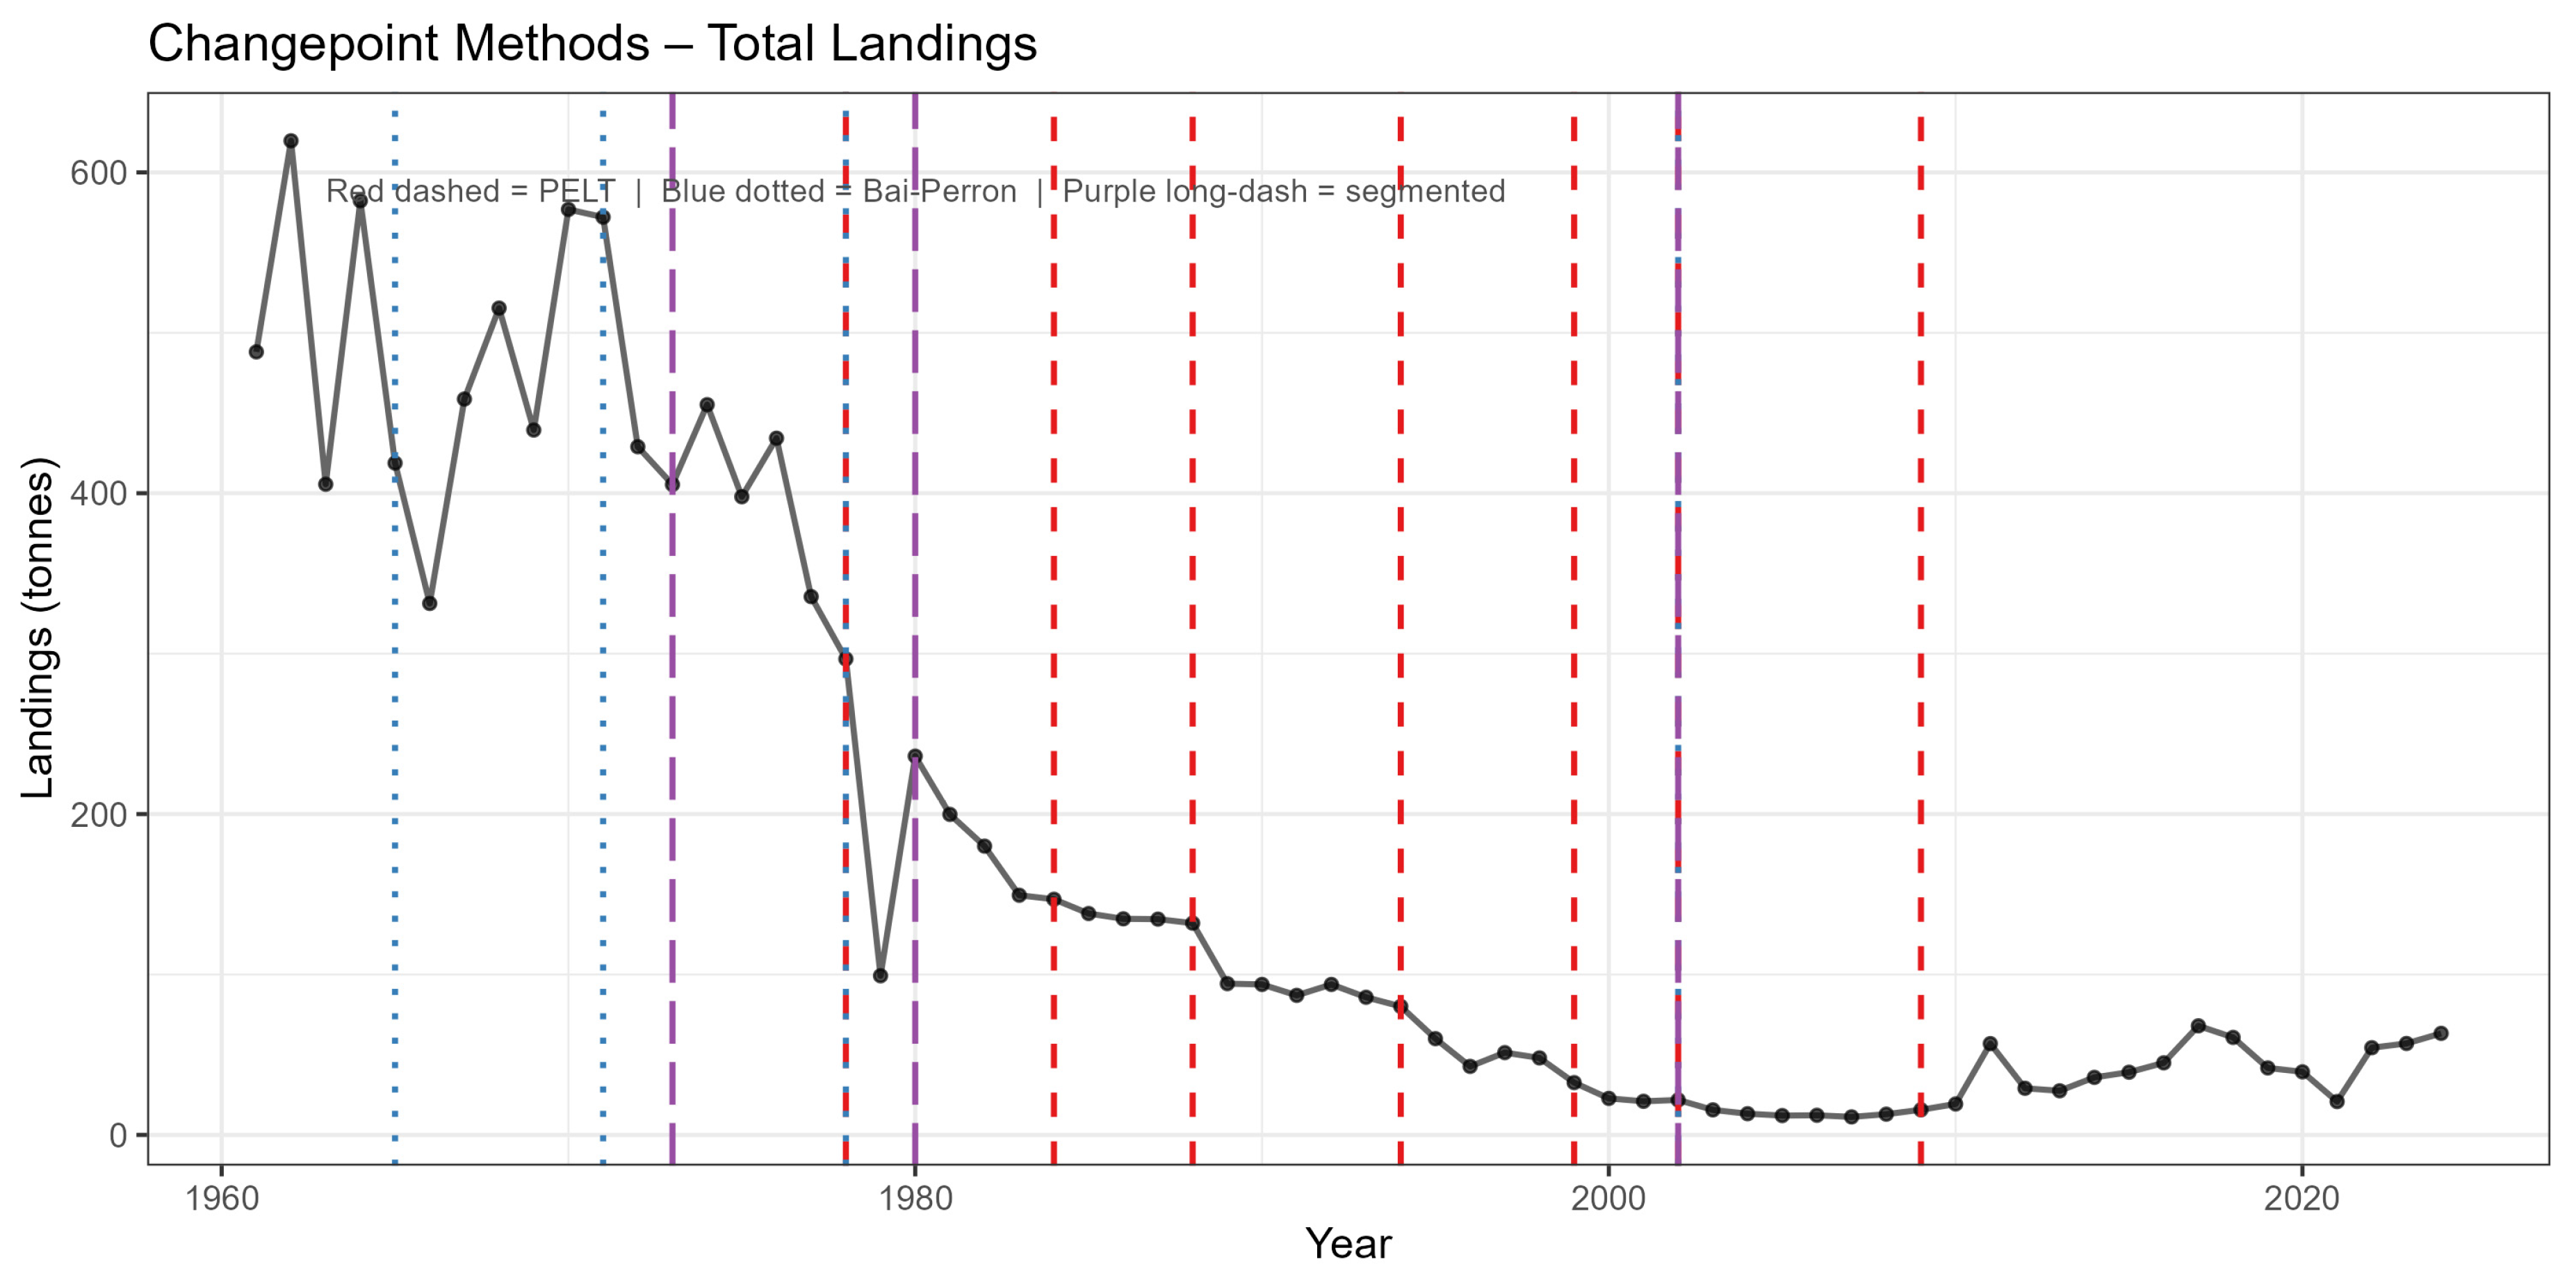
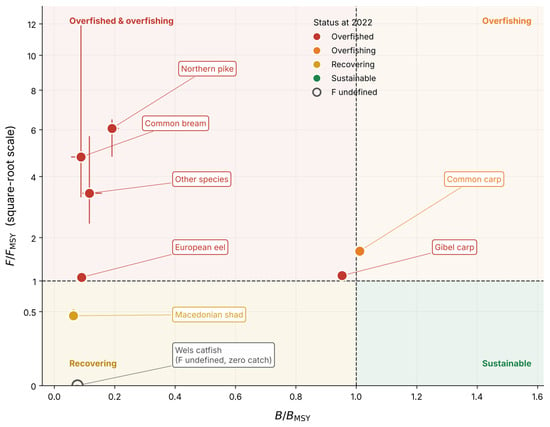
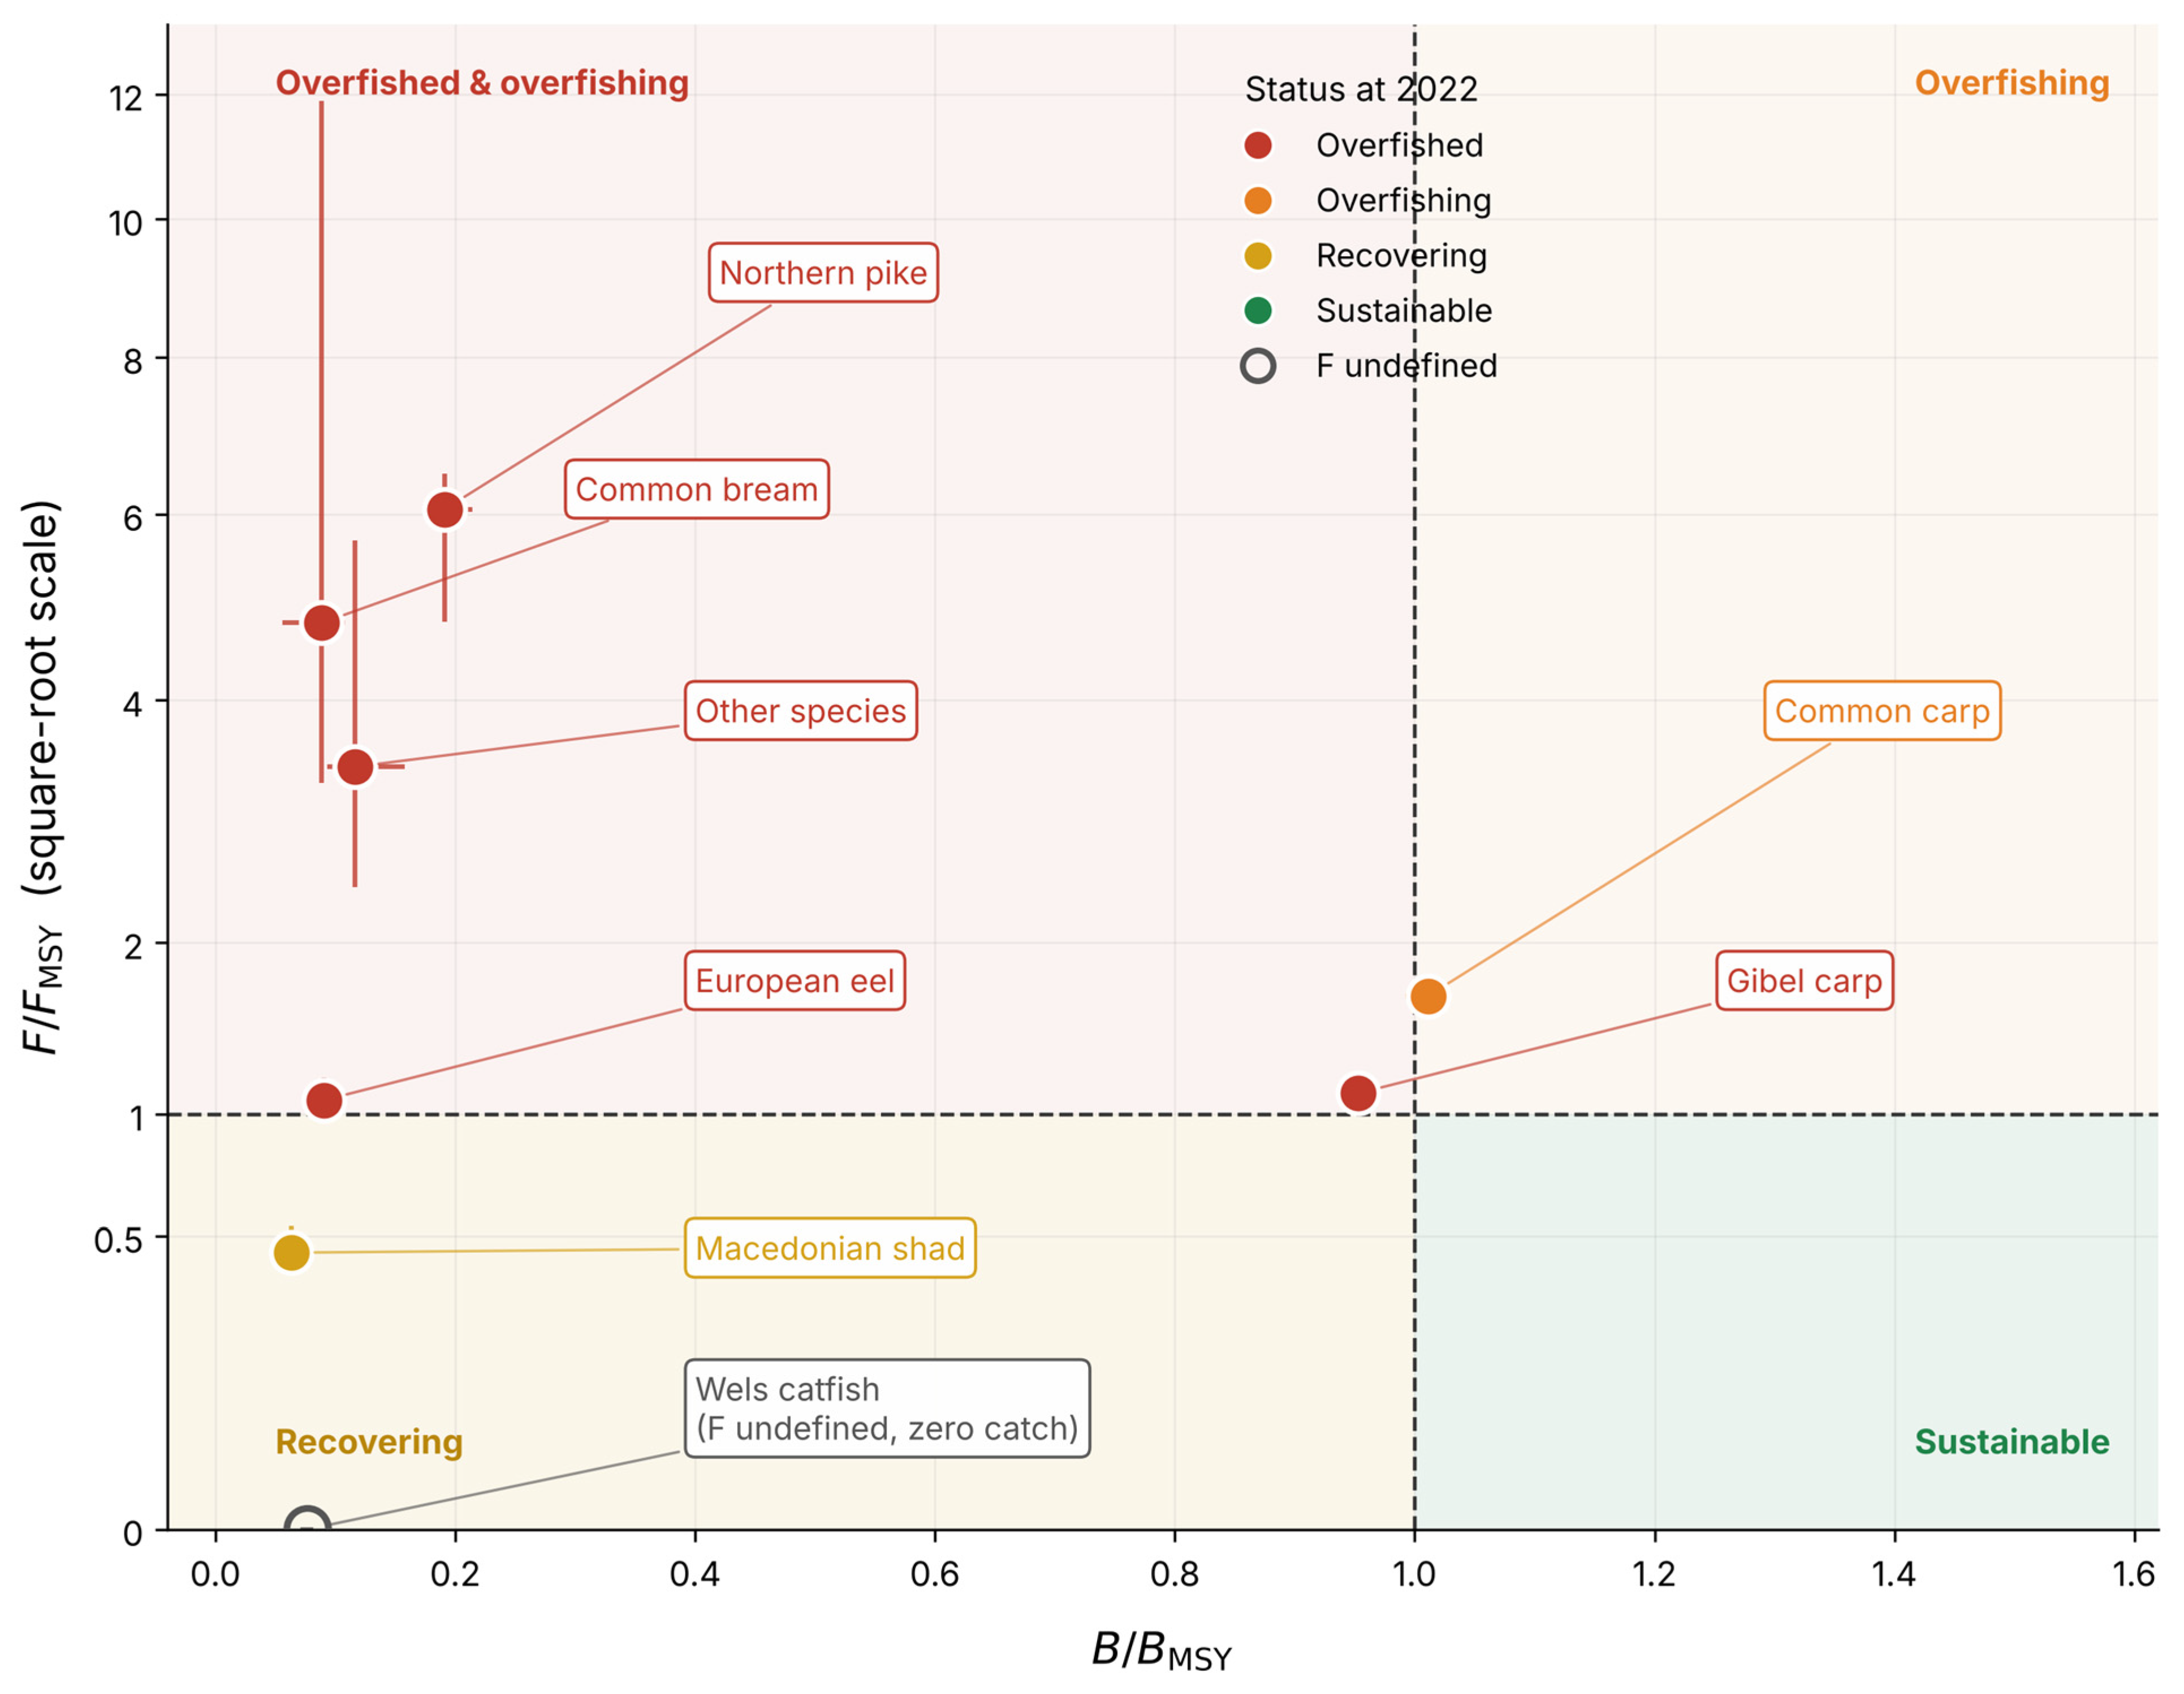
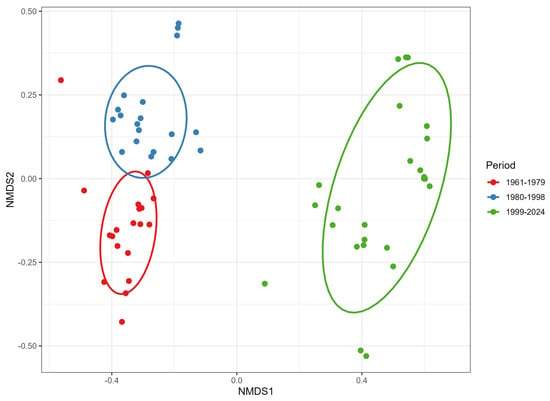
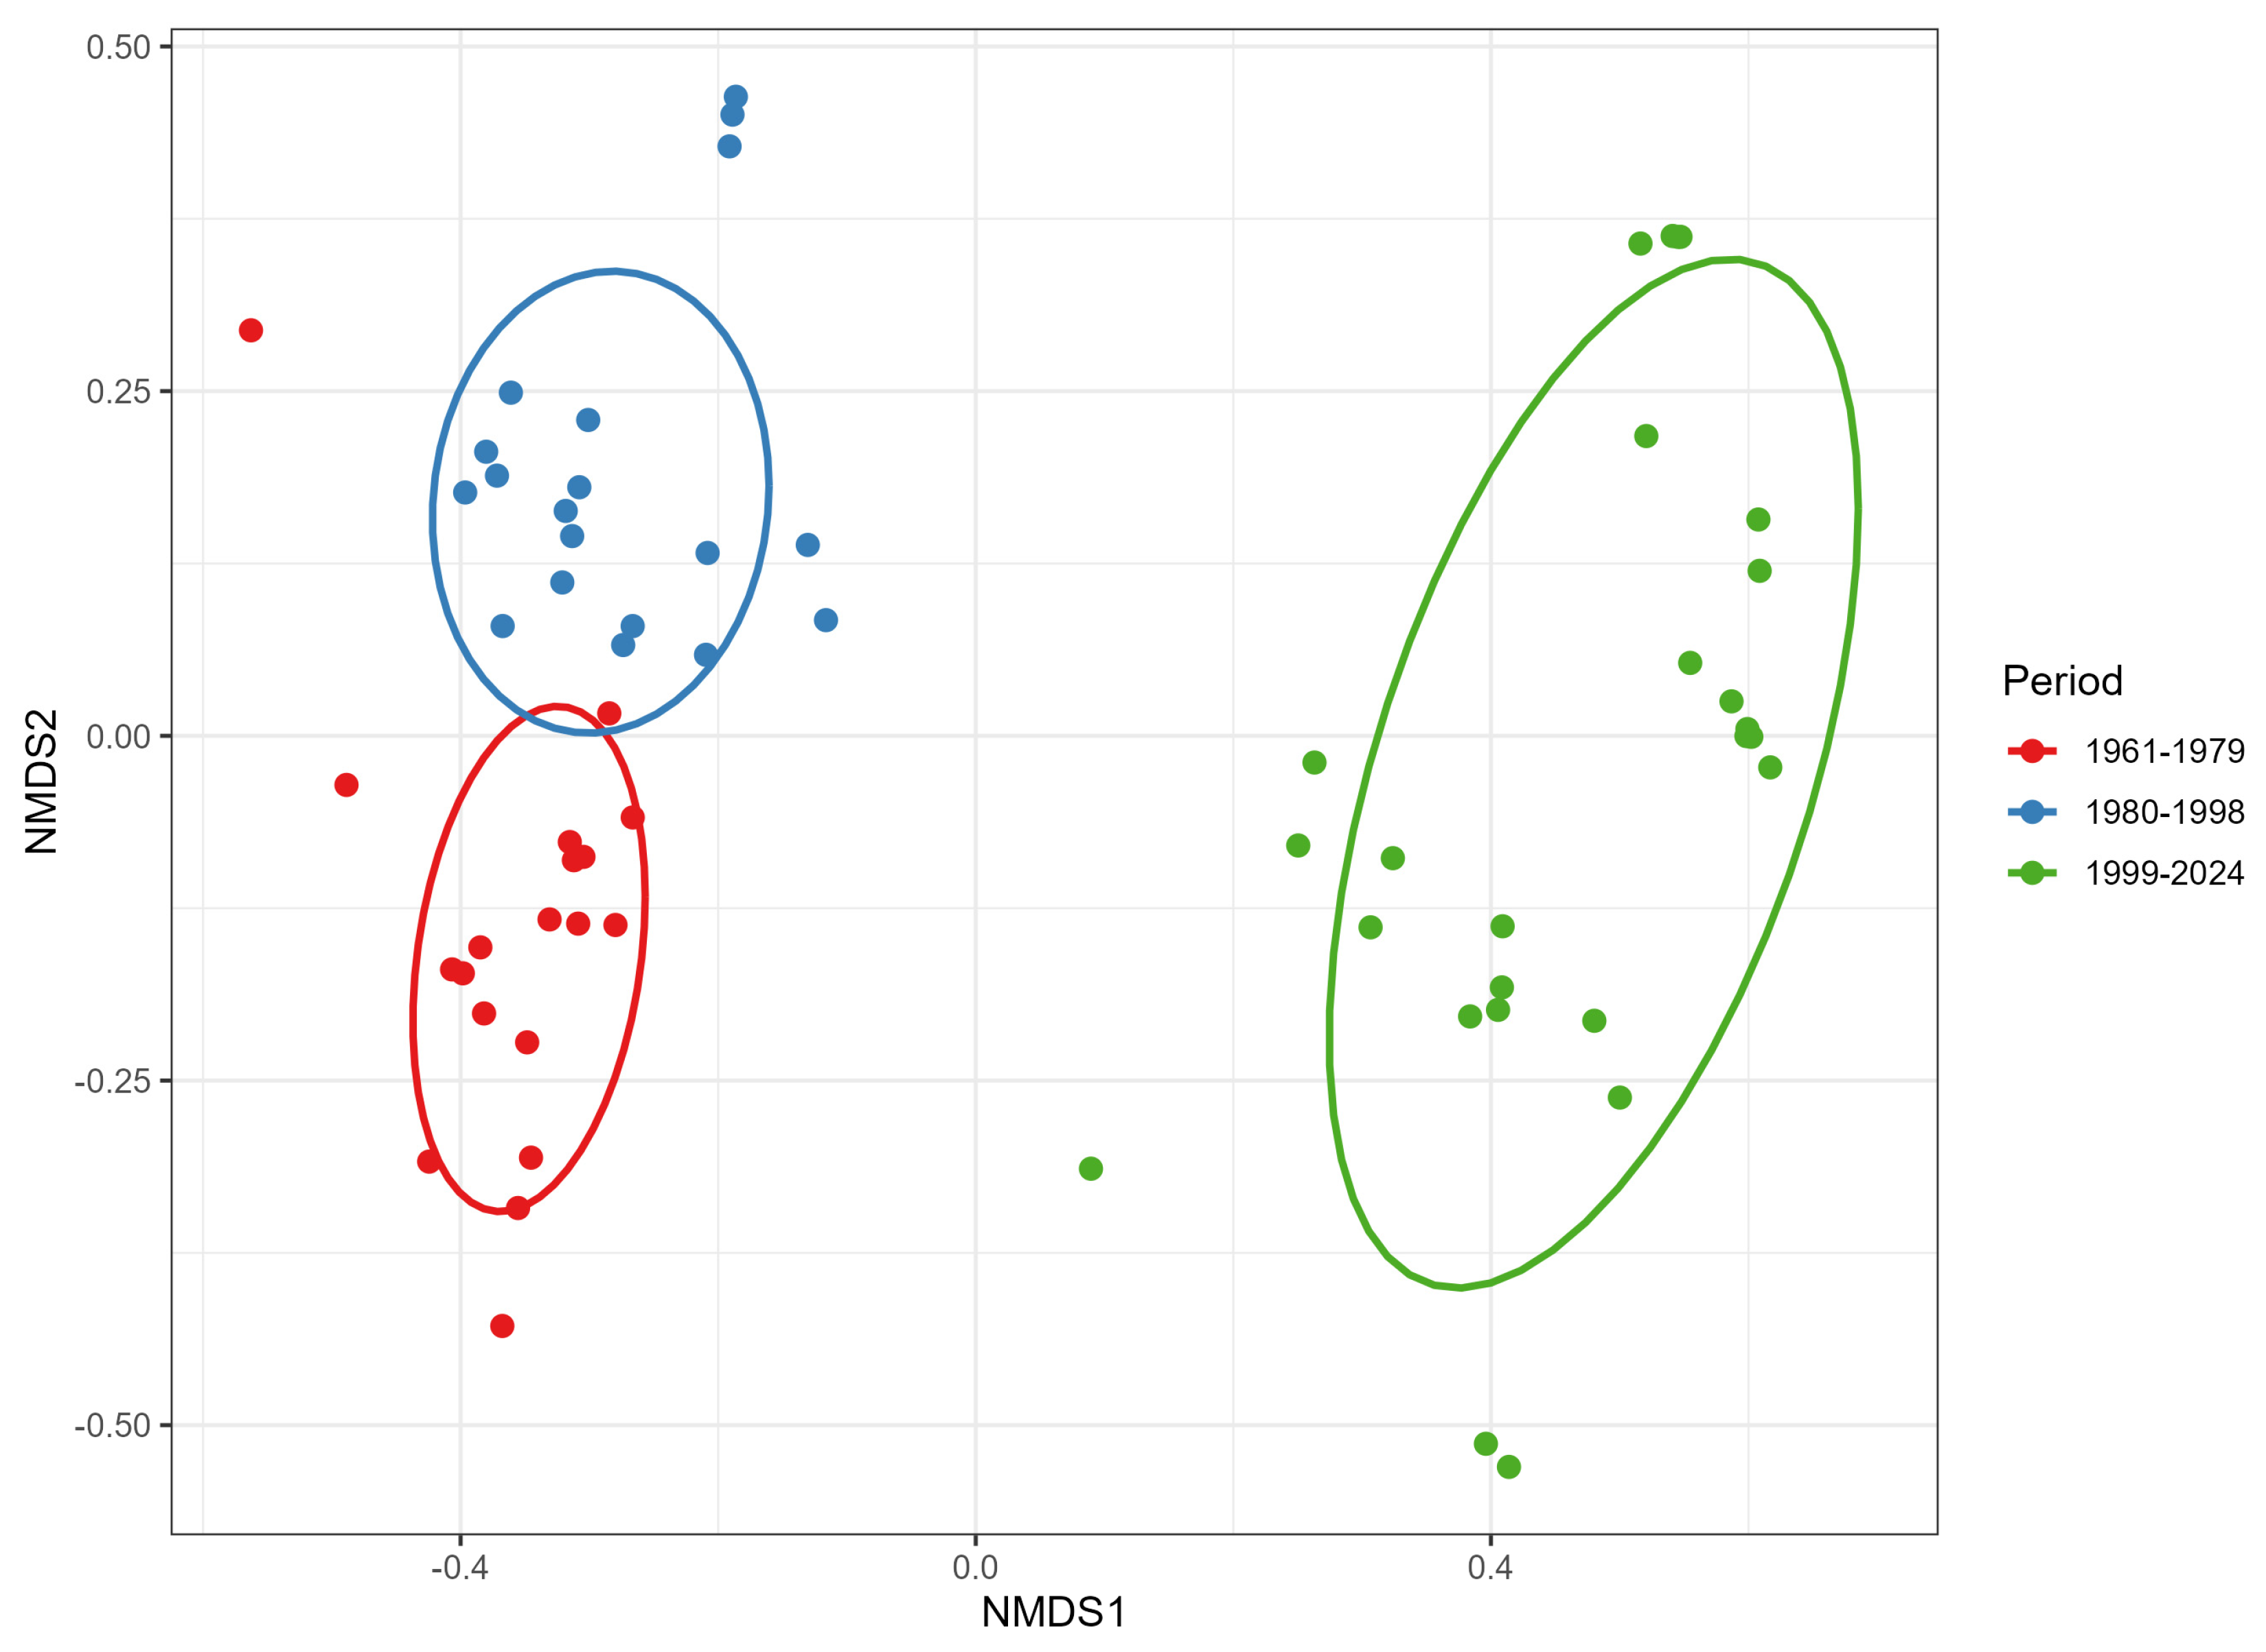

Disclaimer/Publisher’s Note: The statements, opinions and data contained in all publications are solely those of the individual author(s) and contributor(s) and not of MDPI and/or the editor(s). MDPI and/or the editor(s) disclaim responsibility for any injury to people or property resulting from any ideas, methods, instructions or products referred to in the content. |
© 2026 by the authors. Licensee MDPI, Basel, Switzerland. This article is an open access article distributed under the terms and conditions of the Creative Commons Attribution (CC BY) license.