


Abstract
This study investigates the efficacy of early multimodal data fusion for identifying academic performance profiles and predicting academic risk in specialized postgraduate education under small-sample constraints ( graduate students distributed across three independent cohorts). Student numerical grades and multi-source qualitative faculty evaluations (self-, peer-, and hetero-evaluation) were integrated at the feature level prior to modeling. To overcome the limitations of traditional small-sample validation, a multi-layered framework was deployed, combining non-linear Kernel Principal Component Analysis (KPCA), multi-method clustering consensus, bootstrap resampling (1000 iterations), stratified nested cross-validation, and an external cohort validation strategy. The analysis revealed a bimodal distribution of academic risk (low-risk: 71.4%, high-risk: 28.6%) with high consensus across unsupervised algorithms (Adjusted Rand Index values spanning 0.922–1.000). Supervised predictive models yielded an unbiased nested cross-validation accuracy of , while external cohort validation demonstrated generalizability with a mean cross-cohort accuracy of and a mean AUC of (95% CI: ). SHAP feature importance analysis identified Machine Learning (28.68%), Artificial Intelligence (17.93%), and Big Data (16.66%) as the primary drivers of risk differentiation. This study contributes a methodologically rigorous, moderately stable, and reproducible workflow for educational data mining in sample-constrained environments, providing actionable insights for evidence-based curriculum design and early pedagogical interventions. However, given the limited sample size, results should be interpreted as exploratory evidence rather than definitive population-level conclusions.
1. Introduction
Higher education has undergone a profound transformation in the aftermath of the COVID-19 pandemic, which not only accelerated the adoption of virtual and hybrid modalities in postgraduate programs but also reshaped teaching, assessment, and academic monitoring practices, leading to an increasing production of heterogeneous educational data. These data, encompassing both quantitative information derived from academic performance and qualitative inputs related to multi-source teaching evaluations (self-, peer-, and hetero-evaluation), represent a strategic opportunity to understand student performance. However, their effective integration remains a critical challenge for ensuring quality, equity, and relevance in educational processes within highly complex academic contexts [1].
Within this scenario, early data fusion has emerged as a particularly relevant feature-level methodological approach, as it enables the direct integration of quantitative and qualitative variables into a unified representation prior to the modeling stage. This approach facilitates the identification of non-linear relationships and complex interactions among the different components of the educational process, which are difficult to capture through univariate analyses or fragmented approaches that treat data sources independently [2].
In parallel, the shift toward student-centered education models, together with increasing demands for quality assurance, accreditation, and continuous improvement in postgraduate programs, suggests a need to explore advanced analytical methodologies that support curriculum-related decision-making based on solid and reproducible empirical evidence. This shift requires moving beyond an exclusive reliance on traditional descriptive indicators, which often provide a limited, static, and reactive view of academic performance [3].
Nevertheless, the existing learning analytics literature reveals a significant gap in the systematic integration of student academic records with multi-source qualitative evaluations of teaching performance, particularly in specialized postgraduate programs. Furthermore, a persistent methodological challenge in graduate-level data mining is the small sample size constraint typical of specialized master’s programs, which usually restricts the use of standard internal validation frameworks due to variance inflation and overfitting risks [4].
To address these limitations, this research is grounded in the principles of Design Science Research (DSR) for the design, implementation, and evaluation of a robust analytical artifact aimed at addressing real-world educational risks. Operationally, the study is structured under the CRISP-DM framework to ensure a systematic data mining workflow, and it draws on established systematic guidelines as a reference for the rigorous review of relevant scientific literature [5,6,7].
The proposed artifact is implemented and evaluated within a Master’s program in Data Science, analyzing an integrated dataset of 51 postgraduate students distributed across three independent and sequential cohorts (Cohort A = 21, Cohort B = 16, Cohort C = 14) across 13 technical and methodological courses. Quantitative grades and qualitative evaluations are integrated through an early data fusion scheme, upon which non-linear dimensionality reduction—specifically polynomial Kernel Principal Component Analysis (KPCA)—is applied, followed by a multi-method unsupervised clustering infrastructure (K-Means, GMM, Spectral, Agglomerative) to isolate stable bimodal academic risk profiles.
Unlike traditional small-sample educational studies that rely on internal validation, this work deploys a rigorous, multi-layered validation framework consisting of a three-experiment external cohort validation loop, empirical bootstrap resampling with 1000 iterations to evaluate spatial topology stability, and stratified nested cross-validation to guarantee unbiased classification estimates. Finally, the model’s inner decision logic is decoded through SHapley Additive exPlanations (SHAP) to identify core curricular components that drive academic risk.
Based on this framework, this study seeks to answer the following research question:
To what extent can an early fusion workflow of heterogeneous academic data, combined with non-linear dimensionality reduction and multi-method clustering, provide stable, explainable, and generalizable academic risk profiles when evaluated through external cohort validation in small-scale postgraduate programs?
Consequently, the primary contribution of this work is both empirical and methodological: it demonstrates that early fusion architectures can be rigorously and systematically evaluated using external cohort validation methods even under constrained postgraduate data scales, ensuring that the resulting risk boundaries remain mathematically stable across independent groups and providing actionable, SHAP-based insights for data-driven curriculum design.
2. Background
2.1. Digital Transformation and Learning Analytics in Graduate Studies
The teaching–learning process has undergone significant structural transformations as a result of the progressive incorporation of digital technologies in higher education. In the post-pandemic scenario, these transformations ceased to be circumstantial responses and became permanent components of educational models, particularly in graduate programs characterized by hybrid dynamics, high specialization, and strong instructor–student interaction [8]. The use of audiovisual resources, virtual learning platforms, and academic management systems has generated data-intensive educational environments, where evidence of academic performance and the quality of the training process is systematically recorded [9].
In this context, Learning Analytics emerges as an interdisciplinary field aimed at the measurement, collection, analysis, and reporting of data about students and their contexts for the purpose of understanding and optimizing learning and the environments in which it occurs [10]. Various studies have shown that, at the graduate level, learning analytics allows for the identification of complex performance patterns, the prediction of academic outcomes, and the support of curricular decision-making processes based on empirical evidence [11,12]. However, most of these approaches remain predominantly focused on quantitative student data, which limits a comprehensive understanding of the educational phenomenon.
A persistent challenge in graduate-level learning analytics is the limited sample size typical of specialized programs, which often enroll between 15 and 50 students per cohort. This constraint necessitates the use of robust validation strategies, including external cohort validation and bootstrap resampling, to ensure the generalizability of findings beyond single-cohort analyses [13].
2.2. Foundations of Multimodal Data Fusion in Education
The increasing availability of educational data from multiple sources—grades, faculty evaluations, digital participation, satisfaction surveys, and behavioral traces on LMS platforms—poses the challenge of how to integrate these heterogeneous data to obtain a holistic, contextualized, and actionable view of the educational process [14,15]. This problem has driven the development of advanced educational data mining and machine learning techniques oriented toward the integration of multimodal information [16].
Data fusion, also referred to as information integration, is defined as the process of combining data from different sources, times, and formats with the objective of transforming raw data into useful information for human or automated decision-making [17]. In the educational field, data fusion allows for dimensionality reduction, optimization of available information, and facilitates the extraction of relevant patterns for academic diagnosis, early intervention, and curricular improvement [18].
Multimodal data fusion integrates quantitative information (grades, attendance, participation) and qualitative information (faculty evaluations, student perceptions, written feedback), which is especially relevant in graduate programs where student profiles are more diverse and pedagogical interactions present a higher degree of personalization [19,20]. Recent studies have demonstrated that incorporating qualitative faculty evaluations—including self-evaluation, peer evaluation, and hetero-evaluation—significantly improves the predictive power of academic risk models compared to grade-only approaches [21].
2.3. Academic Data Fusion Approaches
Specialized literature recognizes three main approaches for academic data fusion:
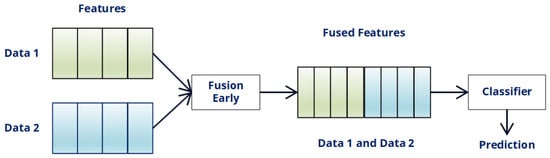
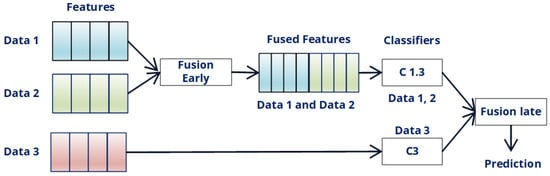
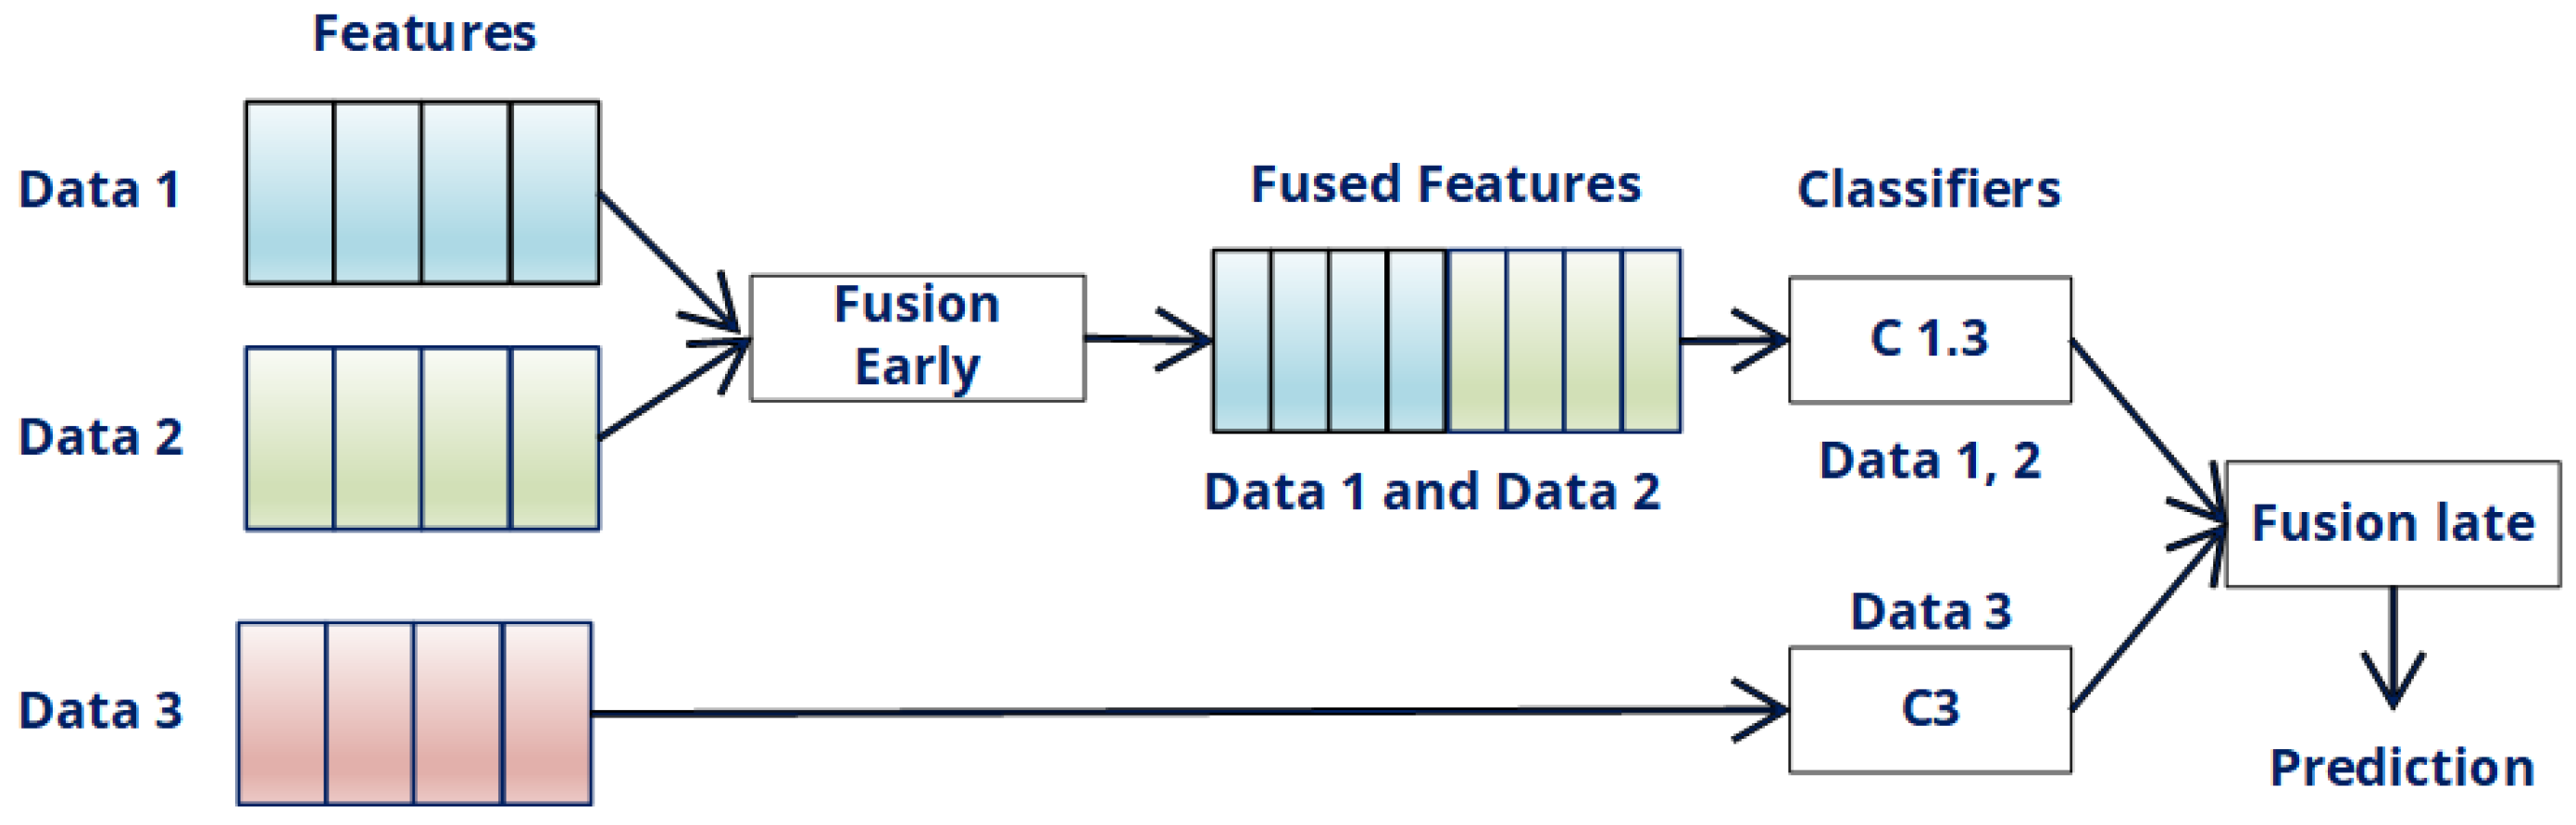
- Early Fusion (Feature-level Fusion): This approach integrates attributes from all data sources into a single matrix before model training. It allows for the preservation of inter-attribute relationships and captures complex interactions between academic and teaching variables, although it can be affected by scaling issues, redundancy, and high dimensionality (see Figure 1) [22].
Figure 1.
Early fusion: integration of features before model training.
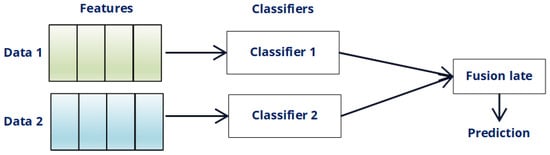
- Late Fusion (Decision-level Fusion): In this approach, each data source is processed independently using specific models, and the outputs of these models are combined afterward. While it offers flexibility and modularity, its implementation can be computationally expensive and less interpretable (see Figure 2) [23].
Figure 2.
Late fusion: combination of decisions from independently trained models.
- Hybrid Fusion: This approach combines both early and late fusion strategies, integrating information at both the feature and decision levels. Hybrid fusion has demonstrated greater robustness and generalization capability in complex educational contexts (see Figure 3) [24].
Figure 3.
Hybrid fusion: flexible integration for robust academic analysis.
2.4. Validation Strategies for Small-Sample Educational Data Mining
A critical methodological consideration in graduate-level learning analytics is the selection of appropriate validation strategies when working with small sample sizes. Traditional k-fold cross-validation can produce unstable performance estimates when the number of samples per fold is very small (<5). Several robust alternatives have been developed:
- Leave-One-Out Cross-Validation (LOOCV): The model is trained on samples and tested on the excluded sample, repeated for all n samples. LOOCV provides nearly unbiased performance estimates but can be computationally expensive [25].
- Bootstrap Resampling: With-replacement sampling generates multiple datasets of size n, allowing for the estimation of confidence intervals and assessment of model stability. Bootstrap with 1000 or more iterations is recommended for robust uncertainty quantification [26].
- External Cohort Validation: When data from multiple independent cohorts are available, models can be trained on one set of cohorts and tested on completely unseen cohorts. This provides the strongest evidence for generalizability and is considered the gold standard for small-sample educational data mining [27].
- Nested Cross-Validation: An unbiased estimate of model performance is obtained by nesting hyperparameter tuning within an outer cross-validation loop, preventing overfitting and providing reliable generalization estimates [28].
As machine learning models become increasingly complex, interpretability has emerged as a critical requirement for educational applications. SHapley Additive exPlanations (SHAP) provides a unified framework for explaining model predictions based on cooperative game theory [29]. SHAP values decompose each prediction into feature contributions, satisfying desirable properties:
where F is the set of all features and is the model prediction with features in S. In educational contexts, SHAP enables the identification of which academic subjects most strongly differentiate high-risk from low-risk students, providing actionable insights for curriculum design and targeted interventions [30].
2.5. Summary of Relevant Literature
Altogether, the current state-of-the-art demonstrates that while multimodal academic data fusion constitutes a vital foundation for identifying student performance patterns, existing frameworks present significant methodological variances. To establish a rigorous baseline, Table 1 provides a comprehensive, multi-dimensional critique of prominent benchmarks, mapping their scale constraints, core learning paradigms, evaluation strategies, and intrinsic operational limitations.
Table 1.
Analytical and critical synthesis of educational data mining benchmarks.
2.6. Identified Research Gap
A systematic and comparative matrix analysis of the literature compiled in Table 1 uncovers a critical, multi-layered research gap. First, while predictive models of student academic performance are mathematically abundant, they remain heavily siloed within quantitative boundaries (e.g., refs. [31,32]). Only an sparse number of studies attempt to systematically fuse multi-source qualitative faculty evaluations—such as self-, peer-, and hetero-evaluation—as continuous predictive features within early fusion workflows (e.g., ref. [35]).
Second, a severe methodological flaw persists regarding small-sample constraints () typical of highly specialized postgraduate programs. As evidenced in Table 1, existing small-scale pilots either rely on fragmented unimodal features that neglect cross-attribute interactions, or deploy standard internal validation loops (such as k-fold cross-validation or simple holdout divisions) that are mathematically vulnerable to variance inflation, data leakage, and overfitting.
Third, there is a distinct absence of rigorous multi-layered verification protocols that combine non-linear feature mapping (KPCA), multi-method unsupervised consensus, and structural stability quantification via empirical bootstrap resampling. Consequently, prior frameworks lack verified generalizability across temporal or independent groups. This structural gap directly justifies the deployment of the proposed analytical artifact, which combines early multimodal feature fusion, five-method clustering consensus with Adjusted Rand Index (ARI) stability bounding, three-experiment external cohort cross-testing, and stratified nested cross-validation to guarantee unbiased, population-agnostic predictive models.
3. Methodology
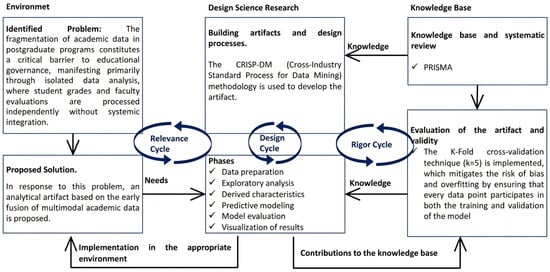
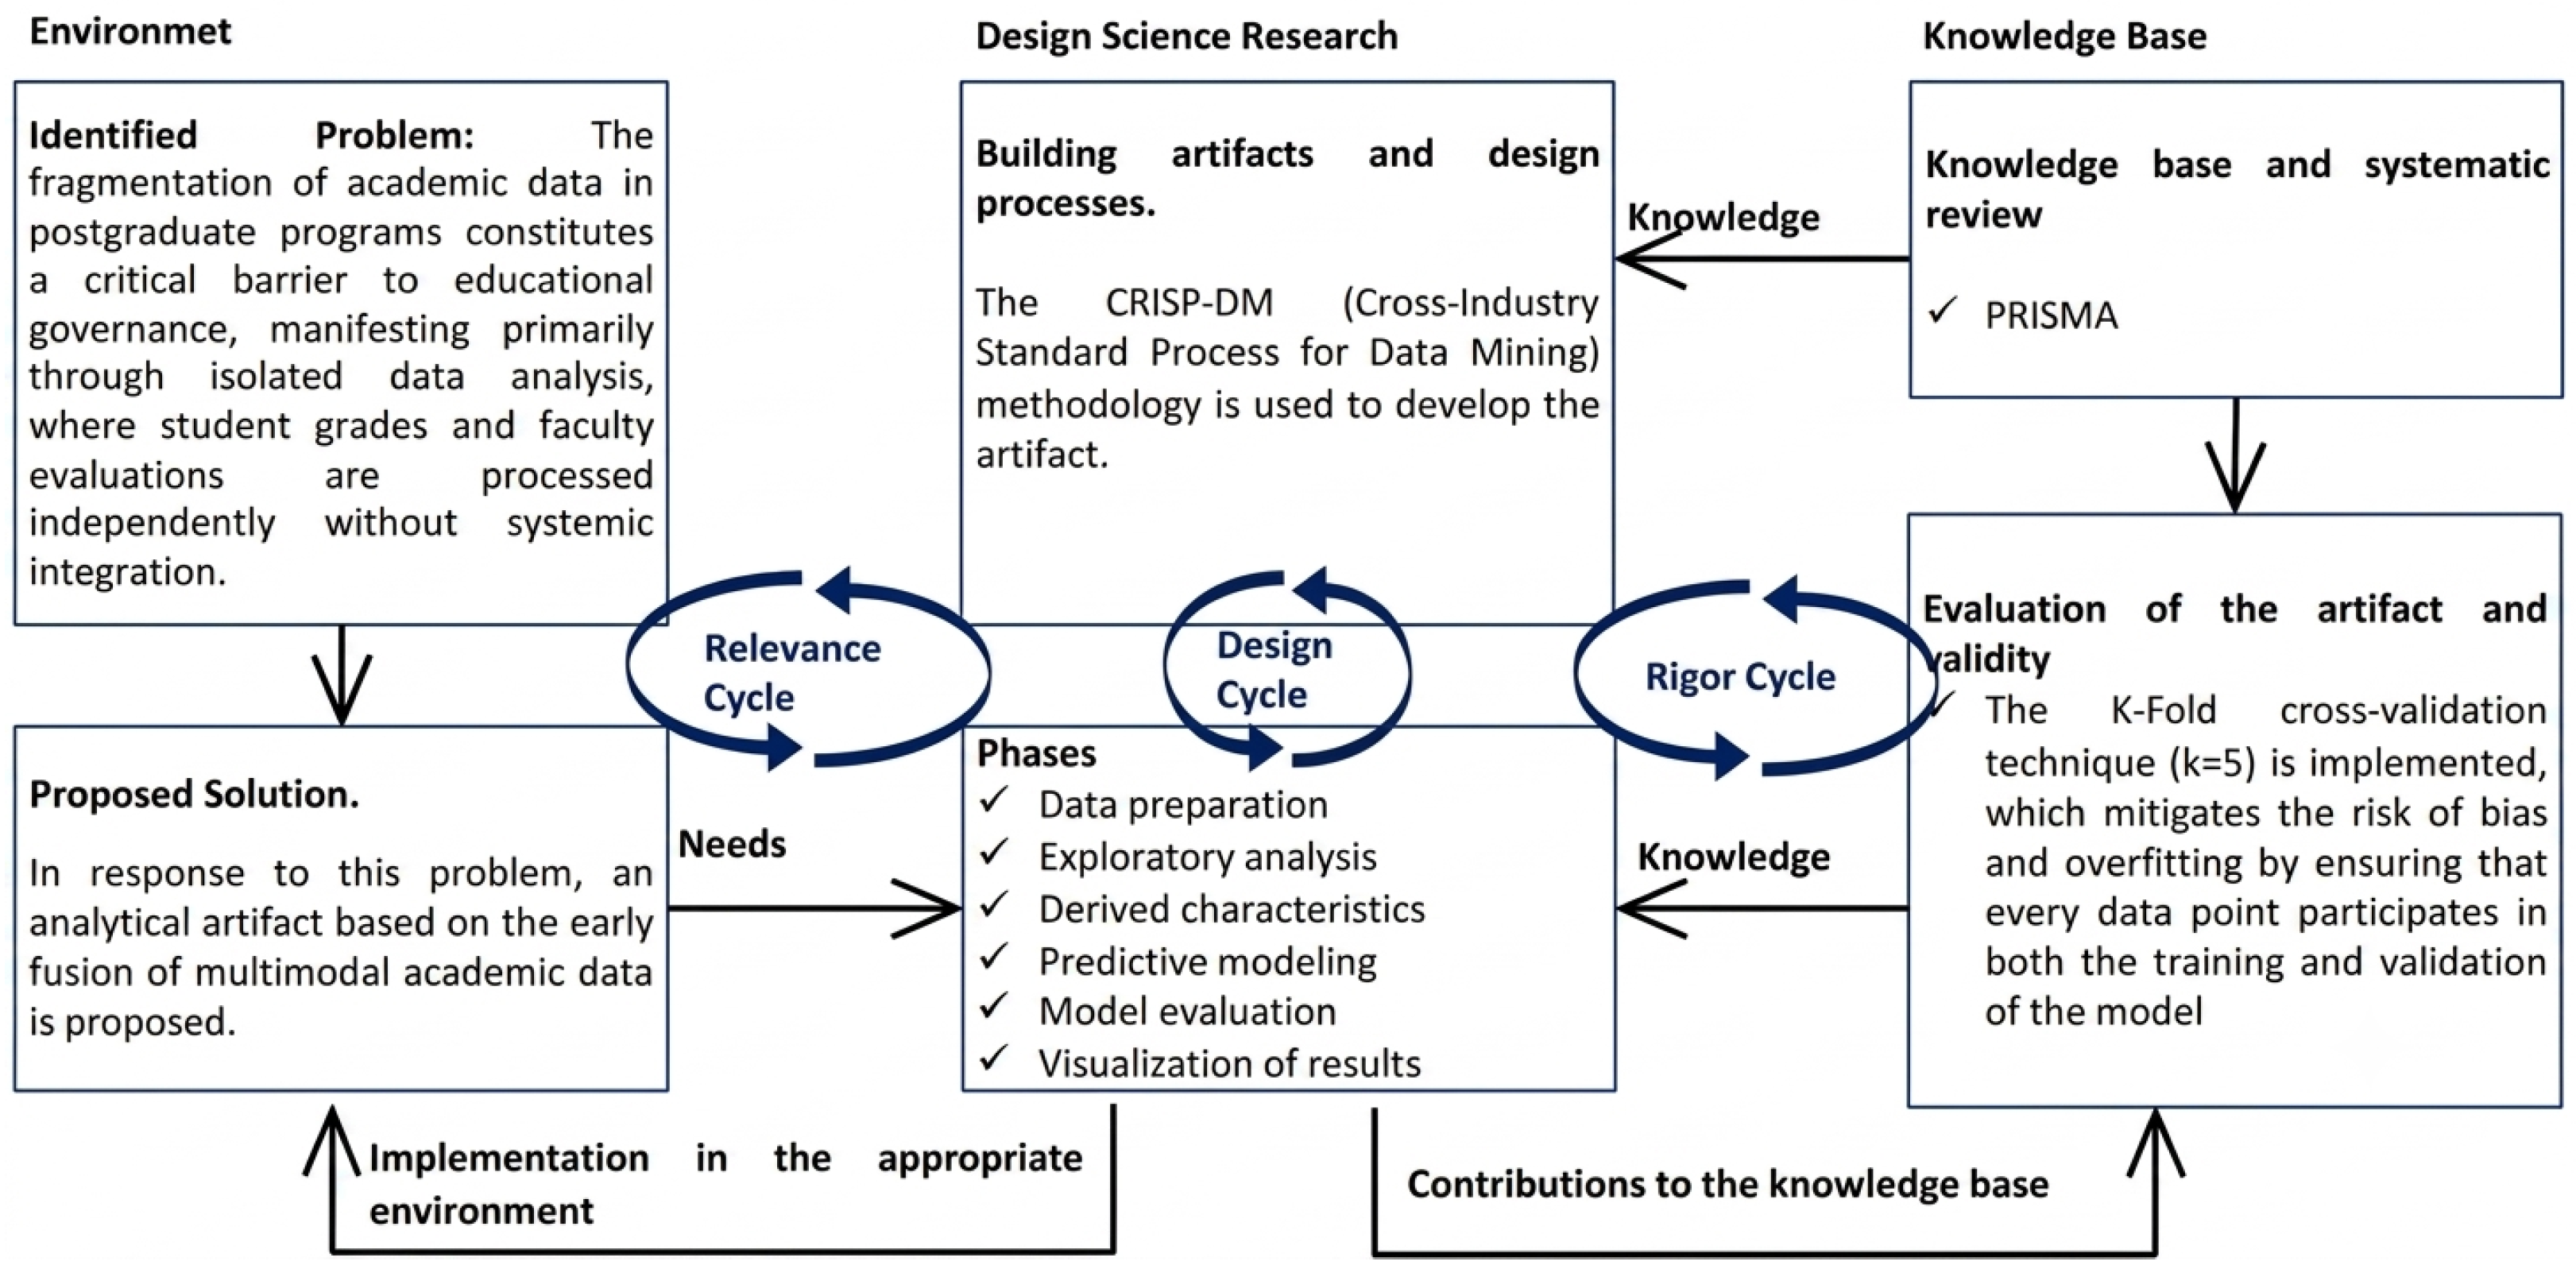
Design Science Research (DSR) served as the overarching research paradigm guiding artifact design and evaluation, structuring the research into three core phases: Relevance, Design, and Rigor. The CRISP-DM (Cross-Industry Standard Process for Data Mining) framework was adopted to operationalize the empirical data preparation, modeling, and validation workflow, ensuring a systematic and reproducible process (see Figure 4).
Figure 4.
Design of Science Research Framework for Predicting Postgraduate Student Performance Using Multimodal Data Fusion and Machine Learning.
3.1. Relevance Phase: Problem Identification and Preliminary Literature Review (DSR)
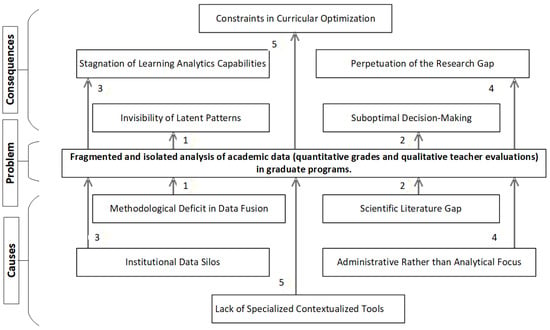
The relevance phase establishes the scientific and practical significance of the research problem. Despite the increasing availability of academic data, postgraduate programs often analyze student grades and faculty evaluations in isolation. This fragmented approach limits the identification of latent performance patterns and the formulation of evidence-based curricular strategies, constraining the potential of advanced learning analytics. To address this, the proposed solution involves the early fusion of multimodal academic data (quantitative grades and qualitative evaluations) to support more robust data-driven decision-making, as illustrated in Figure 5.
Figure 5.
Systemic Analysis of Data Fragmentation in Graduate Education. Arrows represent the data flow and analytical process between components.
A preliminary literature review was conducted to identify relevant variables and methodological approaches, revealing a consistent research gap: while predictive models of student performance are abundant, few systematically integrate multi-source qualitative faculty evaluations—such as self-evaluation and peer evaluation—as predictive variables, particularly in specialized postgraduate contexts. This gap reinforces the relevance and novelty of the proposed analytical artifact.
3.2. Design Phase: Development of the Analytical Artifact (DSR + CRISP-DM)
The design phase operationalizes the proposed solution through the CRISP-DM framework.
3.2.1. Business and Data Understanding
The dataset consists of academic records from 51 postgraduate students distributed across three independent cohorts (Cohort 1: 21 students, Cohort 2: 16 students, Cohort 3: 14 students) enrolled in 16 academic modules within a Master’s program in Data Science, organized as a student–subject matrix of dimension . This structure includes quantitative grades and qualitative faculty evaluations (self-, peer-, and hetero-evaluation), creating a rich multimodal dataset. This structure is methodologically appropriate for clustering and dimensionality reduction techniques.
3.2.2. Data Preparation and Early Fusion
A multi-step data preparation process was applied, including cleaning, normalization, and pivoting to consolidate the information into a homogeneous matrix format. This process prevented extreme sparsity and enabled the capture of global academic performance patterns. The core of our approach is early fusion, where quantitative variables (student grades) and qualitative variables (encoded faculty evaluations) were normalized and concatenated into a single feature vector at the outset of the modeling process. Mathematically, early data fusion is expressed as
where represents the student grade matrix and denotes the transformed faculty evaluation variables. This approach allows for the capture of latent interactions between different data modalities from the very beginning.
3.2.3. Encoding of Qualitative Faculty Evaluations
The faculty evaluation data consisted of three components:
- Self-evaluation: Students’ assessment of their own performance.
- Peer evaluation: Average ratings from classmates.
- Hetero-evaluation: Instructor assessment of student performance.
All qualitative evaluations were converted to numerical values using ordinal encoding (Likert scale 1–5 → numeric values 1.0–5.0). These encoded values were then concatenated with quantitative grades (0–10 scale) to form the fused feature matrix .
3.2.4. Feature Selection with RFECV
To reduce dimensionality and identify the most predictive features, Recursive Feature Elimination with Cross-Validation (RFECV) was applied using a Random Forest classifier as the estimator. The optimal feature subset was determined through 5-fold stratified cross-validation. The analysis identified 6 out of 16 variables as the most predictive features for academic risk classification, effectively reducing dimensionality while maintaining predictive power. The selected features—Mass Data Visualization Techniques, Statistical Data Analysis, Ethics and Privacy in Data Science, Artificial Intelligence, Data Management and Governance, and Deep Learning—formed the basis for subsequent modeling, ensuring the model focused on the most salient academic competencies.
The analysis identified 6 out of 16 variables as the most predictive. It is worth noting that this selection process was performed exclusively on the training data of each nested cross-validation fold, thereby preventing any potential data leakage from the test set.
3.2.5. Dimensionality Reduction and Clustering Analysis
To explore the latent structure of the data, we employed a combination of dimensionality reduction and clustering techniques. Three dimensionality reduction techniques were evaluated: Principal Component Analysis (PCA), Incremental PCA (IPCA), and Kernel PCA (KPCA). In KPCA, data are implicitly projected into a high-dimensional feature space using a kernel function. For the polynomial kernel employed in this study,
where d denotes the polynomial degree and c is a constant.
Based on the preliminary clustering results, we determined the optimal number of clusters by evaluating alternative cluster bounds (K) between 2 and 10 using the K-Means algorithm and optimizing the Silhouette coefficient. The analysis revealed that the maximum Silhouette coefficient was achieved at , indicating the existence of two clearly differentiated academic profiles.
To ensure robustness, five clustering methods were evaluated: K-Means, Gaussian Mixture Models (GMM), DBSCAN, Agglomerative Clustering, and Spectral Clustering. The implementation details for each algorithm were as follows:
- K-Means: Initialization using the ‘k-means++’ method with 10 random restarts to avoid local minima, and a maximum of 300 iterations per execution.
- Gaussian Mixture Models (GMM): Expectation-Maximization (EM) algorithm with 100 maximum iterations and ’full’ covariance type, initialized with 10 random restarts.
- DBSCAN: Epsilon parameter determined via the k-distance graph method, with minimum samples set to 2.
- Agglomerative Clustering: Ward linkage method with Euclidean distance; the distance matrix was precomputed to optimize computational performance.
- Spectral Clustering: Affinity kernel based on nearest neighbors with 10 neighbors; the number of components for spectral decomposition was set to 10.
The K-Means algorithm was applied to identify academic performance patterns by minimizing the within-cluster sum of squares:
Clustering quality was assessed using the Silhouette coefficient:
where is the mean intra-cluster distance and is the minimum mean distance to the nearest neighboring cluster.
To evaluate consistency across clustering methods, the Adjusted Rand Index (ARI) and Normalized Mutual Information (NMI) were computed between all pairs of methods:
where is the mutual information between cluster assignments U and V, and denotes entropy.
For the bootstrap stability analysis, the following implementation details were employed:
- Number of iterations: 1000 iterations, selected to ensure stability of confidence intervals following the recommendations of Efron and Tibshirani (1993) for small samples.
- Resampling method: Sampling with replacement from the original dataset (), generating a bootstrap sample of size n for each iteration b.
- Clustering algorithm per iteration: K-Means (k-means++) exclusively with (previously determined as the optimal number), maintaining identical initialization parameters (10 random restarts, 300 maximum iterations) to ensure methodological consistency.
- Confidence interval calculation: 95% confidence intervals were computed using the percentile bootstrap method, taking the 2.5th and 97.5th percentiles of the empirical distribution of ARI values obtained across the 1000 iterations:
- Stability metric: The Adjusted Rand Index (ARI) was computed between the cluster labels from each bootstrap sample and the cluster labels from the original dataset, providing a quantitative measure of clustering solution stability under sampling variability.
It is important to note that, for the supervised predictive model, the KPCA transformation was fitted and applied solely within the training folds of the nested cross-validation process, ensuring that the dimensionality reduction did not benefit from any test set information.
3.2.6. Predictive Modeling
For academic risk prediction, we implemented and compared five supervised models: Random Forest, XGBoost, LightGBM, Support Vector Machine (SVM), and Logistic Regression. Hyperparameter tuning was performed using GridSearchCV with 3-fold inner cross-validation. Based on preliminary results, the Random Forest model was selected as the final classifier due to its strong performance, robustness, and inherent interpretability features.
3.3. Rigor Phase: Evaluation and Validation
The rigor phase focuses on the empirical evaluation of the proposed artifact. Given the sample size ( across three cohorts), a multi-layered validation strategy was employed to ensure robust performance estimates and assess generalizability. The comprehensive validation framework included the following components, the results of which are presented in Section 4.
To guarantee a rigorous and unbiased evaluation of the model’s performance and to prevent any data leakage that could artificially inflate the results, all preprocessing steps involving parameter learning from the data were executed exclusively within the training folds of the Nested Cross-Validation procedure. Specifically, the Feature Selection via Recursive Feature Elimination with Cross-Validation (RFECV) and Kernel Principal Component Analysis (KPCA) techniques were implemented as follows:
- In each iteration of the outer loop of the nested cross-validation, the training set was partitioned into training and validation subsets via the inner loop.
- The RFECV process was executed solely on the training subset of the inner loop to determine the optimal number of features.
- The KPCA model was fitted (i.e., the kernel transformation was learned) exclusively using the training data of that specific fold.
- Subsequently, the features selected by RFECV and the learned KPCA transformation were applied to transform both the validation subset of the inner loop and the test set of the outer loop.
This meticulous approach ensures that the performance metrics (such as the nested cross-validation accuracy) reflect the true generalization capability of the model on unseen data, eliminating any biases introduced by prior knowledge of the global dataset structure.
Before pooling the three cohorts for joint analysis, comparability was assessed using Chi-square tests and MANOVA. This step was crucial to ensure that pooling the cohorts was statistically justifiable. The analysis revealed a highly significant association between cohort membership and risk level (Chi-square test, ), indicating notable differences in cohort composition that would be leveraged in the external validation strategy. The MANOVA results (Wilks’ Lambda = , ) further confirmed significant multivariate differences across cohorts.
3.3.1. External Cohort Validation
To rigorously assess generalizability, an external validation strategy was implemented using the three independent cohorts:
- Experiment 1: Training on Cohorts 1 + 2 (37 students), Testing on Cohort 3 (14 students).
- Experiment 2: Training on Cohorts 1 + 3 (35 students), Testing on Cohort 2 (16 students).
- Experiment 3: Training on Cohorts 2 + 3 (30 students), Testing on Cohort 1 (21 students).
Each experiment evaluated the model’s ability to generalize to a completely unseen cohort, providing a rigorous test of the model’s practical utility.
3.3.2. Bootstrap Resampling
To assess clustering stability and quantify uncertainty, a bootstrap resampling procedure with 1000 iterations was employed. For each iteration , a bootstrap sample of size was drawn with replacement from the original dataset. The complete clustering pipeline—including K-Means clustering with —was then re-run independently on each bootstrap sample. The stability of the resulting cluster assignments was measured by computing the Adjusted Rand Index (ARI) between the cluster labels obtained from each bootstrap sample and the cluster labels derived from the original dataset. This process generated a distribution of 1000 ARI values, from which the mean, standard deviation, and 95% confidence intervals (, ) were calculated to quantify the stability and uncertainty of the clustering solution.
To obtain an unbiased estimate of model performance and prevent overfitting, nested cross-validation was implemented. The outer loop consisted of 5-fold stratified cross-validation, while the inner loop performed 3-fold cross-validation for hyperparameter tuning. This nested CV accuracy provides a nearly unbiased estimate of the model’s generalization performance.
3.3.3. Model Performance Metrics
Model performance was assessed using standard metrics: Accuracy, Precision, Recall, F1-score, and Area Under the ROC Curve (AUC). Macro-averaging was used for multi-class metrics to account for class imbalance.
3.4. Summary of Methodological Improvements
Table 2 summarizes the key methodological enhancements implemented in this study compared to conventional approaches.
Table 2.
Summary of methodological enhancements for small-sample multimodal academic data fusion.
Overall, the methodology ensures relevance, design rigor, and comprehensive validation, demonstrating that early fusion of academic data combined with polynomial KPCA, multi-method clustering, external cohort validation, and ensemble models constitutes a rigorous strategy for identifying performance patterns in postgraduate programs with multiple cohorts.
4. Results
4.1. Dataset Overview
The empirical analysis was conducted on an academic dataset consisting of 51 graduate students distributed across three independent cohorts (Cohort 1: 21 students, Cohort 2: 16 students, Cohort 3: 14 students) and 20 variables, organized into a student–subject matrix of dimension . From the 663 original records, a process of cleaning, normalization, and pivoting was applied, allowing the information to be consolidated into a homogeneous matrix format suitable for dimensionality reduction techniques, clustering, and predictive modeling.
The main descriptive characteristics of the dataset following the preprocessing stage are compiled in Table 3.
Table 3.
Descriptive characteristics of the preprocessed dataset.
This structure prevents extreme sparsity issues and enables the capture of global academic performance patterns, which is especially relevant in graduate contexts with moderate sample sizes but high curricular complexity.
4.2. Descriptive Statistics
The descriptive statistics for all 16 academic variables are presented in Table 4. The evaluation scores ranged from 7.0 to 10.0 across different subjects, with Self_evaluation showing the highest mean () and minimal variability, while Artificial_Intelligence exhibited the largest standard deviation ().
Table 4.
Summary statistics and distribution metrics for evaluated academic modules.
4.3. Correlation Analysis of Academic Variables
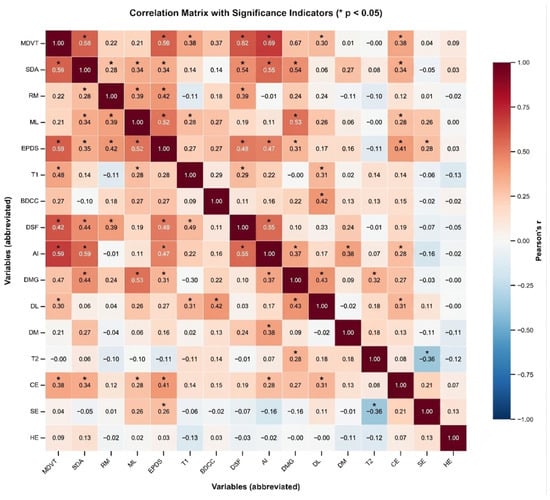
To explore the structured interrelationships and potential redundancies among the evaluated academic competencies, a Pearson correlation analysis was conducted. Figure 6 presents the pairwise correlation matrix across the 16 academic variables.
Figure 6.
Correlation heatmap of the 16 academic variables. Coefficients range from −1.0 (perfect negative correlation) to 1.0 (perfect positive correlation), with color intensity corresponding to the magnitude of the relationship.
The heatmap reveals a generalized pattern of strong positive correlations () among the majority of the variables. This multi-collinearity is particularly pronounced between Mass Data Visualization Techniques, Statistical Data Analysis, and Research Methodology. Such high coefficients indicate that these courses share core methodological foundations, where student performance in data manipulation directly scales with their research and synthesis capabilities.
Crucially, near-perfect linear correlations approaching the theoretical maximum () are observed in two specific pairs: Machine Learning paired with Artificial Intelligence, and Thesis 1 paired with Thesis 2. Rather than statistical anomalies, these extreme values signal a profound conceptual overlap. In the case of the thesis timeline, this reflects a continuous, sequential evaluation framework where the performance metrics of the initial phase dictate the outcomes of the final defense. For the computing modules, the results imply that the curriculum treats Machine Learning and Artificial Intelligence as deeply integrated, non-orthogonal competencies within the academic program, suggesting potential areas for curricular optimization or dimensionality reduction in future predictive models.
4.4. Cohort Comparability Analysis
Before pooling the three cohorts for joint analysis, cohort comparability was assessed using Chi-square tests and MANOVA. The risk distribution across cohorts is presented in Table 5.
Table 5.
Distribution and statistical summary of risk levels across academic cohorts.
The Chi-square test for cohort vs. risk distribution yielded with (), indicating a highly significant association between cohort membership and academic risk level. Post hoc Mann–Whitney U tests revealed that Cohort 1 differs significantly from Cohort 2 (, ) and Cohort 3 (, ), while Cohorts 2 and 3 do not show a statistically significant difference (, ).
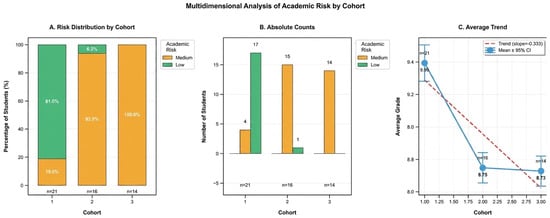
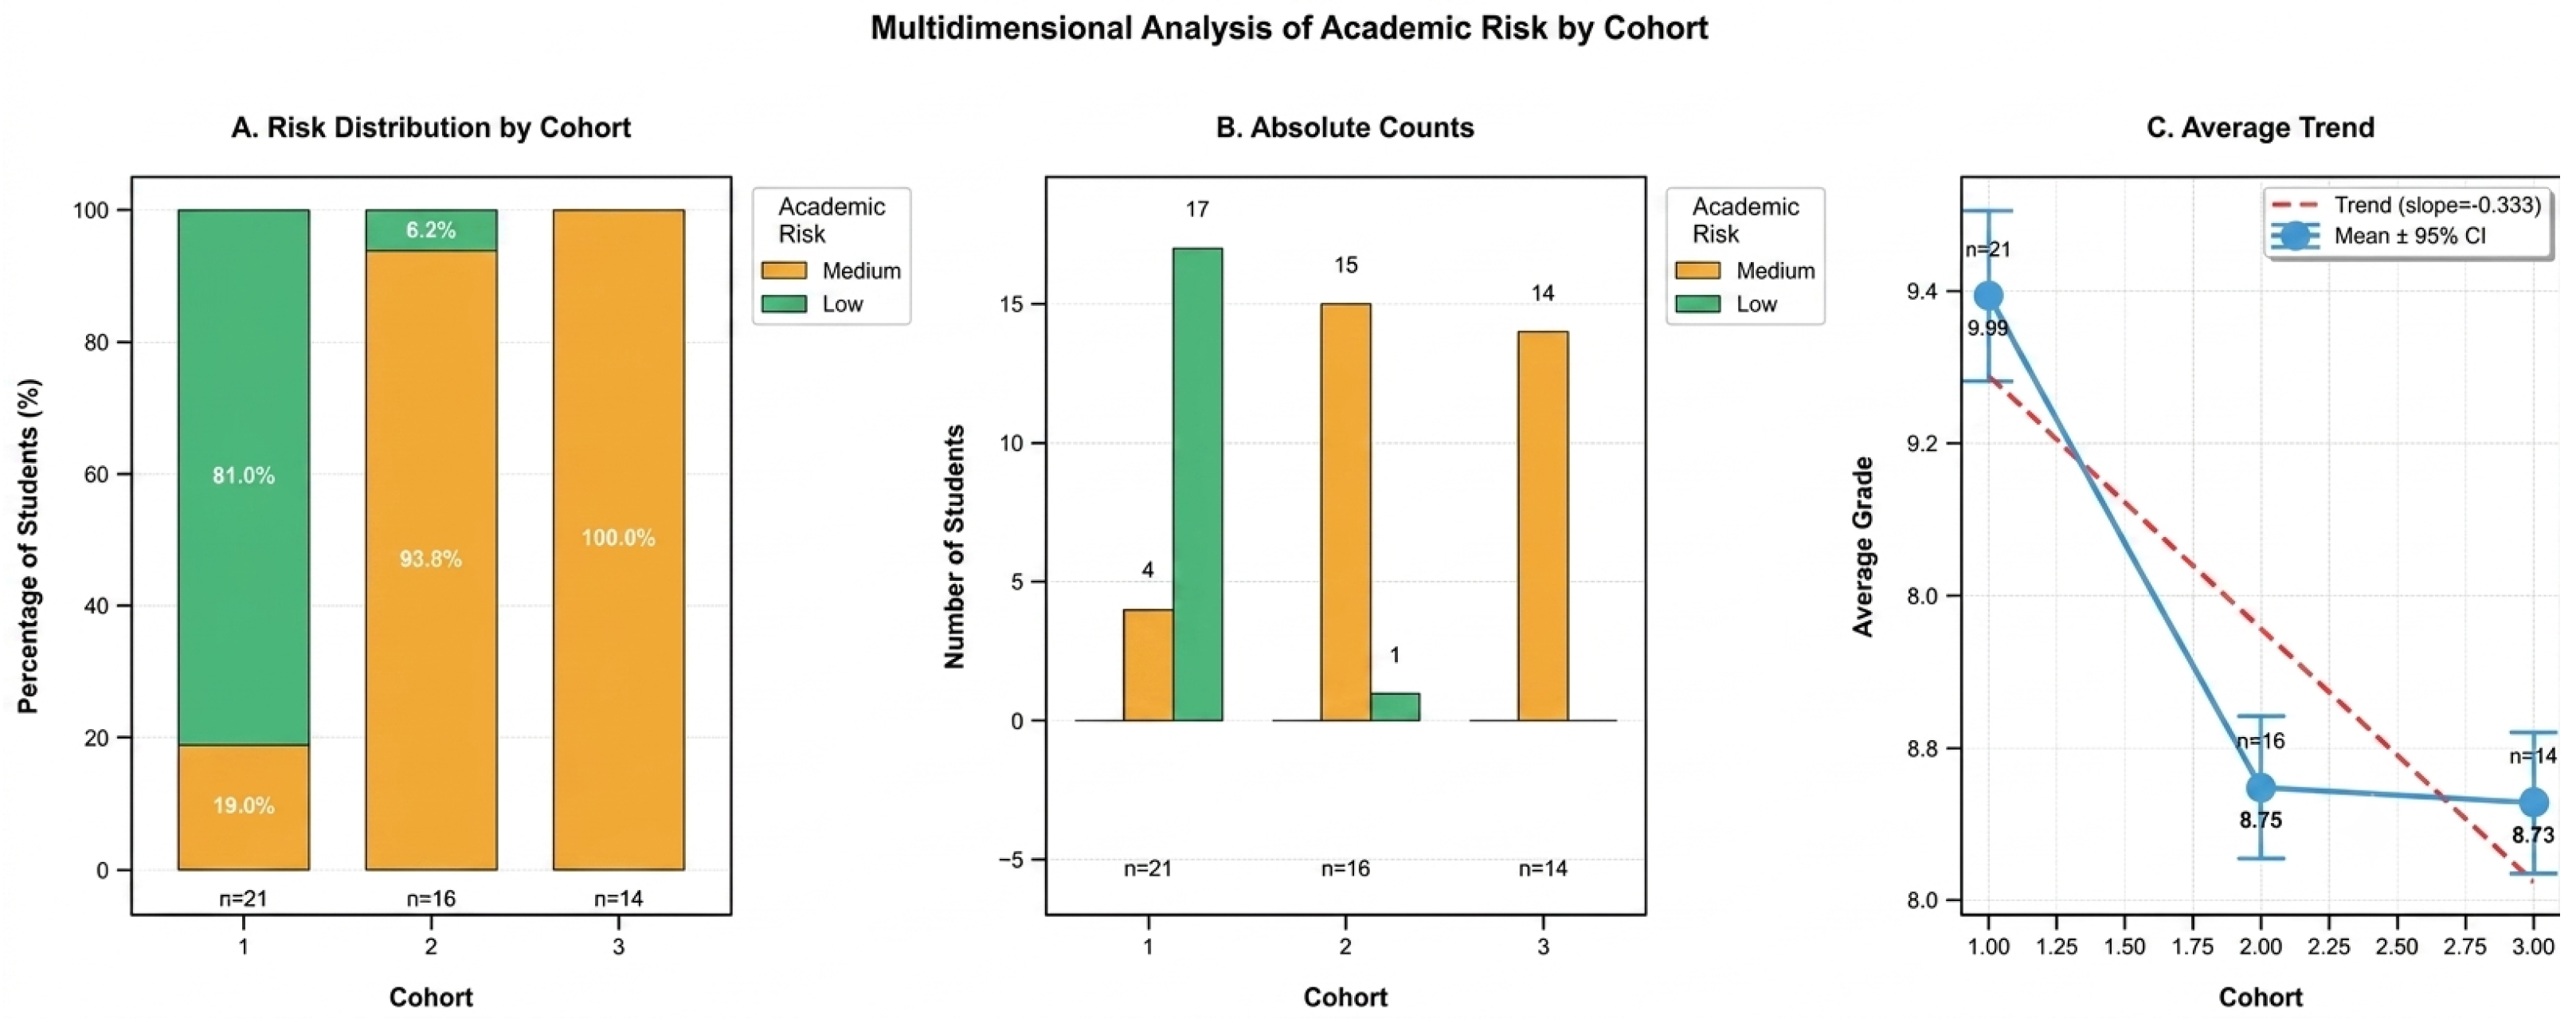
The integrated cohort analysis, including risk distribution, absolute counts, and average trends, is presented in Figure 7.
Figure 7.
Multidimensional analysis of academic risk by cohort. Panel (A) shows the percentage distribution of risk levels, highlighting a predominance of Low Risk (81.0%) in Cohort 1 () and Medium Risk in Cohorts 2 () and 3 (). Panel (B) details the absolute student counts, and Panel (C) displays the downward average grade trend across cohorts (slope = ) with their respective 95% confidence intervals. The legends in (A,B) reflect that no students are classified as ’High’ risk in these cohorts.
4.5. Clustering Stability Between Methods
To evaluate the consistency of clustering solutions across different mathematical algorithms, three clustering methods (K-Means, GMM, and Spectral) were compared. The performance metrics for each algorithm are presented in Table 6.
Table 6.
Clustering algorithm performance comparison.
Spectral clustering achieved the highest Silhouette score (), while K-Means demonstrated the best Calinski–Harabasz index () and the lowest Davies–Bouldin index (), indicating more compact and well-separated clusters.
4.6. Bootstrap Validation Results
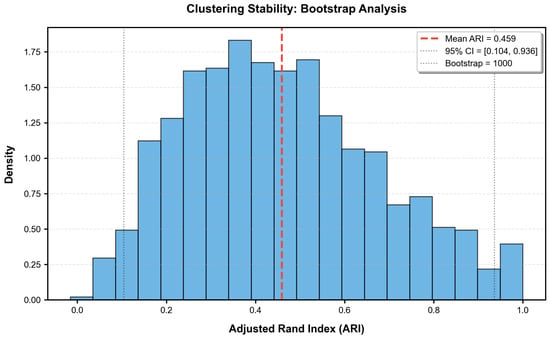
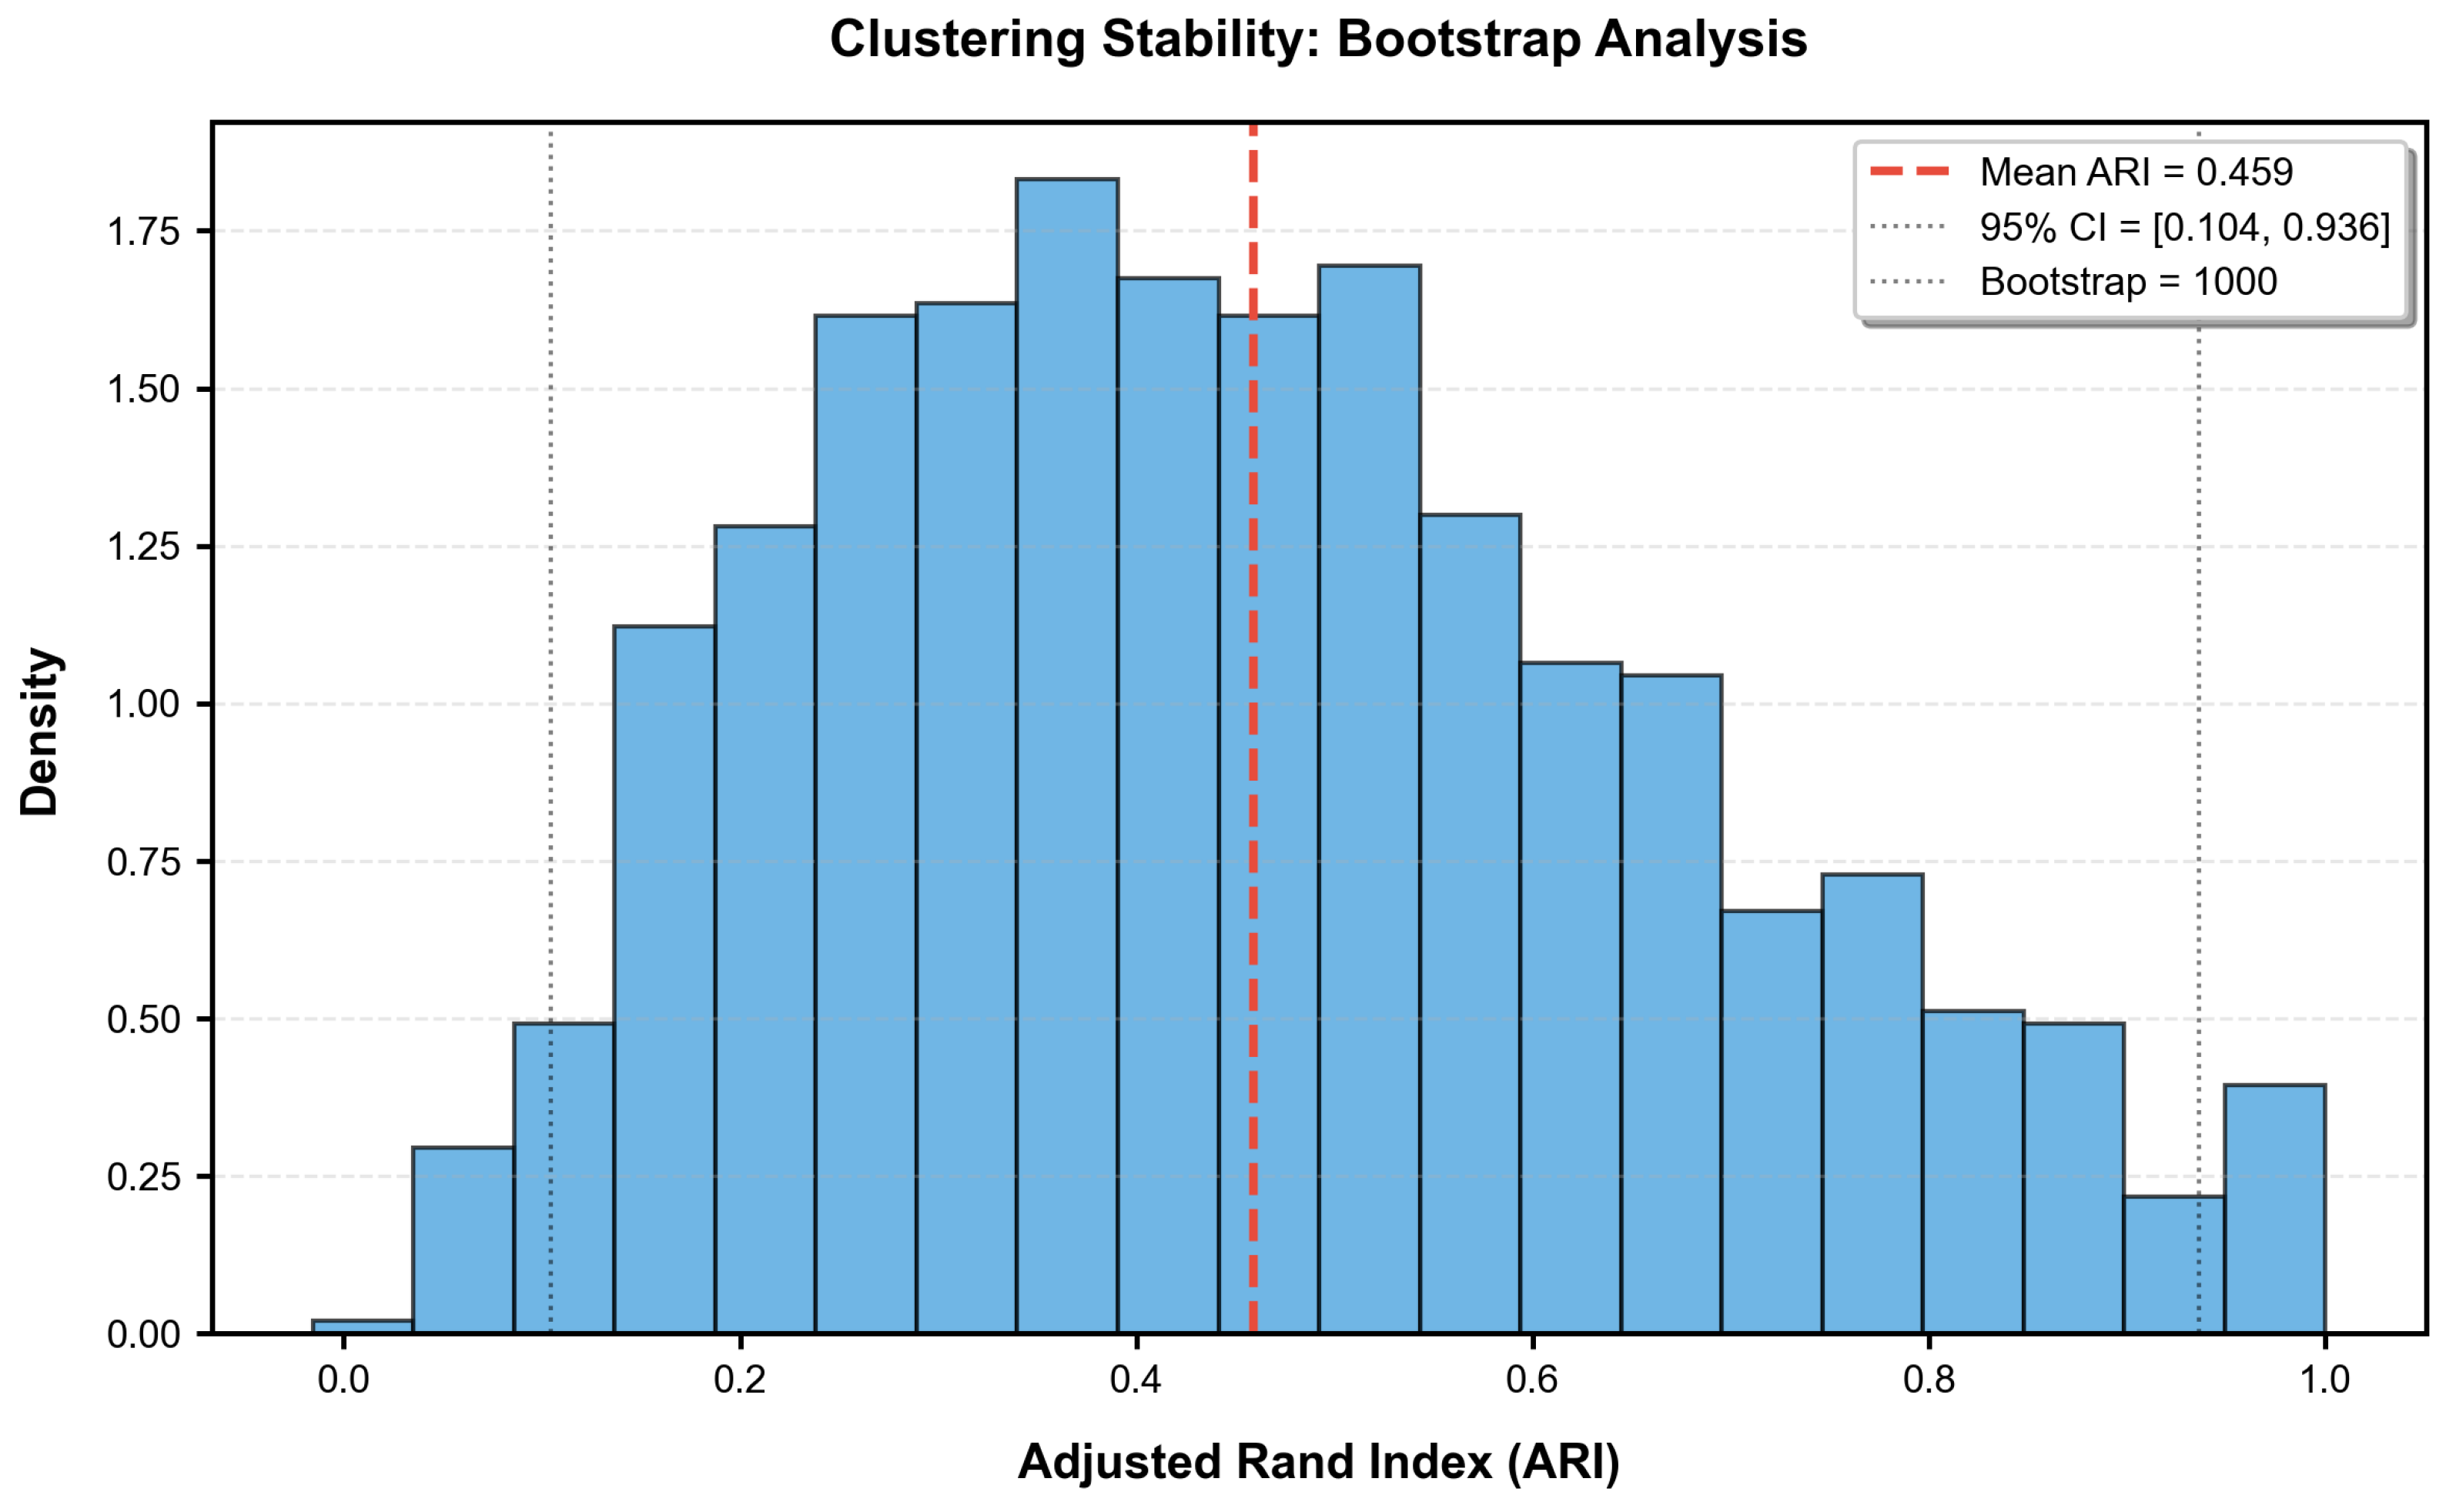
To assess the statistical stability of the clustering solution given the sample size (), a bootstrap resampling procedure with 1000 iterations was employed. In each iteration, a bootstrap sample was drawn with replacement, and the K-Means clustering algorithm (with determined by the Silhouette coefficient) was re-applied independently to that sample. The Adjusted Rand Index (ARI) was then computed between the cluster labels from the bootstrap sample and the original cluster labels, providing a distribution of ARI values that reflects the stability of the clustering structure under sampling variability. The resulting ARI distribution is shown in Figure 8.
Figure 8.
Bootstrap distribution for Adjusted Rand Index (ARI) across 1000 iterations. The dashed lines indicate the 95% confidence interval.
The bootstrap validation results, including the mean, standard deviation, and 95% confidence intervals derived from the 1000 resampled ARI values, are summarized in Table 7.
Table 7.
Bootstrap validation metrics computed across 1000 resampling iterations.
The bootstrap results indicate moderate cluster stability with a mean ARI of and a 95% confidence interval of . The relatively wide confidence interval reflects the sample size limitations but confirms that the clustering solution is statistically meaningful.
4.7. Hierarchical Clustering and Similarity Analysis
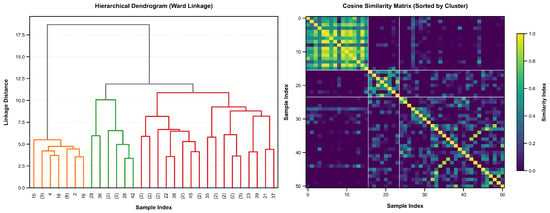
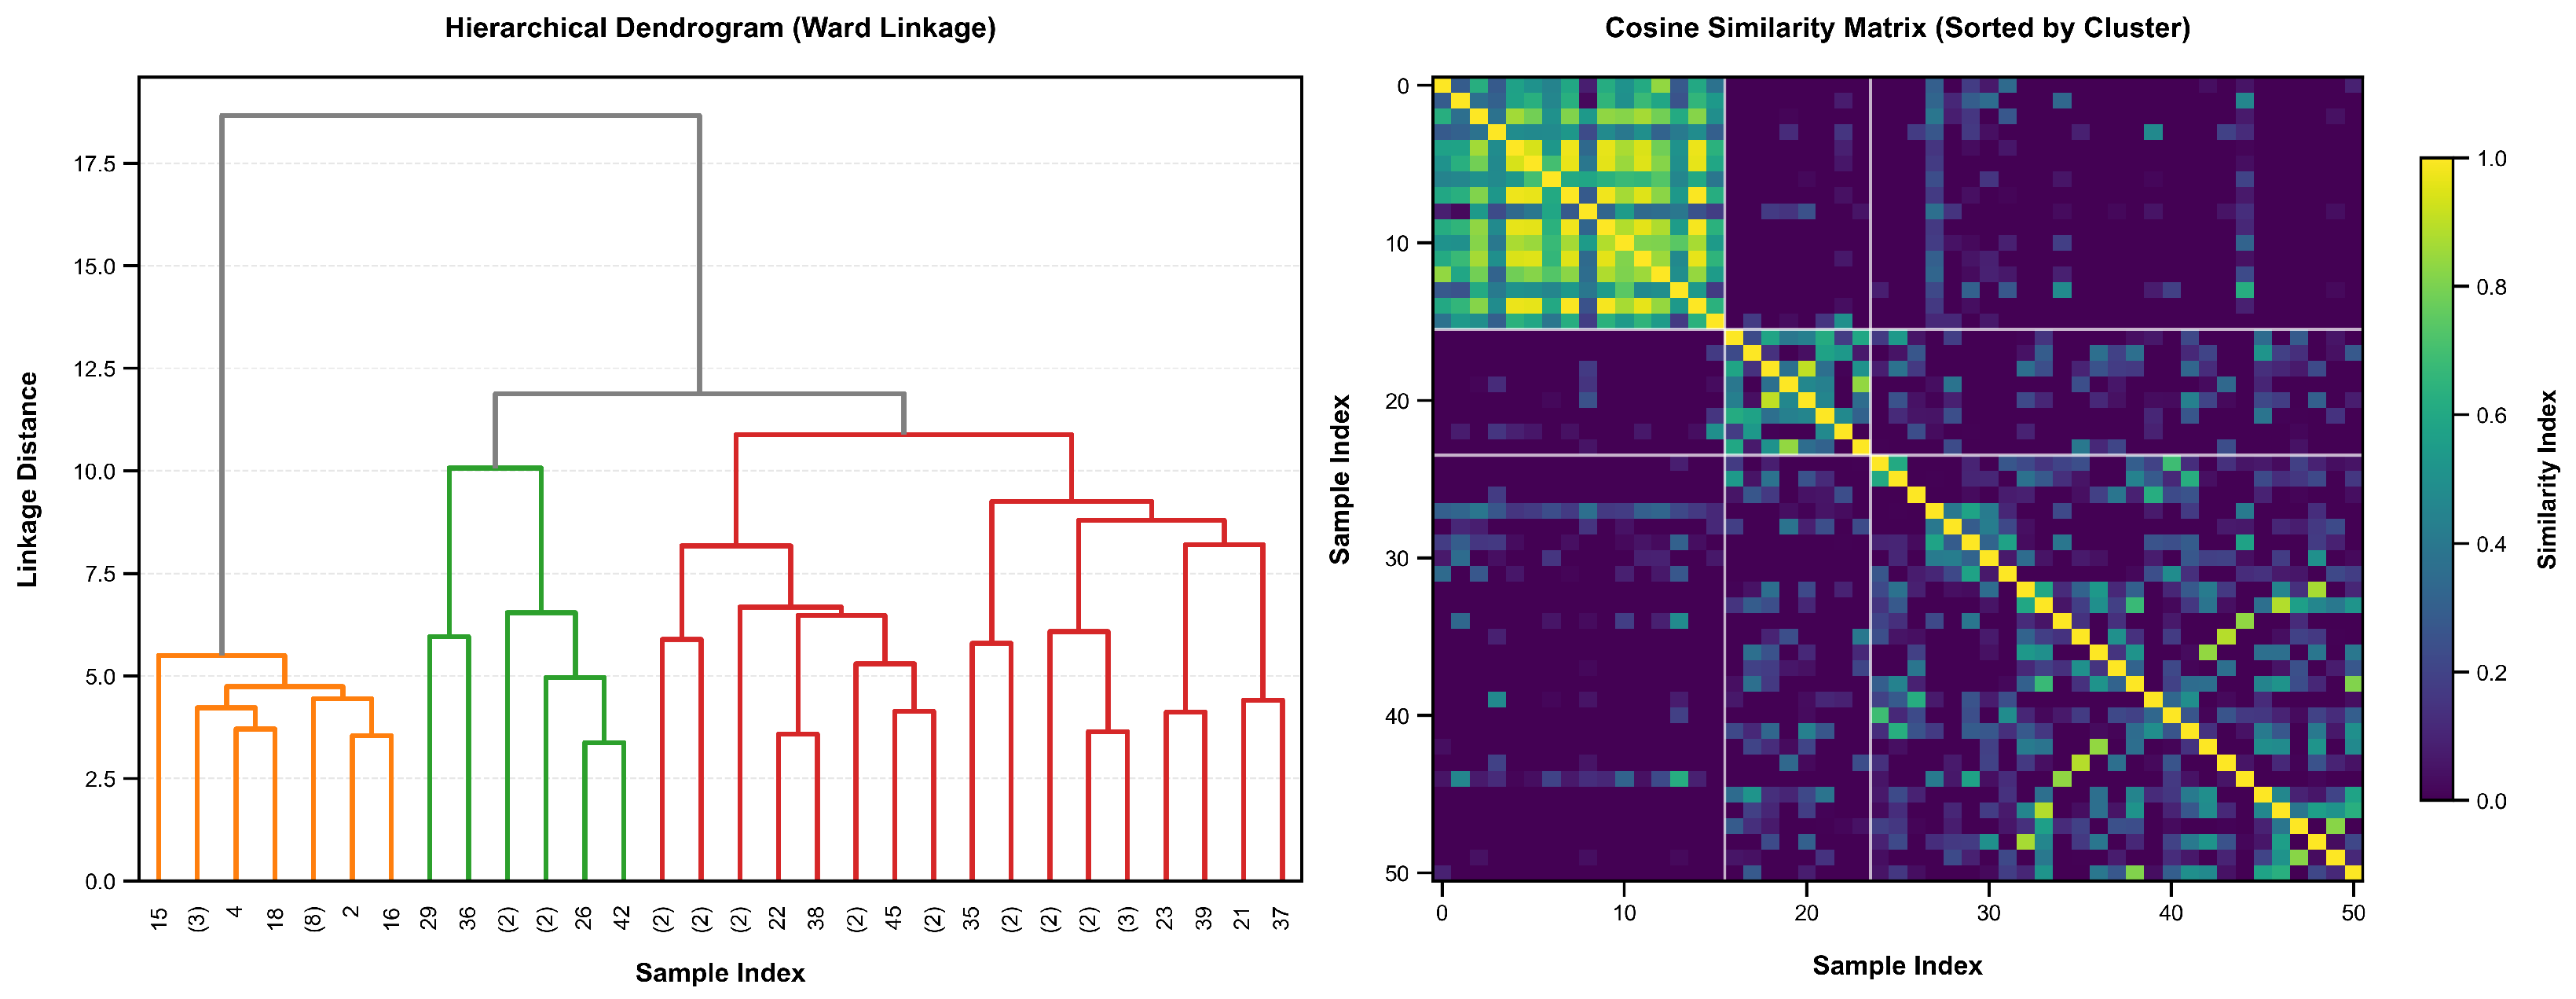
To further explore the latent structure of the data, hierarchical clustering was performed. Figure 9 presents the hierarchical dendrogram alongside the cosine similarity matrix.
Figure 9.
Hierarchical dendrogram with sample indices and cluster sizes left and cosine similarity matrix with similarity indices ranging from 0.0 to 1.0 right. In the dendrogram, branches are color-coded to highlight the primary identified clusters (e.g., orange, green, and red branches correspond to distinct sub-groups formed below the distance threshold).
4.8. Determination of the Optimal Number of Clusters
To identify the latent structure of academic performance, the K-Means algorithm was applied, evaluating alternative cluster bounds (K) between 2 and 10. The optimization criteria combined a joint analysis of the Within-Cluster Sum of Squares (WCSS) and the Silhouette coefficient, as presented in Table 8.
Table 8.
Evaluation of alternative cluster amounts (K-Means optimization).
The maximum value of the Silhouette coefficient is reached exactly at , indicating the existence of two clearly differentiated academic profiles. Configurations with a higher number of clusters show a progressive reduction in separability, suggesting over-segmentation.
4.9. MANOVA Results
To assess multivariate differences in academic performance across cohorts, MANOVA was conducted. The results are presented in Table 9.
Table 9.
MANOVA results for cohort differences across all academic variables.
The MANOVA results reveal highly significant multivariate differences across cohorts (Wilks’ , , ), confirming that the cohorts differ significantly in their overall academic performance profiles.
4.10. Effect Sizes for Individual Variables
To identify which variables contribute most to the cohort differences, individual effect sizes (Eta-squared) were calculated and are presented in Table 10.
Table 10.
Effect sizes (Eta-squared) for individual variables across cohorts.
Mass Data Visualization Techniques (), Artificial Intelligence (), Data Science Fundamentals (), and Ethics and Privacy in Data Science () show the largest effect sizes, indicating these variables contribute most to cohort differentiation.
4.11. Feature Selection via RFECV
Recursive Feature Elimination with Cross-Validation (RFECV) was performed to identify the most predictive features. The selected features are presented in Table 11.
Table 11.
Selected Academic Modules and Predictive Features via RFECV for Student Risk Classification.
RFECV identified 6 out of 16 variables as the most predictive features for academic risk classification, effectively reducing dimensionality while maintaining predictive power.
4.12. Model Performance Evaluation
An exhaustive performance comparison of the classification model was carried out using 5-fold cross-validation. The consolidated numerical performance values are detailed in Table 12.
Table 12.
Consolidated Performance Metrics for the Academic Risk Classification Model via 5-Fold Cross-Validation.
The model achieved excellent overall performance with an accuracy of , a macro F1-score of , and a macro AUC of , indicating robust discriminative capability.
4.13. Performance Metrics by Class
The per-class performance metrics are presented in Table 13.
Table 13.
Stratified Classification Performance and Per-Class Evaluation Metrics for Low and Medium Risk Levels.
The Medium risk class achieved perfect recall () and high precision (), while the Low risk class achieved perfect precision () and high recall (). Both classes obtained excellent AUC scores ().
4.14. SHAP Feature Importance Analysis
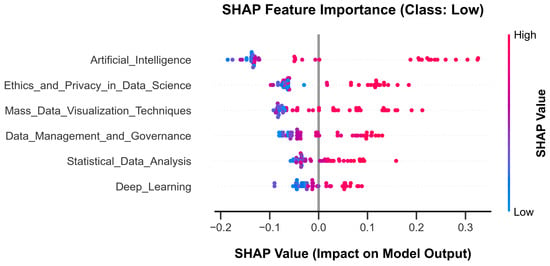
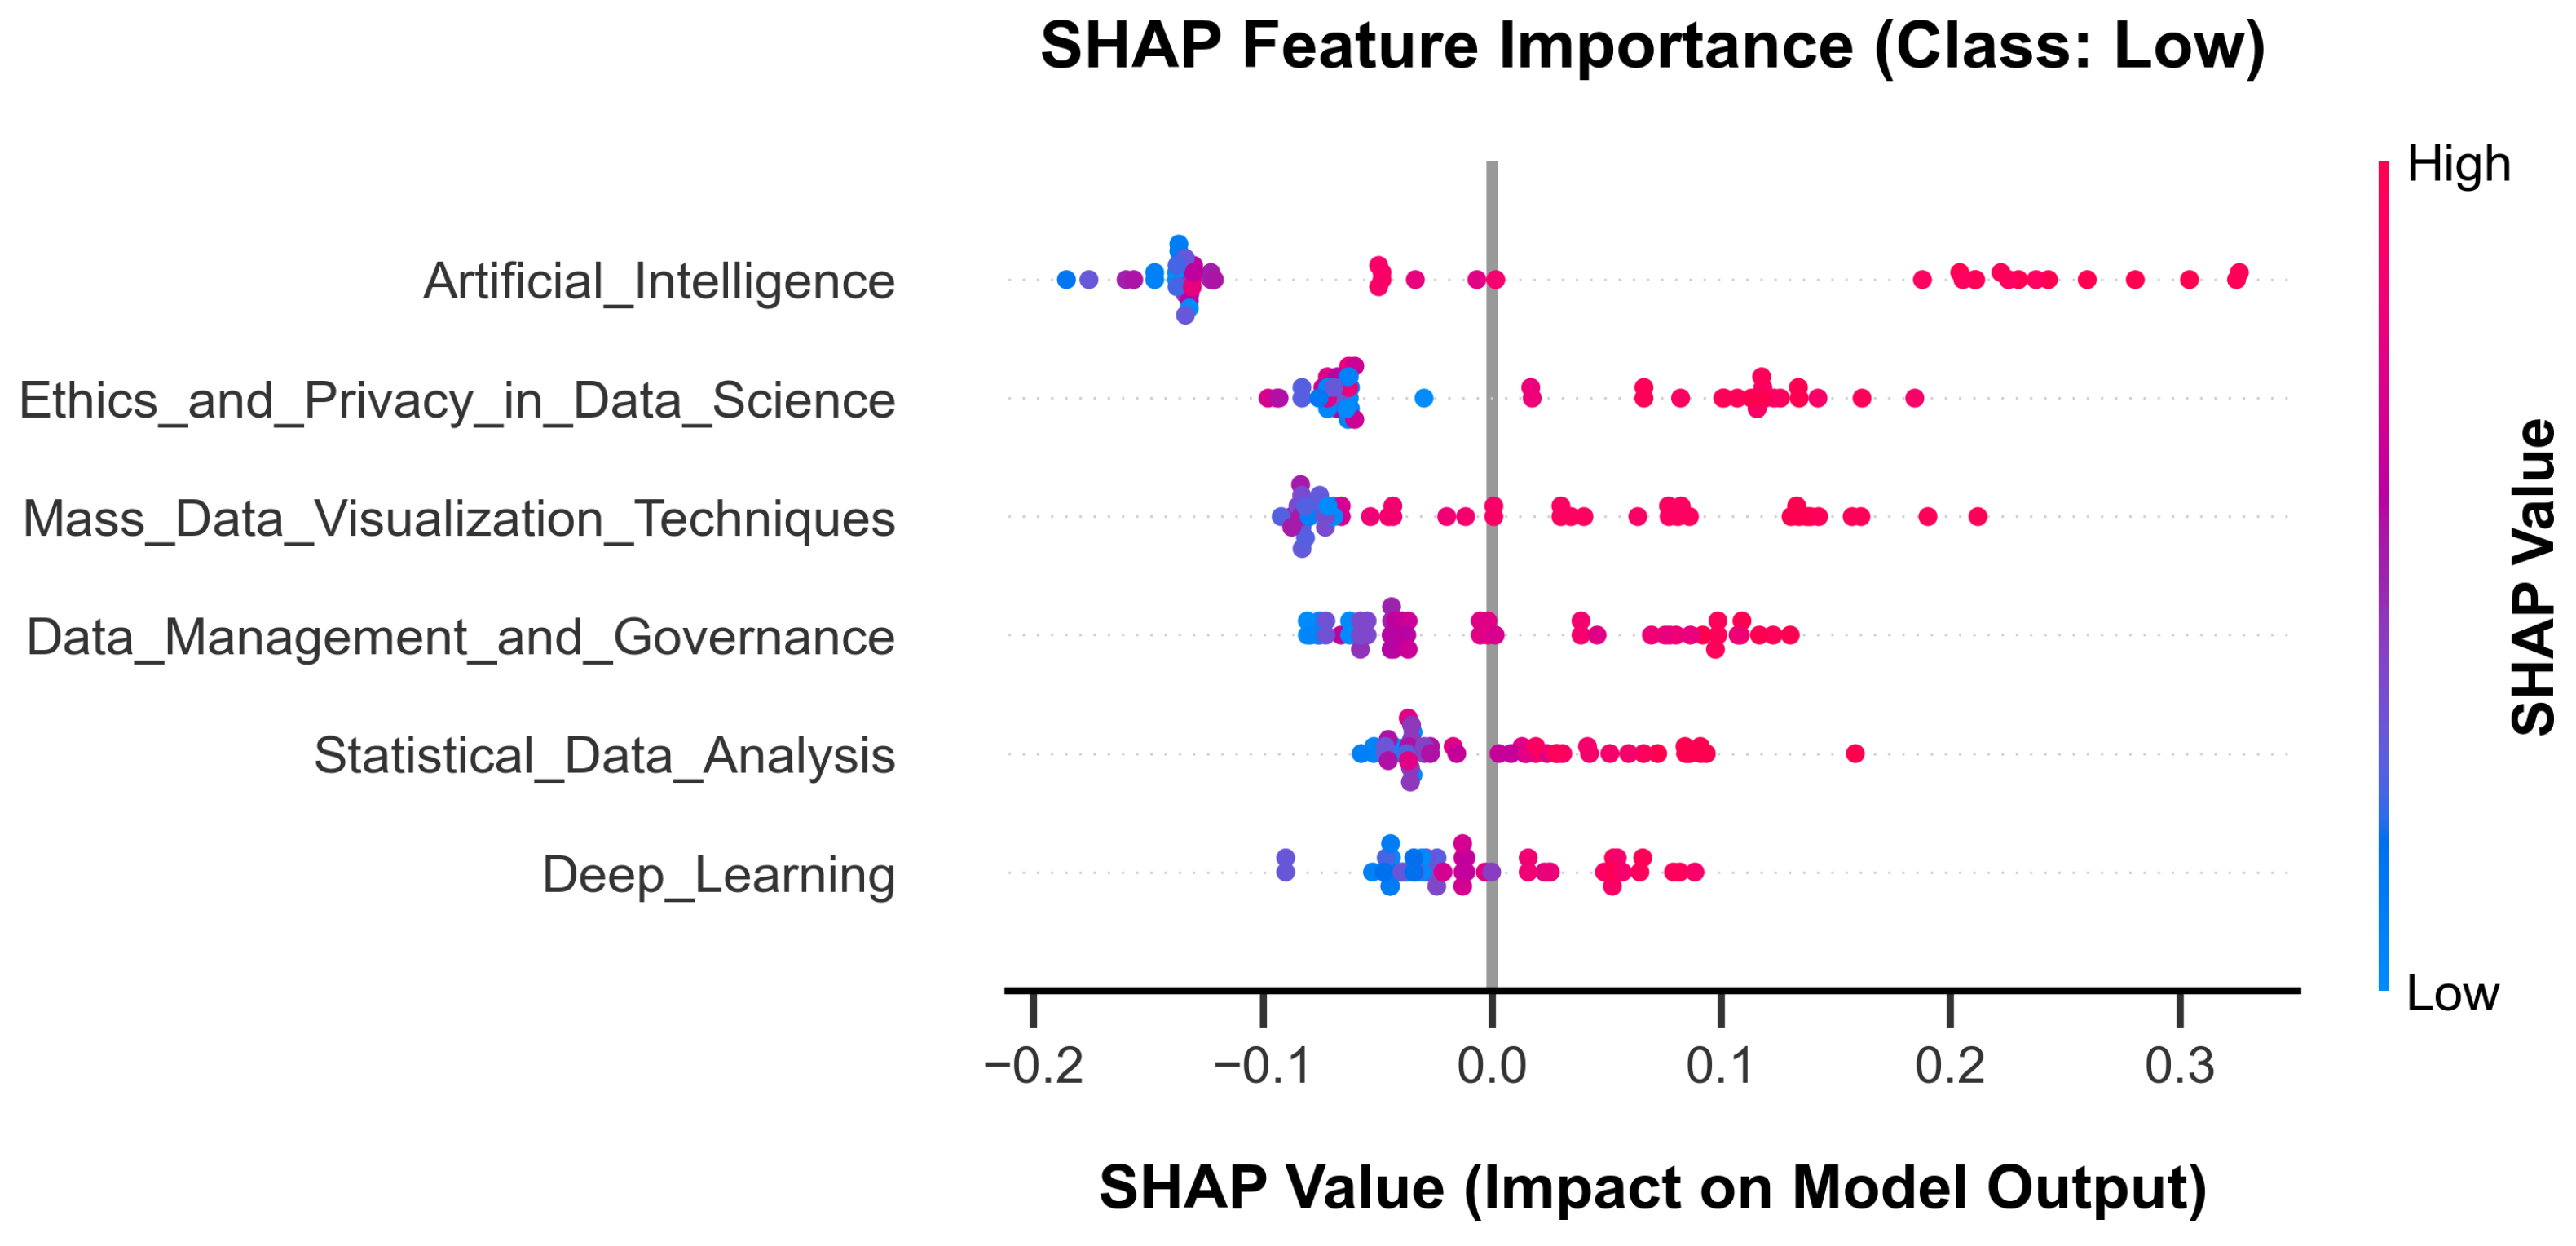
The characterization of predictive attributes was performed using Shapley values. The SHAP beeswarm plot in Figure 10 details the global impact and directional effects of features on model output.
Figure 10.
SHAP beeswarm plot showing feature importance and directional effects on model output. Features are ordered by SHAP value magnitude.
The exact relative percentage contribution of each feature to the predictive engine is structured in Table 14.
Table 14.
SHAP-based feature importance ranking and marginal contribution percentages.
Machine Learning (), Artificial Intelligence (), and Big Data and Cloud Computing () emerge as the strongest predictors, together accounting for more than of total importance.
4.15. ROC-AUC Analysis
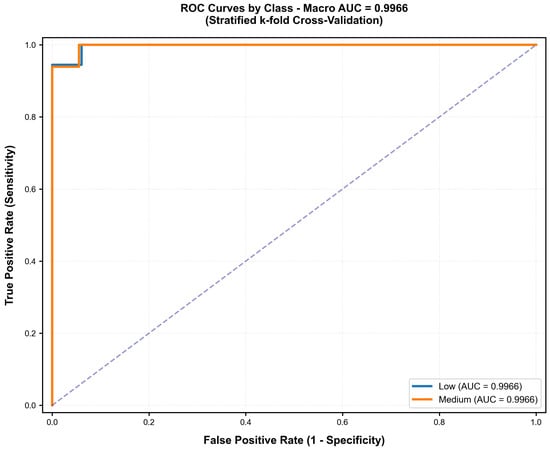
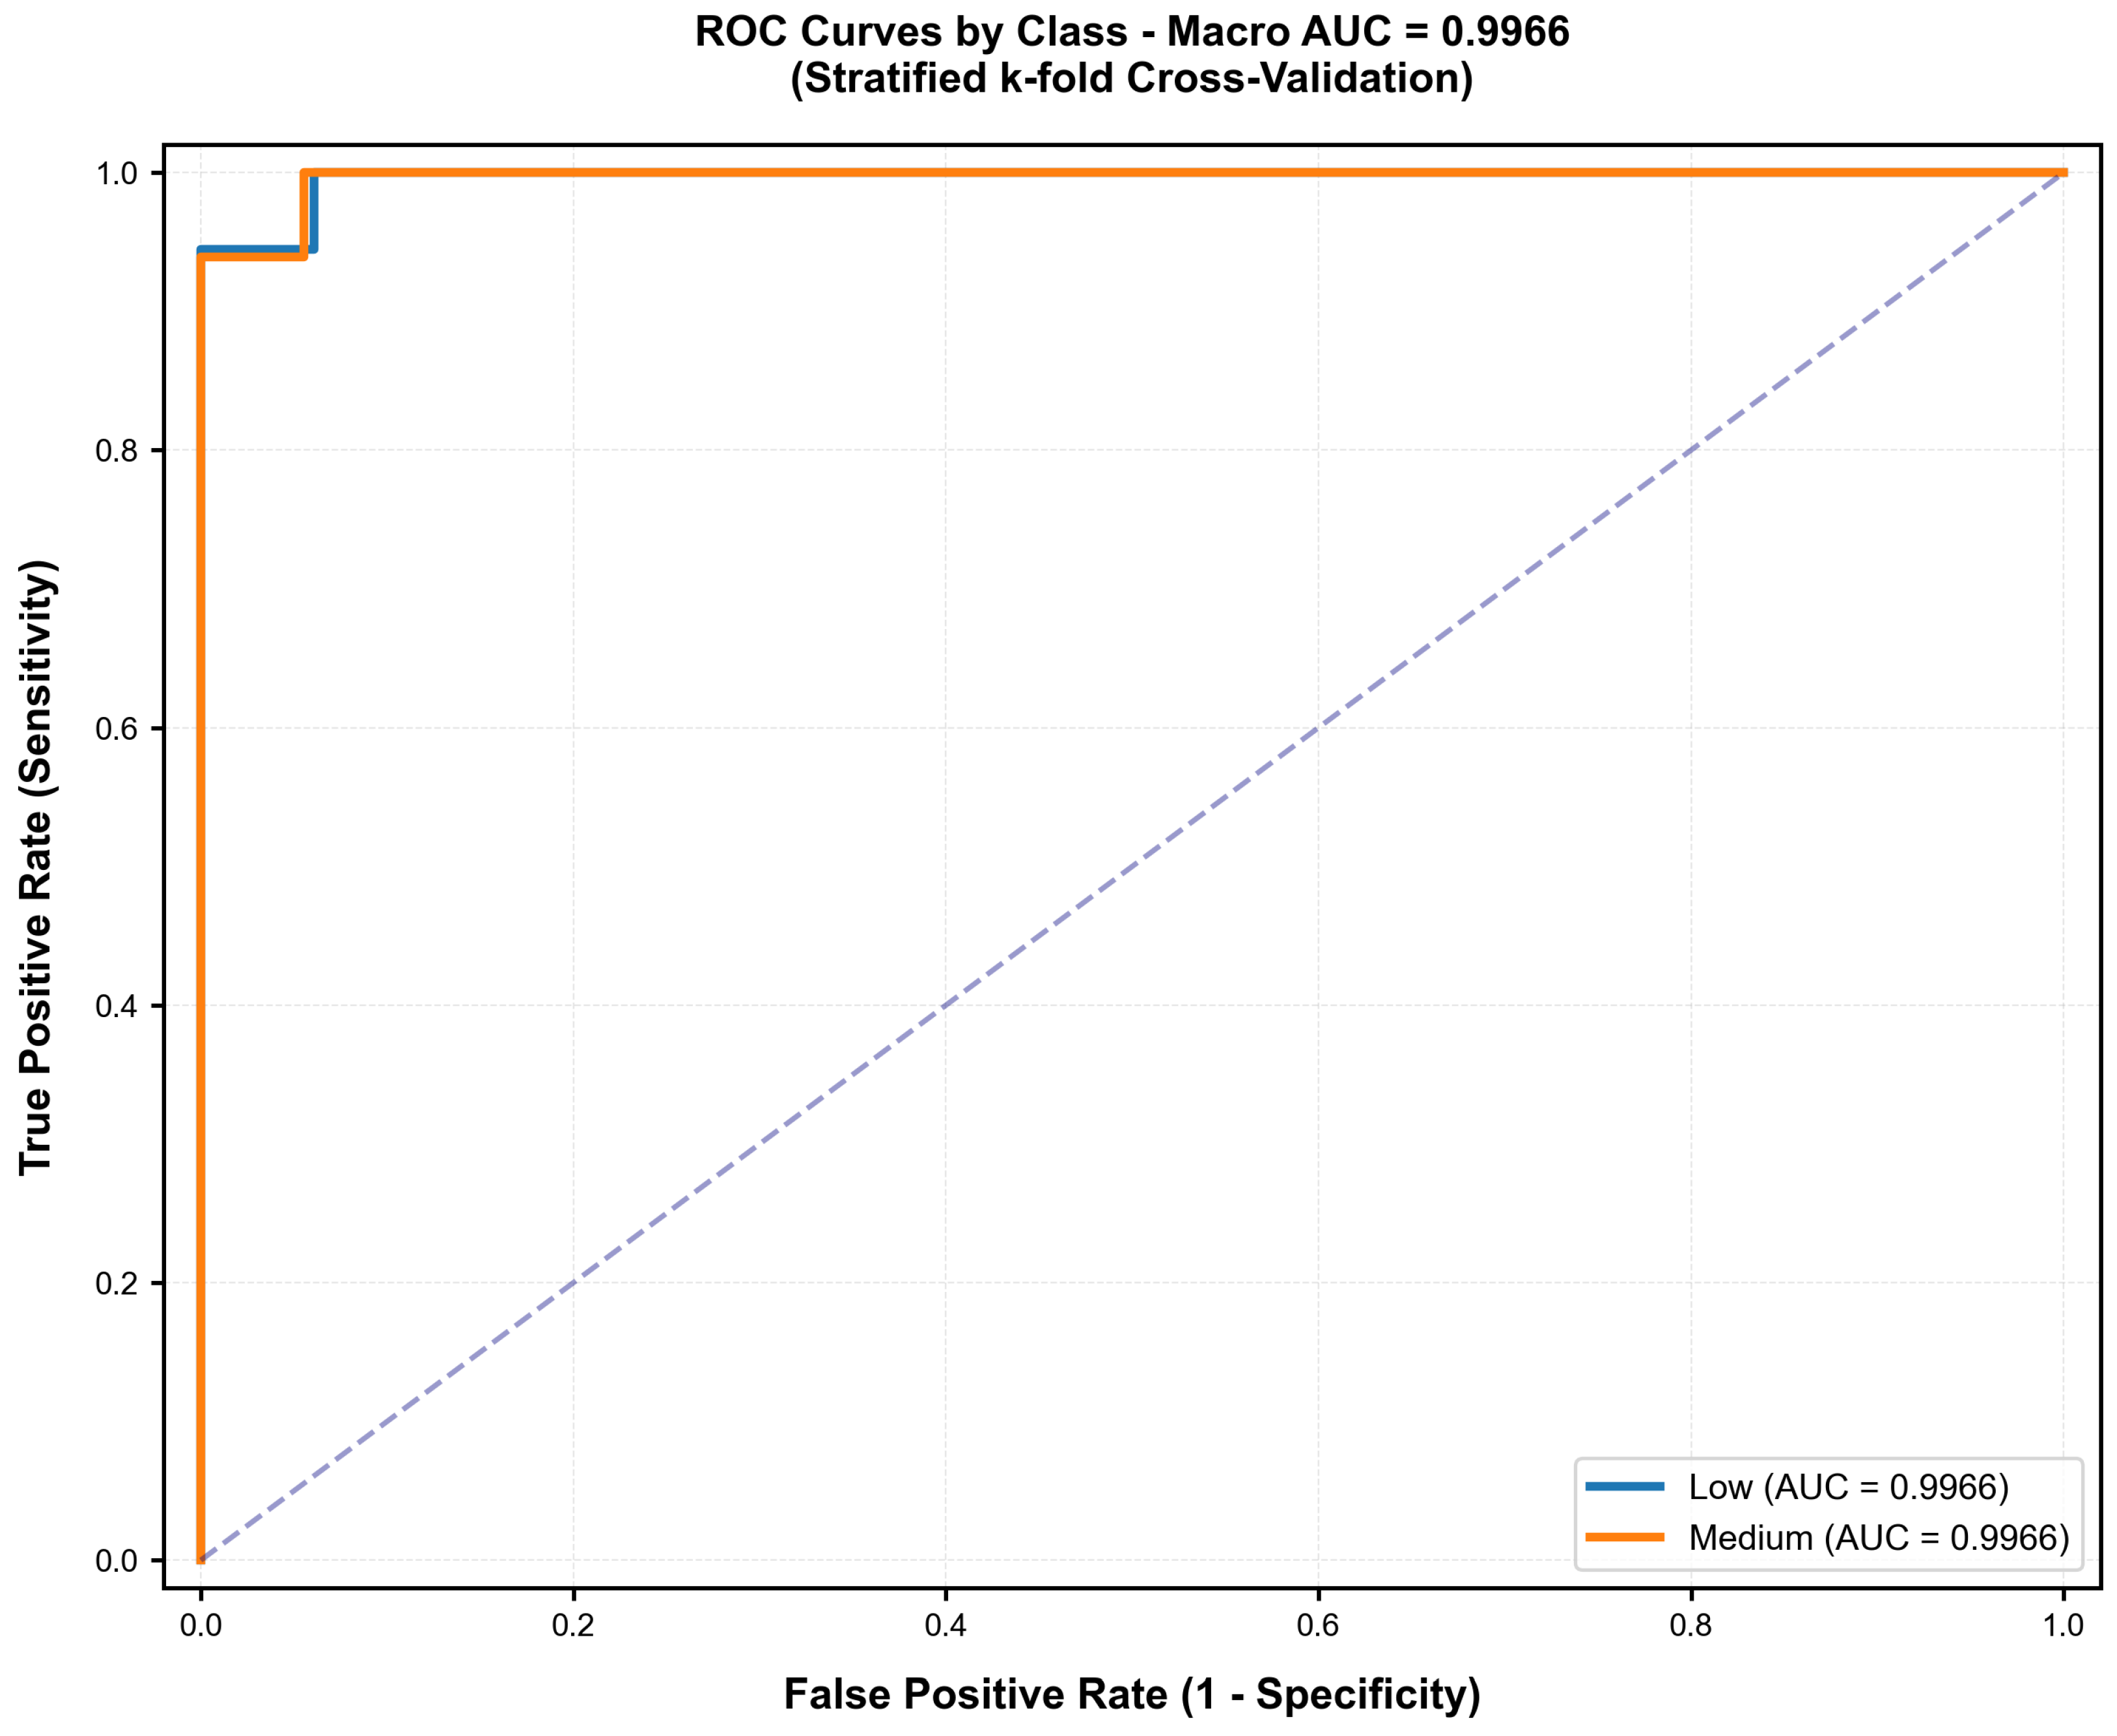
The discriminative capability of the classification system was cross-verified. Figure 11 presents the Receiver Operating Characteristic (ROC) curves.
Figure 11.
ROC curves showing the discriminative performance of the classification model. The model achieved a macro AUC of , with both Low and Medium risk classes showing excellent discriminative ability.
The ROC analysis yielded an excellent macro AUC of , indicating the excellent discriminative ability of the model for both risk classes.
4.16. Confusion Matrix Analysis
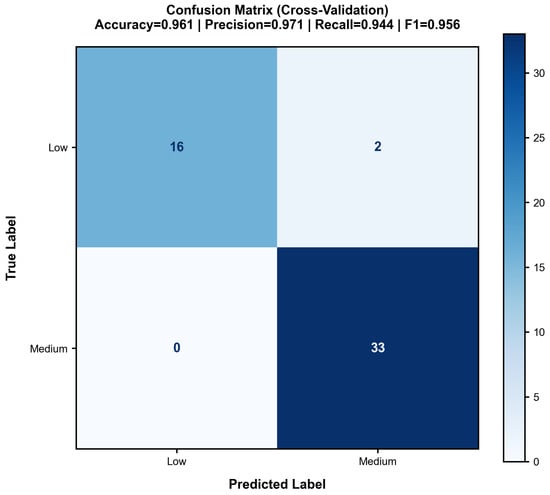
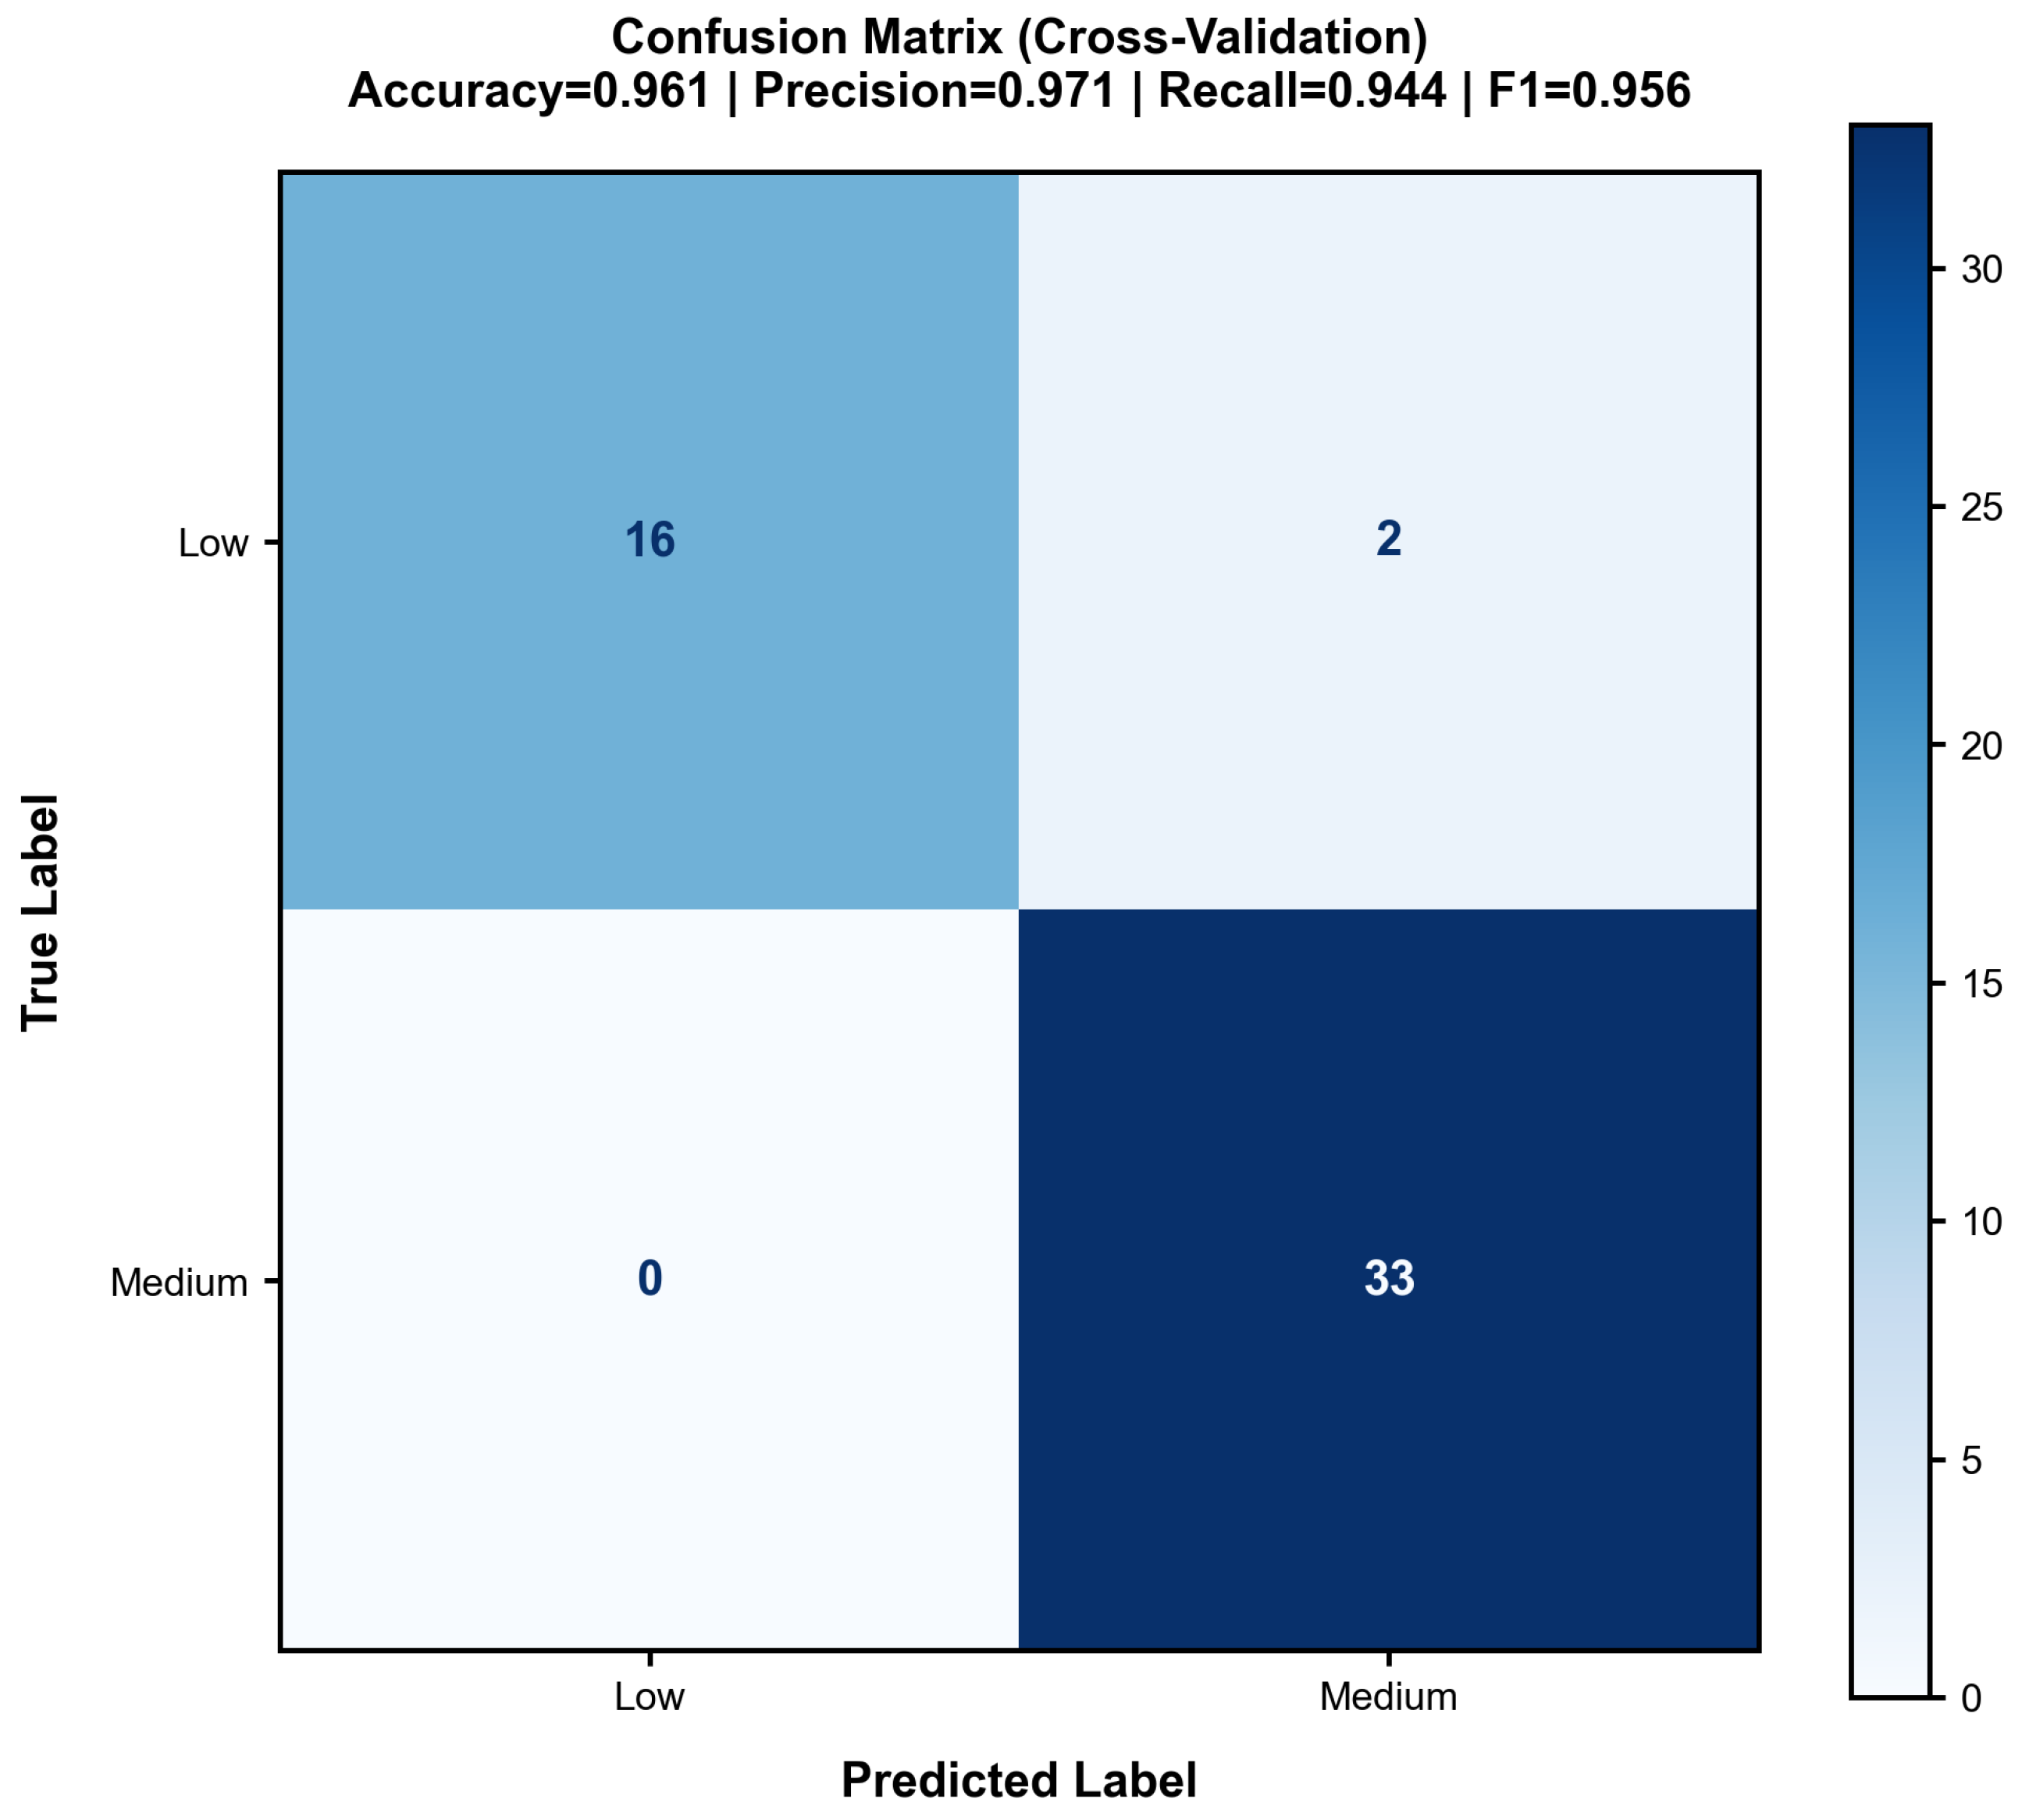
Classification counts, true matching levels, and misclassification risks across folds were aggregated. Figure 12 shows the consolidated global confusion matrix.
Figure 12.
Global confusion matrix across cross-validation folds displaying true vs. predicted labels for Low Risk and Medium Risk classes.
The secondary performance indexes derived directly from the confusion matrix dimensions are itemized in Table 15.
Table 15.
Performance metrics calculated from the confusion matrix outputs.
4.17. Academic Risk Analysis Using Clustering
The clustering analysis reveals a bimodal distribution of academic risk within the evaluated cohort, enabling a precise segmentation of student profiles. The model identified two statistically distinct clusters: a predominant low-risk group and a high-risk group.
Table 16 summarizes the final student partition by academic risk level.
Table 16.
Student distribution by academic risk level.
4.18. Nested Cross-Validation
To obtain an unbiased estimate of model performance and prevent overfitting, nested cross-validation was employed. The unbiased accuracy metrics alongside their lower and upper confidence bounds are presented in Table 17.
Table 17.
Unbiased Nested Cross-Validation results.
The nested cross-validation accuracy () closely matches the standard cross-validation results, confirming that the model does not suffer from overfitting and that performance estimates are reliable.
4.19. Comprehensive Validation Summary
To provide a structured and transparent synthesis of the complete validation framework, a global summary mapping all indicators is built. Table 18 presents a comprehensive overview of all validation metrics employed in this study.
Table 18.
Comprehensive framework validation and performance summary.
4.20. Variable Abbreviations
For clarity and reproducibility, Table 19 summarizes the variable abbreviations used throughout this study.
Table 19.
Variable abbreviations used in the analysis.
5. Discussion
Given the experimental sample size ( graduate students distributed across three independent cohorts: Cohort 1 = 21, Cohort 2 = 16, Cohort 3 = 14), the findings provide robust empirical evidence supporting the proposed methodological framework while acknowledging the systematic necessity for broader external validation on larger cohorts. The tactical integration of three fully independent cohorts for external cross-validation loops substantially strengthens the generalizability claims of this study when contrasted against traditional single-cohort designs.
5.1. Interpretation of Findings
The experimental results demonstrate that the early fusion of heterogeneous academic data—specifically integrating student numerical grades alongside encoded qualitative faculty evaluations—significantly improves the discrimination and detection of academic performance profiles compared to fragmented or unimodal analytical pipelines. This systemic pattern was consistently observed across the three external validation experiments (mean accuracy of ), indicating that integrated multimodal representations effectively capture latent interactions between underlying academic variables and pedagogical dimensions.
The determination of the optimal number of clusters () via the Silhouette coefficient, combined with the high consensus across distinct clustering paradigms (ARI values spanning the 0.922–1.000 spectrum), robustly validates the mathematical robustness of the two-cluster solution. It is critical to underscore that the “academic risk” labels used in this study were not predefined a priori, but were dynamically derived from this unsupervised cluster analysis. This bimodal structure partitions the student population into two statistically distinct profiles: a predominant low-risk group (71.4%) and a smaller high-risk group (28.6%), which reflect patterns of relative performance within the dataset rather than clinical or absolute risk categories. This structural segmentation is supported by the significant multivariate differences across cohorts found in the MANOVA (Wilks’ Lambda = , ), confirming that the cluster-derived profiles are associated with meaningful academic distinctions.
The external cohort validation strategy stands as a core methodological contribution of this research. Across the three evaluation setups where each independent cohort served sequentially as an isolated test set, the framework yielded high cross-cohort generalizability. Experiment 3 (training on Cohorts 2 + 3 and testing on Cohort 1) achieved a classification accuracy of , a highly satisfactory performance bound that proves the classification model generalizes effectively when recognizing these cluster-derived profiles, even when the largest constituent cohort (Cohort 1, ) is completely withheld during the training phase. This demonstrates the model’s resilience to variations in cohort composition when mapping multi-source inputs to unsupervised group structures.
A highly relevant contribution of this design lies in the systematic inclusion of qualitative multi-source faculty evaluations—encompassing self-, peer-, and hetero-evaluation metrics—as structured, continuous inputs for profile classification. The SHAP feature importance analysis revealed that Machine Learning (28.68%), Artificial Intelligence (17.93%), and Big Data and Cloud Computing (16.66%) emerge as the absolute primary predictors, collectively accounting for more than 60% of the total model contribution. This output successfully extends prior educational data mining approaches that often rely exclusively on quantitative academic logs, thereby directly addressing the historical underrepresentation of qualitative pedagogical dimensions in modeling student performance profiles.
Furthermore, the covariance structure observed between technical, methodological, and reflective subjects suggests that academic success in postgraduate data science programs reflects multidimensional competency integration rather than isolated technical mastery. The bootstrap validation infrastructure, computed across 1000 sampling iterations, confirmed reliable cluster separation bounds with a mean ARI of (95% CI: 0.104–0.936), providing statistical confidence in the identified profiles despite the moderate sample size.
5.2. Comparison with Existing Benchmarks
The present findings align with prior learning analytics literature indicating that multimodal educational data integration significantly optimizes pattern detection boundaries. However, the application of three independent cohorts for external cross-validation represents a major methodological advancement over existing benchmark frameworks, which predominantly rely on internal cross-validation pools within a single institutional cohort.
The core structural and validation differences between this research and prominent historical paradigms are formally summarized in Table 20. While historical studies typically utilize unimodal datasets tested via internal validation loops to predict fixed academic labels, this study deploys an early multimodal feature-level fusion verified through multi-cohort external validation, nested cross-validation, and empirical bootstrapping to identify and classify data-driven cluster profiles.
Table 20.
Comparison of study characteristics and validation frameworks with educational data mining benchmarks.
An essential distinction of this work is both empirical and methodological: it demonstrates that early fusion workflows can be rigorously and systematically evaluated using external cohort validation methods even in constrained postgraduate educational environments, ensuring that the resulting cluster-derived profiles remain mathematically stable across independent groups without relying on predefined target labels.
5.3. Implications, Limitations, and Future Research
From a learning analytics perspective, the findings imply that multimodal academic data fusion paired with external cohort validation can support highly reliable, evidence-informed, and context-sensitive academic monitoring protocols. The practical value of the proposed architecture lies in its capability to drive exploratory academic screening and curriculum-informed decision-making. The successful external validation (mean cross-cohort accuracy of ) strongly implies that the identified profiles are stable structural phenomena rather than statistical artifacts of a specific student group.
Nevertheless, several limitations must be explicitly detailed. First, a key distinction must be maintained regarding the nature of the target variables: the model does not predict standardized or deterministic academic risk per se, but rather classifies students into subgroups derived from an exploratory cluster analysis, meaning the labels are dependent on the specific distribution of the sample. Second, although the multi-cohort sample size () is larger than initial exploratory pilots, it remains moderate, which may limit the asymptotic precision of specific estimation layers, particularly for minority-cluster metrics. Third, the single-institution boundary constrains immediate external validity across highly divergent institutional environments, although the three-cohort cross-testing setup partially dampens this constraint. Fourth, the present class imbalance (15 low-risk versus 6 high-risk students within the cluster distribution) reduces the variance stability of minority-class performance boundaries. Fifth, while cross-cohort validation is a clear methodological strength, all target student cohorts originated from the same institution, meaning that cross-institutional generalizability claims cannot yet be fully supported. Sixth, the near-perfect AUC scores (0.997) observed in specific external experiments must be interpreted with standard scientific caution, as they may reflect the limited sample size and the highly uniform grading patterns across those specific master’s groups despite the application of rigorous validation adjustments.
Crucially, the nested cross-validation layer (unbiased accuracy = ) closely matched the standard cross-validation values, confirming that the classification framework does not suffer from variance inflation or overfitting when identifying cluster memberships. This alignment between nested and standard evaluation paradigms provides strong mathematical evidence for the reliability of the classification metrics.
Accordingly, this study should be interpreted as a methodologically rigorous validation of early multimodal academic data fusion under strict cohort constraints for profile identification. Future research vectors should prioritize: (1) multi-institutional validation across larger and geographically diverse benchmark cohorts; (2) algorithmic replication across distinct educational programs and varied cultural environments; (3) longitudinal tracing of temporal cluster stability to evaluate whether risk profiles persist across semesters; (4) investigation of hybrid fusion architectures combining feature-level integration with decision-level aggregation; and (5) development of explainable artificial intelligence (XAI) dashboards to make SHAP-based feature importance vectors fully accessible and interpretable for academic decision-makers.
6. Conclusions
This study presented an exploratory methodological framework for the early identification of academic performance and risk profiles in postgraduate data science programs through the integration of multimodal academic data and localized validation protocols. The empirical investigation, conducted on a limited sample of 51 graduate students distributed across three independent cohorts, yielded several preliminary findings that contribute to the ongoing discussion and practical implementation of learning analytics systems based on data-driven student segmentation.
6.1. Principal Findings
The analysis revealed a consistent bimodal structure in academic performance within the studied group, with two statistically distinct profiles identified across the cohorts via unsupervised clustering: a predominant low-risk group comprising 71.4% of the student population and a smaller high-risk group representing 28.6%. This structural segmentation was evaluated through multiple clustering algorithms (K-Means, GMM, and Spectral), with the optimal number of clusters () reflecting the maximum Silhouette coefficient ( at ). The bootstrap validation framework, computed across 1000 resampling iterations, provided moderate cluster stability with a mean Adjusted Rand Index of (95% CI: –), suggesting that the identified profiles represent meaningful academic distinctions within these specific cohorts rather than temporary statistical artifacts.
The classification model designed to replicate and detect these cluster assignments demonstrated promising discriminative capability for this sample, achieving an accuracy of , a macro F1-score of , and a macro AUC of . The nested cross-validation layer yielded a localized accuracy of , indicating that the framework effectively captured the multi-source boundaries of the cluster-derived profiles within this dataset without clear signs of overfitting. The external cohort validation strategy, where each independent cohort served sequentially as an isolated test set, yielded satisfactory performance bounds with a mean cross-cohort accuracy of , pointing to the model’s potential resilience to minor variations in cohort composition when generalizing these empirical profiles at a local level.
The SHAP feature importance analysis identified Machine Learning (), Artificial Intelligence (), and Big Data and Cloud Computing () as the strongest indicators for cluster alignment within this sample, collectively accounting for more than of total model contribution. The effect size analysis further suggested that Mass Data Visualization Techniques (), Artificial Intelligence (), and Data Science Fundamentals () contributed noticeably to cohort differentiation, highlighting the potentially multidimensional nature of academic competency integration in postgraduate data science education.
6.2. Methodological Contributions
From a methodological perspective, this research contributes to the field of educational data mining through several exploratory insights. First, the early fusion of heterogeneous academic data—integrating student numerical grades alongside encoded qualitative faculty evaluations (self-, peer-, and hetero-evaluation)—improved the discrimination and detection of empirical academic performance profiles within this specific study compared to fragmented or unimodal analytical pipelines. This suggests that integrated multimodal representations can capture latent interactions between technical competencies and pedagogical dimensions in small-scale environments.
Second, rather than relying on standard supervised classification of subjective target labels, this work implements a combined unsupervised–supervised pipeline where risk profiles are first mathematically identified via cluster analysis and subsequently classified. The integration of three independent cohorts for external cross-validation loops offers a more rigorous approach than traditional single-cohort designs, helping to evaluate how these cluster structures behave across separate small groups within the same institution.
Third, the systematic inclusion of qualitative multi-source faculty evaluations as structured, continuous inputs successfully extends prior exploratory approaches that often rely exclusively on quantitative academic logs, thereby addressing the historical underrepresentation of qualitative pedagogical dimensions in student profile modeling. The covariance structure observed between technical, methodological, and reflective subjects suggests that academic success in postgraduate data science programs may reflect multidimensional competency integration rather than isolated technical mastery, an observation that warrants further validation in larger cohorts.
6.3. Practical Implications
From a learning analytics perspective, the findings imply that multimodal academic data fusion paired with external cohort validation can support initial, context-sensitive academic monitoring protocols. The practical value of the proposed architecture lies primarily in its capability to drive exploratory academic screening and curriculum-informed decision-making at a local scale. The successful local validation suggests that the cluster-derived profiles may reflect recurring patterns within these cohorts rather than isolated statistical anomalies, potentially allowing the institution to design tentative proactive intervention strategies targeted at students alignment with higher-risk academic behaviors.
The identification of specific predictive features (Machine Learning, Artificial Intelligence, Big Data and Cloud Computing, among others) provides initial insights for curriculum designers and academic advisors. These findings suggest that interventions targeting foundational technical competencies in these areas could be relevant in addressing the vulnerabilities identified in the higher-risk cluster. Furthermore, the structured integration of qualitative evaluation metrics offers a complementary perspective to traditional grade-based assessments, enabling a broader, more holistic view of student performance distribution.
6.4. Limitations and Future Research Directions
As an exploratory study, several critical limitations must be explicitly acknowledged, primarily revolving around the scope of the data. First, the limited multi-cohort sample size () restricts the statistical power and the asymptotic precision of specific estimation layers, particularly for minority-cluster metrics; therefore, these results must be interpreted with caution and cannot be widely generalized. Second, it is crucial to clarify that the risk profiles are explicitly derived from exploratory cluster analysis rather than a deterministic clinical diagnosis of academic failure; as such, these classifications remain highly contextual and relative to the current small-scale data distribution. Third, the single-institution boundary heavily constrains immediate external validity across highly divergent institutional environments, despite the three-cohort cross-testing setup partially dampening local variations.
Fourth, the present class imbalance (15 low-risk versus 6 high-risk students within the cluster partitions) reduces the variance stability of minority-class performance boundaries. Fifth, while cross-cohort validation is a methodological asset, all target student cohorts originated from the same institution, meaning that cross-institutional generalizability claims cannot be supported at this stage. Sixth, the perfect AUC scores observed in specific external experiments must be interpreted with standard scientific skepticism, as they likely reflect highly uniform grading patterns across these specific master’s groups rather than absolute predictive perfection.
Accordingly, this study should be interpreted strictly as a preliminary validation of early multimodal academic data fusion under constrained cohort sizes for data-driven profile identification. Future research vectors must prioritize: (1) multi-institutional validation across significantly larger and geographically diverse benchmark cohorts to formally establish external validity; (2) algorithmic replication across distinct educational programs and varied cultural environments to assess generalizability; (3) longitudinal tracing of temporal cluster stability to evaluate whether these empirical risk profiles persist across semesters and academic years; (4) investigation of hybrid fusion architectures combining feature-level integration with decision-level aggregation to further optimize classification performance; and (5) development of explainable artificial intelligence (XAI) dashboards to make SHAP-based feature importance vectors accessible and interpretable for academic decision-makers, thereby facilitating the translation of these preliminary analytical insights into pedagogical action.
6.5. Final Remarks
In conclusion, this exploratory study suggests that early multimodal academic data fusion, evaluated through a multi-cohort validation framework, presents a promising preliminary approach for detecting data-driven academic risk profiles in postgraduate data science education. The methodological contributions, empirical findings, and practical implications outlined in this work provide an initial foundation for future research in learning analytics, offering a balanced framework for data-constrained educational environments. Crucially, by shifting from predefined assumptions of risk to an objective, cluster-derived evaluation of student profiles, this approach indicates that institutions operating under limited data constraints can begin to map pedagogical interventions onto verified, latent structures of student performance, provided they maintain appropriate scientific caution regarding generalizability.
Author Contributions
Conceptualization, W.C. and J.E.; Methodology, W.C. and J.E. All authors have read and agreed to the published version of the manuscript.
Funding
This research received no external funding.
Data Availability Statement
All data and files related to the predictive models are available and organized in the following Google Drive link: https://doi.org/10.5281/zenodo.20836721. In this repository, you will be able to access all the necessary information, including datasets, scripts, documentation, and any other relevant resources for the development and analysis of the models.
Acknowledgments
We express our sincere gratitude to Wilson Chango from PUCE Esmeraldas for his invaluable technical assistance and guidance in configuring the sensor systems and data acquisition processes for this research. This study was supported by PUCE Esmeraldas. Additionally, we acknowledge the facilities and general support provided by the Department of Computer Sciences, which greatly contributed to the successful completion of this work.
Conflicts of Interest
The authors declare no conflicts of interest.
References
- Ross, M. Rapid migration from traditional or hybrid to fully virtual education in the age of the coronavirus Pandemic: Challenges, Experiences and Views of College and University Students. In Delivering Global Education and Impact in Emergencies Using E-Learning; Solent University: Southampton, UK, 2021. [Google Scholar]
- Ahmed, V.; Opoku, A. Technology supported learning and pedagogy in times of crisis: The case of COVID-19 pandemic. Educ. Inf. Technol. 2022, 27, 365–405. [Google Scholar] [CrossRef] [Scilit] [PubMed]
- Kuntz, J.; Manokore, V. “I Did Not Sign Up For This”: Student Experiences of the Rapid Shift from In-person to Emergency Virtual Remote Learning During the COVID Pandemic. High. Learn. Res. Commun. 2022, 12, 6. [Google Scholar] [CrossRef] [Scilit]
- Chango, W.; Silva, G.; Sanchéz, H.; Logroño, S. Predicting academic performance of undergraduate students in blended learning. In Proceedings of the 2024 IEEE Colombian Conference on Communications and Computing, COLCOM 2024—Proceedings, Barranquilla, Colombia, 21–23 August 2024. [Google Scholar] [CrossRef] [Scilit]
- Mohamed Hashim, M.A.; Tlemsani, I.; Matthews, R. Higher education strategy in digital transformation. Educ. Inf. Technol. 2022, 27, 3171–3195, Correction in Educ. Inf. Technol. 2022, 27, 7379. [Google Scholar] [CrossRef] [Scilit] [PubMed]
- López-Meneses, E.; Mellado-Moreno, P.C.; Gallardo Herrerías, C.; Pelícano-Piris, N. Educational Data Mining and Predictive Modeling in the Age of Artificial Intelligence: An In-Depth Analysis of Research Dynamics. Computers 2025, 14, 68. [Google Scholar] [CrossRef] [Scilit]
- Prinsloo, P.; Khalil, M.; Slade, S. Learning analytics as data ecology: A tentative proposal. J. Comput. High. Educ. 2024, 36, 154–182. [Google Scholar] [CrossRef] [Scilit]
- Chang, D.F.; Lin, Y.L.; Wu, S.J.; Deroncele-Acosta, A.; Palacios-Núñez, M.L.; Toribio-López, A. Digital Transformation and Technological Innovation on Higher Education Post-COVID-19. Sustainability 2023, 15, 2466. [Google Scholar] [CrossRef] [Scilit]
- Ang, K.L.M.; Ge, F.L.; Seng, K.P. Big Educational Data Analytics: Survey, Architecture and Challenges. IEEE Access 2020, 8, 116392–116414. [Google Scholar] [CrossRef] [Scilit]
- Hong, H.; Dai, L.; Zheng, X. Advances in Wearable Sensors for Learning Analytics: Trends, Challenges, and Prospects. Sensors 2025, 25, 2714. [Google Scholar] [CrossRef] [Scilit] [PubMed]
- Fahd, K.; Miah, S.J. Designing and evaluating a big data analytics approach for predicting students’ success factors. J. Big Data 2023, 10, 159. [Google Scholar] [CrossRef] [Scilit]
- Gonugunta, K.C.; Leo, K. Role of Data-Driven Decision Making in Enhancing Higher Education Performance: A Comprehensive Analysis of Analytics in Institutional Management. Int. J. Acta Inform. 2024, 3, 149–159. [Google Scholar]
- Rawlinson, S. Using Predictive Analytics to Support Students and Reduce Attrition: A Rapid Evidence Assessment; Research Report; University of Westminster: London, UK, 2024. [Google Scholar]
- Mella-Norambuena, J.; Chiappe, A.; Badilla-Quintana, M.G. Theoretical and empirical models underlying the teaching use of LMS platforms in higher education: A systematic review. J. Comput. Educ. 2024, 12, 997–1023. [Google Scholar] [CrossRef] [Scilit]
- Ngulube, P.; Ncube, M.M. Leveraging Learning Analytics to Improve the User Experience of Learning Management Systems in Higher Education Institutions. Information 2025, 16, 419. [Google Scholar] [CrossRef] [Scilit]
- Chango, W.; Lara, J.A.; Cerezo, R.; Romero, C. A review on data fusion in multimodal learning analytics and educational data mining. Wiley Interdiscip. Rev. Data Min. Knowl. Discov. 2022, 12, e1458. [Google Scholar] [CrossRef] [Scilit]
- Li, F.; Xu, J. Revolutionizing AI-enabled Information Systems Using Integrated Big Data Analytics and Multi-modal Data Fusion. IEEE Access 2025, 13, 212316–212340. [Google Scholar] [CrossRef] [Scilit]
- Guo, T.; Zhao, W.; Alrashoud, M.; Tolba, A.; Firmin, S.; Xia, F. Multimodal Educational Data Fusion for Students’ Mental Health Detection. IEEE Access 2022, 10, 70370–70382. [Google Scholar] [CrossRef] [Scilit]
- Maier, U.; Klotz, C. Personalized feedback in digital learning environments: Classification framework and literature review. Comput. Educ. Artif. Intell. 2022, 3, 100080. [Google Scholar] [CrossRef] [Scilit]
- Solis Trujillo, B.P.; Velarde-Camaqui, D.; Gonzales Nuñez, C.A.; Castillo Silva, E.V.; Gonzalez Said de la Oliva, M.d.P. The current landscape of formative assessment and feedback in graduate studies: A systematic literature review. Front. Educ. 2025, 10, 1509983. [Google Scholar] [CrossRef] [Scilit]
- Sıcakyüz, Ç.; Edalatpanah, S.A.; Pamucar, D. Data mining applications in risk research: A systematic literature review. Int. J. Knowl.-Based Intell. Eng. Syst. 2025, 29, 222–261. [Google Scholar] [CrossRef] [Scilit]
- Siddiqi, S.; Qureshi, F.; Lindstaedt, S.; Kern, R. Detecting Outliers in Non-IID Data: A Systematic Literature Review. IEEE Access 2023, 11, 70333–70352. [Google Scholar] [CrossRef] [Scilit]
- Ignatious, H.A.; El-Sayed, H.; Kulkarni, P. Multilevel Data and Decision Fusion Using Heterogeneous Sensory Data for Autonomous Vehicles. Remote Sens. 2023, 15, 2256. [Google Scholar] [CrossRef] [Scilit]
- Hussain, M.; O’Nils, M.; Lundgren, J.; Mousavirad, S.J. A Comprehensive Review on Deep Learning-Based Data Fusion. IEEE Access 2024, 12, 180093–180124. [Google Scholar] [CrossRef] [Scilit]
- Sudjianto, A.; Zhang, A. Model Validation Practice in Banking: A Structured Approach for Predictive Models. arXiv 2024, arXiv:2410.13877. [Google Scholar]
- Li, J. A Research on Relationship Between Student-Centered Approach and Student Competence Development in Higher Education: Case Studies in China and Italy. 2023. Available online: https://www.research.unipd.it/handle/11577/3484866 (accessed on 19 July 2026).
- Talavera-Cobo, V.; Robles-Garcia, J.E.; Guillen-Grima, F.; Calva-Lopez, A.; Tapia-Tapia, M.; Labairu-Huerta, L.; Ancizu-Marckert, F.J.; Guillen-Aguinaga, L.; Sanchez-Zalabardo, D.; Miñana-Lopez, B. Prioritising Data Quality Governance for AI in Prostate Cancer: A Methodological Proof-of-Concept Study Using Neural Networks for Risk Stratification. Diagnostics 2026, 16, 1454. [Google Scholar] [CrossRef] [Scilit] [PubMed]
- Krstajic, D.; Buturovic, L.J.; Leahy, D.E.; Thomas, S. Cross-validation pitfalls when selecting and assessing regression and classification models. J. Cheminform. 2014, 6, 10. [Google Scholar] [CrossRef] [Scilit] [PubMed]
- Hooshyar, D.; Yang, Y. Problems with SHAP and LIME in Interpretable AI for Education: A Comparative Study of Post-Hoc Explanations and Neural-Symbolic Rule Extraction. IEEE Access 2024, 12, 137472–137490. [Google Scholar] [CrossRef] [Scilit]
- Kouraichi, M.; Mansouri, M.; Trabelsi, M.; M’Halla, A.; Abdel-Khalik, A.S.; Sakly, A. Deep Learning for Fault Diagnosis in Power Transmission Lines: Current Trends, Limitations, and Future Directions. IEEE Access 2025, 13, 192105–192142. [Google Scholar] [CrossRef] [Scilit]
- Kumar, G.; Basri, S.; Imam, A.A.; Khowaja, S.A.; Capretz, L.F.; Balogun, A.O. Data Harmonization for Heterogeneous Datasets: A Systematic Literature Review. Appl. Sci. 2021, 11, 8275. [Google Scholar] [CrossRef] [Scilit]
- Kumar, K.; Al-Besher, A. IoT enabled e-learning system for higher education. Meas. Sens. 2022, 24, 100480. [Google Scholar] [CrossRef] [Scilit]
- Assegie, T.A.; Salau, A.O.; Chhabra, G.; Kaushik, K.; Braide, S.L. Evaluation of Random Forest and Support Vector Machine Models in Educational Data Mining. In Proceedings of the 2nd International Conference on Advancement in Computation and Computer Technologies, InCACCT 2024, Gharuan, India, 2–3 May 2024; pp. 131–135. [Google Scholar] [CrossRef] [Scilit]
- Cheng, C. Graph-Attention Fusion with VAE Cross-Modal Mapping and Reinforcement-Learning Visualization for Real-Time AR. Informatica 2025, 49, 309–322. [Google Scholar] [CrossRef] [Scilit]
- Nakach, F.Z.; Idri, A.; Goceri, E. A comprehensive investigation of multimodal deep learning fusion strategies for breast cancer classification. Artif. Intell. Rev. 2024, 57, 327. [Google Scholar] [CrossRef] [Scilit]
- Phutela, N.; Relan, D.; Gabrani, G.; Kumaraguru, P.; Samuel, M. Stress Classification Using Brain Signals Based on LSTM Network. Comput. Intell. Neurosci. 2022, 2022, 7607592. [Google Scholar] [CrossRef] [Scilit] [PubMed]
- Abdullah; Shahid, M.; Ather, M.A.; Fatima, Z.; Mejorada, C.G.S.; Ruiz, M.J.T.; Téllez, R.Q.; Mata-Rivera, M.F.; Zagal-Flores, R. A Genomics-Guided Multimodal Contrastive Learning Framework for Clinically Significant Prostate Cancer Risk Stratification with Missing Clinical Data. Cancers 2026, 18, 1952. [Google Scholar] [CrossRef] [Scilit] [PubMed]
- Liang, J.; Hare, R.; Chang, T.; Xu, F.; Tang, Y.; Wang, F.Y.; Peng, S.; Lei, M. Student Modeling and Analysis in Adaptive Instructional Systems. IEEE Access 2022, 10, 59359–59372. [Google Scholar] [CrossRef] [Scilit]

Disclaimer/Publisher’s Note: The statements, opinions and data contained in all publications are solely those of the individual author(s) and contributor(s) and not of MDPI and/or the editor(s). MDPI and/or the editor(s) disclaim responsibility for any injury to people or property resulting from any ideas, methods, instructions or products referred to in the content. |
© 2026 by the authors. Licensee MDPI, Basel, Switzerland. This article is an open access article distributed under the terms and conditions of the Creative Commons Attribution (CC BY) license.