


Abstract
Coconut oil is a commercially important vegetable oil whose composition is relevant to food quality assessment. This study explored the complementary use of Attenuated Total Reflectance-Fourier Transform Infrared (ATR-FTIR) and proton nuclear magnetic resonance (1H NMR) spectroscopy, combined with principal component analysis (PCA), to characterize commercial coconut oils marketed in Brazil. Thirteen commercial samples available during the sampling period were analyzed, alongside an in-house coconut oil reference and comparison oils. The spectral patterns were interpreted in relation to fatty-acid composition, including features associated with unsaturated fatty acids. Most coconut oil samples clustered close to the reference sample, despite different brands, whereas two samples exhibited spectral profiles more similar to palm kernel oil than to the reference coconut oil. These observations describe similarities in the measured spectral profiles and do not establish adulteration. Overall, these findings highlight the complementary potential of 1H NMR and FTIR spectroscopy combined with chemometrics for the exploratory chemical characterization of coconut oils commercially available in Brazil. Further studies involving more reference samples and independent validation are required before authentication performance.
1. Introduction
Coconut oil (Cocos nucifera L.) has attracted increasing scientific and commercial interest due to its functional properties, unique composition, and antioxidant, anti-inflammatory, and metabolism-enhancing effects [1]. Coconut oil is a rich source of medium-chain fatty acids, such as lauric acid (C12:0) and caprylic acid (C8:0). Its fatty acid composition, which also includes myristic (C14:0) and palmitic (C16:0) acids, contributes to its stability and broad applicability in the food industry [2]. Unlike long-chain fatty acids, medium-chain fatty acids are rapidly metabolized by the liver and converted into an energy source. This characteristic has driven the use of coconut oil in functional diets and research on energy metabolism and cardiovascular health [1,3].
Interest in the potential biological effects of coconut oil has contributed to discussion of its commercial value and demand [4,5]; however, such effects depend on the specific outcome studied and the dietary context. According to the United Nations Conference on Trade and Development (UNCTAD) [6], the global coconut oil market generated approximately US$6 billion in revenue in 2025 and is projected to reach US$7.61 billion by 2029.
However, its high commercial value and increasing demand have also increased the economic incentive for coconut oil adulteration. According to the literature [7,8,9], the most common adulterants include palm oil, palm kernel oil, and liquid paraffin.
In Brazil, the identity and quality standards for vegetable oils are established by the Brazilian Health Regulatory Agency (ANVISA), based in part on the international guidelines of the Codex Alimentarius [10,11]. Nevertheless, detecting adulteration remains challenging because adulteration practices have become increasingly sophisticated [12]. Adulterant oils can be added to coconut oil in small amounts that may be difficult to detect using conventional physicochemical parameters employed in quality control [13].
Therefore, several analytical methods have been employed to investigate the composition and detect possible fraud of coconut oil [8,14]. Gas chromatography (GC), performed according to the protocols established by the American Oil Chemists’ Society (AOCS) [15], is still regarded as a reference method [16,17]. However, it requires extensive sample preparation, including derivatization, the use of chemical reagents, and long analysis times, while also increasing the risk of sample oxidation.
As an alternative, the detection of adulteration in coconut oil has increasingly relied on accurate analytical techniques, often combined with multivariate analysis. Among these, Fourier-transform infrared (FTIR) spectroscopy [8,13] and proton nuclear magnetic resonance (1H NMR) spectroscopy [18], have emerged as powerful tools, with the latter providing detailed information on sample chemical composition. In addition, chemometric methods, particularly principal component analysis (PCA), facilitate pattern recognition and the visualization of similarities and differences among samples [19,20,21].
Previous studies have investigated different analytical approaches for assessing coconut oil authenticity and detecting potential adulteration. Neves and Poppi (2020) [22] combined ATR-FTIR (Attenuated Total Reflectance-Fourier Transform Infrared) spectroscopy with data-driven soft independent modeling of class analogy (DD-SIMCA) to assess virgin coconut oil authenticity and identify adulteration with canola, corn, sunflower, and soybean oils. Manaf et al. (2007) [23] demonstrated the applicability of FTIR spectroscopy for detecting palm kernel olein in virgin coconut oil. More recently, Bao et al. (2023) [18] compared low-field and high-field 1H NMR spectroscopy combined with chemometric methods for differentiating virgin and refined coconut oils and investigating adulterated mixtures. Chromatographic approaches have also been explored, including the use of triacylglycerol profiles to detect and quantify the addition of palmolein and palm kernel oil to coconut oil [13]. Together, these studies demonstrate that coconut oil characterization and authenticity assessment have been addressed using several analytical techniques, with different adulterants, sample sets, and chemometric strategies.
Building on these previous investigations, commercial coconut oil samples marketed in Brazil were investigated using ATR-FTIR and 1H NMR spectroscopy combined with chemometric analysis. Gas chromatography coupled with flame ionization detection (GC-FID) analysis was used as a complementary reference for fatty acid composition, supporting the interpretation of the spectroscopic and chemometric results. To the best of our knowledge, this is the first study to report complementary ATR-FTIR, 1H NMR, and GC-FID data for commercial coconut oil samples marketed in Brazil. Rather than aiming to establish a validated authentication method, this study explores how complementary information from spectroscopic profiles and fatty acid composition can be used to characterize similarities and differences among the commercial samples investigated, relative to an in-house coconut oil reference and other oils used for comparison.
2. Materials and Methods
2.1. Materials and Reagents
Ultrapure water and hexane (Dinâmica, Indaiatuba, Brazil) were used for coconut oil extraction, and anhydrous magnesium sulfate (Dinâmica, Indaiatuba, Brazil) was used for drying the lipid extract. Isopropanol (Sigma-Aldrich, St. Louis, MO, USA) and potassium hydroxide (Vetec Química Fina Ltda, Duque de Caxias, Brazil) were used for acid value determination, while lithium chloride (Merck, Darmstadt, Germany) and ethanol (Vetec Química Fina Ltda, Duque de Caxias, Brazil) were used to prepare the filling solution for the Ag/AgCl reference electrode. Deuterated chloroform (CDCl3; Sigma-Aldrich, St. Louis, MO, USA) and tetramethylsilane (TMS; Sigma-Aldrich, St. Louis, MO, USA) were used for 1H NMR analysis. For GC-FID analysis, high-purity reagents were used for the fatty acid methyl esters (FAME) preparation, including sodium hydroxide (Merck, Darmstadt, Germany), methanol (Dinâmica, Indaiatuba, Brazil), sulfuric acid (Exodo Científica, Sumaré, Brazil), ammonium chloride (Merck, Darmstadt, Germany), sodium chloride (Neon Reagentes, Suzano Brazil), and n-heptane (Merck, Darmstadt, Germany). A 37-component FAME standard mixture (Supelco; Sigma-Aldrich, St. Louis, MO, USA), comprising methyl esters ranging from C4:0 to C24:1, was used for fatty acid identification.
2.2. Instrumentation
ATR-FTIR spectra were acquired on a PerkinElmer Spectrum 100 FTIR spectrometer (PerkinElmer, Shelton, CT, USA) (software version 10.03.07) equipped with a germanium attenuated total reflectance accessory, with a spectral resolution of 4 cm−1 and a spectral range of 4000–600 cm−1. 1H NMR spectra were acquired using Bruker DPX300 spectrometer (Bruker Biospin, Rheinstetten, Germany) (7.05 T) operating at 1H frequency of 300.13 MHz and equipped with a 5 mm direct-detection probe. Bruker TopSpin® software (version 2.1) was used for data acquisition, and version 3.5 for data processing.
A coulometric Karl Fischer titrator (KEM® MKC-610; Kyoto Electronics Manufacturing; Kyoto, Japan) was used for moisture content determination, and an automatic potentiometric titrator (KEM® AT-500N; Kyoto Electronics Manufacturing; Kyoto, Japan) equipped with a glass working electrode and an Ag/AgCl reference electrode was used for acid value determination. A Rancimat instrument (Metrohm®, model 873, Herisau, Switzerland) was used for oxidative stability analysis. Gas chromatography coupled with flame ionization detection (GC-FID) was performed using a Shimadzu® GC-2010 (Shimadzu Corporation, Kyoto, Japan) gas chromatograph equipped with a BPX-70 capillary column (Trajan Scientific and Medical, Ringwood, VIC, Australia) (30 m × 0.25 mm i.d., 0.25 μm film thickness) containing a stationary phase of 70% cyanopropyl polysilphenylene-siloxane. Helium was used as the carrier gas. The chromatographic oven was operated from 80 to 240 °C according to the temperature program described in the Appendix A.
2.3. Methods
2.3.1. Samples
Thirteen commercial coconut oil samples from different manufacturers and available in Brazil during the sampling period were analyzed. The samples were purchased from local markets and online stores. This limited set provides an exploratory snapshot of products available at that time and should not be interpreted as representative of the entire Brazilian market. In addition, palm oil, palm kernel oil, and liquid paraffin samples were analyzed as comparison materials representing potential adulterants, reported in the literature [9].
To avoid disclosing commercial brands, all samples were identified by alphabetical letters. The analyzed samples were coded as follows: reference coconut oil (J), palm oil (G), palm kernel oil (H), liquid paraffin (Q), and commercial coconut oils (A-F, I, K-P).
The in-house coconut oil reference (sample J) was registered in the National System for the Management of Genetic Heritage and Associated Traditional Knowledge (SISGEN) under code AAFF5C2 and was prepared from three dried coconuts using the following procedure. Initially, the coconut water was removed and retained. The coconut meat was then separated from the shell, ground, and homogenized together with the retained coconut water. The resulting mixture was filtered to obtain coconut milk, which was left to stand for approximately 72 h, allowing separation into aqueous and oily phases. After removal of the aqueous phase, the organic phase containing the oil was extracted with hexane to ensure complete lipid recovery. The lipid extract was then dried over anhydrous magnesium sulfate, and the solvent was removed by evaporation. The resulting coconut oil was stored in amber glass containers, protected from light, until the chromatographic and spectroscopic analyses were performed.
2.3.2. ATR-FTIR Analyses
Commercial and reference coconut oil samples, as well as potential adulterants (liquid paraffin, palm oil, and palm kernel oil), were analyzed by ATR-FTIR spectroscopy. Each sample was analyzed in triplicate using a single drop for each measurement. Data acquisition was performed using 16 accumulated scans, a spectral resolution of 4 cm−1, and a spectral range of 4000–600 cm−1.
2.3.3. 1H NMR Analyses
Reference and commercial coconut oil samples were prepared in triplicate (three separate aliquots of each sample were analyzed) by dissolving 50 mg of each sample in 500 μL of deuterated chloroform (CDCl3) containing tetramethylsilane (TMS) as an internal standard. Potential adulterants (liquid paraffin, palm oil, and palm kernel oil) were analyzed under the same experimental conditions.
The experimental parameters were 16 scans (NS), a relaxation delay (d1) of 8 s, 32k acquired data points (TD), an acquisition time (AQ) of approximately 3.4 s, and a spectral width (SW) of 16 ppm. For spectral processing, an exponential line broadening (LB) of 0.3 Hz was applied prior to Fourier transformation. Phase and baseline corrections were performed manually, and the TMS signal was used as the chemical shift reference at 0.00 ppm.
2.3.4. Reference Coconut Oil
ATR-FTIR (cm−1) 2956, 2922, 2853, 1743, 1466, 1378, 1229–1111, 722; 1H NMR (300 MHz, CDCl3) δ (ppm) 5.33–5.28 (m, 2H, CH=CH, olefinic moiety), 5.27–5.18 (m, 1H, CH-OCO-R, glycerol sn-2 moiety), 4.26 and 4.10 (dd, 2H, J 11.9, 4.2, -CH2-OCO-R, glycerol sn-1,3 moiety), 2.73 (t, 2H, J 6.9, =CH-CH2-CH=; bis-allylic; in a very small intensity), 2.27 (t, 2H, J 7.5, -OCO-CH2-CH2), 2.00–2.10 (m, 2H, -CH=CH-CH2, allylic), 1.64–1.51 (m, 2H, -OCO-CH2-CH2), 1.32–1.20 (m, (CH2)n), 0.88 (t, 3H, J 6.9, CH3); GC-FID (FAMEs) C6:0, C8:0, C10:0, C11:0, C12:0, C13:0, C14:0, C18:0, C18:1n9c, C18:2n6c, C18:3n6, C20:0, C20:1, C20:4n6, C22:0, C24:0.
2.3.5. Chemometrics
Chemometric analysis of both data matrices was carried out using Pirouette software (version 4.0; Infometrix, Inc., Bothell, WA, USA). Principal component analysis (PCA), an unsupervised pattern recognition method used for exploratory data analysis, was applied to evaluate sample clustering and identify spectral patterns. The PCA score and loading plots were generated using R (version 4.6.1) in RStudio (version 2026.09.0+174, “Autumn Hawkbit” Release) for Windows.
The ATR-FTIR data matrix was generated in Excel 2013 using all data points from the spectra. The data matrix was preprocessed using Pirouette software (version 4.0) by applying multiplicative scatter correction (MSC) to correct spectral irregularities related to light scattering, thereby linearizing the spectral data and minimizing non-informative sources of variability [24]. Additionally, normalization and Pareto scaling were applied to reduce variability associated with sample amount and to balance the contribution of spectral variables to the PCA, reducing the dominance of high-intensity bands while preserving the relative importance of variables according to their original variance. The spectral regions from 4000 to 3100 cm−1 and from 2700 to 1800 cm−1 were excluded to minimize the influence of spectral noise, performing 3401 variables.
The 1H NMR data matrix was generated using AMIX 3.8 software (Bruker Biospin, Billerica, MA, USA). Pareto scaling and normalization were applied using Pirouette software (version 4.0) to minimize concentration variations. The spectra were segmented into uniform rectangular buckets (0.04 ppm width) over the spectral region from 5.5 to 0.5 ppm. The noise regions from 5.12 to 4.52 ppm and from 3.92 to 2.92 ppm were excluded according to the selected data-processing window used for this exploratory analysis, performing 125 variables.
2.4. Supplementary Characterization
2.4.1. Moisture Content
The moisture content was determined according to AOCS Official Method Ca 2e-84 using a Karl Fischer coulometric titrator [15].
A 2.0 mL aliquot of each sample was transferred into a previously weighed 5 mL syringe, which was then weighed again to determine the sample mass. After the instrument reached an acceptable drift value, the sample was introduced into the titration cell, and the automatic titration was initiated. Upon completion of the analysis, the masses of the empty syringe and the syringe containing the sample were entered into the instrument software, which calculated the exact sample mass analyzed. The moisture content was expressed as water content in ppm (parts per million).
2.4.2. Acid Value
The acid value was determined according to AOCS Official Method Ca 5-40 [15]. The analyses were performed using an automatic potentiometric titrator equipped with glass working electrode and an Ag/AgCl reference electrode filled with 1.0 mol L−1 LiCl in ethanol [15].
Before analysis, a 1.0 mol L−1 potassium hydroxide solution in isopropanol was prepared for instrument calibration. The solution was gently heated for approximately 10 min to facilitate the dissolution of potassium hydroxide crystals in the solvent and remove dissolved carbon dioxide.
For acid value determination, 10.0 g of each sample was weighed into a beaker and dissolved in 50.0 mL of isopropanol. The samples were titrated under constant magnetic stirring.
The acid index was calculated using the equation implemented in the titrator and expressed as milligrams of potassium hydroxide per gram of sample (mg KOH g−1).
where A is the volume of KOH solution consumed during sample titration (mL); B is the volume of KOH solution consumed during blank titration (mL); C is the standardized concentration of the KOH solution (mol L−1); M is the mass of sample (g); and 56.1 corresponds to the molar mass of potassium hydroxide (KOH) (g mol−1).
2.4.3. Oxidative Stability
Oxidative stability was determined using a Rancimat instrument. For the analysis, 3.0 g of each sample was weighed into a reaction vessel, which was placed in the instrument and heated at 110 °C (temperature correction: 0.9 °C) [25]. Two tubes were connected to the reaction vessel. One supplied a constant airflow of 10 L h−1, whereas the other was connected to the vessel to the conductivity measurement cell. The oxidative stability (induction time) was determined from the conductivity curve generated by the instrument software.
2.4.4. Iodine Value
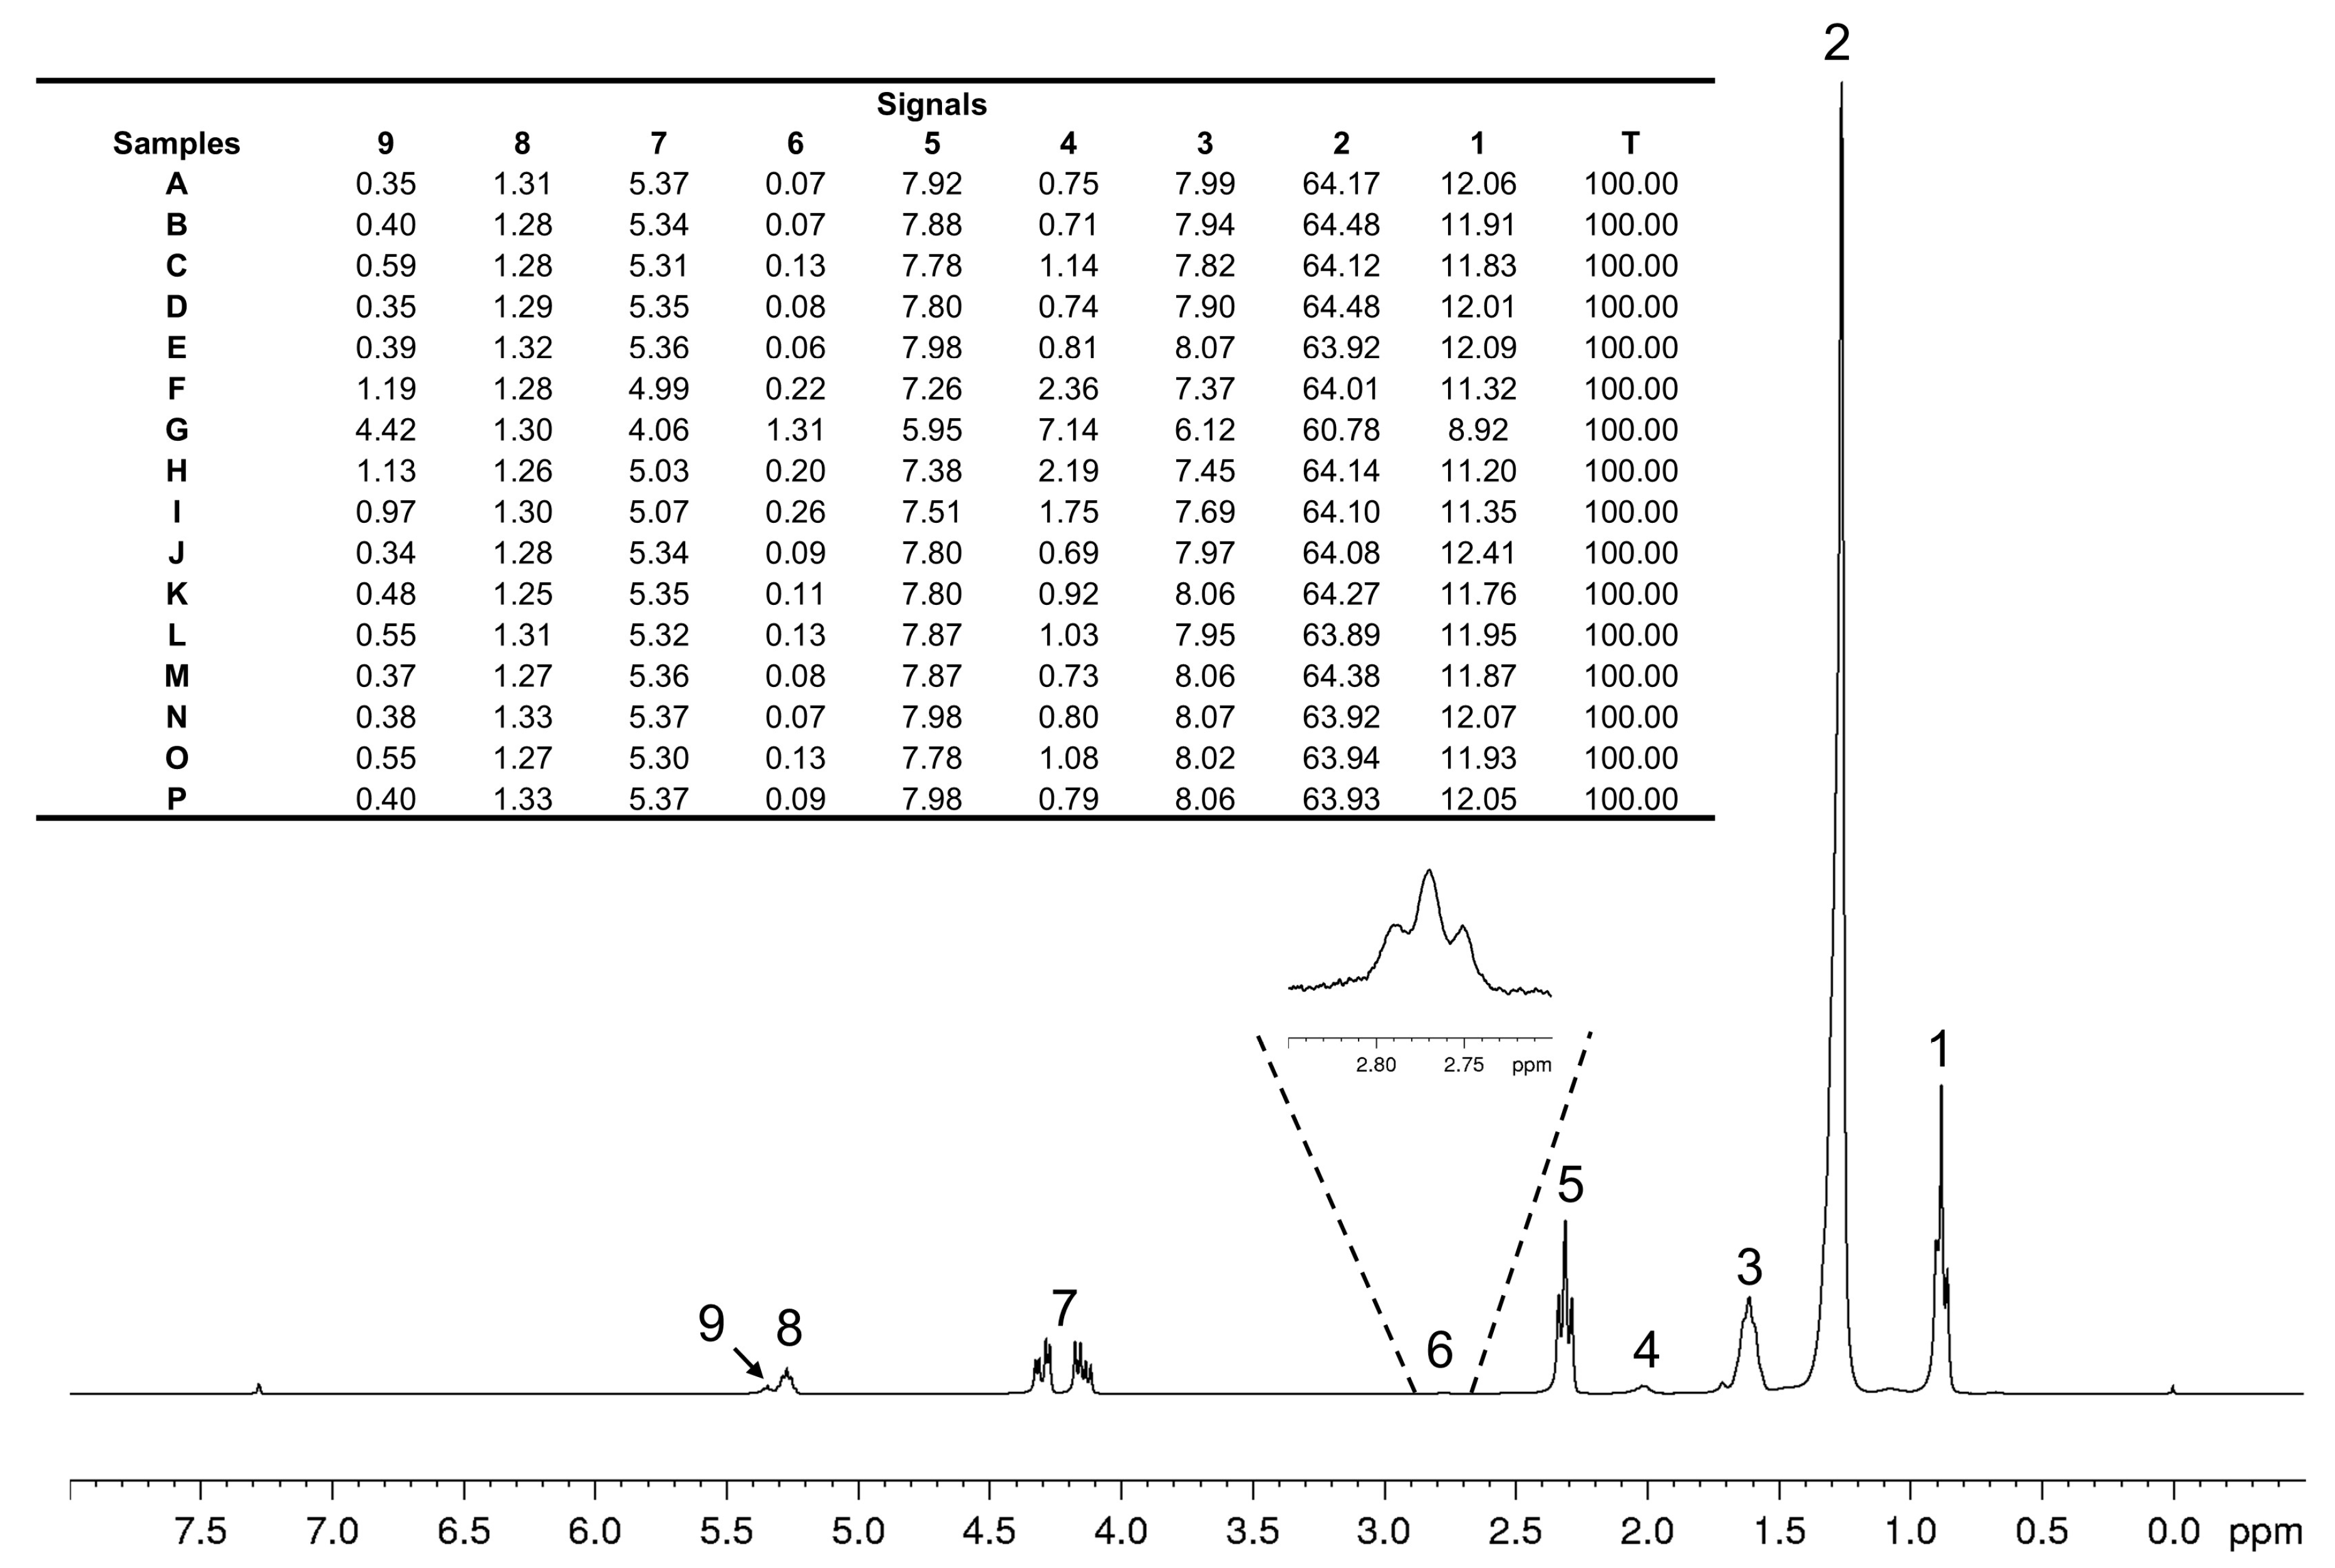
The iodine values (IV) were estimated from the 1H NMR spectra according to the method described by Guillén and Ruiz (2003) [26], based on the integration of olefinic proton signals and the total spectral area. Briefly, the integrated area of the olefinic proton signals (5.31–5.40 ppm), designated as F, was determined, along with the total integrated spectral area, designated as T. The total spectral area was normalized to 100, and the normalized integral corresponding to the olefinic proton region was used in the calculation. The IV was estimated using the following equation:
where F represents the normalized integral of the olefinic proton signals and T represents the normalized total spectral area. The integration regions normalized areas used for the calculations are illustrated in Figure A2.
2.4.5. GC-FID Analysis
The coconut oil samples were analyzed by gas chromatography coupled with flame ionization detection (GC-FID) after derivatization, according to AOCS Official Method Ce 1-62 [15].
The analyses were performed using a gas chromatograph equipped with a BPX-70 capillary column (30 m × 0.25 mm i.d., 0.25 μm film thickness) containing a stationary phase of 70% cyanopropyl polysilphenylene-siloxane. Helium was used as the carrier gas. The GC-FID operating conditions are summarized in Table A1 (Appendix A).
The initial oven temperature was set at 80.0 °C and maintained for 3.0 min. The temperature was then increased at a rate of 10.0 °C min−1 to 140.0 °C, followed by a second temperature ramp of 5.0 °C min−1 to 240.0 °C, which was maintained for 5 min.
The samples were injected using an automatic injector with a 1 μL injection volume in split mode. A 37-component FAME standard mixture was used to identify the fatty acid constituents. First, the reference mixture of fatty acid methyl esters (C4:0 to C24:1) was analyzed to establish retention times. The resulting retention times were then used to identify the fatty acids present in the oil samples [15,27].
The relative percentages of fatty acids were calculated from the integrated chromatographic peak areas, applying response correction factors in the quantification procedure. The normalization denominator included chromatographic peaks that could not be assigned to specific FAMEs by comparison with the retention times of the reference standards. Only identified FAMEs were included in the reported fatty acid composition tables; consequently, the sum of the reported percentages may be below 100%.
A single chromatographic injection was performed for each sample. Therefore, replicate-injection data were not available to estimate analytical variability, and standard deviations and coefficients of variation could not be calculated. This limitation should be considered when interpreting the GC-FID results.
3. Results and Discussion
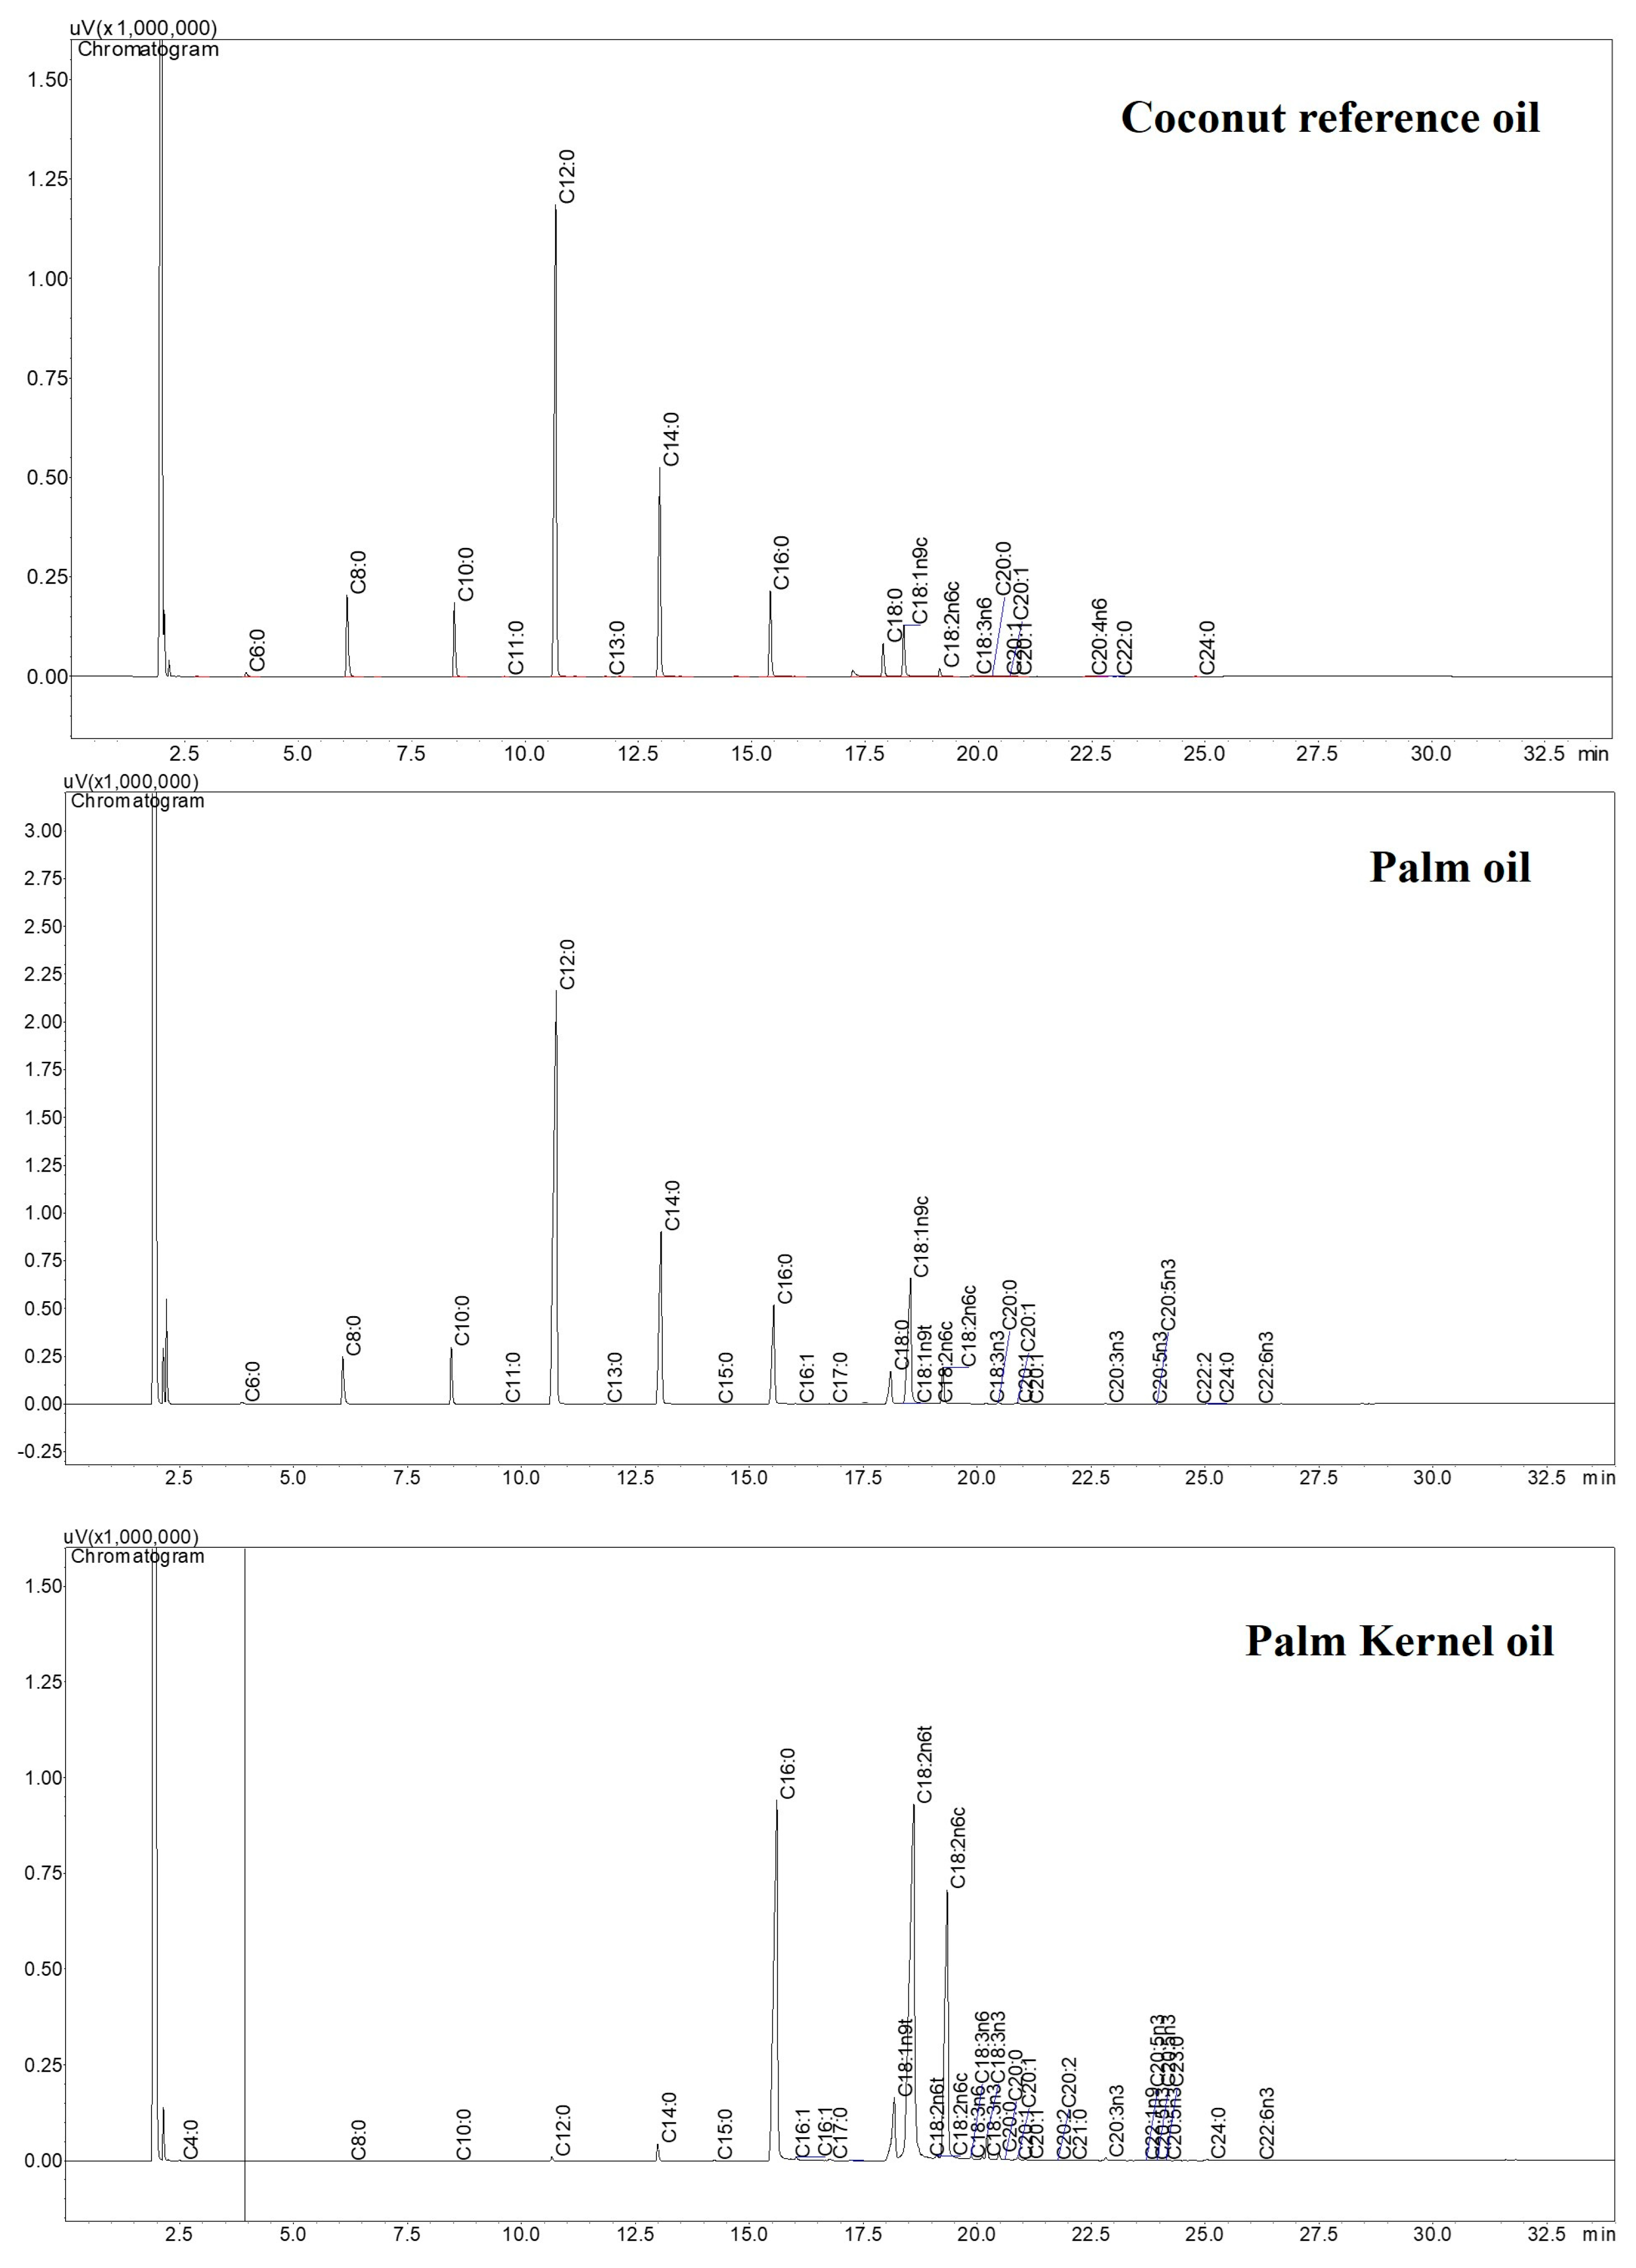
The samples were initially characterized by physicochemical and chromatographic analyses to provide complementary information for the spectroscopic evaluation. These complementary analyses included the determination of moisture content, acid value, oxidative stability, iodine values and fatty acid composition by GC-FID through comparison with FAME reference standards (C4:0–C24:0). For GC-FID, the relative percentages were calculated using a normalization denominator that included chromatographic peaks that could not be assigned to specific FAMEs by comparison with the reference-standard retention times. Consequently, only identified FAMEs were listed in the fatty acid composition tables, and the sum of the reported percentages may be below 100%. The physicochemical results showed variation among the analyzed samples, whereas the fatty acid profiles (Figure A1, Appendix A) were consistent with the expected composition of coconut oil and provided a basis for differentiating coconut oil from palm and palm kernel oils. Detailed results of these analyses, including the physicochemical parameters and chromatographic profiles, are provided in Appendix A (Table A2 and Table A4). Overall, these data provided additional information on the quality and fatty acid composition of the samples and supported the interpretation of the subsequent ATR-FTIR and 1H NMR results.
3.1. ATR-FTIR Spectral Profiles of Coconut Oil Samples
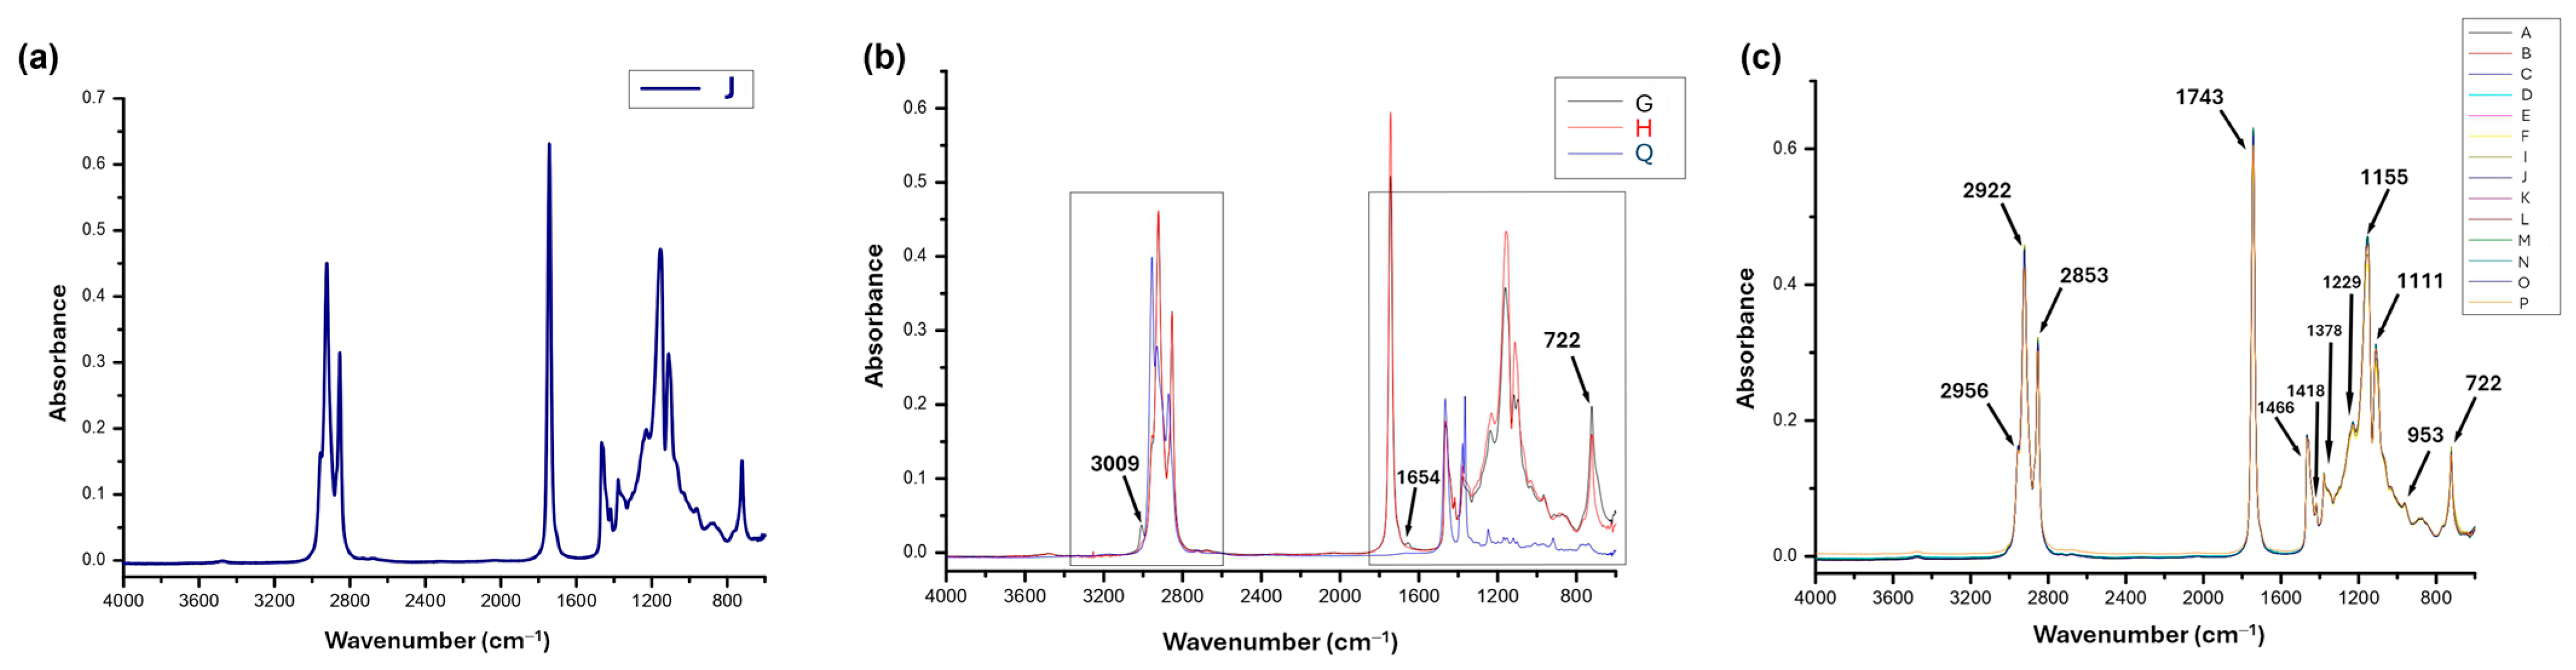
The FTIR spectrum of the reference coconut oil (Figure 1a) showed the characteristic bands of triacylglycerols, including the CH2 and CH3 stretching vibrations (2956–2853 cm−1), ester carbonyl stretching (1743 cm−1), the C–O stretching bands (1229–1111 cm−1), CH2/CH3 bending vibrations (1466 and 1378 cm−1), and the long-chain CH2 rocking vibration at 722 cm−1, although a minor contribution from the out-of-plane deformation of cis C=C–H groups cannot be excluded, consistent with the predominance of saturated fatty acids.
Figure 1.
ATR-FTIR spectral profiles of (a) reference coconut oil (J); (b) potential adulterants, including palm oil (G), palm kernel oil (H), and liquid paraffin (Q); and (c) commercial coconut oil samples (A–F, I, K–P).
When compared with potential adulterants (Figure 1b), liquid paraffin (Q) displayed spectral features similar to those of palm oil (G) and palm kernel oil (H) in the 3100–2800 cm−1 region because all three samples contain predominantly sp3 C–H bonds. In contrast, liquid paraffin (Q) exhibited a markedly different spectral profile in the 1400–600 cm−1 region owing to the absence of C–O bonds and the characteristic long-chain CH2 vibrations present in vegetable oils.
Palm oil (G) and palm kernel oil (H) exhibited FTIR profiles more similar to that of coconut oil (J) than did liquid paraffin (Q), although differences were observed in the intensities of the bands associated with unsaturated fatty acids. Palm oil (G) was distinguished by the higher intensity of the bands at 3009 cm−1 (C–H sp2 stretching), 1654 cm−1 (C=C stretching), and 722 cm−1 (cis CH=CH bending), reflecting its higher unsaturated fatty acid content. In contrast, palm kernel oil (H) closely resembled coconut oil because of its predominance of lauric acid (Table A4, Appendix A).
Likewise, the ATR-FTIR spectra of the commercial coconut oils exhibited the same characteristic absorption bands as those of the reference oil (Figure 1c), indicating a broadly similar chemical composition.
3.2. 1H NMR Spectral Profiles of Coconut Oil Samples
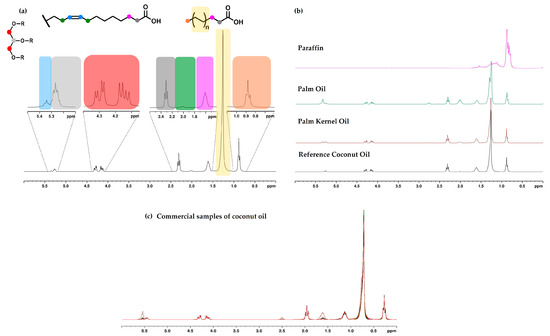
The 1H NMR spectrum of the reference coconut oil (Figure 2a) displayed the characteristic signals of saturated fatty acid chains, including the intense multiplet at 1.24 ppm assigned to the methylene protons [-(CH2)n-]. The signals at 0.88, 1.60, and 2.30 ppm were assigned to terminal methyl, β-methylene, and α-methylene protons, respectively. Signals of lower intensity, corresponding to unsaturated fatty acids, were observed at 5.30 ppm (olefinic protons) and between 2.0 and 2.8 ppm (allylic and bis-allylic protons), indicating the presence of minor amounts of unsaturated fatty acids, mainly oleic and linoleic acids. In particular, the bis-allylic proton signals were observed at very low intensity, consistent with the low C18:2 content (0.71%) determined by GC-FID for the reference coconut oil (J) (Table A3, Appendix A).
Figure 2.
1H NMR spectral profiles (300 MHz, CDCl3) of (a) reference coconut oil (sample J), with typical assignments of fatty acids and glycerol signals; (b) potential adulterants, including liquid paraffin (Q), palm oil (G), and palm kernel oil (H); and (c) commercial coconut oil samples (A–F, I, K–P).
Comparison of the 1H NMR spectral profile of reference coconut oil with those of the potential adulterants (Figure 2b) showed that liquid paraffin displayed a simplified and easily distinguishable spectrum, whereas palm oil and palm kernel oil exhibited spectral differences mainly associated with the higher intensity of resonances arising from unsaturated fatty acids, particularly in the regions of 2.70–2.80 ppm (bis-allylic protons) and 5.30–5.40 ppm (olefinic protons). Likewise, the 1H NMR spectra of commercial samples (Figure 2c) revealed the same characteristic signals observed in the reference oil, with comparable signal intensities.
Overall, the comparative analysis of the ATR-FTIR and 1H NMR spectra demonstrated a high degree of similarity among the analyzed oils, reflecting their closely related chemical compositions. Nevertheless, this similarity hindered the visual identification of subtle compositional differences and patterns potentially associated with differences in fatty acid composition, thereby emphasizing the need for chemometric analysis to facilitate the visualization of sample similarities and differences.
3.3. Chemometric Analysis of ATR-FTIR and 1H NMR Spectral Data
As indicated by both the FTIR (Figure 1b) and 1H NMR (Figure 2b) data, liquid paraffin, one of the potential adulterants reported in the literature [9], exhibited a spectral profile clearly distinct from those of the vegetable oils because of its chemical composition. Consequently, liquid paraffin was excluded from the chemometric analysis, which was performed using only the spectral data of the reference and commercial coconut oils together with the two remaining potential adulterants (palm oil and palm kernel oil).
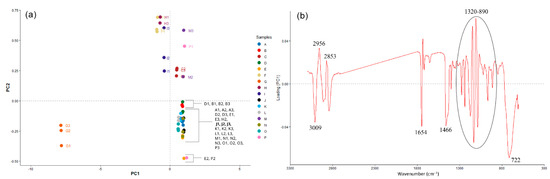
For the ATR-FTIR spectral data obtained in triplicate, the PCA scores plot (Figure 3a) revealed that most commercial coconut oil samples did not exhibit significant separation and were located in the positive region of Factor 1, close to the reference coconut oil (sample J), indicating high compositional similarity. In contrast, palm kernel oil (H) was clearly separated along the negative side of Factor 1, where commercial samples F and I were also located. This proximity indicates spectral similarity between these samples and palm kernel oil.
Figure 3.
PCA scores plot (a) (Factor 1 × Factor 2, 95.5% and 2.2%, respectively) and factor 1 loading plot (b) obtained from ATR-FTIR data of reference coconut oil (sample J), palm oil (G), palm kernel oil (H), and commercial coconut oils (A–F, I, K–P).
In contrast, palm oil (G1, G2, and G3) maintained a clearly distinct spectral profile, mainly due to the absorption bands associated with unsaturated fatty acids, particularly those at 3009 cm−1 and 722 cm−1, which contributed strongly to its separation in the PCA scores plot. This behavior reflects the higher proportion of unsaturated fatty acids in palm oil. In addition, the band at 1654 cm−1 assigned to cis C=C sp2 stretching further supports the higher degree of unsaturation observed in this oil (Figure 3b).
The bands associated with CH2 and CH3 stretching also contributed to the separation of the samples. The bands at 2853 and 2956 cm−1, corresponding to the symmetric CH2 and asymmetric CH3 stretching vibrations, respectively, showed high loadings, reflecting differences in the fatty acid composition, particularly chain length and degree of unsaturation, among the analyzed oils (Figure 3b).
Similarly, the band at 1466 cm−1, assigned to CH2 bending vibrations, contributed to the separation of the samples, reflecting differences in the abundance and chemical environment of methylene groups resulting from the distinct fatty acid compositions of coconut (J) and palm (G) oils (Figure 3).
Furthermore, the reference coconut oil (J), palm oil (G), and palm kernel oil (H) differed in the spectral region from 1320 to 890 cm−1, which is mainly associated with C–O stretching vibrations. The band at 722 cm−1, assigned to the out-of-plane cis bending vibration of–CH=CH–, showed a high loading, contributing to the differentiation between coconut oil (J) and the other vegetable oils as a consequence of differences in the degree of unsaturation. Therefore, the variables with negative loadings on Factor 1 were mainly associated with the higher degree of unsaturation observed for palm oil (G), reflecting its greater content of unsaturated fatty acids (Figure 3b).
Palm kernel oil (H) clustered in the positive region of Factor 2, reflecting the predominance of saturated fatty acids, whereas palm oil (G), which contains a higher proportion of unsaturated fatty acids, clustered in the negative region of Factor 2 (Figure 3a). These results indicate that FTIR spectroscopy combined with PCA can reveal differences in the spectral profiles of coconut oil and the comparison oils, in agreement with Amit and coauthors [8], who also demonstrated the potential of ATR-FTIR spectroscopy combined with chemometric analysis for detecting adulteration in virgin coconut oil.
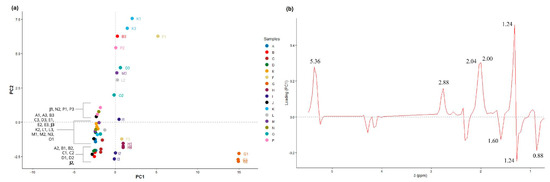
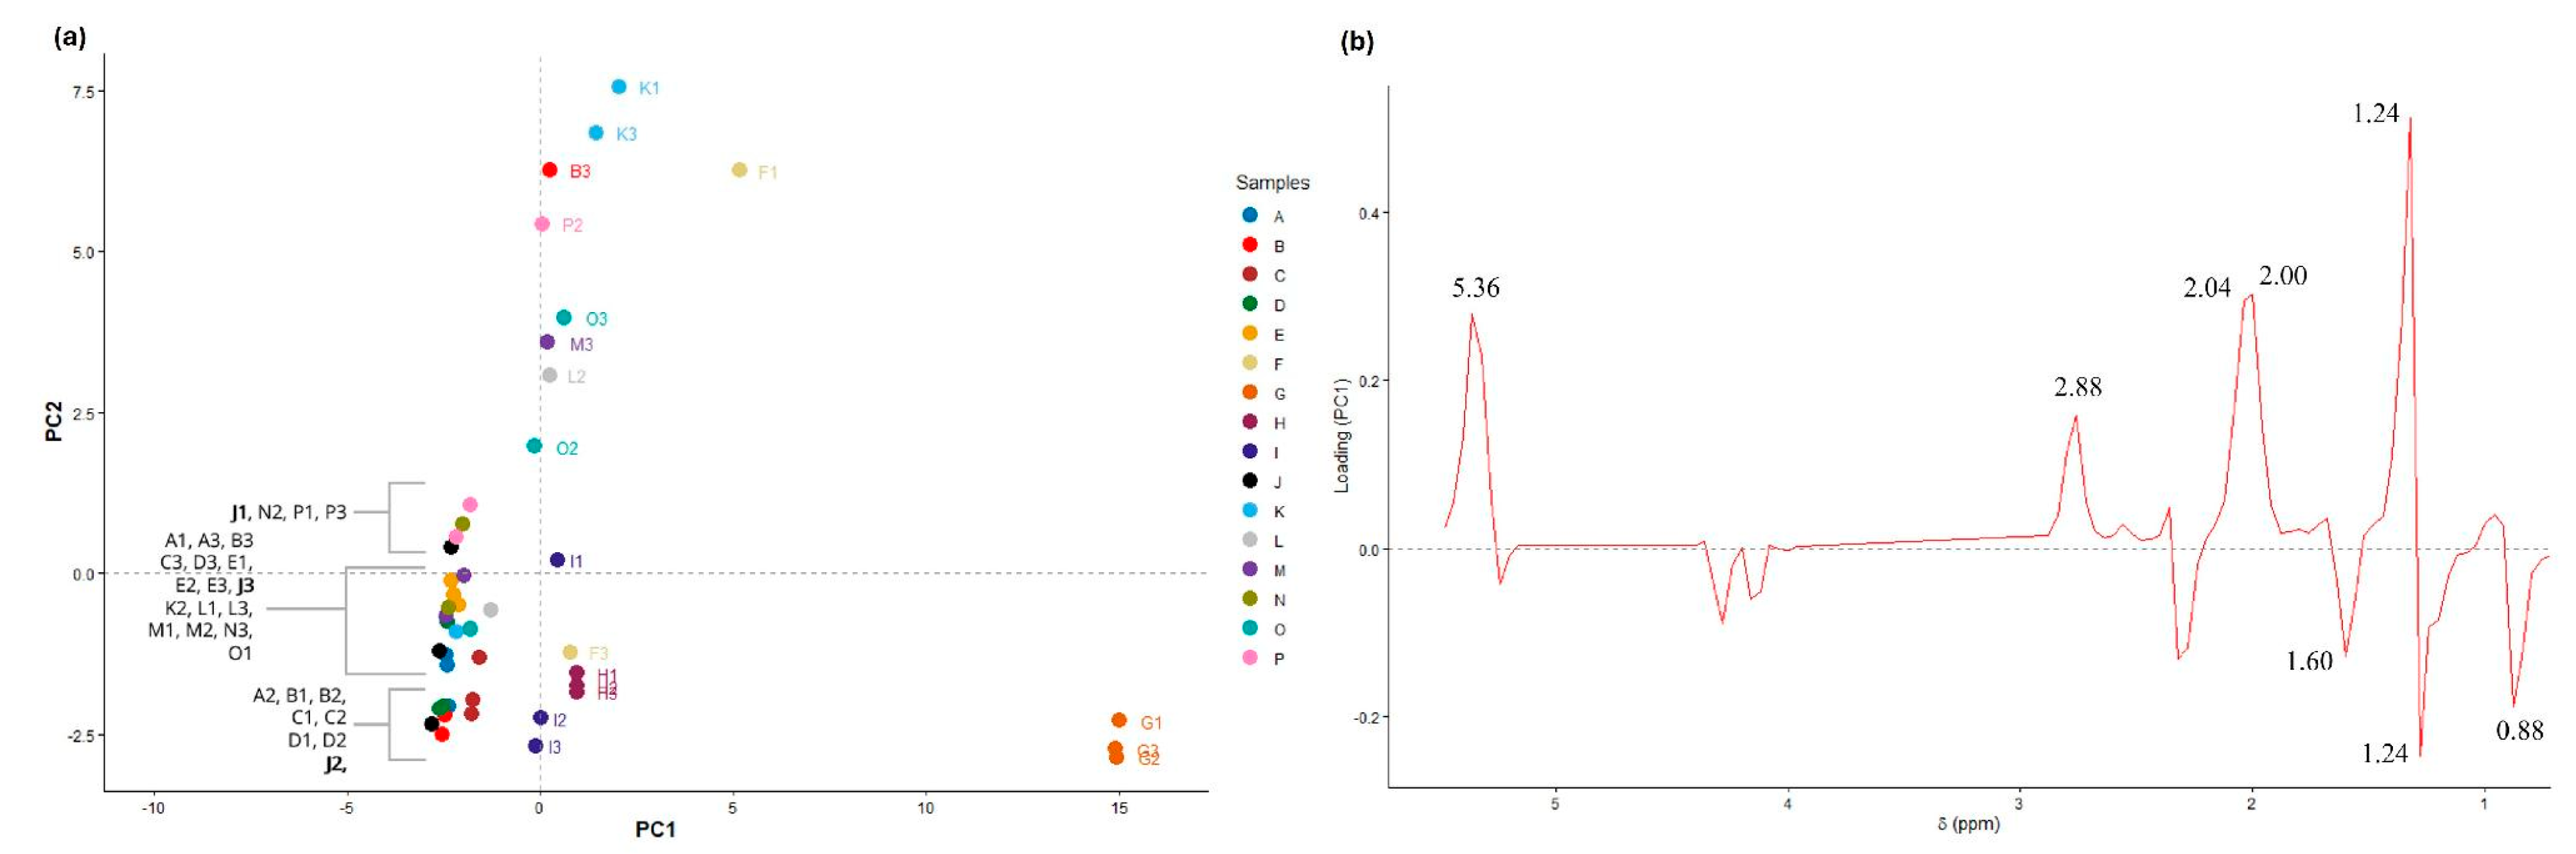
Looking into the PCA with the NMR data, the loading plot further confirmed the contribution of unsaturated fatty acids to the separation observed among the samples. The variables responsible for the positioning of the palm oil samples (G) in the positive region of Factor 1 corresponded to the chemical shifts at 5.36, 2.88, and 2.00–2.04 ppm (Figure 4b). These signals were assigned to olefinic protons (5.36 ppm) and bis-allylic protons (2.88 ppm), typical in polyunsaturated fatty acids. The signals at 2.00–2.04 ppm were assigned to allylic protons associated with unsaturated fatty acids. These findings are consistent with the higher proportion of unsaturated fatty acids in palm oil (G), resulting in a clear distinction from the reference coconut oil (J). It is worth noting that olefinic proton signals are associated with unsaturated fatty acids in general and are not specific to linoleic acid. Bis-allylic proton signals, in contrast, provide more specific evidence of polyunsaturated fatty acid residues. In the reference coconut oil (J), these signals were observed at very low intensity, in agreement with its low C18:2 content determined by GC-FID (0.71%).
Figure 4.
PCA scores plot (a) for Factor 1 and Factor 2, which explained 55.4% and 35.6% of the variance, respectively, and factor 1 loading plot (b) obtained from 1H NMR data of reference coconut oil (J), palm oil (G), palm kernel oil (H), and commercial coconut oils (A–F, I, K–P).
Additionally, the negative region of Factor 1 was mainly associated with loadings corresponding to the signals at 0.88, 1.24, and 1.60 ppm (Figure 4b). The signal at 0.88 ppm was assigned to terminal methyl protons of fatty acid chains, whereas the signal at 1.24 ppm corresponded to methylene protons from the aliphatic chains [–(CH2)n–], and the signal at 1.60 ppm was attributed to the β-methylene protons relative to the carbonyl group. Together, these signals contributed to the clustering of the reference coconut oil (J), some commercial coconut oil samples, and palm kernel oil (H) in the negative region of Factor 1, reflecting the higher contribution of saturated fatty acids in these samples (Figure 4).
As observed with the ATR-FTIR data, the NMR data are in agreement, showing that the palm kernel oil samples (H) differentiated slightly from the reference coconut oil (J), and both samples were located close to the origin along Factor 1 (Figure 4a), indicating a higher contribution of saturated fatty acids compared to palm oil (G). Nevertheless, most commercial coconut oil samples (A-E and L-P) cluster close to the reference coconut oil sample (J), indicating a high similarity in their chemical compositions. Samples F and I were positioned close to sample H (palm kernel oil) (Figure 4a), suggesting a possible adulteration with this oil. Conversely, a dispersed group of commercial coconut oil samples was observed in the positive region of Factor 2 (Figure 4a), showing differences in fatty acid composition (Table A3, Appendix A). Since these variations remained within the limits established by the Codex Alimentarius (2025) [11], the results suggest that these differences may be associated with the origin of the raw material, processing conditions, or production practices rather than necessarily indicating adulteration.
In summary, the application of PCA to ATR-FTIR and 1H NMR spectral data enabled a detailed assessment of the differences and similarities among the studied samples. For both analytical techniques, palm oil (G) was consistently separated from the other samples due to its higher content of unsaturated fatty acids. The reference coconut oil (J) and palm kernel oil (H) exhibited greater similarity, consistent with the high proportion of saturated fatty acids in their profiles.
For the commercial coconut oil samples, most clustered close to the reference coconut oil (J), indicating similarity in composition. However, two samples (F and I) showed greater proximity to the palm kernel oil profile, indicating a spectral similarity that warrants further investigation (Figure 4a).
Furthermore, the isolated physicochemical characterization did not provide conclusive evidence of adulteration, since all parameters complied with the limits established by the Codex Alimentarius [11]. The GC-FID analysis provided additional information on fatty acid composition, showing the predominance of lauric acid (C12:0) in the authentic coconut oil (J), as well as the high compositional similarity between coconut oil (J) and palm kernel oil (H), whereas palm oil (G) exhibited a different fatty acid profile due to its higher content of unsaturated fatty acids. The reference coconut oil (J) contained 0.71% C18:2 according to GC-FID (Table A3), consistent with the very low-intensity bis-allylic proton signals observed in its 1H NMR spectrum. Nevertheless, although GC-FID and 1H NMR provided complementary information on fatty acid composition, direct quantitative equivalence between the two techniques cannot be inferred from the available data. These data are described in Appendix A.
Overall, the combined application of ATR-FTIR and 1H NMR spectroscopy, together with the complementary GC-FID fatty acid profiles, and supported by chemometric analysis, provided complementary information on the chemical profiles of the commercial coconut oils and enabled the visualization of similarities and differences among the samples. The integration of these analytical approaches therefore provided a broader chemical characterization of the samples than could be achieved using any single technique alone.
4. Conclusions
ATR-FTIR and 1H NMR spectroscopy, combined with chemometric analysis, provided information on the chemical profiles of the samples, revealing similarities and differences among the commercial coconut oils and the comparison oils. The physicochemical parameters and fatty acid composition determined by GC-FID provided additional information for interpreting the observed spectral patterns, but the physicochemical parameters considered individually were insufficient to differentiate the samples, as all samples complied with the limits established by the Codex Alimentarius (2025) [11]. Overall, the findings highlight the potential of ATR-FTIR and 1H NMR spectroscopy combined with chemometrics for the exploratory chemical characterization of commercial coconut oils. Nevertheless, the absence of controlled mixtures containing different proportions of potential adulterants limits the assessment of the analytical performance of the proposed approaches, particularly regarding their detection limits and ability to identify adulteration at different levels. Further studies involving a larger set of reference samples, controlled mixtures at different adulteration levels, and validated chemometric models are required to establish the sensitivity and reliability of these techniques and support their application in coconut oil authentication and adulteration detection.
Author Contributions
M.S.A.B., G.C.G., L.M.R., and P.D.d.O. contributed to data analysis and interpretation and to the writing of the manuscript. L.C.C.V., L.M.R., G.B.A., and T.I.B.L. contributed to the NMR experiments and analysis and interpretation of the NMR data. R.W.A.G., C.E.D.N., L.F.C. and S.L.O. contributed to the GC-FID and ATR-FTIR experiments and to the analysis and interpretation of the corresponding data. G.B.A. supervised the research and contributed to the discussion and interpretation of the results. All authors have read and agreed to the published version of the manuscript.
Funding
This research was funded by Fundação de Apoio ao Desenvolvimento do Ensino, Ciência, e Tecnologia de Mato Grosso do Sul (Fundect/MS), grant numbers 23104.016018/2022–84; 71/020.168/2021; 71/038.233/2022; 71/032.446/2022; 83/026.537/2023; Conselho Nacional de Desenvolvimento Científico e Tecnológico (CNPq), grant numbers 312595/2021-2; 427221/2018-8; Coordenação de Aperfeiçoamento de Pessoal de Nível Superior-Brasil (CAPES)–Finance Code 001; and FINEP, grant number 0113.0358.00.
Institutional Review Board Statement
Not applicable.
Informed Consent Statement
Not applicable.
Data Availability Statement
The original data presented in the study are openly available in FigShare at 10.6084/m9.figshare.34037661.
Acknowledgments
The authors acknowledge the support provided by the Federal University of Mato Grosso do Sul (UFMS). The AI tool (ChatGPT, GPT-5.6 Luna) was used exclusively for language editing (grammar and spelling). The authors have reviewed and edited the output and take fully responsible for the content of this publication.
Conflicts of Interest
The authors declare no conflicts of interest.
Abbreviations
The following abbreviations are used in this manuscript:
| FTIR | Fourier transform infrared |
| 1H NMR | Proton nuclear magnetic resonance |
| UNCTAD | United Nations Conference on Trade and Development |
| ANVISA | Brazilian Health Regulatory Agency |
| AOCS | American Oil Chemists’ Society |
| PCA | Principal Component Analysis |
| GC-FID | Gas chromatography coupled with flame ionization detection |
| CDCl3 | Deuterated chloroform |
| TMS | Tetramethylsilane |
| FAME | Fatty acid methyl esters |
| ATR | Attenuated Total Reflectance |
| SISGEN | National System for the Management of Genetic Heritage and Associated Traditional Knowledge |
| NS | Number of scans |
| d1 | Relaxation delay |
| TD | Acquired data point |
| AQ | Acquisition time |
| SW | Spectral width |
| LB | Exponential line broadening |
| MSC | Multiplicate scatter correction |
| ppm | Parts per million |
| Ag/AgCl | Silver/silver chloride |
| LiCl | Lithium chloride |
| KOH | Potassium hydroxide |
Appendix A
Table A1.
Chromatographic conditions for determining the fatty acid profile of reference and commercial coconut oils, palm oil, and palm kernel oil.
Figure A1.
Representative chromatogram of reference coconut oil (J), palm oil (G) and palm kernel oil (H) sample obtained by GC-FID analysis.
Appendix A.1. Physicochemical Characterization
The determination of moisture content by Karl Fischer titration revealed values ranging from 0.04 to 0.09%, all of which were below the limit established by the Codex Alimentarius (up to 0.2% for virgin and extra-virgin coconut oils) (Table A2). The reference oil (J) had a moisture content of 0.06%, which also complied with the limit of 0.5% established for crude oils. The lowest water concentrations were observed in palm and palm kernel oils, whereas the highest levels were detected in commercial samples P and M. Although the absolute differences were small, higher moisture content may favor triacylglycerol hydrolysis and free fatty acid formation, potentially affecting oil stability and storage quality.
The acid values ranged from 0.028 to 1.063 mg KOH g−1. According to the Codex Alimentarius, the maximum acid value depends on the processing category of the oil: the limit is 0.6 mg KOH g−1 for refined oils, whereas a limit of 4.0 mg KOH g−1 applies to cold-pressed and virgin oils, subject to the conditions specified in the standard. Samples J, I, and O exhibited acid values above the limit for refined oils, but below the limit for cold-pressed and virgin oils (Table A2). Because the processing category of each commercial sample could not be independently confirmed from the available information, compliance with a specific processing-category limit cannot be established for these samples. Higher acid values were associated with higher moisture contents, supporting the relationship between water content and hydrolysis, which increases the formation of free fatty acids [28].
Oxidative stability (Table A2) showed a wide variation in induction times (9.72 to 178.82 h). Samples C, D, E, K, L, M, and P exhibited the longest induction times, which may be related to their low acidity and moisture values, as well as the possible presence of natural antioxidants preserved during cold extraction [29,30]. In contrast, samples J, F, and O exhibited the shortest induction times (28.43, 34.03, and 20.72 h, respectively), which may be associated with their higher moisture and acidity contents. Samples A, B, I, and N showed variable oxidative stability. Overall, these physicochemical analyses alone were insufficient to identify potential adulteration among the analyzed samples.
The estimation of the iodine value (IV) from 1H NMR spectra provides an alternative approach for assessing the degree of unsaturation of vegetable oils. Guillén and Ruiz (2003) [26] and Vigli et al. (2003) [31] demonstrated that quantitative analysis of 1H NMR signals can be used to estimate parameters related to unsaturation and the composition of acyl groups in vegetable oils. The estimated values are presented in Table A2.
The iodine values (IV) ranged from 5.16 to 66.14 among the analyzed samples. Most commercial coconut oil samples showed values within the range specified by the Codex Alimentarius (6.3–10.6) and were consistent with values reported for commercial virgin coconut oils (4.47–8.55) [32,33]. In contrast, samples F and I exhibited higher estimated IV (18.19 and 14.82, respectively). These elevated values are consistent with the greater spectral proximity of these samples to palm kernel oil (H) observed in the PCA (Figure 4), suggesting differences in their overall degree of unsaturation. Samples F and I also exhibited relatively short oxidative induction times (34.03 and 42.15 h, respectively). This behavior may be partly associated with their higher iodine values, as oils containing higher proportions of unsaturated fatty acids are generally more susceptible to oxidative deterioration due to the presence of double bonds, particularly in polyunsaturated fatty acids. Similar relationships between fatty acid unsaturation and oxidative behavior have been reported in studies involving vegetable oils [34,35].
Table A2.
Water content, acid value, and oxidative stability of reference coconut oil (J), palm oil (G) and palm kernel oil (H) and commercial coconut oils (A-F, I, K-P).
Figure A2.
Representative 1H NMR spectrum of coconut oil, showing the integrated signals and their respective normalized areas, with the total spectral area set to 100. Signal numbering indicates the regions used for integration.
Appendix A.2. Fatty Acid Composition by GC-FID
The fatty acid profiles obtained by GC-FID were consistent with those previously reported in the literature [36,37]. GC-FID was used to determine the relative fatty acid composition after derivatization to fatty acid methyl esters (FAMEs), following the procedure described above. Fatty acids were identified by comparison of their retention times with those of a 37-component FAME reference mixture, and their relative percentages were calculated from the integrated FAME peak areas. The complete fatty acid composition data are provided in Table A3 and Table A4.
The fatty acid profiles obtained by GC-FID were compared with the reference ranges established by the Codex Alimentarius Standard for Named Vegetable Oils (CXS 210-1999) [11]. Although the laboratory-prepared reference coconut oil (sample J) exhibited a characteristic coconut oil profile, with lauric acid (C12:0, 48.32%) and myristic acid (C14:0, 18.88%) as the predominant fatty acids, some individual fatty acid percentages fell outside the reference ranges specified by the Codex. These included C16:0 (7.44%, compared with 7.5-10.2%), C18:1 (4.68%, compared with 5.0-10.0%), and C18:2 (0.71%, compared with 1.0-2.5%). However, the commercial sample I exhibited a lauric acid content (40.22%) below the Codex reference range (45.1-53.2%). An additional deviation was observed for sample O, which presented a C18:3 content of 1.67%, considerably higher than the Codex reference range (ND–0.2%). This result was retained as determined by GC-FID and highlights the variability in fatty acid composition among the commercial coconut oil samples analyzed. Although this finding may reflect differences in the composition of the analyzed product, the available data do not allow the specific origin of this deviation to be established.
These differences indicate that the fatty acid composition of some samples did not fully match the individual reference ranges established by the Codex. Although natural compositional variability and analytical factors may contribute to differences in fatty acid proportions, their specific contributions cannot be established from the present data. Furthermore, the fatty acid percentages calculated from corrected chromatographic peak areas provide a comparative description of the analyzed samples but do not, by themselves, establish formal compliance with the Codex compositional criteria. Therefore, the results are interpreted primarily in terms of fatty acid profile characterization, and no general claim of full compliance with the Codex fatty acid composition requirements is made. Compliance with physicochemical quality parameters is considered separately from conformity with the fatty acid composition ranges.
Table A3.
Fatty acid profile by GC-FID for the fatty acid profile of reference coconut oil compared with the values established by the Codex Alimentarius [11].
In contrast, palm oil and palm kernel oils, which are commonly reported as potential coconut oil adulterants [12], exhibited distinct compositional characteristics (Table A4 ). Palm oil (G) showed a predominance of palmitic acid (C16:0, 30.87%) and a high content of unsaturated fatty acids, particularly oleic acid (C18:1, 40.42%) and linoleic acid (C18:2, 4.55%), together with a low lauric acid content (0.17%). In contrast, palm kernel oil (H) exhibited a profile very similar to that of coconut oil reference (J), with 47.61% lauric acid (C12:0), 15.67% myristic acid (C14:0), and 8.74% palmitic acid (C16:0), although its oleic acid content was higher (14.52% versus 4.68%) (Table A4). However, oleic acid contents among the commercial samples varied considerably, and some samples showed values approaching or exceeding that of the palm kernel oil reference (Table A4).
Table A4.
Fatty acid profiles, expressed as percentages of FAMEs, for the samples of reference coconut oil (J), palm oil (G) and palm kernel oil (H) and commercial coconut oils (A-F, I, K-P).
References
- Rohman, A.; Irnawati; Erwanto, Y.; Lukitaningsih, E.; Rafi, M.; Fadzilah, N.A.; Windarsih, A.; Sulaiman, A.; Zakaria, Z. Virgin coconut oil: Extraction, physicochemical properties, biological activities and its authentication analysis. Food Rev. Int. 2021, 37, 46–66. [Google Scholar] [CrossRef] [Scilit]
- Prasanna, N.S.; Selvakumar, M.; Choudhary, N.; Raghavarao, K.S.M.S. Virgin coconut oil: Wet production methods and food applications—A review. Sustain. Food Technol. 2024, 2, 1391–1408. [Google Scholar] [CrossRef] [Scilit]
- Wallace, T.C. Health effects of coconut oil—A narrative review of current evidence. J. Am. Coll. Nutr. 2019, 38, 97–107. [Google Scholar] [CrossRef] [Scilit] [PubMed]
- Chatterjee, P.; Fernando, M.; Fernando, B.; Dias, C.B.; Shah, T.; Silva, R.; Williams, S.; Pedrini, S.; Hillebrandt, H.; Goozee, K.; et al. Potential of coconut oil and medium chain triglycerides in the prevention and treatment of Alzheimer’s disease. Mech. Ageing Dev. 2020, 186, 111209. [Google Scholar] [CrossRef] [Scilit] [PubMed]
- Setyawati, A.; Sangkala, M.S.; Malasari, S.; Jafar, N.; Sjattar, E.L.; Syahrul, S.; Rasyid, H. Virgin coconut oil: A dietary intervention for dyslipidaemia in patients with diabetes mellitus. Nutrients 2023, 15, 564. [Google Scholar] [CrossRef] [Scilit] [PubMed]
- United Nations Conference on Trade and Development. Guide on Exports to the European Union for Pacific Island Economies; UNCTAD/TCS/DITC/INF/2026/4; United Nations: Geneva, Switzerland, 2026; Available online: https://unctad.org/system/files/official-document/tcsditcinf2026d4_en.pdf (accessed on 16 August 2026).
- Rohman, A.; Ghazali, M.A.B.; Windarsih, A.; Irnawati; Riyanto, S.; Yusof, F.M.; Mustafa, S. Comprehensive review on application of FTIR spectroscopy coupled with chemometrics for authentication analysis of fats and oils in the food products. Molecules 2020, 25, 5485. [Google Scholar] [CrossRef] [Scilit] [PubMed]
- Amit; Kumari, S.; Jamwal, R. Use of FTIR spectroscopy integrated with multivariate chemometrics as a swift, and non-destructive technique to detect various adulterants in virgin coconut oil: A comprehensive review. Food Chem. Adv. 2023, 2, 100203. [Google Scholar] [CrossRef] [Scilit]
- Libish, T.M.; Linesh, J.; Bobby, M.C.; Biswas, P.; Bandyopadhyay, S.; Dasgupta, K.; Radhakrishnan, P. Detection and analysis of paraffin oil adulteration in coconut oil using fiber optic long period grating sensor. Optik 2011, 122, 1939–1942. [Google Scholar] [CrossRef] [Scilit]
- Agência Nacional de Vigilância Sanitária. Instrução Normativa No. 87, de 15 de Março de 2021; Agência Nacional de Vigilância Sanitária (ANVISA): Brasília, Brazil, 2021; Available online: https://anvisalegis.datalegis.net/action/UrlPublicasAction.php?acao=abrirAtoPublico&num_ato=00000087&sgl_tipo=INM&sgl_orgao=DC/ANVISA/MS&vlr_ano=2021&seq_ato=000&cod_modulo=310&cod_menu=9434 (accessed on 24 October 2026).
- Codex Stan 210-1999; Standard for Named Vegetable Oils. FAO/WHO: Rome, Italy, 2025.
- Priya, R.B.; Rashmitha, R.; Preetham, G.S.; Chandrasekar, V.; Jagan Mohan, R.; Sinija, V.R.; Pandiselvam, R. Detection of adulteration in coconut oil and virgin coconut oil using advanced analytical techniques: A review. Food Anal. Methods 2022, 15, 2917–2930. [Google Scholar] [CrossRef] [Scilit]
- Komaram, A.C.; Anjaneyulu, E.; Goswami, K.; Nayak, R.R.; Kanjilal, S. Detection and quantification of palmolein and palm kernel oil added as adulterant in coconut oil based on triacylglycerol profile. J. Food Sci. Technol. 2021, 58, 4420–4428. [Google Scholar] [CrossRef] [Scilit] [PubMed]
- Tan, C.H.; Kong, I.; Irfan, U.; Solihin, M.I.; Pui, L.P. Edible oils adulteration: A review on regulatory compliance and its detection technologies. J. Oleo Sci. 2021, 70, 1343–1356. [Google Scholar] [CrossRef] [Scilit] [PubMed]
- Firestone, D. (Ed.) Official Methods and Recommended Practices of the AOCS, 5th ed.; AOCS Press: Champaign, IL, USA, 1998. [Google Scholar]
- Sabahannur, S.; Alimuddin, S. Identification of fatty acids in virgin coconut oil (VCO), cocoa beans, crude palm oil (CPO), and palm kernel beans using gas chromatography. IOP Conf. Ser. Earth Environ. Sci. 2022, 1083, 012036. [Google Scholar] [CrossRef] [Scilit]
- Hajrulai-Musliu, Z.; Uzunov, R.; Angelevska, A.; Popovska-Trenevska, V.; Arapcheska, M.; Dimitrieska-Stojkovikj, E. Determination of milk fat adulteration in sour cream with vegetable oils by GC-FID method. J. Hyg. Eng. Des. 2021, 37, 160–165. [Google Scholar]
- Bao, R.; Tang, F.; Rich, C.; Hatzakis, E. A comparative evaluation of low-field and high-field NMR untargeted analysis: Authentication of virgin coconut oil adulterated with refined coconut oil as a case study. Anal. Chim. Acta 2023, 1273, 341537. [Google Scholar] [CrossRef] [Scilit] [PubMed]
- De Luca, M.; Ioele, G.; Grande, F.; Occhiuzzi, M.A.; Chieffallo, M.; Garofalo, A.; Ragno, G. Multivariate curve resolution methodology applied to the ATR-FTIR data for adulteration assessment of virgin coconut oil. Molecules 2023, 28, 4661. [Google Scholar] [CrossRef] [Scilit] [PubMed]
- Popescu, R.; Costinel, D.; Dincă, O.R.; Marinescu, A.; Ștefănescu, I.; Ionete, R.E. Discrimination of vegetable oils using NMR spectroscopy and chemometrics. Food Control 2015, 48, 84–90. [Google Scholar] [CrossRef] [Scilit]
- Gandhi, K.; Sharma, R.; Seth, R.; Mann, B. Detection of coconut oil in ghee using ATR-FTIR and chemometrics. Appl. Food Res. 2022, 2, 100035. [Google Scholar] [CrossRef] [Scilit]
- Neves, M.G.; Poppi, R.J. Authentication and identification of adulterants in virgin coconut oil using ATR/FTIR in tandem with DD-SIMCA one class modeling. Talanta 2020, 219, 121338. [Google Scholar] [CrossRef] [Scilit] [PubMed]
- Manaf, M.A.; Man, Y.B.C.; Hamid, N.S.A.; Ismail, A.; Abidin, S.Z. Analysis of adulteration of virgin coconut oil by palm kernel olein using Fourier transform infrared spectroscopy. J. Food Lipids 2007, 14, 111–121. [Google Scholar] [CrossRef] [Scilit]
- Hemmateenejad, B.; Mobaraki, N.; Baumann, K. Robust multiplicative scatter correction using quantile regression. J. Chemom. 2024, 38, e3589. [Google Scholar] [CrossRef] [Scilit]
- De Freitas, O.N.; Rial, C.R.; Cavalheiro, L.F.; Barbosa, J.M.S.; Nazário, C.E.D.; Viana, L.H. Evaluation of the oxidative stability and cold filter plugging point of soybean methyl biodiesel/bovine tallow methyl biodiesel blends. Ind. Crops Prod. 2019, 140, 111667. [Google Scholar] [CrossRef] [Scilit]
- Guillén, M.D.; Ruiz, A. Rapid simultaneous determination by proton NMR of unsaturation and composition of acyl groups in vegetable oils. Eur. J. Lipid Sci. Technol. 2003, 105, 688–696. [Google Scholar] [CrossRef] [Scilit]
- Maia, E.L.; Rodriguez-Amaya, D.B. Avaliação de um método simples e econômico para a metilação de ácidos graxos com lipídios de diversas espécies de peixes. Rev. Inst. Adolfo Lutz 1993, 53, 27–35. [Google Scholar] [CrossRef] [Scilit]
- Jeevarathinam, G.; Rahul, R.; Deepa, J.; Sharath Kumar, N.; Neethu, C.S.; Sarojini, G.; Siva Shankar, V.; Singh, P.; Oberoi, D.P.S.; Rustagi, S.; et al. Deacidification of vegetable oils: Advanced technologies, mechanistic insights, and emerging strategies. Food Chem. 2026, 499, 147325. [Google Scholar] [CrossRef] [Scilit] [PubMed]
- Prescha, A.; Grajzer, M.; Dedyk, M.; Grajeta, H. The antioxidant activity and oxidative stability of cold-pressed oils. J. Am. Oil Chem. Soc. 2014, 91, 1291–1301. [Google Scholar] [CrossRef] [Scilit] [PubMed]
- Chabni, A.; Bañares, C.; Torres, C.F. Study of the oxidative stability via Oxitest and Rancimat of phenolic-rich olive oils obtained by a sequential process of dehydration, expeller and supercritical CO2 extractions. Front. Nutr. 2024, 11, 1494091. [Google Scholar] [CrossRef] [Scilit] [PubMed]
- Vigli, G.; Philippidis, A.; Spyros, A.; Dais, P. Classification of edible oils by employing 31P and 1H NMR spectroscopy in combination with multivariate statistical analysis. A proposal for the detection of seed oil adulteration in virgin olive oils. J. Agric. Food Chem. 2003, 51, 5715–5722. [Google Scholar] [CrossRef] [Scilit] [PubMed]
- Marina, A.M.; Che Man, Y.B.; Nazimah, S.A.H.; Amin, I. Chemical properties of virgin coconut oil. J. Am. Oil Chem. Soc. 2009, 86, 301–307. [Google Scholar] [CrossRef] [Scilit]
- Ogbeide, O.K.; Omorotionmwan, E.A.; Igenumah, O.D.; Ifijen, H.I.; Akhigbe, I.U. Comparative analysis on physicochemical properties and chemical composition of coconut and palm kernel oils. ChemSearch J. 2022, 13, 70–75. [Google Scholar]
- Luzaić, T.Z.; Grahovac, N.L.; Hladni, N.T.; Romanić, R.S. Evaluation of oxidative stability of new cold-pressed sunflower oils during accelerated thermal stability tests. Food Sci. Technol. 2022, 42, e67320. [Google Scholar] [CrossRef] [Scilit]
- Tsao, C.H.; Chang, C.W.; Ho, Y.C.; Chuang, Y.K.; Lee, W.J. Application of OXITEST for prediction of shelf-lives of selected cold-pressed oils. Front. Nutr. 2021, 8, 763524. [Google Scholar] [CrossRef] [Scilit] [PubMed]
- Kumar, S.N. Variability in coconut (Cocos nucifera L.) germplasm and hybrids for fatty acid profile of oil. J. Agric. Food Chem. 2011, 59, 13050–13058. [Google Scholar] [CrossRef] [Scilit] [PubMed]
- Cicero, N.; Albergamo, A.; Salvo, A.; Bua, G.D.; Bartolomeo, G.; Mangano, V.; Rotondo, A.; Di Stefano, V.; Di Bella, G.; Dugo, G. Chemical characterization of a variety of cold-pressed gourmet oils available on the Brazilian market. Food Res. Int. 2018, 109, 517–525. [Google Scholar] [CrossRef] [Scilit] [PubMed]
Disclaimer/Publisher’s Note: The statements, opinions and data contained in all publications are solely those of the individual author(s) and contributor(s) and not of MDPI and/or the editor(s). MDPI and/or the editor(s) disclaim responsibility for any injury to people or property resulting from any ideas, methods, instructions or products referred to in the content. |
© 2026 by the authors. Licensee MDPI, Basel, Switzerland. This article is an open access article distributed under the terms and conditions of the Creative Commons Attribution (CC BY) license.