


Abstract
The Chilean silverside (Basilichthys microlepidotus) is an endemic freshwater species considered Vulnerable, and the species-specific bioengineering parameters needed to design efficient recirculating aquaculture systems (RAS) for this species, particularly oxygen consumption, remain unknown. A factorial experiment (2 × 2) was conducted to evaluate how body size and stocking density affect the routine oxygen consumption of B. microlepidotus. The study considered two body-size groups and two stocking-density treatments, each represented by three replicate tanks. Oxygen uptake rates were determined from mass-balance calculations in a static closed respirometry system during sequential 24 h periods. Body size significantly influenced mass-specific oxygen consumption, with smaller fish exhibiting higher rates than larger fish, consistent with allometric metabolic scaling, whereas no significant independent effect of stocking density was detected; however, with only three tanks per treatment and two similar densities, the test had low power and this result is inconclusive. A pronounced diurnal pattern was evident in all treatments, with the main oxygen consumption peak near 14:00 h, approximately three hours after the single daily feeding (11:00 h), which is consistent with, but does not demonstrate, a specific dynamic action (SDA) response because no unfed control was included; a smaller peak near 08:00 h preceded feeding and may reflect routine laboratory activity at the start of the working day. These results provide the first species-specific reference values of routine oxygen consumption for B. microlepidotus, offering a preliminary basis, within the size and density ranges tested, for estimating the oxygen demand of fish in RAS designed for this species, with direct relevance for both conservation-oriented restocking and its development as a candidate for freshwater aquaculture diversification.
1. Introduction
Aquaculture is one of the fastest-growing food production sectors globally and is expected to play a central role in ensuring world food security [1]. In this context, the FAO actively promotes the culture of native species as a strategy to diversify production and strengthen regional food security [2]. In Chile, the genus Basilichthys (Atherinopsidae) is among the most representative groups of the freshwater ichthyofauna. The endemic species Basilichthys microlepidotus (Jenyns, 1841), commonly known as Chilean silverside or pejerrey chileno, is distributed from the Huasco River to the Island of Chiloé [3]. This species faces multiple threats, including invasive species, overexploitation, and habitat degradation, which have led to its classification as “Vulnerable” and the implementation of an extraction moratorium [4]. Consequently, the development of culture programs for this species is essential not only for conservation through restocking, but also for exploring its aquaculture potential [5].
Despite advances in the reproduction and larval development of B. microlepidotus [5], the bioengineering parameters required for the design of intensive culture systems—particularly recirculating aquaculture systems (RAS)—remain unknown for this species. Among the most critical parameters is the oxygen consumption rate, a direct indicator of fish energetic metabolism [6]. Knowledge of oxygen demand is essential for sizing aeration and oxygenation equipment, calculating water flow rates, and determining the carrying capacity of culture systems [7]. To date, no published data exist on the oxygen consumption rate of B. microlepidotus under any culture condition, representing a critical knowledge gap that limits the development of efficient and sustainable production systems for this species.
The metabolic demand for oxygen in fish is shaped by the interaction of internal physiological processes and external environmental drivers. Body size is a fundamental determinant of metabolic rate: whole-animal oxygen consumption increases with body mass with a scaling exponent below 1, so that mass-specific oxygen consumption declines as fish grow [8,9]. Smaller individuals therefore typically exhibit higher oxygen consumption per unit mass. Metabolic rate also differs among species according to ecological lifestyle, being higher in pelagic and lower in hypoxia-tolerant teleosts [10]. Stocking density is another critical factor in aquaculture, capable of modulating metabolic rate through changes in behavior, chronic stress, and space availability [11,12]. High densities may reduce locomotor activity and consequently routine energy expenditure, whereas low densities may promote greater exploratory behavior and higher activity-related oxygen demand [13,14]. Understanding how body size and stocking density, as well as their interaction, affect oxygen consumption is particularly relevant for B. microlepidotus, for which no metabolic data are available.
Given the absence of metabolic data for B. microlepidotus under culture conditions, the present study aimed to evaluate the effects of stocking density and body size, as well as their interaction, on the oxygen consumption rate of fish maintained in a recirculating aquaculture system. The results provide the first species-specific bioengineering parameters for this endemic Chilean species, establishing a preliminary baseline for estimating the oxygen demand of fish in RAS and contributing to the development of sustainable production strategies for both conservation and commercial aquaculture purposes.
2. Materials and Methods
2.1. Experimental Organisms
Wild individuals were obtained from the Elqui River and transported to the aquaculture facilities of Universidad Católica del Norte, Coquimbo, Chile. The fish were subsequently housed in 12 m3 circular concrete tanks under continuous aeration and flowing water conditions (5 L s−1). To ensure adaptation to the laboratory environment, all specimens remained under these conditions for 140 days before oxygen consumption measurements were initiated. Fish were acclimated to experimental conditions for 140 days prior to the start of the measurements. During the acclimation period, fish were fed daily at 2% body weight and water quality was maintained as described. Water quality parameters were maintained as follows: temperature 19.51 ± 0.11 °C, dissolved oxygen 9.12 ± 0.09 mg L−1 and pH 8.36 ± 0.09. A total of 151 fish were selected and distributed into four experimental groups defined by the combination of two stocking densities and two size ranges: low density–small size (D1S1), low density–large size (D1S2), high density–small size (D2S1), and high density–large size (D2S2). Stocking densities (total fish biomass per unit of tank water volume) were nominally 1.1 kg m−3 for the low-density condition (D1) and 1.8 kg m−3 for the high-density condition (D2), while size ranges were 7.8–77.8 g for S1 and 80–297 g for S2. Each experimental treatment consisted of three replicate tanks, and fish were randomly distributed among the culture units to minimize allocation bias. The number of fish and total biomass varied among replicate tanks according to individual body size and the target stocking density: D1S1 tanks held 18–19 fish (18.3 ± 0.6) with a total biomass of 425.8–504.4 g (466.5 ± 39.4 g); D1S2 tanks held 3–6 fish (4.7 ± 1.5) with a total biomass of 536.8–591.8 g (566.1 ± 27.7 g); D2S1 tanks held 21–23 fish (22.3 ± 1.2) with a total biomass of 845.5–866.0 g (858.0 ± 10.9 g); and D2S2 tanks held 5 fish in all three replicates with a total biomass of 719.0–781.1 g (758.8 ± 34.5 g). Mean individual body mass per tank (total biomass divided by the number of fish) was 25.4 g in D1S1, 130.8 g in D1S2, 38.5 g in D2S1 and 151.8 g in D2S2, so that mean body mass differed between the two density treatments within each size class. With the working volume of 450 L, realized stocking densities were 0.95–1.12 (D1S1), 1.19–1.32 (D1S2), 1.88–1.92 (D2S1) and 1.60–1.74 kg m−3 (D2S2), averaging 1.1 kg m−3 in D1 and 1.8 kg m−3 in D2, in agreement with the nominal densities.
2.2. Experimental Design
The RAS and the closed-system respirometry protocol described below are the same as those used by our group in a previous study on the congeneric Argentine silverside (Odontesthes bonariensis; see Section 4). Routine oxygen consumption measurements were conducted in a recirculating aquaculture system (7 m3 total volume) composed of twelve cylindrical–conical tanks. Each tank had a nominal volume of 500 L, although a working volume of 450 L was used for experimental calculations. The system incorporated mechanical, biological, and ultraviolet water-treatment components, including a 1000 L settling basin, a sand filter (Emaux, model P500; Emaux Water Technology Co., Ltd., Zhongshan, Guangdong, China), a submerged moving-bed biofilter containing Kaldnes carriers, and a 20 W UV sterilization unit (Bio Light SpA, Santiago, Chile). Water movement was maintained by a 1 HP centrifugal pump (ESPA, model SILEN 100, Girona, Spain) with a maximum discharge of 14 m3 h−1, while aeration was provided by Aero-Tube™ diffusers and a hydraulic aeration system connected to a 2.5 HP blower (Sweetwater®, Pentair, Golden Valley, MN, USA). Each tank received a flow of 0.77 m3 h−1, equivalent to 1.7 exchanges of the tank volume per hour (hydraulic retention time of approximately 35 min). Tanks were exposed to the natural photoperiod of Coquimbo during austral spring (measurements in November; approximately 13.3–13.9 h of daylight). Mean water temperature across treatments ranged from 20.06 to 20.39 °C (Table 1). Following the 140-day acclimation described in Section 2.1, fish were kept in the experimental tanks for a further 60 days before the measurements began. Freshwater supplied from the municipal system was aerated for 24 h to ensure dechlorination. Water quality management included verification of chlorine-free conditions using a HI701 free chlorine checker (Hanna Instruments, Woonsocket, RI, USA). Additionally, husbandry procedures involved daily siphoning of tanks to eliminate uneaten feed particles and fecal deposits.
Table 1.
Water quality parameters of silverside Basilichthys microlepidotus in a recirculating aquaculture system.
2.3. Routine Oxygen Consumption Measurements
Routine oxygen consumption was measured using the optical probe LDO10105 connected to the HQ40d portable multiparameter meter (Hach Company, Loveland, CO, USA), calibrated prior to each measurement session following the manufacturer’s recommendations. Oxygen consumption rates were estimated using a static closed-system mass-balance approach under non-steady-state conditions, in which each culture tank functioned as an independent sealed respirometer [15,16]. At the beginning of each 6 h measurement block, aeration was suspended and all water inlet and outlet valves were closed, thereby isolating each tank from the recirculating system. Dissolved oxygen concentrations were recorded at 1 h intervals using the same meter throughout four consecutive 6 h measurement blocks, covering the full 24 h cycle (06:00–12:00, 12:00–18:00, 18:00–00:00, and 00:00–06:00 h). Between blocks, aeration and water circulation were restored until dissolved oxygen returned to initial saturation levels before the subsequent block commenced. Each measurement block lasted 6 h, and dissolved oxygen was monitored to ensure that it did not fall below 70% of air saturation (≈6.5 mg O2 L−1, taking as 100% saturation the ≈9.3 mg O2 L−1 displayed by the meter at ≈20 °C; Table 1), a limit that was not reached in any block, ensuring that all recorded values reflected aerobic metabolic rates under non-critically limiting oxygen conditions, well above the critical oxygen tension (Pcrit) associated with acute metabolic suppression in freshwater teleosts (~3.5–5.5 mg O2 L−1) [17,18]. Since each tank was completely sealed during measurements, with no active aeration or water exchange, no correction for oxygen reaeration or atmospheric diffusion was applied. Background (microbial and biofilm) oxygen consumption was not measured in fish-free controls and was therefore not subtracted; the potential influence of this and of other procedural effects is discussed in Section 4. The three 24 h measurement cycles were consecutive, repeated measurements on the same twelve tanks, not independent tanks: for each tank, hourly rates were averaged across the three cycles, and the tank mean (average of all valid hourly values of that tank) was used as the unit of replication (n = 3 tanks per treatment) in all statistical analyses. The hourly mass-specific oxygen consumption rate (mg O2 kg−1 h−1) was calculated according to the following equation:
where Ct0 and Ct1 are the dissolved oxygen concentrations (mg O2 L−1) at the beginning (t0) and end (t1) of each 1 h interval, so that positive rates correspond to a decline in oxygen concentration; V is the working water volume of the tank in liters (450 L); and B (kg) is the total fish biomass.
Environmental and water quality conditions were regularly evaluated during the study. Measurements of dissolved oxygen, temperature, and pH were obtained using a Hach HQ40d multiparameter probe. Total ammonia nitrogen (TAN) concentration was quantified colorimetrically using the salicylate method (Method 8155) employing ammonium salicylate and ammonium cyanurate reagents, following the procedure described by Hach for the Hach DR3900 spectrophotometer, and un-ionized ammonia (NH3) was calculated from TAN, pH and temperature [19]. Nitrate and nitrite concentrations were monitored weekly following the Cadmium Reduction (Method 8039) and Diazotization (Method 8507) procedures, respectively [19]. Alkalinity was estimated by acid titration using the Bromophenol Blue method and a commercial HI3811 test kit, whereas total suspended solids were quantified according to the protocol described in APHA Method 2540D [20].
2.4. Feeding Protocol
A commercial starter feed (Biomar ORB Intro; BioMar Chile S.A., Puerto Montt, Chile) was used during the experiment. According to the manufacturer’s specifications, the diet contained 50.13–54.13% crude protein and 18.5–20.0% lipids, with moisture and ash contents below 10% and 12%, respectively. Fish were fed once daily at 11:00 h, receiving a ration equivalent to 1% of the standing biomass. Feeding rates were revised every 14 days to account for growth. Identical feeding conditions were maintained during all routine oxygen consumption measurements, while fasting controls were not incorporated into the study.
2.5. Statistical and Sensitivity Analysis
Results are presented as mean ± standard deviation (SD). The tank was the experimental unit (n = 3 per treatment). Between measurement blocks, the tanks were open to the recirculating system and shared its water; during each 6 h block, however, they were isolated and functioned as static closed respirometers. Because the three consecutive 24 h cycles were repeated measurements on the same twelve tanks, values were averaged per tank before analysis, thereby avoiding pseudoreplication (see Section 2.3). Mass-specific oxygen consumption was compared with a two-way ANOVA that included body size and stocking density as fixed factors together with their interaction. Where a factor had a significant effect, treatment means were compared pairwise using Tukey’s HSD test. Changes in oxygen consumption over the 24 h cycle were assessed with a repeated-measures ANOVA, with hour of the day as the within-subject factor and tank as the experimental unit; the Greenhouse–Geisser correction was used whenever sphericity was not met. Before each analysis, residual normality (Shapiro–Wilk) and homogeneity of variances (Levene) were checked. All tests were evaluated at α = 0.05. The observed power (1 − β) of each ANOVA term was estimated post hoc with the R package pwr, using Cohen’s f computed from partial eta-squared (f = √[η2p/(1 − η2p)]) and n = 3 tanks per treatment. For each η2p, 90% confidence intervals were calculated by inverting the noncentral F distribution. In addition, a sensitivity analysis determined the smallest effect size that the design (three tanks in each of the four treatments) could detect with 80% power. Main and interactive effects were evaluated and reported through F-statistics, their respective degrees of freedom, and exact p-values. All statistical procedures were implemented using R (version 4.5.2) [21].
3. Results
3.1. Water Quality Parameters
The mean values of the water quality parameters are summarized in Table 1. Overall, the physicochemical characteristics of the culture tank water remained comparable across treatments, ensuring that the oxygen consumption measurements were not confounded by environmental variability in water quality. Key parameters, including temperature, dissolved oxygen, and pH, exhibited stable profiles throughout the experimental period, with no statistically significant differences detected among treatments (p > 0.05). Within the recirculating aquaculture system, the average concentrations of nitrogenous compounds were as follows: total ammonia nitrogen (TAN), 0.34 ± 0.27 mg L−1 (range 0.01–0.61 mg L−1), with un-ionized ammonia (NH3) of 0.03 ± 0.01 mg L−1 (maximum 0.04 mg L−1); nitrite (NO2–N), 0.06 ± 0.01 mg L−1; and nitrate (NO3–N), 18.17 ± 0.06 mg L−1. Alkalinity averaged 202 ± 1.73 mg CaCO3 L−1, while total suspended solids (TSSs) reached 12.82 ± 4.56 mg L−1.
3.2. Oxygen Consumption
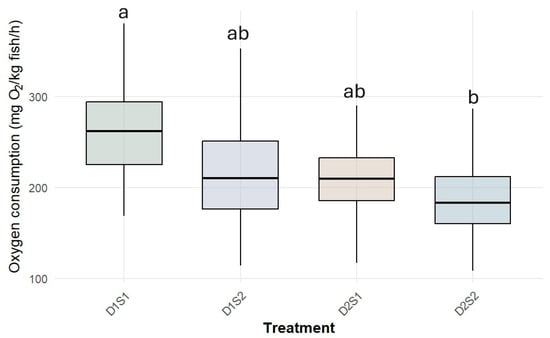
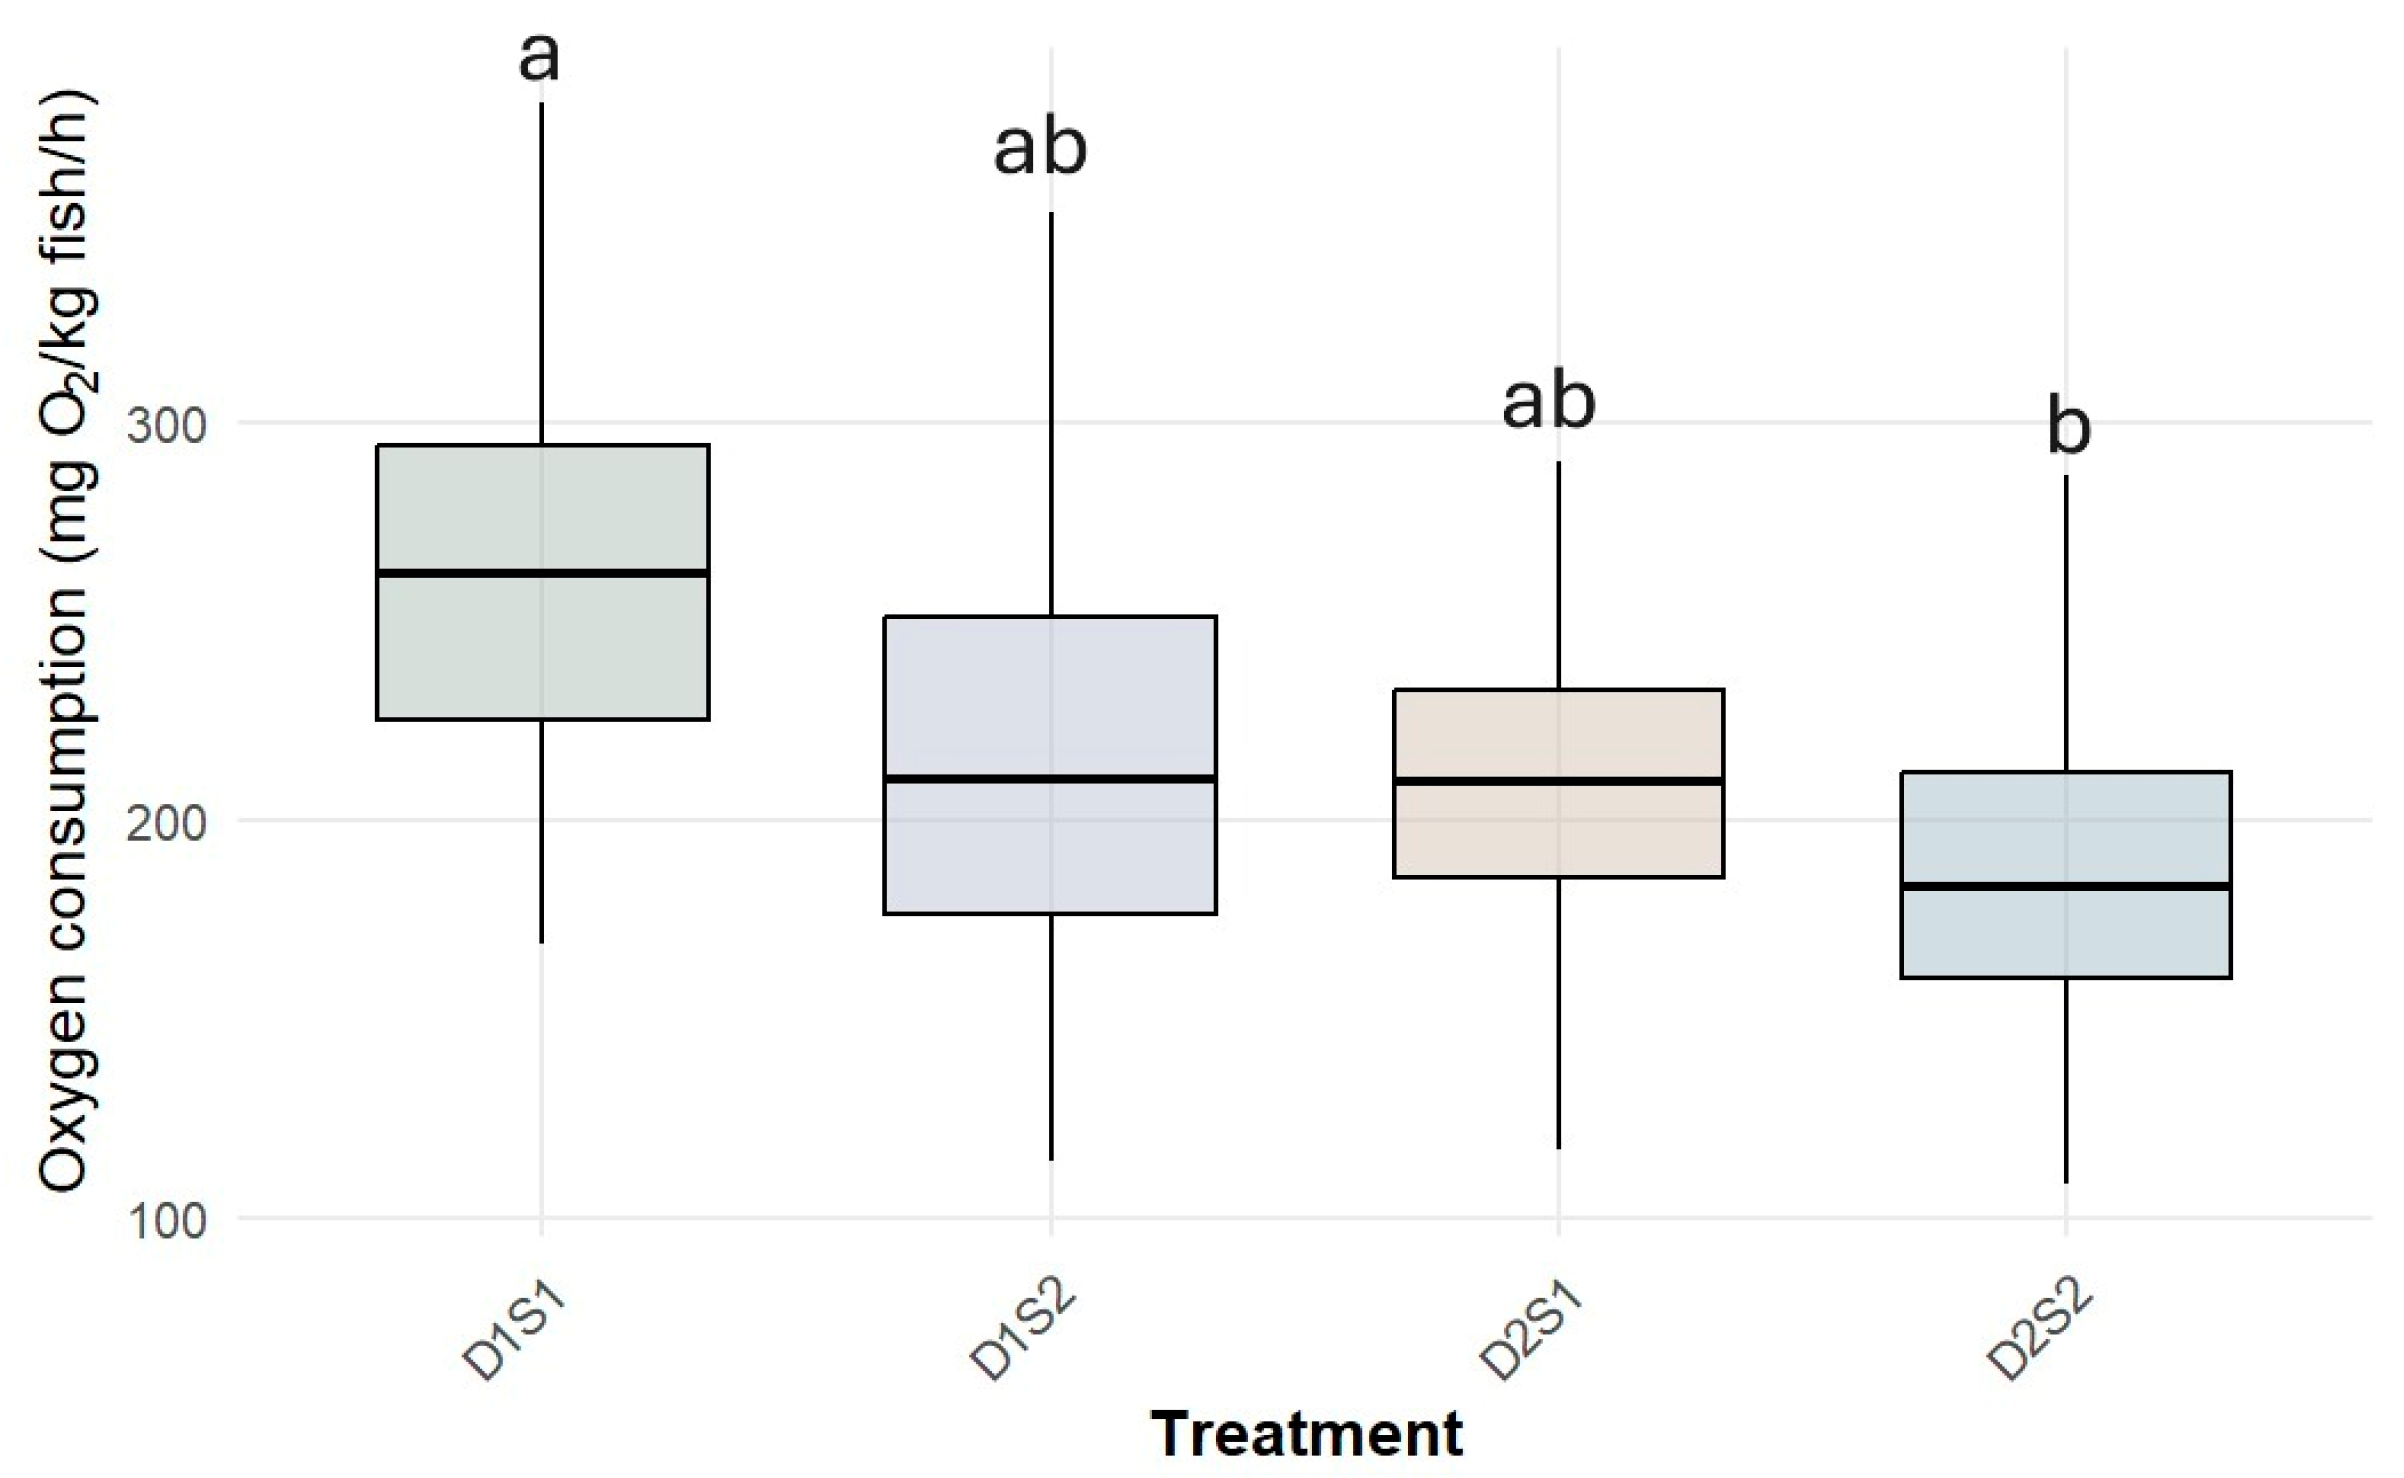
The oxygen consumption estimates showed strong agreement among replicate tanks within each treatment. Coefficients of variation were consistently lower than 15%, reflecting satisfactory experimental precision and reproducibility. Mean routine oxygen consumption rates were 264.86 ± 53.71 mg O2 kg−1 h−1 for D1S1, 209.56 ± 60.25 mg O2 kg−1 h−1 for D1S2, 214.03 ± 63.46 mg O2 kg−1 h−1 for D2S1, and 186.92 ± 41.34 mg O2 kg−1 h−1 for D2S2 (Figure 1). Two-way ANOVA revealed a significant main effect of body size on oxygen consumption rate (F (1,8) = 5.8, p = 0.041, η2p = 0.42, 90% CI 0.01–0.64), with smaller fish (S1) exhibiting significantly higher mass-specific rates than larger fish (S2). The main effect of stocking density was not significant (F (1,8) = 1.9, p = 0.21, η2p = 0.19, 90% CI 0.00–0.49), and no significant interaction between body size and stocking density was detected (F (1,8) = 0.3, p = 0.60, η2p = 0.04, 90% CI 0.00–0.32). Post hoc comparisons (Tukey HSD) confirmed a significant difference only between D1S1 and D2S2 (p < 0.05), while intermediate treatments (D1S2 and D2S1) did not differ significantly from either extreme (Figure 1).
Figure 1.
Mass-specific routine oxygen consumption rate (mg O2 kg−1 h−1) of Basilichthys microlepidotus under four experimental treatments combining two stocking densities (D1: 1.1 kg m−3; D2: 1.8 kg m−3) and two body-size classes (S1: 7.8–77.8 g; S2: 80–297 g). Boxes show the distribution of hourly values pooled across the three replicate tanks and the three consecutive 24 h cycles of each treatment, for visualization only; statistical inference (letters) was based on tank means (n = 3 per treatment). Different lowercase letters above boxes indicate significant differences among treatments (Tukey HSD, p < 0.05, following two-way ANOVA).
Post hoc statistical power analysis (Cohen’s f effect sizes derived from partial eta-squared values, α = 0.05, n = 3 replicates per treatment) indicated an observed power (1 − β) of 73.3% for the body size effect, 31.6% for the stocking density effect, and 9.6% for the body size × stocking density interaction (Table S1). These results indicate that the study was reasonably powered to detect the significant body size effect, but only weakly powered to detect a true stocking density effect; a minimum of approximately nine replicate tanks per treatment (n = 36) would be required to achieve conventional 80% power for the density effect at the observed effect size. A sensitivity analysis showed that, with three tanks in each of the four treatments (n = 12), α = 0.05 and 80% power, the design could detect only very large effects (Cohen’s f ≈ 0.92, corresponding to η2p ≈ 0.46). The stocking-density effect observed here (η2p = 0.19, 90% CI 0.00–0.49) is therefore inconclusive, being compatible with both no effect and a large effect. This post hoc power estimate is presented for illustrative purposes only, to inform sample-size planning in future studies, and should not be interpreted as retrospective validation of the non-significant density effect, given the statistical circularity inherent to observed power calculated from the same data used to test the effect [22].
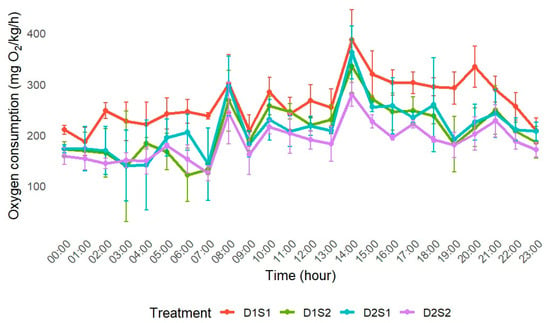
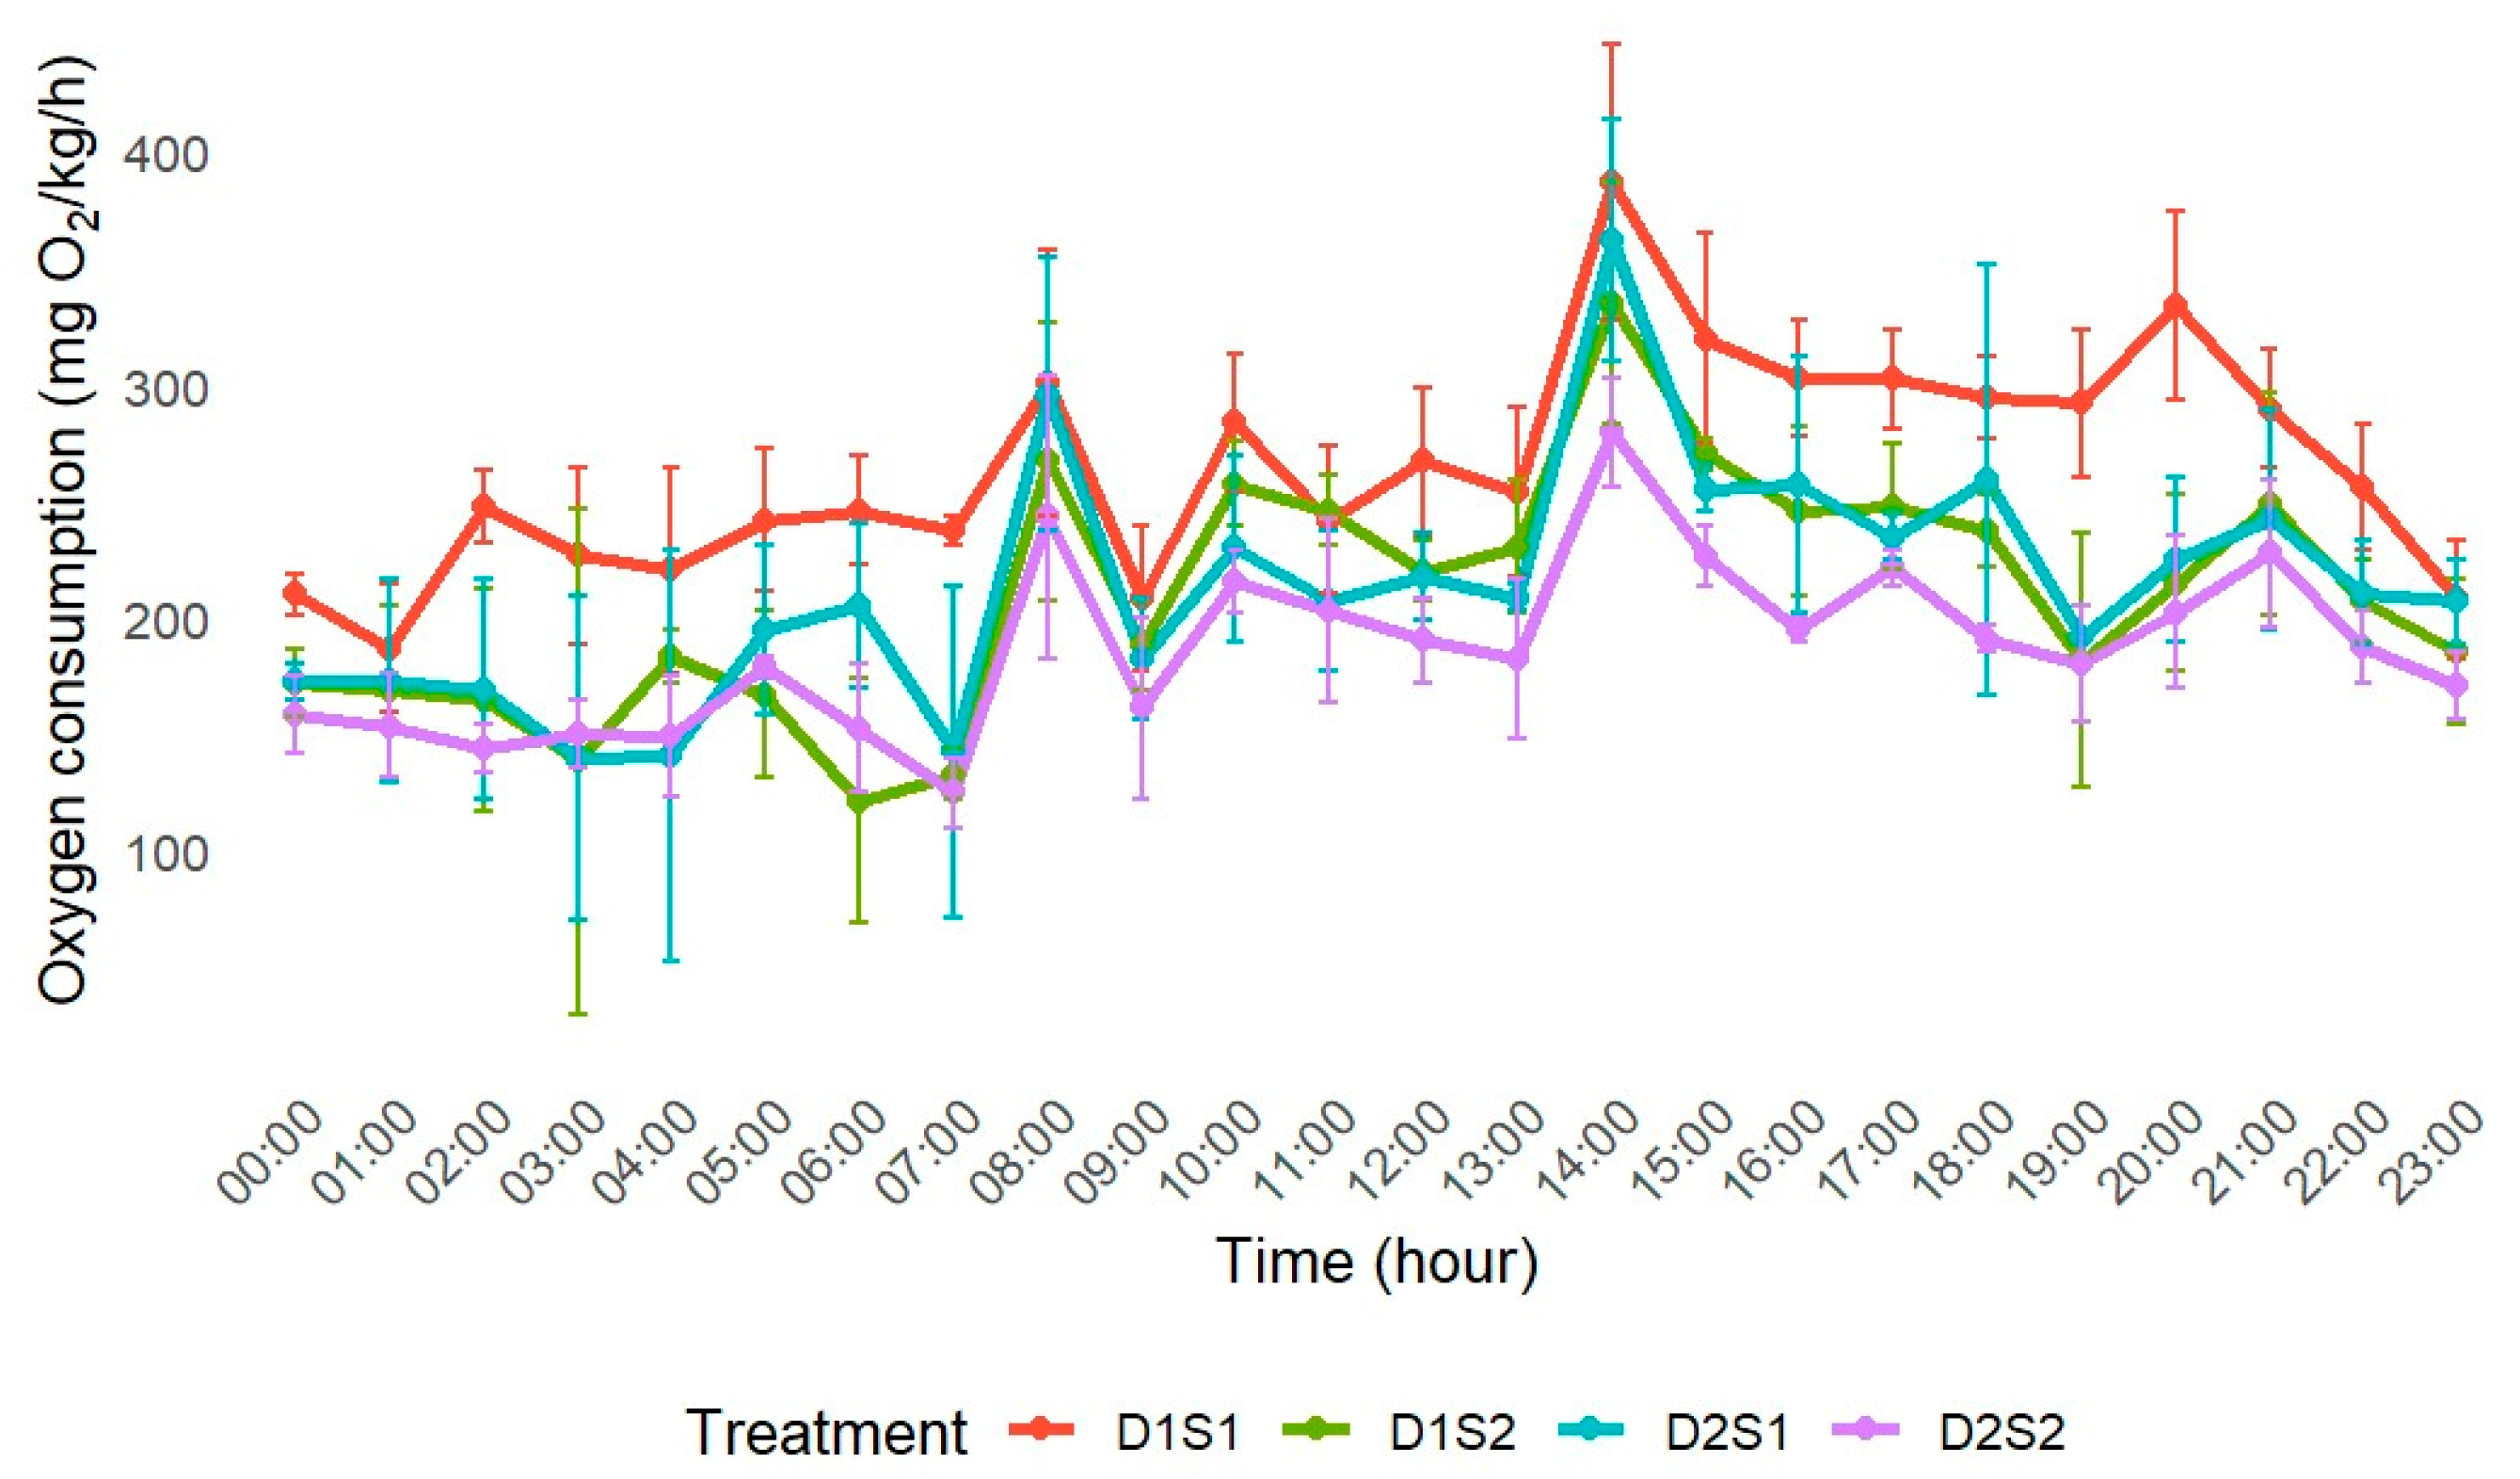
Daily oxygen consumption exhibited a pronounced diurnal pattern, with significant fluctuations throughout the 24 h cycle (Figure 2). Individual hourly values ranged from 103.31 to 378.0 mg O2 kg−1 h−1 across all treatments. These temporal variations were primarily associated with postprandial metabolic activity (SDA) rather than inconsistencies among experimental replicates. The highest values, recorded near 14:00 h in all four treatments, occurred approximately three hours after the single daily feeding (11:00 h), a timing compatible with a postprandial (SDA) response; because no unfed control was included, this temporal association does not by itself demonstrate causation (Section 4). A smaller peak near 08:00 h preceded feeding and is also discussed in Section 4. Repeated-measures ANOVA confirmed a significant effect of time on oxygen consumption (F (23,184) = 10.2, p < 0.001), indicating that oxygen consumption varied significantly over the 24 h cycle. The treatment × time interaction was not significant (F (69,184) = 0.9, p = 0.58, η2p = 0.25), providing no evidence that the shape of the diurnal pattern differed among the four treatments.
Figure 2.
Diurnal variation in mass-specific routine oxygen consumption rate (mg O2 kg−1 h−1) of Basilichthys microlepidotus under four experimental treatments combining two stocking densities (D1: 1.1 kg m−3; D2: 1.8 kg m−3) and two body-size classes (S1: 7.8–77.8 g; S2: 80–297 g). Values are presented as mean ± SD at 1 h intervals over a 24 h cycle (n = 3 replicate tanks per treatment). Peaks of oxygen consumption occurred near 08:00 h and 14:00 h; the latter, about three hours after the single daily feeding (11:00 h), is consistent with a specific dynamic action (SDA) response (see Section 4).
4. Discussion
All physicochemical parameters recorded during the experimental period remained within the ranges recommended for B. microlepidotus under culture conditions [5,23], ensuring that water quality did not confound the metabolic measurements. Dissolved oxygen concentration and saturation are among the most critical parameters in aquaculture systems, as they directly influence fish physiological performance, metabolic rates, feed intake, and growth [24]. Maintaining dissolved oxygen saturation close to 100% is recommended for intensive RAS, as suboptimal oxygen levels reduce aerobic scope and can compromise feed conversion efficiency [25]. For most cultured fish species, dissolved oxygen concentrations above 5 mg L−1 are generally considered sufficient to sustain adequate feed intake and growth performance [26]. Dissolved oxygen availability is also essential for the nitrifying bacteria responsible for the biological conversion of ammonia in the RAS biofilter, where oxygen depletion can rapidly impair nitrification efficiency [7]. The pH values recorded in this study were above 8.3, remaining within the range considered favorable for the development and activity of nitrifying bacteria (pH 7.0–9.0) [27]. However, elevated pH (>8.8) combined with high alkalinity can affect critical metabolic processes in freshwater fish, potentially inducing respiratory and metabolic alkalosis and inhibiting branchial ammonia excretion [28]. The alkalinity recorded in this study averaged 202 mg CaCO3 L−1, exceeding the minimum range of 100–150 mg CaCO3 L−1 recommended to sustain nitrification and buffer pH fluctuations in recirculating systems [29,30]. This suggests that the system maintained adequate buffering capacity during the experimental period.
Regarding ammonia, total ammonia nitrogen (TAN) and un-ionized ammonia (NH3) concentrations remained within safe ranges throughout the experiment. The maximum values recorded were 0.61 mg TAN L−1 and 0.04 mg NH3 L−1, well below the toxicity thresholds reported for freshwater teleosts. Freshwater fish are generally considered less sensitive to ammonia than marine species; mean acute toxicity values are approximately 2.79 mg NH3 L−1 for freshwater species compared with 1.86 mg NH3 L−1 for marine species [31]. Although chronic ammonia toxicity data are unavailable for B. microlepidotus itself, other Atherinopsidae are notably ammonia-sensitive: the pejerrey (Odontesthes bonariensis) shows a 96 h LC50 of 0.71 mg NH3 L−1 [32], and the inland silverside (Menidia beryllina) has a chronic toxicity value of 0.061 mg NH3 L−1 [33], both markedly lower than the safe threshold reported for the warm-water Nile tilapia (0.89 mg L−1 [34]). This heightened sensitivity parallels that of other cold-water fishes: in a 13-week chronic exposure trial, rainbow trout (Oncorhynchus mykiss) tolerated up to 0.05 mg NH3 L−1—four times the conventional “safe” threshold—without relevant physiological or performance effects [35], suggesting that under otherwise optimal rearing conditions, water-quality criteria for cold-water species may be less restrictive than commonly assumed. Because ammonia concentrations recorded in the present study remained well below these species-specific sensitivity thresholds, it is unlikely that ammonia influenced oxygen consumption or metabolic activity of B. microlepidotus during the measurement periods.
No previous data have been published on oxygen consumption rates for B. microlepidotus under any culture condition. This study therefore provides the first species-specific records of routine oxygen demand under recirculating conditions representative of those used in aquaculture, providing a preliminary baseline for estimating the oxygen demand of fish in RAS for this endemic Chilean species.
Body size emerged as the principal determinant of mass-specific oxygen consumption in this study, with smaller B. microlepidotus (S1) exhibiting significantly higher routine rates than larger conspecifics (S2). This pattern is consistent with the well-established negative allometric relationship between body mass and mass-specific metabolic rate documented across teleosts, whereby oxygen consumption scales with body mass following a power function with an exponent generally below 1, averaging around 0.79 across a meta-analysis spanning 138 studies and 69 fish species [36]. Because this scaling exponent departs from isometry, smaller individuals inherently display higher mass-specific rates than larger conspecifics of the same species. More recent comparative analyses have further shown that this scaling exponent is not fixed across taxa, but instead depends on species lifestyle and thermal regime [37]. Furthermore, a recent theoretical model by Rubalcaba et al. [38] predicts that the mass-scaling exponent of metabolism decreases at higher temperatures or activity levels, as oxygen limitation becomes more likely to constrain metabolism in larger, warmer, and more active individuals. Notably, a recent longitudinal study by Rosén et al. [39] found that within-individual ontogenetic scaling of standard metabolic rate correlates positively with scaling of growth, suggesting that accelerating growth comes at a cost of a reduced metabolic scope for functions beyond maintenance. The higher mass-specific oxygen consumption of the smaller size class (S1) is consistent with this negative allometry; proposed explanations include the greater relative energetic cost of growth in small, young fish [39], although the underlying mechanisms remain debated [9]. Importantly, the size classes were broad and mean body mass differed between density treatments within each class (Section 2.1), so that the contrasts among treatments cannot be attributed to density or to size alone.
Unlike body size, stocking density did not represent a significant independent driver of oxygen consumption in the two-way ANOVA, and a significant difference emerged only between the extreme treatment combinations (D1S1 vs. D2S2) rather than as a main density effect. Because these two combinations differ in both factors, and mean body mass was lower in D1S1 (≈25 g) than in D2S2 (≈152 g), this contrast mainly reflects the body-size effect and cannot be attributed to density. This outcome is consistent with reports in rainbow trout (O. mykiss) showing that routine metabolic rate did not differ significantly across a considerably wider range of rearing densities (25–100 kg m−3), indicating that density per se is not always a primary determinant of routine oxygen consumption when water quality and oxygen availability are properly maintained, as in the RAS used here [40]. The numerically higher oxygen consumption of fish held at the lower density (D1) was not statistically supported and is partly confounded by mean body mass, which was lower in D1S1 than in D2S1 (≈25 vs. ≈38 g); it is nevertheless compatible with evidence that behavioral responses to space availability, rather than a generalized stress response, can modulate routine metabolic expenditure. In rainbow trout, fish reared at low density displayed elevated oxygen consumption together with scale loss, interpreted as signs of increased aggressive and territorial behavior, whereas fish at high density instead showed signs of chronic stress mediated by elevated brain serotonergic activity without a corresponding rise in routine oxygen consumption [41]. Likewise, low stocking density has been shown to induce chronic physiological stress in juvenile rainbow trout, evidenced by dysregulated immune- and inflammation-related gene expression, indicating that both unusually low and high densities can represent departures from an optimal range depending on species and life stage [42]. A behavioral basis for reduced individual activity at higher density has also been described in gilthead seabream (Sparus aurata), where fish held at low density displayed more heterogeneous, individually variable swimming behavior, while fish at high density adopted a more synchronized, cohesive schooling pattern that may lower individual-level activity costs [14]. Taken together, these findings are compatible with, but do not demonstrate, a behavioral, activity-related component of any density effect: behavior and stress indicators were not measured here, and the narrow density range evaluated (1.1–1.8 kg m−3) lies well below the densities (often exceeding 25 kg m−3) typically associated with crowding stress in intensively farmed salmonids [43]. Accordingly, the present data neither support nor rule out an effect of stocking density on oxygen consumption.
The absence of a significant body size × stocking density interaction provides no evidence that density effects differ with fish size; however, the power to detect an interaction was very low (9.6%), so an additive relationship cannot be concluded. Within this design, body size was the only factor with a statistically detectable effect on mass-specific oxygen consumption.
The routine oxygen consumption rates recorded for B. microlepidotus in the present study (186.9–264.9 mg O2 kg−1 h−1) fall within the broad range reported for other cultured teleosts, reflecting the substantial interspecific variability generated by differences in body size, water temperature, activity level, and metabolic strategy. For example, juvenile gilthead seabream (S. aurata) acclimated at 15 °C exhibited a standard metabolic rate of approximately 138 mg O2 kg−1 h−1, a value that increased markedly with acclimation temperature, reaching nearly 800 mg O2 kg−1 h−1 at 30 °C [44] (Table 2). This comparison underscores how strongly water temperature can shape absolute oxygen demand across species and experimental conditions, and highlights the importance of establishing species- and condition-specific benchmarks, such as those generated here for B. microlepidotus, rather than extrapolating oxygen requirements from more extensively studied aquaculture species.
Table 2.
Interspecific comparison of routine mass-specific oxygen consumption in cultured teleosts.
These values are also broadly consistent with those recently reported for its congener O. bonariensis under comparable RAS conditions (146.1–226.3 mg O2 kg−1 h−1 routine; peak 333.0 mg O2 kg−1 h−1 postprandially [45]), which is compatible with similar bioenergetic requirements in these two atherinopsids, although only two species are compared (Table 2). Notably, while body size significantly affected oxygen consumption in both species, stocking density was an independent significant driver only in O. bonariensis, which was evaluated across a considerably wider density range (3.2–6.2 kg m−3) than the one tested here (1.1–1.8 kg m−3), suggesting that the narrower density range applied in the present study, together with the low statistical power of the test, may explain why no independent effect was detected.
The remaining species compiled in Table 2 further illustrate this temperature- and taxon-dependent pattern. S. violacea (66.0–98.4 mg O2 kg−1 h−1 at 14–18 °C [46]) and rainbow trout (O. mykiss, 91–130 mg O2 kg−1 h−1 at 15 °C [47]) were evaluated at or below 18 °C and showed routine rates well below those of B. microlepidotus, consistent with the positive effect of temperature on metabolic rate noted above for S. aurata. Tench (T. tinca, 126.8–187.4 mg O2 kg−1 h−1 at 23 °C [48]) and northern pike (E. lucius, 92.9–144.8 mg O2 kg−1 h−1 at 20 °C [49]), evaluated at temperatures similar to or warmer than that of the present study, also showed lower routine rates than B. microlepidotus (186.9–264.9 mg O2 kg−1 h−1 at ~20 °C). Such differences are unlikely to be explained by temperature alone: across teleosts, resting metabolic rate is higher in pelagic species and lower in hypoxia-tolerant lineages [10], and body mass, feeding state and methodology also differ among the studies compiled in Table 2. The comparison is therefore only indicative, and lifestyle-related explanations remain hypotheses because activity was not measured in the present study.
Beyond extending these benchmarks to a second atherinopsid, the present study differs from our previous work on O. bonariensis [45] in three respects. First, B. microlepidotus is classified as Vulnerable under Chilean conservation legislation, and the present values are intended primarily to support restocking and conservation-oriented culture, a use not addressed in the O. bonariensis study. Second, the experimental conditions differed (rearing temperature ≈20 vs. ≈16 °C; size range 7.8–297 vs. 48–250 g; stocking density 1.1–1.8 vs. 3.2–6.2 kg m−3; Table 2), and the use of an equivalent respirometry protocol in both studies allows a first comparison of two atherinopsids under comparable methodological conditions. Third, the timing of the diurnal peaks relative to the feeding time and to routine laboratory activity (see the limitations below) indicates that sequential closed-block designs may be sensitive to procedural effects, a consideration relevant to future respirometry studies. The contrast between a significant density effect in O. bonariensis and its absence here should be interpreted with caution, because the density ranges did not overlap and the present test had low power.
The pronounced diurnal fluctuation in oxygen consumption observed throughout the 24 h cycle, together with the significant time effect detected by repeated-measures ANOVA, is consistent with the classic postprandial metabolic response known as specific dynamic action (SDA), whereby oxygen consumption rises sharply following feeding, reaches a peak, and then gradually declines toward pre-feeding levels [50]. Without an unfed control, however, feeding-associated swimming, anticipatory behavior and other behavioral responses cannot be separated from SDA, so the diurnal pattern is described here as consistent with, rather than proof of, an SDA response. Relative to other vertebrate groups, this postprandial increase in fish is comparatively moderate, averaging around 136% above standard metabolic rate, compared with increases of up to 687% reported in some reptiles [51]. Relative to the mean routine rate (218.8 mg O2 kg−1 h−1, the arithmetic mean of the four treatment means in Section 3.2), the highest hourly value recorded here (378.0 mg O2 kg−1 h−1) was approximately 1.7 times higher. A similar ratio (≈1.8) is obtained for O. bonariensis from the values in Table 2 (peak of 333.0 relative to 186.2 mg O2 kg−1 h−1, the midpoint of its routine range), and a ratio of ≈1.5 for S. violacea (101–145 relative to 66.0–98.4 mg O2 kg−1 h−1, assuming that the lower and upper values of both ranges correspond to 14 and 18 °C, respectively). These ratios are therefore similar in magnitude among the three taxa for which peak data are available, although they are not strictly comparable because peaks were defined and measured differently in each study. A broadly comparable diel pattern, combining a baseline day–night rhythm with discrete feeding-associated peaks, has recently been documented in goldfish (Carassius auratus) under aquaculture-relevant conditions, in which oxygen consumption was higher during the day than at night and increased by 35% following feeding to satiety, peaking approximately 3 h post-feeding before returning to baseline [52]—a pattern similar to the main peak observed here after the single daily feeding. Similarly, in the Argentine pejerrey study by Mendez et al. [45], oxygen consumption exhibited pronounced postprandial peaks 2–4 h after feeding, with maximum rates reaching up to 333 mg O2 kg−1 h−1, a pattern similar to the diurnal dynamics observed in the present study.
The non-significant treatment × time interaction provides no evidence that the shape of the diurnal pattern differed among the four treatments, despite differences in absolute oxygen consumption related to body size; given the limited replication (n = 3 tanks), however, small differences cannot be excluded.
Using the mean oxygen consumption recorded during the pre-feeding overnight period (00:00–07:00 h) as a reference, the increase in oxygen consumption after feeding ranged from 70.4% (D1S1) to 116.6% (D2S1), averaging 96.7% across treatments. This is of the same order as the ~136% average increase above standard metabolic rate reported for fish [51], although the two values are not strictly comparable, because the overnight period (13–20 h after feeding) is a routine rather than a standard metabolic reference that may still include residual SDA [50,51], and because no unfed control was available. The comparison therefore supports plausibility but does not confirm that the observed fluctuations are SDA.
Given that absolute metabolic rates in ectotherms increase with temperature [8,36], projected increases in water temperature associated with climate change may elevate the routine oxygen demand of B. microlepidotus beyond the benchmarks established here, underscoring the need to periodically revisit species-specific bioengineering parameters as regional thermal regimes shift.
Several limitations should be acknowledged. First, the 2 × 2 factorial design with two body-size classes and two stocking densities provided useful baseline benchmarks but does not permit the development of continuous predictive models or allometric equations across a wider range. Future studies using response-surface designs are recommended. Second, the broad weight ranges within each size class (S1: 7.8–77.8 g; S2: 80–297 g) introduced intra-treatment biological variability that may have reduced statistical sensitivity, and mean body mass differed between density treatments within each size class (Section 2.1), so that size and density effects are partly confounded; individual body mass was not available as a covariate. Third, the number of replicate tanks (n = 3 per treatment) and the narrow range of densities limited statistical power. The non-significant density effect (η2p = 0.19, 90% CI 0.00–0.49) is therefore inconclusive, and a sensitivity analysis indicates that the design could reliably detect only very large effects (Cohen’s f ≈ 0.92, η2p ≈ 0.46, at 80% power) [53,54]. Fourth, individual feed intake was not recorded, and neither nitrogen excretion nor growth-associated nitrogen retention were measured; therefore, a comprehensive nitrogen balance could not be established. Fifth, the absence of behavioral observations and physiological stress assessments, such as cortisol analysis, limits the mechanistic interpretation of the metabolic responses observed under different stocking densities. Sixth, the relatively short duration of the experimental assessments, encompassing only three consecutive 24 h cycles, precluded the calculation of growth performance indicators and other long-term production parameters.
Seventh, the diurnal oxygen consumption pattern displayed two peaks, near 08:00 h and near 14:00 h. Fish were fed once daily at 11:00 h, so the 14:00 h peak, the more pronounced of the two, occurred about three hours after feeding, which is compatible with the 2–4 h window typically associated with SDA onset in fish. However, no unfed control was included, and feeding-associated swimming activity, anticipatory behavior or other behavioral responses cannot be excluded as contributors; the peak is therefore consistent with, but does not demonstrate, an SDA response. The 08:00 h peak preceded feeding by three hours and cannot be attributed to digestion; it coincided with the start of routine laboratory activity, when tanks are first approached each morning, and possibly with the onset of daylight under the natural photoperiod, neither of which could be tested. In addition, both peaks occurred two hours after the start of the 06:00 and 12:00 sealed blocks (and a smaller rise near 20:00 h, also two hours after a block start, is visible in some treatments in Figure 2), so that a procedural effect of the sequential 6 h block design, such as re-sealing or incomplete mixing after aeration was restored, cannot be excluded. Future studies could separate these effects by including fasted controls, randomizing or staggering block start times, and recording oxygen consumption on disturbance-free days. Eighth, the closed-system protocol, in which aeration and water exchange were suspended during each 6 h block, cannot fully rule out a transient acute stress response to confinement as a contributor to oxygen consumption, independent of digestion. Because aeration and circulation were suspended, no mixing was provided other than fish movement, so oxygen heterogeneity within the tank cannot be excluded, and background (microbial and biofilm) oxygen consumption was not measured in fish-free controls; both are recommended practice in aquatic respirometry [55,56]. A gradual accumulation of CO2 and other metabolites toward the end of each block also cannot be excluded: a first-order estimate, assuming a respiratory quotient of 0.8–1.0, no gas exchange and the mean alkalinity (202 mg CaCO3 L−1) and pH (8.37) recorded, indicates that the oxygen decline expected in a block with the 450 L working volume (≈1.6–2.4 mg O2 L−1, derived from tank biomass and the rates measured here) would raise CO2 from ≈1.8 to ≈3.5–5 mg L−1 and lower pH by ≈0.3–0.5 units, but pH and CO2 were not measured during the blocks. Ammonia concentrations remained low in the system (maximum 0.61 mg TAN L−1). Future studies should incorporate continuous-flow (open-system) respirometry or paired sealed/open controls, fish-free blanks and in-tank mixing to partition these effects, and should consider sampling plasma cortisol, glucose or lactate from a subset of fish as complementary indicators of acute stress. Ninth, the oxygen demand values reported here refer only to the fish, were obtained over a limited range of body sizes (7.8–297 g) and stocking densities (1.1–1.8 kg m−3) at a single temperature (~20 °C), and should be extrapolated to commercial RAS with caution. These limitations define the scope of the parameters reported here and should be addressed in future studies.
5. Conclusions
This study provides the first species-specific data on routine oxygen consumption for Basilichthys microlepidotus reared under recirculating aquaculture system (RAS) conditions, addressing a critical knowledge gap for the bioengineering design of culture systems for this endemic and vulnerable Chilean species. Body size was the principal determinant of mass-specific oxygen consumption, with smaller fish exhibiting significantly higher routine rates than larger conspecifics, consistent with the well-documented negative allometric scaling of metabolic rate with body mass in teleosts [36,37]. Within the moderate stocking density range evaluated (1.1–1.8 kg m−3), no significant independent effect of stocking density on oxygen consumption was detected, and no significant interaction with body size was found. Given the low statistical power associated with the density effect (31.6%) and its interaction with body size (9.6%), this result should be interpreted as an absence of a detectable effect under the specific conditions and sample size tested, rather than definitive evidence that stocking density has no biological influence on oxygen demand in this species. A pronounced diurnal pattern, with its main peak about three hours after the single daily feeding, was observed in all treatments; this is consistent with a feeding-related (SDA) response, although the absence of an unfed control and possible procedural effects of the closed-block protocol prevent a firm attribution.
From an applied perspective, the routine oxygen consumption values reported here (186.9–264.9 mg O2 kg−1 h−1) provide a preliminary, species-specific reference for estimating the oxygen demand of fish in RAS designed for B. microlepidotus within the size and density ranges tested, supporting both its aquaculture development and its use in conservation-oriented restocking programs. Future studies should extend these findings across a broader range of stocking densities, body sizes, and water temperatures, and should incorporate direct measurements of standard and maximum metabolic rate to more precisely define the aerobic scope of this species under intensive culture conditions.
As an illustrative example, for a RAS module holding 100 kg of B. microlepidotus biomass, the mean routine oxygen demand of the fish ranges from approximately 21.9 g O2 h−1 (mean of the four treatments) to 26.5 g O2 h−1 (highest treatment mean, small fish at low density), while the highest hourly rate recorded (378.0 mg O2 kg−1 h−1, near 14:00 h, three hours after the single daily feeding) corresponds to 37.8 g O2 h−1 (Table 3), about 1.7 times the mean routine demand. Aeration or oxygenation capacity should therefore be sized on peak rather than mean demand. These values, however, represent only the oxygen consumed by the fish: the capacity to be installed must also cover the oxygen demand of the biofilter and heterotrophic bacteria and must be derived from the standard oxygen transfer rate of the equipment corrected for field conditions (temperature, dissolved oxygen set point, water quality and diffuser fouling), so that an adequate safety margin depends on the oxygen transfer efficiency of the selected system [26,57]. The 20% contingency in Table 3 is an arbitrary illustrative value.
Table 3.
Illustrative aeration design example for a 100 kg B. microlepidotus RAS module, based on the routine and peak oxygen consumption rates reported in this study. The values refer only to the oxygen consumed by the fish.
These values may also inform the management of transport and short-term holding conditions during restocking operations for this Vulnerable, endemic species, where oxygen availability during confinement may influence post-release survival.
Supplementary Materials
The following supporting information can be downloaded at: https://www.mdpi.com/article/10.3390/aquacj6040055/s1, Table S1: Observed statistical power of the two-way ANOVA effects on oxygen consumption rate.
Author Contributions
Conceptualization, C.A.M. and M.C.M.; data curation, C.A.M., C.G., M.L.N. and C.H.-T.; formal analysis, C.A.M. and C.G.; investigation, C.A.M.; methodology, C.A.M.; writing—original draft preparation, C.A.M.; writing—review and editing, C.A.M., C.G., M.L.N., C.H.-T. and M.C.M.; project administration, M.C.M.; funding acquisition, M.C.M. All authors have read and agreed to the published version of the manuscript.
Funding
This work and publication were developed with the support of the project FONDEF ID23I10189 Implementación de un cultivo de pejerrey chileno y pejerrey argentino, como una estrategia promotora de la acuicultura continental de pequeña escala, basada en el manejo de la reproducción y la recirculación del agua.
Institutional Review Board Statement
The animal study protocol was approved by the Ethics and Biotechnology Committee of the Universidad Católica del Norte (UCN), Coquimbo, Chile (CEC UCN No. 45; Approval Date: 16 November 2021). Capture and transport of fish were authorized under research fishing permit E-2023-716 issued by the Under Subsecretaría de Pesca y Acuicultura on 12 November 2023. All animal procedures complied with the guidelines for the care and use of laboratory animals, as reviewed and approved by the Ethics and Biotechnology Committee of the Universidad Católica del Norte (UCN), Coquimbo, Chile.
Informed Consent Statement
Not applicable.
Data Availability Statement
The data presented in this study are available on request from the corresponding author.
Acknowledgments
The authors express their sincere gratitude to the research staff of the Crustaceans Laboratory of the Universidad Catolica del Norte.
Conflicts of Interest
The authors declare no conflict of interest.
References
- Food and Agriculture Organization (FAO). The State of World Fisheries and Aquaculture 2026: Blue Transformation in Action; FAO: Rome, Italy, 2026. [Google Scholar] [CrossRef] [Scilit]
- Food and Agriculture Organization (FAO). The State of World Fisheries and Aquaculture 2024: Blue Transformation in Action; FAO: Rome, Italy, 2024. [Google Scholar] [CrossRef] [Scilit]
- Véliz, D.; Catalán, L.; Pardo, R.; Acuña, P.; Díaz, A.; Poulin, E.; Vila, I.; Poulin, E. The genus Basilichthys (Teleostei: Atherinopsidae) revisited along its Chilean distribution range (21° to 40°S) using variation in morphology and mtDNA. Rev. Chil. Hist. Nat. 2012, 85, 49–59. [Google Scholar] [CrossRef] [Scilit]
- Colin, N. Basilichthys microlepidotus. The IUCN Red List of Threatened Species 2023: e.T230406023A176558676. Available online: https://www.iucnredlist.org/species/230406023/176558676 (accessed on 26 August 2026).
- Rojas, P.M.; Saavedra, S.; Muñoz, C. Progress in farming of Chilean silverside Basilichthys microlepidotus Jenyns, 1841: An alternative for productive diversification. Lat. Am. J. Aquat. Res. 2016, 44, 342–354. [Google Scholar] [CrossRef] [Scilit]
- Chabot, D.; McKenzie, D.J.; Craig, J.F. Metabolic rate in fishes: Definitions, methods and significance for conservation physiology. J. Fish. Biol. 2016, 88, 1–9. [Google Scholar] [CrossRef] [Scilit] [PubMed]
- Timmons, M.B.; Vinci, B.J. Recirculating Aquaculture, 5th ed.; Ithaca Publishing Company: Ithaca, NY, USA, 2023. [Google Scholar]
- Gillooly, J.F.; Brown, J.H.; West, G.B.; Savage, V.M.; Charnov, E.L. Effects of size and temperature on metabolic rate. Science 2001, 293, 2248–2251. [Google Scholar] [CrossRef] [Scilit] [PubMed]
- White, C.R.; Alton, L.A.; Bywater, C.L.; Lombardi, E.J.; Marshall, D.J. Metabolic scaling is the product of life-history optimization. Science 2022, 377, 834–839. [Google Scholar] [CrossRef] [Scilit] [PubMed]
- Killen, S.S.; Glazier, D.S.; Rezende, E.L.; Clark, T.D.; Atkinson, D.; Willener, A.S.T.; Halsey, L.G. Ecological influences and morphological correlates of resting and maximal metabolic rates across teleost fish species. Am. Nat. 2016, 187, 592–606. [Google Scholar] [CrossRef] [Scilit] [PubMed]
- Ellis, T.; North, B.; Scott, A.P.; Bromage, N.R.; Porter, M.; Gadd, D. The relationships between stocking density and welfare in farmed rainbow trout. J. Fish. Biol. 2002, 61, 493–531. [Google Scholar] [CrossRef]
- Martos-Sitcha, J.A.; Mancera, J.M.; Prunet, P.; Magnoni, L.J. Editorial: Welfare and stressors in fish: Challenges facing aquaculture. Front. Physiol. 2020, 11, 162. [Google Scholar] [CrossRef] [Scilit] [PubMed]
- Person-Le Ruyet, J.; Labbé, L.; Le Bayon, N.; Sévère, A.; Le Roux, A.; Le Delliou, H.; Quéméner, L. Combined effects of water quality and stocking density on welfare and growth of rainbow trout (Oncorhynchus mykiss). Aquat. Living Resour. 2008, 21, 185–195. [Google Scholar] [CrossRef] [Scilit]
- Holhorea, P.G.; Naya-Català, F.; Belenguer, Á.; Calduch-Giner, J.A.; Pérez-Sánchez, J. Understanding how high stocking densities and concurrent limited oxygen availability drive social cohesion and adaptive features in regulatory growth, antioxidant defense and lipid metabolism in farmed gilthead sea bream (Sparus aurata). Front. Physiol. 2023, 14, 1272267. [Google Scholar] [CrossRef] [Scilit] [PubMed]
- Neill, W.; Oborny, E.; Craig, S.; Matlock, M.; Gatlin, D. Estimating metabolism of fish in aquacultural production systems. Int. J. Recirc. Aquac. 2003, 4, 25–32. [Google Scholar] [CrossRef] [Scilit][Green Version]
- Merino, G.E.; Piedrahita, R.H.; Conklin, D.E. Routine oxygen consumption rates of California halibut (Paralichthys californicus) juveniles under farm-like conditions. Aquacult. Int. 2009, 41, 166–175. [Google Scholar] [CrossRef] [Scilit]
- Rogers, N.J.; Urbina, M.A.; Reardon, E.E.; McKenzie, D.J.; Wilson, R.W. A new analysis of hypoxia tolerance in fishes using a database of critical oxygen level (Pcrit). Conserv. Physiol. 2016, 4, cow012. [Google Scholar] [CrossRef] [Scilit] [PubMed]
- Reemeyer, J.E.; Rees, B.B. A methodological evaluation of the determination of critical oxygen threshold in an estuarine teleost. Biol. Open 2019, 8, bio045310. [Google Scholar] [CrossRef] [Scilit] [PubMed]
- HACH Company. HACH Water Analysis Handbook Procedures; HACH Company: Loveland, CO, USA, 2003. [Google Scholar]
- American Public Health Association. Standard Methods for the Examination of Water and Wastewater, 19th ed.; APHA: Washington, DC, USA, 1995. [Google Scholar]
- R Core Team. R: A Language and Environment for Statistical Computing; R Foundation for Statistical Computing: Vienna, Austria, 2025; Available online: https://www.R-project.org/ (accessed on 26 August 2026).
- Hoenig, J.M.; Heisey, D.M. The abuse of power: The pervasive fallacy of power calculations for data analysis. Am. Stat. 2001, 55, 19–24. [Google Scholar] [CrossRef] [Scilit]
- Rojas, P.M.; Espinoza, C. Habitat suitability for Chilean silverside (Basilichthys microlepidotus) in the Mataquito River, Maule Region: A geospatial approach. Mar. Freshw. Res. 2018, 69, 1301–1311. [Google Scholar] [CrossRef] [Scilit] [PubMed]
- Thorarensen, H.; Farrell, A.P. The biological requirements for post-smolt Atlantic salmon in closed-containment systems. Aquaculture 2011, 312, 1–14. [Google Scholar] [CrossRef] [Scilit]
- Thorarensen, H.; Gústavsson, A.; Gunnarsson, S.; Árnason, J.; Steinarsson, A.; Björnsdóttir, R.; Imsland, A.K.D. The effect of oxygen saturation on the growth and feed conversion of juvenile Atlantic cod (Gadus morhua L.). Aquaculture 2017, 475, 24–28. [Google Scholar] [CrossRef] [Scilit]
- Timmons, M.B.; Ebeling, J.M. Recirculating Aquaculture; Ithaca Publishing Company: Ithaca, NY, USA, 2010. [Google Scholar]
- Chen, S.; Ling, J.; Blancheton, J.P. Nitrification kinetics of biofilm as affected by water quality factors. Aquacult. Int. 2006, 34, 179–197. [Google Scholar] [CrossRef] [Scilit]
- Parra, J.E.G.; Baldisserotto, B. Effect of water pH and hardness on survival and growth of freshwater teleosts. In Fish Osmoregulation; Baldisserotto, B., Mancera, J.M., Kapoor, B.G., Eds.; Science Publishers: Enfield, NH, USA, 2007; pp. 135–150. [Google Scholar]
- Van Wyk, P.; Scarpa, J. Water quality requirements and management. In Farming Marine Shrimp in Recirculating Freshwater Systems; Van Wyk, P., Davis-Hodgkins, M., Laramore, R., Eds.; Florida Department of Agriculture and Consumer Services: Tallahassee, FL, USA, 1999; pp. 141–162. [Google Scholar]
- Ebeling, J.M.; Timmons, M.B.; Bisogni, J.J. Engineering analysis of the stoichiometry of photoautotrophic, autotrophic, and heterotrophic removal of ammonia-nitrogen in aquaculture systems. Aquaculture 2006, 257, 346–358. [Google Scholar] [CrossRef] [Scilit]
- Randall, D.J.; Tsui, T.K.N. Ammonia toxicity in fish. Mar. Pollut. Bull. 2002, 45, 17–23. [Google Scholar] [CrossRef] [Scilit] [PubMed]
- Piedras, S.R.N.; Pouey, J.L.O.F.; Moraes, P.R.R.; Cardoso, D.F. Lethal concentration (CL50) of un-ionized ammonia for pejerrey larvae in acute exposure. Sci. Agric. 2006, 63, 184–186. [Google Scholar] [CrossRef] [Scilit]
- Miller, D.C.; Poucher, S.; Cardin, J.A.; Hansen, D. The acute and chronic toxicity of ammonia to marine fish and a mysid. Arch. Environ. Contam. Toxicol. 1990, 19, 40–48. [Google Scholar] [CrossRef] [Scilit] [PubMed]
- Sánchez, I.A.; Bastos, R.K.X.; Lanna, E.A.T. Effects of chronic ammonia exposure on growth of genetically improved farmed tilapia (GIFT) cultured under different densities. N. Am. J. Aquac. 2023, 85, 21–30. [Google Scholar] [CrossRef] [Scilit]
- Becke, C.; Schumann, M.; Steinhagen, D.; Rojas-Tirado, P.; Geist, J.; Brinker, A. Effects of unionized ammonia and suspended solids on rainbow trout (Oncorhynchus mykiss) in recirculating aquaculture systems. Aquaculture 2019, 499, 348–357. [Google Scholar] [CrossRef] [Scilit]
- Clarke, A.; Johnston, N.M. Scaling of metabolic rate with body mass and temperature in teleost fish. J. Anim. Ecol. 1999, 68, 893–905. [Google Scholar] [CrossRef] [Scilit]
- Killen, S.S.; Atkinson, D.; Glazier, D.S. The intraspecific scaling of metabolic rate with body mass in fishes depends on lifestyle and temperature. Ecol. Lett. 2010, 13, 184–193. [Google Scholar] [CrossRef] [Scilit] [PubMed]
- Rubalcaba, J.G.; Verberk, W.C.E.P.; Hendriks, A.J.; Saris, B.; Woods, H.A. Oxygen limitation may affect the temperature and size dependence of metabolism in aquatic ectotherms. Proc. Natl. Acad. Sci. USA 2020, 117, 31963–31968. [Google Scholar] [CrossRef] [Scilit] [PubMed]
- Rosén, A.; Andreassen, A.H.; Storm, Z.; Exsteen, J.W.; Moesby, A.F.; Raqbi, S.; Beldane, R.; Mills, S.; Norin, T. Co-variation and trade-offs in ontogenetic scaling of growth and metabolic rates in teleost fish. Commun. Biol. 2026, 9, 338. [Google Scholar] [CrossRef] [Scilit] [PubMed]
- Lefrançois, C.; Claireaux, G.; Mercier, C.; Aubin, J. Effect of density on the routine metabolic expenditure of farmed rainbow trout (Oncorhynchus mykiss). Aquaculture 2001, 195, 269–277. [Google Scholar] [CrossRef] [Scilit]
- Laursen, D.C.; Silva, P.I.M.; Larsen, B.K.; Höglund, E. High oxygen consumption rates and scale loss indicate elevated aggressive behavior at low rearing density, while elevated brain serotonergic activity suggests chronic stress at high rearing densities in farmed rainbow trout. Physiol. Behav. 2013, 122, 147–154. [Google Scholar] [CrossRef] [Scilit] [PubMed]
- Roy, J.; Terrier, F.; Marchand, M.; Herman, A.; Heraud, C.; Surget, A.; Lanuque, A.; Sandres, F.; Marandel, L. Effects of low stocking densities on zootechnical parameters and physiological responses of rainbow trout (Oncorhynchus mykiss) juveniles. Biology 2021, 10, 1040. [Google Scholar] [CrossRef] [Scilit] [PubMed]
- Larsen, B.K.; Skov, P.V.; McKenzie, D.J.; Jokumsen, A. The effects of stocking density and low level sustained exercise on the energetic efficiency of rainbow trout (Oncorhynchus mykiss) reared at 19 °C. Aquaculture 2012, 324–325, 226–233. [Google Scholar] [CrossRef] [Scilit]
- Kır, M. Thermal tolerance and standard metabolic rate of juvenile gilthead seabream (Sparus aurata) acclimated to four temperatures. J. Therm. Biol. 2020, 93, 102739. [Google Scholar] [CrossRef] [Scilit] [PubMed]
- Mendez, C.A.; Galleguillos, C.; Harris-Toro, C.; Nava, M.L.; Morales, M.C. Effects of body size and stocking density on oxygen consumption and ammonia excretion in the Argentine silverside (Odontesthes bonariensis) reared in a recirculating aquaculture system. Animals 2026, 16, 2114. [Google Scholar] [CrossRef] [Scilit] [PubMed]
- Nerici, C.; Merino, G.; Silva, A. Effect of two temperatures on the oxygen consumption rates of Seriolella violacea (palm fish) juveniles under rearing conditions. Aquacult. Eng. 2012, 48, 40–46. [Google Scholar] [CrossRef] [Scilit]
- Kieffer, J.D.; Alsop, D.; Wood, C.M. A respirometric analysis of fuel use during aerobic swimming at different temperatures in rainbow trout (Oncorhynchus mykiss). J. Exp. Biol. 1998, 201, 3123–3133. [Google Scholar] [CrossRef] [Scilit] [PubMed]
- Zakes, Z.; Demska-Zakes, K.; Jarocki, P.; Stawecki, K. The effect of feeding on oxygen consumption and ammonia excretion of juvenile tench Tinca tinca (L.) reared in a water recirculating system. Aquacult. Int. 2006, 14, 127–140. [Google Scholar] [CrossRef] [Scilit]
- Zakes, Z.; Szczepkowski, M.; Demska-Zakes, K.; Jesiołowski, M. Oxygen consumption and ammonia excretion by juvenile pike, Esox lucius L. Arch. Pol. Fish. 2007, 15, 79–92. [Google Scholar]
- Jobling, M. The influences of feeding on the metabolic rate of fishes: A short review. J. Fish. Biol. 1981, 18, 385–400. [Google Scholar] [CrossRef] [Scilit]
- Secor, S.M. Specific dynamic action: A review of the postprandial metabolic response. J. Comp. Physiol. B 2009, 179, 1–56. [Google Scholar] [CrossRef] [Scilit] [PubMed]
- Herrera-Castillo, L.; Vallejo-Palma, G.; Saiz, N.; Sánchez-Jiménez, A.; Isorna, E.; Ruiz-Jarabo, I.; de Pedro, N. Metabolic rate of goldfish (Carassius auratus) in the face of common aquaculture challenges. Biology 2024, 13, 804. [Google Scholar] [CrossRef] [Scilit] [PubMed]
- Lakens, D. Sample size justification. Collabra Psychol. 2022, 8, 33267. [Google Scholar] [CrossRef] [Scilit]
- Steiger, J.H. Beyond the F test: Effect size confidence intervals and tests of close fit in the analysis of variance and contrast analysis. Psychol. Methods 2004, 9, 164–182. [Google Scholar] [CrossRef] [Scilit] [PubMed]
- Rodgers, G.G.; Tenzing, P.; Clark, T.D. Experimental methods in aquatic respirometry: The importance of mixing devices and accounting for background respiration. J. Fish. Biol. 2016, 88, 65–80. [Google Scholar] [CrossRef] [Scilit] [PubMed]
- Killen, S.S.; Christensen, E.A.F.; Cortese, D.; Závorka, L.; Norin, T.; Cotgrove, L.; Crespel, A.; Munson, A.; Nati, J.J.H.; Papatheodoulou, M.; et al. Guidelines for reporting methods to estimate metabolic rates by aquatic intermittent-flow respirometry. J. Exp. Biol. 2021, 224, jeb242522. [Google Scholar] [CrossRef] [Scilit] [PubMed]
- Boyd, C.E.; Watten, B.J. Aeration systems in aquaculture. Rev. Aquat. Sci. 1989, 1, 425–472. [Google Scholar] [CrossRef] [Scilit]

Disclaimer/Publisher’s Note: The statements, opinions and data contained in all publications are solely those of the individual author(s) and contributor(s) and not of MDPI and/or the editor(s). MDPI and/or the editor(s) disclaim responsibility for any injury to people or property resulting from any ideas, methods, instructions or products referred to in the content. |
© 2026 by the authors. Licensee MDPI, Basel, Switzerland. This article is an open access article distributed under the terms and conditions of the Creative Commons Attribution (CC BY) license.