


Abstract
Indoor environmental quality (IEQ) in naturally ventilated hospitals presents significant challenges in tropical regions, where seasonal climatic variability and limited environmental control may compromise indoor air quality (IAQ) and thermal comfort (TC). However, comparative field evidence from African healthcare facilities remains limited. This study investigated seasonal IEQ conditions in two naturally ventilated intensive care units (ICUs) in the Democratic Republic of the Congo (DRC). Environmental monitoring and questionnaire-based assessments were conducted during rainy and dry seasons at Jason Sendwe Hospital (JSH), Lubumbashi, and Hôpital du Cinquantenaire (HDC), Kinshasa. Measurements included operative temperature, relative humidity, CO2, PM2.5, PM10, and a VOC-based IAQ index. Subjective assessments from 348 healthcare workers examined perceived IAQ, thermal sensation, and self-reported symptoms. Exploratory PMV–PPD calculations complemented the thermal assessment. The CO2 concentrations ranged from 1977 to 2600 ppm at JSH and 1437–2733 ppm at HDC, with higher values during the dry season. Reported PM2.5 concentrations reached 228 and 237 µg/m3, respectively, indicating potentially substantial particulate pollution. VOC-based IAQ indices were higher during the rainy season. At JSH, 80% and 74% of respondents rated IAQ as poor or very poor during rainy and dry seasons, respectively. Both hospitals exhibited a pronounced seasonal reversal in thermal conditions, characterized by warm rainy-season conditions and predominantly cold dry-season thermal sensations. Exploratory PMV–PPD estimates indicated greater predicted warm discomfort at HDC. The findings identify a dual seasonal thermal challenge in naturally ventilated tropical ICUs, where warm-season and cool-season discomfort coexist with substantial IAQ concerns. By demonstrating this pattern across hospitals in contrasting climatic and urban environments, the study extends existing evidence beyond the predominant focus on overheating and highlights the need for integrated, seasonally adaptive ventilation and pollutant-control strategies in resource-constrained healthcare facilities.
1. Introduction
Indoor environmental quality (IEQ) affects occupant health [1]. This is especially true in hospitals, which have complex facilities where doctors, staff, and other people spend long hours. Most hospital occupants have specific medical requirements and are vulnerable. Thus, hospitals strictly manage IEQ, including indoor air quality (IAQ), thermal comfort (TC), lighting, and acoustics. Poor IAQ may cause SBS symptoms such as headaches, chest tightness, and dry eyes, reducing work productivity [2]. Improving hospital IAQ may reduce environmental risk factor-related sick building syndrome (SBS). IAQ in vulnerable environments like hospitals, where patients spend time during treatment, is important. Poor air quality in inpatient settings may directly affect occupants, particularly those with weak immune systems who spend long hours in the facilities [3,4]. Indoor and outdoor pollutants may pollute hospital IAQs with, among other pollutants, carbon dioxide, carbon monoxide, VOCs, particulate matter, viruses breathed by patients, bacterial proliferation, and mold growth [5,6]. Outdoor pollution, including NO2, PM2.5, and PM10, comes from vehicle emissions, road dust, industrial activities, and biomass burning [7]. Indoor pollution sources include CO2 from human activity, VOCs from building chemicals and furniture, and PM2.5 from cooking and copy machines [7]. Pollution exposure may induce allergies, headaches, nausea, dizziness, asthma, and other respiratory and cardiovascular problems in residents [8,9]. Jung et al. assessed several primary airborne pollutants at 37 hospitals in Taiwan, such as CO, CO2, TVOC, PM2.5, PM10, airborne bacteria, and fungus [10]. Inpatient rooms had greater CO2 and TVOC levels than nurse stations, clinics, and waiting spaces. CO2 and TVOC values in inpatient rooms exceed Taiwan’s IAQ standards [10]. A study found that CO2 produced by inhabitants is a proxy for IAQ and a risk marker for the spread of airborne diseases [11,12]. Another study revealed airborne nosocomial transmission, often in multi-bed hospital wards, due to the concentration of infectious and vulnerable patients [13]. Perfumes, hygiene and cleaning products, building structures, furnishings, and materials release VOCs. Hospitals often use hand sanitizers, which increase indoor VOC levels. When hand sanitizers containing ethanol and propanol are applied, contamination levels rise [14]. In addition, other chemicals like alcohol, cleaning products, anesthetic gases, pharmaceuticals, and medicines are also utilized in patient and operating rooms. Several studies found that healthcare personnel are exposed to complex VOC mixtures from different pollutants, such as disinfection and cleaning products employed in these environments [15,16]. Fine particles with an aerodynamic diameter < 2.5 µm (PM2.5) are health-relevant because they can penetrate deep into the lungs [17]. PM2.5 is a strong indicator of the danger of ambient air pollution. Worldwide, PM2.5 exposure reduces life expectancy and increases disease [18]. Long- and short-term PM2.5 exposure increases morbidity and mortality, and these health impacts depend on PM2.5 concentration, composition, size, exposure duration, and age [7,19]. Although previous studies have documented IAQ and ventilation challenges in tropical hospitals, including those in the DRC [20,21,22], field-based evidence from hospitals in the country’s mining regions remains limited. This study extends existing research by integrating objective pollutant measurements with healthcare workers’ perceptions and self-reported symptoms across rainy and dry seasons, providing comparative evidence from two hospitals under distinct environmental conditions. Poor indoor climate can impact patients’ recovery and well-being, as they spend most of their time in these settings [23,24]. A study has revealed that the TC needs of patients and staff in hospitals vary significantly due to the health state of each group in the hospital [25]. A patient’s illness might immediately impact their thermal sensation, metabolic rate, and regulatory response. Field investigations in Thailand national hospitals on TC reported comparatively wider ranges for patients 21.8 °C to 27.9 °C and visitors (22 °C to 27.1 °C) than for hospital workers (24.1 °C to 25.6 °C) [26]. According to the research, 26.4 °C served as the neutral temperature for hospitals in Malaysia, while the range of 25.3 °C to 28.2 °C for excellent TC hindered 90% of the inhabitants. Several studies have evaluated thermal conditions in hospital buildings and found that indoor air temperature ranges from 25 °C to 29 °C [27,28,29,30,31], which may affect medical staff performance. It can lead to unhealthy indoor environments. In recent years, during the global COVID-19 pandemic, multiple investigations of the relationship between ambient temperature and RH and the risk of infectious aerosols and pathogens; for instance, their common findings allude to the conclusions that the SARS-CoV-2 virus remains active at low temperatures and low RH [32,33,34]. Moreover, Ref. [35] notes that low temperatures may cause occupant discomfort and can promote germ proliferation and infection among ward patients. Also, regarding indoor RH levels, a study [36] reported that high temperature and humidity [37] promote bacterial growth, spread, and thermal discomfort. In contrast, low humidity [38] negatively affects comfort and health by drying the nose, throat, eyes, skin, and respiratory system [36,39]. Moreover, low RH may also enhance influenza infection rates [40] in patients and personnel who spend time in hospitals and need natural light. Ulrich et al. have revealed that adequate light reduces depression and decreases fatigue [41]. Inadequate illumination in buildings has been linked to eye strain, sleep disturbances, and headaches. A study of lighting in patient rooms revealed a strong link between the daylight interior environment and patients’ average length of stay in the hospital [42,43]. Moreover, patients hospitalized in the southeast area had a shorter length of stay than those in the northwest region. Integrating quality light into patient settings can improve recovery and staff performance by reducing medication-dispensing errors in the hospital [44]. Lighting limitations have also been reported in DRC intensive care units [45]. In sub-Saharan Africa, IEQ is challenged by the region’s hot, humid climate and economic constraints, which affect TC and ventilation. Access to advanced climate-control technologies is often limited, limiting efforts to improve infrastructure.
In the DRC, maintaining adequate IEQ in hospitals presents significant challenges associated with industrial emissions, mining activities, seasonal climatic variability, and limited environmental control, particularly in mining-intensive regions such as Lubumbashi. Previous studies have reported elevated ambient PM2.5 concentrations in Kinshasa [46] and substantial particulate pollution along urban roads in Lubumbashi [47], highlighting the environmental pressures affecting both cities. Mining and associated industrial activities represent potential sources of airborne PM and metal-containing dust that may infiltrate naturally ventilated hospitals, where vulnerable patients and healthcare workers spend extended periods. Previous investigations in the DRC have also identified ventilation and acoustic deficiencies in hospital environments [21,22,48], inadequate ICU lighting with implications for healthcare workers’ visual comfort and occupational performance [45], and broader public health and equity concerns associated with poor IAQ [49]. Collectively, these findings emphasize the importance of hybrid ventilation, occupant-informed design, and affordable environmental monitoring for improving IEQ in resource-constrained tropical hospitals [49]. This study evaluates indoor environmental conditions (IEC) in naturally ventilated ICUs at two hospitals in contrasting urban environments in the DRC: Hôpital du Cinquantenaire (HDC) in the dense metropolitan environment of Kinshasa and Jason Sendwe Hospital (JSH) in the industrial and mining context of Lubumbashi. The study combines objective measurements of indoor temperature, RH, CO2, VOC index, PM2.5, and PM10 with healthcare workers’ subjective assessments of IAQ, thermal sensation, thermal satisfaction, and self-reported health symptoms during the rainy and dry seasons. By integrating seasonal objective and subjective assessments, the study aims to (i) characterize seasonal variations in IAQ and thermal conditions; (ii) assess healthcare workers’ perceptions of IAQ and TC; (iii) examine the correspondence between subjective responses and measured environmental conditions; and (iv) compare IEQ performance between two hospitals located in contrasting climatic and urban contexts. Particular attention is given to dry-season cold discomfort, which complements the prevailing emphasis on overheating in tropical healthcare buildings. The findings provide field evidence to support climate-responsive and context-specific IEQ strategies for NV healthcare facilities in resource-constrained tropical environments.
2. Materials and Methods
2.1. Location Description
This study investigates the indoor climate parameters of two hospital buildings located in distinct urban environments within the DRC: one in a residential area and the other in an industrial town. The research focuses on two specific hospitals: Hospital Du Cinquantenaire (HDC) in Kinshasa and Jason Sendwe Hospital (JSH) in Lubumbashi. The HDC, situated in Kinshasa, the capital city of the DRC, was constructed in 1924. The hospital occupies a total of 40,000 square meters, comprising seven floors above ground. It is a large facility with 2000 patient beds and employs approximately 1200 healthcare professionals, including doctors, nurses, and allied health staff. The climate in Kinshasa during the rainy season is characterized by temperatures ranging from 20 °C to 37 °C, which presents unique challenges for maintaining a stable indoor environment in the hospital. On the other hand, the JSH is located in Lubumbashi, the second-largest city in the DRC. Lubumbashi’s industrial nature is highlighted by the hospital’s proximity to a mine and a mineral processing plant, situated just 8 km away. Established in 1925, JSH spans a total area of 35,000 square meters and has five floors above ground. The hospital accommodates 1250 patients and has a workforce of around 500 employees. Unlike Kinshasa, Lubumbashi experiences a more temperate climate, with temperatures consistently ranging between 10 °C and 25 °C throughout the dry and rainy seasons.
Figure 1a,b show the external and internal views of the investigated room at HDC, while Figure 2a,b present the corresponding external and internal views at JSH. In both hospitals, the investigated ICU wards rely on NV, underscoring the important role of this passive cooling strategy in regulating the indoor environment within these critical care spaces.
Figure 1.
Illustration of the HDC. (a) External view and (b) inpatient ward.
Figure 2.
Illustration of the JSH. (a) External view and (b) inpatient ward.
2.2. Methods
A seasonal observational field study was conducted in the NV in the ICUs of JSH and HDC in the DRC. The study integrated objective environmental monitoring with structured questionnaire-based assessments to characterize IEQ during rainy and dry season conditions. Environmental parameters included operative temperature (To), RH, CO2, a VOC-related indoor air quality index, and particulate matter (PM2.5 and PM10). Subjective assessments addressed thermal sensation, thermal satisfaction, perceived IAQ, and self-reported health symptoms among healthcare workers. Environmental monitoring was conducted during the rainy-season campaign between October and November 2021, and the dry-season campaign between June and July 2022. Objective measurements and questionnaire responses were obtained within the same seasonal campaigns; however, individual questionnaire records were not linked to environmental measurements by participant identity, monitoring time, work shift, or precise location. Accordingly, the two datasets were evaluated as complementary but analytically distinct sources of evidence. Their combined interpretation provides a broader characterization of seasonal IEC and occupants’ perceptions without establishing individual-level exposure response relationships or causal associations between pollutant concentrations and reported symptoms.
2.3. Questionnaire Recruitment and Subjective IEQ Assessment
Healthcare workers in the selected ICUs were recruited for a structured IEQ questionnaire. Eligible participants were nurses, physicians, and allied health professionals with at least one year of hospital experience who worked in the ICUs during the study periods; patients were excluded because clinical conditions may alter thermal sensation and environmental perception. The questionnaire link was distributed electronically, and participants could complete either the French or English version. The rainy-season questionnaire was available from 22 October to 7 November 2021 and the dry-season questionnaire from 28 June to 23 July 2022. A total of 348 healthcare workers participated in the study, comprising 164 respondents from JSH and 184 from HDC. Female participants represented the majority at both hospitals (54.9% and 59.2%, respectively). Nurses constituted the largest occupational group, accounting for 57.3% of respondents at JSH and 54.9% at HDC. The distribution of age and professional experience varied between hospitals, providing relevant contextual information for interpreting healthcare workers’ perceptions of IEC. The sociodemographic and occupational characteristics of the study participants are presented in Table 1.
Table 1.
Participants’ parameters for the hospital’s Indoor environmental quality.
2.4. Institutional Review Board Statement
The study was conducted in accordance with the ethical principles of the Declaration of Helsinki and was approved by the Ethics Committee of the University Official of Mbuji-Mayi (UOM), Democratic Republic of the Congo (protocol code UOM-CE/2020/870, approved on 13 March 2020). All participants were informed about the purpose and procedures of the study, the voluntary nature of their participation, their right to participate or withdraw without consequences, and the confidentiality and intended use of the collected information. Electronic informed consent was obtained from all participants before completion of the questionnaire. Participation was voluntary, and no directly identifying personal information was collected or included in the analysis.
2.5. Survey Questionnaires
Subjective IEQ was assessed using a structured electronic questionnaire administered through the Encuestafacil platform in French and English. The questionnaire comprised six domains: (i) demographic characteristics and clothing information; (ii) thermal sensation; (iii) thermal satisfaction; (iv) thermal preference; (v) perceived IAQ and self-reported health symptoms; and (vi) lighting satisfaction. Thermal sensation was evaluated using a seven-point scale based on ISO 7730:2005 [50], while perceived IAQ was assessed using a five-point ordinal scale ranging from very poor to very good. Responses were analyzed descriptively to characterize perceived environmental conditions and self-reported symptoms, without constituting validated clinical outcomes. The questionnaire is provided in the Appendix A.
2.6. Environmental Monitoring Instrumentation and Data Processing
Indoor environmental conditions were monitored using four AURA IEQ multiprobe units (Art. No. 13701; serial No. SN0004A30B0005AO8; Colswe Consulting AB, Tyresö, Sweden), operated through the AURA IEQ DISCOVERER software platform (Version 10.11) [51], and two TROTEC PC220 optical particle counters (TROTEC GmbH, Heinsberg, Germany). The AURA system monitored air temperature, RH, CO2 concentration, atmospheric pressure (Pa), illuminance, and a VOC-based indoor air quality (IAQ) index, with To assessed using a supplementary probe. The AURA IEQ DISCOVERER platform supported continuous data acquisition, automated recording, and classification of IEC according to EN 16798-1, alongside VOC-based IAQ assessment. The technical specifications, calibration, and sampling characteristics of both monitoring systems are summarized in Table 2. A Brüel & Kjær Type 1212 instrument (Brüel & Kjær Sound & Vibration Measurement A/S, Nærum, Denmark) and two TROTEC data loggers, DL200X and DL200L (Trotec GmbH, Heinsberg, Germany), were also used for reference measurements.
Table 2.
Monitoring instrument specifications, calibration, and sampling characteristics.
Monitoring devices were positioned in the occupied zone approximately 1.2 m above the floor and about 2.5 m from walls and windows. The AURA platform recorded readings at nominal 5 s intervals (a theoretical maximum of 17,280 measurements per 24 h per channel during uninterrupted logging). Two PC220 counters provided optically estimated PM2.5 and PM10 mass concentrations across six particle-size channels (0.3–10 µm). As documented in the study, PM sampling was organized in three one-hour periods (morning, midday, and afternoon) each monitoring day, with 60 s acquisitions and pre-monitoring zero-filter checks. The five reported summary days per hospital-season should not be confused with the full field-campaign dates. This protocol was implemented during the rainy- and dry-season monitoring campaigns at both hospitals to characterize within-day and seasonal variations in PM concentrations. Technical specifications, calibration references, and sampling characteristics for both monitoring systems are summarized in Table 2.
Figure 3 illustrates the placement of the environmental monitoring equipment in the investigated ICU wards at JSH and HDC. The instruments were positioned within the occupied zone to characterize conditions near occupant level. However, localized airflow and spatial variations in pollutant concentrations and thermal conditions may not have been fully captured by the monitoring locations. Consequently, these measurements are interpreted as observations at the selected sampling locations rather than definitive representations of conditions throughout each ICU.
Figure 3.
Spot monitoring and data logger position in patients’ rooms in JSH (a) and HDC (b).
2.7. Thermal Comfort Calculations and Standards Interpretation
Thermal comfort was assessed using the Predicted Mean Vote (PMV) and Predicted Percentage of Dissatisfied (PPD) indices in accordance with ISO 7730:2005 [50]. Calculations were performed using an iterative spreadsheet procedure, adopting a metabolic rate of 1.2 met, clothing insulation of 0.7 clo, and air velocity of 0.1 m/s to represent relatively low-activity healthcare work under lightweight clothing conditions. Sensitivity analyses incorporating an air velocity of 0.3 m/s and a metabolic rate of 2.5 met were conducted to examine the influence of increased air movement and physical activity on thermal comfort predictions. Since these parameters were assumed rather than individually measured, and the original mean radiant temperature inputs could not be fully reconstructed, PMV–PPD estimates were treated as exploratory and examined alongside measured To, RH, and questionnaire-based thermal sensation. To complement the thermal assessment, IAQ was evaluated using established reference criteria. Indoor CO2 concentrations were examined in relation to EN 16798-1:2019 [52], which defines IAQ categories based on CO2 increments above outdoor concentrations. PM2.5 and PM10 concentrations were contextualized against the WHO 2021 air quality guideline values of 15 and 45 µg/m3, respectively, expressed as 24 h averages [7]. Given the intermittent PM sampling protocol, these comparisons were used to characterize concentration magnitudes rather than establish compliance with the 24 h guidelines. Table 2 presents the complementary TC and IAQ reference criteria adopted for the comparative assessment of the two hospitals, following the integrated evaluation approach of Gameiro da Silva et al. [53]. These include To ranges for heating and cooling conditions and CO2-based ventilation criteria derived from EN 16798-1:2019 [52], together with the dimensionless VOC-based IAQ index classifications associated with the Bosch BME680 sensor [54]. Table 3 summarizes the classification criteria for TC and IAQ based on operative temperature, CO2 concentration, outdoor airflow rate, and VOC index.
Table 3.
Classification criteria for thermal comfort (TC) and indoor air quality (IAQ) based on operative temperature, CO2 concentration, outdoor airflow rate, and VOC-based IAQ index.
Table 3 shows that indoor environmental quality is classified into four categories (I–IV), reflecting different levels of thermal comfort and ventilation performance. Category I represents the most stringent conditions, whereas Category IV corresponds to less demanding environmental criteria. The operative temperature ranges vary according to seasonal clothing insulation, while CO2 concentration and outdoor airflow rates provide indicators of ventilation adequacy. The VOC index is classified separately into six descriptive levels, ranging from good (0–50) to very bad (301–500). These classifications provide a comparative framework for interpreting the measured indoor conditions in the investigated ICUs. However, the thermal and ventilation categories are used as general reference criteria rather than healthcare-specific compliance thresholds, and the dimensionless VOC index should not be interpreted as a direct measurement of pollutant concentration or health risk.
Environmental measurements were presented using color-coded background bands, consistent with previous studies [45,55], with dark gray indicating values outside the selected reference ranges. These bands supported seasonal and inter-hospital comparisons without establishing definitive exposure classifications, given the absence of simultaneous outdoor CO2 measurements and complete VOC-index calibration data. Monitoring employed the AURA IEQ multiprobe system, previously applied in hospital IEQ investigations in the DRC [21,45]. Through the AURA IEQ DISCOVERER platform, the system recorded air temperature, RH, atmospheric pressure, illuminance, CO2 concentration, and a VOC-based IAQ index. To was measured using a supplementary probe, while the VOC index provided a dimensionless indicator rather than a direct measure of VOC mass concentration.
3. Results
This section presents the results of the subjective and objective IEQ assessments conducted at JSH and HDC during the rainy and dry seasons. The analysis includes healthcare workers’ perceptions of IAQ, overall satisfaction with IEQ, self-reported symptoms, objective measurements of CO2, VOC index, PM2.5 and PM10, monitored thermal conditions, RH, thermal sensation votes (TSV), and exploratory statistical relationships among selected environmental variables.
3.1. Indoor Air Quality
3.1.1. Occupants’ Perception of Indoor Air Quality
Occupants’ perceptions of IAQ showed substantial dissatisfaction at both hospitals during the two monitoring seasons. Healthcare workers evaluated IAQ using a five-point scale ranging from very poor to very good, as presented in Figure 4.
Figure 4.
Seasonal occupant satisfaction with indoor air quality at JSH and HDC during the rainy and dry seasons.
Figure 4 shows the satisfaction of healthcare workers in both JSH and HDC during the rainy and dry seasons. At JSH, 80% of respondents during the rainy season and 74% during the dry season rated IAQ as either poor or very poor. A similar distribution was observed at HDC, where poor and very poor ratings also represented most responses across both seasons. During the rainy season, no respondents at JSH selected the average category, whereas nearly 2% of respondents at HDC rated IAQ as average. Overall, the response distributions indicate that negative perceptions of IAQ predominated at both hospitals, with only limited variation between seasons.
Figure 5 presents healthcare workers’ perceptions of odor, air cleanliness, and air stuffiness at JSH and HDC during both seasons. Odor received the highest proportion of negative responses at both hospitals during the rainy season. During the dry season, air cleanliness became more prominent at JSH, whereas odor remained the most frequently reported concern at HDC. Air stuffiness generally received the lowest proportion of responses across both hospitals and seasons. Overall, the distributions demonstrate seasonal and inter-hospital differences in the specific IAQ characteristics perceived by healthcare workers.
Figure 5.
Occupant’s perception regarding indoor air quality categories in both JSH and HDC.
3.1.2. Overall Satisfaction with IEQ
A broader assessment was conducted to determine occupants’ satisfaction with the different components of the indoor environment. The evaluated parameters included TC, acoustic, visual, spatial, and furniture-related conditions, with the overall response distribution presented in Figure 6.
Figure 6.
Healthcare workers’ satisfaction with Indoor environmental quality at JSH and HDC across seasons.
Figure 6 illustrates healthcare workers’ satisfaction with different IEQ parameters at JSH and HDC during the rainy and dry seasons. Room layout and furniture received relatively favorable ratings at both hospitals, while TC, acoustic conditions, and visual comfort showed lower satisfaction levels. Thermal satisfaction exhibited seasonal differences, with a variation of approximately 12 percentage points at HDC compared with 4 percentage points at JSH, indicating greater seasonal variability at HDC. These findings reveal that healthcare workers’ satisfaction differs across IEQ parameters, hospitals, and seasons. They also suggest that adequate spatial conditions do not necessarily ensure satisfactory environmental comfort. Overall, the results highlight the importance of improving thermal, acoustic, and visual conditions through integrated, seasonally responsive IEQ management strategies in NV hospitals.
3.1.3. Reported Health Symptoms
In addition to comfort and satisfaction, the questionnaire evaluated the occurrence of selected health symptoms among healthcare workers during the monitoring periods. The prevalence of the reported symptoms at both hospitals and in both seasons is summarized in Figure 7.
Figure 7.
Self-reported health symptoms among healthcare workers at JSH and HDC in both seasons.
Figure 7 shows that eye irritation, sore throat, and fatigue were among the most often reported symptoms, exceeding 70% in several hospitals season combinations. At JSH, fatigue and eye irritation were more frequently reported during the dry season, whereas sore throat and headache were more prominent during the rainy season. At HDC, eye irritation, sore throat, and fatigue were particularly prevalent during the rainy season, while laryngitis, sinusitis, and allergic rhinitis increased during the dry season.
3.2. Objective Indoor Air Quality Assessment
Objective environmental monitoring complemented the subjective assessments by characterizing indoor CO2 concentrations, VOC-indices, PM2.5 and PM10 under rainy- and dry-season conditions. Daily mean values and associated SDs for JSH are presented in Table 4. For contextual comparison, the 2021 WHO Global Air Quality Guidelines [7] recommend 24 h mean concentrations of 15 µg/m3 for PM2.5 and 45 µg/m3 for PM10.
Table 4.
Reported daily mean values and standard deviations of indoor environmental parameters at JSH during rainy and dry seasons.
Table 4 presents the daily mean pollutant concentrations at JSH, with CO2 levels ranging from 1977 to 2600 ppm and higher concentrations observed during the dry season. The VOC-based IAQ index ranged from 136 to 222, while PM2.5 and PM10 concentrations varied between 141 and 228 µg/m3 and 445 and 582 µg/m3, respectively. Both PM fractions exhibited higher concentrations during the dry season, with reported values exceeding the numerical thresholds of the WHO 2021 24 h air quality guidelines. Corresponding seasonal pollutant concentrations at HDC are presented in Table 5.
Table 5.
Reported daily mean values and standard deviations of indoor environmental parameters at HDC during rainy and dry seasons.
Table 5 presents the daily mean pollutant concentrations at HDC, with CO2 levels ranging from 1437 to 2733 ppm. Rainy-season concentrations varied between 1437 and 1994 ppm, whereas dry-season values consistently exceeded 2500 ppm. The VOC-based IAQ index ranged from 143 to 229, while PM2.5 and PM10 concentrations ranged from 113 to 237 µg/m3 and 277 to 553 µg/m3, respectively. Similar to JSH, CO2 and PM concentrations were generally higher during the dry season. All reported PM concentrations were numerically above the WHO 2021 24 h guideline values of 15 µg/m3 for PM2.5 and 45 µg/m3 for PM10 [7], although the intermittent sampling protocol precludes definitive assessment of 24 h guideline exceedances.
3.2.1. Seasonal Variation in CO2
Seasonal differences in ventilation-related conditions were further examined using the temporal variation in daily mean CO2 concentrations. The values and corresponding standard deviations for the two hospitals are shown in Figure 8.
Figure 8.
Daily mean and SD of CO2 concentrations at (a) JSH and (b) HDC in both seasons.
Figure 8 presents seasonal variations in indoor CO2 concentrations at JSH and HDC, evaluated against the EN 16798-1 IAQ categories and the additional discomfort zone indicated in the figure. At JSH (Figure 8a), CO2 concentrations ranged from approximately 1950 to 2350 ppm during the rainy season and from 2400 to 2600 ppm during the dry season. All measurements exceeded the upper boundary of Category IV and fell within the designated discomfort zone. At HDC (Figure 8b), rainy-season concentrations ranged from approximately 1500 to 2100 ppm, with the lowest measurements near the upper Category IV boundary and the remaining observations extending into the discomfort zone. During the dry season, concentrations increased to approximately 2500–2700 ppm, with all measurements falling within the discomfort zone. Overall, concentrations were higher during the dry season at both hospitals, with a more pronounced seasonal variation at HDC. Measurements exceeding the Category IV boundary predominated, particularly during the dry season.
3.2.2. VOC Index
A different seasonal pattern was observed for volatile organic compounds. Daily mean VOC index values and their variability at the two hospitals are presented in Figure 9.
Figure 9.
Daily mean VOCs IAQ index values and standard deviations at (a) JSH and (b) HDC during the rainy and dry seasons.
Figure 9 presents the seasonal variation in the VOC-index at (a) JSH and (b) HDC. At JSH, rainy-season values ranged from 196 to 222, compared with 136 to 165 during the dry season. Similarly, HDC recorded higher values during the rainy season, ranging from 202 to 229, whereas dry-season values remained relatively stable between 143 and 149. According to the displayed classification bands, rainy-season observations predominantly fell within the “Worse” category at both hospitals, while dry-season values were mainly distributed between the “Little Bad” and “Bad” categories at JSH and within the “Little Bad” category at HDC. No observations reached the “Very Bad” category. Overall, both hospitals exhibited consistently higher VOC index values during the rainy season, with a greater seasonal difference observed at HDC.
3.3. Thermal Comfort
Thermal conditions exhibited marked seasonal variations at both hospitals. The assessment combined continuous To measurements, RH, subjective TSV, and PMV–PPD indices.
3.3.1. Operative Temperature
Continuous monitoring revealed a substantial shift in To between rainy and dry seasons. The temporal profiles obtained at JSH and HDC are presented in Figure 10.
Figure 10.
Operative-temperature profiles at JSH ((A-1): rainy season; (A-2): dry season) and HDC ((B-1): rainy season; (B-2): dry season).
Figure 10 shows a pronounced seasonal contrast. At JSH, rainy-season operative temperatures ranged approximately from 27.5 to 30.4 °C, with short-term peaks approaching 32 °C, whereas dry-season temperatures remained close to 20.7–21.0 °C. At HDC, rainy-season values ranged approximately from 24.9 to 34.4 °C, while dry-season values decreased to approximately 19.8–21.3 °C. Thus, both hospitals experienced substantially cooler conditions during the dry-season monitoring period.
3.3.2. Daily Mean Operative Temperature and Relative Humidity
The reported daily summary temperatures and relative humidity values were compared descriptively between seasons present in Figure 11.
Figure 11.
Seasonal operative temperature and RH at JSH (A-1,A-2) and HDC (B-1,B-2) by EN 16798-1 comfort category.
Figure 11 shows that the JSH daily mean To were predominantly within Categories III and IV, whereas HDC included values extending toward the discomfort zone. The lowest mean temperatures occurred during the dry season, particularly at HDC, where values approached 20 °C. RH showed considerably less seasonal variation. At JSH, RH ranged approximately from 53 to 66% during the rainy season and 34–54% during the dry season, whereas the corresponding ranges at HDC were approximately 56–66% and 51–54%.
3.3.3. Thermal Sensation Votes
Occupants’ subjective thermal responses were assessed using the ASHRAE seven-point thermal sensation scale to characterize perceived thermal conditions in the investigated ICUs. The analysis considered the distribution of TSV at JSH and HDC during both the rainy and dry seasons, allowing seasonal and inter-hospital differences in thermal perception to be identified. The resulting distributions are presented in Figure 12.
Figure 12.
Thermal sensation vote distributions for healthcare workers JSH ((A-1): rainy; (A-2): dry) and HDC ((B-1): rainy; (B-2): dry) based on the ASHRAE seven-point scale.
Figure 12 shows a pronounced seasonal shift in thermal sensation at both JSH and HDC. During the dry season, TSV were concentrated predominantly in the cold and very cold categories, whereas rainy-season responses shifted toward the warm and hot categories. This seasonal reversal was evident in both hospitals, although the scale of the response differed between locations. At JSH, warm and hot sensations were more prominent during the rainy season, while HDC showed a stronger concentration of cold sensations during the dry season. Overall, the TSV distributions indicate that thermal discomfort occurred during both seasons but in opposite directions, indicating substantial seasonal variability in occupants’ thermal perception within the investigated NV in ICUs.
3.3.4. PMV and PPD Indices
Thermal comfort was evaluated using the PMV and PPD indices in accordance with ISO 7730:2005 [50]. The baseline calculations assumed a metabolic rate of 1.2 met, clothing insulation of 0.7 clo, and air velocity of 0.1 m/s. Since air velocity was not directly measured, a sensitivity analysis was conducted to assess the influence of alternative assumptions on the calculated PMV values. This analysis considered metabolic rates of 1.2 and 2.5 met and air velocities of 0.1 and 0.3 m/s, while maintaining clothing insulation at 0.7 clo. The corresponding results for JSH and HDC are presented in Appendix A (Figure A1 and Figure A2, respectively).
Table 6 reveals a pronounced seasonal reversal in predicted thermal comfort at both hospitals, characterized by warm conditions during the rainy season and cooler conditions during the dry season. Rainy-season PMV values ranged from +0.25 to +0.87 at JSH (PPD: 6.3–21.1%) and from +0.89 to +1.65 at HDC (PPD: 21.7–59.2%), indicating greater predicted warm discomfort at HDC. The highest predicted dissatisfaction occurred at HDC on Day 3 (PMV = +1.65; PPD = 59.2%). In contrast, dry-season PMV values were consistently negative, ranging from −1.02 to −0.67 at JSH (PPD: 14.5–26.9%) and from −1.03 to −0.68 at HDC (PPD: 14.7–27.3%), reflecting comparable predicted cool discomfort at both hospitals. Only Day 5 of the rainy season at JSH fell within the adopted ISO 7730 comfort limits (−0.5 ≤ PMV ≤ +0.5; PPD < 10%) [50]. Figure 13 further illustrates this seasonal contrast, highlighting the transition from greater predicted warm discomfort at HDC to similar levels of predicted cool discomfort across both hospitals. These exploratory estimates reflect the adopted metabolic rate, clothing insulation, and air velocity assumptions rather than individually measured thermal responses.
Table 6.
PMV and PPD values for JSH and HDC calculated using an assumed air velocity of 0.1 m/s.
Figure 13.
Seasonal variation in exploratory PMV estimates at (A) JSH and (B) HDC.
Figure 13 presents the PMV classifications at JSH (A) and HDC (B) during the rainy and dry seasons, calculated using an assumed air velocity of 0.1 m/s, 0.7 clo, and a metabolic rate of 1.2 met. At JSH, rainy-season observations were predominantly classified within Category II, whereas dry-season conditions were distributed between Categories II and III. At HDC, rainy-season observations extended across Categories II, III, and IV, indicating less favorable TC conditions than at JSH. During the dry season, observations at HDC were primarily distributed between Categories II and III. Overall, the results reveal distinct seasonal variations in predicted TC, with HDC exhibiting greater departures from the higher comfort categories during the rainy season.
3.4. Statistical Analysis
Pearson correlation analyses were conducted to examine associations among occupancy, temperature, RH, CO2, the VOC-related IAQ index, PM2.5, and PM10 at JSH and HDC during the rainy and dry seasons. Figure 14 presents the complete seasonal correlation matrices for both hospitals, based on five daily observations per hospital-season (n = 5).
Figure 14.
Seasonal Pearson Correlations of Indoor Environmental Parameters at JSH and HDC.
Figure 14 summarizes the selected Pearson correlation coefficients, while Figure 14 presents the complete correlation matrices among occupancy and indoor environmental parameters at JSH and HDC during the rainy and dry seasons. The reported associations exhibited considerable seasonal and inter-hospital variability in magnitude and direction. At JSH, occupancy–CO2 correlations were weakly negative during the dry season (r = −0.138) and moderately positive during the rainy season (r = 0.507). In contrast, HDC exhibited a strong positive coefficient during the dry season (r = 0.950), which decreased substantially during the rainy season (r = 0.115). Occupancy–PM2.5 correlations were consistently positive, ranging from 0.696 to 0.744 at JSH and from 0.327 to 0.431 at HDC. Strong positive PM2.5–PM10 correlations were also reported at both hospitals, with coefficients of 1.000 and 0.996 at JSH and 0.905 and 0.929 at HDC during the dry and rainy seasons, respectively. The relationship between RH and the VOC-related IAQ index showed pronounced seasonal variability, changing from r = 1.000 (dry) to r = −0.952 (rainy) at JSH, compared with r = 0.545 (dry) and r = 1.000 (rainy) at HDC.
4. Discussion
4.1. Indoor Air Quality and Health Implications
The objective measurements revealed substantial IAQ deficiencies in the ICUs investigated, although the magnitude and seasonal patterns differed between the two hospitals. At JSH, daily mean CO2 concentrations ranged from 1977 to 2600 ppm, whereas HDC recorded values between 1437 and 2733 ppm. The highest concentrations occurred predominantly during the dry season, when all daily mean CO2 values at HDC exceeded 2500 ppm. These concentrations indicate limited dilution of occupant-generated pollutants and suggest that the NV strategy did not consistently provide adequate air renewal under the prevailing operating conditions. Similar ventilation limitations were previously observed in DRC hospital environments [21,22]. These findings are consistent with previous investigations showing that ventilation type, occupancy, and hospital function strongly influence indoor CO2 concentrations [10,56,57]. Jung et al. [10] reported important differences in IAQ among hospital working areas and observed higher CO2 and TVOC concentrations in inpatient rooms than in several other hospital spaces. Similarly, Roberts et al. [56] demonstrated that NV hospitals in tropical climates can experience substantial variations in IAQ depending on ventilation practices and prevailing environmental conditions. The present findings extend this evidence to naturally ventilated ICUs in the DRC and indicate that high CO2 concentrations are not restricted to mechanically conditioned or densely occupied hospitals in other regions. Rather, maintaining satisfactory ventilation may be particularly challenging where ventilation depends largely on manual window operation and variable outdoor conditions. The seasonal increase in CO2 during the dry season may reflect differences in window-opening behavior, indoor–outdoor temperature relationships, occupancy, and airflow conditions. Previous work conducted in the investigation ICUs showed that windows may remain closed or only partly open in response to environmental disturbances, including outdoor noise [48]. Such behavior can create a trade-off between acoustic comfort and ventilation effectiveness. This interpretation is consistent with Roberts et al. [56], who emphasized the importance of ventilation operation in determining IAQ in tropical hospitals, and with Jung et al. [57], who showed that indoor pollutant concentrations can vary according to building characteristics and human activities. However, because ventilation rates and window-opening duration were not continuously quantified in the present study, the specific contribution of each mechanism cannot be determined. PM represented a major indoor environmental concern in both ICUs. The recorded PM2.5 concentrations reached 228 µg/m3 at JSH and 237 µg/m3 at HDC, while PM10 concentrations reached 582 and 553 µg/m3, respectively. These values are substantially higher than the numerical concentrations specified in the WHO 2021 guidelines for 24 h PM2.5 and PM10 exposure [7], highlighting the potential importance of particulate pollution in the investigated healthcare environments. However, given the limitations in the documented particle-sampling duration, optical mass estimation, and instrument-specific quality assurance, the magnitude of these findings requires cautious interpretation. In particular, the reported concentrations should be considered indicative of potentially elevated particulate levels rather than independently validated 24 h exposure estimates. The PM concentrations in NV hospitals are influenced by interacting indoor and outdoor processes, including pollutant infiltration, dust resuspension, occupant movement, cleaning activities, and combustion-related emissions [19,56,57]. The contrasting geographical and environmental settings of the investigated hospitals are particularly relevant to understanding the observed particulate pollution. JSH is situated in the industrial and mining region of Lubumbashi, where mining operations, industrial activities, and associated transport may contribute to ambient PM pollution. In contrast, HDC is located in the densely urbanized environment of Kinshasa, where traffic emissions, road dust, and urban combustion activities represent potential sources of airborne particles. Previous investigations of NV hospital wards in the DRC have highlighted the importance of IAQ and ventilation conditions in healthcare environments [22]. Furthermore, outdoor-to-indoor particle transport is governed by ventilation practices, airflow patterns, and building characteristics [13,52]. These interacting factors provide an important environmental context for interpreting the elevated PM2.5 and PM10 concentrations observed in both ICUs and underscore the relevance of surrounding environmental conditions to PM pollution in NV tropical hospitals. The health relevance of fine PM is well established because smaller particles can penetrate deeply into the respiratory system, while long- and short-term exposure has been associated with adverse respiratory and cardiovascular outcomes [7,19]. Hospital occupants may be particularly important in this context because healthcare environments accommodate individuals with different levels of vulnerability. The high particulate levels are broadly consistent with previous research demonstrating that hospital particle concentrations are influenced by ventilation, human activity, outdoor air pollution, cleaning, resuspension, and building characteristics [10,57,58]. In the DRC context, potential contributions from outdoor pollution warrant particular attention, given the contrasting environmental settings of the two hospitals. JSH is located within an industrial and mining region, whereas HDC is situated in the densely urbanized environment of Kinshasa. Mining-related dust, traffic emissions, road dust, and combustion activities represent plausible external sources of PM that may infiltrate NV hospital spaces [22]. However, the absence of simultaneous outdoor measurements and chemical source apportionment precludes distinguishing outdoor contributions from indoor sources or attributing the observed concentrations to specific activities. The exploratory correlation analysis (Figure 14) indicated strong positive associations between PM2.5 and PM10 at JSH during the dry (r = 1.000) and rainy (r = 0.996) seasons, with corresponding coefficients of 0.905 and 0.929 at HDC. These findings highlight the importance of considering both local environmental conditions and potential outdoor pollution contributions when assessing PM concentrations in NV hospitals. The VOC results showed a different seasonal pattern from CO2 and particulate matter. Higher VOC index values were generally observed during the rainy season, reaching 222 at JSH and 229 at HDC, whereas lower values occurred during the dry season. Hospitals contain numerous potential VOC sources, including disinfectants, cleaning products, alcohol-based products, pharmaceuticals, furniture, medical materials, and building finishes [14]. Bessonneau et al. [14] demonstrated that healthcare personnel and patients may be exposed to complex mixtures of VOCs arising from routine hospital activities. Other studies have also reported relationships between VOC levels and IEC [59,60]. The higher rainy-season VOC index values observed in the present study may therefore result from a combination of indoor source strength and seasonal ventilation conditions. However, the VOC measurement in this study represents an IAQ VOC index rather than compound-specific mass concentrations. Consequently, direct comparisons with studies reporting concentrations of individual VOCs or total VOCs should be made cautiously. The present results indicate relative differences in VOC index between seasons and hospitals but cannot determine the chemical composition or toxicity of the detected compounds. This distinction is particularly important when discussing potential health implications.
The subjective assessment was generally consistent with the objective evidence of poor IAQ. At JSH, 80% of respondents during the rainy season and 74% during the dry season classified IAQ as poor or very poor, while negative evaluations also predominated at HDC. Odor and perceived air cleanliness were important concerns, which is compatible with the presence of VOC sources and particulate pollution. Previous studies have similarly demonstrated that occupants’ perceptions can provide valuable complementary information when assessing hospital IEQ [61,62,63,64]. Eye irritation, sore throat, fatigue, headache, and other symptoms were also frequently reported. Similar complaints have previously been documented in buildings affected by inadequate IAQ [8,9] and among hospital workers [65]. Norbäck et al. [66], for example, reported associations between indoor pollutants and symptoms including ocular and throat irritation, headache, and fatigue, while other research has highlighted respiratory and toxicological concerns related to VOC exposure [67,68]. The subjective assessments revealed widespread dissatisfaction with IAQ, accompanied by frequent reports of eye irritation, sore throat, headache, and fatigue. Although these findings coincided with elevated pollutant indicators, the absence of individually linked measurements and questionnaire responses precludes establishing direct exposure response relationships. The reported symptoms may also reflect occupational, clinical, personal, and environmental factors. Together, these findings highlight complementary concerns regarding measured and perceived IAQ, emphasizing the need for temporally synchronized monitoring and individual-level exposure assessments. The contrasting urban and industrial environments of the investigated hospitals provide additional context for interpreting the elevated indoor PM concentrations. Previous studies have documented substantial ambient particulate pollution in the DRC. McFarlane et al. [46] reported elevated PM2.5 concentrations in Kinshasa, while Mpoyo Kumwimba et al. [47] identified elevated PM2.5 and PM10 concentrations along Kasapa Road in Lubumbashi. More recently, Jean-Luc et al. [69] identified a significant association between ambient PM2.5 exposure and asthma in Kinshasa, further highlighting the potential respiratory health implications of particulate pollution. Collectively, these findings provide important environmental and epidemiological context for assessing IAQ in NV intensive care units, where outdoor particles may penetrate through windows, doors, and other openings [13,52]. Nevertheless, indoor particulate concentrations may also be influenced by occupant activities, cleaning, particle resuspension, and ventilation conditions [19,56,57]. The absence of simultaneous indoor–outdoor measurements and source apportionment prevents reliable attribution of the observed particulate pollution to specific sources. These findings highlight the importance of integrating outdoor air quality assessments into future investigations and developing ventilation strategies that balance adequate air renewal with protection against PM infiltration.
4.2. Thermal Comfort and Seasonal Adaptation
The TC assessment revealed a pronounced seasonal contrast at both hospitals. During the rainy season, the To at JSH ranged approximately from 27.5 to 30.4 °C, with short-term peaks approaching 32 °C, whereas HDC recorded a broader range of approximately 24.9 to 34.4 °C. In contrast, dry-season To decreased substantially, remaining around 20.7–21.0 °C at JSH and 19.8–21.3 °C at HDC. The results therefore demonstrate that naturally ventilated hospitals in tropical Africa may experience not only warm-season discomfort but also cold discomfort during cooler seasonal periods. The rainy season results are broadly consistent with previous investigations of thermal conditions in tropical hospitals. Earlier hospital studies have commonly reported indoor temperatures in the range of approximately 25–29 °C [27,28,29,30,31]. Sattayakorn et al. [26], investigating hospitals in Thailand, reported that the TC range differed among patients, visitors, and medical staff, with hospital workers showing a comparatively narrow range of approximately 24.1–25.6 °C. Compared with these findings, the rainy-season temperatures recorded at JSH and particularly HDC were frequently higher, indicating the potential for warm discomfort among healthcare workers. The DRC findings contrast with the predominant emphasis on overheating in tropical healthcare environments, as dry-season To were substantially lower than those reported in many previous tropical hospital studies [26,29,30]. Temperatures close to or below 21 °C were repeatedly observed during the dry season, accompanied by a marked shift in questionnaire responses toward the cold and very cold thermal-sensation categories. This agreement between seasonal measurements and group-level perceptions supports the presence of a pronounced seasonal reversal, although the data do not represent individually matched exposure response observations. Thermal perception is influenced by multiple factors, including air and radiant temperature, air movement, clothing, metabolic activity, expectations, previous exposure, personal preference, and behavioral adaptation [70,71]. These influences are particularly complex in hospitals, where healthcare workers, patients, and visitors differ substantially in activity, clothing, health status, and thermal requirements [25,26,29,71]. Thus, conditions acceptable to staff may not necessarily be appropriate for critically ill ICU patients. The clo may also have contributed to dry-season cold sensations, although individual clothing levels were not quantified sufficiently for model-based attribution. RH showed less pronounced seasonal variation than temperature, ranging from approximately 53–66% and 34–54% at JSH and 56–66% and 51–54% at HDC during the rainy and dry seasons, respectively. RH can influence thermal perception and perceived IAQ and may also affect aerosol persistence and respiratory-virus transmission [72,73,74]. The observation of pronounced dry-season cold discomfort is one of the main contributions of this investigation. Climate-health research in tropical Africa has understandably emphasized vulnerability to heat and increasing temperatures under climate change [75]. The present findings extend existing evidence on heat-related health risks in tropical Africa by highlighting the relevance of seasonal cold discomfort in healthcare environments. Previous research [75] examined heat-related vulnerability in informal settlements in Dares Salaam, providing a broader climate health perspective rather than a direct comparison with hospital TC. The observed seasonal variability suggests that uniform year-round thermal management strategies may be inadequate for NV hospitals in the DRC. Accordingly, climate-responsive interventions should combine passive solar control and enhanced air movement during warmer periods with adjustable ventilation during cooler seasons to mitigate thermal discomfort while maintaining adequate IAQ and limiting energy demand.
4.3. Integration of Subjective, Objective, and Statistical Findings
A key contribution of this study is the integration of objective environmental measurements, subjective occupant assessments, and exploratory statistical analyses to provide a multidimensional evaluation of IEQ in naturally ventilated ICUs. Previous investigations have emphasized the importance of integrated IEQ assessments in healthcare facilities, where thermal, air quality, acoustic, and visual conditions collectively influence occupant experience [61,62,63,64]. The present study extends this perspective to naturally ventilated ICUs in a resource-constrained tropical African setting, where seasonal variability and limited environmental control present additional challenges. The objective and subjective findings revealed broadly consistent environmental concerns. Elevated CO2 and particulate matter concentrations were recorded during the monitoring campaigns, while healthcare workers frequently rated IAQ as poor or very poor. Seasonal variations in operative temperature, TSV, and exploratory PMV–PPD estimates further highlighted TC concerns. Nevertheless, these observations do not establish direct exposure–response relationships, as questionnaire responses were not linked to contemporaneous environmental measurements. Moreover, perceived environmental quality is influenced by factors beyond measured pollutant concentrations, including activity, clothing, adaptation, odors, temperature, and humidity. Fang et al. [68] demonstrated that temperature and humidity influence perceived air quality, reinforcing the interdependence of thermal conditions and IAQ perception. The exploratory correlation analysis (Figure 14) revealed considerable seasonal and inter-hospital variability in the reported associations among occupancy and environmental parameters. At HDC, occupancy CO2 correlations differed between the dry (r = 0.950) and rainy (r = 0.115) seasons, while JSH exhibited coefficients of −0.138 and 0.507, respectively. These variations are consistent with the complex interactions among occupancy, ventilation, occupant behavior, and building characteristics that influence indoor air quality [56,57]. Positive occupancy particle correlations were also reported at JSH, alongside strong positive PM2.5–PM10 correlations at both hospitals. However, these associations cannot establish pollutant sources, ventilation effectiveness, or underlying transport mechanisms. Given the limited analytical sample (n = 5 per hospital-season), the correlation findings should be interpreted as exploratory. Importantly, the implications of the observed environmental conditions extend beyond healthcare workers’ perceptions to the potential health and safety of critically ill patients. ICU patients may be particularly vulnerable to environmental stressors owing to pre-existing respiratory or cardiovascular conditions, compromised immune function, impaired thermoregulation, and limited capacity to modify their immediate surroundings. Elevated particulate matter concentrations are of particular concern, as exposure to fine particles has been associated with adverse respiratory and cardiovascular outcomes [7,19]. Similarly, elevated indoor CO2 concentrations may indicate insufficient ventilation relative to occupancy, raising concerns about the dilution and removal of airborne contaminants, including potentially infectious respiratory aerosols. Previous research on ventilation in tropical hospital wards has highlighted the importance of adequate airflow and ventilation strategies for maintaining acceptable indoor conditions [13]. Seasonal thermal variations may also have clinical implications, particularly for patients with impaired thermoregulatory capacity. Differences in thermal comfort requirements between patients and healthcare workers further suggest that environmental conditions considered acceptable by staff may not adequately reflect patients’ thermal needs [25]. Consequently, maintaining appropriate IAQ and thermal conditions should be considered an essential component of supportive ICU environmental management rather than solely an issue of occupant comfort. Nevertheless, the potential health implications remain distinct from demonstrated clinical effects, as individual patient exposures, airborne pathogen concentrations, and clinical outcomes were not assessed. Accordingly, direct associations between IEC and adverse health outcomes remain unestablished. Collectively, the findings highlight seasonal IEQ challenges in naturally ventilated ICUs and underscore the importance of integrated, climate-responsive environmental management strategies.
4.4. Implications for Tropical Healthcare Environments
The combined findings demonstrate that the IEQ problems observed in the investigated ICUs are multidimensional and strongly season dependent. The two hospitals experienced elevated CO2 and particulate pollution together with seasonal thermal discomfort, while VOC conditions followed a somewhat different seasonal pattern. These findings illustrate the difficulty of managing NV in healthcare environments in which ventilation must simultaneously support pollutant removal, infection-control requirements, and TC. This interaction is particularly important in tropical healthcare buildings. Increasing NV by opening windows may improve CO2 removal and pollutant dilution, as suggested by previous studies of NV tropical hospitals [57], but greater airflow is not necessarily beneficial under all climatic conditions. During cooler dry-season periods, excessive uncontrolled ventilation could contribute to cold discomfort, whereas insufficient ventilation may increase CO2 and indoor pollutant accumulation. Conversely, closing windows during warmer periods may reduce outdoor noise or particulate penetration but can also increase indoor CO2 and reduce air exchange. The environmental management strategy should therefore balance IAQ and TC requirements rather than addressing either parameter independently. The comparison between JSH and HDC further highlights the importance of local context. Although both hospitals relied primarily on NV, they are exposed to different climatic and urban environments. JSH is located in Lubumbashi, an industrial and mining city with a cooler dry season, whereas HDC is situated in the dense metropolitan environment of Kinshasa. Differences in climate, outdoor pollutant sources, building characteristics, occupancy, and window operation may therefore contribute to the observed inter-hospital variation. The findings are consistent with previous research demonstrating that hospital IEQ depends strongly on ventilation type, building configuration, human activity, and local environmental conditions [10,56,57,58]. The results also support previous work showing that occupants’ overall assessment of healthcare environments depends on multiple IEQ dimensions [61,62,63,64]. Previous DRC studies also identified ventilation, acoustic, and lighting limitations in hospital environments [21,22,45,48]. The present findings contribute to the growing DRC evidence base on hospital IEQ. Previous studies have demonstrated the difficulty of maintaining adequate IAQ through NV in hospital wards [21,22], while complementary ICU investigations have identified acoustic and lighting deficiencies with potential implications for occupant comfort and healthcare-worker performance [45,48]. Recent work has further emphasized that hospital IAQ management in resource-constrained settings should integrate health equity, climate resilience, hybrid ventilation, affordable monitoring, and occupant-informed environmental management [49]. Taken together, these findings support a systems-based approach in which ventilation, IAQ, TC, lighting, and acoustics are considered as interacting components of the healthcare environment. This is particularly relevant in ICUs, where interventions aimed at improving one environmental parameter may adversely affect another. For instance, restricting window opening may reduce outdoor noise intrusion but also limit air exchange, whereas increasing NV may enhance pollutant dilution while increasing the risk of thermal discomfort during cooler periods. Practical interventions should therefore prioritize seasonally responsive ventilation, improved airflow distribution, appropriate window-operation protocols, routine monitoring of CO2 and PM, and control of indoor and outdoor pollutant sources. Where feasible, hybrid or appropriately designed mechanical ventilation may supplement NV when window-based strategies are insufficient. Such interventions should be adapted to local climatic conditions, infrastructure, maintenance capacity, infection-control requirements, and hospital operational constraints.
The substantial seasonal thermal contrast also indicates that TC strategies developed primarily around overheating may be insufficient for some tropical African locations. During rainy and warmer periods, shading, solar control, appropriate air movement, and heat removal may be required. During cooler dry season periods, excessive heat loss and unnecessary air movement should be avoided while still maintaining adequate ventilation for IAQ. Clothing adaptation and locally controllable environmental conditions may provide additional low-cost measures for healthcare workers. More broadly, the present findings add evidence from an underrepresented geographical context to the international literature on healthcare IEQ. Previous studies from Asia, Europe, and other tropical settings have demonstrated problems related to hospital ventilation, pollutant exposure, and TC [10,26,29,56,58,61,62,63,71]. The present study shows that several of these challenges are also evident in the DRC, but with an important additional feature: substantial warm-season and cold-season thermal discomfort can occur within the same NV healthcare system. The principal implication is therefore not that tropical hospitals require universally greater cooling or universally greater ventilation, but that they require climate-responsive and seasonally adaptive IEQ management. Such an approach is particularly relevant to resource-constrained healthcare systems, where highly energy-intensive HVAC solutions may not always be economically or operationally feasible. Evidence-based management of natural and hybrid ventilation, pollutant sources, thermal conditions, occupancy, and environmental monitoring may provide a more realistic pathway toward healthier and more resilient healthcare facilities in the DRC and comparable tropical regions.
4.5. Practical Applications
The findings provide practical guidance for improving indoor environmental management in NV in ICUs in the DRC. The simultaneous occurrence of elevated CO2 and PM concentrations, unfavorable VOC index values, negative occupant perceptions, and substantial seasonal thermal discomfort indicates the need for integrated rather than single-parameter interventions. Priority measures should include improved management of NV and window operation, better airflow distribution, routine monitoring of CO2 and PM, and control of indoor pollutant sources. Where outdoor PM pollution is substantial, ventilation strategies should balance outdoor-air intake with measures that limit particle infiltration. Thermal management strategies should address the pronounced seasonal variability observed at both hospitals. During the warmer rainy season, shading, solar control, and enhanced air movement may mitigate warm discomfort, while cooler dry-season conditions require limiting excessive air movement and heat loss without compromising IAQ. Where resources and maintenance capacity permit, hybrid or energy-efficient mechanical ventilation could complement NV when passive strategies cannot adequately balance thermal comfort and IAQ. Continuous IEQ monitoring could further support adaptive operational adjustments and early identification of adverse indoor conditions. Future intervention studies are needed to evaluate the effectiveness of these strategies and their potential implications for clinical outcomes, staff performance, and infection control.
4.6. Limitations and Future Research
Several limitations should be acknowledged when interpreting the findings. First, the study was confined to two NV in ICUs, with relatively short monitoring campaigns during the rainy and dry seasons. This limited the temporal representativeness and generalizability of the results. Second, incomplete documentation of field calibration procedures, sampling durations, valid observations, quality assurance protocols, and missing-data treatment introduces uncertainty into the environmental measurements. This is particularly relevant to PM2.5 and PM10 concentrations, which were estimated using optical particle measurements without independent gravimetric validation. Furthermore, the absence of simultaneous outdoor monitoring and chemical source characterization precluded reliable differentiation between indoor and outdoor pollution sources.
Third, environmental measurements and questionnaire responses were not linked at the individual, temporal, or spatial level, preventing the assessment of exposure–response relationships and causal associations between pollutant exposure and self-reported symptoms. Incomplete recruitment records also prevented the determination of hospital- and season-specific response rates and the identification of repeated participants, introducing potential selection bias and uncertainty regarding the independence of seasonal observations. Moreover, the absence of documented questionnaire translation validation, pilot testing, and psychometric assessment limits confidence in the reliability and validity of the subjective measures.
Fourth, PMV–PPD calculations relied on assumed air velocity, metabolic rate, and clothing insulation, while incomplete information on mean radiant temperature and other model inputs limited independent reproducibility. Accordingly, these indices should be interpreted as exploratory estimates rather than definitive measures of occupant thermal comfort. Finally, the small number of daily observations within each hospital–season group (n = 5) limited statistical power and the robustness of the correlation analyses, which should therefore be considered exploratory.
Future research should prioritize extended, multi-season monitoring across a broader range of healthcare facilities, supported by standardized calibration, validated measurement protocols, and comprehensive quality assurance procedures. Simultaneous indoor–outdoor pollutant measurements, direct assessment of ventilation rates and air velocity, and detailed occupancy characterization would improve understanding of pollutant sources and transport mechanisms. Integrating temporally synchronized environmental measurements with validated occupant questionnaires and clinical outcome data would further strengthen exposure–response assessments. Such investigations are essential for developing and evaluating climate-responsive ventilation, particulate pollution control, and thermal management strategies tailored to resource-constrained tropical hospitals, with particular attention to the environmental needs of healthcare workers and critically ill patients.
5. Conclusions
This study provides comparative field-based evidence of seasonal IEQ challenges in naturally ventilated ICUs at JSH in Lubumbashi and HDC in Kinshasa, DRC. By integrating objective environmental monitoring with subjective assessments from 348 healthcare workers, the investigation identified substantial IAQ concerns at both hospitals. Indoor CO2 concentrations ranged from 1977 to 2600 ppm at JSH and 1437 to 2733 ppm at HDC, indicating limited dilution of occupant-generated CO2 under the prevailing ventilation conditions. Potentially elevated PM concentrations, seasonal variations in VOC-based IAQ indices, and widespread dissatisfaction with perceived IAQ further highlighted the environmental challenges affecting both facilities. The principal scientific contribution is the identification of a pronounced seasonal reversal in thermal conditions across two naturally ventilated ICUs situated in contrasting climatic and urban environments. Rainy-season measurements revealed predominantly warm conditions, with greater predicted thermal discomfort at HDC, whereas dry-season temperatures decreased substantially and were accompanied by predominantly cold thermal sensation responses at both hospitals. These seasonal patterns were reflected in To measurements, group-level occupant perceptions, and exploratory PMV–PPD estimates. The findings extend existing evidence on tropical healthcare environments by demonstrating that thermal management must address both warm-season overheating and cooler-season discomfort, challenging approaches focused predominantly on heat mitigation. Importantly, the concurrent occurrence of elevated CO2 concentrations, potentially substantial particulate pollution, and seasonal thermal discomfort highlights the interdependence of ventilation, IAQ, and thermal regulation. Increasing outdoor air exchange may enhance pollutant dilution while potentially introducing ambient particles and intensifying thermal discomfort under unfavorable climatic conditions. Consequently, effective IEQ management requires integrated, seasonally adaptive strategies that balance adequate air renewal, pollutant control, and thermal requirements. Priority measures include improved window-operation protocols, routine environmental monitoring, targeted pollutant-source reduction, and context-appropriate hybrid ventilation where feasible. These strategies should reflect the distinct environmental conditions of Kinshasa and Lubumbashi and the operational requirements of critical healthcare facilities. Overall, this study advances understanding of seasonal IEQ variability in an underrepresented tropical healthcare context and underscores the need to move beyond uniform year-round environmental control strategies. The findings provide a scientific foundation for developing climate-responsive, resource-efficient IEQ management approaches that jointly address air quality and TC, supporting healthier and more resilient NV in healthcare environments in the DRC and comparable tropical regions.
Author Contributions
Conceptualization, J.-P.K.B.N.; methodology. J.-P.K.B.N., J.O.O. and M.G.d.S.; formal analysis, J.-P.K.B.N., J.O.O. and M.G.d.S.; investigation, J.-P.K.B.N.; resources, J.-P.K.B.N., N.A.V.S. and M.G.d.S.; data curation, J.-P.K.B.N.; writing—original draft preparation, J.-P.K.B.N.; writing—review and editing, J.-P.K.B.N., J.O.O., N.A.V.S. and M.G.d.S.; reviewing and supervision, N.A.V.S. and M.G.d.S. All authors have read and agreed to the published version of the manuscript.
Funding
This research was funded in part by the Fundação para a Ciência e a Tecnologia, I.P. (FCT) (ROR: https://ror.org/00snfqn58 (accessed on 14 June 2026)) through the projects UID/50022/2025 (DOI: https://doi.org/10.54499/UID/50022/2025), LA/P/0079/2020 (DOI: https://doi.org/10.54499/LA/P/0079/2020), within the Associate Laboratory of Energy, Transports, and Aerospace (LAETA). Author N.A.V.S was funded in whole or in part by the Fundação para a Ciência e a Tecnologia, I.P. (FCT, https://ror.org/00snfqn58) under Grant UID/6438/2025 (https://doi.org/10.54499/UID/06438/2025) of the research unit CERIS. Additional financial support was provided by the Université Officielle de Mbuji-Mayi (UOM), Democratic Republic of Congo, under the Institutional Research Grant No. UOM/RG/2026/001.
Institutional Review Board Statement
The study was conducted in accordance with the ethical principles of the Declaration of Helsinki and was approved by the Ethics Committee of the University Official of Mbuji-Mayi (UOM), Democratic Republic of the Congo (protocol code UOM-CE/2020/870, approved on 13 March 2020).
Informed Consent Statement
All participants were informed about the purpose and procedures of the study, the voluntary nature of their participation, their right to participate or withdraw without consequences, and the confidentiality and intended use of the collected information. Electronic informed consent was obtained from all participants before completion of the questionnaire. Participation was voluntary, and no directly identifying personal information was collected or included in the analysis.
Data Availability Statement
The data presented in this study are available on request from the corresponding author due to privacy.
Acknowledgments
The authors gratefully acknowledge the Energy for Sustainability Initiative at the University of Coimbra, the Associate Laboratory of Energy, Transports, and Aerospace (LAETA), the research unit CERIS (Civil Engineering Research and Innovation for Sustainability), and the Université Officielle de Mbuji-Mayi (UOM), Democratic Republic of the Congo, for their institutional and scientific support in the development of this research.
Conflicts of Interest
The authors declare no conflicts of interest.
Abbreviations
| Abbreviation | Definition |
| ACH | Air Changes per Hour |
| ASHRAE | American Society of Heating, Refrigerating and Air-Conditioning Engineers |
| CO | Carbon Monoxide |
| CO2 | Carbon Dioxide |
| DRC | Democratic Republic of the Congo |
| HDC | Hôpital du Cinquantenaire (Kinshasa) |
| IAQ | Indoor Air Quality |
| ICU | Intensive Care Unit |
| IEQ | Indoor Environmental Quality |
| ISO | International Organization for Standardization |
| JSH | Jason Sendwe Hospital (Lubumbashi) |
| NO2 | Nitrogen Dioxide |
| NV | Natural Ventilation |
| PM | Particulate Matter |
| PMV | Predicted Mean Vote |
| PPD | Predicted Percentage of Dissatisfied |
| RH | Relative Humidity |
| SBS | Sick Building Syndrome |
| SD | Standard Deviation |
| TC | Thermal Comfort |
| TO | Operative Temperature |
| TSV | Thermal Sensation Vote |
| TVOC | Total Volatile Organic Compounds |
| UOM | University Official of Mbuji-Mayi |
| VOC | Volatile Organic Compound |
| WHO | World Health Organization |
Appendix A
Appendix A.1. PMV Sensitivity Analysis at JSH
Figure A1.
PMV sensitivity at JSH under varying metabolic rates (1.2 and 2.5 met) and air velocities (0.1 and 0.3 m/s), with clothing insulation fixed at 0.7 clo.
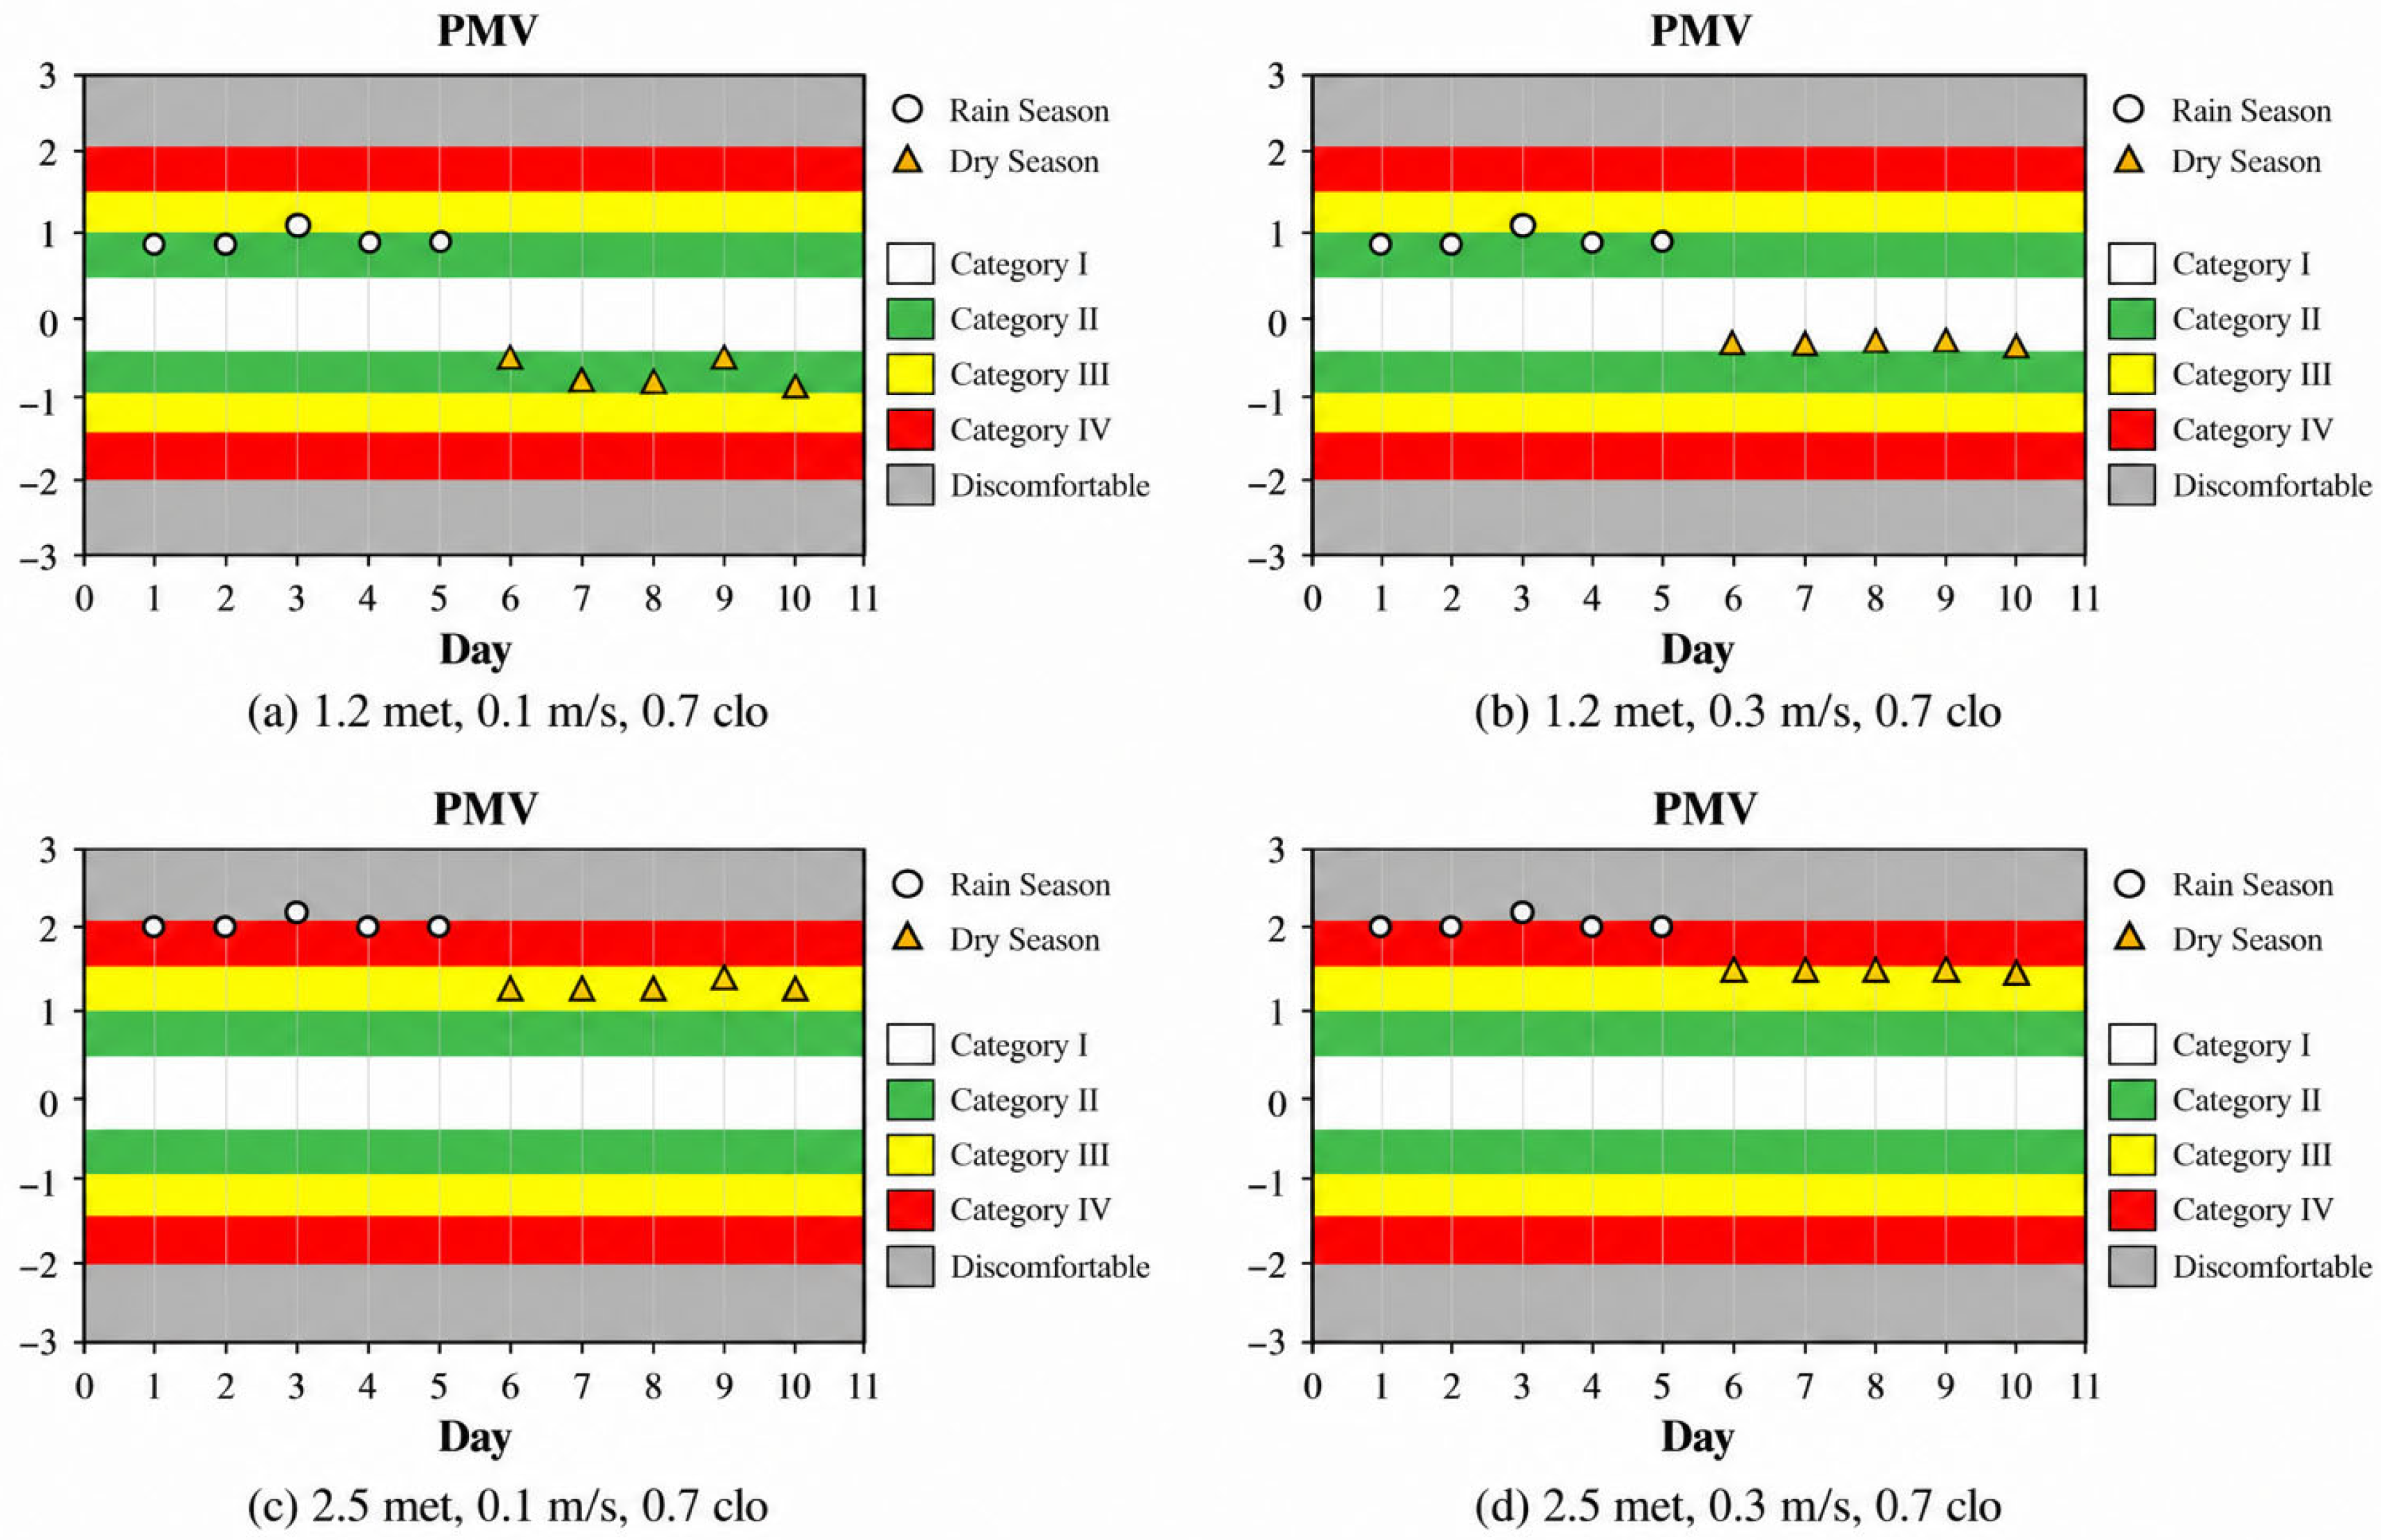
Appendix A.2. PMV Sensitivity Analysis at HDC
Figure A2.
PMV sensitivity at HDC under varying metabolic rates (1.2 and 2.5 met) and air velocities (0.1 and 0.3 m/s), with clothing insulation fixed at 0.7 clo.
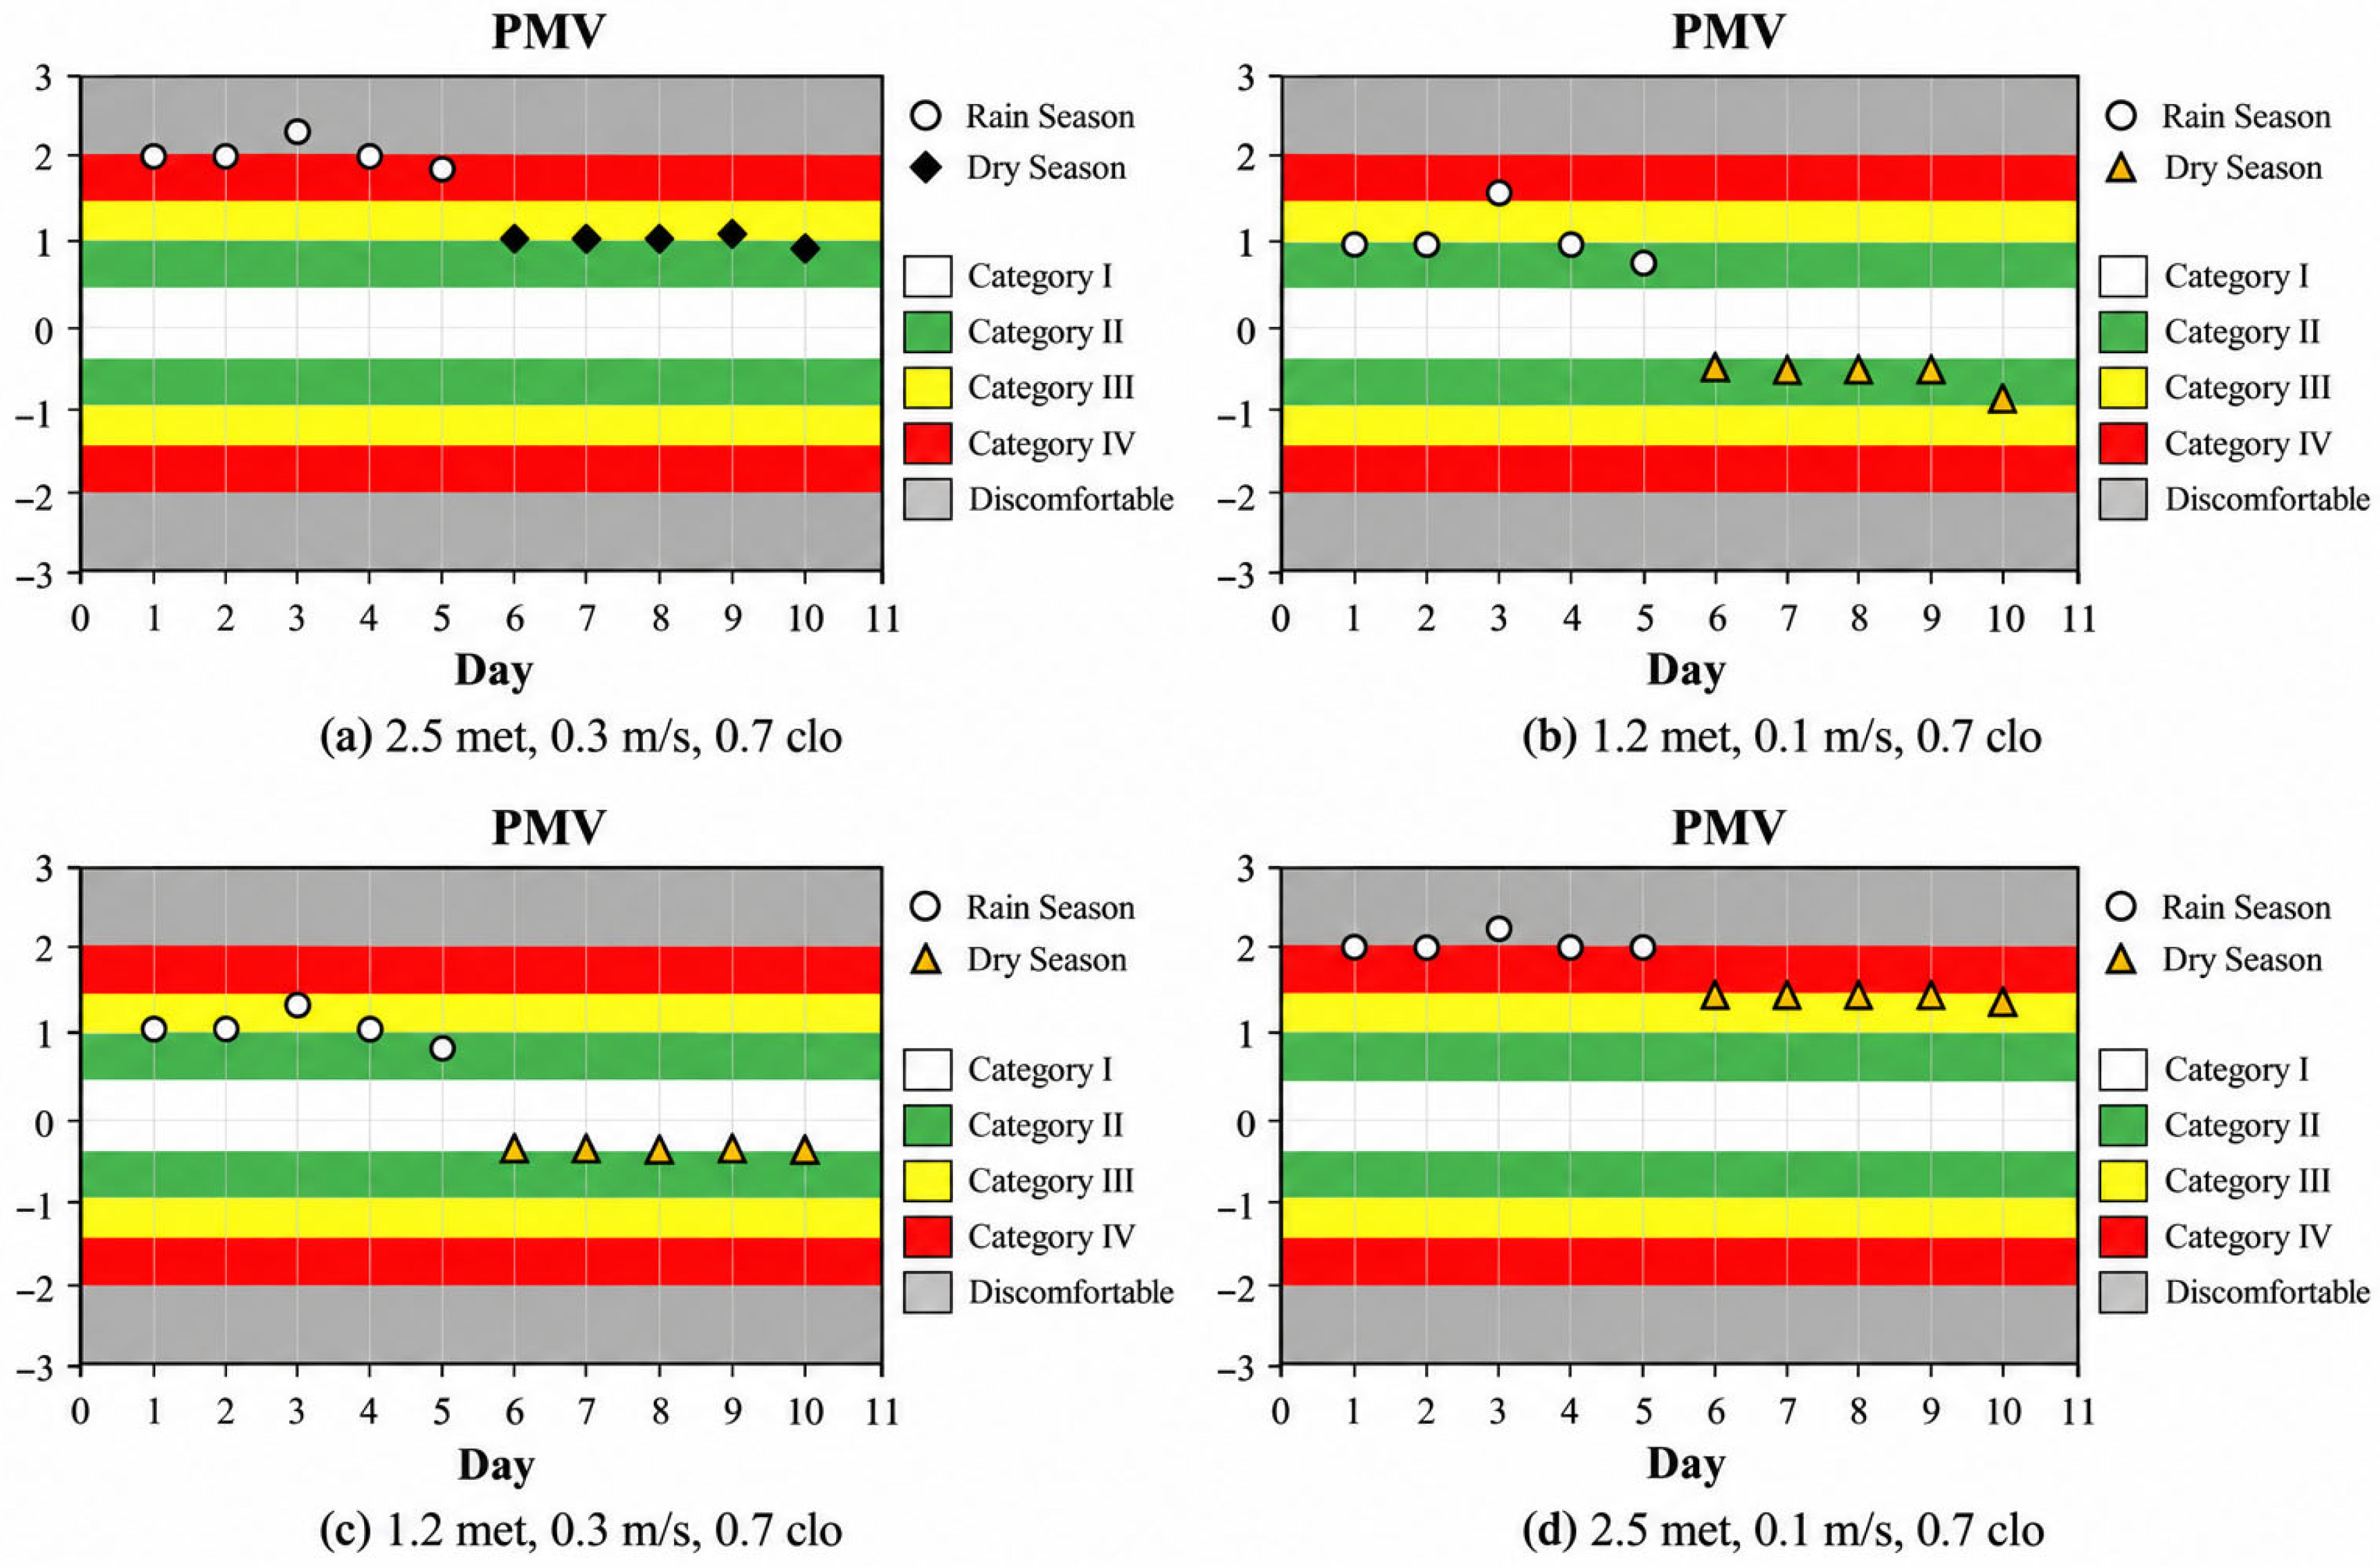
References
- Asadi, I.; Mahyuddin, N.; Shafigh, P. The relation between indoor environmental quality (IEQ) and energy consumption in building based on occupant behavior—A review. MATEC Web Conf. 2016, 66, 00086. [Google Scholar] [CrossRef] [Scilit]
- Tran, V.V.; Park, D.; Lee, Y.C. Indoor air pollution, related human diseases, and recent trends in the control and improvement of indoor air quality. Int. J. Environ. Res. Public Health 2020, 17, 2927. [Google Scholar] [CrossRef] [Scilit] [PubMed]
- Śmiełowska, M.; Marć, M.; Zabiegała, B. Indoor air quality in public utility environments—A review. Environ. Sci. Pollut. Res. 2017, 24, 11166–11176. [Google Scholar] [CrossRef] [Scilit] [PubMed]
- Settimo, G.; Gola, M.; Capolongo, S. The relevance of indoor air quality in hospital settings: From an exclusively biological issue to a global approach in the Italian context. Atmosphere 2020, 11, 361. [Google Scholar] [CrossRef] [Scilit]
- Asif, A.; Zeeshan, M.; Hashmi, I.; Zahid, U.; Bhatti, M.F. Microbial quality assessment of indoor air in a large hospital building during winter and spring seasons. Build. Environ. 2018, 135, 68–73. [Google Scholar] [CrossRef] [Scilit]
- Fifield, L.J.; Lomas, K.J.; Giridharan, R.; Allinson, D. Hospital wards and modular construction: Summertime overheating and energy efficiency. Build. Environ. 2018, 141, 28–44. [Google Scholar] [CrossRef] [Scilit]
- World Health Organization. WHO Global Air Quality Guidelines: Particulate Matter (PM2.5 and PM10), Ozone, Nitrogen Dioxide, Sulfur Dioxide and Carbon Monoxide; World Health Organization: Geneva, Switzerland, 2021. [Google Scholar]
- Thivel, D.; Tremblay, A.; Genin, P.M.; Panahi, S.; Rivière, D.; Duclos, M. Physical Activity, Inactivity, and Sedentary Behaviors: Definitions and Implications in Occupational Health. Front. Public Health 2018, 6, 288. [Google Scholar] [CrossRef] [Scilit] [PubMed]
- Passarelli, G.R. Sick building syndrome: An overview to raise awareness. J. Build. Apprais. 2009, 5, 55–66. [Google Scholar] [CrossRef] [Scilit]
- Jung, C.C.; Wu, P.C.; Tseng, C.H.; Su, H.J. Indoor air quality varies with ventilation types and working areas in hospitals. Build. Environ. 2015, 85, 190–195. [Google Scholar] [CrossRef] [Scilit]
- Rudnick, S.N.; Milton, D.K. Risk of indoor airborne infection transmission estimated from carbon dioxide concentration. Indoor Air 2003, 13, 237–245. [Google Scholar] [CrossRef] [Scilit]
- Huang, Q.; Marzouk, T.; Cirligeanu, R.; Malmstrom, H.; Eliav, E.; Ren, Y.F. Ventilation Assessment by Carbon Dioxide Levels in Dental Treatment Rooms. J. Dent. Res. 2021, 100, 810–816. [Google Scholar] [CrossRef] [Scilit] [PubMed]
- Yau, Y.H.; Chandrasegaran, D.; Badarudin, A. The ventilation of multiple-bed hospital wards in the tropics: A review. Build. Environ. 2011, 46, 1125–1132. [Google Scholar] [CrossRef] [Scilit] [PubMed]
- Bessonneau, V.; Mosqueron, L.; Berrubé, A.; Mukensturm, G.; Buffet-Bataillon, S.; Gangneux, J.-P.; Thomas, O. VOC Contamination in Hospital, from Stationary Sampling of a Large Panel of Compounds, in View of Healthcare Workers and Patients Exposure Assessment. PLoS ONE 2013, 8, e55535. [Google Scholar] [CrossRef] [Scilit] [PubMed]
- Lee, S.J.; Nam, B.; Harrison, R.; Hong, O. Acute symptoms associated with chemical exposures and safe work practices among hospital and campus cleaning workers: A pilot study. Am. J. Ind. Med. 2014, 57, 1216–1226, Erratum in Am. J. Ind. Med. 2015, 58, 914. https://doi.org/10.1002/ajim.22474. [Google Scholar] [CrossRef] [Scilit] [PubMed]
- LeBouf, R.F.; Virji, M.A.; Saito, R.; Henneberger, P.K.; Simcox, N.; Stefaniak, A.B. Exposure to volatile organic compounds in healthcare settings. Occup. Environ. Med. 2014, 71, 642–650. [Google Scholar] [CrossRef] [Scilit] [PubMed]
- Mentese, S.; Rad, A.Y.; Arisoy, M.; Güllü, G. Multiple comparisons of organic, microbial, and fine particulate pollutants in typical indoor environments: Diurnal and seasonal variations. J. Air Waste Manag. Assoc. 2012, 62, 1380–1393. [Google Scholar] [CrossRef] [Scilit] [PubMed]
- GBD 2013 Risk Factors Collaborators; Forouzanfar, M.H.; Alexander, L.; Anderson, H.R.; Bachman, V.F.; Biryukov, S.; Brauer, M.; Burnett, R.; Casey, D.; Coates, M.; et al. Global, regional, and national comparative risk assessment of 79 behavioural, environmental and occupational, and metabolic risks or clusters of risks in 188 countries, 1990–2013: A systematic analysis for the Global Burden of Disease Study 2013. Lancet 2015, 386, 2287–2323. [Google Scholar] [CrossRef] [Scilit] [PubMed]
- Li, Z.; Wen, Q.; Zhang, R. Sources, health effects and control strategies of indoor fine particulate matter (PM2.5): A review. Sci. Total Environ. 2017, 586, 610–622. [Google Scholar] [CrossRef] [Scilit] [PubMed]
- Nyembwe, J.-P.K.B.; Ogundiran, J.O.; Chenari, B.; Simões, N.A.V.; Gameiro da Silva, M. The Indoor Climate of Hospitals in Tropical Countries: A Systematic Review. Energies 2023, 16, 3513. [Google Scholar] [CrossRef] [Scilit]
- Nyembwe, J.-P.K.B.; Munanga, J.K.; Simões, N.; Gameiro da Silva, M. Ventilation Strategies to Mitigate Air Pollution Impact on Hospital Professionals in Intensive Care Units in the Democratic Republic of Congo. Buildings 2024, 14, 1996. [Google Scholar] [CrossRef] [Scilit]
- Nyembwe, J.-P.K.B.; M’Zimbes, S.C.; Simões, N.A.V.; Gameiro da Silva, M. Evaluation of Indoor Air and Natural Ventilation Complexity in Hospital Wards in the Democratic Republic of Congo (DRC). E3S Web Conf. 2025, 672, 07032. [Google Scholar] [CrossRef] [Scilit]
- Cincinelli, A.; Martellini, T. Indoor Air Quality and Health. Int. J. Environ. Res. Public Health 2017, 14, 1286. [Google Scholar] [CrossRef] [Scilit] [PubMed]
- Mendes, A.; Pereira, C.; Mendes, D.; Aguiar, L.; Neves, P.; Silva, S.; Batterman, S.; Teixeira, J.P. Indoor air quality and thermal comfort—Results of a pilot study in elderly care centers in portugal. J. Toxicol. Environ. Health A 2013, 76, 333–344. [Google Scholar] [CrossRef] [Scilit] [PubMed]
- Khalid, W.; Zaki, S.A.; Rijal, H.B.; Yakub, F. Thermal Comfort Requirements for Different Occupants in Malaysian Hospital In-patient Wards. J. Adv. Res. Fluid Mech. Therm. Sci. 2018, 43, 128–140. [Google Scholar]
- Sattayakorn, S.; Ichinose, M.; Sasaki, R. Clarifying thermal comfort of healthcare occupants in tropical region: A case of indoor environment in Thai hospitals. Energy Build. 2017, 149, 45–57. [Google Scholar] [CrossRef] [Scilit]
- Nimlyat, P.S.; Kandar, M.Z. Appraisal of indoor environmental quality (IEQ) in healthcare facilities: A literature review. Sustain. Cities Soc. 2015, 17, 61–68. [Google Scholar] [CrossRef] [Scilit]
- Adunola, A.O. Evaluation of urban residential thermal comfort in relation to indoor and outdoor air temperatures in Ibadan, Nigeria. Build. Environ. 2014, 75, 190–205. [Google Scholar] [CrossRef] [Scilit]
- Yau, Y.H.; Chew, B.T. Thermal comfort study of hospital workers in Malaysia. Indoor Air 2009, 19, 500–510. [Google Scholar] [CrossRef] [Scilit] [PubMed]
- Hwang, R.L.; Lin, T.P.; Cheng, M.J.; Chien, J.H. Patient thermal comfort requirement for hospital environments in Taiwan. Build. Environ. 2007, 42, 2980–2987. [Google Scholar] [CrossRef] [Scilit]
- Nematchoua, M.K.; Ricciardi, P.; Buratti, C. Adaptive approach of thermal comfort and correlation between experimental data and mathematical model in some schools and traditional buildings of Madagascar under natural ventilation. Sustain. Cities Soc. 2018, 41, 666–678. [Google Scholar] [CrossRef] [Scilit]
- Wei, Y.; Dong, Z.; Fan, W.; Xu, K.; Tang, S.; Wang, Y.; Wu, F. A narrative review on the role of temperature and humidity in COVID-19: Transmission, persistence, and epidemiological evidence. Eco-Environ. Health 2022, 1, 73–85. [Google Scholar] [CrossRef] [Scilit] [PubMed]
- Morris, D.H.; Yinda, K.C.; Gamble, A.; Rossine, F.W.; Huang, Q.; Bushmaker, T.; Fischer, R.J.; Matson, M.J.; Van Doremalen, N.; Vikesland, P.J.; et al. Mechanistic theory predicts the effects of temperature and humidity on inactivation of SARS-CoV-2 and other enveloped viruses. eLife 2021, 10, e65902. [Google Scholar] [CrossRef] [Scilit] [PubMed]
- Guo, X.-J.; Zhang, H.; Zeng, Y.-P. Transmissibility of COVID-19 in 11 major cities in China and its association with temperature and humidity in Beijing, Shanghai, Guangzhou, and Chengdu. Infect. Dis. Poverty 2020, 9, 87. [Google Scholar] [CrossRef] [Scilit] [PubMed]
- Balaras, C.A.; Dascalaki, E.; Gaglia, A. HVAC and indoor thermal conditions in hospital operating rooms. Energy Build. 2007, 39, 454–470. [Google Scholar] [CrossRef] [Scilit]
- Clements-Croome, D.J.; Li, B.; Clements-Croome, D.; Baizhan, L. Productivity and indoor environment. Proc. Healthy Build. 2000, 1, 629–634. [Google Scholar]
- Qiu, Y.; Zhou, Y.; Chang, Y.; Liang, X.; Zhang, H.; Lin, X.; Qing, K.; Zhou, X.; Luo, Z. The Effects of Ventilation, Humidity, and Temperature on Bacterial Growth and Bacterial Genera Distribution. Int. J. Environ. Res. Public Health 2022, 19, 15345. [Google Scholar] [CrossRef] [Scilit] [PubMed]
- Amaripadath, D.; Rahif, R.; Velickovic, M.; Attia, S. A systematic review on role of humidity as an indoor thermal comfort parameter in humid climates. J. Build. Eng. 2023, 68, 106039. [Google Scholar] [CrossRef] [Scilit]
- Moriyama, M.; Hugentobler, W.J.; Iwasaki, A. Seasonality of respiratory viral infections. Annu. Rev. Virol. 2020, 7, 83–101. [Google Scholar] [CrossRef] [Scilit] [PubMed]
- Lowen, A.C.; Mubareka, S.; Steel, J.; Palese, P. Influenza Virus Transmission Is Dependent on Relative Humidity and Temperature. PLoS Pathog. 2007, 3, e151. [Google Scholar] [CrossRef] [Scilit] [PubMed]
- Ulrich, R.S.; Quan, X.; Zimring, C.; Joseph, A.; Choudhary, R. The Role of the Physical Environment in the Hospital of the 21st Century: A Once-in-a-Lifetime Opportunity; Center for Health Design: Concord, CA, USA, 2004. [Google Scholar]
- Choi, J.-H.; Beltran, L.O.; Kim, H.-S. Impacts of indoor daylight environments on patient average length of stay (ALOS) in a healthcare facility. Build. Environ. 2012, 50, 65–75. [Google Scholar] [CrossRef] [Scilit]
- Ulrich, R.S.; Zimring, C.; Zhu, X.; DuBose, J.; Seo, H.-B.; Choi, Y.-S.; Quan, X.; Joseph, A. A Review of the Research Literature on Evidence-Based Healthcare Design. HERD Health Environ. Res. Des. J. 2008, 1, 61–125. [Google Scholar] [CrossRef] [Scilit] [PubMed]
- Joseph, A. The Impact of Light on Outcomes in Healthcare Settings; Center for Health Design: Concord, CA, USA, 2006. [Google Scholar]
- Nyembwe, J.-P.K.B.; Ogundiran, J.O.; Lukumwena, N.; Mastouri, H.; Gameiro da Silva, M. Assessing Lighting Quality and Occupational Outcomes in Intensive Care Units: A Case Study from the Democratic Republic of Congo. Int. J. Environ. Res. Public Health 2025, 22, 1511. [Google Scholar] [CrossRef] [Scilit]
- McFarlane, C.M.; Isevulambire, P.K.; Lumbuenamo, R.S.; Ndinga, A.M.E.; Dhammapala, R.; Jin, X.; McNeill, V.F.; Malings, C.; Subramanian, R.; Westervelt, D.M. First Measurements of Ambient PM2.5 in Kinshasa, Democratic Republic of Congo and Brazzaville, Republic of Congo Using Field-Calibrated Low-Cost Sensors. Aerosol Air Qual. Res. 2021, 21, 200619. [Google Scholar] [CrossRef] [Scilit]
- Mpoyo Kumwimba, P.-D.; Dembo Emongo, C.; Muyumba Nonga, W.; Nsenga Nkulu, S.; Zeka Mujinga, L.; Kalonda Mutombo, E.; Banza Lubaba Nkulu, C.; Nsanga, K.w. Contribution à l’étude de la pollution particulaire de l’air en milieu urbain: Cas des PM2,5 et PM10 le long de la route Kasapa, dans la Ville de Lubumbashi, en R.D. Congo. S. Fla. J. Dev. 2021, 2, 4130–4141. [Google Scholar] [CrossRef] [Scilit]
- Nyembwe, J.-P.K.B.; Ogundiran, J.O.; Gameiro da Silva, M.; Simões, N.A.V. Evaluation of Noise Level in Intensive Care Units of Hospitals and Noise Mitigation Strategies. Case Study: Democratic Republic of Congo. Buildings 2023, 13, 278. [Google Scholar] [CrossRef] [Scilit]
- Nyembwe, J.-P.K.B.; Ogundiran, J.O.; Nyembwe, O.K.; Mastouri, H.; Gameiro da Silva, M. Air Is Medicine: Advancing Indoor Air Quality in Tropical Hospitals. In Proceedings of the Clean Indoor Air for ALL Conference Proceedings, Melbourne, Australia, 13–15 October 2025; pp. 2–7. [Google Scholar]
- ISO 7730:2005; Ergonomics of the Thermal Environment—Analytical Determination and Interpretation of Thermal Comfort Using Calculation of the PMV and PPD Indices and Local Thermal Comfort Criteria. International Organization for Standardization (ISO): Geneva, Switzerland, 2005.
- Gameiro da Silva, M. Assessing and Communicating Indoor Environmental Quality; REHVA: Brussels, Belgium, 2019. [Google Scholar]
- EN 16798-1:2019; Energy Performance of Buildings—Ventilation for Buildings—Part 1: Indoor Environmental Input Parameters for Design and Assessment of Energy Performance of Buildings Addressing Indoor Air Quality, Thermal Environment, Lighting and Acoustics—Module M1-6. European Committee for Standardization (CEN): Brussels, Belgium, 2019.
- Gameiro da Silva, M.; Broday, E.E.; Ruivo, C.R. Indoor Climate Quality Assessment in Civil Aircraft Cabins: A Field Study. Therm. Sci. Eng. Prog. 2023, 37, 101581. [Google Scholar] [CrossRef] [Scilit]
- Bosch Sensortec. BME680: Low Power Gas, Pressure, Temperature & Humidity Sensor; Datasheet BST-BME680-DS001-00, Revision 1.0; Bosch Sensortec GmbH: Reutlingen, Germany, 2017. [Google Scholar]
- Ogundiran, J.O.; Nyembwe, J.-P.K.B.; Ogundiran, J.; Gandhi, V.C.; Ribeiro, A.; Gameiro da Silva, M. Cabin Management and Ventilation Strategies for Improved Indoor Environmental Quality in Passenger Vehicles of Developing Tropics. Results Eng. 2025, 27, 106129. [Google Scholar] [CrossRef] [Scilit]
- Roberts, B.M.; Kasei, R.; Codjoe, S.N.; Amankwaa, E.F.; Gough, K.V.; Abdullah, K.; Mensah, P.; Lomas, K.J. Comparing indoor air quality in naturally ventilated and air-conditioned hospitals in the tropics. In Proceedings of the 42nd AIVC–10th TightVent–8th Venticool Conference, Rotterdam, The Netherlands, 5–6 October 2022; Available online: https://www.researchgate.net/publication/364210501 (accessed on 15 October 2023).
- Jung, C.C.; Hsu, N.Y.; Su, H.J. Temporal and spatial variations in IAQ and its association with building characteristics and human activities in tropical and subtropical areas. Build. Environ. 2019, 163, 106249. [Google Scholar] [CrossRef] [Scilit]
- Baurès, E.; Blanchard, O.; Mercier, F.; Surget, E.; le Cann, P.; Rivier, A.; Gangneux, J.-P.; Florentin, A. Indoor air quality in two French hospitals: Measurement of chemical and microbiological contaminants. Sci. Total Environ. 2018, 642, 168–179. [Google Scholar] [CrossRef] [Scilit] [PubMed]
- Sonne, C.; Xia, C.; Dadvand, P.; Targino, A.C.; Lam, S.S. Indoor volatile and semi-volatile organic toxic compounds: Need for global action. J. Build. Eng. 2022, 62, 105344. [Google Scholar] [CrossRef] [Scilit]
- Vasile, V.; Petcu, C.; Iordache, V. Experimental Studies on TVOC Concentrations and their Relationships with Indoor Comfort Parameters. Rev. Chim. 2019, 70, 4145–4152. [Google Scholar] [CrossRef] [Scilit]
- Park, S.H.; Shin, H.K.; Kim, K.W. COVID-19 hospital indoor environments and how it helped patients’ recovery and staff’s work: A case study in South Korea. Front. Psychol. 2023, 14, 1192842. [Google Scholar] [CrossRef] [Scilit] [PubMed]
- Wu, Q.; Li, N.; Cai, X.; He, Y.; Du, Y. Impact of indoor environmental quality (IEQ) factors on occupants’ environmental perception and satisfaction in hospital wards. Build. Environ. 2023, 245, 110918. [Google Scholar] [CrossRef] [Scilit]
- Willems, S.; Saelens, D.; Heylighen, A. Understanding and Estimating Patients’ Indoor Environmental Quality Assessment: A Pilot Case Study in a Hospital Ward. In Proceedings of the IAQ 2020: Indoor Environmental Quality; ASHRAE: Atlanta, GA, USA, 2022; pp. 438–446. [Google Scholar]
- Nimlyat, P.S. Indoor environmental quality performance and occupants’ satisfaction [IEQPOS] as assessment criteria for green healthcare building rating. Build. Environ. 2018, 144, 598–610. [Google Scholar] [CrossRef] [Scilit]
- Hellgren, U.-M.; Reijula, K. Indoor-air-related complaints and symptoms among hospital workers. Scand. J. Work Environ. Health 2006, 2, 47–49. [Google Scholar]
- Norbäck, D.; Hashim, J.H.; Hashim, Z.; Ali, F. Volatile organic compounds (VOC), formaldehyde and nitrogen dioxide (NO2) in schools in Johor Bahru, Malaysia: Associations with rhinitis, ocular, throat and dermal symptoms, headache and fatigue. Sci. Total Environ. 2017, 592, 153–160. [Google Scholar] [CrossRef] [Scilit] [PubMed]
- Allen, J.G.; MacNaughton, P.; Satish, U.; Santanam, S.; Vallarino, J.; Spengler, J.D. Associations of cognitive function scores with carbon dioxide, ventilation, and volatile organic compound exposures in office workers: A controlled exposure study of green and conventional office environments. Environ. Health Perspect. 2016, 124, 805–812. [Google Scholar] [CrossRef] [Scilit] [PubMed]
- Zhao, Q.; Li, Y.; Chai, X.; Xu, L.; Zhang, L.; Ning, P.; Huang, J.; Tian, S. Interaction of inhalable volatile organic compounds and pulmonary surfactant: Potential hazards of VOCs exposure to lung. J. Hazard. Mater. 2019, 369, 512–520. [Google Scholar] [CrossRef] [Scilit] [PubMed]
- Jean-Luc, B.S.; Isevulambire, P.K.; Obel, B.K.; Kinzunga, M.N.; Isidore, M.; Mafuta, J.-J.; Guillaume, K.M.; Joël, K.N.N.; Phaka, R.Y.; Djibi, B.L.; et al. Abiotic and Socioenvironmental Factors of PM2.5 Pollution Associated with Asthma in a Dense Urban Road Network Environment in Kinshasa, D.R. Congo: A Cross-Sectional Study. Environ. Geochem. Health 2026, 48, 231. [Google Scholar] [CrossRef] [Scilit] [PubMed]
- Fang, L.; Clausen, G.; Fanger, P.O. Impact of Temperature and Humidity on the Perception of Indoor Air Quality. Indoor Air 1998, 8, 80–90. [Google Scholar] [CrossRef] [Scilit]
- Pereira, P.F.d.C.; Broday, E.E.; Xavier, A.A.d.P. Thermal comfort applied in hospital environments: A literature review. Appl. Sci. 2020, 10, 7030. [Google Scholar] [CrossRef] [Scilit]
- Jing, S.; Li, B.; Tan, M.; Liu, H. Impact of relative humidity on thermal comfort in a warm environment. Indoor Built Environ. 2013, 22, 598–607. [Google Scholar] [CrossRef] [Scilit]
- Ahlawat, A.; Wiedensohler, A.; Mishra, S.K. An overview on the role of relative humidity in airborne transmission of SARS-CoV-2 in indoor environments. Aerosol Air Qual. Res. 2020, 20, 1856–1861. [Google Scholar] [CrossRef] [Scilit]
- Davidse, A.; Zare, R.N. Effect of Relative Humidity in Air on the Transmission of Respiratory Viruses. Mol. Front. J. 2021, 5, 5–16. [Google Scholar] [CrossRef] [Scilit]
- Pasquini, L.; van Aardenne, L.; Godsmark, C.N.; Lee, J.; Jack, C. Emerging climate change-related public health challenges in Africa: A case study of the heat-health vulnerability of informal settlement residents in Dar es Salaam, Tanzania. Sci. Total Environ. 2020, 747, 141355. [Google Scholar] [CrossRef] [Scilit] [PubMed]
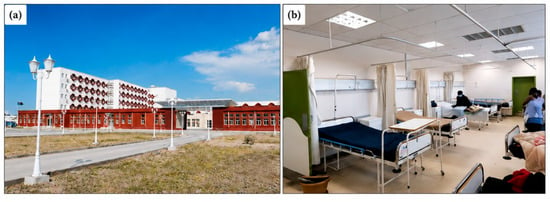
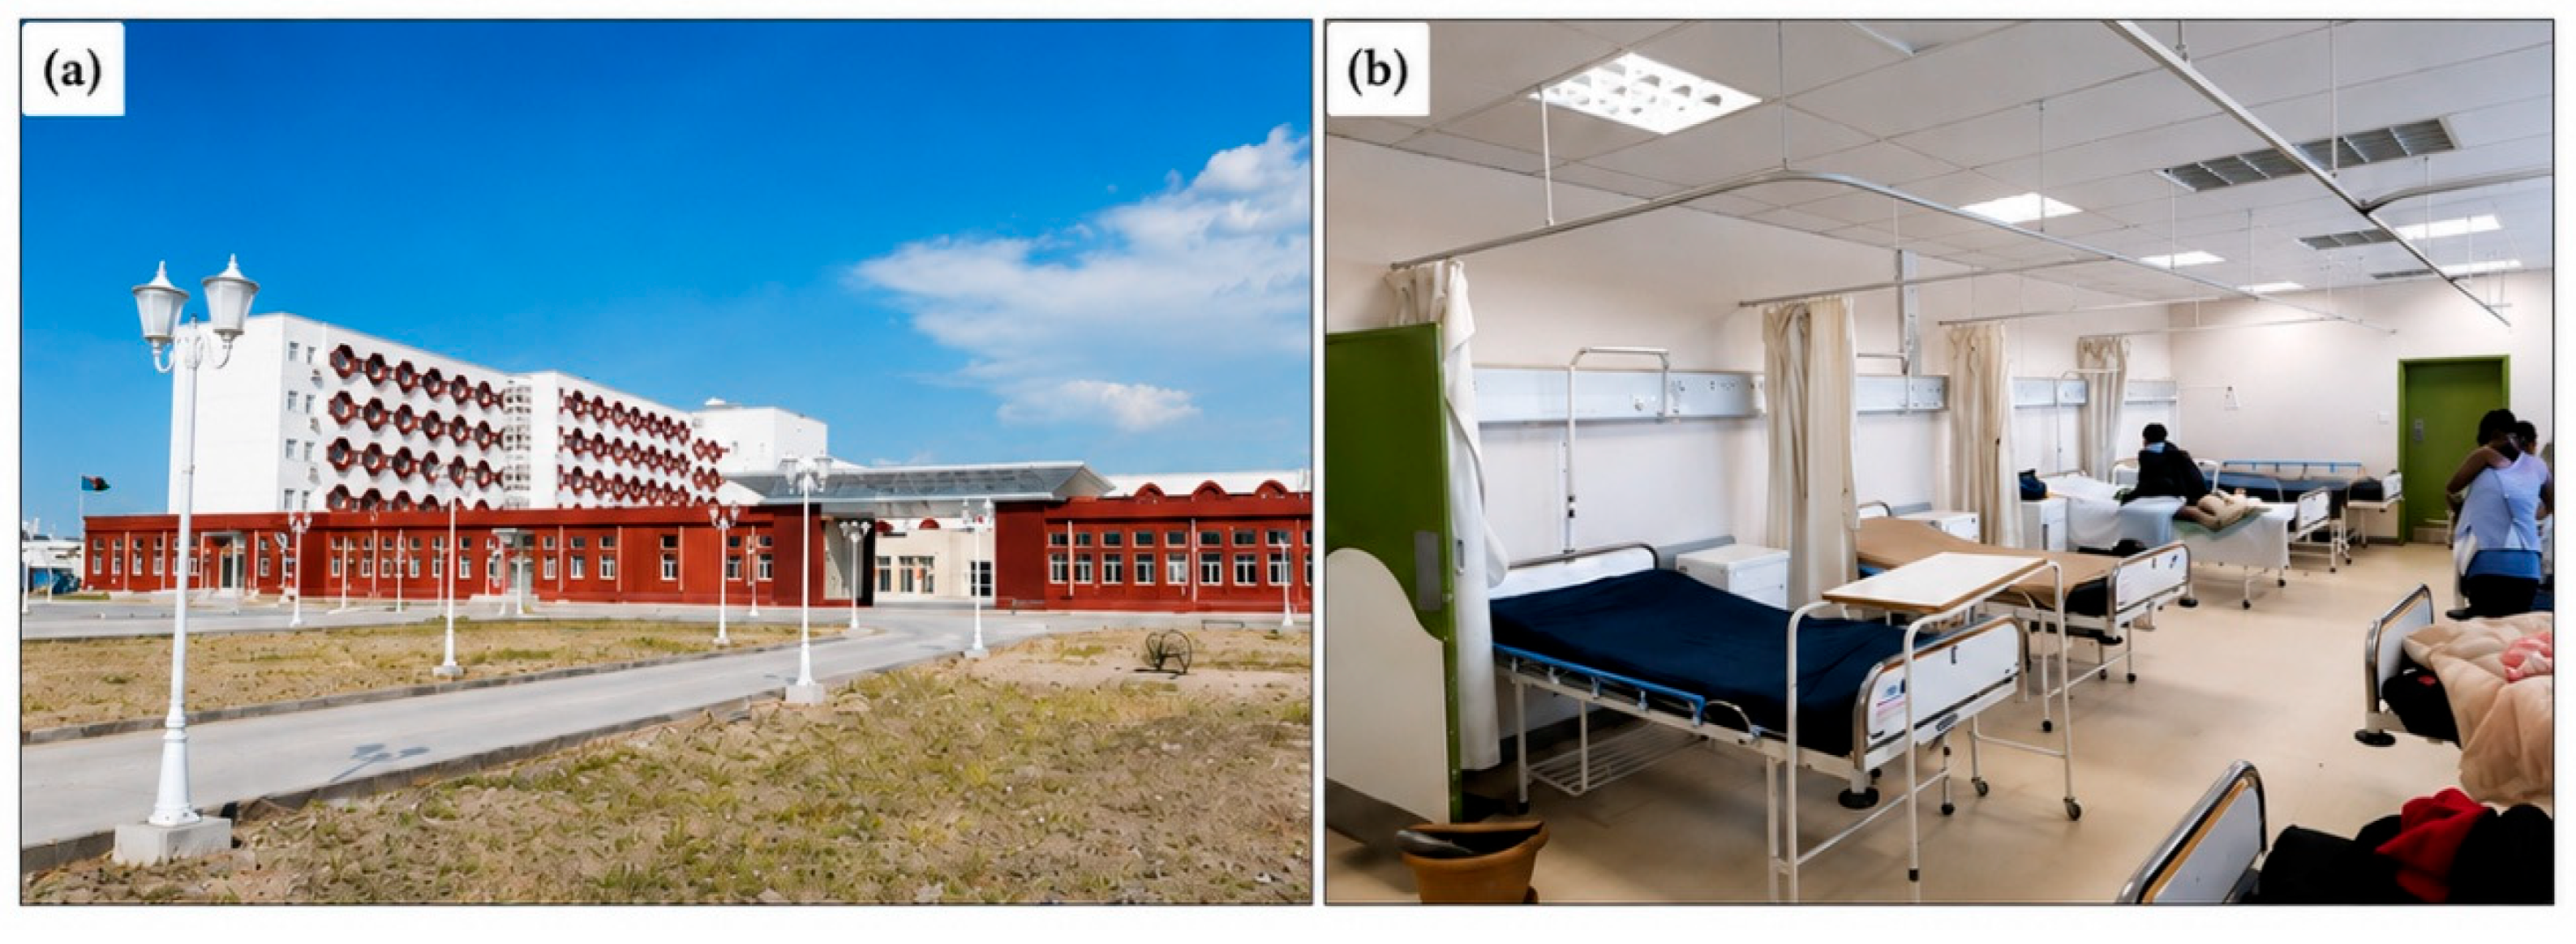
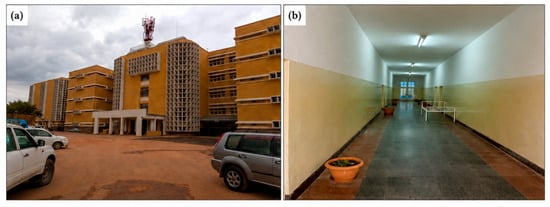
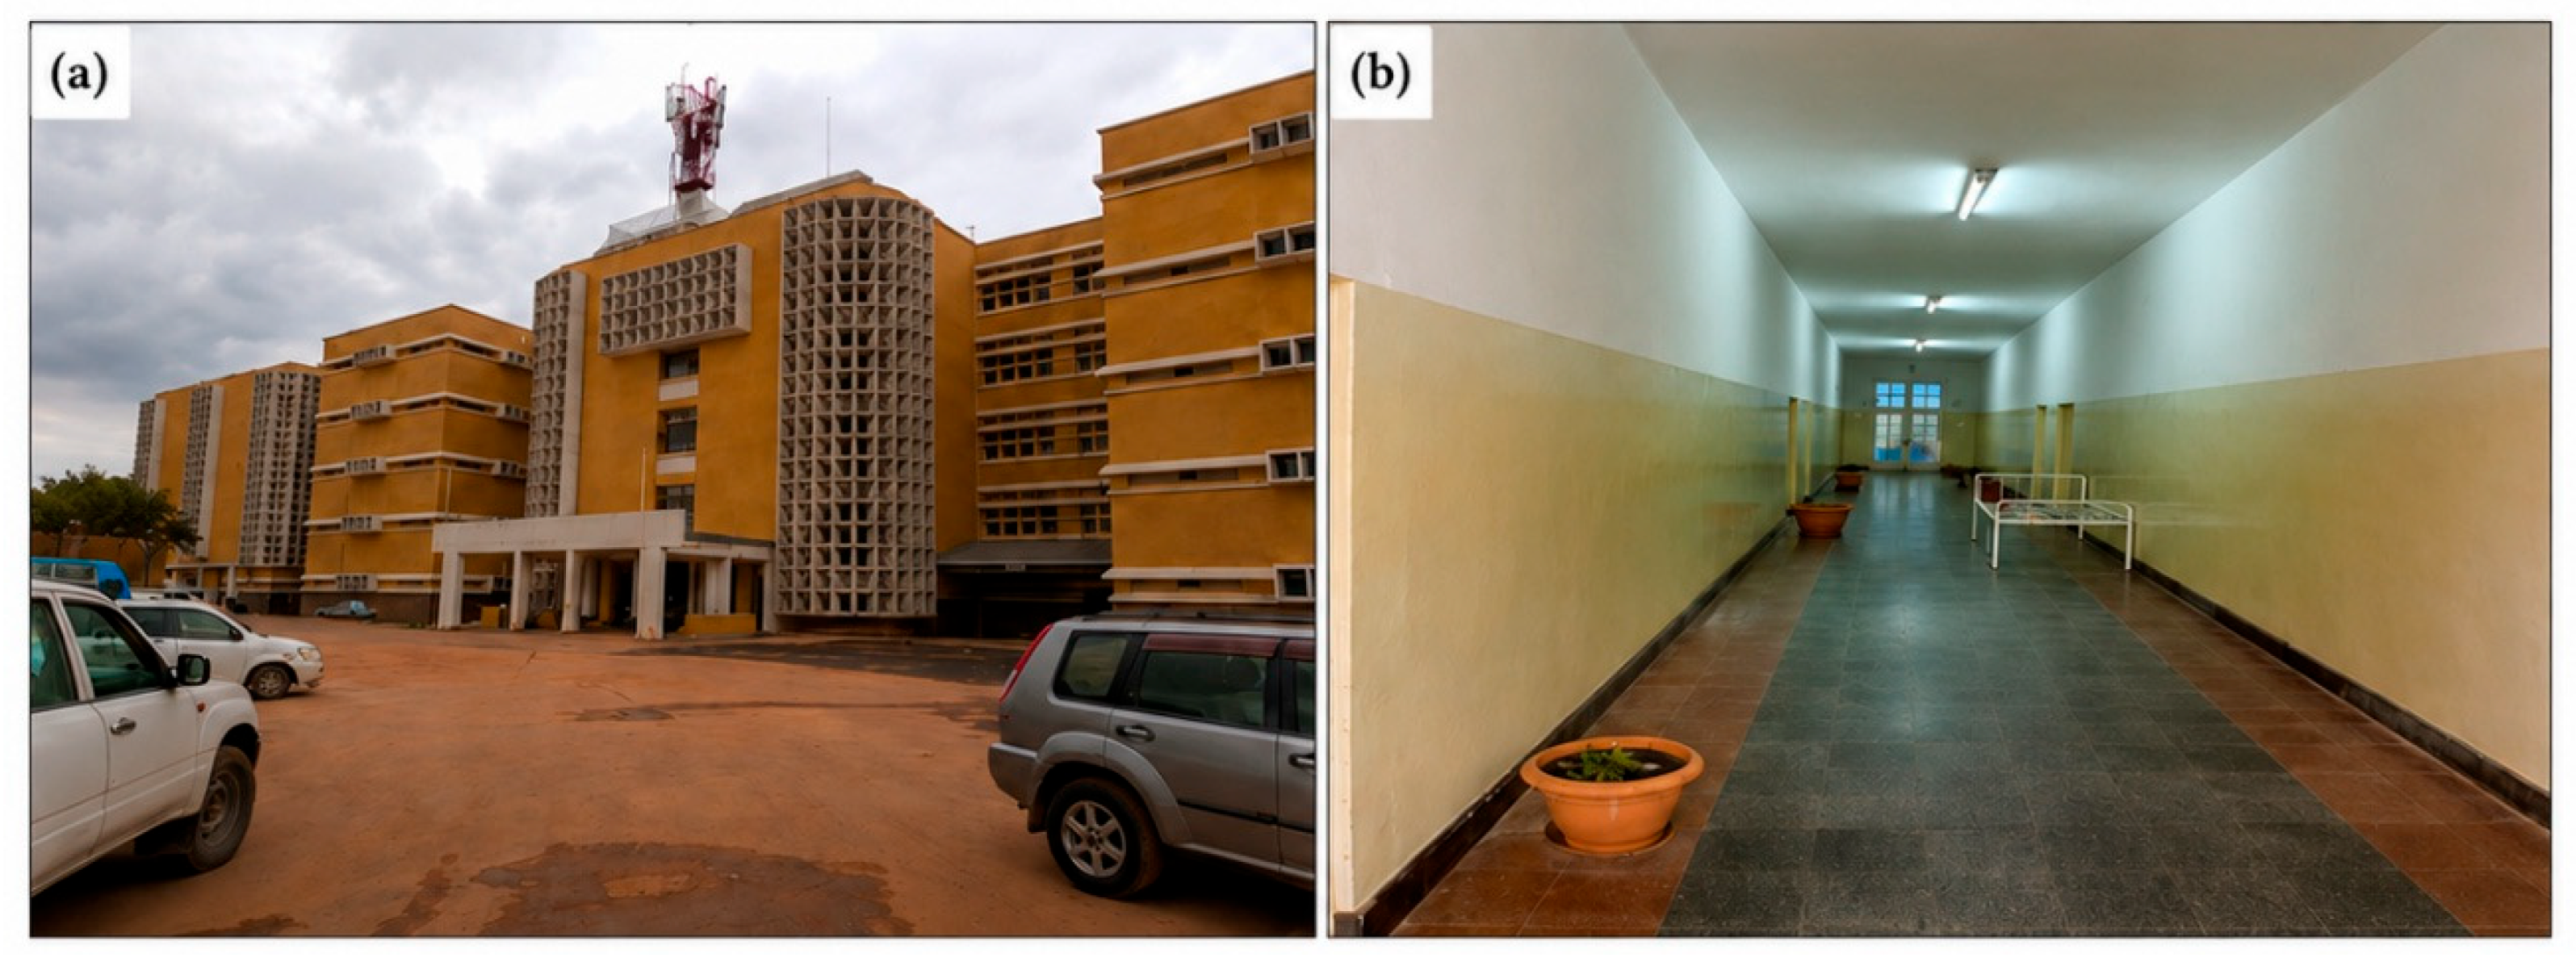
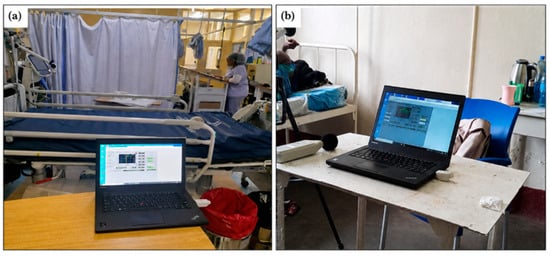
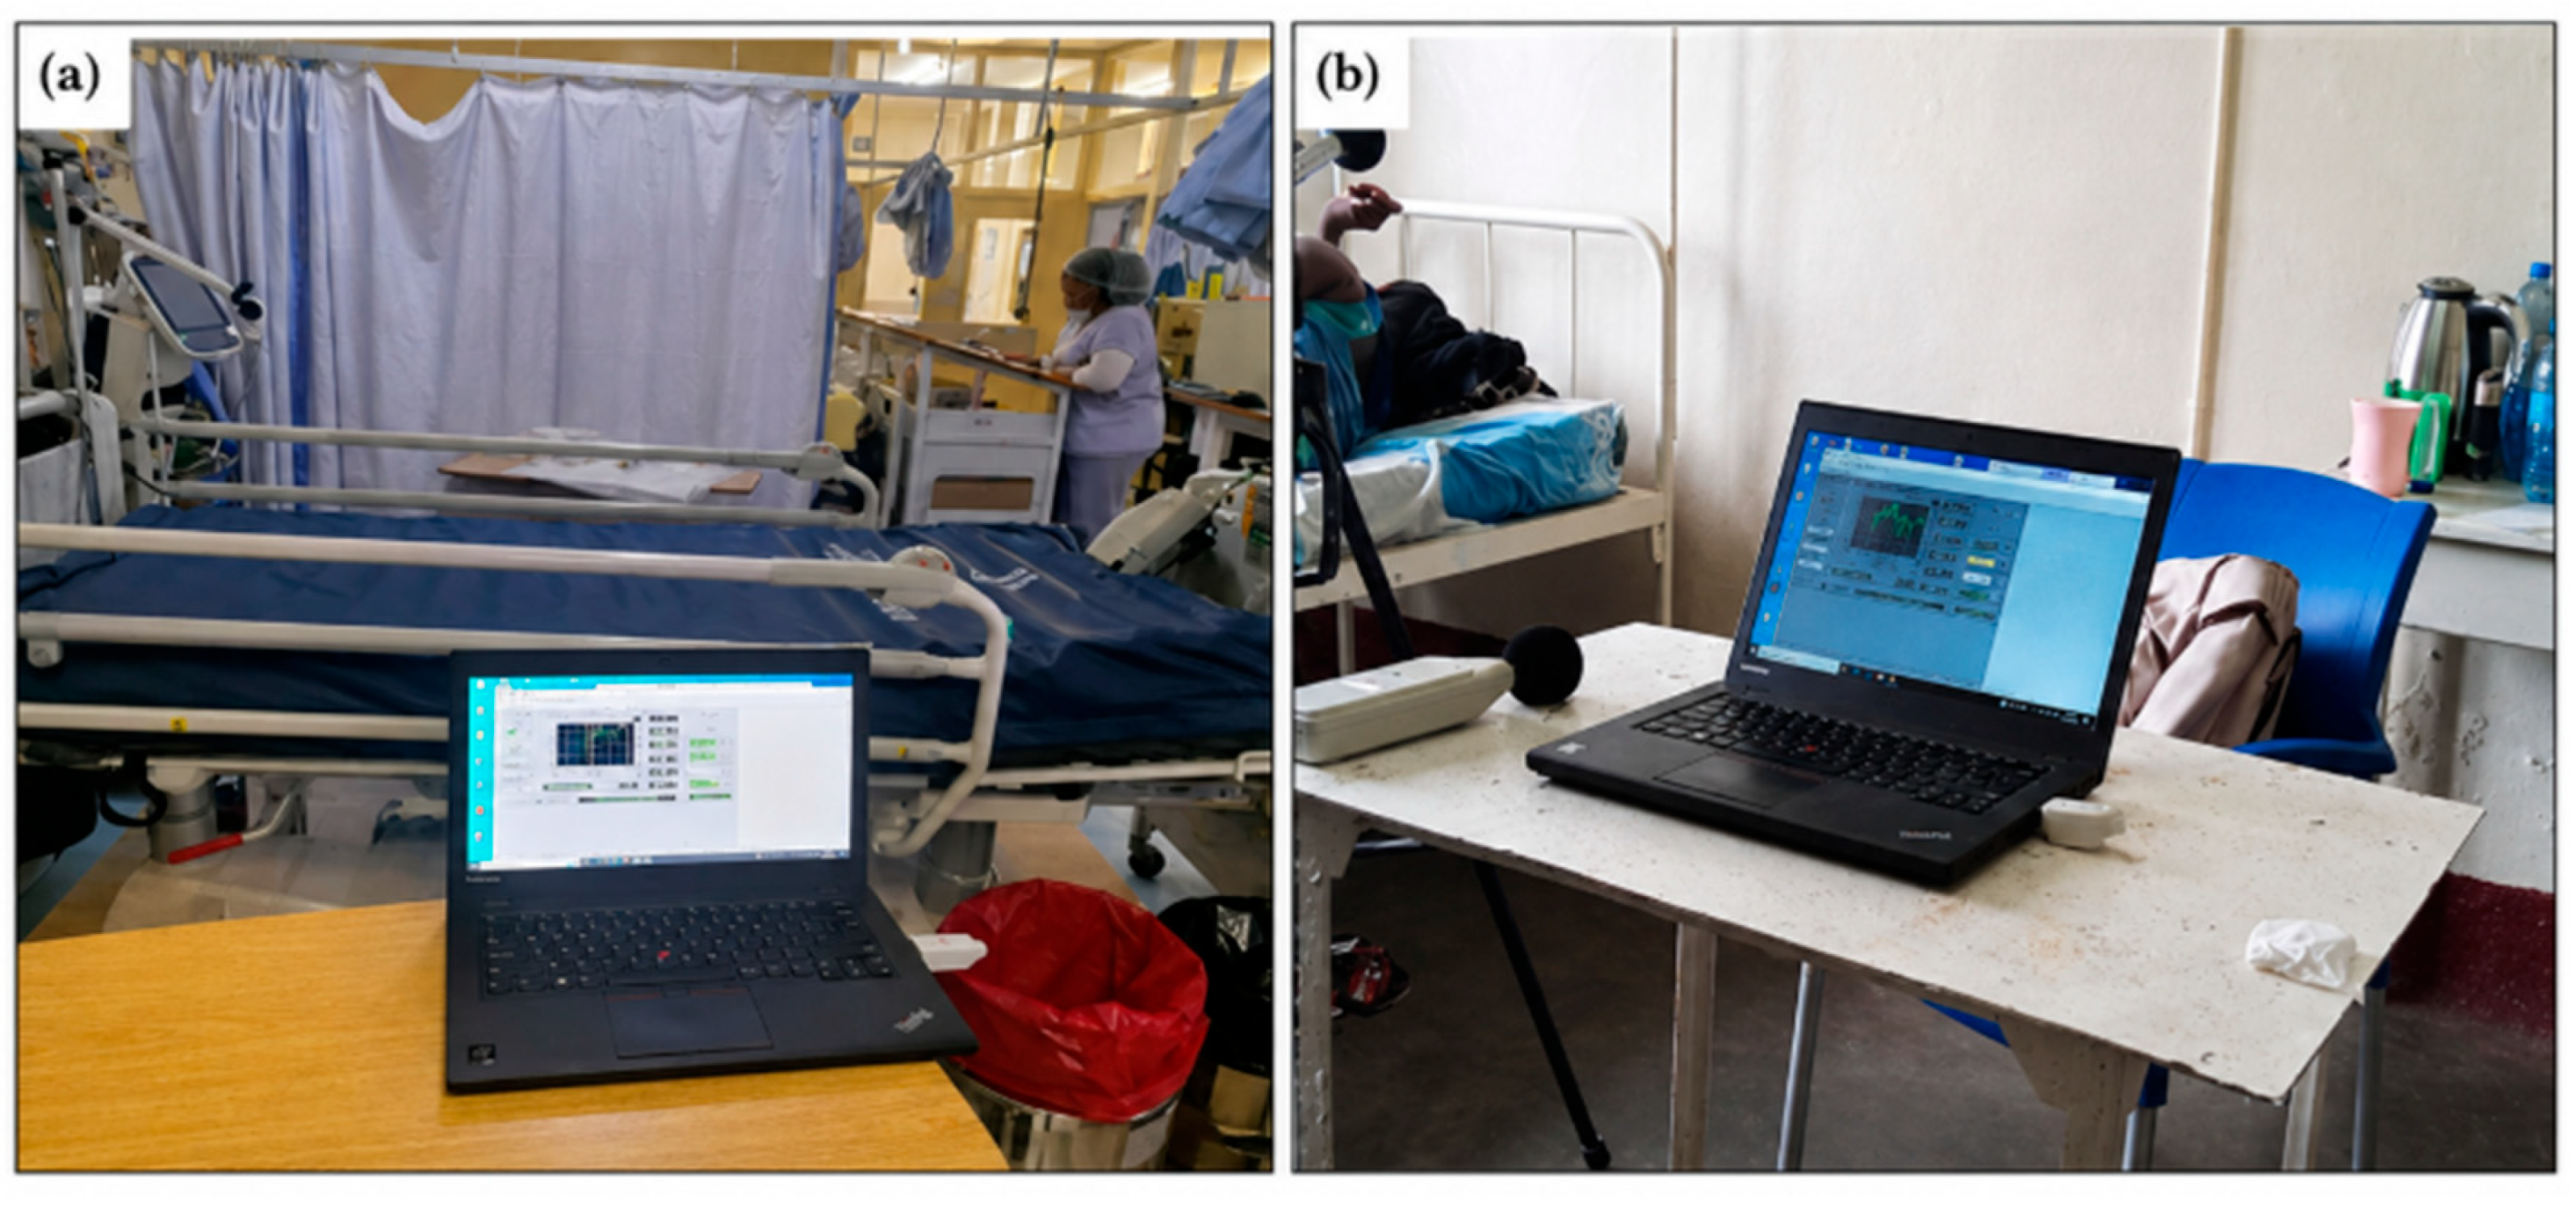
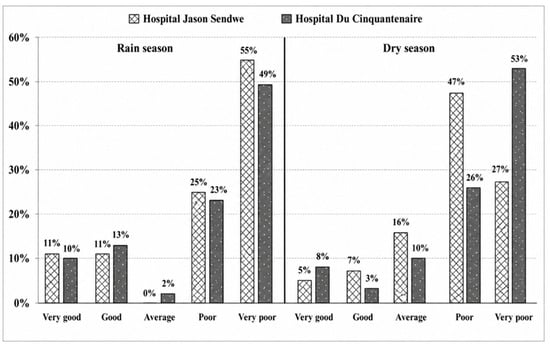
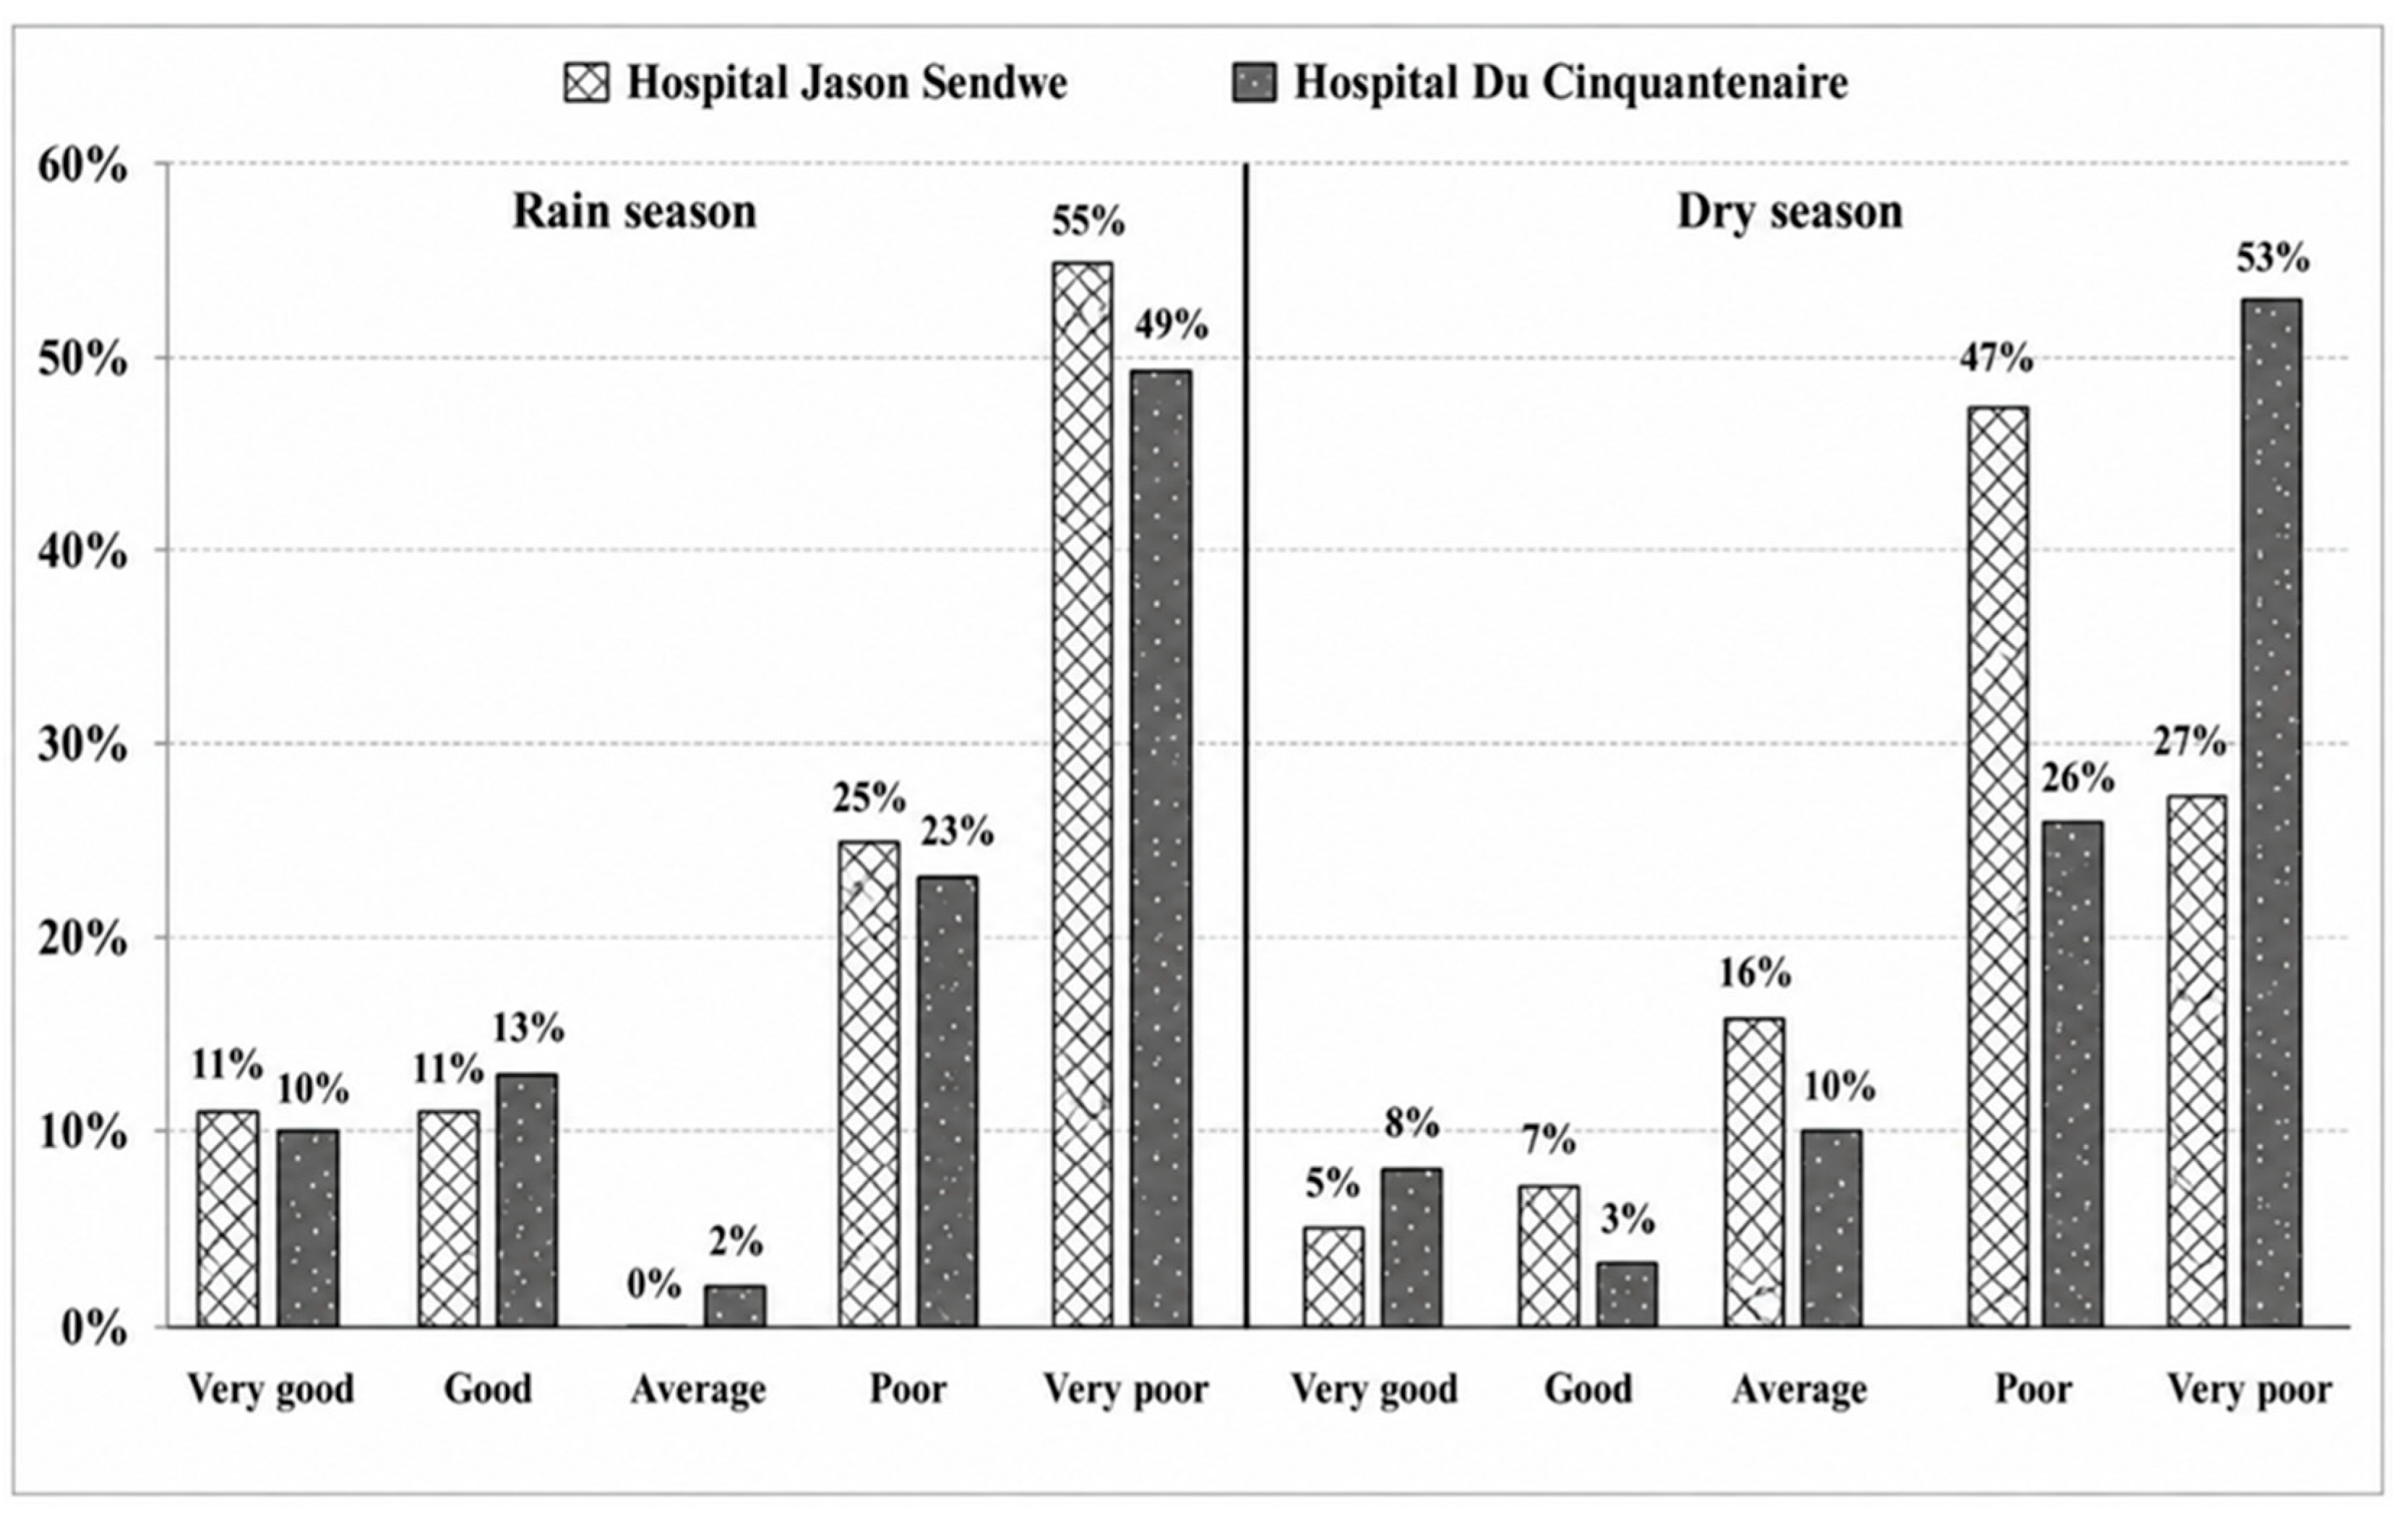
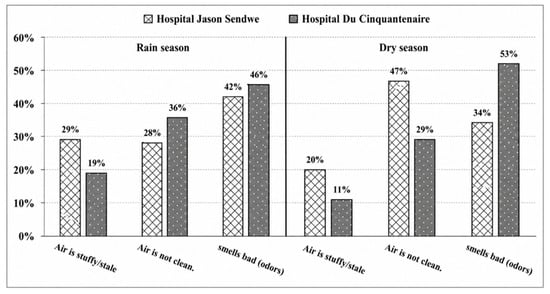
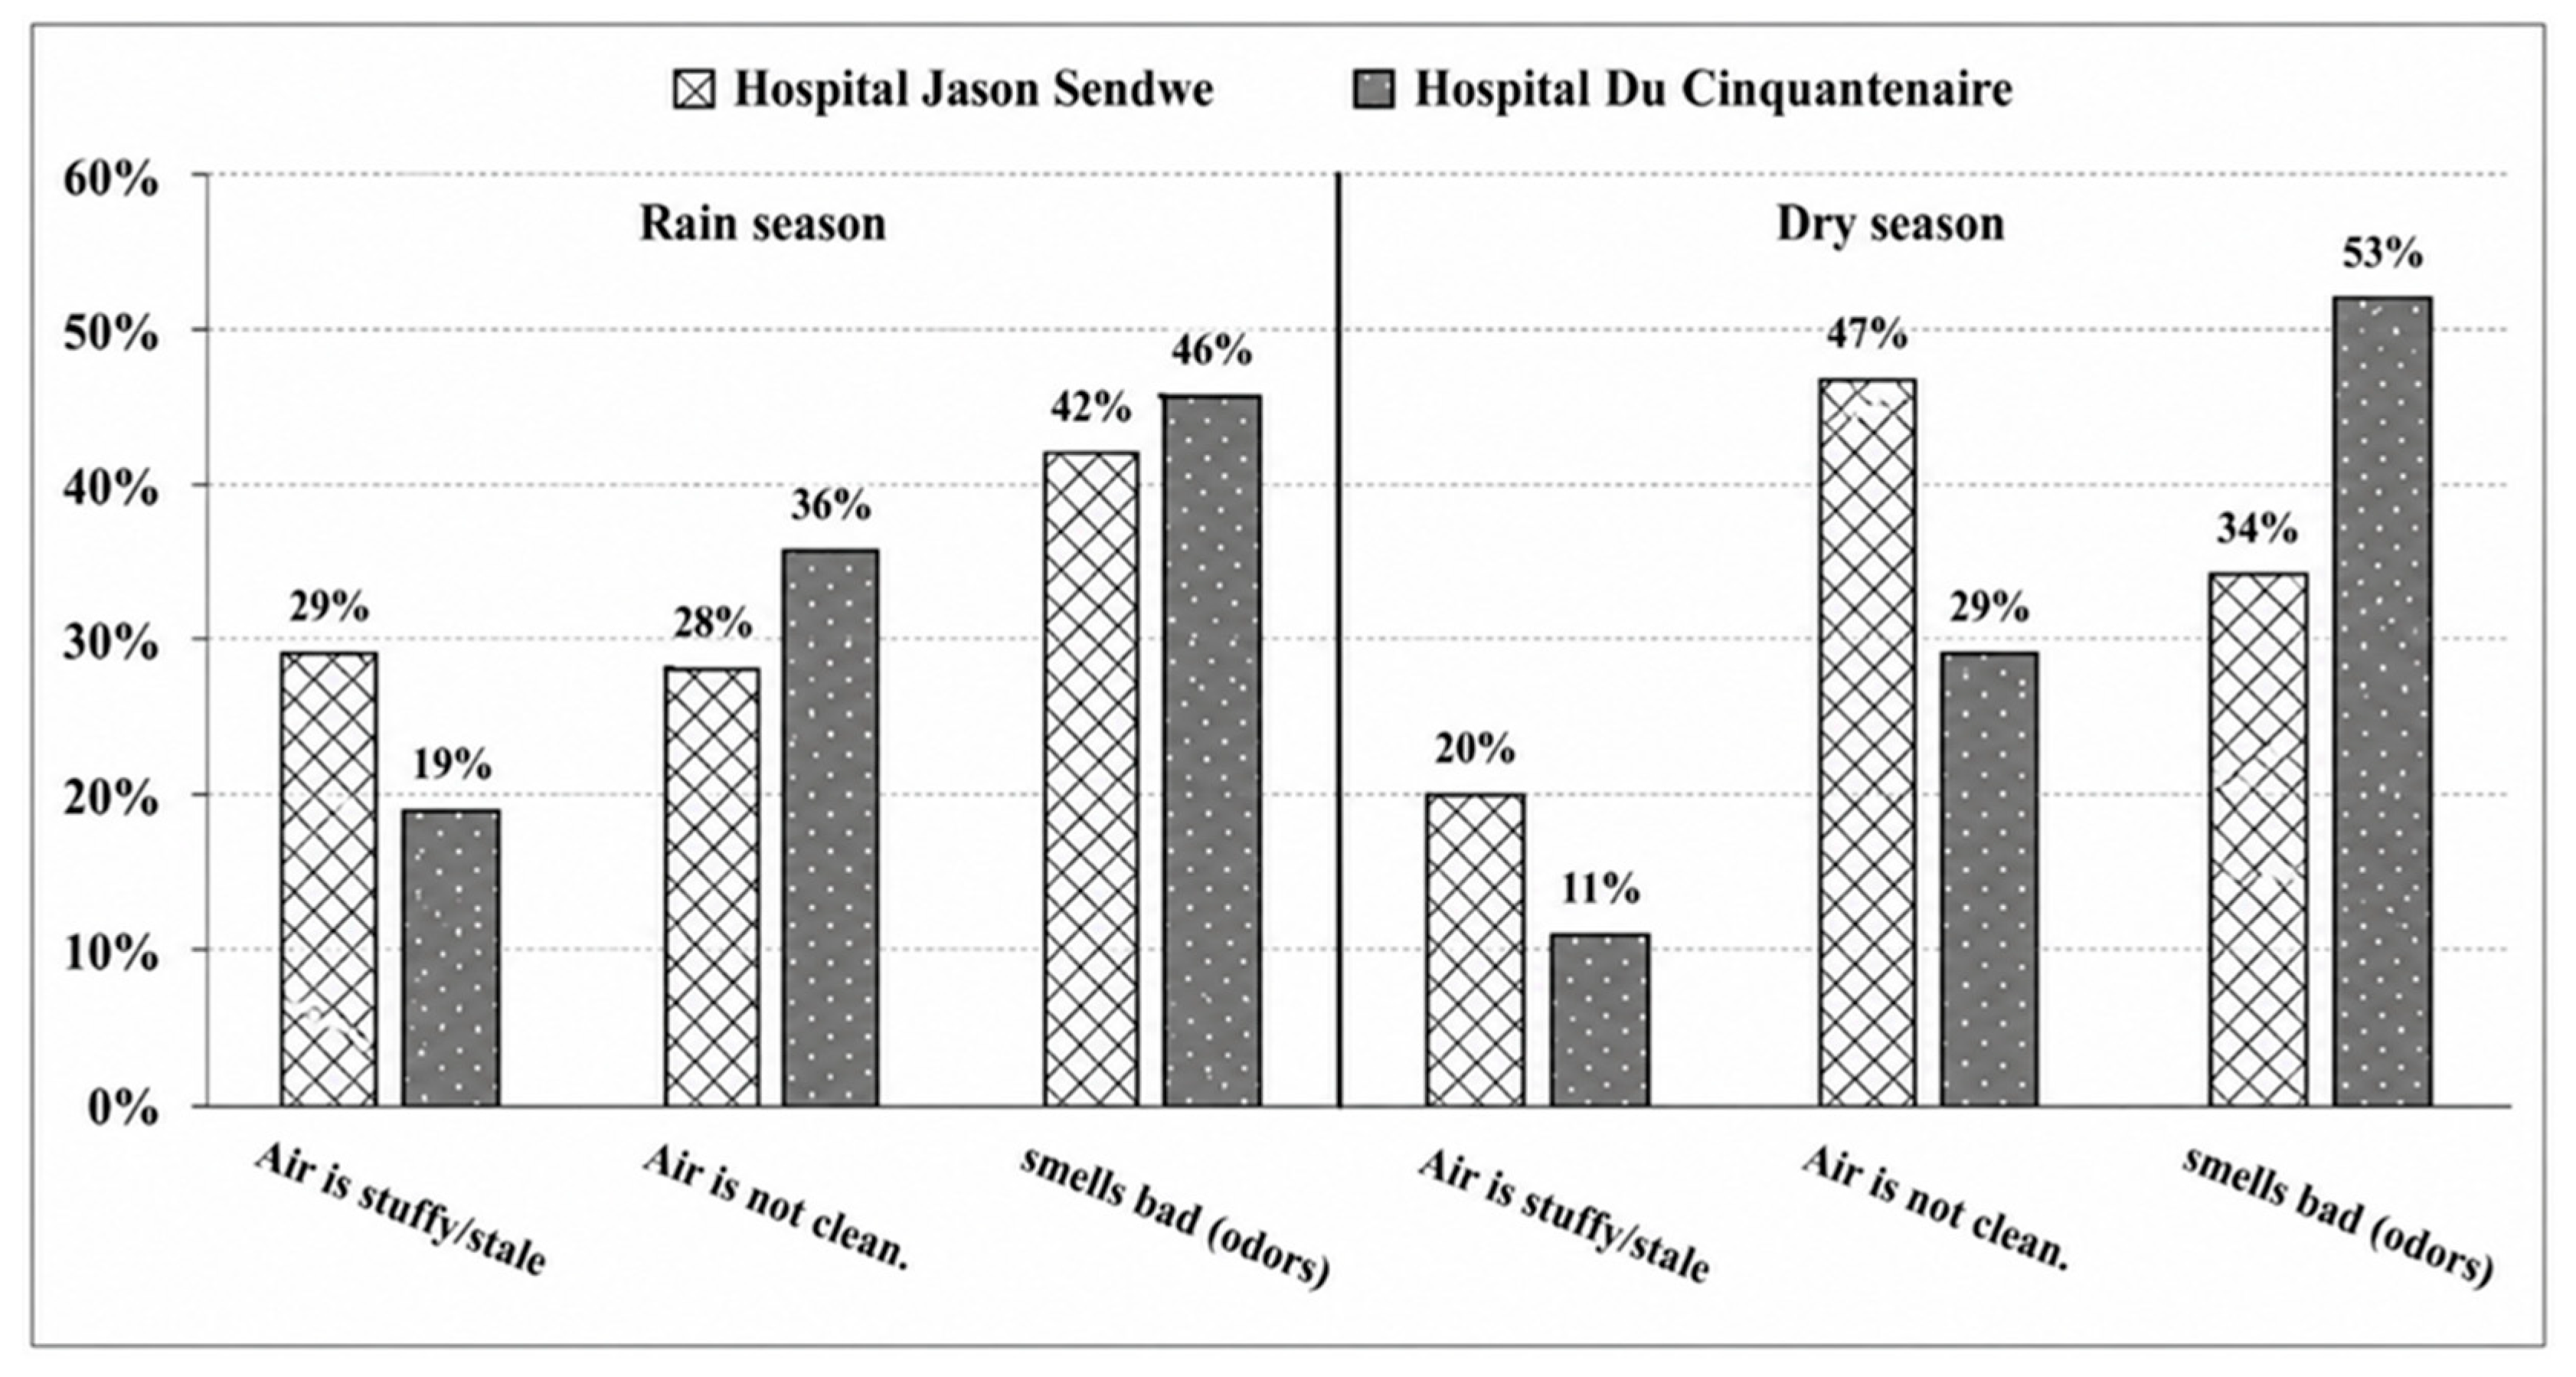
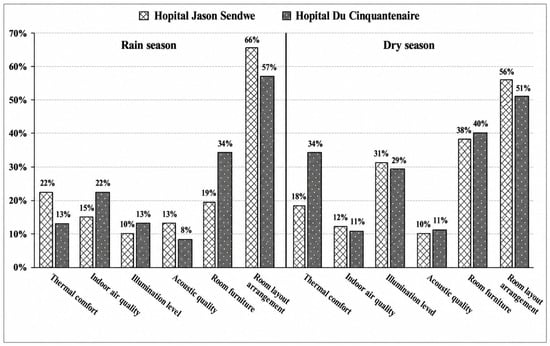
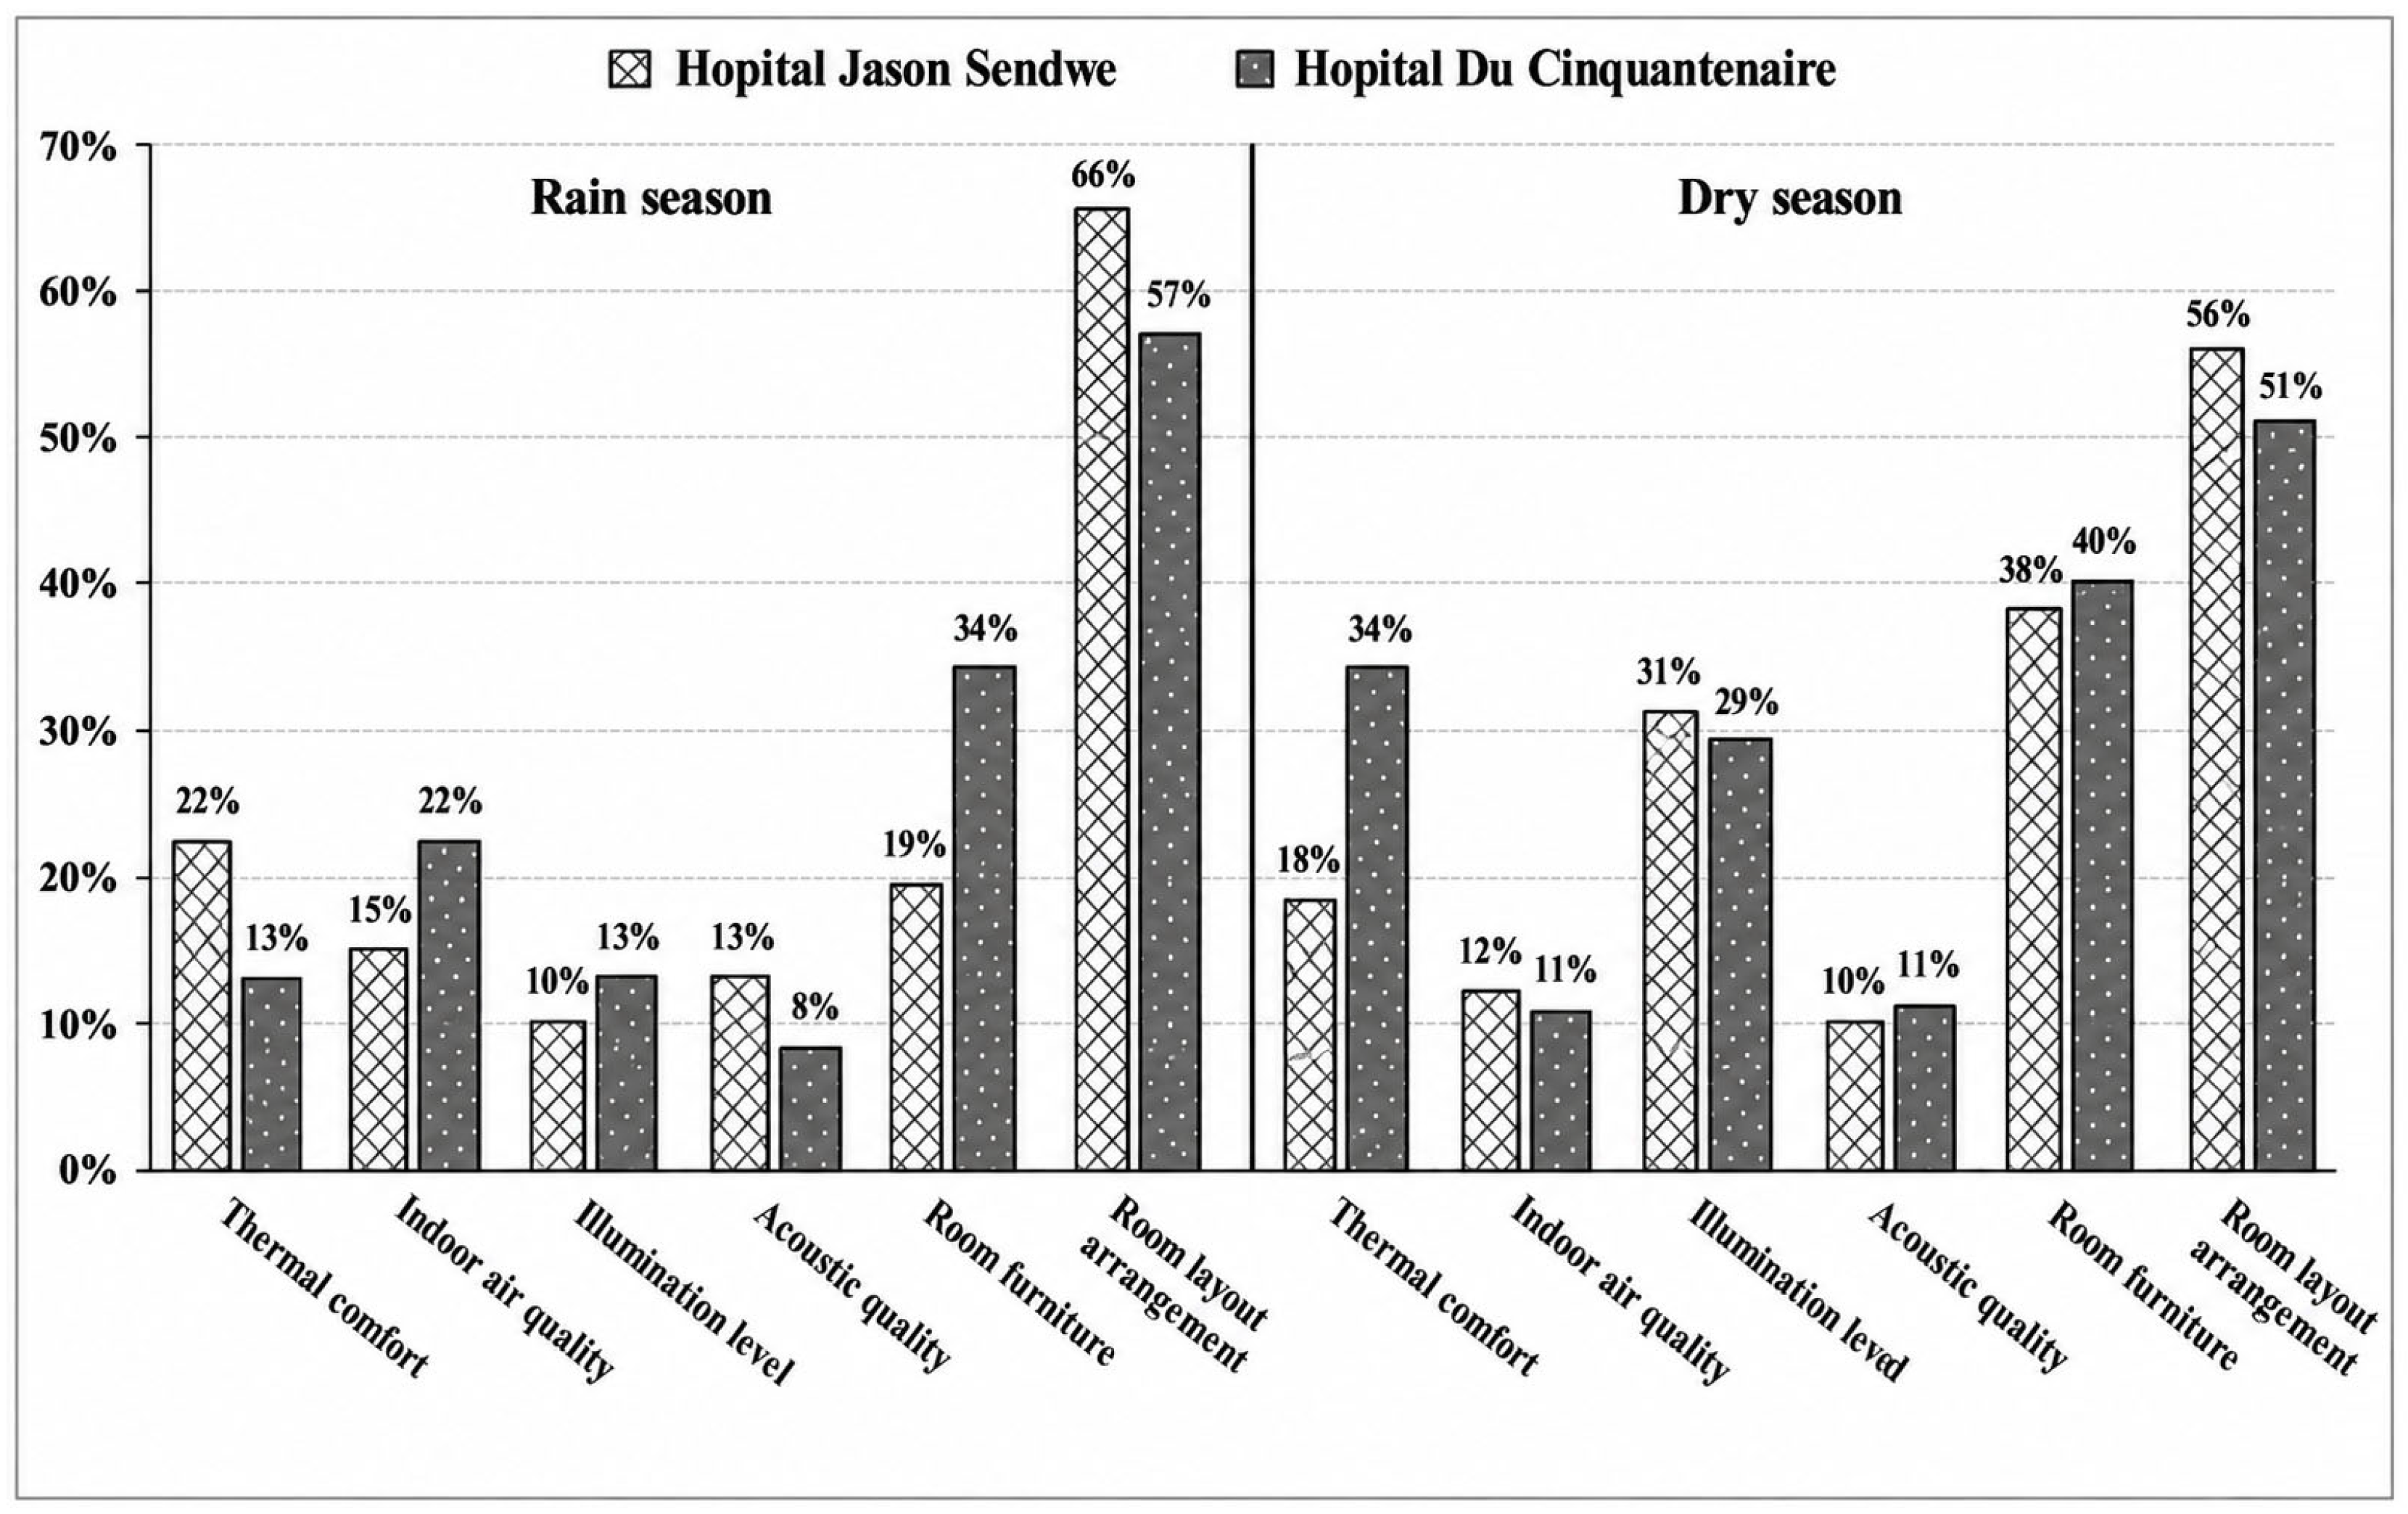
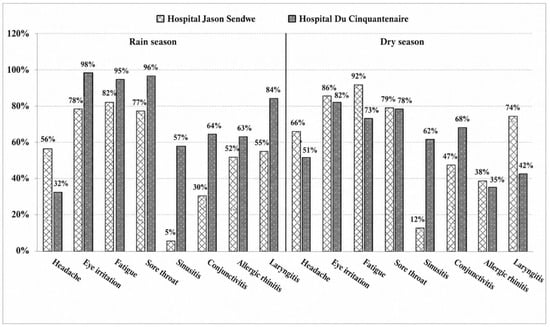
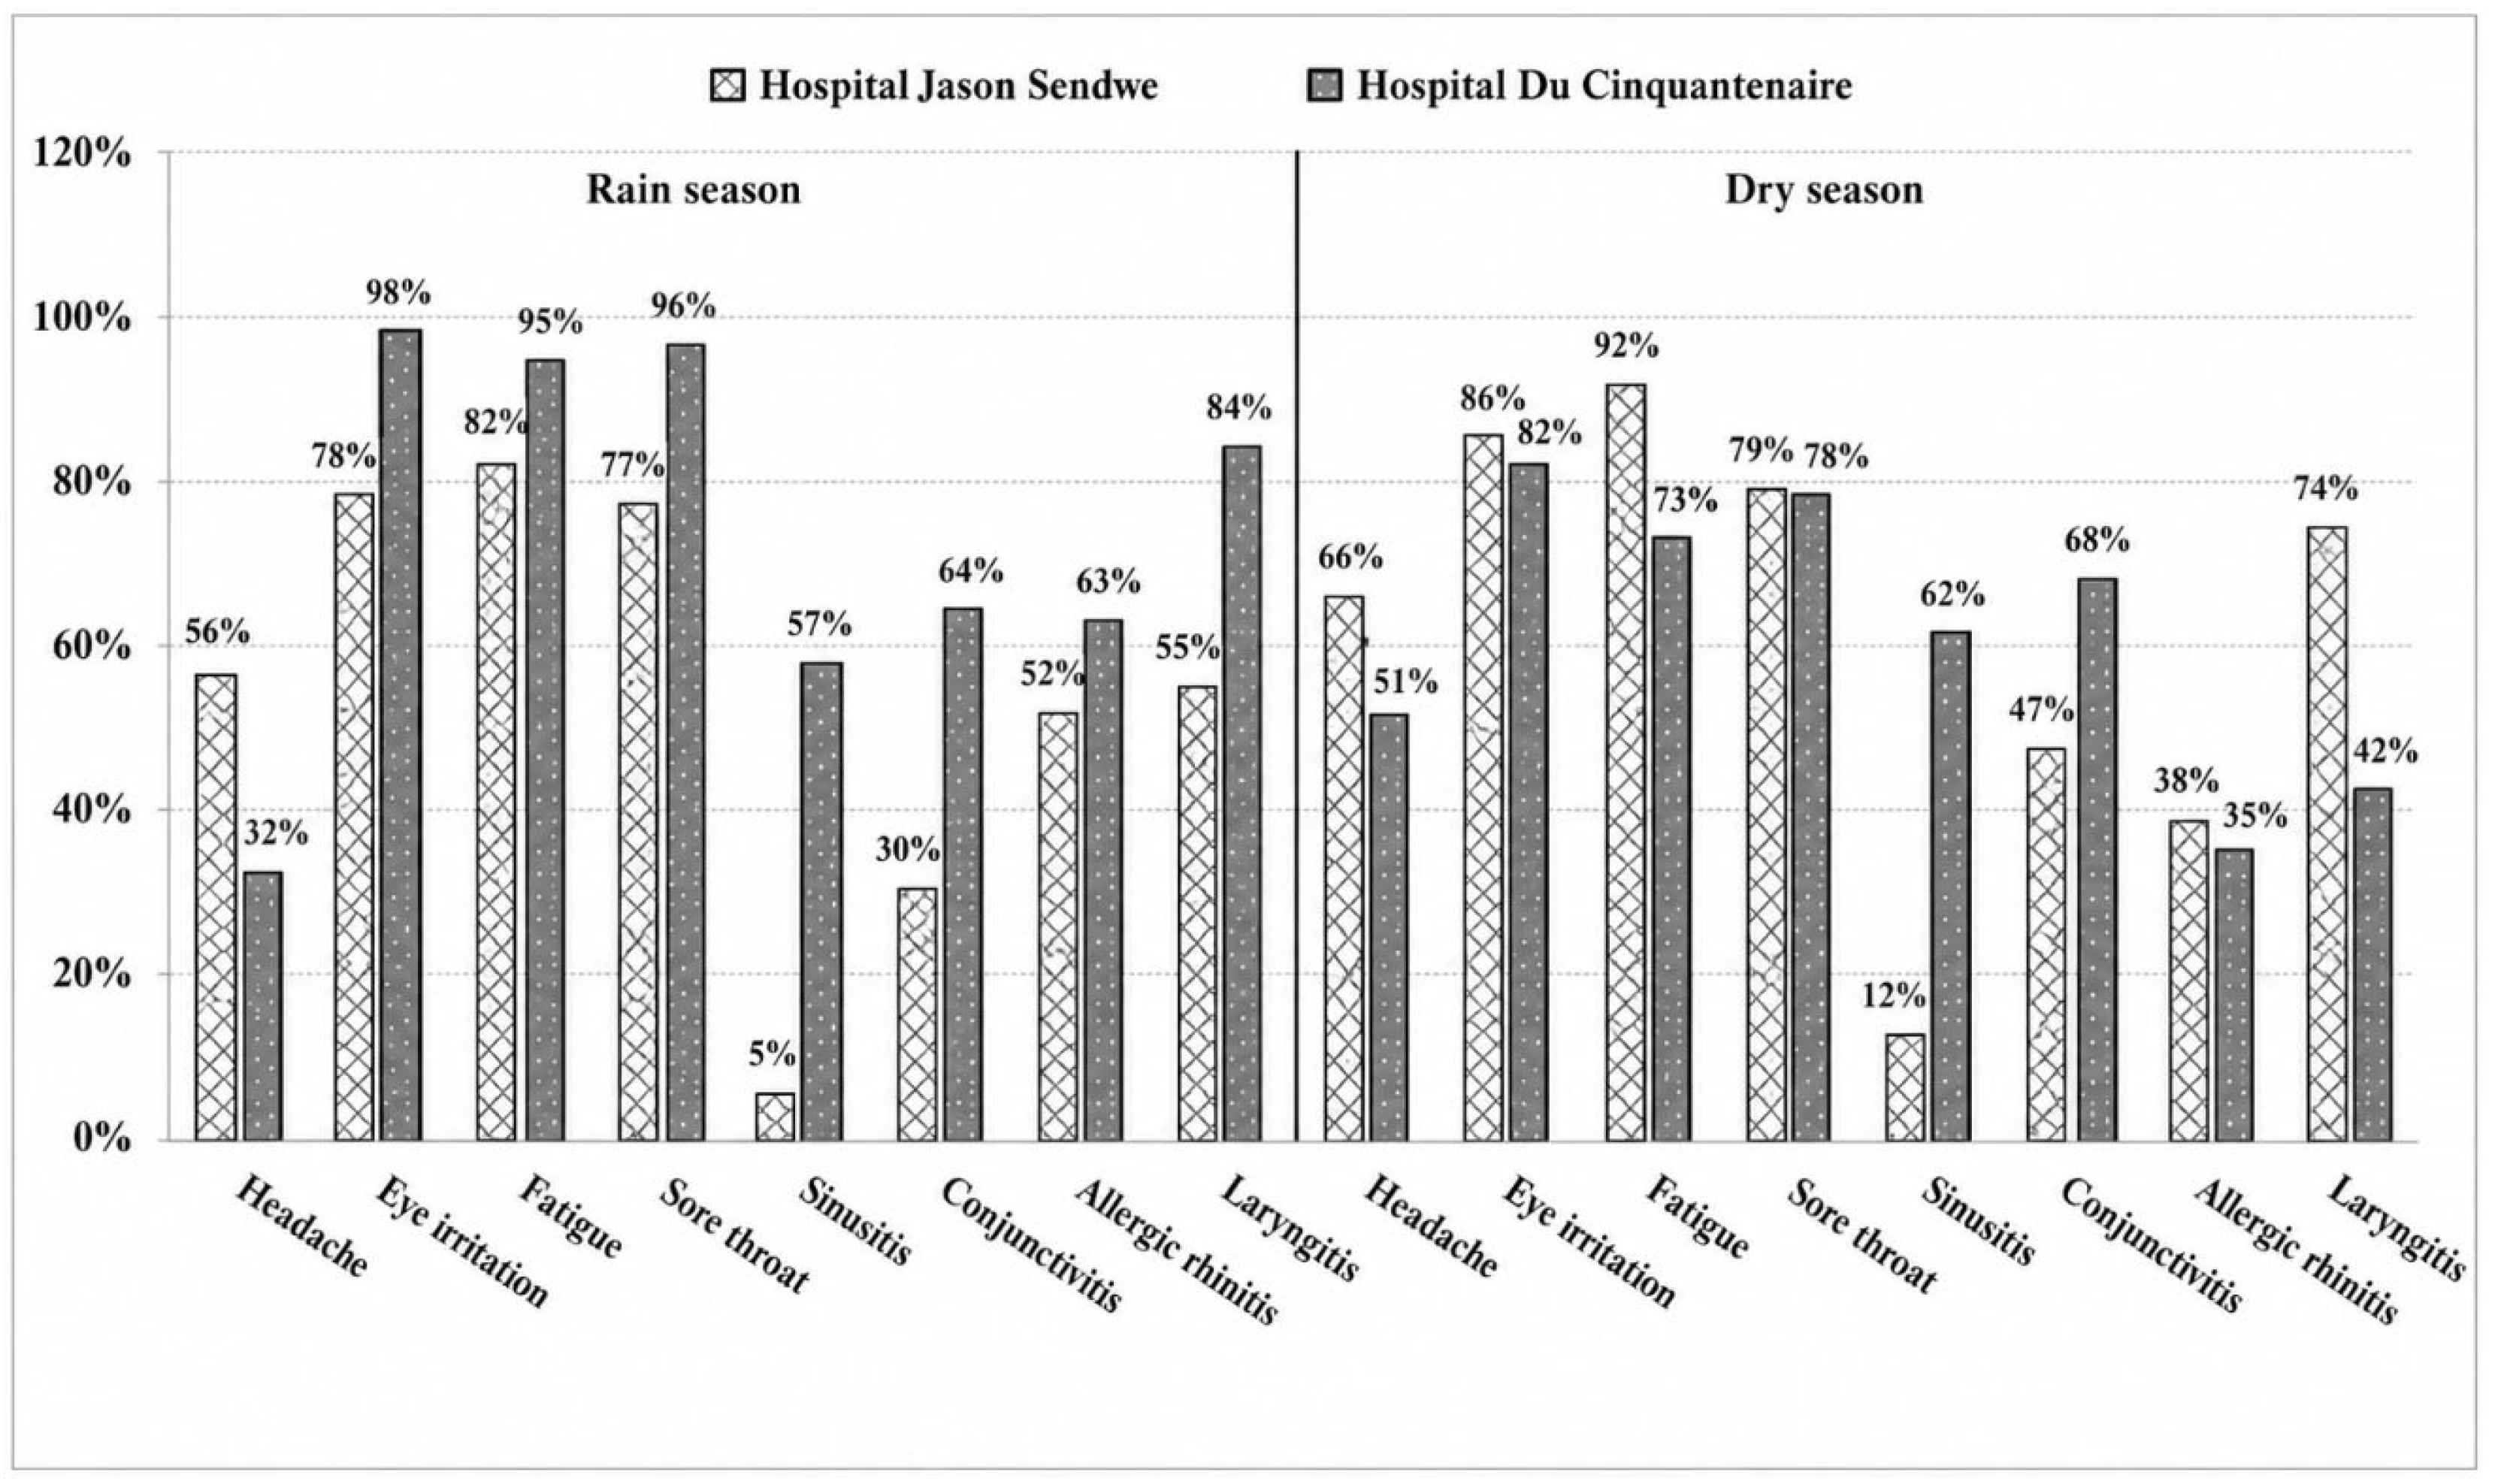
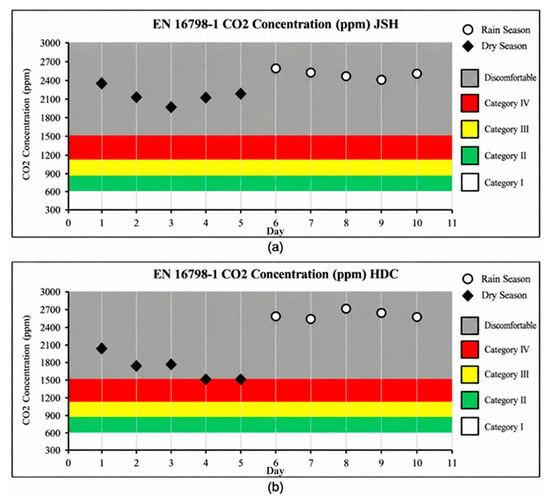
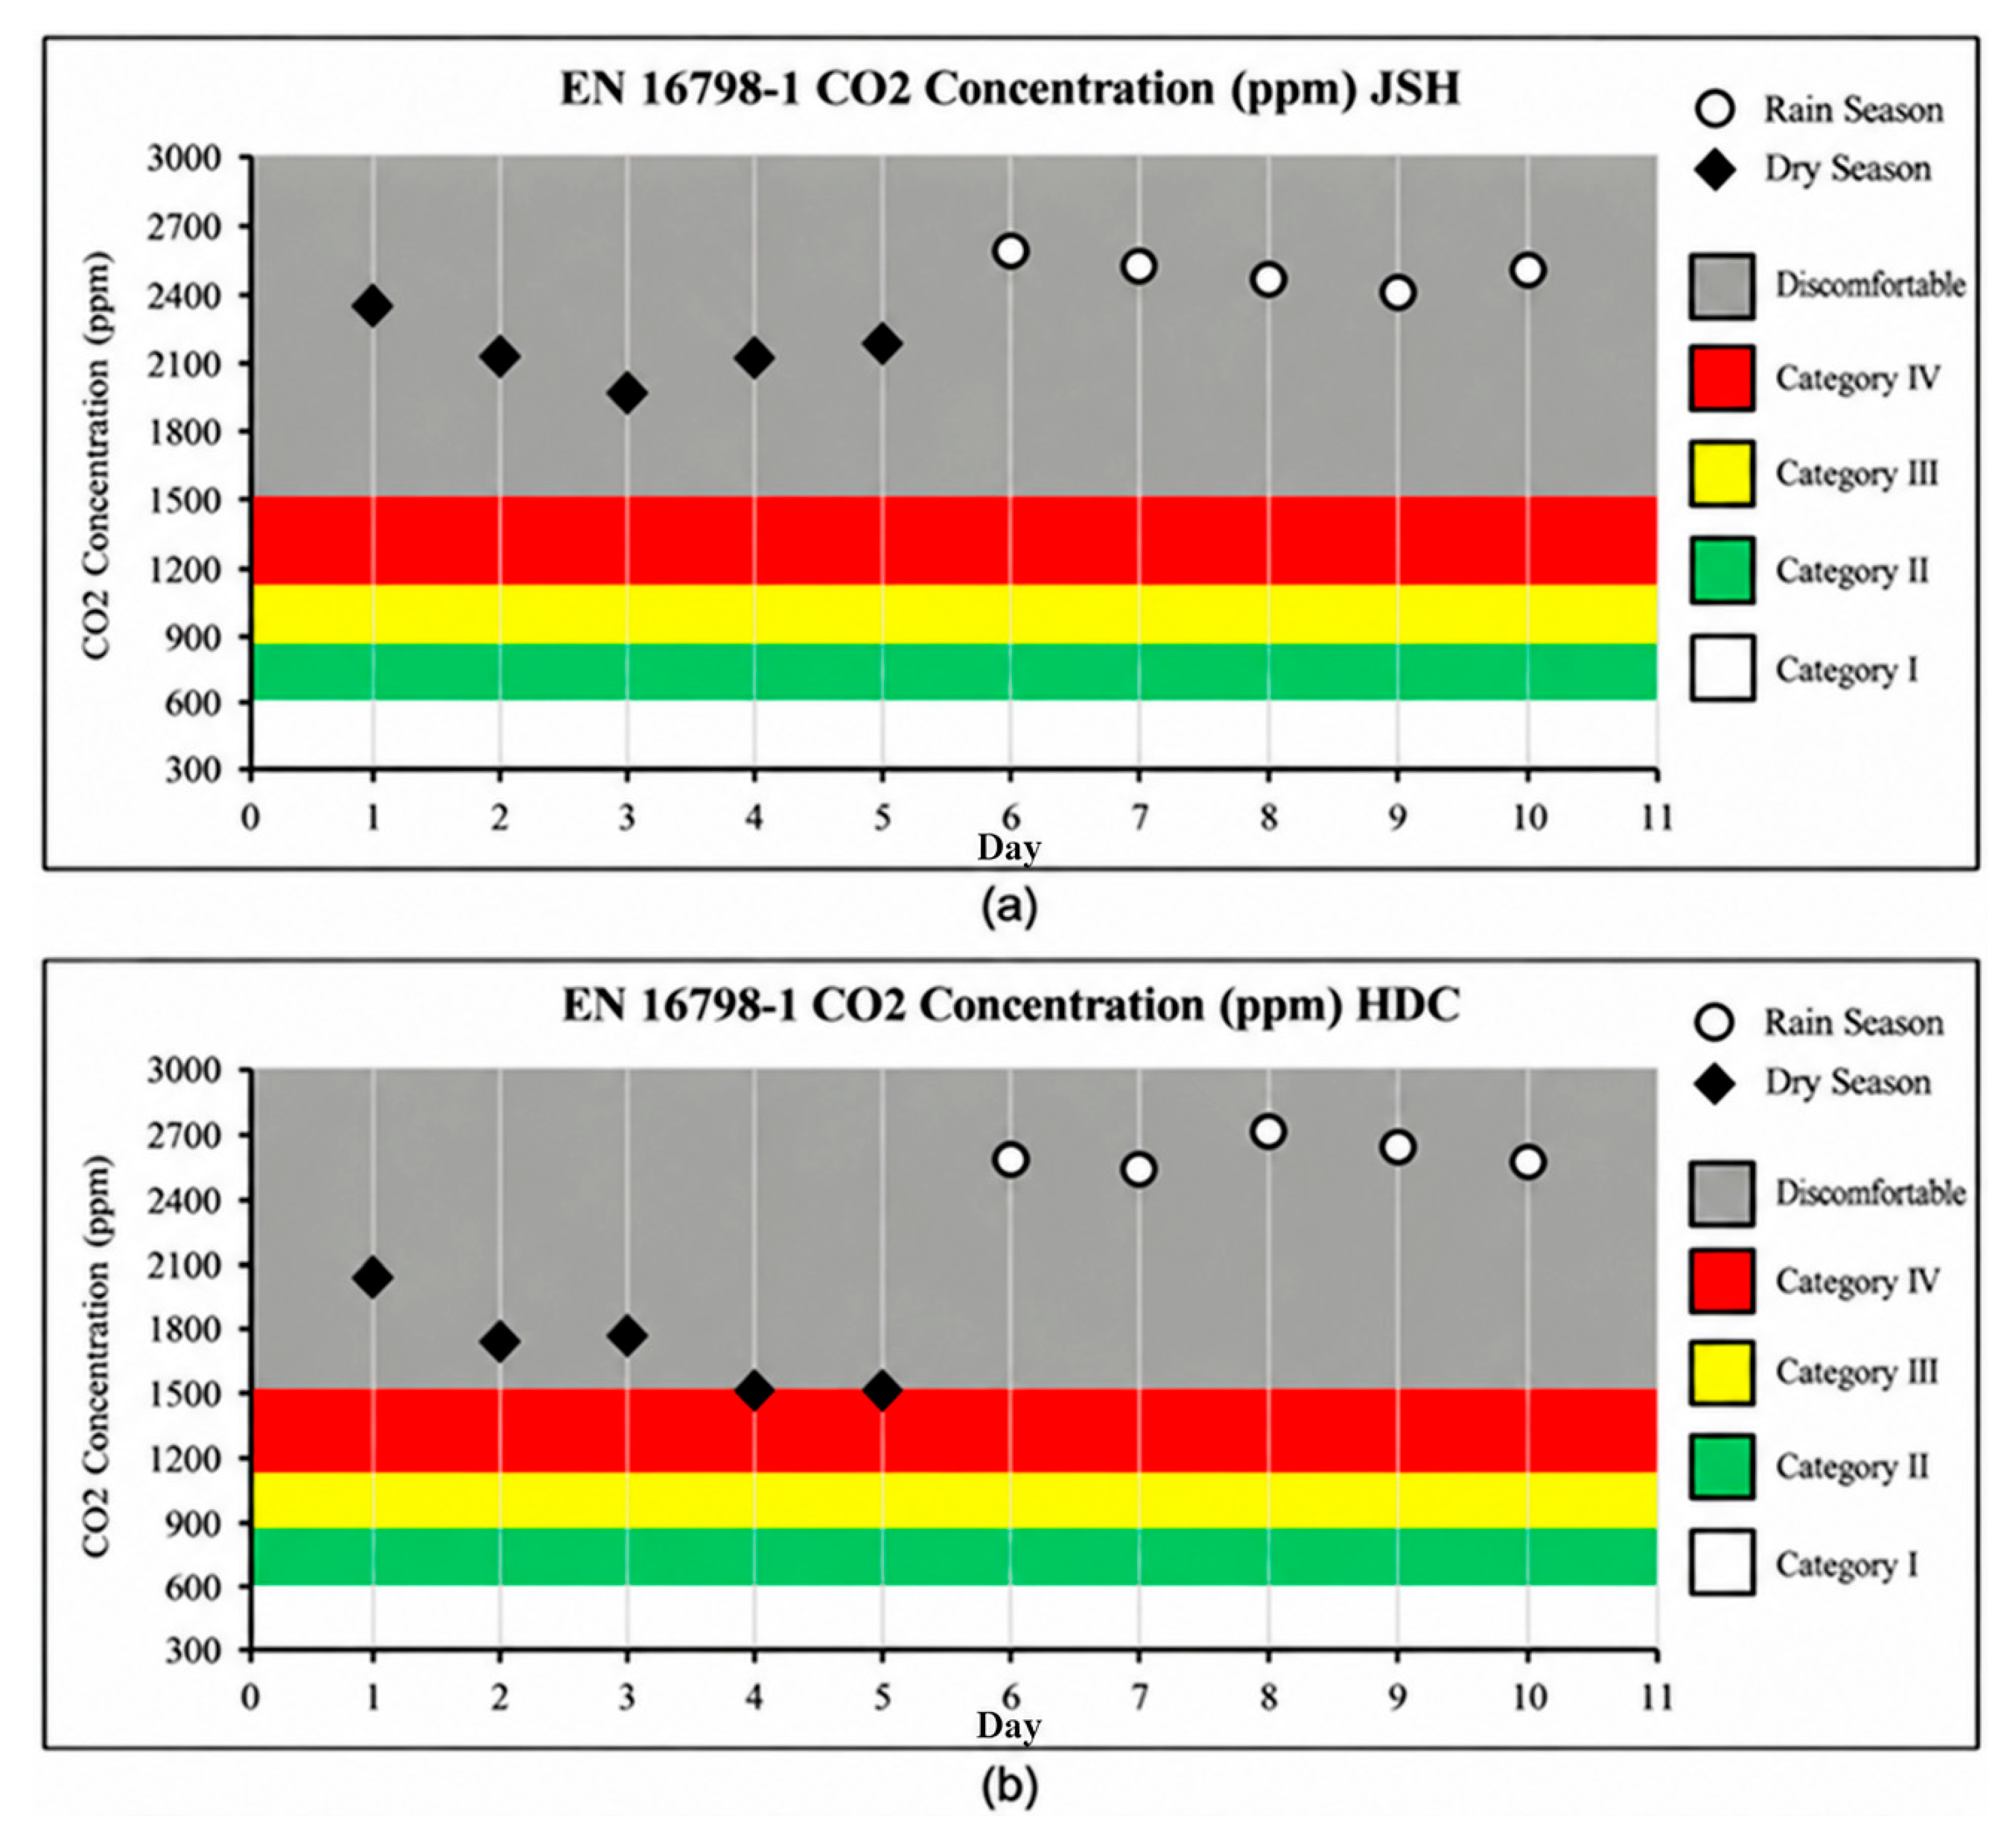
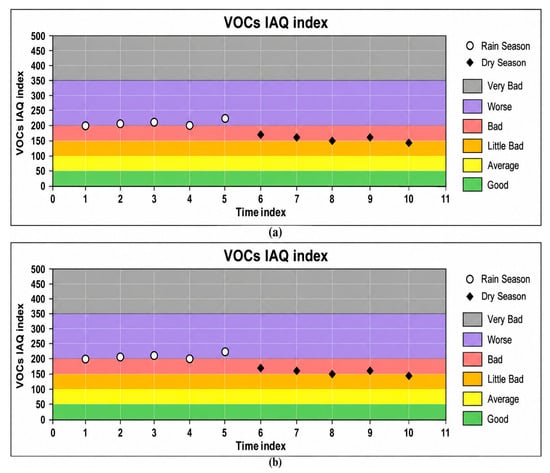
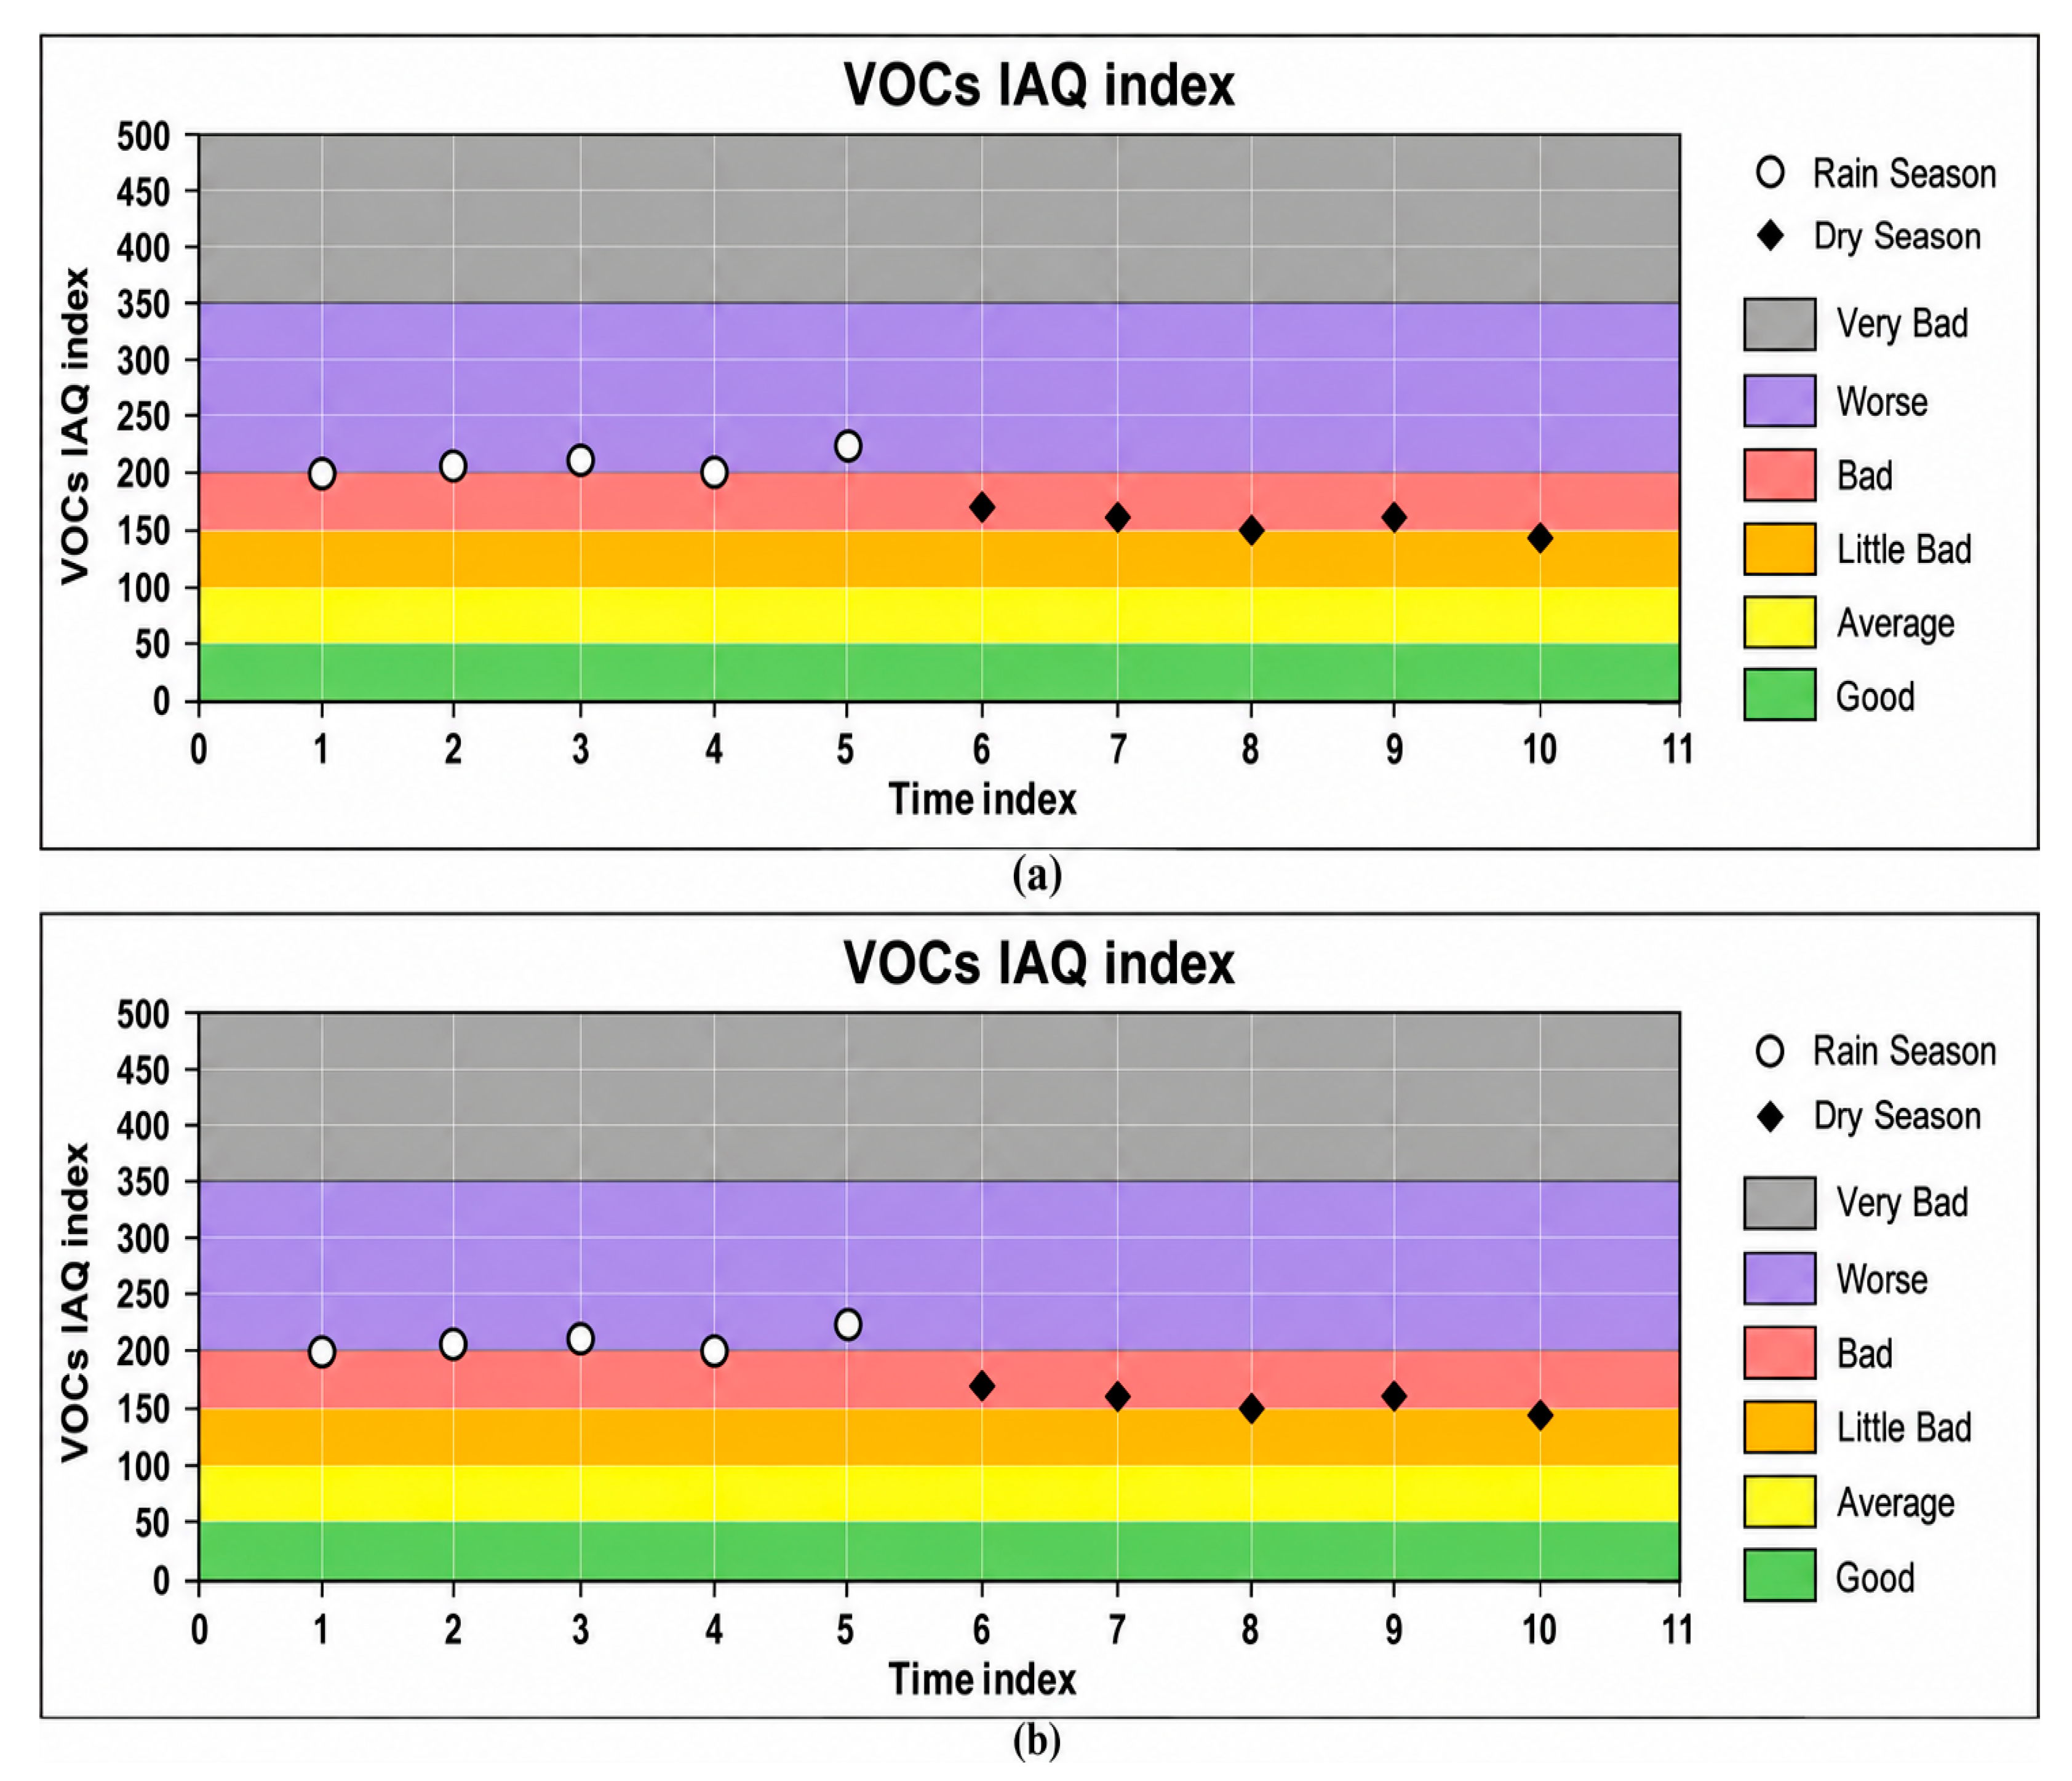
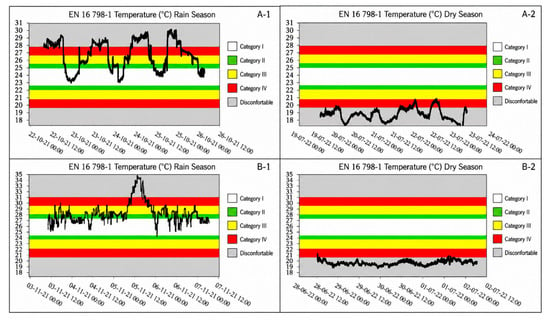
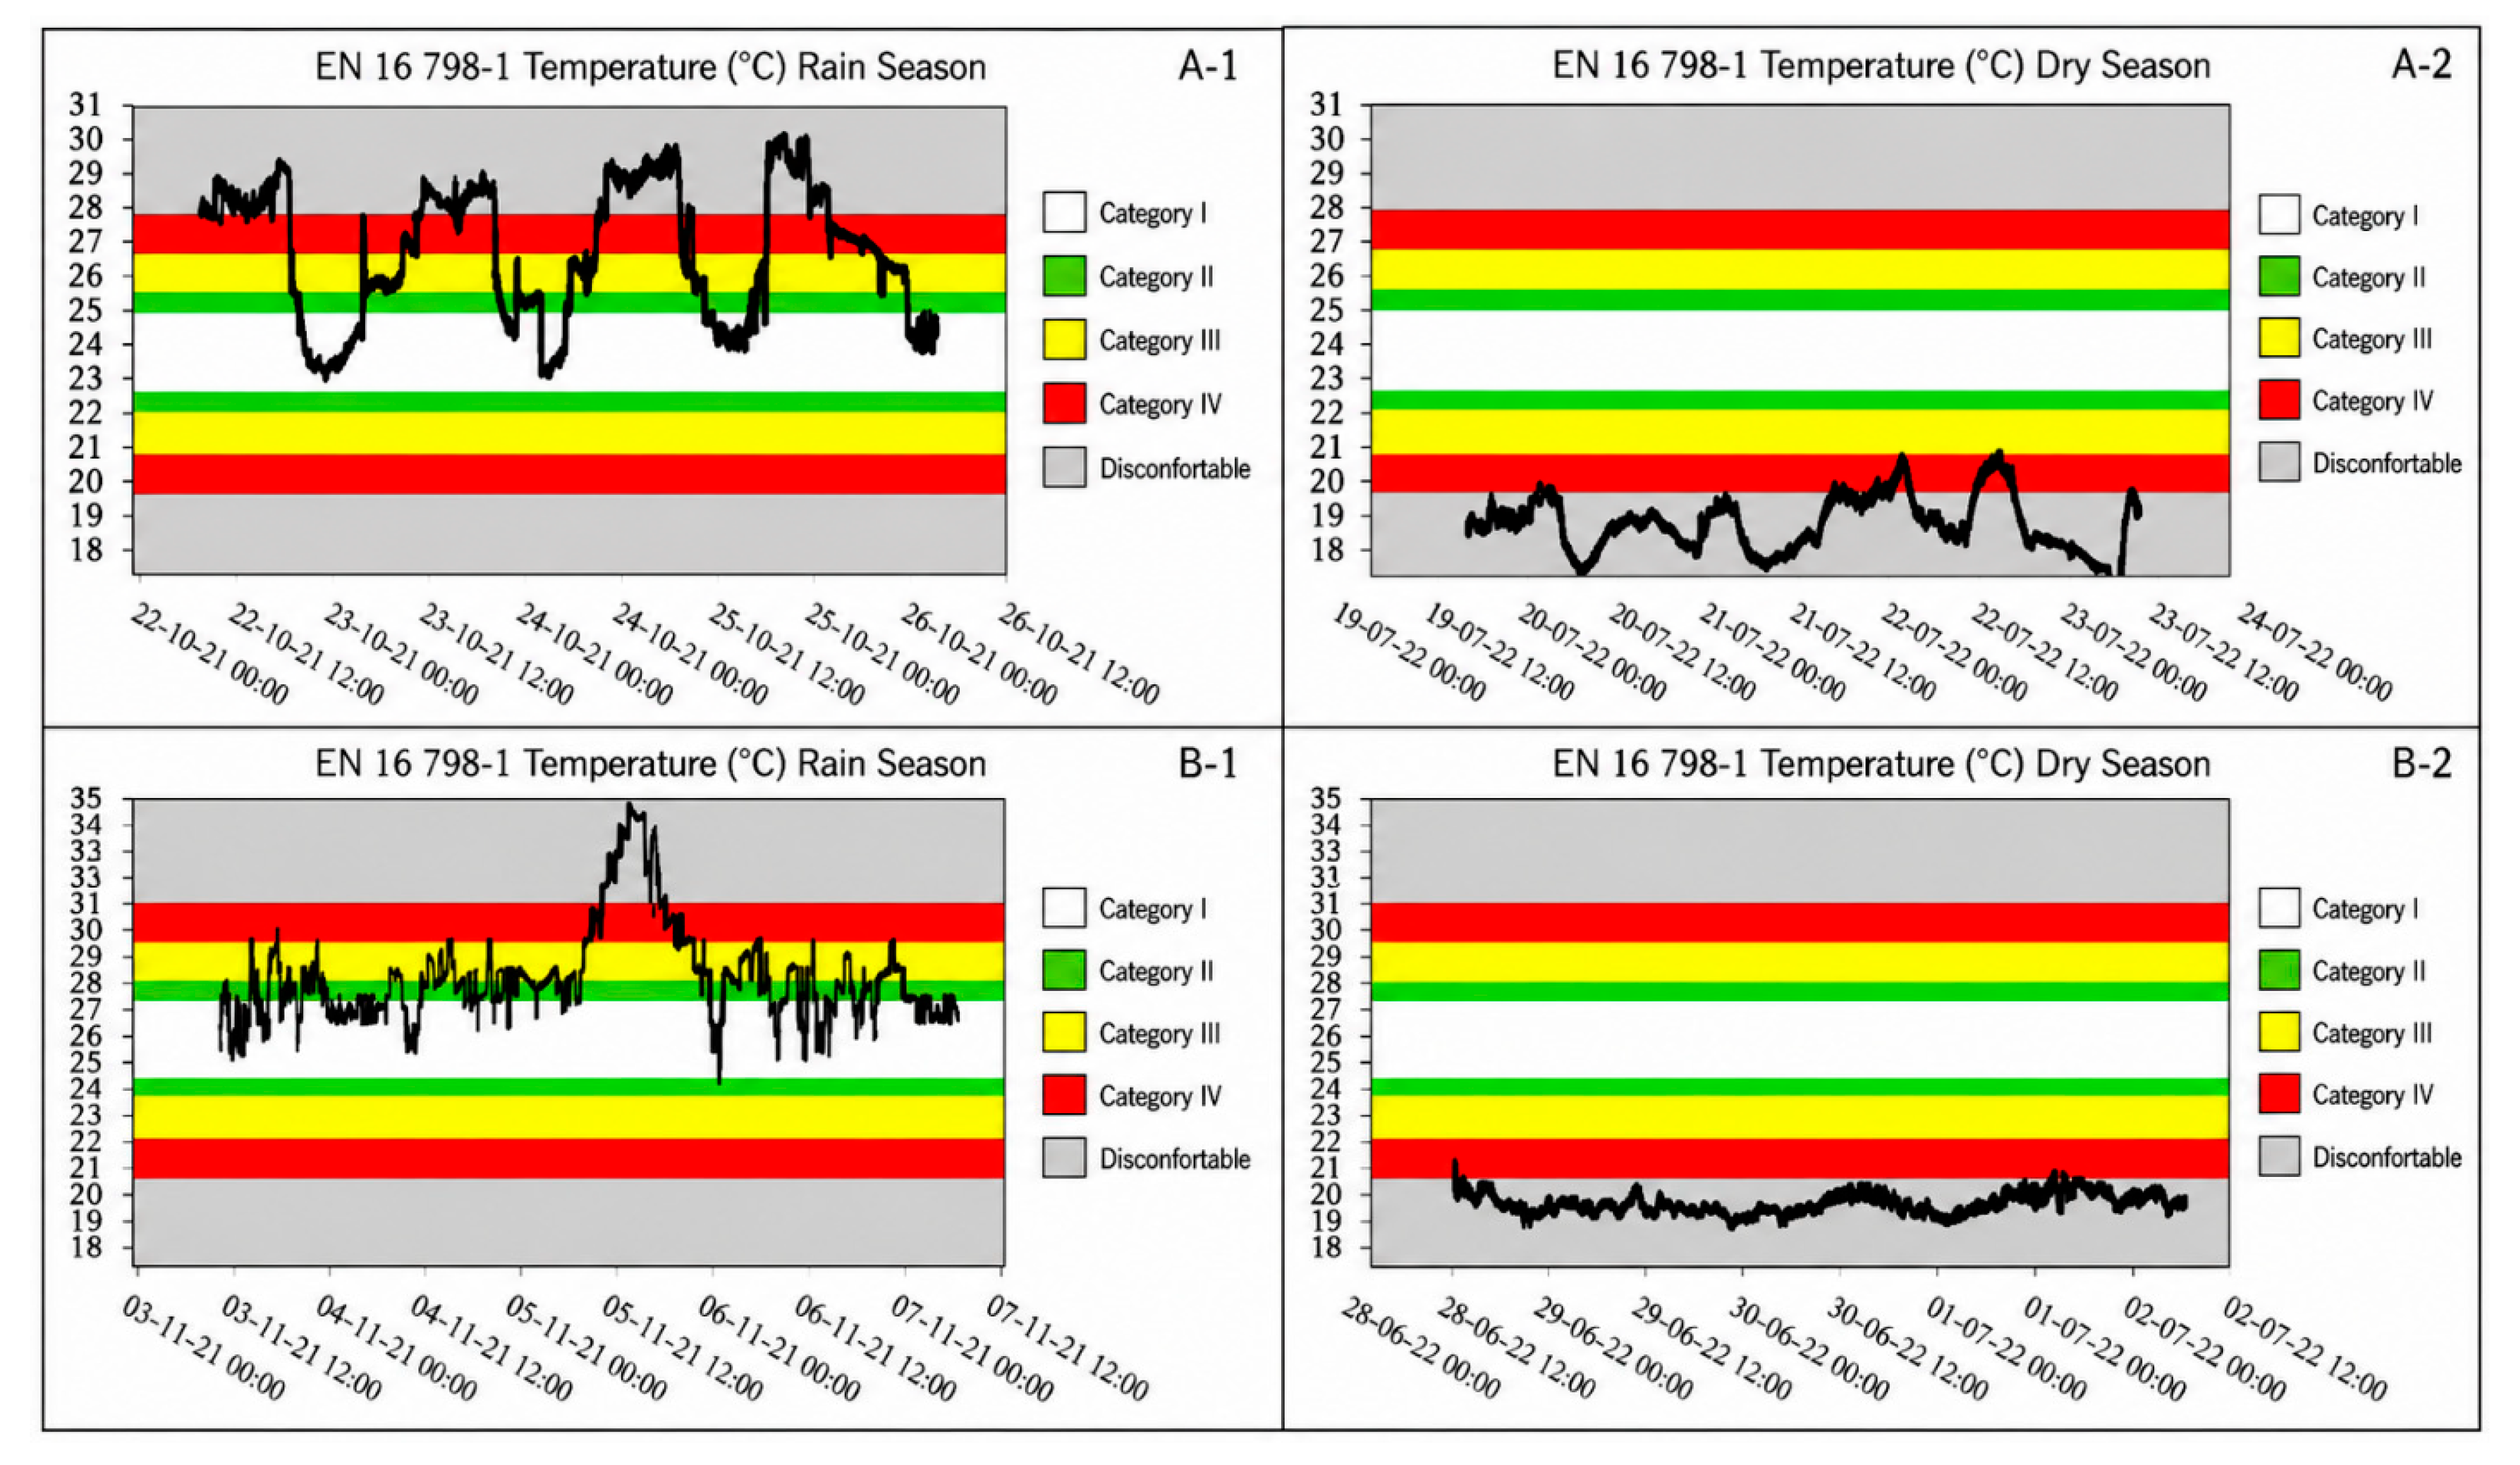
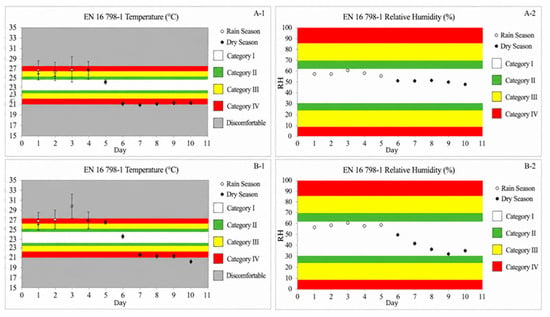
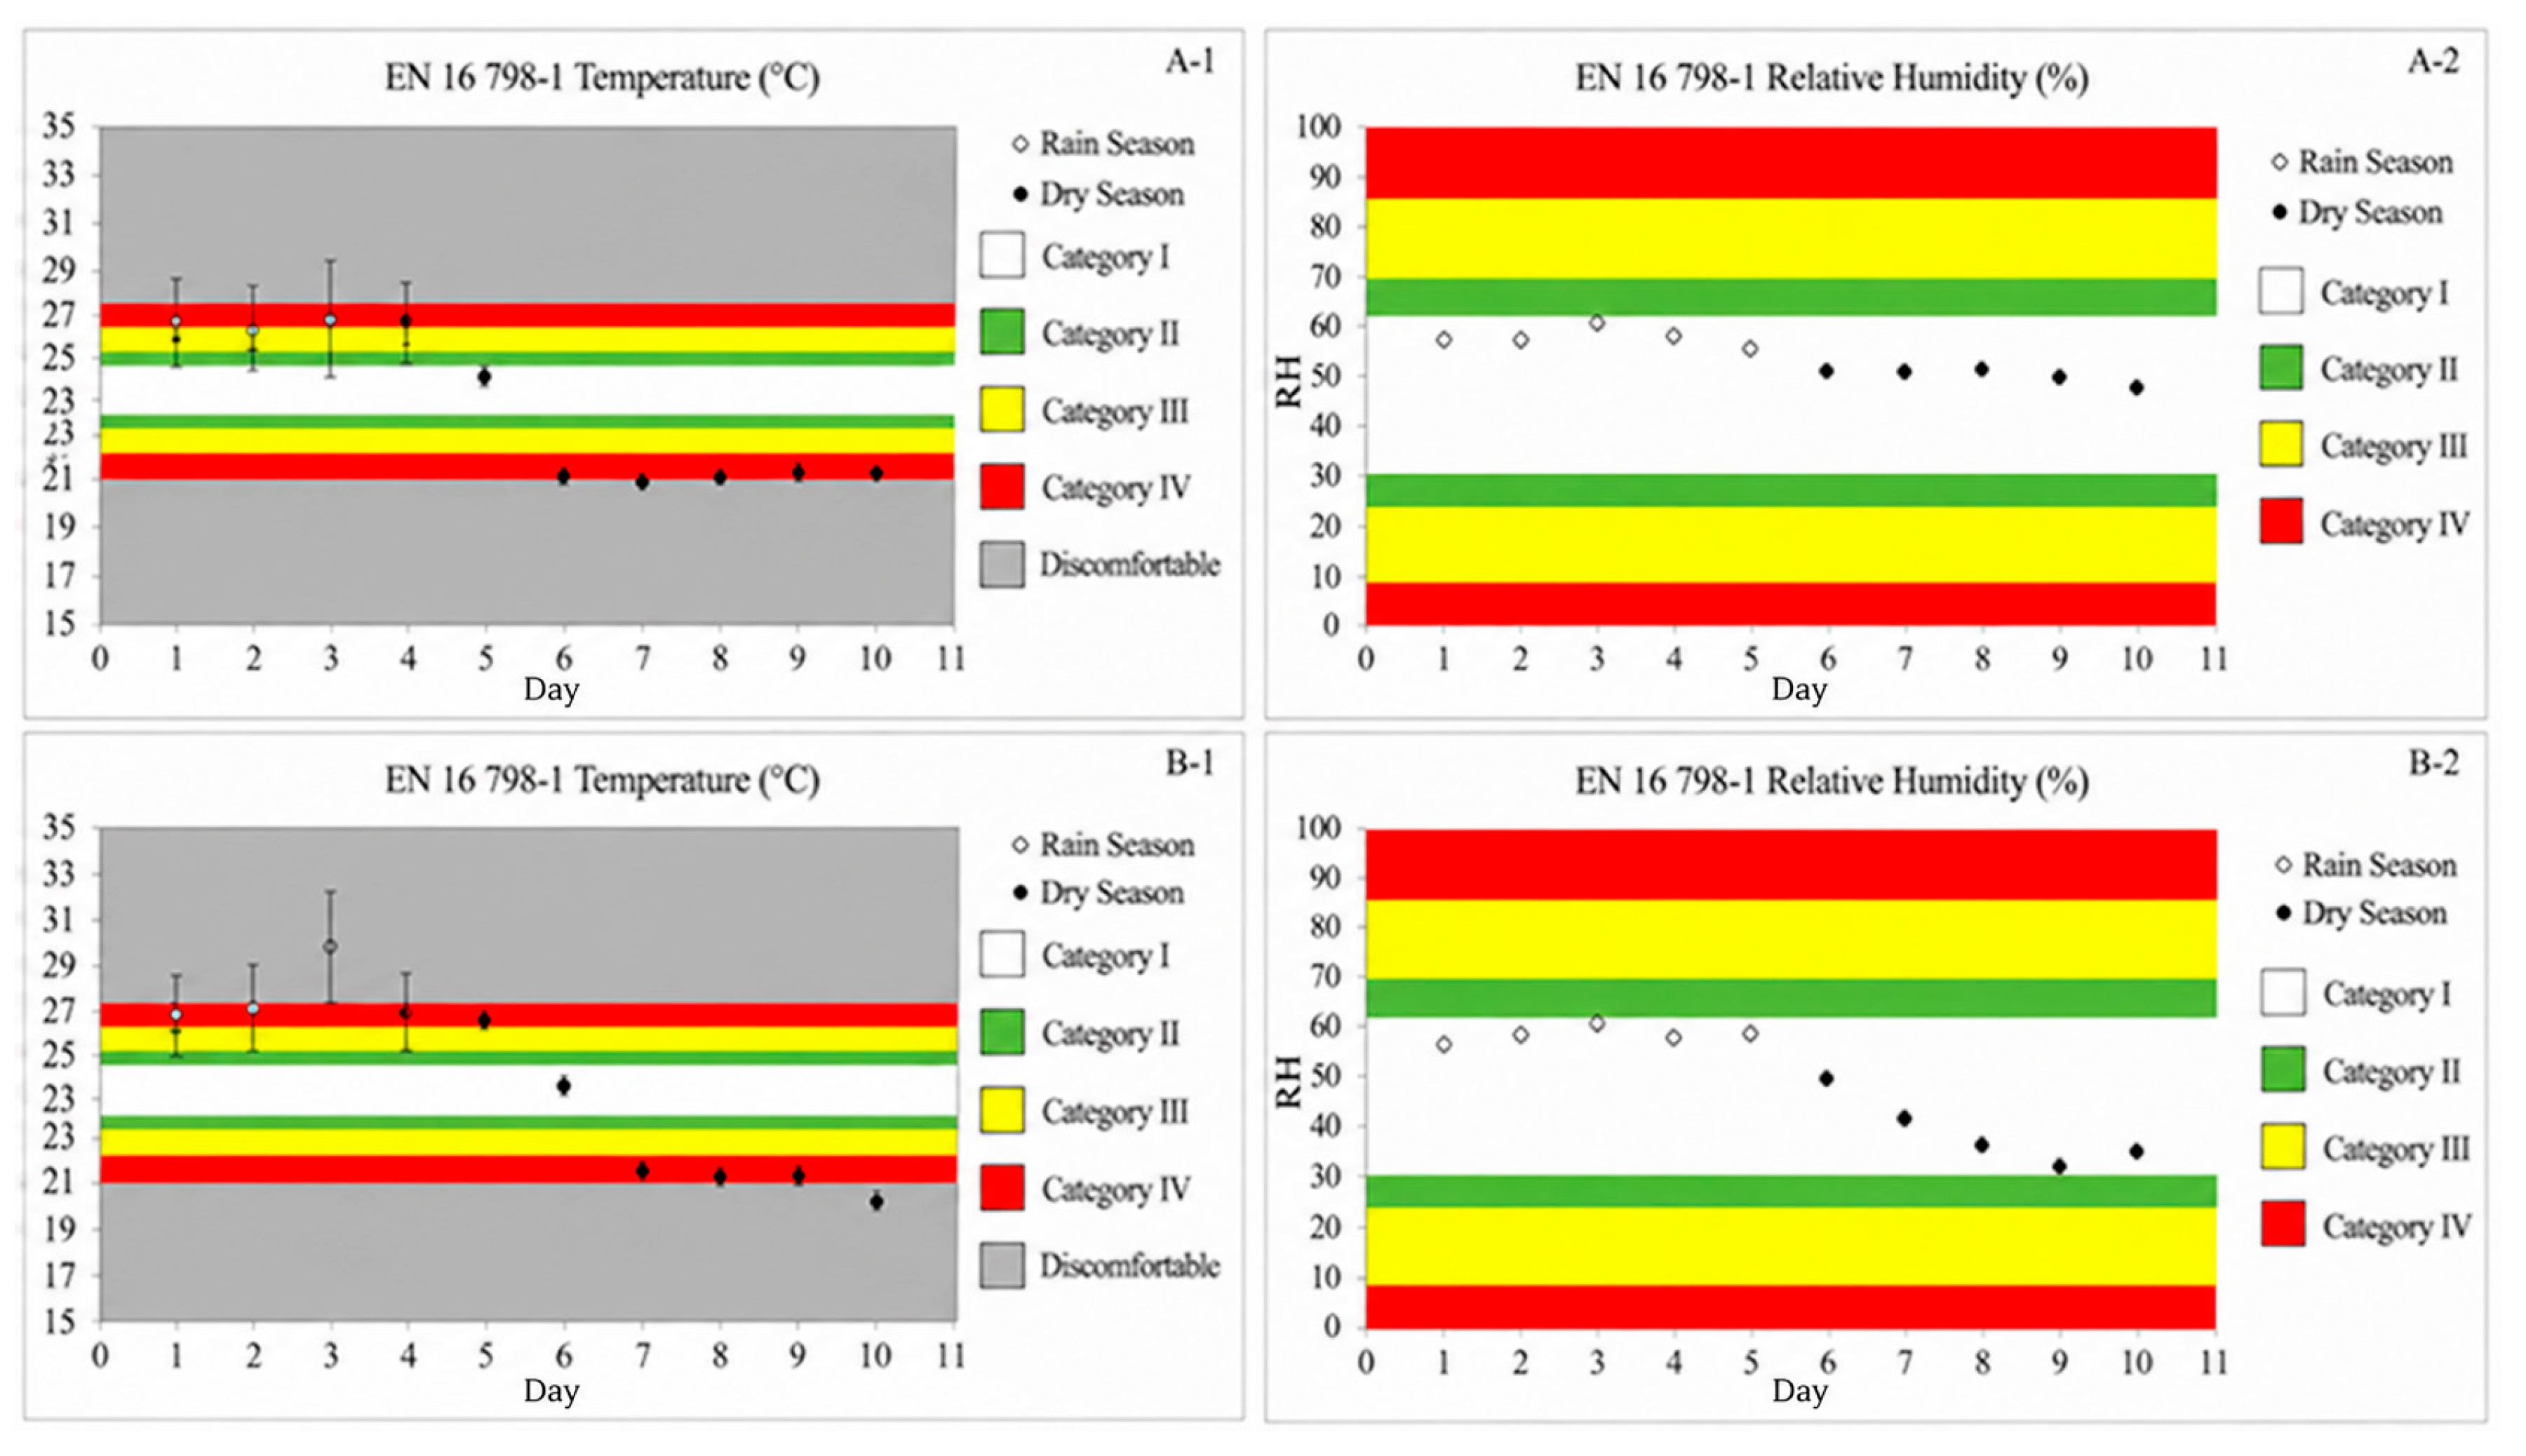
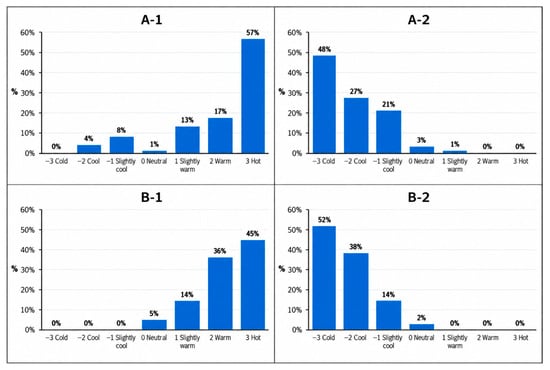
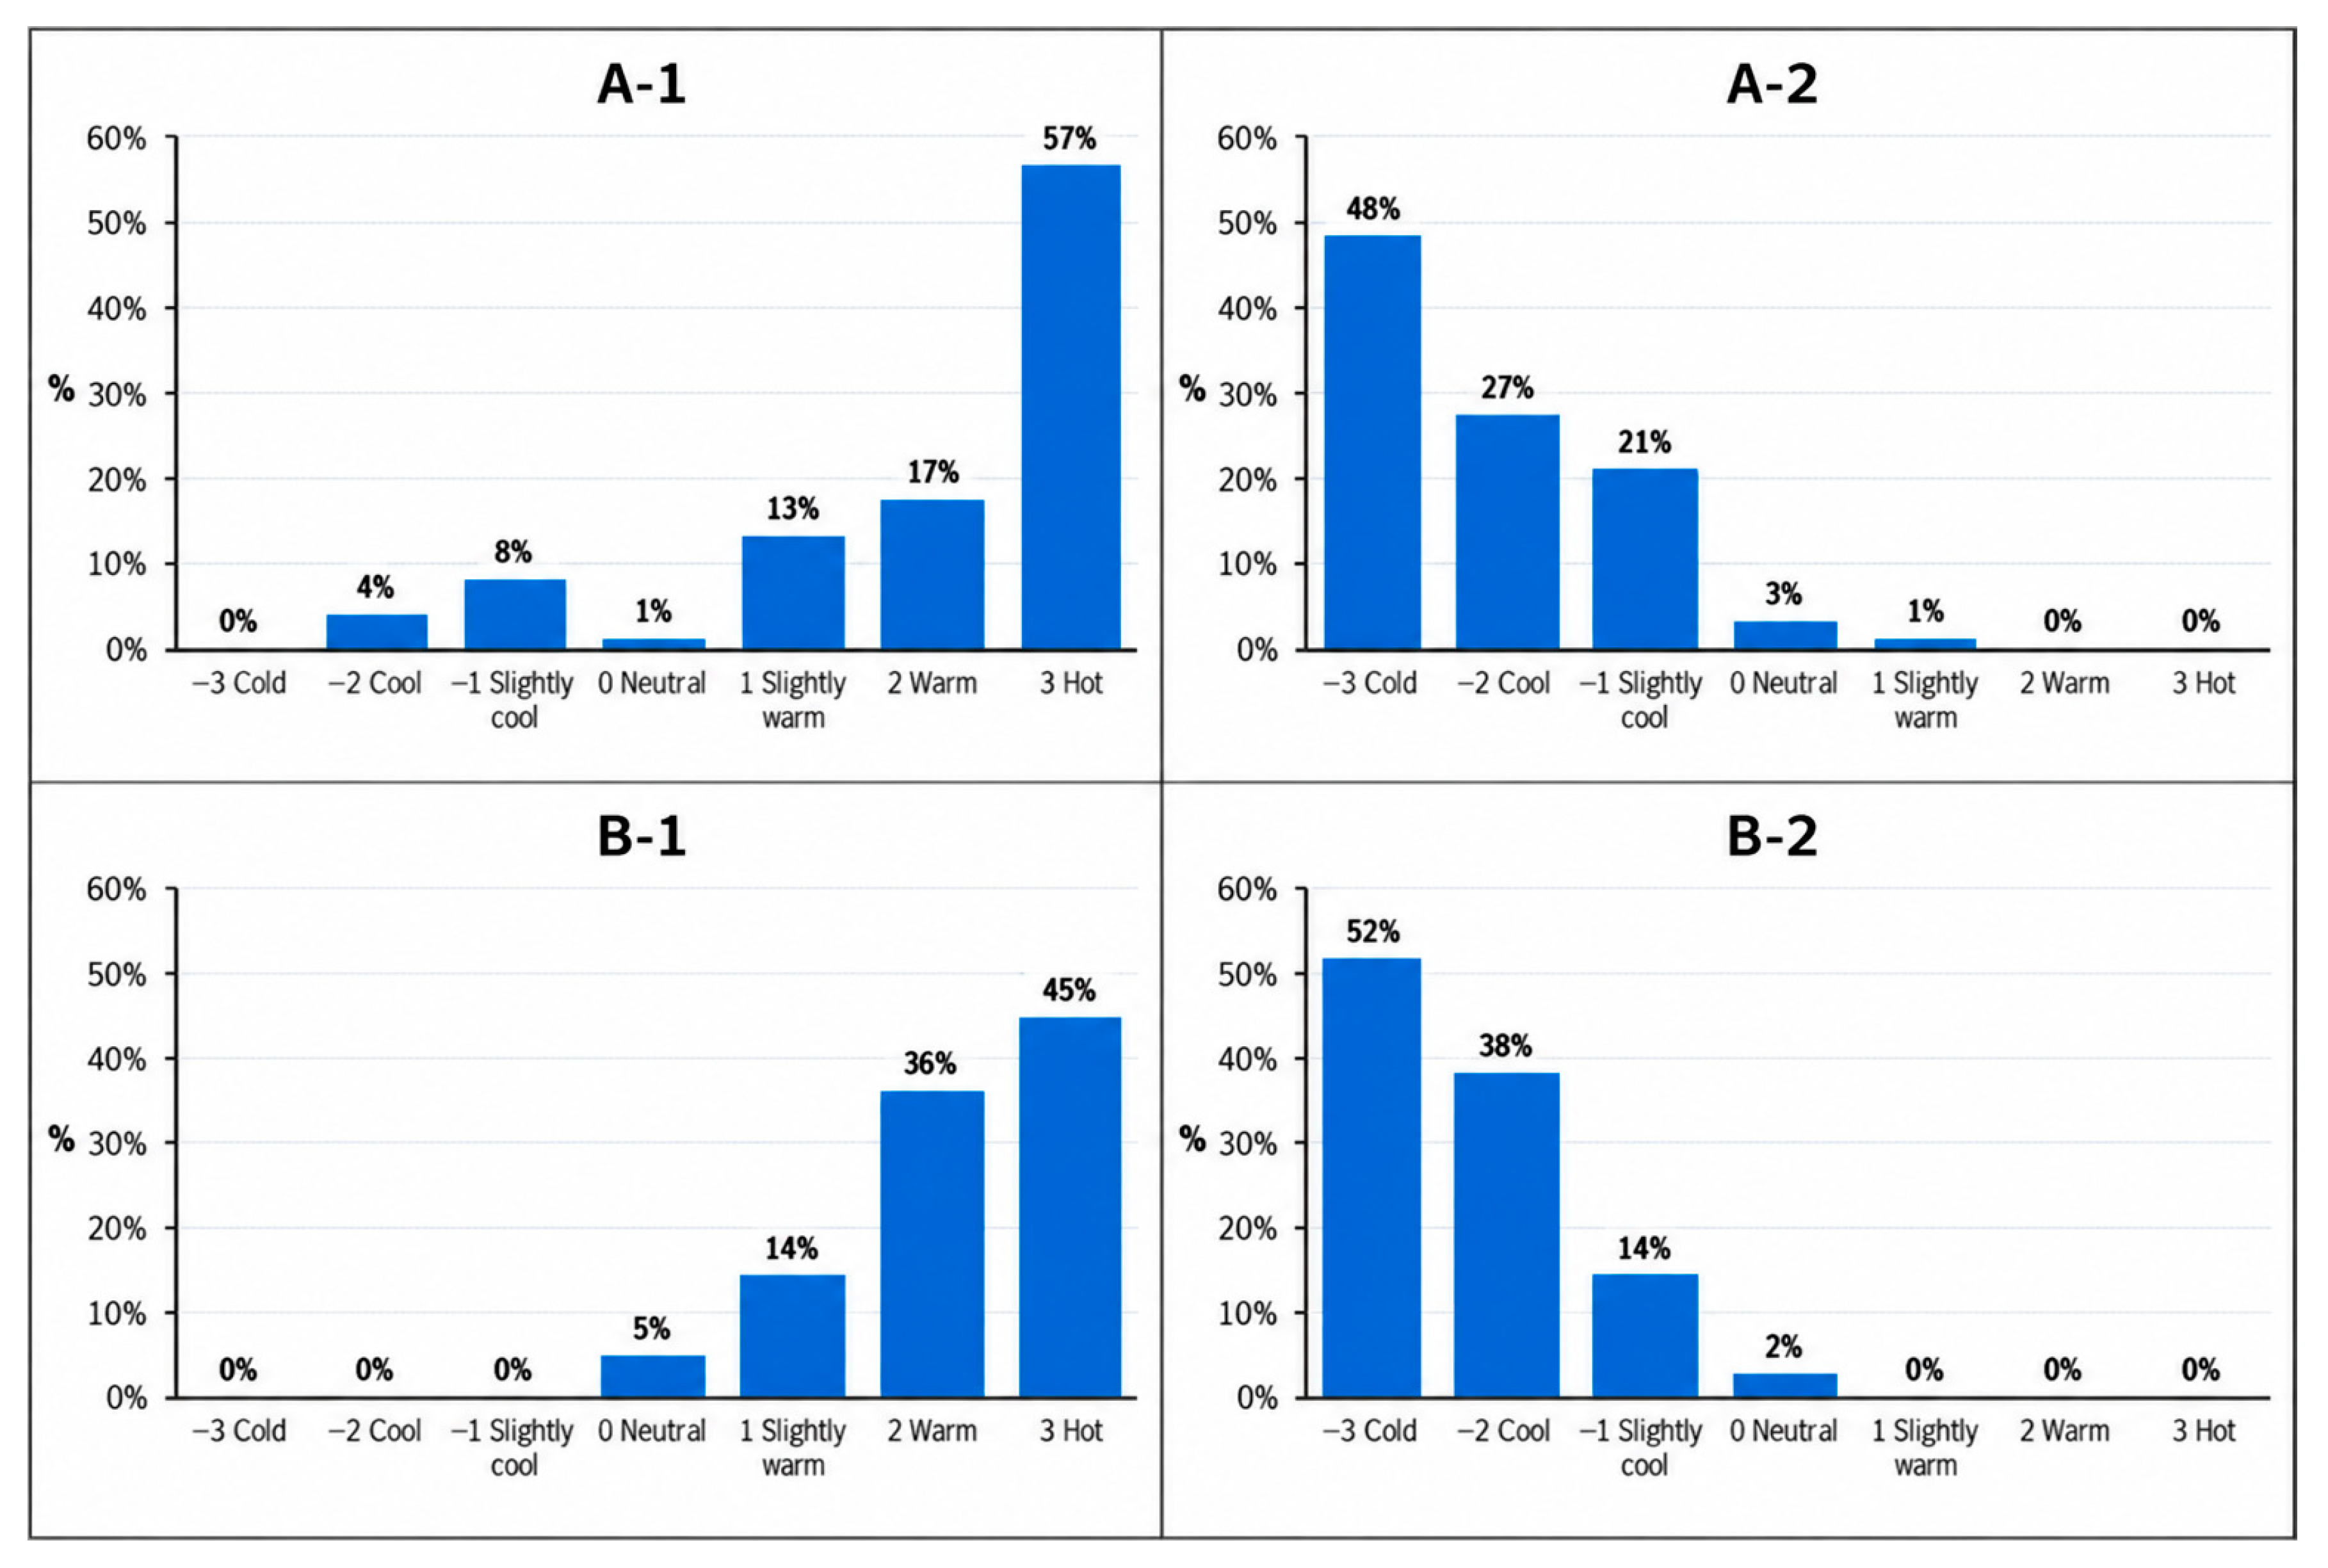
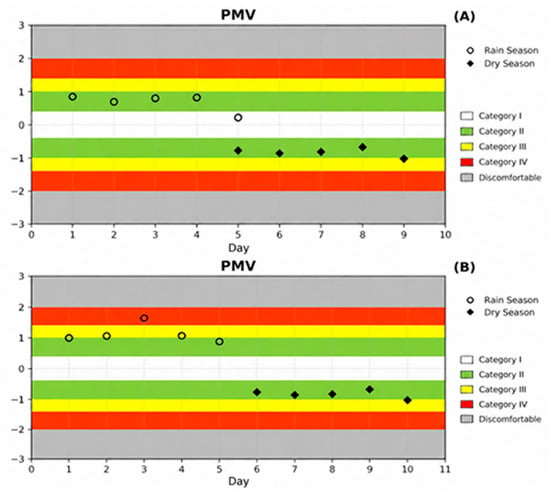
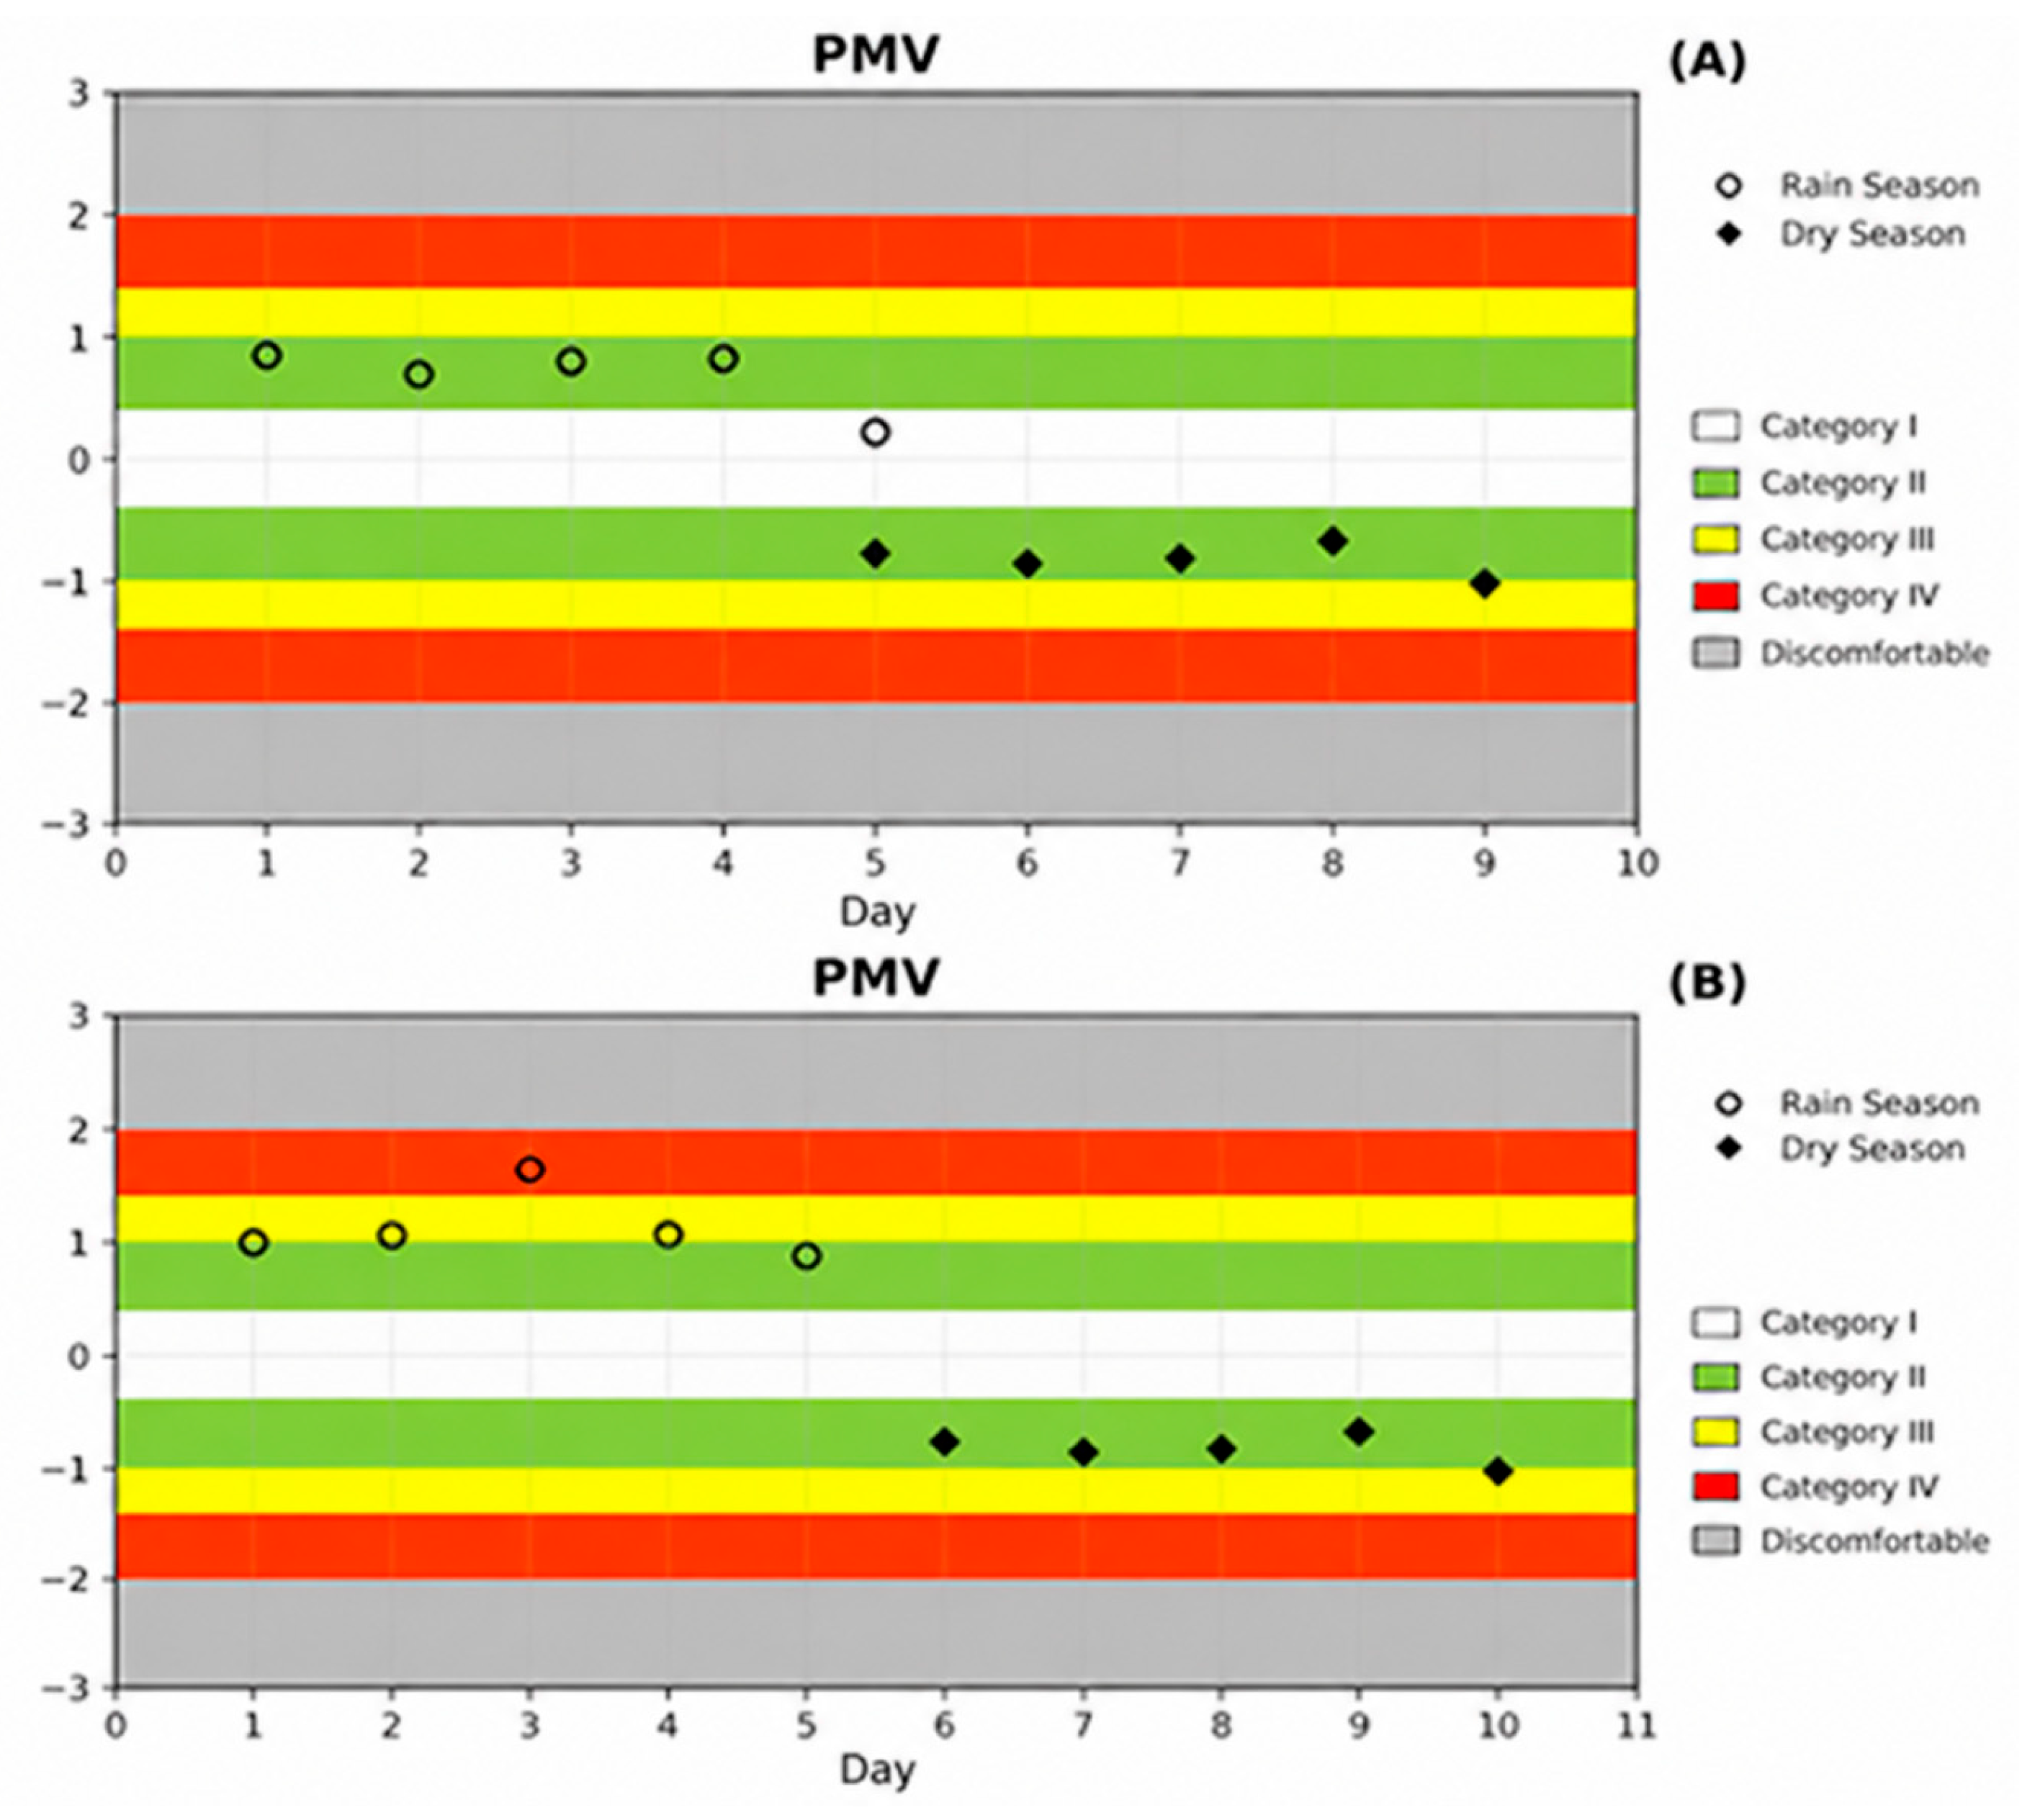
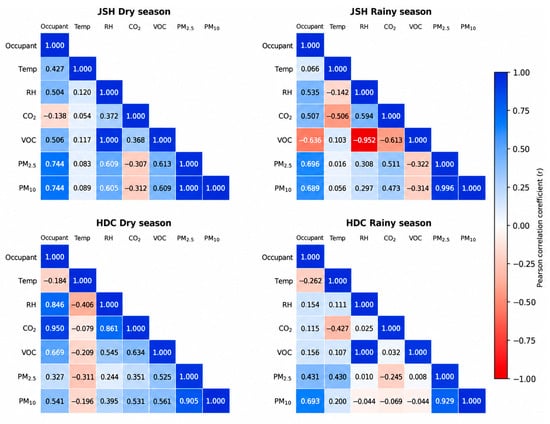
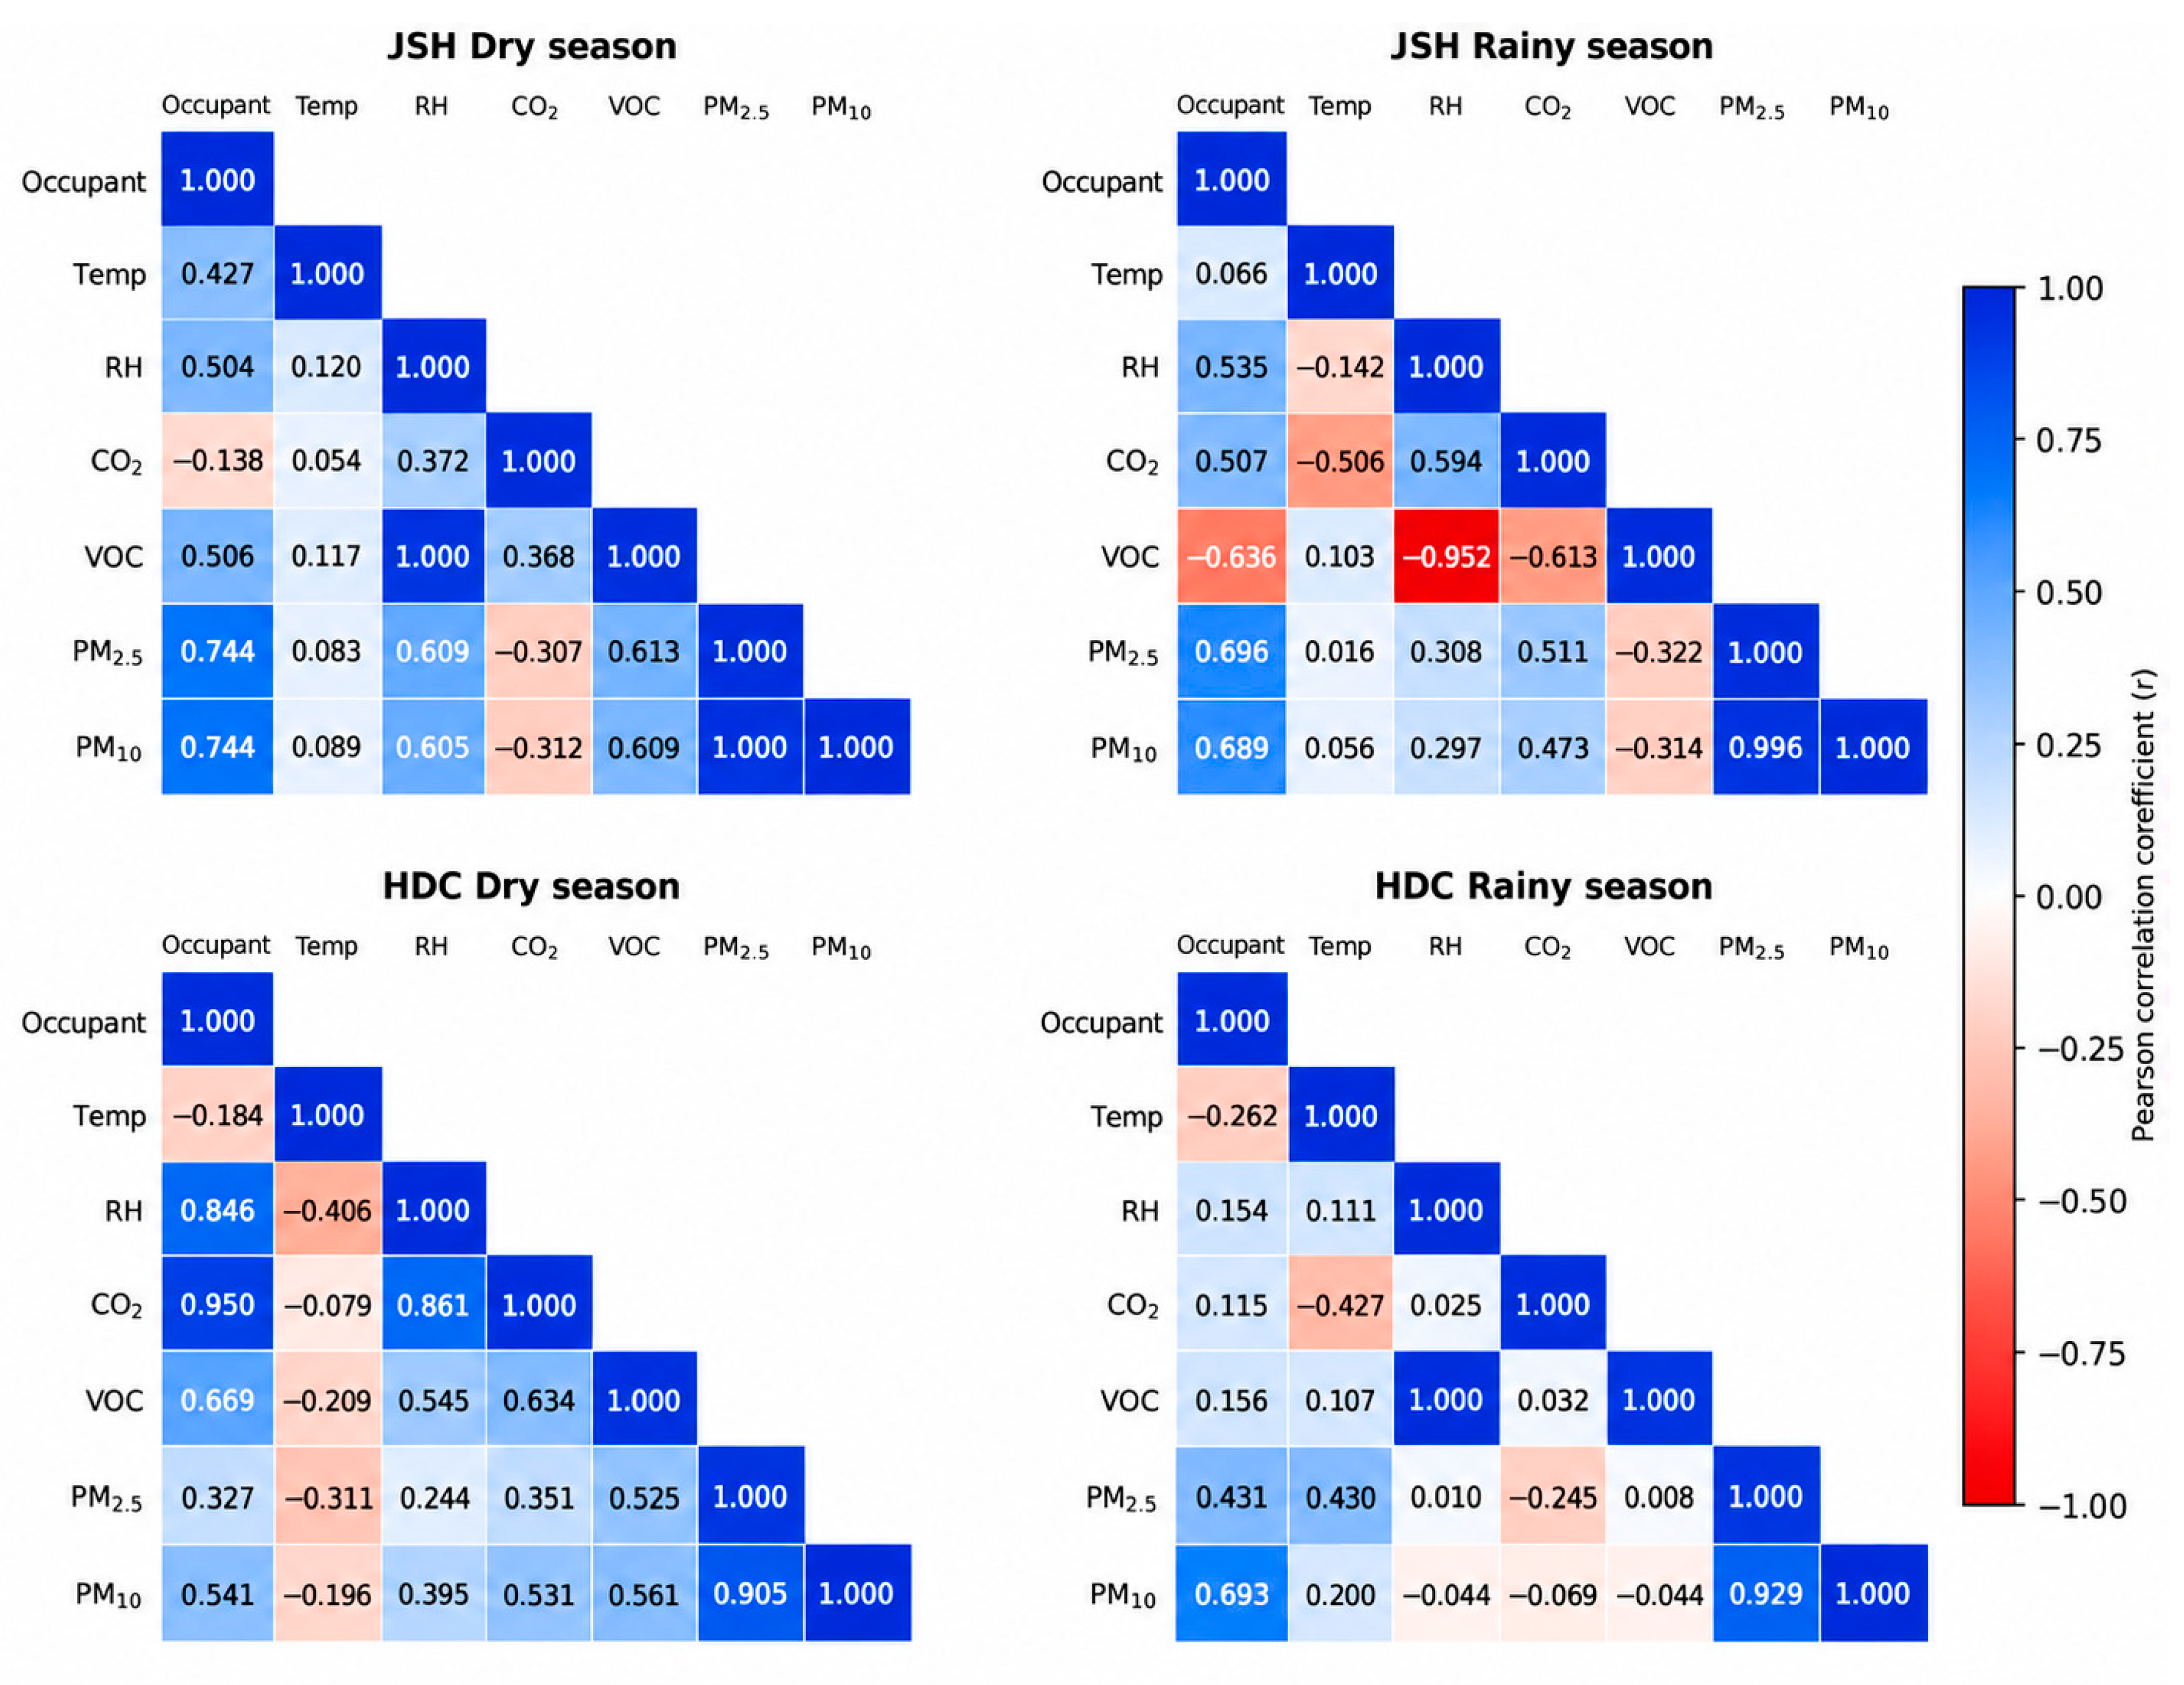

Disclaimer/Publisher’s Note: The statements, opinions and data contained in all publications are solely those of the individual author(s) and contributor(s) and not of MDPI and/or the editor(s). MDPI and/or the editor(s) disclaim responsibility for any injury to people or property resulting from any ideas, methods, instructions or products referred to in the content. |
© 2026 by the authors. Licensee MDPI, Basel, Switzerland. This article is an open access article distributed under the terms and conditions of the Creative Commons Attribution (CC BY) license.