


Simple Summary
A previously published Adaptability Selection Index (ISA) combined physiological measurements to rank breeding cows exposed to wetland conditions, but binary reference-range rules could produce abrupt score changes near clinical limits. We developed ISA2 as a continuous extension of that framework. Eighty cows from five cattle populations were measured in four seasons. Machine-learning models supplied biomarker weights for two profiles, one weighted toward live weight and one toward body condition. We then compared three ways of integrating those profiles: a weighted linear score, a weighted distance to a joint favourable profile, and a principal-component score. The three ISA2 alternatives ranked most cows similarly, whereas all three differed substantially from the antecedent ISA because several parts of the analytical pipeline were corrected simultaneously. ISA2 should therefore be viewed as a substantive methodological revision rather than a rescaled antecedent index. It remains a phenotypic within-cohort ranking tool, not a genetic breeding-value index. Independent herds and prospective fertility, calf, health and economic outcomes are needed before operational selection use.
Abstract
The Adaptability Selection Index (ISA) previously proposed for breeding cows in Paraguayan wetlands provided a framework for integrating physiological biomarkers, but its binary reference-range factor and elements of its predictive workflow limited continuity and out-of-sample interpretation. We developed ISA2 as a corrected continuous extension and compared three integration strategies: ISA2-A, a weighted linear combination; ISA2-B, the complement of weighted distance to a joint ideal; and ISA2-C, a principal-component formulation. The study used 320 seasonal records from 80 cows of five cattle populations, namely Criollo Ñeembucú, Criollo Pilcomayo, Brangus, Nelore and Brahman, with 16 cows each. All analyses were carried out in R 4.6.0 with H2O 3.44.0.3 and a fixed random seed. Live weight and body condition score were modelled separately using an animal-level training-test split and cross-validation grouped by animal. Gradient boosting was retained on cross-validation error. Biomarker weights were estimated by cross-fitted permutation importance exclusively within the training animals, leaving the testing subset untouched until final performance assessment. The corrected rerun retained the reported biomarker weights and rankings. Cross-validated R2 values were 0.361 for live weight and 0.303 for body condition, decreasing to 0.265 and 0.123 on cows withheld in their entirety, the decline reflecting the removal of all within-cow dependence from the held-out estimate rather than model failure. The two biomarker profiles correlated moderately (r = 0.555) but had low upper-quintile overlap (Jaccard = 0.231). ISA2-A and ISA2-C were highly concordant with ISA2-B (Spearman = 0.997 and 0.996; upper-quintile Jaccard = 0.882 for both). PC1 explained 77.7% of standardized two-profile variation and, because PCA involved only two standardized positively correlated profiles, its equal loadings represent a symmetric unsupervised integration rather than learned differential weights. Relative to the archived antecedent ISA, Spearman correlations ranged from −0.319 to −0.335 and only one of 16 upper-quintile cows overlapped (Jaccard = 0.032). ISA2-B averaged 57.52 ± 10.50; upper-quintile retention was 0.868 under 5% simulated biomarker noise and 0.691 at 20%. ISA2 provides a transparent phenotypic ranking architecture, but external validation against reproductive, productive, health and economic outcomes is required before operational use. Throughout this article ISA2 denotes a phenotypic, within-cohort ranking tool; it is not a genetic breeding-value index and confers no information on transmissible merit.
1. Introduction
Cattle raised in the Ñeembucú wetlands and surrounding areas of Paraguay experience humid heat, seasonal flooding, parasite exposure and variation in forage supply. Earlier studies from this research line documented seasonal variation in metabolic and adaptive traits and used machine learning to rank physiological variables associated with live weight and body condition [1,2,3,4]. Those analyses motivated an Adaptability Selection Index (ISA) that condensed heterogeneous physiological measurements into an animal ranking [4].
The magnitude of that seasonal variation is substantial in the present cohort. Live weight fell from a mean of 341.4 kg in summer to 274.8 kg in winter, a range of 66.6 kg equal to 24.2% of the lower mean, while body condition moved from 3.91 to 3.08 over the same seasons. Season accounted for 19.3% of the variance in live weight and 21.8% in body condition, both with p < 10−14. Among the biomarkers the effect ranged from hair length, for which season accounted for 51.7% of the variance, and creatinine, 28.1%, to cortisol and hemoglobin, for which it accounted for 1.0% and 0.3% and was not significant. This is why the seasonal record is treated as the unit of measurement and the cow-level score is the mean of four seasonal scores.
The biological premise remains relevant. Heat load affects endocrine regulation, energy partitioning, blood metabolites, immune function and thermoregulation, while feed and parasite conditions can modify body reserves [5]. Resilience is therefore not equivalent to maximizing one trait at one time [6]. Body condition score (BCS) summarizes energy reserves but is ordinal and observer-dependent [7], and live weight alone does not represent the multivariate physiological state. An integrated profile can complement these conventional measurements. The two traits are related without being interchangeable: body condition indexes energy reserves relative to frame, whereas live weight confounds reserves with skeletal size, gut fill and pregnancy status. In the present cohort they correlate at r = 0.651 at animal level (95% CI 0.503 to 0.762, p = 6.4 × 10⁻¹¹), so roughly 42% of the variation in one is shared with the other and 58% is not. At the level of the seasonal record the correlation is lower, r = 0.573, and it varies by season from 0.306 in summer to 0.665 in autumn. This degree of partial overlap is the empirical basis for modelling the two traits separately and combining them afterwards.
The term selection index requires qualification. In quantitative genetics, a classical selection index combines traits with economic weights and genetic variances and covariances to predict aggregate breeding merit [8]. The present data contain no heritabilities, genetic covariances, genomic or pedigree information, estimated breeding values or economic weights. ISA and ISA2 are retained as names from this research line, but the method evaluated here is a phenotypic ranking index and does not estimate transmissible merit.
Reanalysis of the antecedent ISA identified features that could change ranking. A binary multiplication factor assigned one inside a clinical reference interval and zero outside, creating an abrupt cliff at each limit. The earlier quadratic integration was measured from the origin and interpreted as favouring balance, although an origin-based norm can favour an extreme equal-sum profile. Record-level partitioning also allowed repeated observations from the same cow to be treated too independently, and impurity-based variable importance can be affected by predictor characteristics and correlation [9,10,11,12]. Permutation importance is more directly tied to predictive loss but remains model-specific and can also be distorted by correlated predictors [11,12,13].
ISA2 was designed to preserve the useful core of ISA while separating prediction, physiological interpretation and multicriteria aggregation. Biomarkers are mapped to continuous desirability based on declared reference information [14]. Two trait-weighted biomarker profiles are then combined in three alternative ways: ISA2-A, a weighted linear combination; ISA2-B, weighted distance to the joint ideal; and ISA2-C, a symmetric principal-component integration of the two standardized animal-level profiles [15,16]. The objectives were to construct these three corrected alternatives, compare their rankings and mathematical behaviour, compare them with the archived antecedent ISA, quantify measurement and parameter sensitivity, and define the validation needed before ISA2 can inform operational cow-selection decisions.
2. Materials and Methods
2.1. Study Population and Data Structure
This retrospective observational analysis used records from a single field campaign carried out between December 2016 and October 2017 in the Paraguayan wetlands, previously reported in [1,2,3,4]. No new procedures were performed on animals. Eighty breeding cows, four to five years old, were represented by five populations of 16 animals each: Criollo Ñeembucú, Criollo Pilcomayo, Brangus, Nelore and Brahman. Animals were associated with farms in Isla Umbú, Nueva Italia, San Miguel and Caapucú and were measured on four seasonal occasions, in summer (December 2016 to January 2017), autumn (April 2017), winter (July to August 2017) and spring (September to October 2017), giving 320 seasonal records. Eligibility at enrolment required a live weight of approximately 350 ± 40 kg, which corresponds to standard values for adult breeding cows in this region; that range is a selection criterion and not a statistic of the analyzed records. Across the 320 seasonal records the observed mean live weight was 298.7 ± 58.0 kg, with a range of 170 to 443 kg, the lower value reflecting the marked seasonal decline described below. Cows were weighed individually on mechanical lever scales of the type in general use in Paraguayan cattle operations (Longhino, Paraguay, or Filizzola, Brazil; 3000 kg capacity), zeroed before each weighing session and again after every 50 animals to compensate for moisture and soiling of the timber crate. Population summaries are descriptive because n = 16 per group is insufficient for strong inference about population or genetic merit. All 320 seasonal records analyzed here originate from that one campaign. The four works cited above report on that same dataset and not on separate collections: they differ in the variables they analyze and in the questions they address, not in the animals studied or in the occasions on which those animals were measured. Selection was purposive. Cows were drawn from the functional breeding herds already maintained by the participating producers, and uniform eligibility criteria were then applied within each genotype: adult cows of four to five years, demonstrated prolificacy, functional dentition, no evident locomotor disorder and no clinical signs or apparent metabolic disturbance. Sixteen cows meeting these conditions were retained per genotype. The intention was to form groups as contemporary and homogeneous as the production setting allows, not to obtain a random sample of the regional population, and population-level inference is correspondingly limited.
Measurements included live weight, BCS on a five-point half-step scale, morphophysiological variables, hair traits, regional tick counts, hematological measurements, biochemical and enzymatic variables, cortisol and endoparasite information. Laboratory measurements followed the source studies [2,3,4]. Relevant reporting elements were organized with reference to ARRIVE 2.0 [17]. The body condition scale runs from 1 to 5 in half-point increments, 1 denoting an emaciated cow with no palpable fat cover over the ribs and transverse processes and 5 an obese cow in which skeletal landmarks cannot be palpated. Eight of the nine possible levels were observed, from 1.5 to 5.0, with mean 3.60 and standard deviation 0.73. The distribution is left-skewed: the mode at 4.0 accounts for 28.8% of records, whereas a single record was scored 1.5 and seven were scored 2.0. The limited resolution of a trait with eight ordered levels, one of which carries nearly three tenths of the observations, is part of the reason for its lower held-out predictability. Body condition was scored by consensus among four assessors: the first author, two veterinarians with 10 to 15 years of experience in bovine anatomy and morphology, and the producer responsible for each ranch. A consensus score removes the dispersion of a single observer but does not quantify inter-observer error, which these data cannot estimate because no independent duplicate scores were recorded.
2.2. Antecedent ISA and Revised Analytical Principles
The antecedent ISA is the conceptual benchmark [4]. Its biomarker contributions included model-derived weights and, for biomarkers with clinical intervals, a binary factor FM. ISA2 retains multivariate physiological information and trait-related weighting but changes four elements: animal-level separation of model development and assessment, training-only cross-fitted permutation importance, continuous desirability instead of binary FM, and explicit comparison of three profile-integration rules.
The archived antecedent score paired to the same 80 animal identifiers was taken from the supplied Cambridge-comparison output. Because several computational elements changed simultaneously, ISA-versus-ISA2 disagreement is interpreted as the effect of the revised architecture as a whole rather than the causal effect of one correction.
2.3. Data Integrity, Repeated Measures and Preprocessing
Variables and units were harmonized and screened for biological plausibility without removing observations merely because they were statistically extreme. The source workbook contained 320 seasonal records from 80 cows and 38 named variables. None of the 13 unique biomarkers entering the final ISA2 profiles contained missing values, and score construction therefore used all 320 records. The record was one cow in one season, whereas the animal was the inferential and ranking unit. Intraclass correlations from intercept-only mixed models were 0.39 for live weight and 0.23 for BCS, confirming non-negligible within-cow dependence.
Live weight and BCS were modelled separately. After excluding identifiers and grouping variables, both response traits, and deterministic or directly derived redundancies, the candidate modelling set comprised 29 predictors. The corrected animal-level split assigned 45 cows (180 seasonal records; nine cows per cattle population) to training and 35 cows (140 records; seven cows per population) to testing. All four records from a cow were assigned to the same subset. Cross-validation folds within the 45 training cows were likewise grouped by animal. Sparse missing regional tick-count predictors were handled within the corrected model-fitting workflow and did not remove whole cows from the split. Min–max scaling parameters were estimated only from training animals and applied unchanged to testing animals. The two counts should be read together. The 45 training and 35 testing cows contribute 180 and 140 seasonal records respectively, but ten of those records, four in training and six in testing, carry at least one missing regional tick count and are therefore incomplete for the 29 candidate predictors. Model fitting and evaluation accordingly used 176 and 134 records. Score construction used all 320, because none of the 13 biomarkers retained in the two profiles has missing values. A balanced 40/40 split was considered and rejected. With 45 training cows the five populations contribute exactly nine each, and those 45 divide into five animal-grouped folds of nine cows with the populations evenly spread; 40 cows do not divide into five folds of equal size while preserving balanced representation. The split therefore favours a clean grouped cross-validation structure, which supplies both the selection criterion and the weights, over symmetry between the subsets. The cost is a smaller testing set, which makes the final estimates less precise but not optimistic.
2.4. Predictive Models and Model Selection
Models were fitted in R version 4.6.0 [18] using H2O version 3.44.0.3 with random seed 123. Gradient boosting machine (GBM), random forest (RF), elastic-net generalized linear model [19] and a feedforward neural network were compared with a training-mean benchmark and a linear mixed model with cow as a random effect. The retained algorithm and hyperparameters were selected from grouped cross-validation error within the training animals. The testing cows were not used for algorithm selection, hyperparameter optimization, biomarker selection, permutation-importance estimation or estimation of the scaled importance (SI) weights. The testing subset was accessed only after the complete predictive and weighting pipeline had been frozen, and then used once for final RMSE, MAE, R2 and MAPE.
To quantify uncertainty in algorithm ordering, grouped folds were regenerated 50 times and GBM and RF were refitted on the same folds. Paired distributions of their performance differences were summarized with percentile intervals. The retention rule was fixed before the testing cows were examined: the algorithm with the lowest grouped cross-validation error within the training animals was carried forward. This is a prespecified decision procedure and not a claim that the retained algorithm is superior; revising it after inspecting the paired comparison would have made the selection contingent on the very result it was intended to arbitrate. Fifty regenerations were used because the purpose of this analysis is to establish whether the paired interval excludes zero, not to estimate the difference precisely. The width of that interval is governed by the 45 training cows rather than by the number of regenerations, so increasing the latter would narrow only the Monte Carlo component of the uncertainty and would not alter the conclusion.
2.5. Permutation Importance and Biomarker Selection
Biomarker importance was estimated exclusively within the training animals by grouped cross-fitting. For each cross-validation fold, the selected algorithm was fitted to the remaining training cows and permutation importance was evaluated on the corresponding out-of-fold validation cows; thus, no record from an animal used to fit a fold-specific model contributed simultaneously to estimation of its permutation importance. For predictor j, importance was defined as the increase in RMSE after permuting that predictor while leaving the other predictors unchanged, and fold-specific values were aggregated across out-of-fold predictions. Within each response, the aggregated importance values were normalized relative to the largest value to obtain SI, with the leading biomarker assigned SI = 1.00. The 10 highest-ranked biomarkers were retained per profile. Seven occurred in both profiles and three were unique to each, giving 13 unique biomarkers. Importance stability was evaluated by repeated resampling of the training animals only, with model fitting and cross-fitted permutation importance repeated without access to the testing cows. Importance is a model-specific predictive attribution, not a causal effect or favourable direction [11,12,13], and correlation among predictors can still redistribute or obscure importance.
2.6. Continuous Biomarker Desirability
For biomarkers with a clinical interval , desirability was defined independently of the prediction model. Let , , and be cohort minima and maxima. Inside the interval,
with dedge = 0.80 and q = 2. The midpoint T = (lo + hi)/2 is an operational reference-interval target used to define a symmetric target-is-best desirability function; it is not assumed to be a biologically proven optimum for adaptation, reproduction or productivity. Outside the interval, desirability decreases linearly from dedge at the corresponding limit to zero at the observed cohort extreme. Full branch equations are given in Supplementary Methods S1. Hair length and number of endoparasite types use monotone decreasing desirability. This mapping removes the 1-to-0 discontinuity of the antecedent FM without claiming that a single reference interval or its midpoint is universally optimal or transferable.
2.7. Two Corrected Biomarker Profiles
For record and a component-specific set of biomarkers,
Each raw profile was transformed once to a 0–100 scale,
where and are the cohort minimum and maximum. The resulting profiles are , weighted by the live-weight model, and , weighted by the BCS model. The response traits themselves do not enter these profiles. The 0–100 range was adopted for three reasons: it gives both components a common span, without which the weighted distance would be dominated by whichever component had the wider raw spread; it makes the ideal profile the interpretable point (100, 100); and it preserves continuity with the antecedent ISA, which was reported on the same scale. The transformation is affine and increasing, so it leaves every rank unchanged and all rank-based statistics reported here would be identical under any other monotone rescaling. Its cost is the cohort dependency addressed in Section 4.6.
For ISA2-A and ISA2-B, relative component coefficients were derived from grouped cross-validated performance,
These are predictability weights, not genetic, economic or welfare weights.
2.8. Three ISA2 Integration Alternatives
ISA2-A, weighted linear integration:
This formulation is monotone and explicitly compensatory.
ISA2-B, weighted distance to the joint ideal:
This formulation preserves quadratic integration but measures distance from , so a poor value on either profile contributes directly to distance from the joint ideal. Because the component weights are unequal, balance behaviour was evaluated numerically under the actual weights rather than asserted from a symmetric theorem [15].
Animal-level ISA2-A and ISA2-B were the means of the four seasonal record-level scores. The order of operations is relevant for ISA2-B because the function is nonlinear.
ISA2-C, principal-component integration: PCA was fitted to the 80 animal-level pairs of mean BP-LW and BP-BCS after standardization [16]. PC1 was oriented so that larger values corresponded to larger favourable profiles, then rescaled linearly to 0–100 for reporting. With only two standardized variables, the correlation matrix has unit diagonal elements; when their correlation is positive, PC1 necessarily has equal-magnitude favourable-direction loadings. ISA2-C is therefore interpreted here as a symmetric unsupervised integration benchmark, not as a procedure that learns unequal weights for BP-LW and BP-BCS. The proportion of variance represented by PC1 still depends on the correlation between the two profiles. The 0–100 display rescaling does not change ranks and is not metrically equivalent to the ISA2-B distance. The conventional factor-analytic adequacy diagnostics are structurally uninformative for a two-variable decomposition and are reported here for completeness rather than as evidence. With two variables the Kaiser-Meyer-Olkin index is exactly 0.5000 whatever the correlation, because the single partial correlation coincides with the simple correlation; Bartlett’s test has one degree of freedom and tests only that the correlation differs from zero (χ2 = 28.507, p = 9.3 × 10⁻⁸); communalities are 0.5000 for both variables by symmetry; and rotation is not applicable when a single component is retained. The only quantity that varies with the data is the proportion of variance represented by PC1, which equals (1 + r)/2 and is therefore a restatement of the correlation.
2.9. Comparison Among ISA2 Alternatives and with ISA
ISA2-A, ISA2-B and ISA2-C were compared with Pearson, Spearman and Kendall coefficients and Jaccard similarity of upper-20% sets. Their aggregation principles were also compared qualitatively: compensatory linear integration, explicit joint-ideal distance, or symmetric variance-based integration of two standardized profiles.
The archived antecedent ISA was paired by animal identifier with all three ISA2 variants. Spearman and Kendall rank association and upper-quintile Jaccard overlap were calculated. The comparison describes architectural reordering and does not establish biological superiority without an independent outcome.
2.10. Ranking Stability and Sensitivity
Uncertainty relevant to the fixed set of 80 ranked cows was characterized by perturbation and sensitivity analyses in which every cow remained an evaluation target. Measurement sensitivity was assessed by Gaussian perturbation of the continuous biomarkers, while robustness to the component weight and desirability parameters was examined over prespecified ranges. Agreement among ISA2-A, ISA2-B and ISA2-C provided an additional assessment of dependence on aggregation philosophy.
Measurement sensitivity was evaluated by adding Gaussian noise to continuous biomarkers,
with . The entire score was recomputed in 200 replicates per level and upper-quintile retention was summarized by Jaccard similarity. Sensitivity to was examined from 0.30 to 0.70; desirability sensitivity used to 0.90 and to 3.
2.11. Invariance of the Score to the Body-Condition Scale Convention, and the Binary Cliff
The observed BCS values map from the five-point half-step convention to a nine-point integer labelling through No rescaling was applied to the data at any point: every analysis reported here uses the five-point half-step scale on which body condition was recorded. The purpose of this section is the opposite of a conversion. Because nine-point integer scales are in common use in beef-cattle practice, a reader may reasonably ask whether the ranking would differ had the data been recorded that way, and the answer follows analytically rather than from simulation.
This strictly increasing affine bijection rescales predictions and RMSE increments by the same constant, leaving normalized importance, min–max component anchoring and final rankings unchanged. It does not address inter-observer disagreement.
To quantify the cliff corrected by desirability, 21 biomarkers with clinical intervals were evaluated under the antecedent binary rule. A border band was defined as within 5% of interval width around either limit. Counts inside, outside and near limits and mean were calculated.
2.12. Statistical Analysis and Software
All data processing, statistical analyses, machine-learning workflows, grouped cross-validation, cross-fitted permutation-importance estimation, sensitivity analyses and graphical outputs were performed in R version 4.6.0 [18]. Machine-learning models were fitted with H2O version 3.44.0.3. Custom R scripts implemented animal-level partitioning, continuous desirability transformations, ISA and ISA2 calculations, Monte Carlo biomarker perturbation and comparisons among the three ISA2 formulations. Random seeds were fixed where applicable to support computational reproducibility.
3. Results
3.1. Biomarker Weights
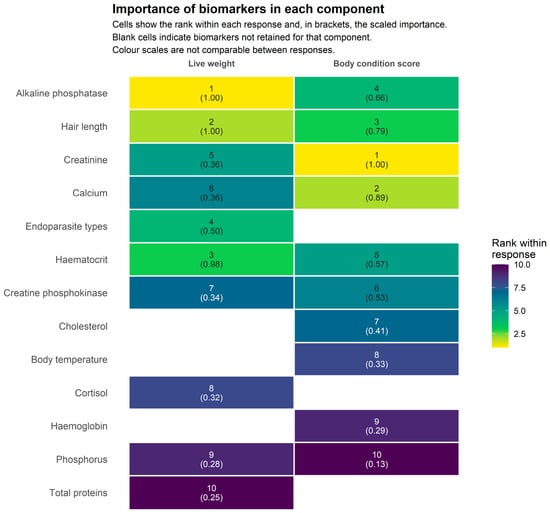
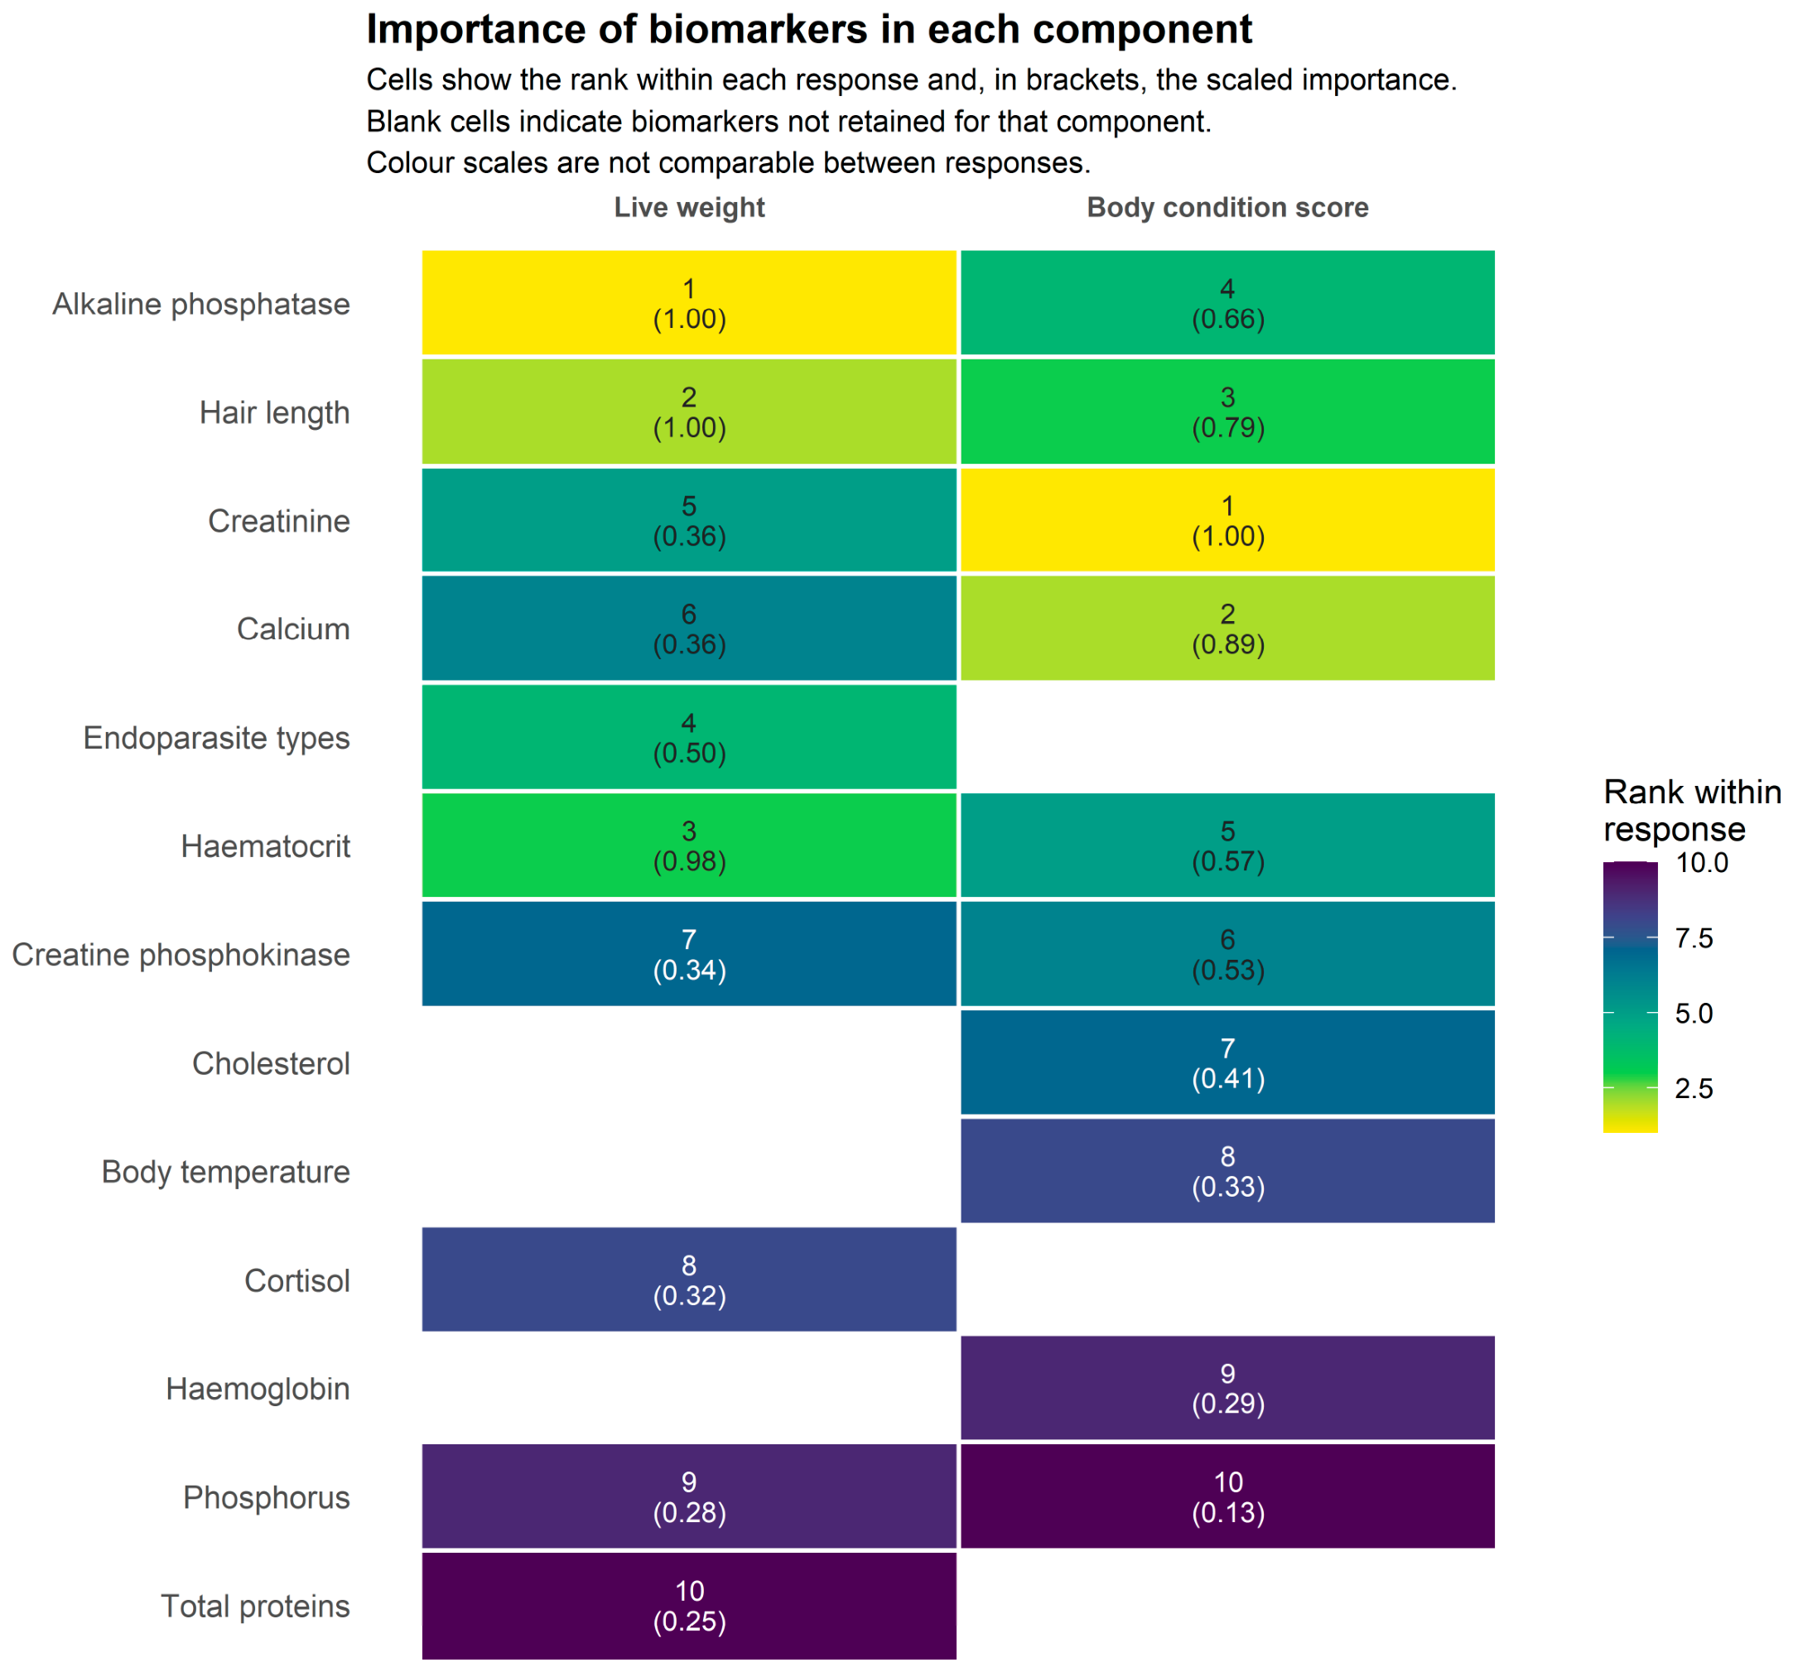
The training-only cross-fitted permutation-importance rerun retained the same 10 biomarkers in each corrected profile, with seven shared (Table 1; Figure 1). Alkaline phosphatase, hair length and hematocrit led the live-weight profile, while creatinine, calcium and hair length led the BCS profile. The same biomarker could carry different weights because importance was estimated separately for each response. The overlap indicates shared predictive information, not evidence of a common causal pathway.
Table 1.
Biomarkers retained in the two corrected profiles. SI is scaled training-only cross-fitted permutation importance within each response.
Figure 1.
Permutation-importance structure of biomarkers retained in each component. Cells show within-response rank and scaled importance. Blank cells indicate biomarkers not retained for that component.
3.2. Predictive Performance
GBM had the lowest primary grouped cross-validation error for both responses and was retained (Table 2). Live-weight cross-validated was 0.361 and test was 0.265; BCS values were 0.303 and 0.123. The corresponding GBM generalization-gap ratios were 3.15 and 3.04, whereas RF gaps were 1.12 and 1.17. The gap therefore favours the random forest by a wide margin. A ratio above three indicates that the fitted gradient boosting model describes the training animals considerably better than it predicts unseen ones, and although the held-out coefficients are what the component weights are derived from, this contrast is a warning about how much of the fitted structure is specific to the training cows.
Table 2.
Predictive performance under animal-grouped validation.
Across 50 regenerated grouped folds, the paired GBM-RF difference was 0.038 for live weight (95% interval −0.025 to 0.092) and 0.020 for BCS (−0.037 to 0.073). Thus, GBM was retained because it minimized the primary cross-validation error, not because the sample established general algorithmic superiority. The held-out values are modest in absolute terms. A coefficient of 0.123 means that the body-condition model accounts for roughly one eighth of the between-animal variation among cows it has not seen, so the importance values derived from it, and the component weight formed from them, carry substantial uncertainty and should not be read as stable or broadly generalizable indicators of biological importance.
3.3. Component Dissociation
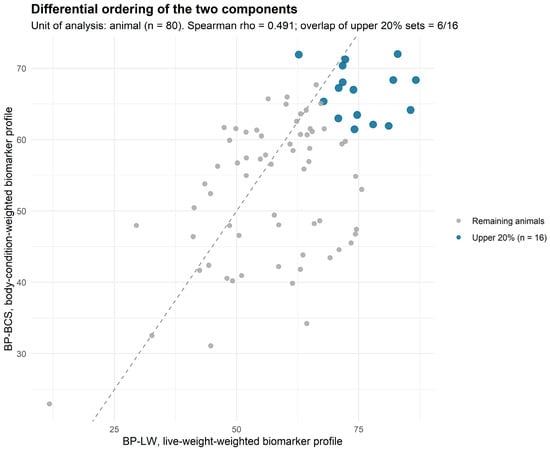
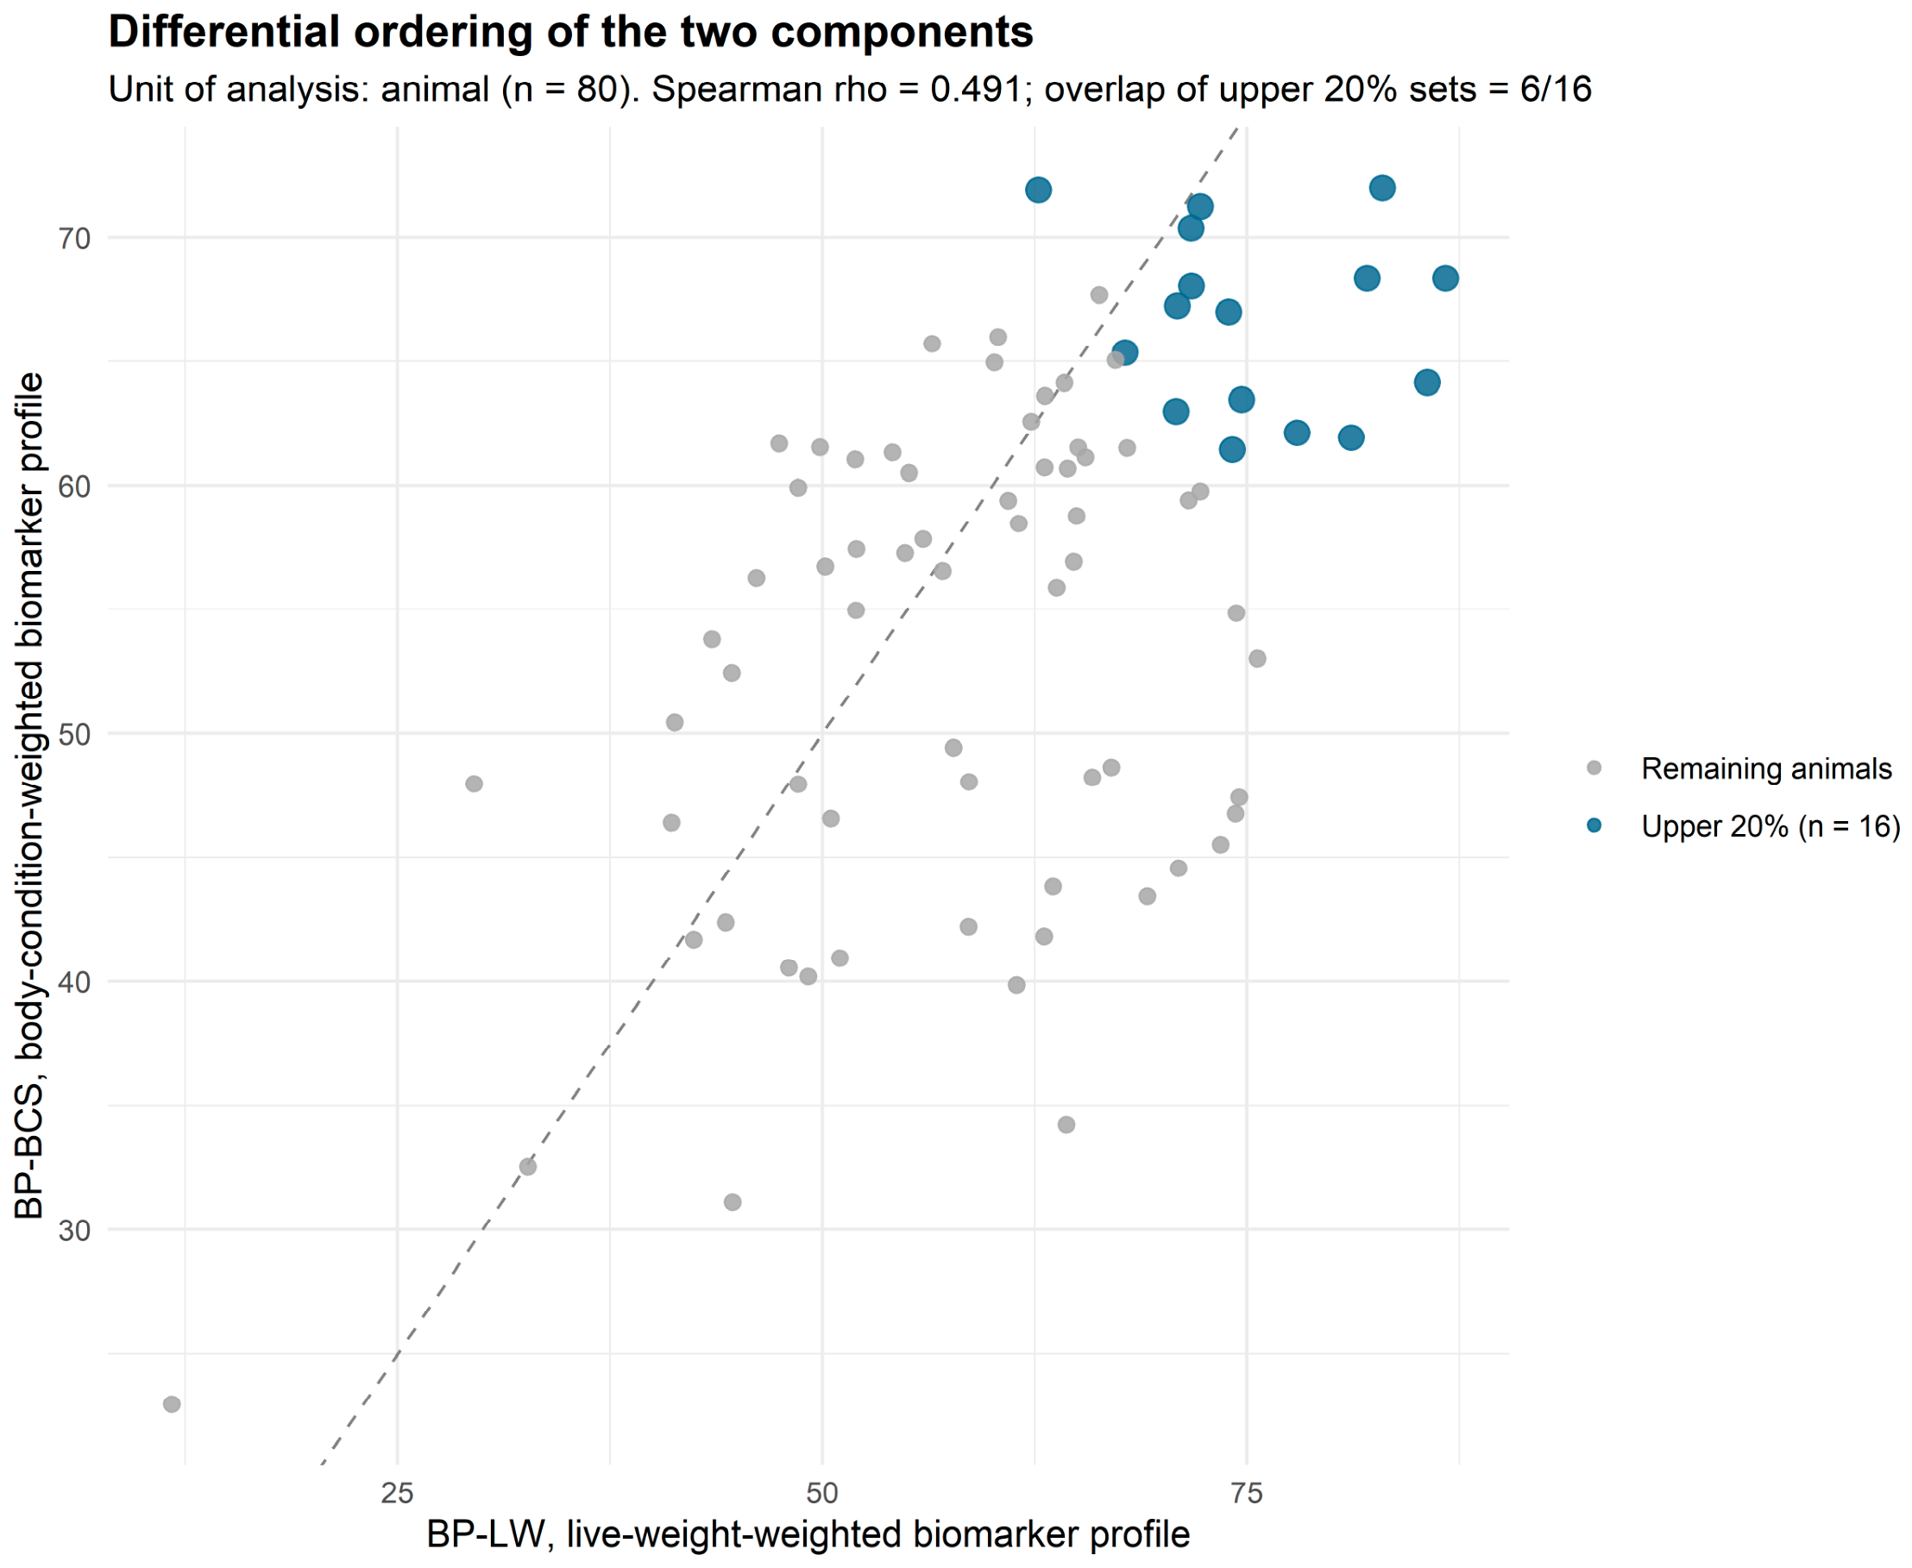
The profiles correlated moderately at animal level (Pearson ; Spearman ) but ordered many cows differently (Table 3; Figure 2). Median absolute rank difference was 15 places and 66.2% of cows moved by more than 10 positions. The two upper-quintile sets had Jaccard similarity 0.231 (95% bootstrap interval 0.105 to 0.412). correlated 0.353 with observed live weight and correlated 0.174 with observed BCS, consistent with profiles representing desirability-weighted predictors rather than copies of the response traits.
Table 3.
Animal-level relationship between corrected biomarker profiles (n = 80).
Figure 2.
Differential ordering of the two corrected biomarker profiles at animal level. The dashed line marks equality and highlighted cows form the ISA2-B upper 20%.
3.4. Three ISA2 Alternatives
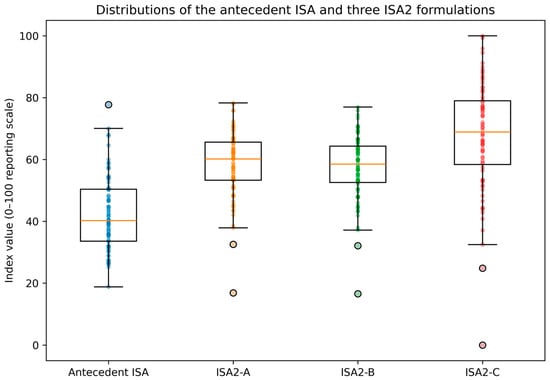
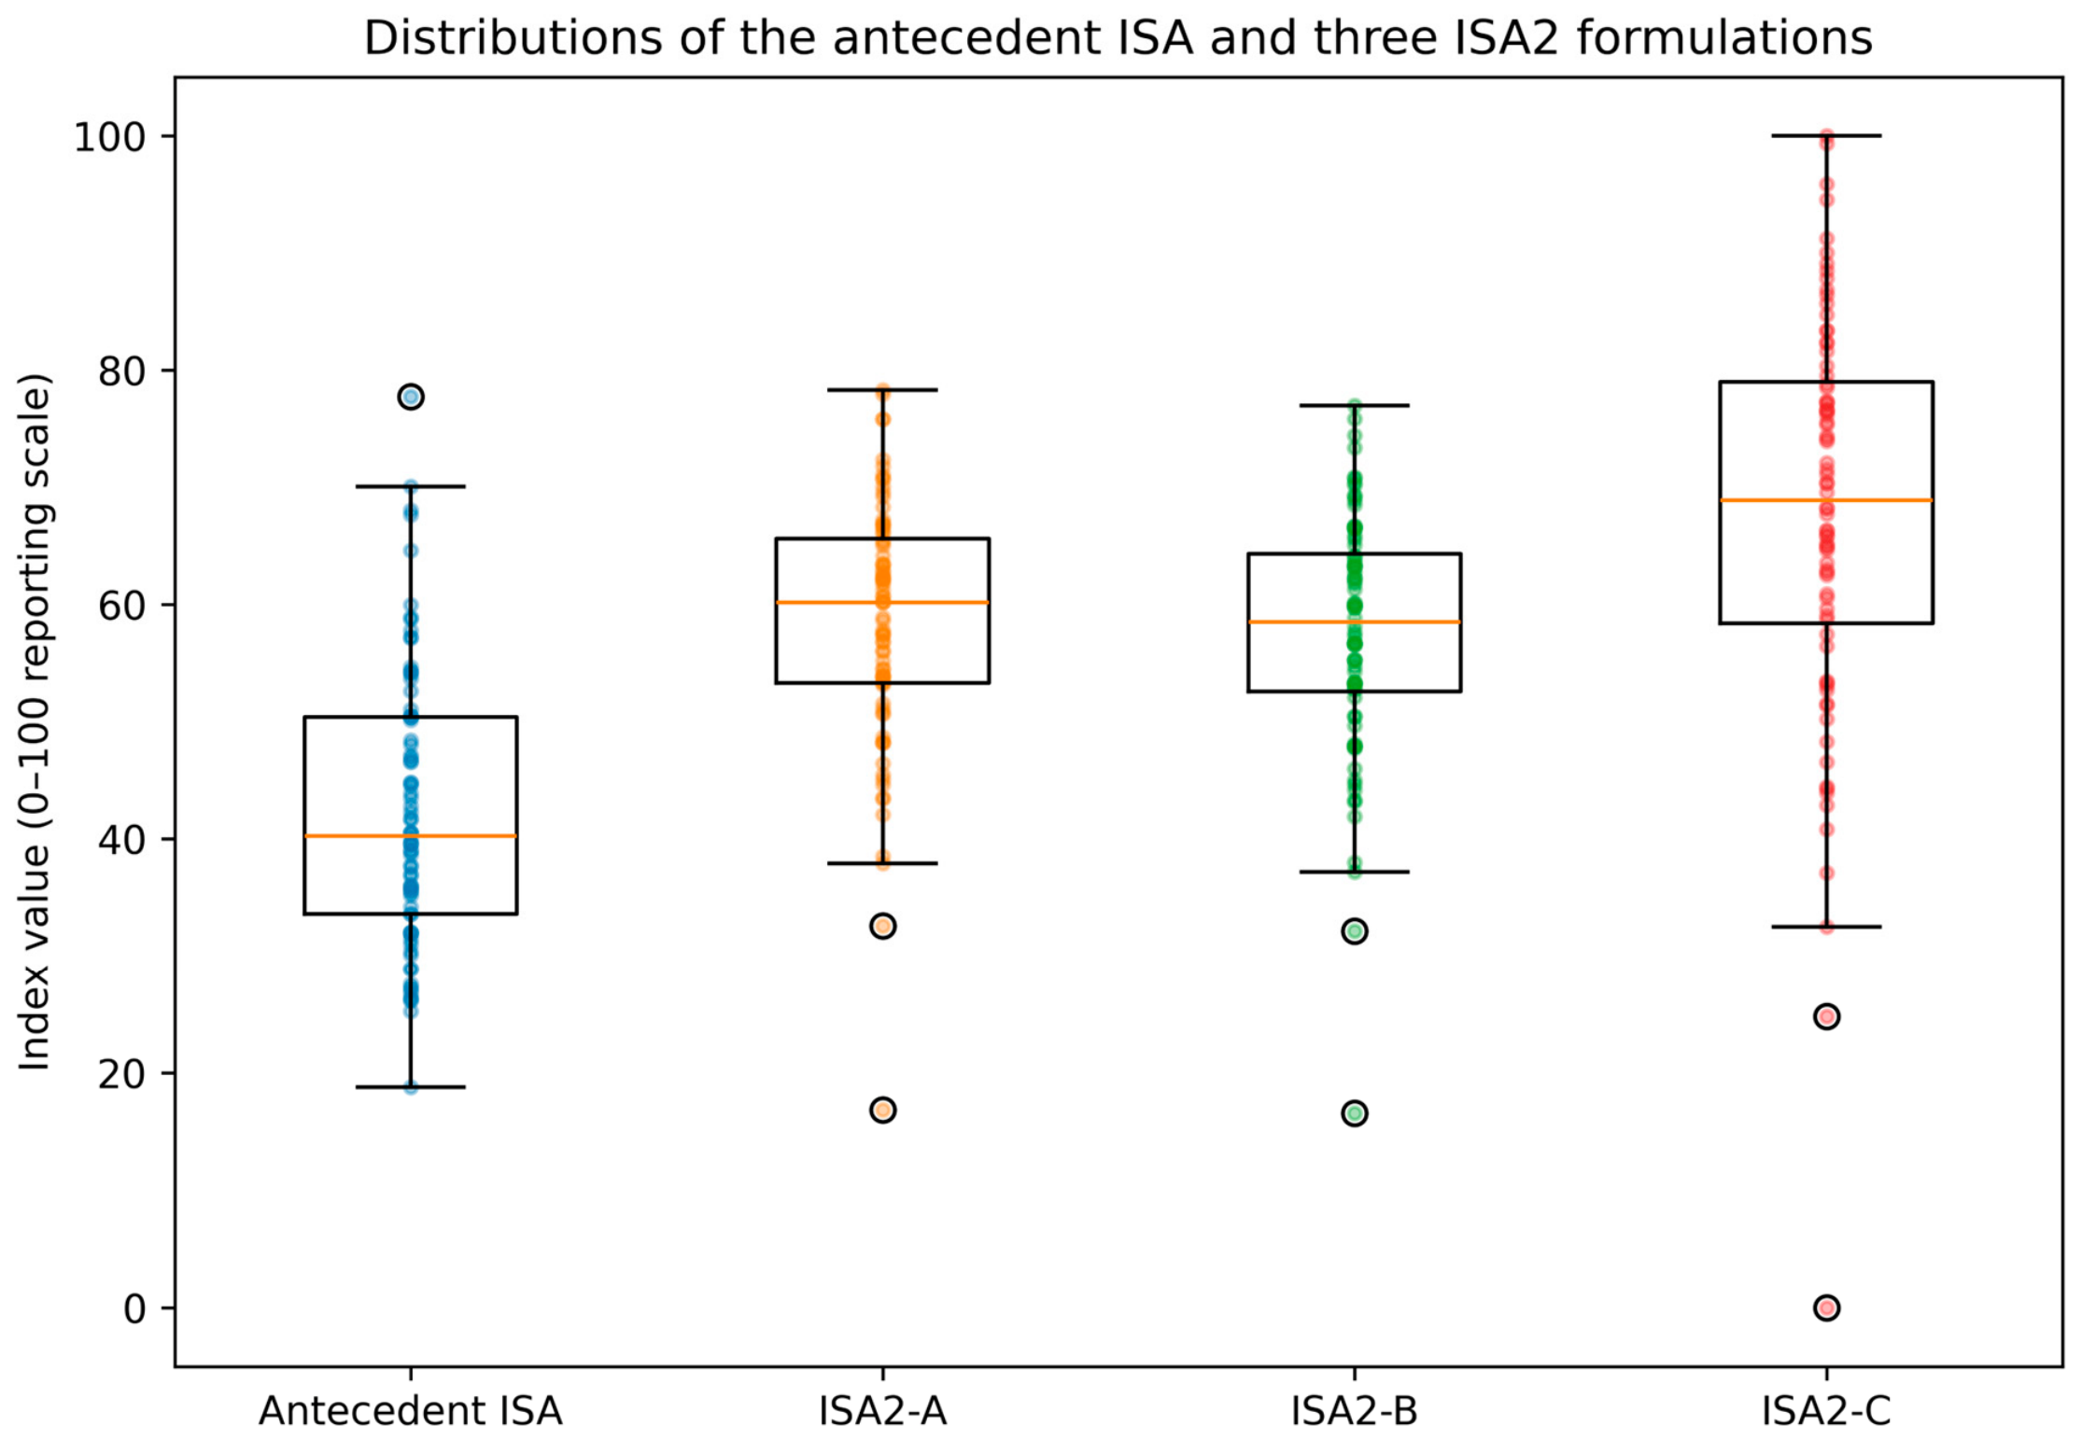
ISA2-A and ISA2-B averaged 58.34 ± 10.69 and 57.52 ± 10.50, respectively (Table 4). For ISA2-C, PC1 explained 77.7% of standardized two-profile variation and the favourable-direction loadings were 0.7071 for both profiles. These equal loadings are the expected PCA geometry for two standardized positively correlated variables and should not be interpreted as empirically learned differential weights. The reporting-only 0–100 transformation of PC1 produced mean 67.63 ± 17.63. That proportion is (1 + r)/2 for the observed correlation of 0.5548 and therefore adds nothing to the correlation already reported.
Table 4.
Comparison of corrected ISA2 formulations. ISA2-C is displayed on an affine 0–100 scale that does not alter its ranking.
The three rankings were highly concordant. ISA2-A versus ISA2-B had Spearman 0.9969 and Kendall 0.9652; ISA2-C versus ISA2-B had Spearman 0.9959 and Kendall 0.9538. Each alternative shared 15 of 16 upper-quintile cows with ISA2-B (Jaccard = 0.882). ISA2-A and ISA2-C both replaced cow 59 in the ISA2-B upper quintile with cow 13519.
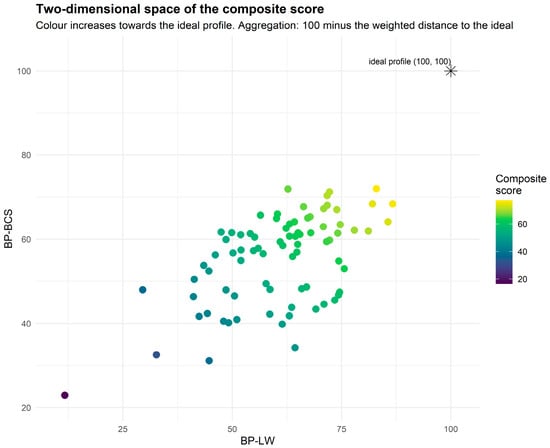
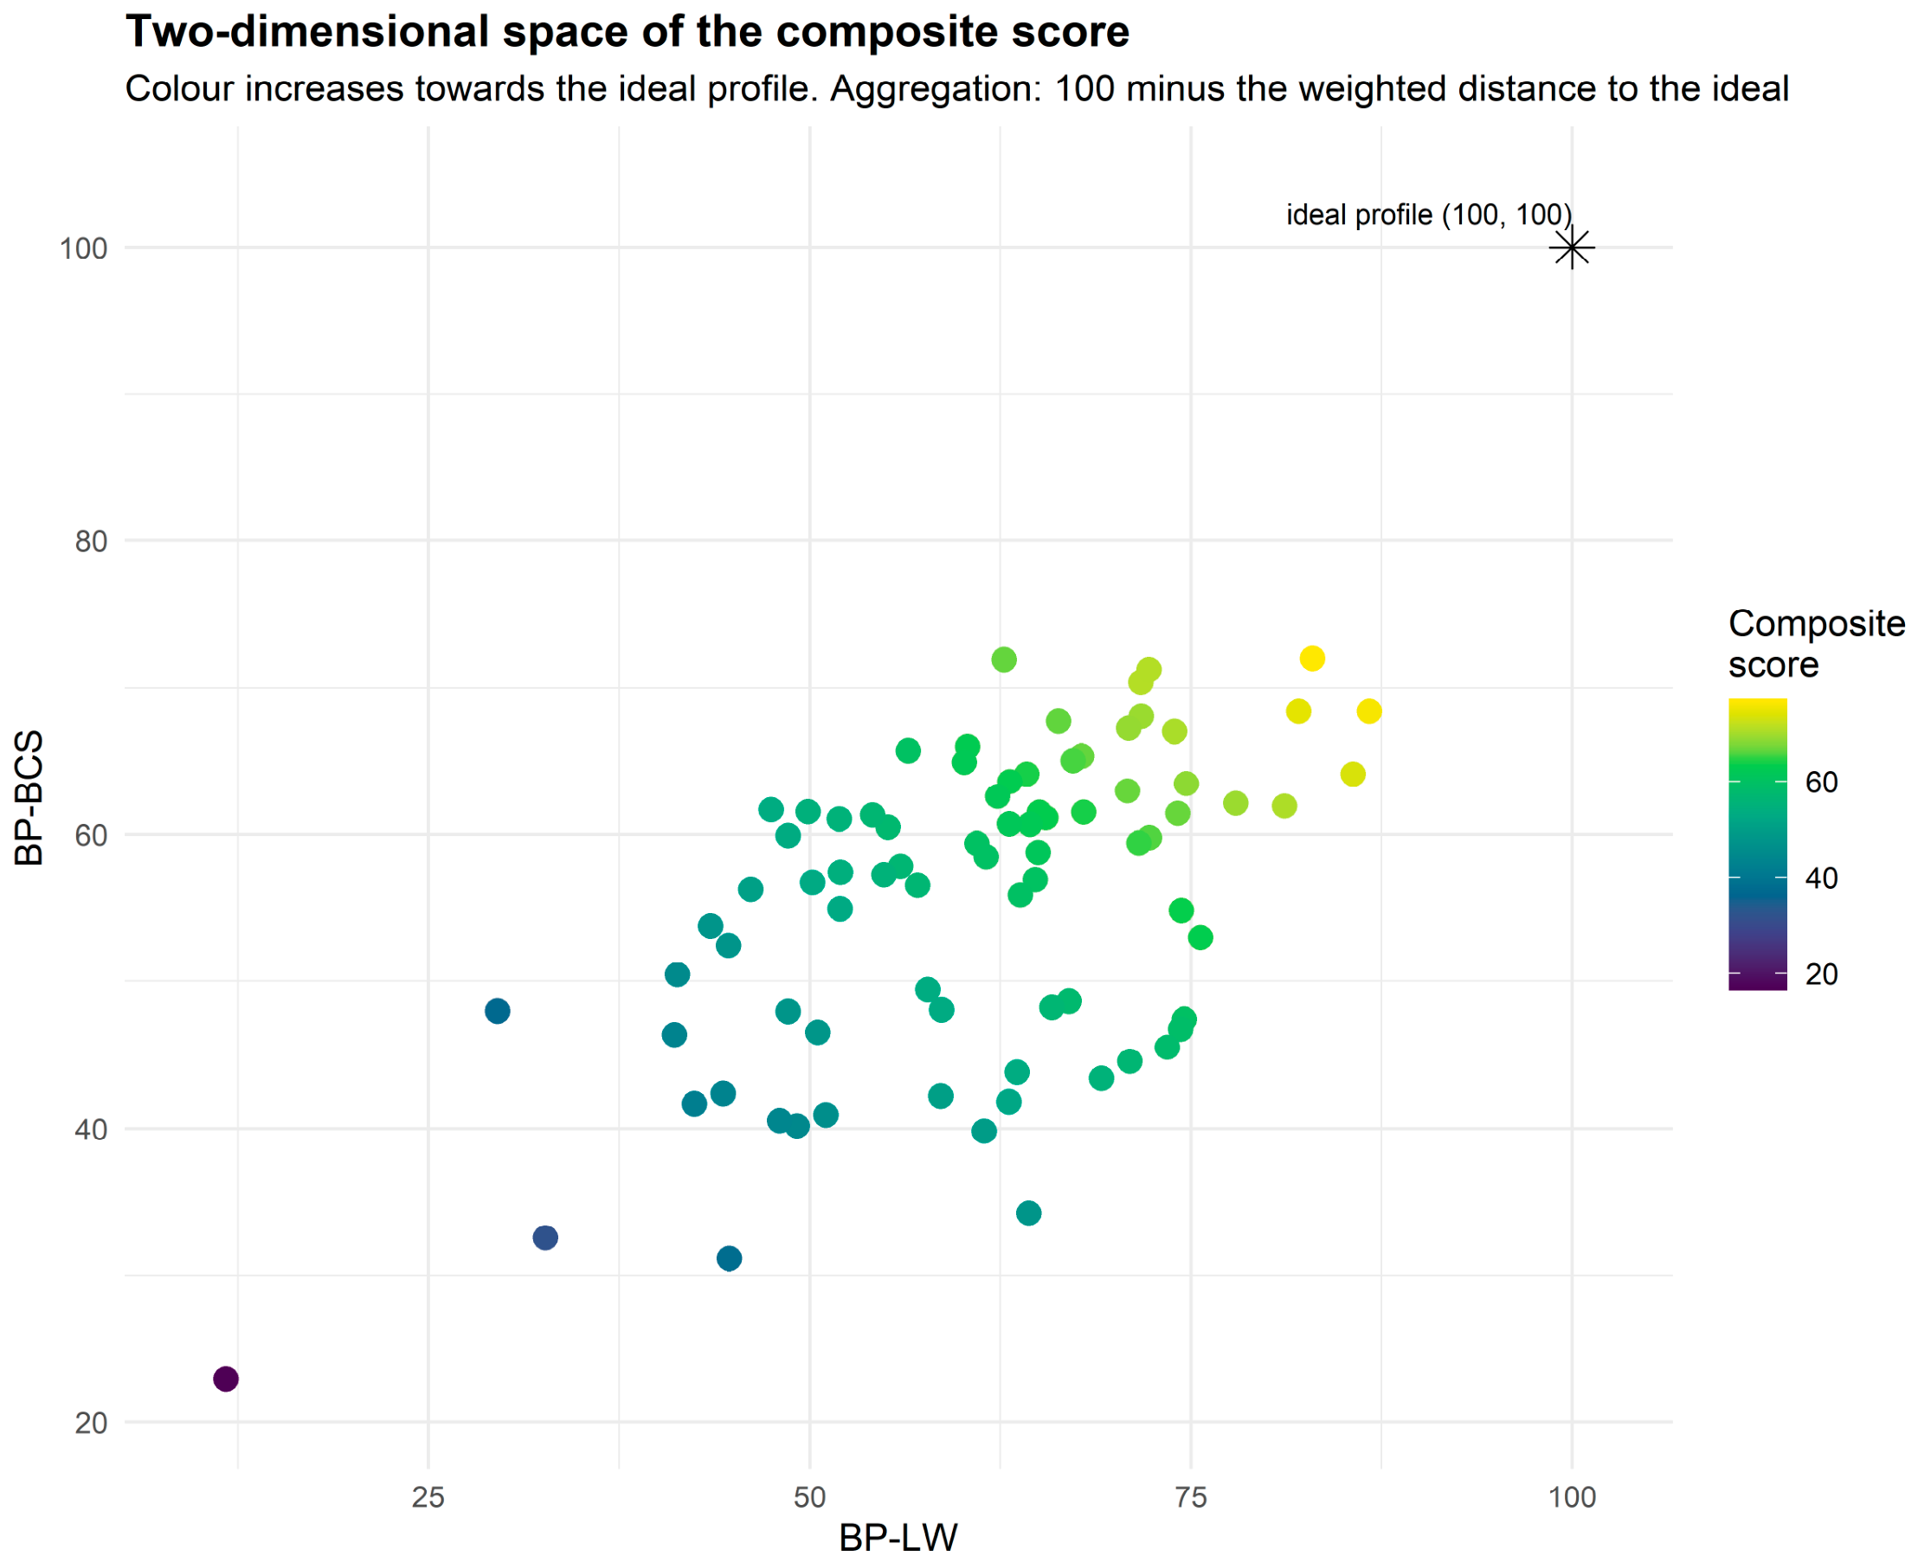
ISA2-B was retained as the primary formulation because its geometry directly represents the stated decision objective, proximity to favourable values on both profile axes (Figure 3). ISA2-A is explicitly compensatory. ISA2-C serves as a symmetric unsupervised benchmark of the common standardized profile direction; under the present two-variable standardized formulation it does not estimate unequal profile weights. The near-identity of the three rankings in this cohort should not be read as evidence that the choice of rule is immaterial in general. ISA2-A and ISA2-B differ precisely on animals that are favourable on one profile and poor on the other: under the actual weights the profile (100, 0) scores 54.40 under ISA2-A and 32.47 under ISA2-B, whereas the balanced profile (50, 50) scores 50.00 under both. This cohort contains few such animals, since the two profiles correlate at 0.555 and the discordant corner is thinly populated, which is why the rules agree here.
Figure 3.
Two-dimensional space underlying ISA2-B. Scores increase as the weighted distance to the joint ideal at (100, 100) decreases.
3.5. Comparison with the Antecedent ISA
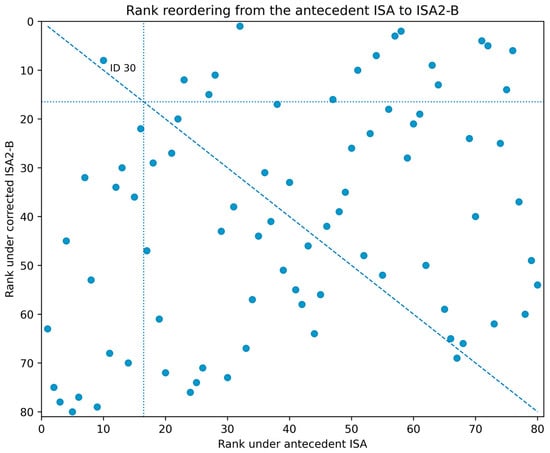
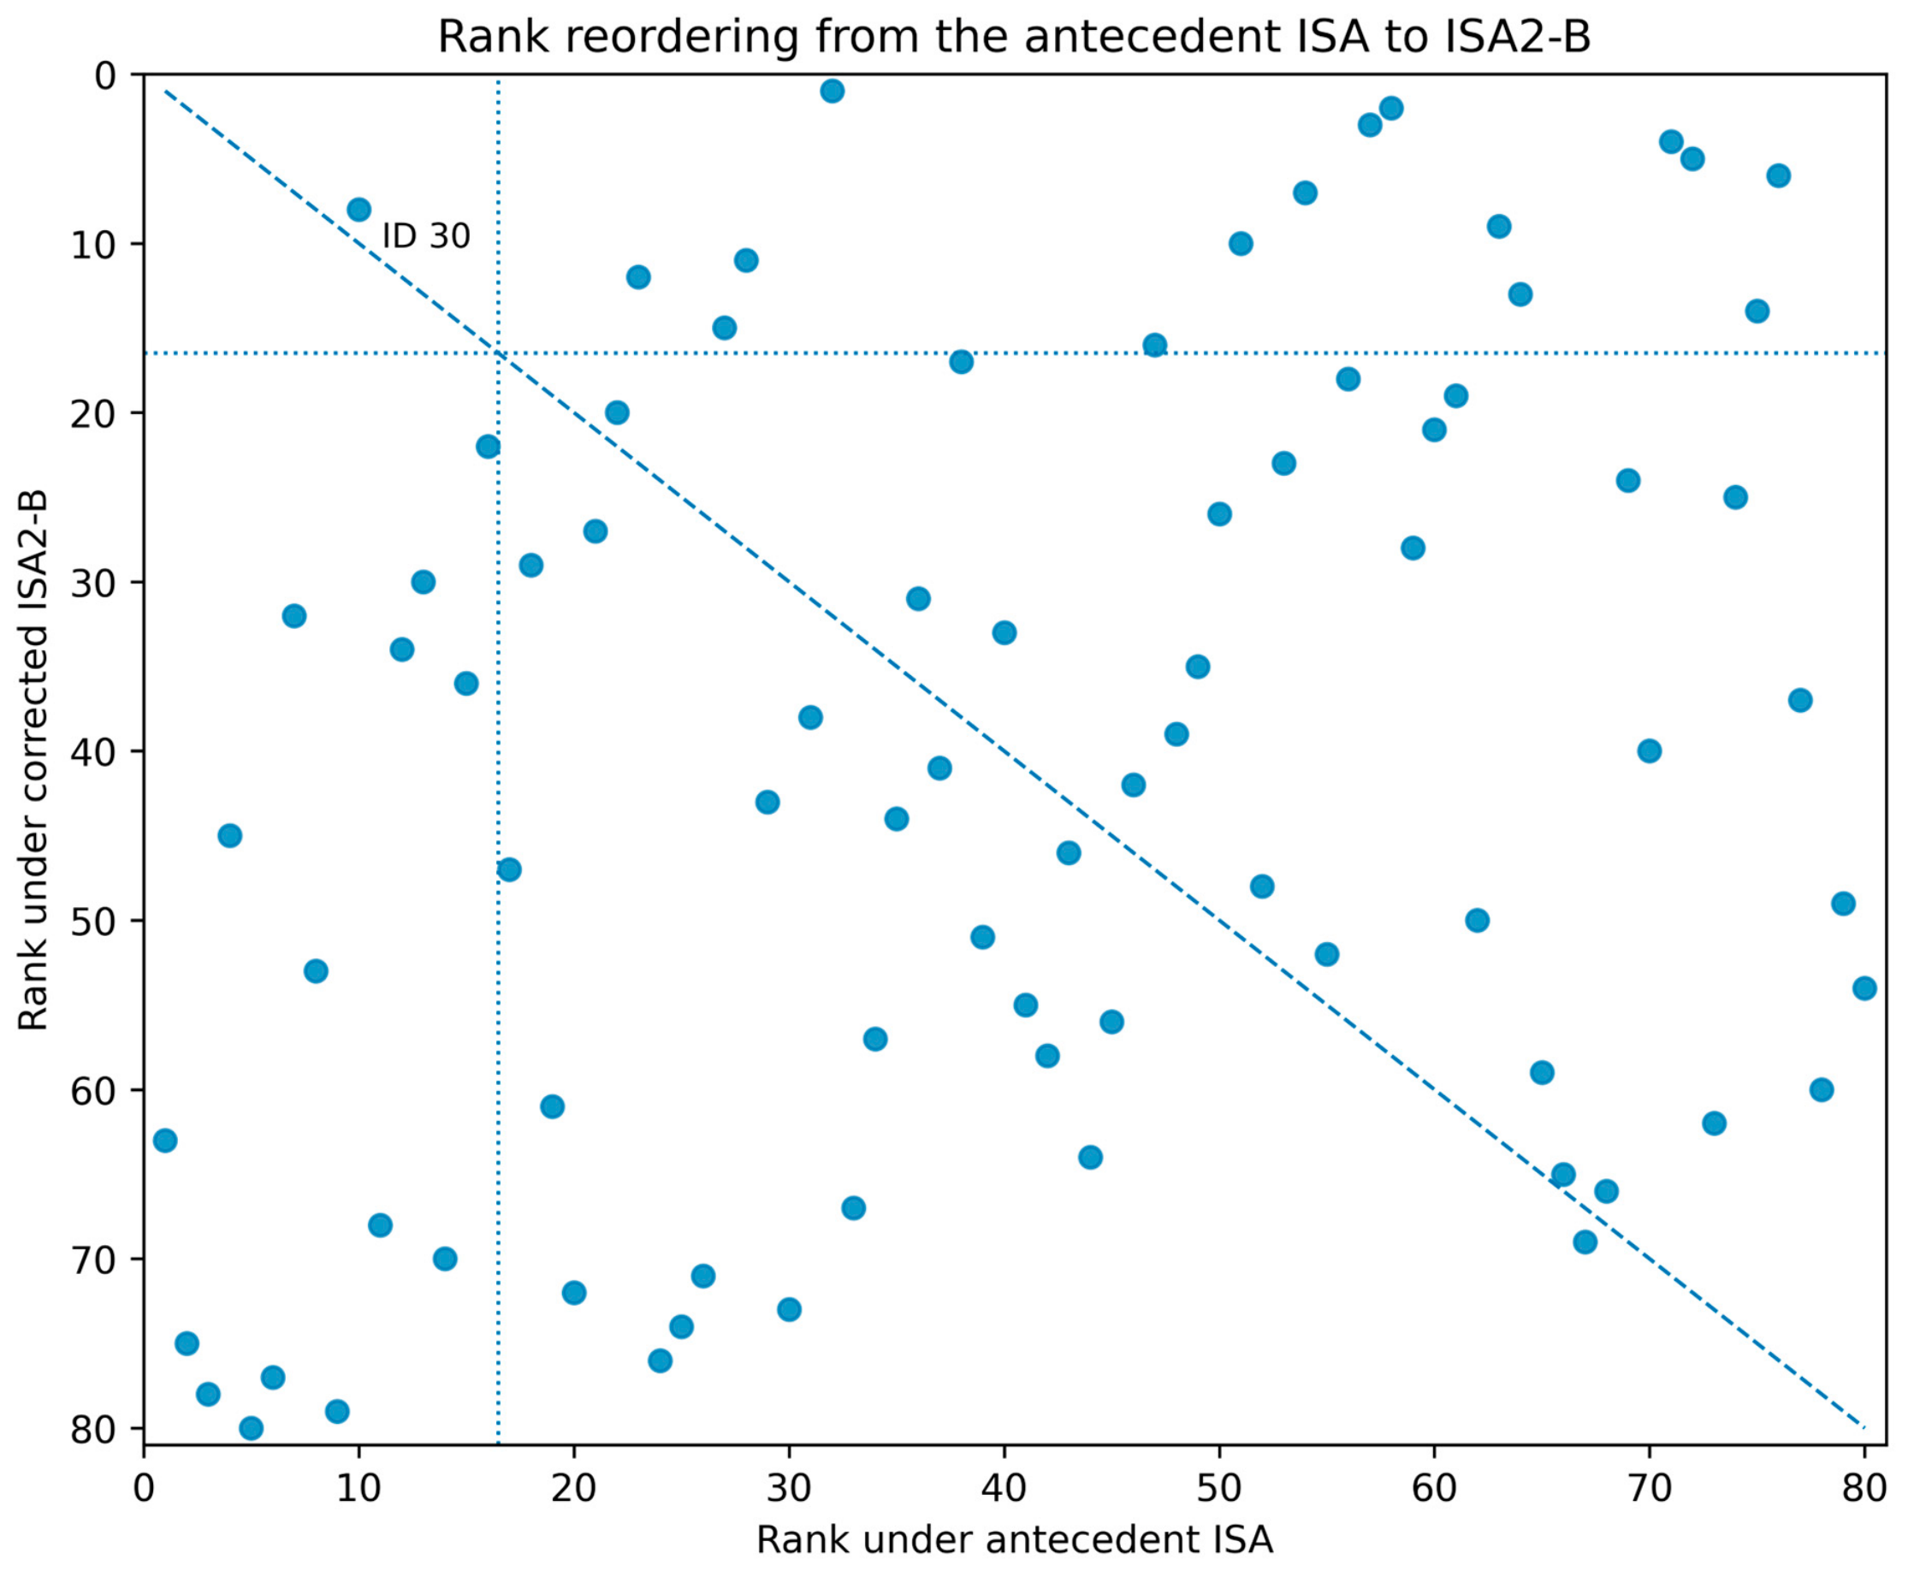
The corrected ISA2 variants differed strongly from the archived antecedent ISA ranking (Table 5; Figure 4 and Figure 5). Spearman correlations ranged from −0.319 to −0.335 and Kendall coefficients from −0.225 to −0.235. Only cow ID 30 occurred in both antecedent and corrected upper-quintile sets, giving Jaccard similarity 0.032 in each comparison.
Table 5.
Rank comparison of the archived antecedent ISA with corrected ISA2 (n = 80).
Figure 4.
Rank reordering from the archived antecedent ISA to ISA2-B. The identity line indicates unchanged rank; dotted lines mark the upper-quintile boundary. ID 30 was the only cow retained in both upper-quintile sets.
Figure 5.
Distributions of the archived antecedent ISA and three corrected ISA2 formulations. ISA2-C was linearly rescaled to 0–100 only for display and should not be interpreted as the same distance metric as ISA2-B.
This reordering reflects the combined revision of validation, feature attribution, reference-range handling, scaling and aggregation. It therefore demonstrates substantive architectural change but does not identify a single cause or prove biological superiority of the new ranking.
3.6. Stability, Cliff Effect and Rank Consistency
Upper-quintile retention under Gaussian biomarker perturbation decreased gradually from mean Jaccard 0.958 at 1% noise to 0.868 at 5%, 0.808 at 10% and 0.691 at 20% (Table 6). Across to 0.70, Spearman correlation with the primary ISA2-B ranking remained at least 0.96. Desirability sensitivity was larger: across to 0.90 and to 3, rank correlations ranged 0.943 to 1.000 and top-20% Jaccard overlap 0.600 to 1.000. Affine BCS relabelling left the score unchanged (Spearman, quartile kappa and top-20% Jaccard all 1.000).
Table 6.
ISA2-B upper-quintile retention under Gaussian biomarker noise, 200 replicates per level.
The antecedent binary rule was exposed to reference boundaries in 250 of 320 records (78.1%), with up to six border biomarkers in one record and mean . CPK had the greatest border exposure (47 records, 14.7%), followed by heart rate (42, 13.1%), GGT (38, 11.9%), sodium (37, 11.6%) and respiratory rate (33, 10.3%). Detailed results are retained in the Supplementary Materials.
The estimation uncertainty carried by the weights themselves was quantified separately, since permutation importance is an estimated quantity rather than a fixed property of a biomarker. Because desirability is declared a priori and does not depend on any fitted model, the weight vector is the only element of the construction that changes when the modelling protocol changes. Weights were therefore re-estimated under a different but equally defensible protocol, a random forest with training-only animal-grouped cross-fitted permutation importance, and both profiles were rebuilt on the identical desirability matrix. Seven of the ten retained biomarkers were common to both protocols in each profile, and the leading biomarkers recurred under both, but the finer weights differed and the ranking moved with them: Spearman 0.7552, Kendall 0.5532, a median absolute rank displacement of 9.5 positions, 39 of 80 cows moved by more than ten places, and 9 of the 16 upper-quintile cows retained, a Jaccard index of 0.391. Set against Jaccard indices of 0.882 for variation in the component weight and 0.882 for variation in the aggregation rule, the estimation of the weights is by a wide margin the dominant source of ranking uncertainty in this analysis. This is the magnitude that should be expected given held-out coefficients of 0.265 and 0.123 estimated from 45 training cows, and it is reported here rather than left implicit.
The ISA2-B upper quintile contained six Criollo Ñeembucú, three Criollo Pilcomayo, three Brahman, three Nelore and one Brangus cow. This distribution is descriptive, not evidence of genetic superiority. Rank consistency across aggregation rules was high: ISA2-A and ISA2-C each shared 15 of the 16 ISA2-B upper-quintile cows. Measurement perturbation provided the primary uncertainty analysis for the fixed set of 80 cows, with upper-quintile retention declining gradually as biomarker noise increased. The complete 16-cow ISA2-B shortlist with alternative A and C ranks is provided in Supplementary Table S5, and the arithmetic worked example is Supplementary Table S3.
4. Discussion
4.1. From ISA to ISA2
ISA2 preserves the original motivation of ISA while making the computational logic more explicit. The antecedent index established a useful premise: multiple physiological measurements can be weighted and integrated to rank cows exposed to wetland conditions [3,4]. ISA2 retains that premise but separates four decisions that should not be conflated. Predictive modelling determines which biomarkers help predict live weight and BCS; clinical information determines favourable biomarker regions; profile equations translate weighted desirability to a common scale; and the final integration rule determines how the two profiles trade off.
The large difference between antecedent [4] and revised ranks shows why this separation matters. ISA2 is not a renamed or linearly transformed ISA. However, the low concordance cannot be interpreted as evidence that ISA2 selects biologically better cows. Several changes occurred together, and no independent fertility, calf or survival outcome was available. The appropriate conclusion is methodological: the revised architecture produces a materially different and more auditable ranking whose external value must now be tested.
The continuous desirability step addresses the clearest structural limitation. More than three quarters of seasonal records had at least one biomarker close to a clinical limit. With a binary , small analytical variation can reverse a contribution completely. Graded desirability preserves information about proximity to the favourable region. It does not, however, make the reference ranges themselves universally valid. The high proportions outside some laboratory intervals and the observed sensitivity to desirability parameters show that future use requires external calibration rather than uncritical transport of thresholds.
The antecedent ISA should therefore not be interpreted as obsolete or invalidated by ISA2. Its simpler threshold-based architecture remains defensible when the aim is transparent within-herd screening under conditions closely matched to the population, laboratory and management setting in which the ISA was calibrated, when computational or data resources are limited, or when continuity with earlier ISA-based monitoring is important [3,4]. In such settings, the lower analytical resolution may be an acceptable trade-off, provided that users recognize the dependence on reference limits and avoid transporting the score uncritically across laboratories, populations or production systems.
ISA2 is preferable when the objective is finer phenotypic ranking, particularly for animals close to physiological reference limits, and when the data and computational infrastructure required for continuous desirability functions and model-derived weights are available. The two tools should therefore be viewed as complementary generations of the same framework rather than as mutually exclusive alternatives. The marked rank reordering observed between ISA and ISA2 does not establish that ISA2 selects biologically superior cows, because neither index was compared here against an independent reproductive, productive, health-survival or economic endpoint. A prospective head-to-head comparison is needed to determine when the additional resolution of ISA2 produces a practically meaningful advantage over the simpler ISA. In this way, ISA2 is considered an evolved model derived from the ISA equation [4], within the context of the continuous improvement of the process for identifying breeding cows that rank favourably on the measured adapto-productive profile under hot and humid conditions.
4.2. Why ISA2-B Was Preferred Without Claiming That A or C Are Invalid
The three ISA2 alternatives ranked this cohort similarly, but their meanings differ. ISA2-A is easy to communicate and intentionally permits compensation. ISA2-C is useful as an unsupervised comparison, but with only two standardized positively correlated profiles, PCA necessarily gives PC1 equal-magnitude favourable-direction loadings. In the present design, ISA2-C therefore represents a symmetric common-direction benchmark rather than a data-driven estimate of unequal importance for BP-LW and BP-BCS. Its 77.7% explained variance reflects the strength of correlation between the two standardized profiles. A future PCA formulation with more than two component profiles, or a deliberately unstandardized analysis, would answer a different methodological question and should be validated as a new alternative rather than interpreted as the current ISA2-C.
ISA2-B was retained because it matches the stated decision objective: high ranking should require proximity to favourable values on both biomarker-profile axes. The corrected formula measures distance from the joint ideal rather than magnitude from the origin. This resolves the geometry problem of the original quadratic proposal. The choice is therefore based on a prespecified interpretation, not on a marginally higher empirical correlation. Reporting all three alternatives remains useful because it shows whether the selected ranking depends materially on aggregation philosophy. We state plainly that on the present cohort ISA2-B offers no demonstrated practical advantage over the simpler and more directly interpretable ISA2-A: the two rankings agree at Spearman 0.9969 and share fifteen of sixteen shortlisted cows. The case for ISA2-B rests on behaviour this cohort does not exercise, namely the treatment of animals that are strong on one profile and weak on the other, and a user whose objective is explicitly compensatory should prefer ISA2-A. Reporting all three formulations remains informative because it reveals when the choice begins to matter. Supplementary Figure S8 traces the three rules across the equal-sum path and shows where they separate.
4.3. Model Validation and Feature Importance Define the Evidential Ceiling
The weights inherited uncertainty from the predictive models. GBM had the lowest primary cross-validation error, but repeated grouped folds did not establish a clear advantage over RF. Held-out values were modest, particularly for BCS. This is a central limit on interpretation, not a secondary technical issue. Two consequences follow. First, the component weight is a ratio of two cross-validated coefficients of determination and inherits their uncertainty, so its value should not be taken as evidence that live weight is meaningfully more predictable than body condition; what protects the ranking is not the precision of that weight but its limited influence, since the Spearman correlation with the retained ranking stays above 0.96 across the whole range examined. Second, permutation importance measures the loss in predictive accuracy when a predictor is scrambled, and when the model predicts only modestly that loss is small and its ordering correspondingly less firm. The weights are an attribution of predictive contribution within one fitted model on one cohort; they are not measurements of physiological importance and are not transportable to another herd without re-estimation. The comparison with random-forest weights reported in Section 3.6 bounds how much of the ranking depends on the algorithm, but it does not remove this constraint.
Agricultural machine-learning studies increasingly emphasize validation that respects biological dependency. Becker et al. demonstrated the potential of machine learning for predicting heat stress in dairy cattle [20], while Ribeiro et al. showed that cross-validation strategy can substantially alter estimated cattle-behaviour prediction quality when dependent records are involved [21]. Grouping all seasons from the same cow in ISA2 therefore makes the reported performance more conservative and more relevant to ranking unseen animals.
Permutation importance should also remain a predictive attribution. The corrected workflow estimates it by cross-fitting exclusively within the training animals, so the independent testing cows no longer participate in biomarker selection or SI estimation. Correlated predictors can nevertheless share or obscure importance [12], and Kaneko showed that small samples and correlation can destabilize conventional permutation importance [13]. The repeated training-only importance-rank summaries quantify part of this uncertainty but do not make the weights universal. Larger datasets should compare conditional or grouped permutation approaches and test whether the same importance structure transports to new herds. Section 3.6 quantifies what that uncertainty costs the ranking. Two learners applied to the same animals are two estimators of the same underlying quantity, so their disagreement measures the sampling variability of the weights rather than adjudicating between the algorithms, and a discrepancy of this size is what held-out coefficients of 0.265 and 0.123 from 45 training cows would lead one to expect. Two features of the comparison are worth separating. The set of retained biomarkers is comparatively stable: seven of ten agree in each profile and the leading biomarkers recur, so the panel of indicators the method identifies is more reproducible than the ordering it produces. The individual ranking is not stable at that level, and the upper quintile is where the instability is concentrated. We therefore retain gradient boosting as a declared convention rather than a justified optimum, since revising the selection on the basis of a comparison run after the fact would reintroduce exactly the contingency the prespecified rule was designed to exclude. The constructive response is not to choose between learners on a sample that cannot separate them, but to reduce the variance of the estimate: averaging scaled importance across several algorithms, or across bootstrap refits of one, would yield weights with a smaller sampling error than any single fit provides. We identify this as the most immediate methodological priority for a subsequent version.
4.4. Biological Plausibility and Recent Evidence on Adaptation
The multivariable biomarker approach is consistent with current work showing that thermal adaptation involves coordinated physiological, hematological and morphological responses. Cartwright et al. reviewed the impact of heat stress on dairy cattle and selection strategies for thermotolerance [22]. Vieira et al. reported breed-dependent changes in physiological variables under increasing heat load in adapted Brazilian cattle [23], and later thermography-based work showed heterogeneous responses across cattle breeds [24]. Silveira et al. integrated machine-learning and path methods and identified hematological and coat-related traits as relevant to adaptive responses [25]. Proteomic work in tropically adapted Caracu cattle also demonstrated broad plasma changes during heat stress and recovery [26].
These studies support the general premise of a multivariable profile but do not validate the specific ISA2 weights. Alkaline phosphatase, hair length, hematocrit and creatinine were important because their disruption reduced model performance in this cohort. That is not evidence that manipulating them would change adaptation or productivity. The more defensible interpretation is that they are candidate predictive indicators whose value should be tested prospectively.
Recent sensor and machine-learning studies also illustrate how the framework could evolve. Da Costa Silva et al. used machine learning to estimate thermal-stress indicators in rams from environmental and thermographic measurements [27], and Schmeling et al. quantified physiological and behavioural reactions of cattle to increasing pasture heat load [28]. These approaches suggest that future ISA2 versions could integrate environmental and high-frequency sensor data rather than rely only on four seasonal snapshots.
4.5. ISA2 as a Phenotypic Ranking, Not a Genetic Selection Index
Modern resilience research provides a useful standard for the distinction between phenotypic ranking and genetic selection. Bengtsson et al. discussed opportunities and consequences of increasing emphasis on resilience in dairy-cattle breeding [29]. Poppe et al. derived activity-based resilience traits and evaluated their heritability and genetic associations with health, fertility and BCS [30], while Chen et al. estimated genomic parameters for resilience based on repeated milk-yield records [31]. These studies show the additional evidence required before a phenotype can be used as a breeding target.
ISA2 currently provides none of those genetic parameters. The observation that nine of 16 ISA2-B upper-quintile cows belonged to local Criollo populations is therefore descriptive. Adapted-breed studies make this pattern scientifically interesting [23,24,26], but n = 16 per population cannot support a claim of genetic superiority. If ISA2 later shows repeatability, prospective validity and genetic variance, it could become an auxiliary phenotype in a formal breeding program. At present, it is better suited to phenotypic prioritization, research stratification and hypothesis generation.
4.6. Measurement, Ranking Stability and Practical Use
The exact invariance to affine BCS relabelling should not be confused with measurement reliability. Manual BCS is observer-dependent. Siachos et al. recently developed and externally tested a machine-learning imaging system for automated dairy-cow BCS [32], showing how repeated standardized measurements may reduce observer dependence. Future ISA2 studies should compare multiple observers or automated BCS rather than simulate country-labelled scoring conventions.
Ranking stability is equally important. ISA2-B retained most upper-quintile cows under small simulated biomarker error, but stability declined as noise increased, and the desirability-parameter analysis showed that shortlist membership can change under less favourable specifications. The former ordinary bootstrap inclusion probabilities are not reported because resampling animals with replacement can confound uncertainty in rank with the probability that a cow is sampled at all. For the fixed set of 80 cows, measurement perturbation and agreement across ISA2-A, ISA2-B and ISA2-C provide more directly interpretable stability evidence. The upper-20% threshold itself remains a management convention; applications should examine several retention fractions, and a utility-based decision threshold would be preferable if economic information becomes available.
Applying ISA2 to a different herd or laboratory requires deliberate recalibration rather than direct transfer, and the two dependencies involved behave differently. The min–max anchoring is a pure cohort dependency: the four anchoring constants are the observed extremes of the raw profiles, so adding a cow outside that range rescales every other animal. Within one cohort this is harmless because the ranking is invariant to it, but two scores of 70 computed on different cohorts are not comparable quantities. The reference intervals are external to the data and do not shift with the cohort, yet they were obtained from one analyzing laboratory, and the desirability parameters are analyst choices to which the ranking is more responsive than it is to the component weight. We therefore recommend four steps. Freeze the biomarker set, the desirability directions and the two desirability parameters before any new animals are scored. Re-derive the reference intervals from the laboratory that will perform the assays, or establish transferability with shared samples or standardized controls. Decide explicitly whether the anchoring constants are re-estimated on the new cohort, which preserves comparability within it, or held fixed from a reference cohort, which preserves comparability across cohorts at the cost of values falling outside 0–100. And re-estimate the weights, since they are model-specific and cohort-specific, unless the deliberate objective is to transport the earlier weights and test whether they still perform.
4.7. Limitations and Future Research
The present study has ten principal limitations. First, the cohort is small and regional, and predictive performance on unseen cows was modest. Second, GBM was not clearly superior to RF when fold uncertainty was considered. Third, cohort min–max anchors make the 0–100 profiles population-dependent. Fourth, clinical reference intervals came from the source laboratory framework and may not transfer across laboratories or management systems; their midpoints were adopted as operational symmetric targets rather than demonstrated biological optima. Fifth, desirability direction and shape are partly specified and changed the ranking under sensitivity analysis. Sixth, even training-only cross-fitted permutation importance remains affected by correlated predictors and algorithm choice. Seventh, α and β are predictability weights rather than economic, welfare or genetic weights. Eighth, BCS was scored by consensus among four assessors rather than by independent raters, so no measure of inter-observer agreement can be computed and the observer component of the error is unquantified. Ninth, with only two standardized positively correlated profiles, ISA2-C necessarily uses equal-magnitude PC1 loadings and therefore does not learn differential profile weights. Tenth, and most importantly, no independent reproductive, productive, health-survival or economic endpoint was available. Internal stability is not external biological validity.
Two further limitations follow from the design of the field campaign. Genotype is partially confounded with ranch: Brangus animals were drawn from all four ranches, whereas each of the remaining genotypes came from a single ranch, so a difference attributed to genotype could in principle reflect the ranch. This is a consequence of where these populations exist, since the Criollo remnants are not distributed across the region, and it is a further reason for reporting the genotype composition of the upper quintile as descriptive. Selection was also purposive rather than random: the cows were drawn from breeding herds already judged functional by their producers, so the cohort describes the ordering of animals that are already performing and is not representative of the regional population.
An eleventh limitation belongs with the ten above and is among the more consequential. The weights are estimated quantities with substantial sampling error, and the ranking inherits it. Re-estimating them under an alternative but equally defensible modelling protocol, with every other element of the construction held fixed, changed seven of the sixteen shortlisted cows and displaced 39 of 80 animals by more than ten rank positions. This exceeds the effect of varying the component weight or the aggregation rule and is a property of estimating weights from models of modest accuracy on a small number of animals, not a defect of this cohort. It reinforces rather than alters the conclusion already drawn: ISA2 should not be used for individual replacement decisions before the weights are stabilized and the ranking is validated against independent outcomes.
These limitations define a clear validation program. The current biomarker definitions, desirability parameters, profile anchors and primary ISA2-B equation should first be frozen, then applied prospectively to cows from independent farms and years. Outcomes should include pregnancy, conception interval, calving interval, calf survival and weaning weight, cow health, longevity and treatment costs. Leave-farm-out and leave-year-out validation should complement animal-grouped cross-validation. Inter-laboratory reproducibility should be quantified with shared samples or standardized controls, and BCS should be assessed by multiple observers or automated imaging [32].
That validation program should include a frozen, prospective comparison of the antecedent ISA with ISA2-A, ISA2-B and ISA2-C in the same animals, without retrospective retuning to the validation outcomes. For each external endpoint, future studies should compare discrimination, calibration, rank stability, overlap across practically relevant replacement fractions and the consequences of reclassification for management decisions. This design would show whether the simpler ISA remains adequate for screening in low-resource or continuity-focused applications, or whether the additional resolution of ISA2 translates into measurable gains in fertility, calf performance, health, survival, longevity or economic return.
A second research line should test alternative weighting philosophies. Conditional or grouped feature importance can be compared with the current permutation weights, while production-system economics and welfare priorities can be introduced separately from predictability. If pedigree or genomic information becomes available, formal heritability and genetic-correlation analyses should precede any claim that ISA2 is a breeding-value index. Resilience studies based on dense activity or milk-yield trajectories provide a precedent for this transition from an observed indicator to a genetically evaluated phenotype [29,30,31].
Finally, ISA2 can be extended from four seasonal measurements to dynamic profiles combining activity sensors, automated BCS, thermography and environmental data. Such an extension should focus on deviation and recovery, not simply on adding more predictors. The objective is not to maximize algorithmic complexity but to determine whether a transparent multivariable phenotype predicts outcomes that matter to producers and animal welfare better than simpler measurements alone.
5. Conclusions
ISA2 evolves by expanding the methodological framework through the replacement of a binary physiological rule with a graded desirability function, rebuilding machine-learning weights with training-only animal-grouped cross-validation and cross-fitted permutation importance, and explicitly comparing three integration strategies. ISA2-A is compensatory, ISA2-B measures proximity to a joint favourable profile and ISA2-C provides a symmetric unsupervised integration of the two standardized profiles. The three produced highly similar rankings in this cohort, but ISA2-B was retained because its geometry directly represents the stated objective of remaining favourable on both profile axes.
The revised architecture substantially reordered cows relative to the antecedent ISA and showed gradual rather than cliff-like sensitivity to simulated measurement error. This demonstrates a substantial methodological revision, but not biological superiority, without invalidating the preceding model. Therefore, the antecedent animal selection index remains a lower-complexity alternative for transparent ranking when its application closely matches the conditions under which it was calibrated, when computational resources or the available database are limited, or when continuity with previous assessments based on that modelling framework needs to be maintained. ISA2 is preferable when finer continuous ranking and greater resolution around reference limits are priorities and the required data, calibration and computational infrastructure are available. These roles are complementary rather than mutually exclusive. Prospective multi-farm comparisons of ISA and ISA2 against reproductive, productive, health-survival and economic outcomes, together with laboratory and BCS reproducibility assessment, are required before ISA2 can be preferred universally for operational breeding or replacement decisions. In both cases the output is a phenotypic ranking of the cows actually evaluated. Neither index estimates transmissible merit, and neither should be described as a breeding-value index in the absence of genetic parameters and independent outcome data; the distinction is set out in full in Section 4.5.
Supplementary Materials
The following supporting information can be downloaded at https://www.mdpi.com/article/10.3390/ruminants6030082/s1: Supplementary Methods S1. Detailed ISA2 Construction; Supplementary Table S1. Biomarkers entering the two ISA2 profiles and their desirability specification. A dash indicates that no clinical interval was used; Supplementary Table S2. Antecedent ISA compared with the corrected ISA2 formulations at animal level (n = 80); Supplementary Table S3. Worked Example: Animal 561; Supplementary Table S4. Repeated Grouped Cross-Validation; Supplementary Table S5. ISA2-B Upper Quintile and Alternative Ranks; Supplementary Table S6. Exposure to the binary threshold cliff. The complete lower-bound and upper-bound counts and source codes remain in Cliff_Effect_Updated_Results.docx and in the machine-readable archive; Supplementary Table S7. Effect of re-estimating the biomarker weights on the animal-level ranking (n = 80); Supplementary Table S8A. Seasonal variation in live weight, body condition and the leading biomarkers; Supplementary Table S8B. Variance attributable to season by one-way analysis of variance; Supplementary Table S9. Observed distribution of body condition scores; Supplementary Table S10. Factor-analytic adequacy diagnostics for the two-variable principal component analysis underlying ISA2-C; Supplementary Table S11. The four cattle ranches contributing animals to the study; Supplementary Analysis S1. Binary-Criterion Cliff Effect; Supplementary Analysis S2. Estimation uncertainty of the biomarker weights; Figure S1. Bland-Altman display retained for descriptive comparison only. The two biomarker profiles are different constructed quantities, so limits of agreement are not treated as evidence of biological complementarity; Figure S2. Records within and outside the reference intervals under the antecedent binary criterion, with denominators retained in the figure; Figure S3. Binary in-range criterion versus centred graded desirability. The continuous function removes the 1-to-0 discontinuity at a reference limit; Figure S4. Learning curves showing training, grouped cross-validation and testing error as the number of training animals increases; Figure S5. Desirability functions used for biomarkers according to their prespecified direction; Figure S6. Monte Carlo retention of the ISA2-B upper-20% set under injected Gaussian noise. The band represents the 95% percentile interval; Figure S7. Rank concordance among ISA2-A, ISA2-B and ISA2-C at animal level. Values show rank differences relative to ISA2-B; the vertical dotted line marks the ISA2-B upper-quintile boundary. This figure assesses dependence of the shortlist on aggregation philosophy without using resampling-based inclusion probabilities; Figure S8. Aggregation diagnostic comparing balanced and extreme two-profile examples under candidate rules. It is used as a numerical diagnostic of the intended balance behaviour under the actual unequal profile weights; Figure S9. Estimation uncertainty of the biomarker weights. Each point is one cow. Desirability, the aggregation rule and the component weight are held fixed; only the estimated importance vector differs. The dashed line marks an unchanged rank and the shaded square the upper quintile under both weightings.
Author Contributions
Conceptualization, R.M.-L.; methodology, R.M.-L. and W.E.P.; software, R.M.-L. and W.E.P.; validation, R.M.-L., L.M.C. and W.E.P.; formal analysis, R.M.-L. and W.E.P.; investigation, R.M.-L. and L.M.C.; resources, R.M.-L.; data curation, R.M.-L. and L.M.C.; writing—original draft preparation, R.M.-L., L.M.C. and W.E.P.; writing—review and editing, R.M.-L., L.M.C. and W.E.P.; visualization, R.M.-L. and W.E.P.; supervision, R.M.-L. All authors have read and agreed to the published version of the manuscript.
Funding
This research received no external funding.
Institutional Review Board Statement
The present study was a secondary analysis of anonymized records from previously reported cattle research and involved no new procedures or experimental manipulation of animals. The ethical context of the original data collection is described in the source publications [2,4]. No additional animal intervention was performed for the present analysis.
Informed Consent Statement
Not applicable.
Data Availability Statement
The original contributions presented in this study are included in the article and its Supplementary Materials. The original data and analysis scripts supporting the findings of this study are available from the corresponding author upon request. Further inquiries can be directed to the corresponding author. The material preserved with the scripts includes the four min–max anchoring constants, the complete desirability specification with its reference intervals and sources, the train and test assignment by animal, the fold assignment by animal, the estimated weight vectors and the random seeds. These are the elements a reader needs in order to reproduce the reported scores or to recalibrate the index for another cohort or laboratory, as described in Section 4.6.
Acknowledgments
The authors acknowledge the Consejo Nacional de Ciencia y Tecnología of Paraguay (CONACYT) and the University Research Scholarship Program Andrés Borgognon Montero (PUBIABM) for institutional support associated with the underlying research line; this acknowledgement does not denote specific grant funding for the present secondary analysis. During manuscript preparation, the authors used Claude Opus 4.8 (Anthropic) and ChatGPT (OpenAI, GPT-5.6 Sol, accessed August 2026) for English-language editing, organization, consistency checking and code-review assistance. The authors reviewed all generated output, independently verified the numerical results and interpretations, and take responsibility for the final content.
Conflicts of Interest
Roberto Martínez-López is founder and director of the Consulting Firm for Specialized Training Linked to Professional and Strategic Research (FELIPE), Luque, Paraguay. The remaining authors declare that the research was conducted in the absence of any commercial or financial relationships that could be construed as a potential conflict of interest.
Abbreviations
| Abbreviation | Meaning |
| BCS | Body condition score |
| BP-LW | Live-weight-weighted biomarker profile |
| BP-BCS | Body-condition-weighted biomarker profile |
| CPK | Creatine phosphokinase |
| CV | Cross-validation |
| GBM | Gradient boosting machine |
| ISA | Antecedent Adaptability Selection Index |
| ISA2 | revised Adaptability Selection Index |
| ISA2-A | Weighted-linear ISA2 |
| ISA2-B | Joint-ideal-distance ISA2 |
| ISA2-C | PCA-based ISA2 |
| PCA | Principal component analysis |
| RF | Random forest |
| RMSE | Root mean squared error |
| SI | Scaled permutation importance |
References
- Martínez-López, R. Estudio de Parámetros Adaptativos de Diferentes Genotipos Bovinos Criados en los Humedales del Ñeembucú y su Área de Influencia, 14-INV-140; Consejo Nacional de Ciencia y Tecnología: Asunción, Paraguay, 2020; 45p.
- Martínez-López, R.; Centurión-Insaurralde, L.M.; Núñez-Yegros, O.L.; Sponenberg, D.P. Protein status in cattle raised in the wetlands of Paraguay during three periods of the year. Rev. Científica Fac. Cienc. Vet. 2022, 32, 1–9. [Google Scholar] [CrossRef] [Scilit]
- Pereira, W.E.; Centurión, L.; Valdez, C.; Martínez-López, R. Machine learning for ranking multivariate variables in cattle breeds raised in Paraguayan wetlands. Rev. Bras. Eng. Agríc. Ambient. 2025, 29, e283168. [Google Scholar] [CrossRef] [Scilit]
- Martínez-López, R.; Centurión, L.M.; Pereira, W.E. Machine learning modelling for weighting and ranking of multiple variables related to genotype-environment interaction: Innovative protocol proposal for selecting breeding cows in wetlands. J. Agric. Sci. 2025, 163, 671–686. [Google Scholar] [CrossRef] [Scilit]
- Bernabucci, U.; Lacetera, N.; Baumgard, L.H.; Rhoads, R.P.; Ronchi, B.; Nardone, A. Metabolic and hormonal acclimation to heat stress in domesticated ruminants. Animal 2010, 4, 1167–1183. [Google Scholar] [CrossRef] [Scilit] [PubMed]
- Colditz, I.G.; Hine, B.C. Resilience in farm animals: Biology, management, breeding and implications for animal welfare. Anim. Prod. Sci. 2016, 56, 1961–1983. [Google Scholar] [CrossRef] [Scilit]
- Roche, J.R.; Friggens, N.C.; Kay, J.K.; Fisher, M.W.; Stafford, K.J.; Berry, D.P. Invited review: Body condition score and its association with dairy cow productivity, health, and welfare. J. Dairy Sci. 2009, 92, 5769–5801. [Google Scholar] [CrossRef] [Scilit] [PubMed]
- Hazel, L.N. The genetic basis for constructing selection indexes. Genetics 1943, 28, 476–490. [Google Scholar] [CrossRef] [Scilit] [PubMed]
- Friedman, J.H. Greedy function approximation: A gradient boosting machine. Ann. Stat. 2001, 29, 1189–1232. [Google Scholar] [CrossRef] [Scilit]
- Breiman, L. Random forests. Mach. Learn. 2001, 45, 5–32. [Google Scholar] [CrossRef] [Scilit]
- Altmann, A.; Toloşi, L.; Sander, O.; Lengauer, T. Permutation importance: A corrected feature importance measure. Bioinformatics 2010, 26, 1340–1347. [Google Scholar] [CrossRef] [Scilit] [PubMed]
- Strobl, C.; Boulesteix, A.-L.; Kneib, T.; Augustin, T.; Zeileis, A. Conditional variable importance for random forests. BMC Bioinform. 2008, 9, 307. [Google Scholar] [CrossRef] [Scilit] [PubMed]
- Kaneko, H. Cross-validated permutation feature importance considering correlation between features. Anal. Sci. Adv. 2022, 3, 278–287. [Google Scholar] [CrossRef] [Scilit] [PubMed]
- Derringer, G.; Suich, R. Simultaneous optimization of several response variables. J. Qual. Technol. 1980, 12, 214–219. [Google Scholar] [CrossRef] [Scilit]
- Marshall, A.W.; Olkin, I.; Arnold, B.C. Inequalities: Theory of Majorization and Its Applications, 2nd ed.; Springer: New York, NY, USA, 2011. [Google Scholar] [CrossRef] [Scilit]
- Jolliffe, I.T.; Cadima, J. Principal component analysis: A review and recent developments. Philos. Trans. R. Soc. A Math. Phys. Eng. Sci. 2016, 374, 20150202. [Google Scholar] [CrossRef] [Scilit] [PubMed]
- Percie du Sert, N.; Hurst, V.; Ahluwalia, A.; Alam, S.; Avey, M.T.; Baker, M.; Browne, W.J.; Clark, A.; Cuthill, I.C.; Dirnagl, U.; et al. The ARRIVE guidelines 2.0: Updated guidelines for reporting animal research. PLoS Biol. 2020, 18, e3000410. [Google Scholar] [CrossRef] [Scilit] [PubMed]
- R Core Team. R: A Language and Environment for Statistical Computing; R Foundation for Statistical Computing: Vienna, Austria, 2026; Available online: https://www.R-project.org/ (accessed on 15 August 2026). [CrossRef] [Scilit]
- Zou, H.; Hastie, T. Regularization and variable selection via the elastic net. J. R. Stat. Soc. Ser. B Stat. Methodol. 2005, 67, 301–320. [Google Scholar] [CrossRef] [Scilit]
- Becker, C.A.; Aghalari, A.; Marufuzzaman, M.; Stone, A.E. Predicting dairy cattle heat stress using machine learning techniques. J. Dairy Sci. 2021, 104, 501–524. [Google Scholar] [CrossRef] [Scilit] [PubMed]
- Ribeiro, L.A.C.; Bresolin, T.; Rosa, G.J.M.; Casagrande, D.R.; Danes, M.A.C.; Dórea, J.R.R. Disentangling data dependency using cross-validation strategies to evaluate prediction quality of cattle grazing activities using machine learning algorithms and wearable sensor data. J. Anim. Sci. 2021, 99, skab206. [Google Scholar] [CrossRef] [Scilit] [PubMed]
- Cartwright, S.L.; Schmied, J.; Karrow, N.; Mallard, B.A. Impact of heat stress on dairy cattle and selection strategies for thermotolerance: A review. Front. Vet. Sci. 2023, 10, 1198697. [Google Scholar] [CrossRef] [Scilit] [PubMed]
- Vieira, R.; Louvandini, H.; Barcellos, J.; Martins, C.F.; McManus, C. Path and logistic analysis for heat tolerance in adapted breeds of cattle in Brazil. Livest. Sci. 2022, 258, 104888. [Google Scholar] [CrossRef] [Scilit]
- Vieira, R.A.; Dias, E.A.; Stumpf, M.T.; Pereira, G.R.; Barcellos, J.O.J.; Kolling, G.J.; McManus, C. Use of thermography and physiological rate to assess heat tolerance in cattle breeds. Trop. Anim. Health Prod. 2023, 55, 223. [Google Scholar] [CrossRef] [Scilit] [PubMed]
- Silveira, R.M.F.; Façanha, D.A.E.; McManus, C.; Bermejo Asensio, L.A.; Álvarez Ríos, S.; da Silva, I.J.O. Intelligent methodologies: An integrated multi-modeling approach to predict adaptive mechanisms in farm animals. Comput. Electron. Agric. 2024, 216, 108502. [Google Scholar] [CrossRef] [Scilit]
- Reolon, H.G.; Abduch, N.G.; de Freitas, A.C.; Silva, R.M.O.; Fragomeni, B.O.; Lourenco, D.; Baldi, F.; de Paz, C.C.P.; Stafuzza, N.B. Proteomic changes of the bovine blood plasma in response to heat stress in a tropically adapted cattle breed. Front. Genet. 2024, 15, 1392670. [Google Scholar] [CrossRef] [Scilit] [PubMed]
- da Costa Silva, A.M.G.; Pandorfi, H.; da Silva, W.A.; Moraes, A.S.; Pereira, H.J.L.; de Almeida, G.L.P.; Machado, N.A.F.; Ferreira, M.B.; da Silva, M.V. Machine Learning Models for Estimating Physiological Indicators of Thermal Stress in Dorper Rams in the Brazilian Semi-Arid Region. Ruminants 2025, 5, 61. [Google Scholar] [CrossRef] [Scilit]
- Schmeling, L.; Thurner, S.; Erhard, M.; Rauch, E. Physiological and Behavioral Reactions of Simmental Dairy Cows to Increasing Heat Load on Pasture. Ruminants 2022, 2, 157–172. [Google Scholar] [CrossRef] [Scilit]
- Bengtsson, C.; Thomasen, J.R.; Kargo, M.; Bouquet, A.; Slagboom, M. Emphasis on resilience in dairy cattle breeding: Possibilities and consequences. J. Dairy Sci. 2022, 105, 7588–7599. [Google Scholar] [CrossRef] [Scilit] [PubMed]
- Poppe, M.; Mulder, H.A.; van Pelt, M.L.; Mullaart, E.; Hogeveen, H.; Veerkamp, R.F. Development of resilience indicator traits based on daily step count data for dairy cattle breeding. Genet. Sel. Evol. 2022, 54, 21. [Google Scholar] [CrossRef] [Scilit] [PubMed]
- Chen, S.Y.; Boerman, J.P.; Gloria, L.S.; Pedrosa, V.B.; Doucette, J.; Brito, L.F. Genomic-based genetic parameters for resilience across lactations in North American Holstein cattle based on variability in daily milk yield records. J. Dairy Sci. 2023, 106, 4133–4146. [Google Scholar] [CrossRef] [Scilit] [PubMed]
- Siachos, N.; Lennox, M.; Anagnostopoulos, A.; Griffiths, B.E.; Neary, J.M.; Smith, R.F.; Oikonomou, G. Development and validation of a fully automated 2-dimensional imaging system generating body condition scores for dairy cows using machine learning. J. Dairy Sci. 2024, 107, 2499–2511. [Google Scholar] [CrossRef] [Scilit] [PubMed]

Disclaimer/Publisher’s Note: The statements, opinions and data contained in all publications are solely those of the individual author(s) and contributor(s) and not of MDPI and/or the editor(s). MDPI and/or the editor(s) disclaim responsibility for any injury to people or property resulting from any ideas, methods, instructions or products referred to in the content. |
© 2026 by the authors. Licensee MDPI, Basel, Switzerland. This article is an open access article distributed under the terms and conditions of the Creative Commons Attribution (CC BY) license.