


Abstract
With the continuous rise in global temperatures, particularly within arid regions, maintaining thermal comfort in naturally ventilated buildings presents a significant challenge. This study investigates the effectiveness of biomaterial-infused bricks in mitigating indoor overheating in low-income residential buildings. The findings indicate that all tested bio-brick families contribute to a notable reduction in unmet thermal comfort hours compared with conventional clay bricks. The best-performing composition in both periods was 10% date palm pit polyhydroxybutyrate (DPP PHB). Compared with conventional clay brick, it removed 284 unmet comfort hours in 2024, equal to 5.5 percentage points of summer hours or a 10.5% reduction relative to the base case, and 389 h under the 2080 scenario, equal to 7.6 percentage points and a 10.4% relative reduction. Peak operative temperature fell by 2.49 °C and 2.11 °C. The research integrates both empirical field measurements and simulation-based analyses using Design-Builder software (7.3.0.046) to assess the thermal behavior of various bio-brick compositions incorporating paper waste, tea waste, rice husk, sugar bagasse, corn cob, and date palm pit with polyhydroxybutyrate. Thermophysical properties for all compositions were taken from previously published experimental studies. No specimens were manufactured or tested in this work. The simulations employed weather data for 2024 alongside future climate projections based on the IPCC 2080 (Intergovernmental Panel on Climate Change) A2 high-emission scenario. Even under the best-performing composition, operative temperature stayed outside the adaptive comfort boundaries for 47.3% of summer hours in 2024, rising to 65.4% under the 2080 scenario. While bio-bricks alone cannot eliminate discomfort hours, their demonstrated effectiveness highlights their potential as a key component within broader passive cooling strategies.
1. Introduction
Excessive heat is the foremost barrier to thermal comfort in hot arid regions, jeopardizing health and productivity, and climate change is amplifying this threat by driving up outdoor temperatures and worsening indoor conditions. Many communities lack efficient cooling, so higher ambient temperatures overload existing systems, push electricity demand upward, and raise associated emissions. Because the buildings and construction sector accounts for roughly one third of global final energy use and a comparable share of energy-related CO2 emissions [1], this sector is central to any mitigation effort within Egypt. This research directs its focus to residential buildings, constituting a substantial 83.2% of the total building inventory in Egypt, totaling 13.46 million structures [2]. The annual electricity consumption of these residential buildings amounts to 62,393 GWH (62.4 TWH), representing 40.46% of the overall electricity usage in Egypt [3].
1.1. Energy Consumption for Residential Buildings in Developing Countries and the Energy Crisis
The accelerating impacts of climate change, coupled with rapid urbanization and growing energy demands, have amplified the urgency for sustainable building strategies. In hot arid climates, where high temperatures and intense solar radiation prevail. Residential buildings overcome the intense heat with mechanical ventilation or air conditioning to mitigate the elevated heat. Consequently, this surge in cooling energy use not only escalates energy expenditures and places additional pressure on energy infrastructure but also contributes to increased greenhouse gas emissions, further intensifying climate change impacts. Passive envelope measures deliver large reductions in cooling energy in hot arid climates, although the evidence indicates they seldom hold comfort unaided through peak summer conditions [4,5]. Egypt’s building sector is projected to consume even more energy as global warming intensifies cooling needs; with global warming, non-air-conditioned buildings are increasingly turning to air-conditioning as the default strategy for maintaining comfort. Existing literature in Egypt has largely examined traditional and bio-based building materials in isolation, or focused solely on future climate scenarios, but almost always through the narrow perspective of electricity demand [6,7], assuming air-conditioning or mechanical ventilation to restore comfort [8]. Studies that project future weather scenarios typically use conventional construction materials or add industrial insulation, whereas investigations of biomaterials restrict their analysis to present-day climatic conditions [9]. As a result, the literature still cannot explain whether bio-based bricks can offset the additional heat stress expected under mid- and late-century warming. Moreover, the few works that examine passive biomaterial solutions focus almost exclusively on sugar bagasse, rice husk, or untreated date palm fibers, neglecting other readily available residues in Egypt, such as corncob, paper waste, tea waste, or chemically modified date palm fibers, and offering no comparative assessment of their relative thermal performance. Additionally, most literature reviews have not focused on Toperative and unmet hours in non-air-conditioned buildings despite being the main factors affecting the indoor main conditions without relying on mechanical ventilation. This combined lack of forward-looking evaluation, even though any future adoption of passive solutions, whether through bio-based materials or retrofitting, will necessarily occur under climatic conditions projected to be considerably warmer than those of the present and material diversity leaves a substantial research gap, particularly for Egypt’s low-income, predominantly unconditioned housing stock, which the present study aims to fill.
1.2. Global Warming, Increasing Outdoor Air Temperature, and Solar Radiation
Climate change, defined as significant and lasting alterations in global temperatures and weather patterns, is largely attributed to human-induced activities, specifically the emission of greenhouse gases such as carbon dioxide (CO2), methane (CH4), and nitrous oxide (N2O) [10]. The Intergovernmental Panel on Climate Change (IPCC) highlights that activities, including fossil fuel combustion, deforestation, and industrial processes, have resulted in atmospheric CO2 concentrations surpassing 400 ppm, levels unprecedented in at least 800,000 years [10,11]. These elevated greenhouse gas concentrations enhance the Earth’s natural greenhouse effect, causing global warming, with the global mean surface temperature already rising approximately 1.1 °C above pre-industrial levels [12].
The implications of global warming are extensive, impacting ecosystems, human health, and the built environment. Elevated temperatures accelerate sea-level rise, enhance the frequency and intensity of extreme weather events such as heatwaves, floods, and storms, and disrupt precipitation patterns [13,14]. According to climate projections, persistent greenhouse gas emissions could lead to global temperature increases of 2.5 °C to 4.5 °C by 2100, significantly exacerbating current impacts [10]. Consequently, research prioritizing adaptive strategies in which sustainable development practices have become crucial across multiple scientific and policy-driven disciplines [15,16].
Global warming significantly impacts the built environment, particularly in hot arid regions, by exacerbating thermal discomfort, elevating cooling demands, and increasing energy consumption. Higher ambient temperatures intensify the Urban Heat Island (UHI) effect, causing cities to experience disproportionately elevated heat levels, which compromise indoor thermal comfort and lead to increased reliance on mechanical cooling systems [17]. Addressing these challenges necessitates the implementation of climate-responsive design strategies and sustainable building practices to enhance passive cooling potential and mitigate energy demands [17,18].
1.3. Future Weather Conditions and Climate Change Scenarios
Projected climate change scenarios across arid regions, such as those of the Middle East and North Africa, forecast intensifying temperature trends that significantly affect building performance and indoor thermal comfort. Numerous studies have evaluated future climate projections using a range of simulation tools and emission scenarios, with findings consistently pointing to worsening thermal conditions indoors.
One of the models used to forecast future weather is the HadCM3 model, using different scenarios under the model. HadCM3 model stands for the Hadley Centre Coupled Model version 3, developed in 1999 and was the first unified model climate configuration not to require flux adjustments (artificial adjustments applied to climate model simulations to prevent them drifting into unrealistic climate states). This model was one of the major models used in the IPCC Third and Fourth Assessments, and contributes to the Fifth Assessment. Its simulation of current climate without using flux adjustments was a major advance and it still ranks highly compared with other models in this respect [19].
The IPCC AR3 [20], IPCC AR4 [21] (IPCC Assessment Report 3-IPCC Assessment Report 4) employed emission scenarios that are used within the model, featuring a range of atmospheric carbon dioxide concentrations at 2100 between 540 and 970 ppm. The emission scenarios include four qualitative storylines or ‘families’: A1, A2, B1, and B2. The A1 family envisions a future characterized by rapid economic growth, a global population that peaks in midcentury and subsequently declines, and the swift introduction of new and more efficient technologies. In contrast, the A2 family paints a picture of a highly heterogeneous world, emphasizing self-reliance and the preservation of local identities. The B1 family outlines a convergent world where the global population peaks in mid-century and decreases thereafter, akin to the A1 storyline. However, it diverges by foreseeing rapid changes in economic structures towards a service and information economy, accompanied by reductions in material intensity and the introduction of clean and resource-efficient technologies. Conversely, the B2 family places emphasis on local solutions to economic, social, and environmental sustainability.
In the previous literature review, the model was deployed to predict future climate and its impact on buildings. Rubio-Bellido [22] employed the HadCM3 model under the A2 scenario to assess the impact of future climate conditions on office buildings in Chile using Energy-Plus. The average dry bulb temperature (DBT, °C) is projected to rise across all studied locations, with the most significant increases anticipated in five warmer climates. Specifically, by 2080, the temperature is expected to rise by an average of 3.6 °C.
Abuhussain [23] examined two residential buildings in Jeddah, Saudi Arabia, under A2, A1B, and B1 scenarios using Metronome 7 for weather projections and Design-Builder for simulation. It concluded that while Saudi residential codes improved envelope performance under current conditions, indoor thermal discomfort would still escalate by 2080 under projected warming. Regarding Saudi Arabia, the study indicated that due to ongoing climate trends, by 2041, the country’s average temperature increase will surpass the global average. Additionally, Almazroui [24] projected that Saudi Arabia’s mean temperature would rise by approximately 0.72 °C per decade, resulting in an overall temperature increase ranging from 2.0 °C to 2.75 °C by 2050.
In the United Arab Emirates (UAE), Radhi [25] used projected temperature rises up to 5.9 °C by 2100 to simulate building performance. The UAE’s climate is characterized by two distinct seasons. The winter season spans from November to March, with temperatures rarely falling below 6 °C, while summers are notably dry, experiencing temperatures up to around 48 °C in coastal regions. The impact of outdoor air temperatures on cooling and heating energy consumption is quantified using degree-days; cooling degree-days rise substantially due to warmer temperatures. By 2050, cooling degree-days are projected to increase by approximately 16% to 27%, and by 2100, this increase could reach between 22% and 42%. Furthermore, global warming scenarios indicate that residential cooling energy demand in the UAE could rise by about 23.5% if average temperatures increase by 5.9 °C, highlighting the challenges posed by highly glazed façades and insufficient shading. Zhang et al. [26] provided essential context with historical data, revealing that maximum daily temperatures, warm nights, and heatwaves have steadily increased across 15 Middle Eastern countries from 1950 to 2003, supporting the urgency of future-focused mitigation strategies.
2. Biomaterial
Bio-bricks have emerged as a promising passive building material due to their low thermal conductivity, which helps limit heat transfer and maintain relatively cooler indoor temperatures.
2.1. Bio-Bricks with Agro-Waste Additives
Bio-bricks made from agricultural waste like rice straw and sugarcane bagasse offer environmental benefits and can reduce operational energy use by 7–12% [9]. Thermal evaluations show that bio-brick systems can reduce indoor heat flux by 8 °C to 15 °C, with simulations confirming their thermal and structural reliability [27]. Furthermore, bio-bricks offer a passive, sustainable solution for lowering indoor temperatures and improving thermal comfort in hot climates [28]. Kazmi et al. [29] demonstrated that incorporating Rice Husk Ash (RHA) and Sugarcane Bagasse Ash (SBA) into clay bricks at dosages up to 15% led to a reduction in thermal conductivity by up to 31%, with consistent reductions in internal wall temperatures. Another study demonstrated that the incorporation of agro-waste materials, specifically sugarcane bagasse ash (SBA) and rice husk ash (RHA), into burnt clay bricks resulted in the development of lightweight masonry units with improved thermal performance and reduced heat transfer. Similarly, Khoudja et al. [30] explored raw earth bricks for passive climate adaptation and found that even without stabilization, the addition of plant-based aggregates improved thermal diffusivity and indoor thermal inertia.
Abd El-Hady et al. [9] applied future climate scenarios to buildings in Egypt using Design-Builder, showing that bio-bricks made from sugarcane bagasse and rice straw effectively reduced indoor Toperative across Cairo, Alexandria, and Aswan. Rice straw cement bricks and sugarcane bricks exhibit operational efficiency improvements of approximately 7% and 12%, respectively. These enhancements, compared with traditional bricks, also help reduce greenhouse gas emissions and carbon dioxide output.
2.2. Bio-Bricks with Paper Waste
Sutcu et al. [31] optimized hollow clay bricks using recycled paper waste, achieving thermal conductivity as low as 0.39 W/m·K compared with 0.68 W/m·K for traditional clay bricks.
2.3. Bio-Bricks with Agro-Waste and Polyester Insulations
Mlhem et al. [32] reported that a date pit-based bio-polyester composite achieved ultra-low thermal conductivity (0.086 W/m·K), suitable for non-structural insulating applications. Saman et al. [33] tested bricks using rice husk, corn cob, and waste tea, observing thermal conductivity values below 0.4 W/m·K, aligning with Malaysian standards for energy-conscious building envelopes.
When additives derived from agro-waste, paper, or a combination of agro-waste with insulation are added to burned clay, a clear improvement in thermal behavior is observed, as shown in the above literature review. These additives enhance the brick’s performance in reducing heat gain through the walls, thereby lowering cooling energy demand. According to the literature, various metrics are used to measure these results, with the main parameter being the thermal conductivity of the brick, which directly affects its thermal behavior. However, the overall results depend on several factors, such as the amount of heat gained from external temperatures, the intensity of solar radiation, and the duration of wall exposure to sunlight. Any improvement in thermal behavior ultimately enhances performance, which can be measured through factors such as the indoor temperature, the decrease in thermal conductivity, or the total reduction in annual electricity consumption for cooling.
These bio-brick innovations not only mitigate the effects of global warming on indoor thermal comfort but also align with sustainable development goals by reducing embodied energy, repurposing waste, and supporting local economies. Their thermal performance under future weather conditions validates their potential as a long-term adaptation strategy, capable of mitigating the intensifying effects of climate change on indoor thermal environments.
This research investigates clay bricks and limestone bricks that are infused with varying percentages of biomaterial. The biomaterial additives, all considered readily available in Egypt, include five main families—sugar bagasse, corn cob, rice husk, tea waste, and paper waste—as well as date palm and date palm pit (DPP) filled with polyhydroxybutyrate. The thermal property values for these bricks, such as conductivity and specific heat, are extracted from previously published studies that measured and compared the properties of biomaterial-infused bricks. Using 100% clay in brick production results in a well-established set of thermal and mechanical properties, including specific values for density, thermal conductivity, and specific heat. However, when 10% of the clay content is replaced with biomaterial, those properties begin to shift due to the inherently different characteristics of the added substance. In particular, the biomaterial may lower the overall density, modify thermal conductivity as shown in Table 1, and alter the ability of the brick to store and transfer heat. As a result, the brick’s performance under real-world conditions changes, creating a measurable distinction between bricks made entirely of clay and those partially composed of biomaterial. Within a given family, the reported properties do not scale in proportion to additive content, and the source studies report diminishing returns at higher dosages.
Table 1.
Bio-brick material and properties (source [30,31,32,33,34]).
Additive percentages are reproduced from the source studies and serve to identify each composition. They are not independent variables in the simulations, which take thermal conductivity, density and specific heat as inputs. The source studies differ in material system and in the basis on which percentage is expressed, so percentages are comparable within a family and are not compared between families.
This research investigates the use of different biomaterial families that will be added to clay in different percentages, with each bio-brick’s thermal and physical properties referenced from previously published studies. The focus is on using bio-bricks to enhance indoor thermal conditions under future weather scenarios; particular attention is given to validating and comparing the bricks’ thermal parameters derived from the literature in mitigating heat rise due to global warming. Instead of conducting separate validation to determine thermal properties, this study adopts average specific heat values reported in the literature. When a specific heat value is not available, the default standard value of 840 J/kg·K from Design-Builder is used to maintain consistency across the simulation process.
Global warming is increasing indoor overheating and thermal discomfort in free-running, low-income housing in hot, arid regions. While previous studies have investigated the thermal properties of individual biomaterial bricks, limited research has compared multiple biomaterial families under future climate scenarios or assessed their effectiveness in reducing unmet thermal comfort hours in non-air-conditioned buildings. To address this gap, this study evaluates a range of biomaterial-infused clay bricks with thermal and physical properties obtained from published literature and investigates their performance under current (2024) and projected future (2080) weather conditions. The objective is to identify the most effective bio-brick compositions for improving indoor thermal comfort and enhancing building resilience to climate change. This study is a simulation-based comparative screening of envelope options. The thermophysical properties are literature-derived, so the accuracy of the comparison is bounded by the accuracy of those published values.
3. Codes, Standards and Simulation Program
3.1. Indoor Thermal Comfort (TComfort, Unmet H, Toperative) Standard
Although several references exist for defining thermal comfort zones, this study adopts the adaptive method detailed in ASHRAE Standard 55-2023 [35] (ASHRAE-, Thermal Environmental Conditions for Human Occupancy 2023). Under this method, the acceptable indoor Toperative for naturally conditioned, occupant-controlled spaces is tied to the running mean outdoor air temperature (Trm) as shown in Equation (1), and the range for that standard is used to calculate the indoor comfort temperature when the mean outside temperature is within a 10 °C to 33.5 °C range.
Where Tcomfort in Celsius is often approximated by
Tcomfort = 0.31Trm + (17.8)
Trm = the running mean outdoor air temperature; Tcomfort = Temperature comfort limit for indoor air [35].
The method applies only if there is no mechanical cooling system installed, no heating system is in operation, occupant metabolic rates range from 1.0 to 1.3 met, and occupants are free to adjust their clothing within 0.5 to 1.0 Clo. Under these conditions as defined by ASHRAE Standard 55, the comfort limit is not a fixed value. It tracks the running mean outdoor temperature. For 80% acceptability, the band is T_comfort ± 3.5 K, so across the applicability range of the method (10 °C ≤ T_rm ≤ 33.5 °C) the limits span 17.4 °C at the lower extreme and 31.7 °C at the upper. Unmet hours in this study are evaluated against the hourly varying upper limit, with a fixed-threshold evaluation.
EREC (Egyptian Energy Code for Residential Buildings)
The Egyptian Residential Energy Code (EREC) classifies the country into eight climatic zones, each with specific recommendations for thermal insulation and prescribed R-values for ceilings and walls. These requirements vary according to building orientation and whether the structure is designed for air-conditioned or non-air-conditioned operation. In this study, reference is made to the second climatic zone, which encompasses Cairo and the Delta region. The analysis focuses on non-air-conditioned buildings with a southwest orientation, considering the prescribed composition of external walls and the typical floor/ceiling construction recommended by the code shown in Table 2.
Table 2.
EREC external wall, floor and ceiling layers.
3.2. Bricks Thermal Behavior
One of the main thermal properties that will highly affect the simulation is the specific heat (C), typically measured in {J/kg·K}, as defined in Equation (2) as the amount of heat required to raise the temperature of one kilogram of a material by one degree Celsius (or Kelvin). It is an empirical value and can be determined by measuring the heat input (Q) needed to achieve a known temperature change (ΔT) in a sample of mass.
Q = heat input, m = mass, ΔT = Change in Temperature due to Q [36].
Because it is an empirical value, specific heat may differ within homogeneous materials (e.g., due to temperature dependence) and can vary even more significantly in non-homogeneous materials or when additives are introduced as biomaterial additives. Furthermore, thermal diffusivity (α)—measured in m2/s is related to the thermal conductivity (k), density (ρ), and specific heat (C) of a material; rearranging this, as depicted in Equation (3), to solve for C yields:
C = Specific heat, ρ = Density, α = thermal diffusivity, K = Thermal Conductivity [36].
Specific heat, thermal conductivity and density are independently measurable properties of a material, and thermal diffusivity is derived from them as α = k/(ρC). Equation (3) is used here only to recover C, where a source reports α, k and ρ without stating C directly [36]. When clay bricks are produced with a percentage of biomaterial additives, the resulting composite structure becomes non-homogeneous, which can cause variations in its thermal properties. This non-uniform composition leads to a range of thermal diffusivity values, since both the thermal conductivity (k) and density (ρ) are influenced by the added biomaterial. In turn, specific heat (C) may vary across different samples, reflecting changes in both the inorganic clay matrix and organic components. Consequently, even when using a similar manufacturing process, these bricks may exhibit a spectrum of thermal behavior rather than a single, fixed property value and this range for (C) Specific heat is discussed in Various literature [29,30,31,32]. Also, the way the Brick manufactured and the amount of time and temperature of firing to dry the brick can result in a difference in the thermal properties for the end product, as “In contrast, porosity and absorption decrease with an increase in firing temperature. Other effects of bagasse addition include a decrease in thermal conductivity of the clay brick and a decrease in heat conduction,” as concluded by Janbuala [34]. Each bio-brick’s thermal and physical properties were referenced from previously published work. Since the focus is on using bio-bricks to enhance indoor thermal conditions under future weather scenarios, particular attention was given to validate and compare the bricks rather than performing independent validation. Thermal properties were established using literature-derived parameters.
DesignBuilder Simulation Program
Design-Builder, paired with the Energy-Plus simulation engine, is widely used in architectural and engineering practice for analyzing building energy performance. Energy-Plus, developed by the U.S. Department of Energy, enables detailed simulation of thermal behavior, HVAC systems, and energy use across varying climate and occupancy scenarios [37]. Design-Builder acts as an intuitive interface for Energy-Plus, offering user-friendly modeling tools to define geometry, materials, internal loads, and mechanical systems [38]. This integration supports assessments of thermal comfort and compliance with ASHRAE 55-2023 standards. Studies have validated the accuracy of this combined approach by comparing simulated outputs to real-world measurements [39,40], making it valuable for both new building design and retrofit analysis.
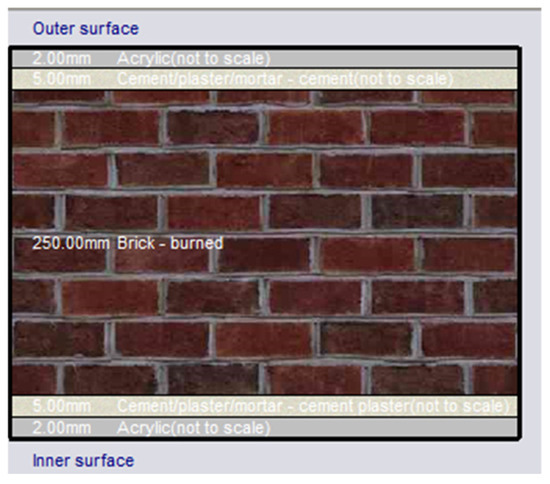
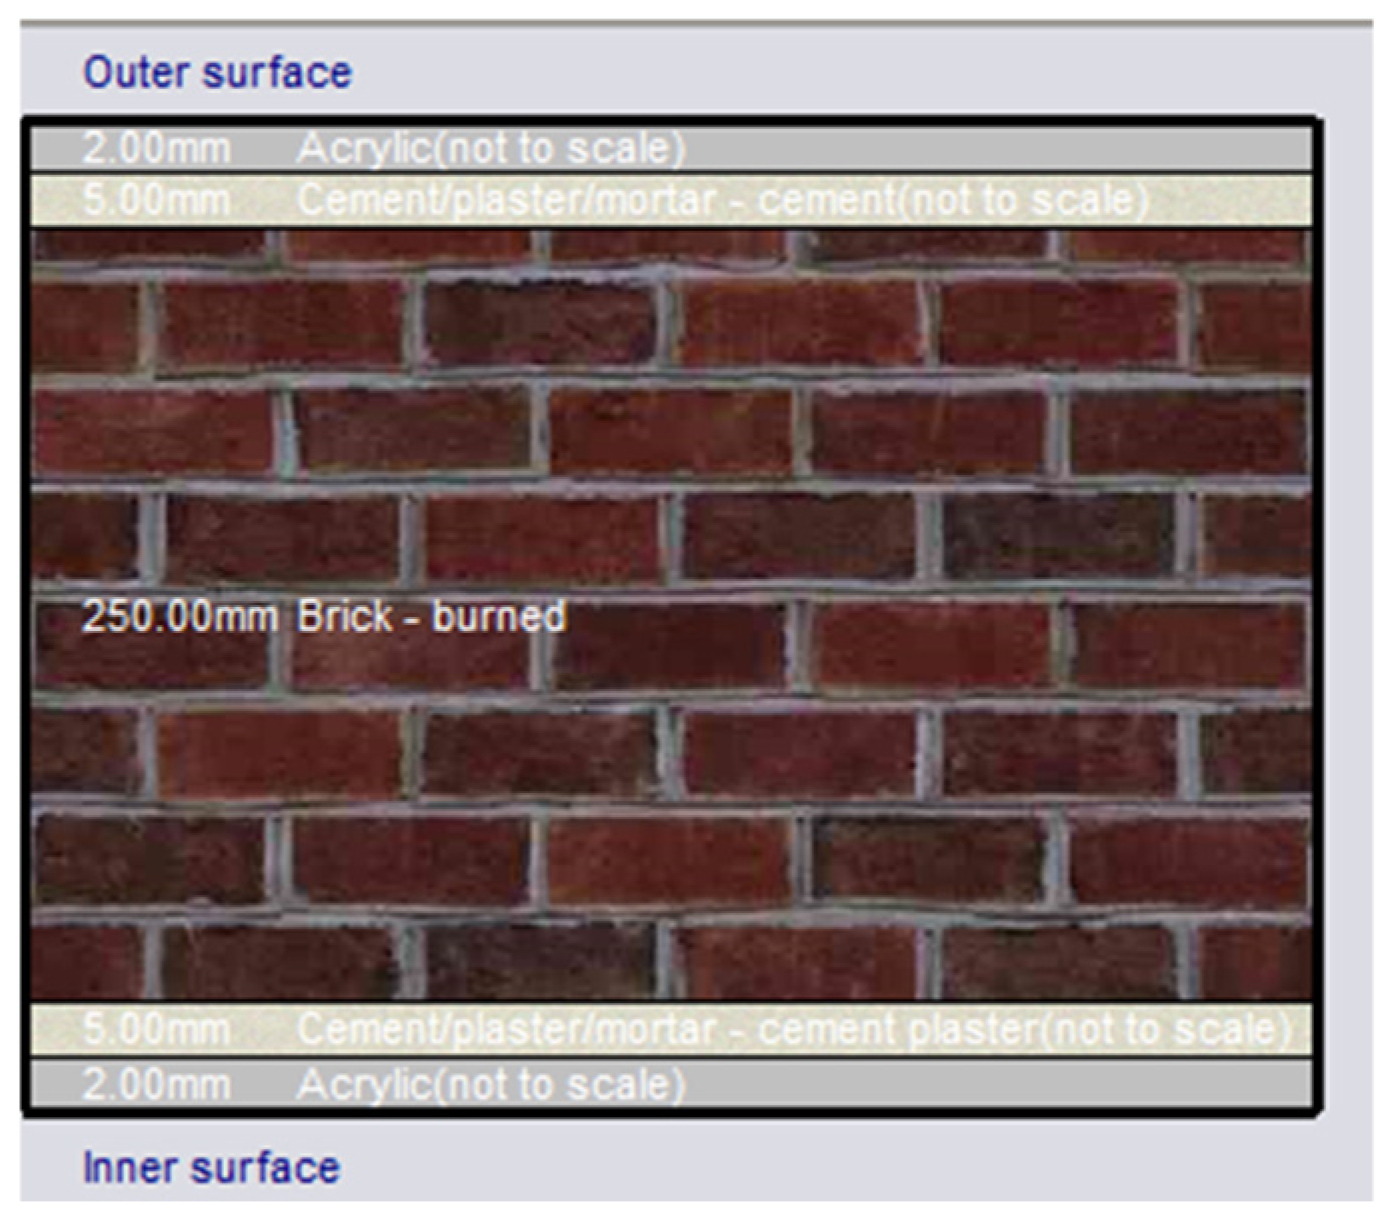
The digital model base case is modeled in accordance with EREC (Egyptian Energy Code for Residential Buildings), in which the external wall is constructed as visualized in Figure 1, which was exported from Design-Builder. The external wall assembly consists of five distinct layers, listed from the outermost to the innermost, as shown in Table 2.
Figure 1.
Design-Builder outer wall layering construction (by author).
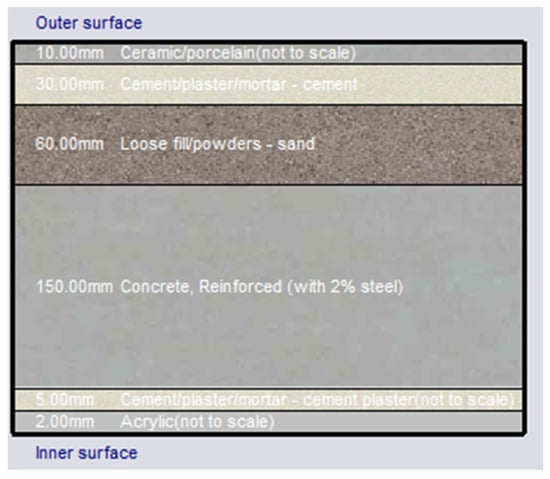
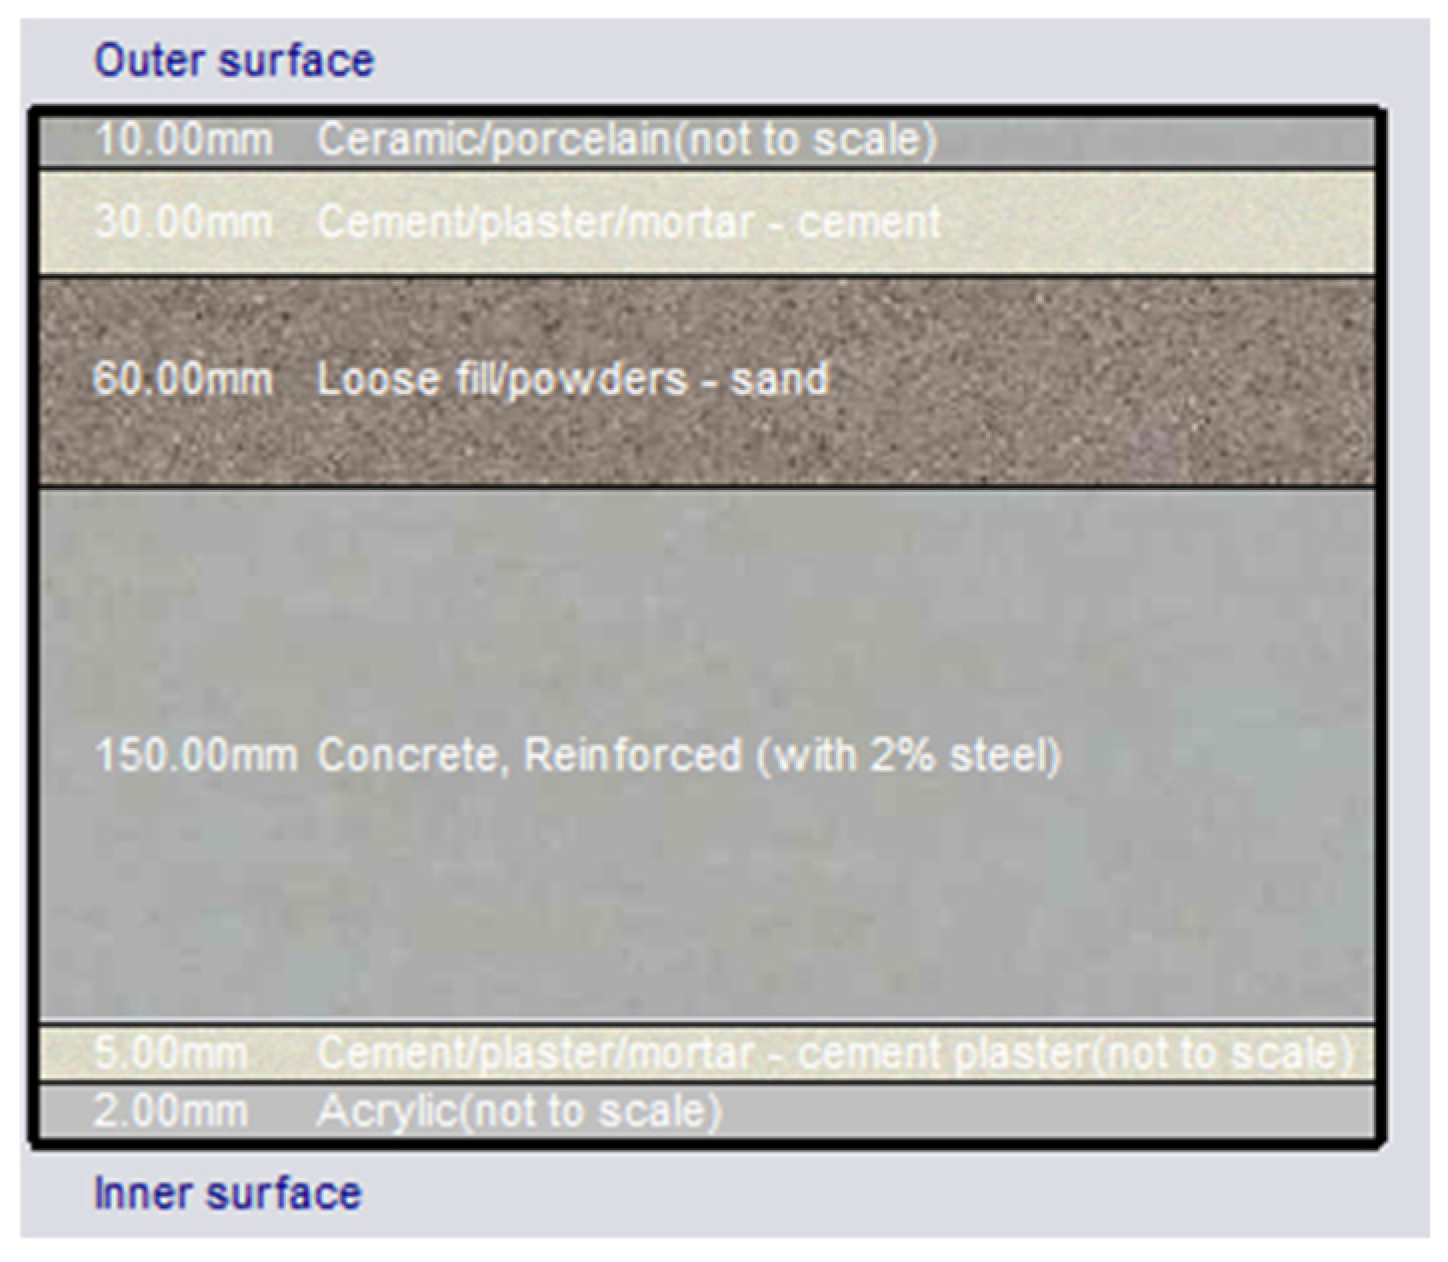
For the typical floor and ceiling, it will be typical but mirrored, as the floor for a middle floor will be the ceiling for the lower floor. The assembly comprises six layers, as depicted in Figure 2. Shown below in descending order, with each layer’s thickness indicated in meters as shown in Table 2. For the bio-brick, the same brick dimensions are used as the standard brick currently in use in normal buildings in Egypt. The U-values for external wall layers (surface-to-surface) for the base case and examined bricks are illustrated in Table 3.
Figure 2.
Design-Builder typical floor layering construction (by author).
Table 3.
The U-value for examined external walls.
The model parameters are fixed to serve as a constant baseline for building behavior comparison, ensuring that the results remain comparable across different building scenarios without being influenced by external factors such as occupancy patterns or internal heat gains, as shown in Table 4.
Table 4.
Model parameters.
The zone is modeled as sealed and unoccupied by design, in order to isolate envelope performance from occupant behavior and internal gains. Under this controlled condition, the adaptive limits of ASHRAE 55 serve as a fixed comfort reference for comparing envelopes rather than as a compliance assessment of occupied performance. The validation period was conducted under the same unoccupied, closed condition, so the calibrated model and the comparison scenarios share a consistent boundary specification. Focusing on a low-income housing building, the selection of this apartment model was made as it accounts for most newly constructed dwellings in Egypt. Although low-income buildings in Egypt do not strictly require following the EREC, this research uses the base case as specified by the code for comparison.
The Design-Builder model places the apartment on a typical third floor. The side apartment under investigation features a living room oriented to the southwest. This orientation is recognized as the least favorable in Cairo. In the base case, the structural layer’s match those originally specified for clay bricks, while the biomaterial bricks (infused with biomaterial yet maintaining the same dimensions as standard clay bricks) are introduced for comparative analysis. For internal walls that partition spaces within the apartment, a typical inner wall configuration is retained, using the same layers as the base-case wall layer but employing a 12.5 cm clay brick instead of 25 cm, as shown in the wall layering order in Figure 1.
A detailed study of parameters illustrated with grouped control variables and fixed parameters is shown in Table 5.
Table 5.
Study parameters, grouped as controlled variables, fixed parameters and output indicators.
4. Research Methodology
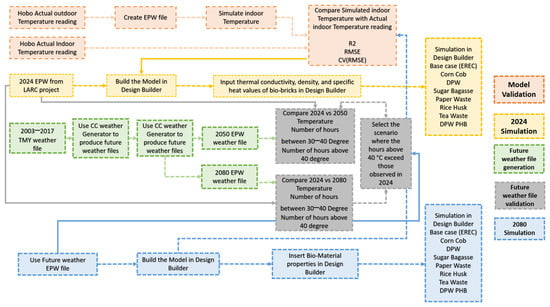
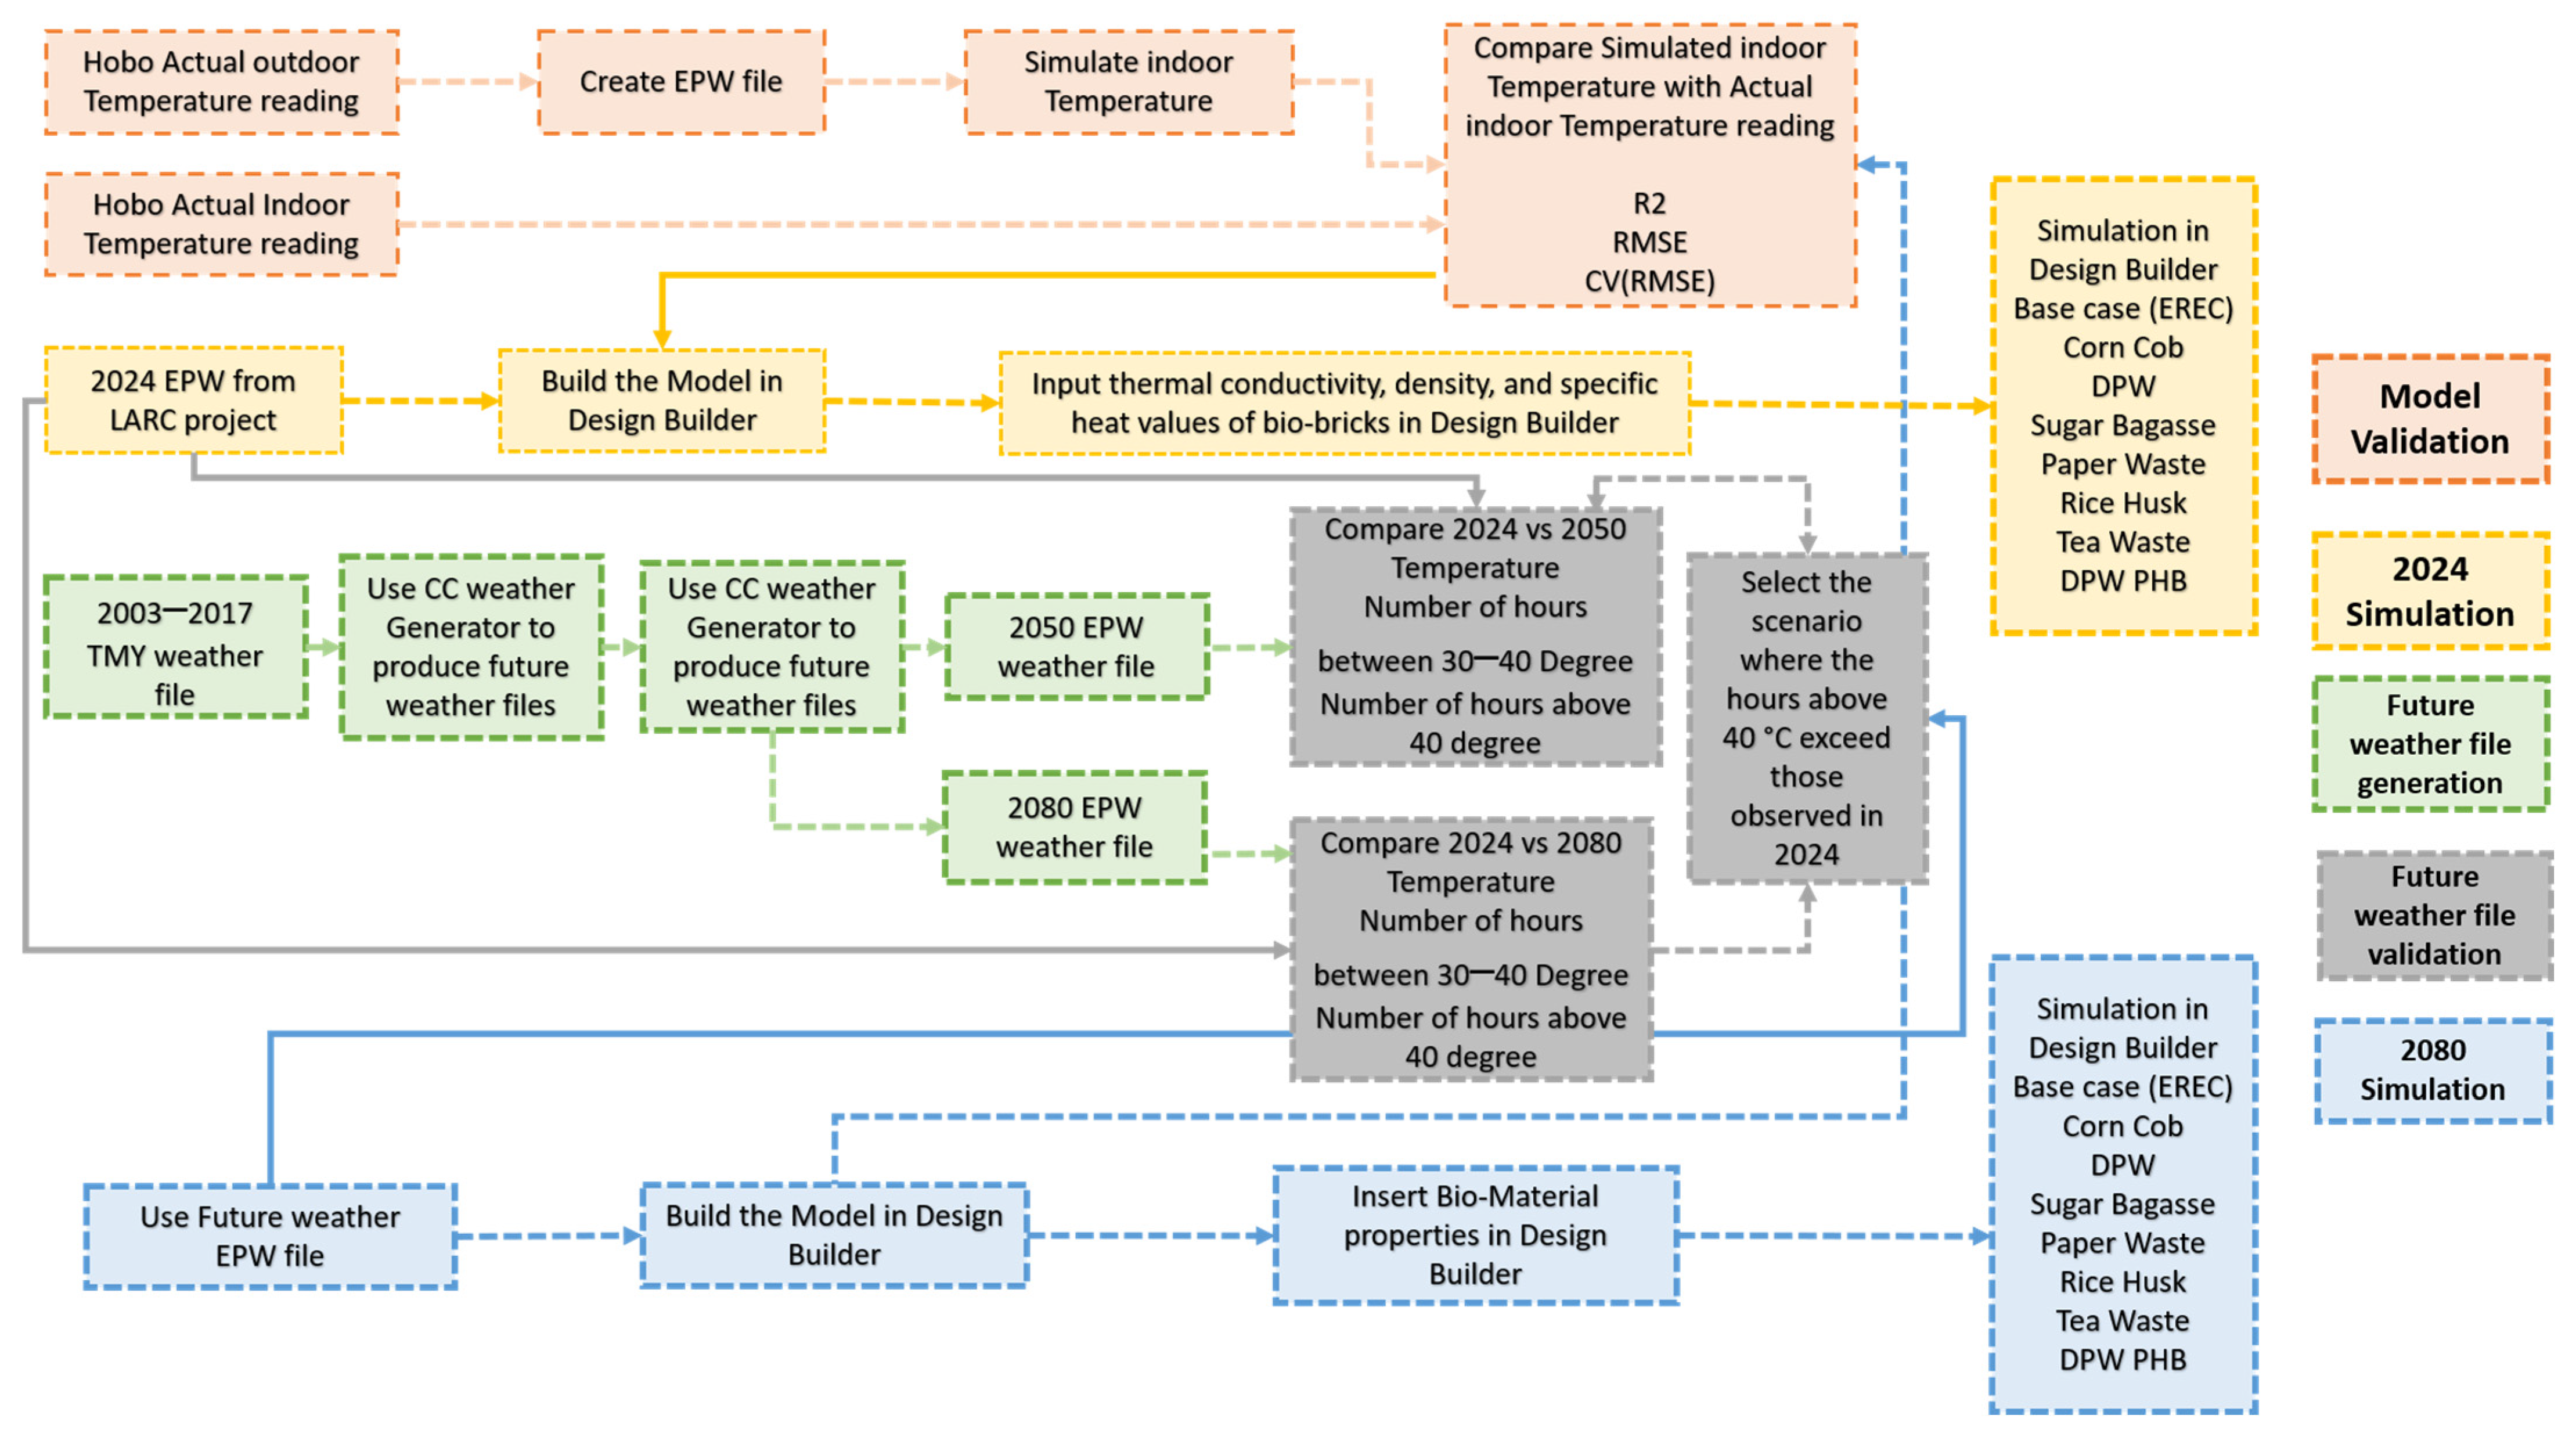
As depicted in Figure 3, the sequential steps are: model validation, 2024 simulation, generation and validation of future weather files, and 2080 simulations. The workflow details the process followed in this study, beginning with the collection of on-site indoor and outdoor temperature data. Model creation and validation achieved a correlation (R2) of 0.915, a root mean square error (RMSE) of approximately 2 °C, and a coefficient of variation in RMSE (CV(RMSE)) of 7.47%. Following validation, a base-case simulation design was developed in accordance with the Egyptian Residential Energy Code (EREC) for Cairo’s climatic zone. Alternative bio-brick materials, including rice husk, bagasse, tea waste, paper waste, corncob, and date palm waste, were used instead of clay brick in the 2024 simulations employing both conventional and bio-bricks. Then, the generation and validation of future weather files identified 2080 as the selected future scenario, as the 2050 forecast was not significantly worse than current 2024 weather conditions. Simulations for 2080 were conducted, and a comparative analysis of bio-brick usage was performed under current and future scenarios to assess the impact of biomaterial use on unmet comfort hours and the relative effectiveness of bio-bricks under projected climate conditions.
Figure 3.
Flow chart for research methodology.
4.1. Case Study Selection and Description
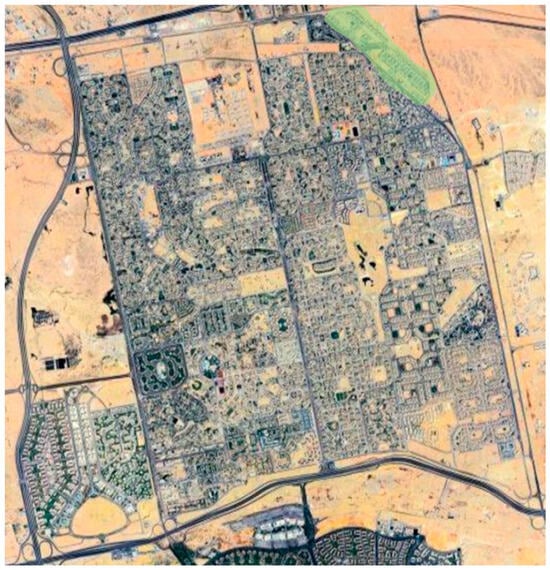
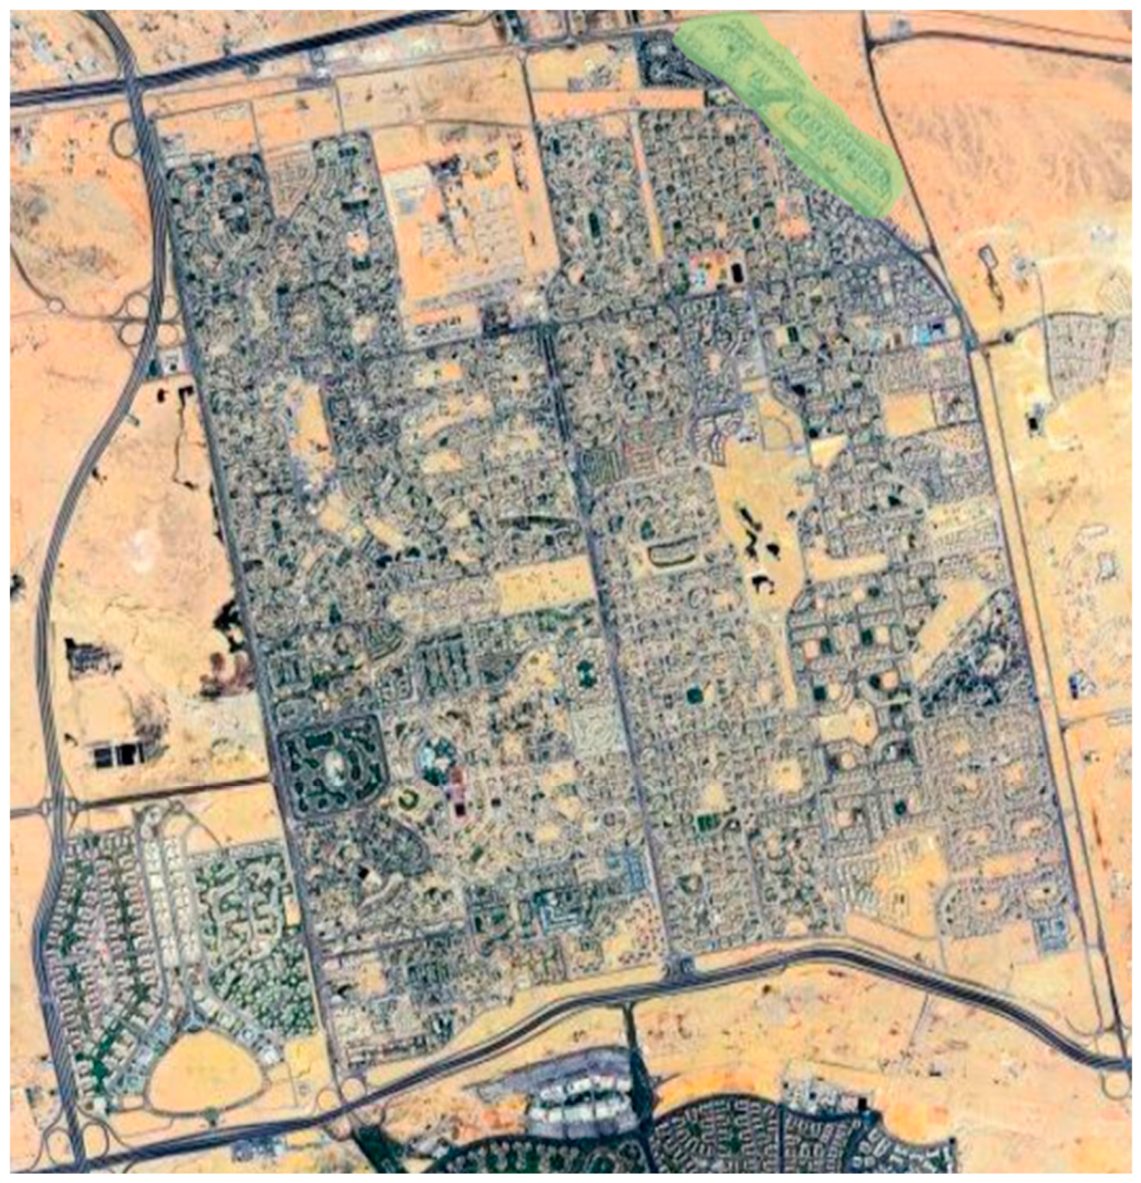
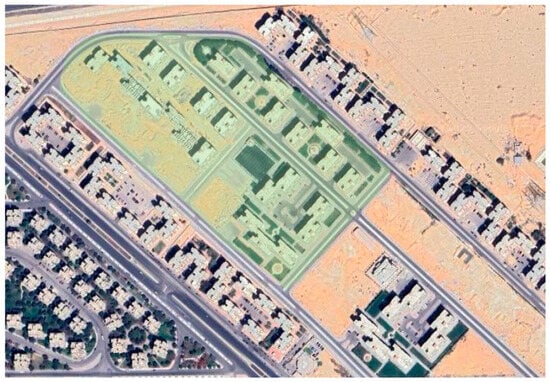
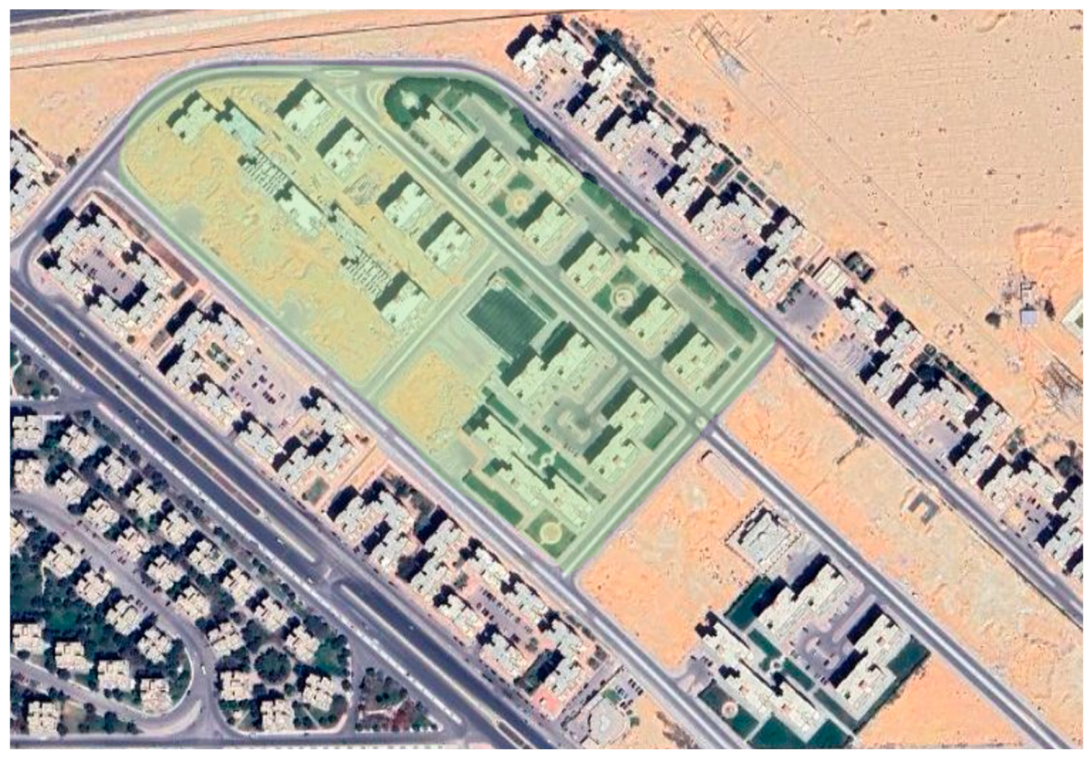
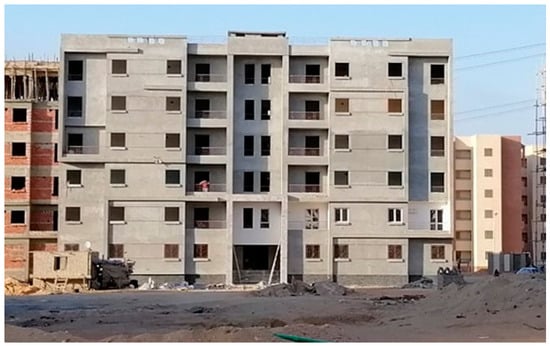
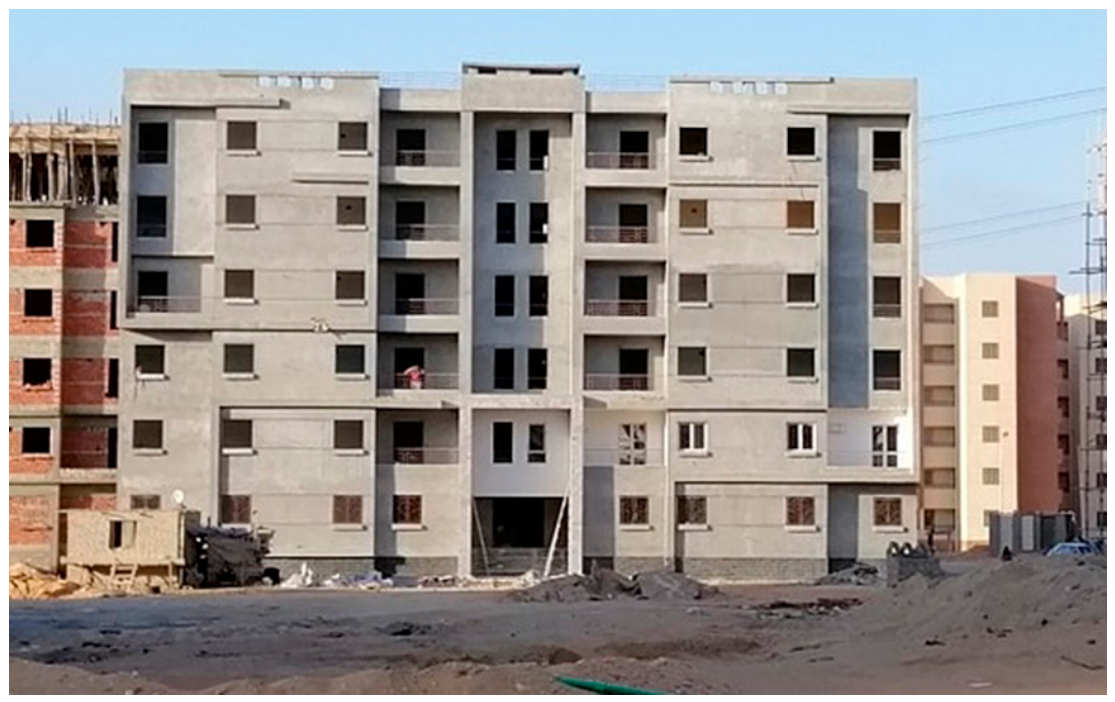
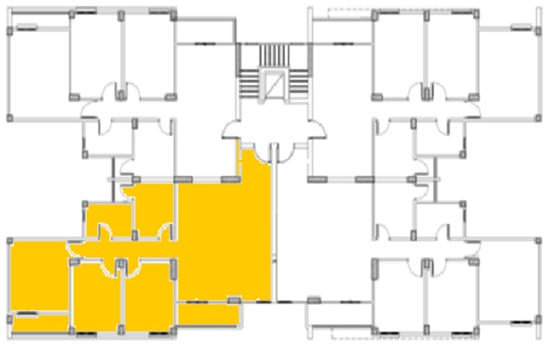
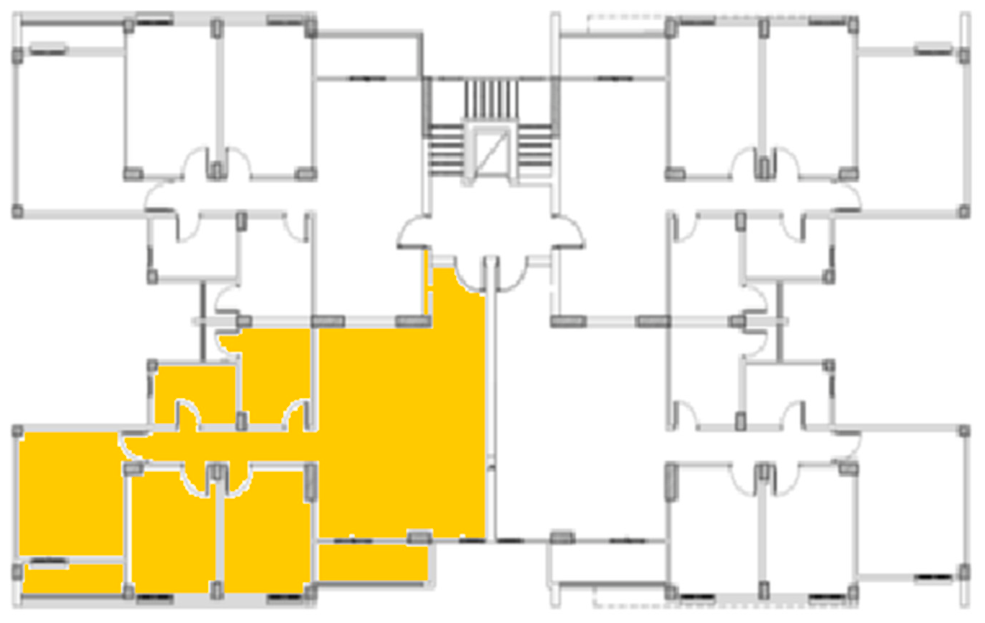
The selected building, representative of typical low-income housing, is situated in El Sherouk City. Experiencing very hot, dry summers with daytime temperatures around 40 °C and moderately high humidity and winters are mild, with sunny days around 19 °C and negligible rainfall [41]. The micro-scale plan of the building’s immediate context is depicted in Figure 4, while the macro plan illustrating its broader location is presented in Figure 5. The building occupies a site with a southwest orientation—considered the least favorable orientation in Cairo due to its extended daily exposure to solar radiation and gaining more heatwaves. The building comprises five floors, as shown in Figure 6; each floor accommodates four apartments of approximately 120 square meters. The typical floor layout, with four apartments per floor, is detailed in Figure 7. Each unit comprises a reception area (33.5 m2), two bedrooms (16 m2 each), a spacious living room (19.5 m2), a kitchen (7.5 m2), a toilet (6 m2), and external balconies. The building envelope features a window-to-wall ratio of 30%, a total R-value for external walls of 0.498 (including an external paint layer with an absorbance of 0.5), a Solar Heat Gain Coefficient (SHGC) for glazing type of 0.4, and an internal wall R-value of 0.441. The analysis in this study focuses on the third floor, specifically the living room at the southwest corner, as this space is both highly sun-exposed and most frequently occupied during the day.
Figure 4.
An aerial view of the examined district at macro scale (building location highlighted in green.
Figure 5.
An aerial view of the examined building at micro scale (building are highlighted in green).
Figure 6.
Building on site.
Figure 7.
A collective architectural plan for the examined floor level and highlighting the case study apartment architectural plan.
The apartment remained unoccupied during the monitoring period, with no internal heat sources or active mechanical heating or cooling systems, ensuring that the thermal data reflected the building envelope’s performance under natural ventilation conditions. The room was exposed to natural ventilation for two days prior to the seven-day examination period used in the validation.
4.2. Validation Process
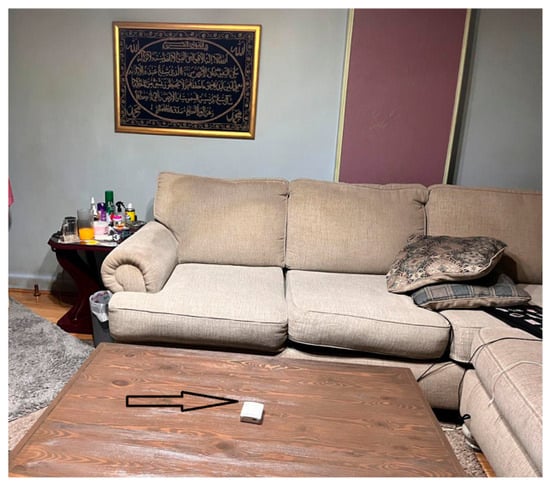
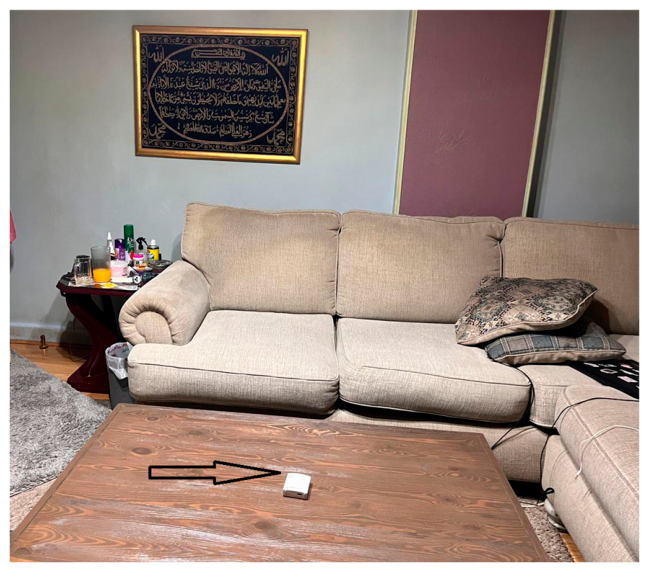
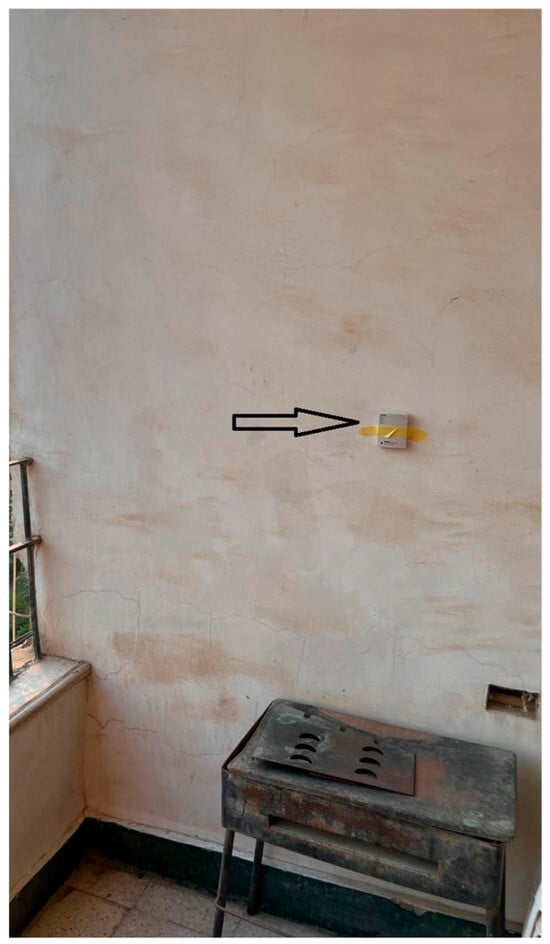
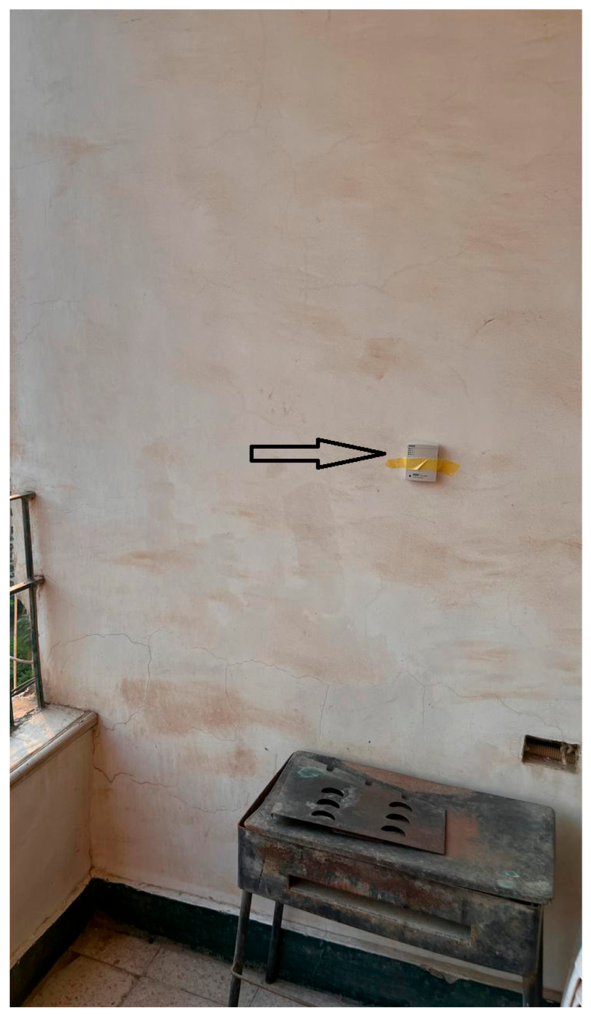
Field measurements were conducted during October over a continuous period of seven days. Outdoor and indoor air temperatures were recorded using HOBO® U10 Temp/RH data loggers (manufactured by Onset Computer Corporation, Bourne, MA, USA) placed in the center of the living rooms and on the balcony, which recorded hourly temperature and relative humidity values continuously over a period of seven days in October. For indoor air temperature, another file was recorded by a HOBO device at the center of the room, as shown in Figure 8. Simultaneously, outdoor air temperatures were measured using a HOBO® device positioned in a shaded balcony area to avoid direct solar radiation and capture accurate ambient conditions, as shown in Figure 9.
Figure 8.
HOBO device location in indoor space during field measurement. (black arrow shows the device location) Taken by the author.
Figure 9.
HOBO device location outdoors during field measurement black arrow shows the device location. Taken by the author.
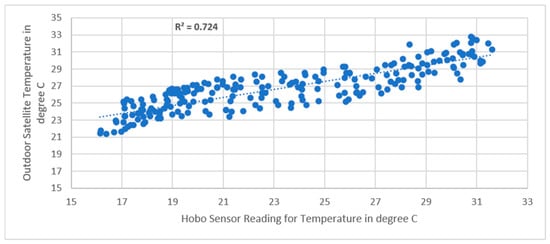
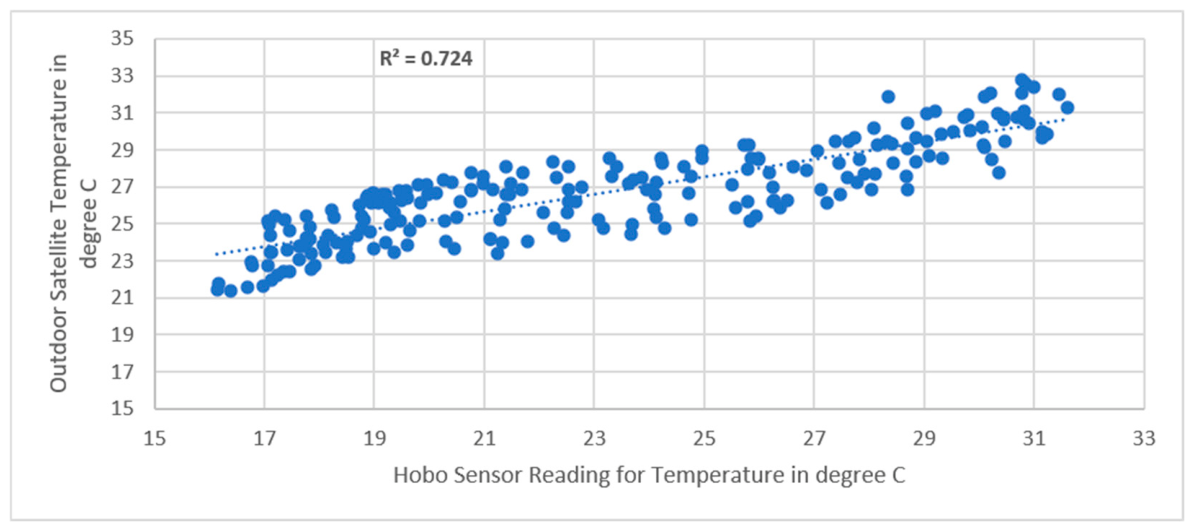
Previous studies comparing satellite-derived temperature with ground-based measurements report moderate to strong correlations due to differences between surface radiative temperature and canopy-layer air temperature. Reported R2 values typically fall within the range of 0.5–0.8, particularly in urban environments where microclimatic effects influence ground sensors. The coefficient of determination between satellite-derived and ground-measured outdoor temperature was R2 = 0.724, as shown in Figure 10, within the range reported for comparisons of this kind [42,43]. Roughly 28% of the variance in ground-measured outdoor temperature is therefore not reproduced by the satellite series, and that uncertainty propagates into the simulation, which takes the satellite data as its boundary condition. The apartment was modeled using Design-Builder. The simulated indoor air temperatures (using satellite data as input) were compared to the measured values. Correlation and error analyses were performed to assess the simulation model’s accuracy and reliability. In architectural performance simulation, the coefficient of determination (R2) is routinely used to quantify how closely a model’s predicted temperatures replicate measured data. R2 represents the proportion of variance in the observed indoor-environment variable captured by the simulation. When R2 approaches 1.0, the simulated trend mirrors the actual trend almost perfectly; Practitioners use R2 alongside error metrics such as RMSE (root mean square error) and CV (RMSE) (coefficient of variation of root mean square error) in Equation (5) to validate calibration runs, following guidelines like ASHRAE Guideline 14-2014 [44] (The American Society of Heating, Refrigerating and Air-Conditioning Engineers Guideline 14—Measurement of Energy, Demand, and Water Saving issued 2014) and IPMVP-EVO-section D (International Performance Measurement and Verification Protocol issued by Efficiency Valuation Organization-section D: Calibrated simulation) that often regard R2 (coefficient of determination) ≥ 0.75 (and ideally ≥ 0.90 for hourly data) as evidence that the temporal pattern of the simulation aligns acceptably with reality. These parameters serve as a concise way to evaluate how well the trend or shape of simulated data aligns with measured data, especially for temperature or energy time-series data in academic and engineering research. Root-mean-square error in degrees’ Celsius shows how far a simulation’s indoor temperatures differ on average from actual measurements. To compare models on a fair, scale-free basis, the RMSE, as shown in Equation (4), normalizes this error.
Figure 10.
The linear regression equation describing the relationship between Satellite and ground-sensor-recorded temperatures outside. (by authors).
Tactual = Actual temperature recorded in real; Stimulated = Simulated temperature for the same time as output from the simulation program; n = number of readings [44].
NMBE = Normalized Mean Bias Error, Tactual = mean of measured indoor temperature [44], T simulated = temperature simulated, n = number of readings [44].
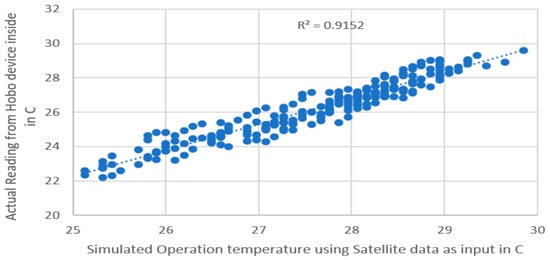
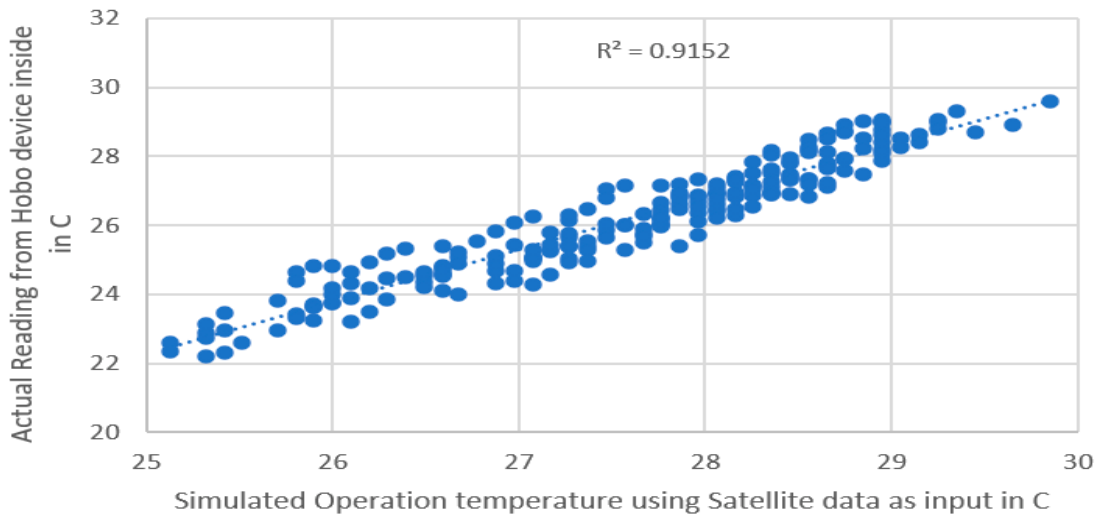
No standard prescribes a minimum monitoring duration for temperature-based calibration of free-running buildings. A continuous seven-day period (14 to 20 October 2024) was used, and the calibration statistics reported below were met over it. Outdoor dry-bulb temperature over this window ranged from 21.38 °C to 32.81 °C, below the summer extremes to which the calibrated model is subsequently applied. ASHRAE Guideline 14-2014 and IPMVP specify hourly calibration limits of CV(RMSE) ≤ 30% and NMBE within ±10%, and recommend a coefficient of determination of at least 0.75. These limits are applied here to hourly indoor temperature. The validation yielded a high correlation (R2) of 0.915, as shown in Figure 11, indicating a strong correlation between simulated and measured temperature patterns. The overall consistency in trends confirms the model’s reliability for predicting indoor temperature behavior. Additionally, the root mean square error (RMSE), calculated using Equation (4) found to be 2.1 °C. The coefficient of variation of RMSE (CV(RMSE)), which provides a normalized percentage-based measure of error as given by the following Equation (5) resulted in a value of 7.47%. The NMBE, calculated with Equation (6) [43], was −5%, indicating a small over-prediction of indoor temperature. CV(RMSE), NMBE and R2 all fall within the limits set out above, and the model is taken as calibrated for the conditions of the monitoring period.
Figure 11.
The linear regression equation describing the relationship between Hobo sensor inside and simulated inside temperature (using satellite data) (by Authors).
4.3. Current Weather File Versus Future Weather File
The outdoor hourly weather file used for simulation is the 2024 hourly weather file for Cairo at Cairo Airport location, obtained from the NASA LARC (Langley Research Center Power Project) [45]. This file records weather parameters at hourly or daily intervals and is accessible in EPW format, which was used in the Design-Builder simulation [46].
The weather file used to predict future weather is a Typical Meteorological Year (TMY) dataset for the same station in Cairo, covering data from 2003 to 2017. The TMY file [47] for the years 2003 to 2017 was used as the basis for generating two future weather EPW files, aligned with the A2 scenario for 2050 and 2080, respectively. The A2 scenario is a high-emission pathway proposed by the IPCC, characterized by regionally oriented economic growth and relatively high population growth, and it anticipates significant changes in climate patterns, making it a useful benchmark for future projections. Future weather files were generated by morphing the baseline TMY with the CC World Weather Gen tool [48], which applies the HadCM3 general circulation model under the IPCC SRES A2 emission scenario. The baseline is the Typical Meteorological Year for Cairo International Airport (WMO 623660) covering 2003 to 2017 [49]. SRES predates the CMIP6 Shared Socioeconomic Pathways adopted in IPCC AR6. A2 is retained here because CC World Weather Gen supports SRES pathways only. In radiative forcing, A2 has been mapped onto RCP8.5, while its socio-economic storyline corresponds most closely to SSP3 [50]. The IPCC Sixth Assessment Report treats RCP8.5 and SSP5-8.5 as nominally comparable high-emission scenarios, with SSP5-8.5 carrying the higher effective radiative forcing [10]. The projections in this study therefore describe a high-emission future of the kind represented by these pathways. Generation of CMIP6-based weather files is identified as further work. [51].
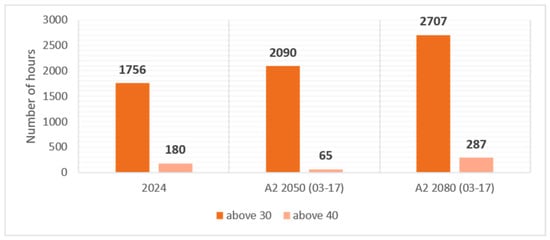
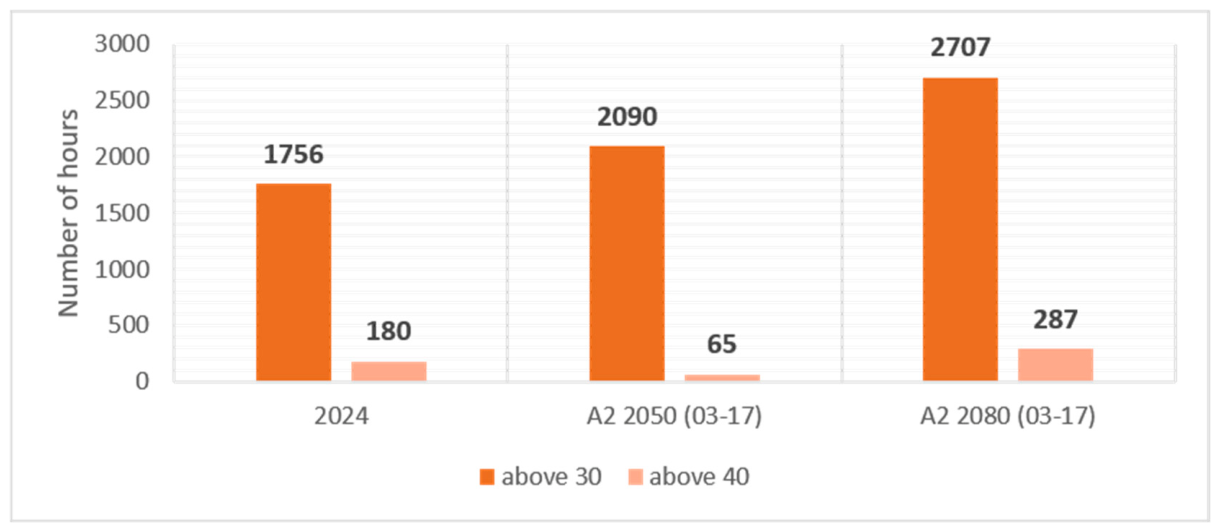
Once predictions were calculated, a comparison was carried out between the 2024 actual hours recorded and the 2050 and 2080 weather forecasts. The comparison focused on the number of hot-weather hours, under the assumption that global warming would increase the hours with high temperatures in already warm regions. Interestingly, the 2050 predictions did not surpass the actual 2024 recorded hours above 40 °C. The intermediate 2050 scenario was excluded, despite its potential relevance for near-term policy planning, as the predicted number of hours above 40 °C (65 h) was lower than the values already observed in 2024 (180 h). The most likely explanation is a baseline mismatch. The morphing procedure is applied to a 2003 to 2017 TMY whose baseline is cooler than the observed 2024 year, so the morphed 2050 file inherits that cooler baseline rather than indicating a deficiency in the underlying projection. A secondary possibility is that near-term warming is outpacing the SRES A2 pathway, although a single station-year cannot support that claim. The 2050 file was therefore excluded and 2080 selected, because it exceeds the observed 2024 baseline at both the 30 °C and 40 °C thresholds. Consequently, 2080 was selected as the future scenario, as it reflects a higher count of hours above both 30 °C and 40 °C compared with 2024, as depicted in Figure 12.
Figure 12.
Comparison between 2024 and future scenarios of 2050 and 2080, which exceeded 30 and 40 degrees Celsius (by Authors).
5. Results
This research studies using bio-bricks to mitigate the current hot weather effect and future hot weather effects that are projected to increase with global warming on non-air-conditioned buildings in hot, arid regions. Using bio-bricks instead of clay bricks in the same building configuration, making use of the changed thermal properties of the bricks after adding biomaterial. The study was carried out to see how the bio-bricks will reduce the comfort unmet hours relative to normal bricks. Comfort bounds used in comparison are (17.8–31.2 °C), with the TOperative used as the hourly representative of room conditions. Within each bio-brick family, the variant that records the lowest peak TOperative deemed the best performer, as it offers the greatest insulation relative to both the outdoors and the conventional-brick baseline. The remaining “best” variants were compared based on how many hours they keep the space within the comfort range. For every brick type, indoor and outdoor temperatures were logged hourly. The assessment focuses on summer months, defined in this research as any month in which the outdoor dry-bulb temperature reaches ≥31.2 °C—a threshold that, in Egypt, spans April through October.
5.1. Performance of Bio-Based Materials Under the 2024 Scenario
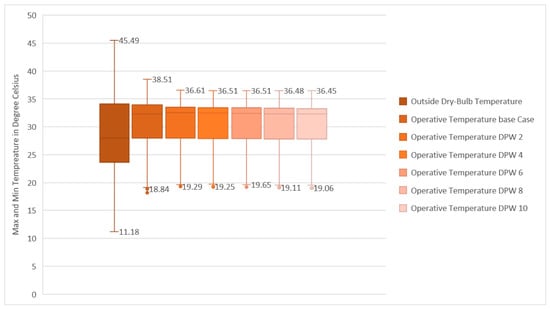
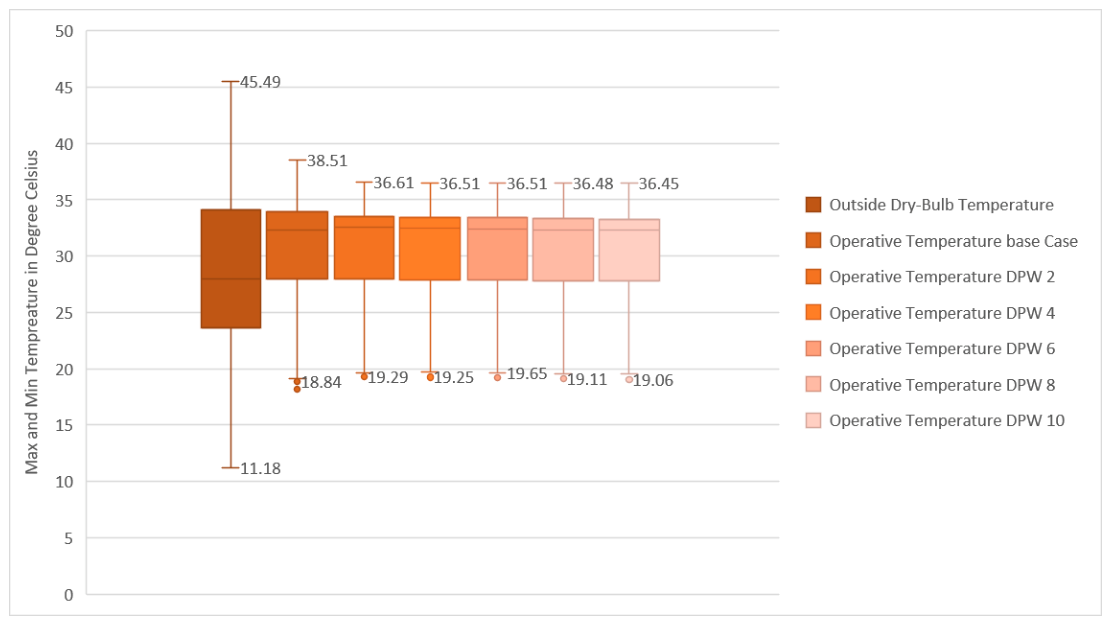
Figure 13 below presents the boxplot results for the selected bio-based materials investigated in this study, showing the range and distribution of outdoor dry-bulb temperature and indoor operative temperature for both the base case and the bio-based material scenarios under 2024 conditions. The outdoor dry-bulb temperature exhibits the widest variability, ranging from a minimum of 11.18 °C to a maximum of 45.49 °C, reflecting the harsh thermal conditions of the hot, arid climate. In comparison, the base-case operative temperature shows a narrower range, with values spanning from 19.08 °C to 38.51 °C and the graphs show that nearly every bio-brick material will behave better than conventional brick in max and min temperatures and distribution.
Figure 13.
Boxplot comparison of thermal performance for biomaterial and base case envelopes in the 2024 simulation scenario.
5.1.1. Key Findings
The results for the best candidate from each family are summarized in Table 6 below. The increase in comfort hours’ ranges from 32 h—approximately a 1.3-day improvement in comfort boundary—for the lowest-performing bio-brick (corncob 7.5%) to the best candidate (DPP PHB 10%), which achieved an increase of 284 h, equivalent to 11.83 additional days of comfort during summer. Within each family, the reduction in unmet hours does not scale in proportion to additive content.
Table 6.
Unmet hours percentage and absolute value for 2024 (by Authors).
5.1.2. Temperature Rise Shift
The maximum indoor TOperative occurred in the early evening (approximately 19:00–22:00), lagging several hours behind the period of peak solar exposure on the south-west wall, which receives intense afternoon exposure up to sunset.
5.1.3. Thermal Mechanism
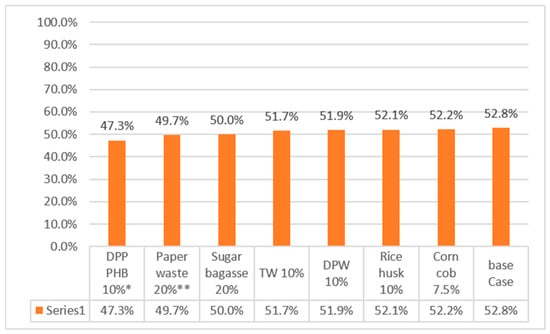
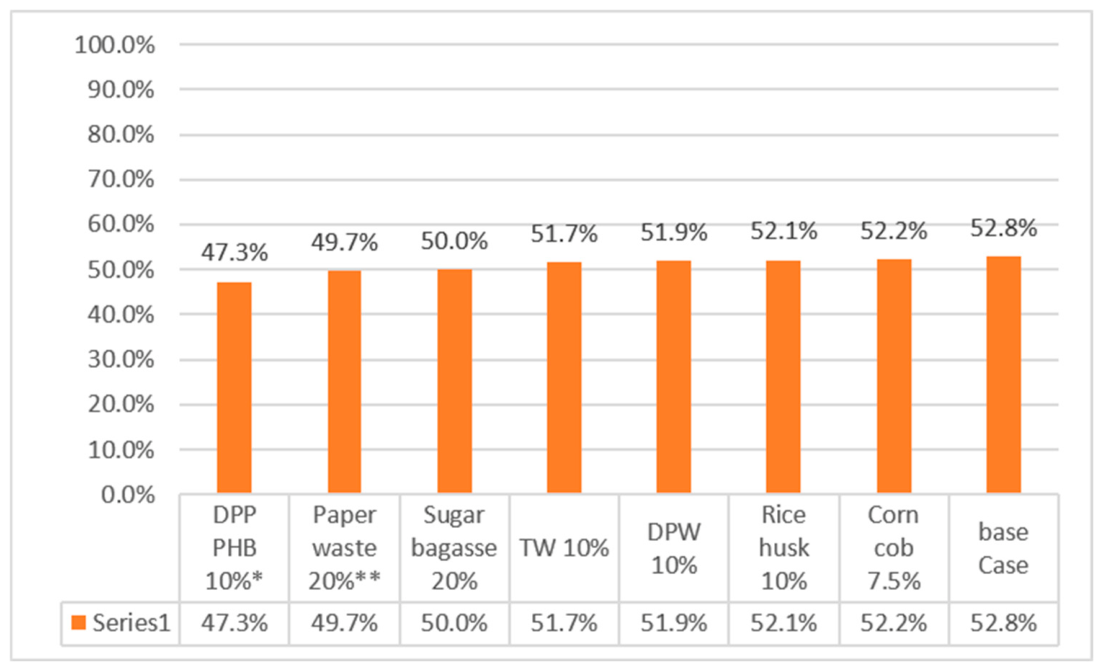
The differences in thermal diffusivity are caused by the biomaterial content added to the mixture. Because specific heat was held at the Design-Builder default of 840 J/(kg·K) for the majority of compositions, thermal diffusivity in these simulations follows from thermal conductivity and density alone, α = k/(ρc). Performance differences between compositions therefore arise from conductivity and density. The differences in the walls’ thermal mass can be attributed to heat capacity (density × specific heat), thermal conductivity (k), and thickness (t). By keeping the brick dimensions constant for all bio-bricks in the simulation, the main factors contributing to differences in behavior are specific heat, density, and thermal conductivity. These factors, expressed collectively through thermal diffusivity, govern the rate at which absorbed heat propagates inward and is subsequently released to the room, as shown in Equation (5). Thus, the variation in insulation performance is attributed to the combined influence of three factors- thermal conductivities, specific heat, and density—assuming the brick thickness remains constant to match the standard conventional clay brick used in the base case. Consequently, bricks with higher thermal mass and lower diffusivity delayed and dampened the temperature peak compared with those with lower thermal storage capacity. As illustrated in Table 1, the lowest recorded temperature occurred at 6:00 A.M. after the wall had cooled overnight, followed by heat gain from the rising outdoor temperature after sunrise. This metric allowed for a comparison of the percentage improvement in reducing unmet comfort hours achieved by using bio-bricks relative to the base case. For 2024, Table 6 shows DPP PHB 10% as the optimal candidate, removing 284 unmet hours, equal to 5.5 percentage points of summer hours or a 10.5% reduction against the base case. Paper waste, at 20%, ranked second at 161 h. Figure 14 shows the full distribution.
Figure 14.
Percentage of unmet hours—summer 2024. * best material, ** Second best Material.
5.2. Performance of Bio-Based Materials Under the 2080 Scenario
In the projected 2080 summer simulations, each bio-brick family was evaluated based on its specific additive and its effect on reducing indoor temperatures relative to the base case. Overall, these comparisons show that constructions with lower wall U-value produce lower indoor TOperative under projected 2080 conditions. Each bio-brick family—sugar bagasse, corn cob, date palm waste, paper waste, rice husk, date palm pit with PHB, and tea waste—demonstrates unique thermal performance characteristics, with optimal percentages varying by material.
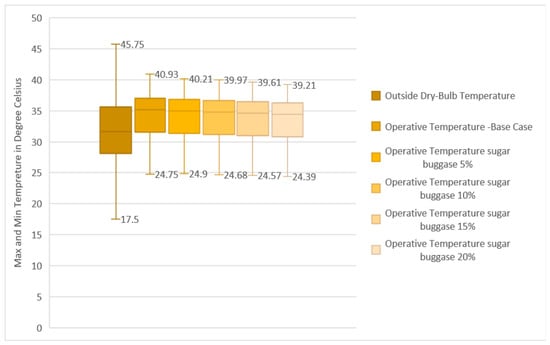
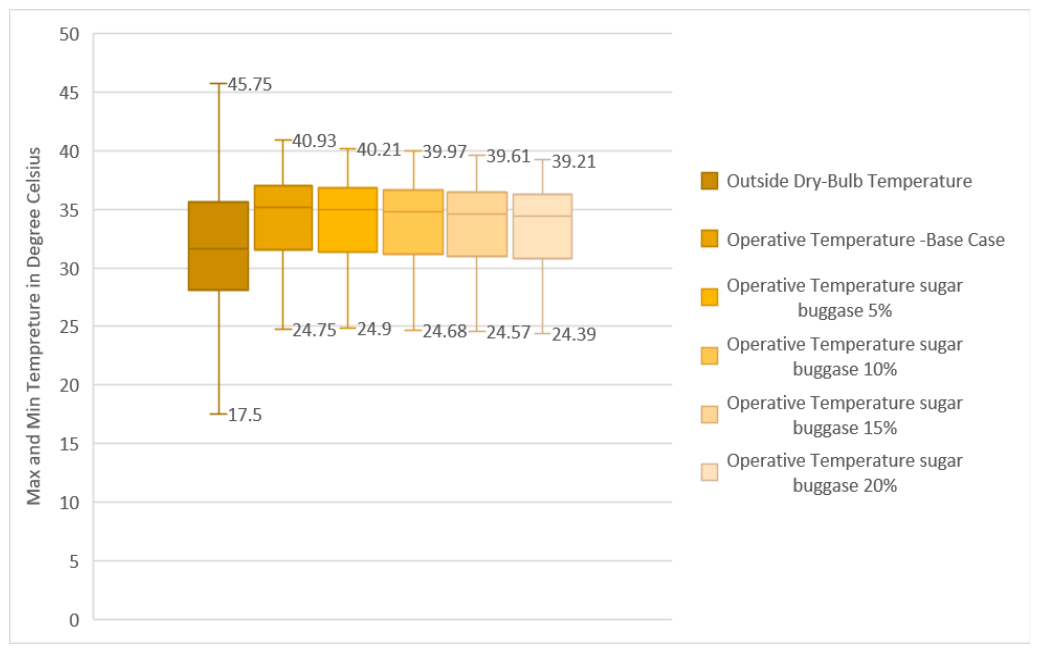
Figure 15 below presents the boxplot results for the selected bio-based materials investigated in this study, showing the range and distribution of outdoor dry-bulb temperature and indoor operative temperature for both the base case and the bio-based material scenarios under 2080 conditions. The outdoor dry-bulb temperature exhibits the widest variability, ranging from a minimum of 17.5 °C to a maximum of 45.75 °C, reflecting the harsh thermal conditions of the hot, arid climate. In comparison, the base-case operative temperature shows a narrower range, with values spanning from 24.75 °C to 40.93 °C and the graphs show that nearly every Bio-brick material will behave better than conventional brick in max and min temperatures and distribution.
Figure 15.
Boxplot comparison of thermal performance for biomaterial and base case envelopes in the 2080 simulation scenario.
5.2.1. Key Findings
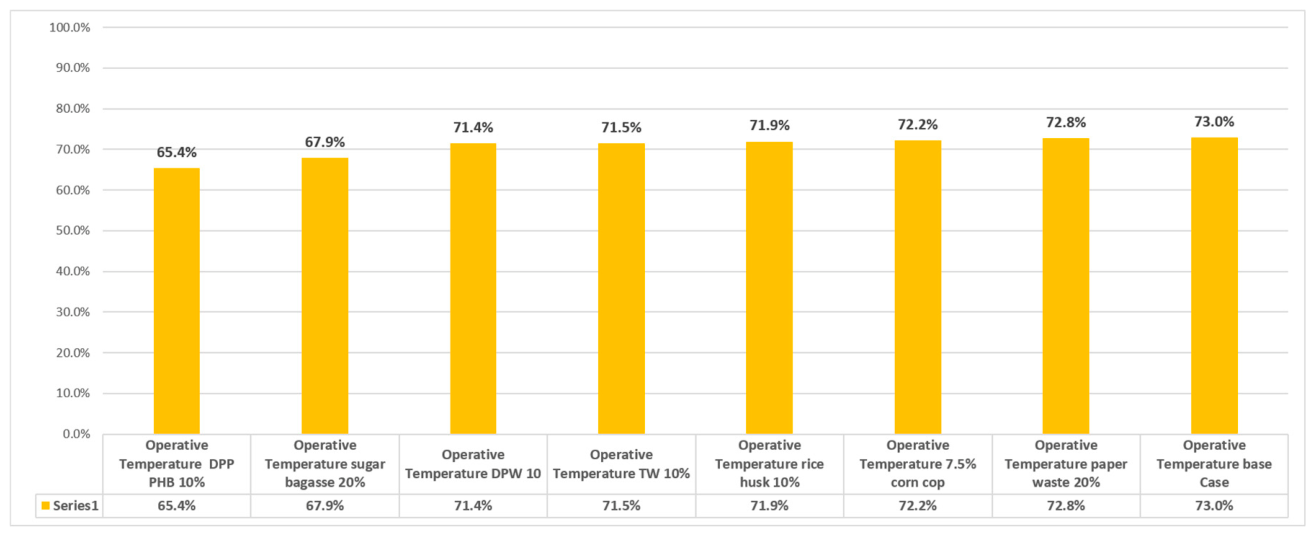
Conducting the same analysis for 2080 across all bio-brick families revealed that no recorded TOperative fell below 17.8 °C during the six summer months analyzed. This metric allowed a comparison of the percentage improvement in reducing unmet comfort hours achieved by using bio-bricks relative to the base case. Table 7 shows DPP PHB 10% brick identified as the optimal bio-brick candidate for 2080, removing 389 unmet hours, equal to 7.6 percentage points or a 10.4% relative reduction. Sugar bagasse 20% ranked second at 262 h, 5.1 percentage points and a 7.0% relative reduction. The least effective bio-brick, corncob 7.5%, still improved comfort hours in summer by 41 h, equivalent to 1.7 days of additional comfort. In contrast, the best-performing bio-brick increased comfort hours by 389 h, corresponding to 16.2 additional days of summer comfort.
Table 7.
Unmet hours percentage and absolute value for 2080.
5.2.2. Temperature Rise Shift
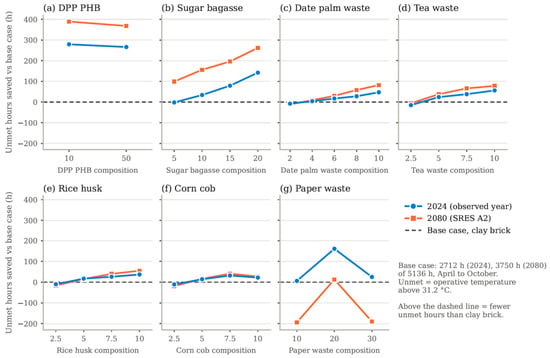
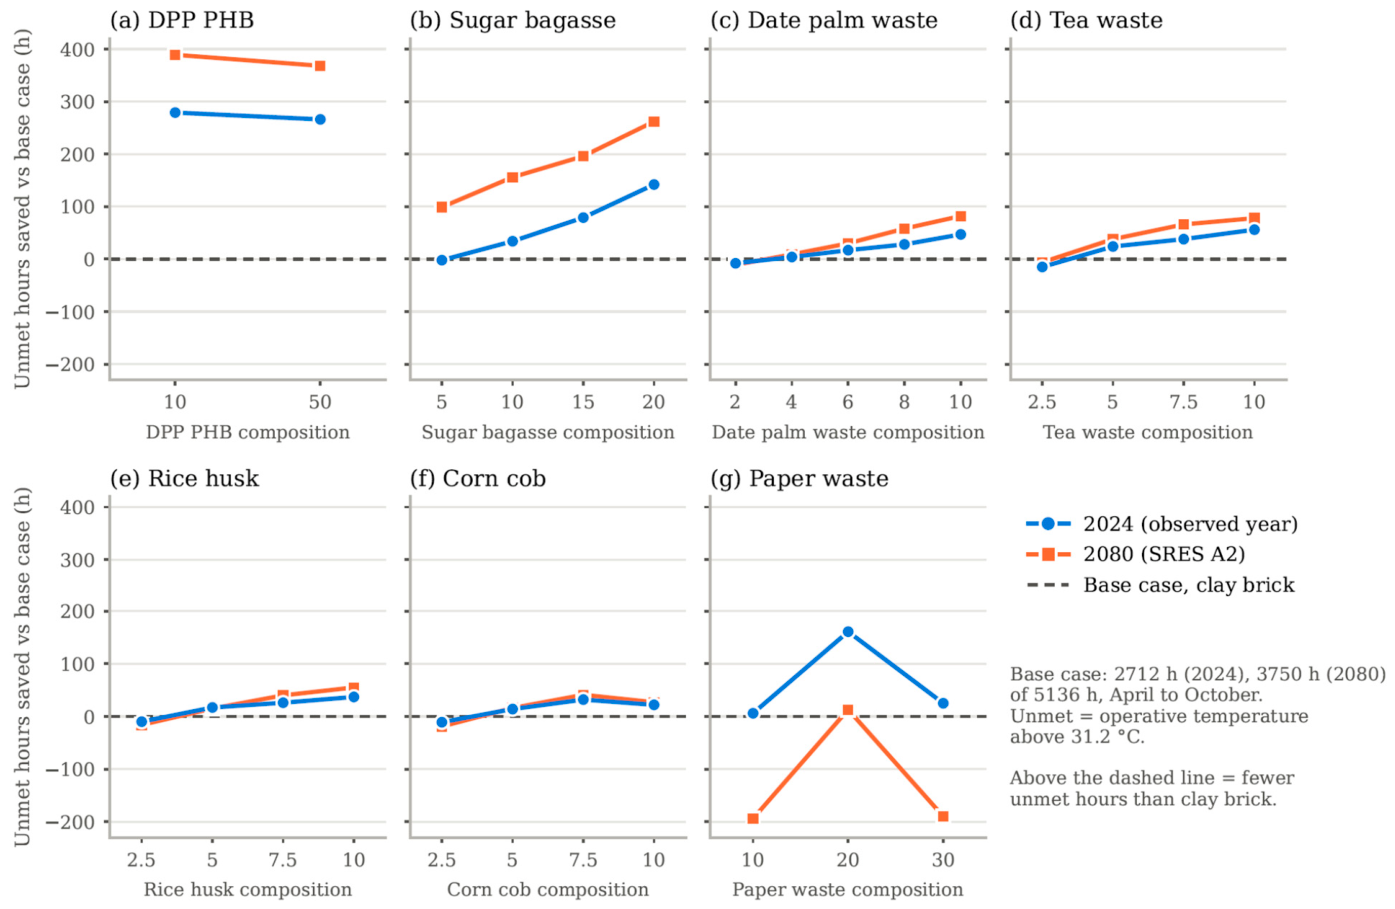
The results for unmet hours in 2080 are illustrated in Figure 16, which shows that the maximum indoor TOperative occurred late in the evening (approximately 21:00–23:00), several hours after the period of strongest solar exposure on the south-west-oriented wall, which experiences intense afternoon radiation up to sunset. Compared with 2024 conditions, the TOperative peak shifted temporally (for example, from 19:00 to 21:00) under the higher heat-gain scenario, indicating an increased thermal load retained and released after sunset. This delay, along with any variation in peak hour among the brick types, is governed by differences in heat capacity. The minimum indoor TOperative recorded at 8:00 A.M., after the structure had cooled throughout the night. The percentage of unmet comfort hours is calculated by dividing the number of hours outside the comfort range by the total number of summer hours. Figure 17 provides a complete summary for each brick under the 2024 and 2080 simulations, compared with the base-case clay brick.
Figure 16.
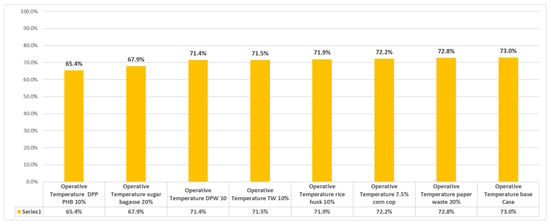
Percentage of unmet hours—summer 2080.
Figure 17.
Unmet comfort hours saved by each composition.
6. Discussion
The literature review demonstrates that incorporating agricultural biomaterials into bricks decreases thermal conductivity and increases thermal mass, thereby improving thermal properties and TOperative. However, most studies have focused on air-conditioned buildings, with limited emphasis on non-air-conditioned spaces and the influence of wall radiant temperature relative to indoor thermal comfort boundaries. When the same bio-additives were applied and the model was run for Egypt’s 2080 summer scenario, the peak TOperative decreased by several degrees—reaching approximately 36 °C with 10% rice husk, 35.9 °C with 10% Date palm waste, and 38.9–39.3 °C with optimized sugar bagasse and corncob mixes—compared with a hotter base-case clay brick wall. These lower peaks confirm the energy-saving advantages reported in the previous literature and align with the numerical evidence from controlled measurements showing reduced conductivity and 7–12% energy savings, as reported by Abd El-Hady et al. [10]. This correlation validates the simulation results, which reveal fewer unmet comfort hours and collectively demonstrate that bio-bricks enhance thermal resilience under future climate conditions.
Across all seven material families, the reduction in unmet comfort hours tracks the surface-to-surface wall U-value closely. A linear fit of hours saved against U-value for the best candidate in each family gives R2 = 0.94 under the 2080 scenario. Additive percentage is defined differently by each source study and is therefore not used as a cross-family variable. The envelope property the simulation actually consumes is the property against which the results are reported.
DPP PHB 10% was the optimal composition in both periods, removing 5.5 percentage points of unmet hours in 2024 and 7.6 percentage points in 2080. Measured against base-case unmet hours, the two reductions are almost the same, 10.5% and 10.4%, which indicates that the relative effectiveness of the envelope measure survives the projected warming even as the absolute burden of discomfort grows. The simulated reductions are not directly comparable with the 7 to 12% operational energy savings reported for conditioned buildings [10]. A reduction in discomfort hours in a free-running space and a reduction in delivered cooling energy in a mechanically conditioned one are different quantities with different thermodynamic references, and the two are reported here only as indicating a consistent direction of effect. Expressed as a relative reduction in unmet hours, 10.5% in 2024 and 10.4% in 2080, the present results fall within the same order of magnitude.
Every case in this study shares one geometry, one glazing specification and one weather file, and the zone is sealed and unoccupied, so the external wall is the only element that changes from run to run. Its U-value sets how much heat reaches the room by conduction, and the results follow it closely. One likely reason is the closed room. A wall that insulates slightly better also slows the escape of solar gains overnight, and at such small changes in conductivity that lost night-time cooling outweighs the smaller gain by day.
The 2080 weather file raises base-case unmet hours from 2712 to 3750 of the 5136 h between April and October. The 2080 file was chosen deliberately. Observed weather in 2024 already had more hours above 40 °C than the morphed A2 file for 2050, most likely because the morphing starts from a 2003 to 2017 baseline that is cooler than 2024 (Section 4.3), so only the 2080 file stood clear of present conditions. Under it, the walls save more hours in absolute terms: 389 h for DPP PHB 10% against 284 h in 2024. The hottest hour of the season drops as well, by 1.8 to 2.4 °C against clay brick in 2024 and by 1.1 to 2.1 °C in 2080, across the best composition in each family. Even so, with DPP PHB 10% the room stays outside the comfort limit for 47.4% of the season in 2024, about 11.4 h a day. In 2080, the figure is 65.4%.
Part of that shortfall comes from the model itself, which was left sealed and unoccupied so that the wall would be the only variable. A lived-in dwelling departs from it in two ways. Occupants and appliances add internal heat, which would raise unmet hours for every wall and narrow the share any envelope can recover. They also open windows. Night ventilation purges the heat that walls and rooms store during the day, and it would be expected to shrink the small penalty seen at the lowest designations, since that penalty is consistent with heat trapped in a closed room. In hot arid Tunisia, optimized natural ventilation cut annual energy use by 38.4 to 42.6%, yet on its own could not hold comfort through peak heat [4]. The walls studied here reach a similar limit, so bio-bricks work best combined with shading, night ventilation and other passive measures. These magnitudes also belong to this building’s form, internal volume and orientation, and other typologies may respond differently.
7. Limitations
The model was calibrated against seven days of continuous indoor and outdoor measurements in October 2024, over which outdoor dry-bulb temperature ranged from 21.38 °C to 32.81 °C. It was then applied to summer conditions reaching 45.5 °C in 2024 and 45.8 °C under the 2080 scenario. The model is therefore extrapolated beyond the range over which it was verified, and the basis for that extrapolation should be stated openly.
Conduction through the envelope is solved by conduction transfer functions derived from constant thermos-physical properties. The conduction model is linear in temperature difference and holds no mechanism by which its accuracy would degrade at larger driving potentials. What the calibration verifies, namely layer thicknesses and properties, wall thermal mass, time lag and decrement factor, zone geometry and infiltration rate, is likewise independent of the temperature level. Extrapolation is not a question of the solver behaving differently in summer.
The simulation is thermal only. Moisture transport is not modeled. Hygrothermal durability needs coupled simulation. Studying the coupled simulations under EN 15026 [52] would be the next stage. Also, a major concern regarding the incorporation of bio-additives in building materials involves their long-term effects, particularly given existing ethical and regulatory gaps.
These issues require deeper investigation, especially concerning potential gas emissions and fungal growth. Previous studies have explored similar long-term safety concerns—for example, the inclusion of coal residues in cement raised certain risks [53]. Meanwhile, research conducted in France found that rice husk–based materials exhibited strong resistance, with mold appearing only after ten weeks of incubation under 93% relative humidity and 30 °C [54]. While Egyptian building practices already consider protective mortar layers and acrylic finishes consistent with code recommendations, long-term durability and degradation of bio-bricks remain underexplored and warrant further study. For this reason, biomaterial solutions are not yet ready for large-scale implementation or integration into building codes and governance frameworks.
8. Conclusions
The ordering of the candidates follows wall U-value closely, departing from it only where volumetric heat capacity differs sharply between compositions. The two materials (DPP PHB 10%, DPP PHB 50%) share similar densities; however, variations in mixture composition influence specific heat and thermal conductivity. The most notable difference lies in their thermal conductivity values, which appear to be the dominant factor driving performance differences.
Despite similar baseline thermal properties, the observed variations can be attributed to the bricks functioning as thermal capacitors—differing in how they store and release heat. Their performance is highly influenced by fluctuations in the temperature gradient between indoor and outdoor surfaces. While the relative ranking of candidates may shift across scenarios, all tested biomaterial bricks consistently outperformed conventional clay bricks in thermal performance.
Although bio-bricks contribute measurably to indoor temperature reduction, a substantial gap in unmet comfort hours persists, worsening under future climate scenarios. Bio-bricks alone improve comfort but are insufficient under extreme conditions. They should integrate with other passive cooling approaches—such as external shading, natural ventilation, and reflective coatings—or through hybrid formulations combining multiple bio-based additives within a single brick to enhance performance. Without achieving a significant reduction in unmet hours—whether through bio-bricks alone or in hybrid strategies—it remains difficult to demonstrate economic benefits when compared with alternative biomass uses, retrofitting costs, or conventional brick production expenses. The inner volume of the space and the amount of heat inside will make the results vary under different building typologies or orientations. The amount of improvement in indoor conditions will vary; it can be confirmed that it will be better with incorporating bio-bricks than regular conventional fired clay. Based on the present evidence, bio-based warrants pilot deployment and formal consideration within Egyptian building code development, conditional on the hygrothermal and structural durability testing and long-term effects identified above. Code inclusion would be premature until that evidence exists.
Author Contributions
Conceptualization, R.M. and A.F.M. and T.M.K.; methodology, R.M. and A.F.M. and T.M.K.; software, R.M.; validation, R.M. and T.M.K.; formal analysis, R.M.; investigation, R.M.; resources, R.M.; data curation, R.M.; writing—original draft preparation, R.M. and A.F.M.; writing—review and editing, A.F.M. and T.M.K.; visualization, R.M.; supervision, A.F.M. and T.M.K.; project administration, R.M., A.F.M. and T.M.K. All authors have read and agreed to the published version of the manuscript.
Funding
This research received no external funding.
Institutional Review Board Statement
Not Applicable.
Informed Consent Statement
Not Applicable.
Data Availability Statement
All data are with the corresponding author for reasonable request.
Conflicts of Interest
The authors declare that there are no conflicts of interest.
Abbreviations
| Toperative | Thermal comfort index that combines indoor air temperature and mean radiant temperature into a single value to describe how warm or cool a space feels to occupants |
| EPW | Energy-Plus weather file |
| R2 | Correlation coefficient |
| RMSE | Root mean square error |
| CV RMSE | Coefficient of variation of root mean square error |
| NMBE | Normalized Mean Bias Error |
| Conventional bricks | Bricks that are made 100% of burned Clay |
| Bio bricks | Bricks that contain a percentage of biomaterial additives and burned clay |
| Q | Heat energy—The amount of thermal energy transferred in or out of a system |
| C | Specific heat—Heat energy required to raise the temperature of 1 kg of a substance by 1 °C, measured in J/kg·°C |
| ∆T | Delta temperature—Difference between two temperatures |
| Tcomfort | Temperature comfort limit for indoor air in °C |
| Trm | The running mean outdoor air temperature in °C |
| ρ | Density of the Material |
| α | Thermal diffusivity represents how quickly heat spreads through a material, measured in (m2/s) |
| K | Thermal conductivity measures how well a material conducts heat. It quantifies the rate of heat transfer through a material when there is a temperature difference across it. |
| U-Value | The U-value (Overall Heat Transfer Coefficient) measures how much heat passes through an entire building element (wall, roof, window, etc.) per unit area and per unit temperature difference between inside and outside |
| TMY | Typical Meteorological Year. It is a synthetic weather dataset built from many years of recorded climate data (usually 15–30 years) to represent a typical year of weather conditions for a specific location. |
| NASA LARC | Langley Research Center Power Project |
| unmet thermal comfort hour | Hours when indoor conditions exceed comfort thresholds |
References
- Farand, C. Building Fast, Falling Short: As Climate Risks Rise and Cities Grow, We Must Rethink How We Build to Create Better Lives for All; Global Status Report for Buildings and Construction; United Nations Environment Programme, Global Alliance for Buildings and Construction: Paris, France, 2026; ISBN 978-92-807-4283-1. [Google Scholar]
- Central Agency for Public Mobilization and Statistics (CAPMAS). Egypt Census 2017; Central Agency for Public Mobilization and Statistics: Cairo, Egypt, 2017.
- Central Agency for Public Mobilization and Statistics (CAPMAS). Annual Bulletin of Electricity and Energy Statistics 2017/2018; Ref. No. 71-22231-2018; Central Agency for Public Mobilization and Statistics: Cairo, Egypt, 2021.
- Hadded, M.H.; Dardouri, S.; Arıcı, M.; Sghaier, J. Towards Sustainable Housing in Tunisia: Optimizing Passive and Hybrid Ventilation Strategies across Various Climatic Zones. Energy Rep. 2026, 15, 108922. [Google Scholar] [CrossRef] [Scilit]
- Aloshan, M.A.; Aldali, K.M. Courtyard Design for Energy Efficiency and Thermal Comfort: Machine Learning Insights across Hot and Warm Climates. Sci. Rep. 2025, 15, 43660. [Google Scholar] [CrossRef] [Scilit] [PubMed]
- Fahmy, M.; El-Hady, H.; Mahdy, M.; Abdelalim, M.F. On the Green Adaptation of Urban Developments in Egypt; Predicting Community Future Energy Efficiency Using Coupled Outdoor-Indoor Simulations. Energy Build. 2017, 153, 241–261. [Google Scholar] [CrossRef] [Scilit]
- Mohamed, A.F.; Mokhtar, M.; Elghobashy, S. Comparative Study of Bio-Materials versus Conventional Materials in Building Construction Methods; Economical Evaluation of Different Building Materials. SN Appl. Sci. 2019, 1, 1179. [Google Scholar] [CrossRef] [Scilit]
- Fahmy, M.; Mahmoud, S.A.; Olwy, I.M.; Abdelalim, M. Comparison of Occupant Thermal Comfort with and without Passive Design for a Naturally Ventilated Educational Building: A Case Study in Cairo, Egypt. IOP Conf. Ser. Mater. Sci. Eng. 2020, 974, 012027. [Google Scholar] [CrossRef] [Scilit]
- El-Hady, R.E.A.; Mohamed, A.F.A. Thermal Performance Evaluation of Bio-Bricks and Conventional Bricks in Residential Buildings in Aswan City, Egypt. Sci. Rep. 2023, 13, 15993. [Google Scholar] [CrossRef] [Scilit] [PubMed]
- IPCC. Climate Change 2013: The Physical Science Basis; Stocker, T., Dahe, Q., Plattner, K., Eds.; Cambridge University Press: Cambridge, UK, 2013; 1535p, ISBN 978-1-107-66182-0. [Google Scholar]
- NOAA National Centers for Environmental Information (NCEI). Monthly Global Climate Report for Annual 2022; National Oceanic and Atmospheric Administration: Asheville, NC, USA, 2023.
- Field, C.B.; Barros, V.R. Climate Change 2014 Impacts, Adaptation, and Vulnerability: Working Group II Contribution to the Fifth Assessment Report of the Intergovernmental Panel on Climate Change; Field, C.B., Barros, V.R., Dokken, D.J., Mach, K.J., Mastrandrea, M.D., Eds.; Cambridge University Press: Cambridge, UK, 2014; ISBN 978-1-107-41537-9. [Google Scholar]
- Field, C.B.; Barros, V.R.; Dokken, D.J.; Mach, K.J.; Mastrandrea, M.D.; Bilir, T.E.; Chatterjee, M.; Ebi, K.L.; Estrada, Y.O.; Genova, R.C.; et al. Climate Change 2014: Impacts, Adaptation, and Vulnerability. Part A: Global and Sectoral Aspects; Cambridge University Press: Cambridge, UK, 2014; ISBN 978-1-107-41537-9. [Google Scholar]
- Trenberth, K.E.; Dai, A.; Van Der Schrier, G.; Jones, P.D.; Barichivich, J.; Briffa, K.R.; Sheffield, J. Global Warming and Changes in Drought. Nat. Clim. Change 2014, 4, 17–22. [Google Scholar] [CrossRef] [Scilit]
- Adger, W.N.; Barnett, J.; Brown, K.; Marshall, N.; O’Brien, K. Cultural Dimensions of Climate Change Impacts and Adaptation. Nat. Clim. Change 2013, 3, 112–117. [Google Scholar] [CrossRef] [Scilit]
- Stern, N.H. The Economics of Climate Change: The Stern Review; Cambridge University Press: Cambridge, UK, 2007; ISBN 978-0-521-70080-1. [Google Scholar]
- Santamouris, M. Recent Progress on Urban Overheating and Heat Island Research. Integrated Assessment of the Energy, Environmental, Vulnerability and Health Impact. Synergies with the Global Climate Change. Energy Build. 2020, 207, 109482. [Google Scholar] [CrossRef] [Scilit]
- Alwetaishi, M.; Benjeddou, O. Impact of Window to Wall Ratio on Energy Loads in Hot Regions: A Study of Building Energy Performance. Energies 2021, 14, 1080. [Google Scholar] [CrossRef] [Scilit]
- Reichler, T.; Kim, J. How Well Do Coupled Models Simulate Today’s Climate? Bull. Am. Meteorol. Soc. 2008, 89, 303–312. [Google Scholar] [CrossRef] [Scilit]
- Zillman, J.W. The IPCC Third Assessment Report on the Scientific Basis of Climate Change. Australas. J. Environ. Manag. 2001, 8, 169–185. [Google Scholar] [CrossRef] [Scilit]
- Christensen, J.H.; Hewitson, B.; Busuioc, A.; Chen, A.; Gao, X.; Held, R.; Jones, R.; Kolli, R.K.; Kwon, W.K.; Laprise, R.; et al. Climate Change 2007: The Physical Science Basis: Contribution of Working Group I to the Fourth Assessment Report of the Intergovernmental Panel on Climate Change; Solomon, S., Intergovernmental Panel on Climate Change, Eds.; Cambridge University Press: Cambridge, NY, USA, 2007; ISBN 978-0-521-88009-1. [Google Scholar]
- Rubio-Bellido, C.; Pérez-Fargallo, A.; Pulido-Arcas, J.A. Optimization of Annual Energy Demand in Office Buildings under the Influence of Climate Change in Chile. Energy 2016, 114, 569–585. [Google Scholar] [CrossRef] [Scilit]
- Abuhussain, M.A.; Chow, D.H.C.; Sharples, S. Sensitivity Energy Analysis for the Saudi Residential Buildings Envelope Codes under Future Climate Change Scenarios: The Case for the Hot and Humid Region in Jeddah. IOP Conf. Ser. Earth Environ. Sci. 2019, 329, 012039. [Google Scholar] [CrossRef] [Scilit]
- Almazroui, M.; Islam, M.N.; Athar, H.; Jones, P.D.; Rahman, M.A. Recent Climate Change in the Arabian Peninsula: Annual Rainfall and Temperature Analysis of Saudi Arabia for 1978–2009. Int. J. Climatol. 2012, 32, 953–966. [Google Scholar] [CrossRef] [Scilit]
- Radhi, H. Evaluating the Potential Impact of Global Warming on the UAE Residential Buildings–A Contribution to Reduce the CO2 Emissions. Build. Environ. 2009, 44, 2451–2462. [Google Scholar] [CrossRef] [Scilit]
- Zhang, X.; Aguilar, E.; Sensoy, S.; Melkonyan, H.; Tagiyeva, U.; Ahmed, N.; Kutaladze, N.; Rahimzadeh, F.; Taghipour, A.; Hantosh, T.H.; et al. Trends in Middle East Climate Extreme Indices from 1950 to 2003. J. Geophys. Res. Atmos. 2005, 110, 2005JD006181. [Google Scholar] [CrossRef] [Scilit]
- Al-Tamimi, N. Passive Design Strategies for Energy Efficient Buildings in the Arabian Desert. Front. Built Environ. 2022, 7, 805603. [Google Scholar] [CrossRef] [Scilit]
- Bourbia, S.; Kazeoui, H.; Belarbi, R. A Review on Recent Research on Bio-Based Building Materials and Their Applications. Mater. Renew. Sustain. Energy 2023, 12, 117–139. [Google Scholar] [CrossRef] [Scilit]
- Kazmi, S.M.S.; Munir, M.J.; Patnaikuni, I.; Wu, Y.-F.; Fawad, U. Thermal Performance Enhancement of Eco-Friendly Bricks Incorporating Agro-Wastes. Energy Build. 2018, 158, 1117–1129. [Google Scholar] [CrossRef] [Scilit]
- Khoudja, D.; Taallah, B.; Izemmouren, O.; Aggoun, S.; Herihiri, O.; Guettala, A. Mechanical and Thermophysical Properties of Raw Earth Bricks Incorporating Date Palm Waste. Constr. Build. Mater. 2021, 270, 121824. [Google Scholar] [CrossRef] [Scilit]
- Sutcu, M.; Díaz, J.J.d.C.; Rabanal, F.P.Á.; Gencel, O.; Akkurt, S. Thermal Performance Optimization of Hollow Clay Bricks Made up of Paper Waste. Energy Build. 2014, 75, 96–108. [Google Scholar] [CrossRef] [Scilit]
- Mlhem, A.; Teklebrhan, T.; Bokuretsion, E.; Abu-Jdayil, B. Development of Sustainable Thermal Insulation Based on Bio-Polyester Filled with Date Pits. J. Bioresour. Bioprod. 2024, 9, 74–89. [Google Scholar] [CrossRef] [Scilit]
- Saman, N.S.M.; Deraman, R.; Hamzah, M.H. Development of Low Thermal Conductivity Brick Using Rice Husk, Corn Cob and Waste Tea in Clay Brick Manufacturing. In Proceedings of the International Conference on Civil and Environmental Engineering, Langkawi, Malaysia, 4–5 December 2017; p. 130007. [Google Scholar]
- Janbuala, S.; Wasanapiarnpong, T. Lightweight Clay Brick Ceramic Prepared with Bagasse Addition. ARPN J. Eng. Appl. Sci. 2016, 11, 8380–8384. [Google Scholar]
- ANSI/ASHRAE Standard 55-2023; Thermal Environmental Conditions for Human Occupancy. ASHRAE: Atlanta, GA, USA, 2023.
- Bergman, T.L.; Lavine, A.S. Fundamentals of Heat and Mass Transfer, 8th ed.; John Wiley & Sons: Hoboken, NJ, USA, 2017; ISBN 978-1-119-33767-6. [Google Scholar]
- Crawley, D.B.; Lawrie, L.K.; Winkelmann, F.C.; Buhl, W.F.; Huang, Y.J.; Pedersen, C.O.; Strand, R.K.; Liesen, R.J.; Fisher, D.E.; Witte, M.J.; et al. EnergyPlus: Creating a New-Generation Building Energy Simulation Program. Energy Build. 2001, 33, 319–331. [Google Scholar] [CrossRef] [Scilit]
- Tian, Z.; Zhang, X.; Jin, X.; Zhou, X.; Si, B.; Shi, X. Towards Adoption of Building Energy Simulation and Optimization for Passive Building Design: A Survey and a Review. Energy Build. 2018, 158, 1306–1316. [Google Scholar] [CrossRef] [Scilit]
- Al Ka’bi, A.H. Comparison of Energy Simulation Applications Used in Green Building. Ann. Telecommun. 2020, 75, 271–290. [Google Scholar] [CrossRef] [Scilit]
- Serag, H.; Mahmoud, M.; Kamel, T.; Fahmy, A. Comparative Validation of a Building Energy Model Calibration Methodology with a Focus on Residential Buildings. Civ. Eng. Archit. 2024, 12, 1447–1462. [Google Scholar] [CrossRef] [Scilit]
- Harris, I.; Osborn, T.J.; Jones, P.; Lister, D. Version 4 of the CRU TS Monthly High-Resolution Gridded Multivariate Climate Dataset. Sci. Data 2020, 7, 109. [Google Scholar] [CrossRef] [Scilit] [PubMed]
- Fung, W.Y.; Lam, K.S.; Nichol, J.; Wong, M.S. Derivation of Nighttime Urban Air Temperatures Using a Satellite Thermal Image. J. Appl. Meteorol. Climatol. 2009, 48, 863–872. [Google Scholar] [CrossRef] [Scilit]
- Fabrizi, R.; De Santis, A.; Gomez, A. Satellite and Ground-Based Sensors for the Urban Heat Island Analysis in the City of Madrid. In Proceedings of the 2011 Joint Urban Remote Sensing Event; IEEE: Munich, Germany, 2011; pp. 349–352. [Google Scholar]
- Ruiz, G.; Bandera, C. Validation of Calibrated Energy Models: Common Errors. Energies 2017, 10, 1587. [Google Scholar] [CrossRef] [Scilit]
- NASA. 2024 Hourly Cairo Weather File. 2024. Available online: https://power.larc.nasa.gov/data-access-viewer/ (accessed on 18 August 2026).
- Design Builder. 2025. Available online: https://designbuilder.co.uk/software/what-s-new-in-2025-1 (accessed on 18 August 2026).
- U.S. Department of Energy 2003 to 2017 Cairo Airport. Available online: https://energyplus.net/weather-location/africa_wmo_region_1/EGY/EGY_Cairo.Intl.Airport.623660_ETMY (accessed on 18 August 2026).
- Jentsch, M.F.; Bahaj, A.S.; Ames, P.A.B. CC Weather File Generator 2024. Available online: http://energyplus.net/weather-location/africa_wmo_region_1/EGY/EGY_Cairo.623660_IWEC (accessed on 18 August 2026).
- Van Vuuren, D.P.; Carter, T.R. Climate and Socio-Economic Scenarios for Climate Change Research and Assessment: Reconciling the New with the Old. Clim. Change 2014, 122, 415–429. [Google Scholar] [CrossRef] [Scilit]
- Jentsch, M.F.; Bahaj, A.S.; James, P.A.B. Climate Change Future Proofing of Buildings—Generation and Assessment of Building Simulation Weather Files. Energy Build. 2008, 40, 2148–2168. [Google Scholar] [CrossRef] [Scilit]
- Intergovernmental Panel on Climate Change (IPCC). Climate Change 2021—The Physical Science Basis: Working Group I Contribution to the Sixth Assessment Report of the Intergovernmental Panel on Climate Change, 1st ed.; Cambridge University Press: Cambridge, UK, 2023; ISBN 978-1-009-15789-6. [Google Scholar]
- EN 15026:2023; Hygrothermal Performance of Building Components and Building Elements—Assessment of Moisture Transfer by Numerical Simulation. European Committee for Standardization: Brussels, Belgium, 2023.
- Shariati, M.; Kamyab, H.; Habibi, M.; Ahmadi, S.; Naghipour, M.; Gorjinezhad, F.; Mohammadirad, S.; Aminian, A. Sulfuric Acid Resistance of Concrete Containing Coal Waste as a Partial Substitute for Fine and Coarse Aggregates. Fuel 2023, 348, 128311. [Google Scholar] [CrossRef] [Scilit]
- Laborel-Préneron, A.; Giroudon, M.; Aubert, J.E.; Magniont, C.; Faria, P. Experimental Assessment of Bio-Based Earth Bricks Durability. IOP Conf. Ser. Mater. Sci. Eng. 2019, 660, 012069. [Google Scholar] [CrossRef] [Scilit]

Disclaimer/Publisher’s Note: The statements, opinions and data contained in all publications are solely those of the individual author(s) and contributor(s) and not of MDPI and/or the editor(s). MDPI and/or the editor(s) disclaim responsibility for any injury to people or property resulting from any ideas, methods, instructions or products referred to in the content. |
© 2026 by the authors. Licensee MDPI, Basel, Switzerland. This article is an open access article distributed under the terms and conditions of the Creative Commons Attribution (CC BY) license.