


Abstract
Indoor environmental quality (IEQ) strongly influences occupant well-being and teaching conditions in educational buildings. This study proposes the Predicted Probability of Dissatisfaction Index (), a probabilistic ordinal learning framework based on the Consistent Rank Logits (CORAL) architecture to estimate university professors’ dissatisfaction while preserving the ordinal structure of subjective perception. The framework integrates operative temperature, concentration, illuminance, and sound pressure level through the CORAL architecture. A dataset comprising 77 synchronized environmental and subjective observations collected during regular teaching activities was evaluated using a Nested Stratified Group Cross-Validation benchmark. The proposed framework achieved an Accuracy of , Balanced Accuracy of , Macro-F1 score of , and a Quadratic Weighted Cohen’s Kappa of . Benchmark comparisons with conventional statistical and machine learning models demonstrated competitive predictive performance while preserving ordinal consistency. The representative CORAL architecture selected during the benchmark was subsequently retrained using the complete dataset for model interpretability analyses. Predictor contribution analysis identified concentration as the most influential environmental variable (48.2%), followed by operative temperature (24.8%), sound pressure level (14.7%), and illuminance (12.4%). Complementary One-Factor-at-a-Time (OFAT) response analysis and exploratory latent-space visualization further enhanced the interpretation of environmental dissatisfaction, demonstrating the potential of the proposed framework as an interpretable virtual sensing approach for supporting IEQ assessment in educational buildings.
1. Introduction
Indoor Environmental Quality (IEQ) in Higher Education Institutions is a key determinant of public health, well-being, and cognitive performance, requiring multidisciplinary approaches capable of capturing the combined influence of thermal, acoustic, visual, and indoor air quality conditions on building occupants [1,2]. Although the effects of environmental variables on students have been extensively investigated [3,4,5,6], comparatively less attention has been devoted to university professors, despite their prolonged occupational exposure to classroom environments and the high cognitive and vocal demands associated with teaching activities.
University classrooms present functional characteristics that distinguish them from offices and other commercial buildings, including high occupancy density, variable occupancy patterns, predominantly sedentary activities, and comfort requirements that differ from those assumed in conventional building standards [7,8]. These characteristics create dynamic indoor environments in which multiple environmental domains interact simultaneously, making the assessment of perceived indoor environmental quality substantially more complex than evaluating isolated physical variables.
Evidence indicates that concentrations above approximately , frequently observed under insufficient air renewal, may impair decision-making, concentration, and strategic planning [9,10]. Likewise, excessive sound pressure levels and poor acoustic conditions increase vocal effort and psychological stress during teaching activities [11,12]. Lighting conditions also play an important role because insufficient or excessive illuminance may contribute to visual fatigue and circadian disruption [13]. Rather than acting independently, these environmental domains jointly influence occupants’ perception of classroom quality, reinforcing the multidimensional nature of Indoor Environmental Quality.
Roche et al. [14] reported that exposure to adverse environmental conditions, including indoor air pollution, is associated with reduced cognitive performance and long-term health impacts, emphasizing the importance of reliable indoor environmental assessment. In educational environments, poor IEQ conditions have also been associated with increased discomfort, self-reported symptoms, and higher absenteeism among occupants [4,9]. These effects extend beyond individual well-being and may ultimately influence teaching quality and learning outcomes. From a sustainability perspective, improving IEQ contributes directly to the United Nations Sustainable Development Goals, particularly SDG 3 (Good Health and Well-being) and SDG 4 (Quality Education) [15].
Occupants’ perceptions of IEQ are inherently subjective and are commonly collected using Likert-type scales, whose response categories represent ordered levels of satisfaction or dissatisfaction rather than independent nominal classes. As emphasized by Wu et al. [9], perceived environmental dissatisfaction should therefore be treated as an ordinal variable whose mathematical structure reflects gradual transitions between neighboring perception states.
Despite this characteristic, many existing data-driven IEQ prediction models formulate perception assessment either as regression problems or as conventional multiclass classification tasks, thereby disregarding the ordinal structure of subjective responses. This simplification may reduce model interpretability and produce inconsistent predictions because errors between adjacent dissatisfaction levels receive the same penalty as errors between opposite ends of the perception scale. Since Likert-type responses naturally encode ordered perceptual intensities, preserving this ordinal information is fundamental for developing predictive models that remain consistent with human environmental perception [16,17].
The need to quantify environmental dissatisfaction has motivated the development of predictive models relating measurable environmental parameters to subjective comfort responses [17,18,19,20]. Dissatisfaction emerges when environmental conditions fail to satisfy occupants’ physiological and psychological expectations across thermal, acoustic, visual, and indoor air quality domains. Early approaches focused primarily on identifying linear relationships between environmental variables and perceived comfort. However, increasing evidence suggests that these relationships are highly nonlinear, multidimensional, and strongly dependent on contextual and behavioral factors [18].
Artificial Neural Networks (ANNs) have demonstrated important advantages over deterministic approaches in IEQ applications because of their ability to capture complex nonlinear relationships between environmental measurements and psychophysiological responses [19,20,21,22]. In contrast, traditional comfort indices such as PMV–PPD exhibit well-recognized limitations in naturally ventilated buildings and under real operating conditions, particularly in tropical and subtropical climates [5,19]. These discrepancies arise because environmental dissatisfaction depends not only on measurable physical variables but also on psychological adaptation, previous expectations, perceived environmental control, and contextual factors [23,24]. While Fanger’s PMV–PPD model was originally developed under controlled laboratory conditions [25], more recent investigations have progressively adopted data-driven and machine learning techniques to estimate occupants’ environmental perception under realistic operating conditions [26,27].
Consequently, developing predictive models that explicitly preserve the ordinal structure of subjective dissatisfaction while simultaneously integrating multiple IEQ domains has become an important research challenge. Such models should not only estimate dissatisfaction levels but also provide interpretable information regarding the relative influence of environmental variables and the probabilistic transitions between different perception states.
Ordinal learning approaches provide an alternative strategy by explicitly incorporating the hierarchical relationships among response categories during model training. In this context, the Consistent Rank Logits (CORAL) framework reformulates ordinal classification by estimating cumulative probabilities while enforcing rank consistency across ordered classes [28,29]. This characteristic is particularly attractive for IEQ perception modeling because transitions between dissatisfaction levels occur progressively rather than as abrupt categorical changes [23,26].
Recent contributions have further demonstrated the influence of specific IEQ components on cognitive and perceptual outcomes. For instance, Cho and Moon [21] and Temprano et al. [30] reported measurable effects of elevated concentrations on cognitive performance, whereas Alam et al. [31] identified indoor air quality and acoustics as dominant predictors of perceived discomfort. Likewise, stochastic and time-series approaches have been proposed to anticipate discomfort conditions before conventional environmental limits are exceeded [20,21,31].
Although these studies demonstrate the potential of data-driven approaches for IEQ assessment, they generally emphasize predictive performance while providing limited insight into how environmental variables jointly contribute to perceived dissatisfaction. Moreover, robust validation strategies capable of preventing information leakage during model selection remain relatively uncommon in studies based on limited psychophysical datasets, potentially leading to optimistic estimates of predictive performance [32,33]. These limitations motivate the development of predictive frameworks that simultaneously preserve ordinal perception, provide interpretable environmental information, and employ unbiased validation procedures.
Within this context, the present study proposes a probabilistic framework for estimating the Predicted Probability of Dissatisfaction Index () from the perspective of university professors exposed to real classroom environments.
The is defined as a probabilistic ordinal index that represents professors’ perceived dissatisfaction with indoor environmental quality (IEQ). Instead of providing only the final predicted dissatisfaction category, it estimates the probability associated with each ordered dissatisfaction level from multidimensional environmental measurements.
Rather than predicting isolated environmental indicators, the framework integrates operative temperature, carbon dioxide concentration, illuminance, and sound pressure level to estimate ordinal dissatisfaction levels based on subjective perception. In addition to estimating dissatisfaction, it investigates the relative contribution of each IEQ domain, characterizes probabilistic transition regions through sensitivity analysis, and explores the latent representations learned by the neural network.
The model is evaluated using a Nested Stratified Grouped Cross-Validation protocol, which separates model selection from final performance estimation while accounting for repeated observations collected from the same professors. Its predictive performance is compared with Ordinal Logistic Regression, Random Forest, Support Vector Machine, XGBoost, and a conventional Artificial Neural Network, thereby providing an unbiased assessment of ordinal deep learning under realistic experimental conditions.
The proposed approach also functions as a virtual sensing framework, allowing the to be estimated directly from routinely measured IEQ variables without requiring continuous subjective surveys. A CORAL-based ordinal neural network preserves the ordered structure of questionnaire responses, while predictor contribution analysis, One-Factor-at-a-Time (OFAT) probability-response curves, and Principal Component Analysis (PCA) of latent representations improve the interpretation of the relationship between environmental conditions and perceived dissatisfaction.
2. Materials and Methods
This study employed an observational research design to investigate the relationship between indoor environmental conditions in university classrooms and professors’ perceived indoor environmental quality (IEQ). Four environmental variables representing the thermal, air quality, visual, and acoustic domains of IEQ were monitored during regular teaching activities: operative temperature (), carbon dioxide concentration (), illuminance (), and sound pressure level (). Simultaneously, subjective evaluations of the classroom environment were collected from professors using standardized questionnaires.
The methodological framework comprised four main stages: (i) environmental monitoring, (ii) collection of subjective perception data, (iii) exploratory statistical analysis, and (iv) development and evaluation of predictive ordinal machine learning models to investigate the relationship between objective environmental measurements and perceived indoor environmental quality.
2.1. Study Site and Data Collection
Data collection was conducted in classrooms at a higher education institution in Southern Brazil, a region with a Cfb climate characterized by mild summers and winters, with average temperatures below 18 °C [34]. The monitored classrooms, constructed of ceramic block masonry, have an average floor area of approximately , a ceiling height of , and a seating capacity of up to 42 students.
The buildings feature aluminum sliding windows with single glazing, predominantly oriented along the east–west axis, which influences the solar thermal load. The classrooms are equipped with recirculating ceiling fans; however, during the monitoring campaign, ventilation relied exclusively on the natural opening of windows and doors. Consequently, air renewal and dilution depended entirely on natural ventilation, creating conditions in which thermal comfort and indoor air quality were directly influenced by window-opening practices and outdoor climatic conditions.
Four environmental variables were selected to represent the main domains of indoor environmental quality (IEQ) in educational buildings: operative temperature (), carbon dioxide concentration (), illuminance (), and sound pressure level (). These variables correspond to the thermal, indoor air quality, visual, and acoustic domains of IEQ, respectively, which are widely recognized as the primary environmental factors influencing occupants’ comfort and performance in educational environments.
Following the thermodynamic principles discussed by Broday et al. [35], operative temperature was adopted as the thermal comfort indicator because it integrates the combined effects of air temperature and mean radiant temperature, providing a physiologically meaningful measure of the thermal environment. Likewise, Pereira and Broday [36] emphasize that acoustic comfort should be assessed using sound pressure levels expressed in decibels, since human perception of sound follows a logarithmic rather than a linear response.
The response variable corresponded to the professors’ overall evaluation of classroom indoor environmental quality, recorded immediately after each monitored class using a five-point Likert scale with the categories Excellent, Good, Medium, Poor, and Very Poor. These ratings served as the target variable for the predictive framework.
During the monitoring campaign, however, no responses were recorded in the two extreme categories (Excellent and Very Poor). Consequently, only the observed response categories were considered during predictive modeling, and the original ratings were reformulated into three ordinal dissatisfaction levels: Low Dissatisfaction (Good), Moderate Dissatisfaction (Medium), and High Dissatisfaction (Poor). This reformulation did not remove any observations from the dataset; rather, it eliminated empty response categories while preserving the ordinal structure of the original questionnaire, thereby providing an outcome variable consistent with both the empirical data and the assumptions of ordinal learning. The resulting class distribution is presented in Table 1.
Table 1.
Dataset class distribution and scale adjustment ().
The environmental variables (, , , and ) were used as predictor variables, whereas the three-level ordinal dissatisfaction outcome served as the response variable throughout the predictive modeling stage.
The proposed framework estimates the Predicted Probability of Dissatisfaction Index () from the measured indoor environmental conditions and the corresponding questionnaire responses. A formal definition of the proposed index and its probabilistic interpretation are presented in the CORAL Neural Network subsection.
2.2. Dataset Construction and Characterization
The study comprised 77 teaching sessions monitored during regular academic activities between March 2024 and June 2025. Data collection covered all four seasons (autumn, winter, spring, and summer), encompassing a broad range of indoor environmental conditions under naturally varying climatic scenarios. The monitoring campaign involved 22 university classrooms and 13 professors. Individual professors contributed between one and 17 teaching sessions (median = 5), resulting in repeated observations for several professors. Accordingly, each teaching session constituted one observation in the predictive dataset because it represented a unique combination of environmental conditions and subjective perception.
Each experimental unit comprised two consecutive 50-min classes (approximately 100 min). During this period, the environmental variables were continuously recorded using the AURA® IEQ Discoverer system, while positioned at a representative location inside the classroom. Immediately after the monitored teaching session, the corresponding professor completed the subjective IEQ questionnaire. The environmental variables associated with each experimental unit were obtained by calculating the arithmetic mean of all measurements acquired throughout the monitoring period. These aggregated environmental measurements were subsequently paired with the corresponding subjective evaluation, producing a single observation for model development. Consequently, repeated sensor readings acquired during the same teaching period were not treated as independent samples. The resulting predictive dataset therefore consisted of 77 observations, each corresponding to one monitored teaching session.
Localized indoor pollutants associated with teaching activities, such as particulate matter generated by chalk use (/) or volatile organic compounds emitted by whiteboard markers, were beyond the scope of this study and were therefore not monitored. Consequently, the predictive models were developed using only the four primary physical IEQ domains.
Table 2 summarizes the operational conditions adopted throughout the monitoring campaign.
Table 2.
Operational boundary conditions during data collection.
Environmental variables were measured using the integrated Aura® IEQ Discoverer instrument developed at the University of Coimbra (Coimbra, Portugal) [37], which simultaneously records operative temperature (°C), carbon dioxide concentration (, ppm), illuminance (lux), and sound pressure level (dB). The experimental measurement setup used during data acquisition is illustrated in Figure 1, which shows the instruments’ positions within the classroom environment. Measurements were taken at a representative location approximately above the floor, corresponding to the breathing zone of seated occupants, in accordance with established standards [38]. Calibration procedures were conducted using certified reference instruments, including a Brüel & Kjær Type 1212 Thermal Comfort Meter (Brüel & Kjær, Nærum, Denmark) and Trotec DL200X and DL200L data loggers (Trotec GmbH, Heinsberg, Germany). The expanded measurement uncertainties ( confidence level) were ±0.2 °C for operative temperature, for relative humidity, and for concentration.
Figure 1.
Measurement equipment setup.
Subjective perception data were collected using validated questionnaires completed immediately after each monitored teaching session. The study was approved by the institutional Ethics Committee (CAAE 68457223.0.0000.0177), and all participants provided informed consent.
As presented in Table 1, no responses were recorded in the two extreme categories of the original five-point Likert scale. Consequently, no observations were excluded from the analysis. Therefore, the original five-level scale was represented by the three observed ordinal categories, preserving the ordinal structure of the response variable while avoiding empty output classes during model development and evaluation. This response representation was established before model training and was applied consistently across all evaluated predictive models. This representation is consistent with the objective of predicting the dissatisfaction level.
The distribution of observations across the three dissatisfaction levels reflects the natural variability of subjective responses collected under real classroom operating conditions. Because class imbalance may bias conventional performance measures, model performance was assessed using complementary evaluation metrics, including overall Accuracy, Balanced Accuracy, macro-averaged F1 score, class-wise recall, and the Quadratic Weighted Cohen’s Kappa (QWK), which accounts for the ordinal nature of the response variable.
To prevent information leakage during model selection and to obtain an unbiased estimate of predictive performance while accounting for repeated observations from the same professor, model performance was estimated using a Nested Stratified Grouped Cross-Validation strategy [32,33]. Because responses from the same professor could not be considered statistically independent, professor identity was adopted as the grouping variable. Consequently, all observations associated with the same professor were assigned exclusively to either the training or the testing partition within each fold.
The outer loop consisted of five stratified grouped folds used exclusively for out-of-sample performance estimation, whereas the inner loop consisted of four stratified grouped folds used for model selection. Both cross-validation loops employed shuffled partitions with a fixed random seed to ensure reproducibility. Stratification preserved, as far as permitted by the grouping constraint, the relative distribution of the three ordinal response classes across the folds.
Before model training, the three-level ordinal response variable was encoded according to the cumulative binary representation adopted by the CORAL framework, thereby preserving the ordinal relationship among dissatisfaction levels. Within each cross-validation fold, the predictor variables were standardized using z-score normalization. The normalization parameters were estimated exclusively from the training partition of each fold and subsequently applied to the corresponding validation or test partition. This procedure prevented information leakage between data partitions while improving numerical stability and optimization convergence during model training.
The resulting dataset is also comparable in size to those reported in previous IEQ field investigations based on synchronized environmental measurements and subjective perception surveys. Rather than emphasizing large cross-sectional populations, studies of this nature generally prioritize detailed environmental characterization under real operating conditions. As summarized in Table 3, the sample size considered in the present study is comparable to, or greater than, those adopted in representative investigations. For example, Mui et al. [17] developed predictive logistic regression and probability indexing models using data collected from 52 residents. Zhang and Bluyssen [39] evaluated multisensory environmental exposure using a cohort of 54 teachers, whereas Carton, Kolarik, and Breesch [23] performed statistical analyses based on field measurements obtained from 58 students.
Table 3.
Comparison of sample sizes reported in representative IEQ field studies.
2.3. CORAL Neural Network
Although previous studies on indoor environmental quality (IEQ) have employed both linear and nonlinear approaches to investigate occupant satisfaction, linear models remain limited in their ability to capture complex interactions among environmental variables and the stochastic nature of human perception [1,2,19]. In particular, IEQ is influenced by multiple interdependent factors—such as thermal, acoustic, and air quality conditions—that interact nonlinearly and affect occupants’ comfort, cognition, and well-being [3,18,40]. Furthermore, classical regression approaches rely on assumptions such as linearity and homoscedasticity, which are often restrictive for perceptual data [41,42]. This limitation is especially relevant when dealing with ordinal (Likert-type) scales, where adjacent response categories represent an ordered progression rather than equally spaced numerical values. In such cases, ordinal statistical frameworks provide a more appropriate modeling approach [16,43].
In this study, the dependent variable represented perceived dissatisfaction with overall indoor environmental quality and comprised three ordered categories: Low, Moderate, and High Dissatisfaction. Machine learning approaches have been increasingly applied to IEQ prediction due to their ability to model complex nonlinear relationships compared with traditional statistical methods [21,22,31,44]. However, most existing studies focus on predicting continuous IEQ indicators or modeling occupant satisfaction using conventional machine learning approaches, without explicitly accounting for the ordinal structure of Likert-scale responses. Preserving this ordinal information is essential because the response categories represent an ordered progression rather than independent nominal classes.
To address these challenges and preserve the ordinal structure of the response variable, this study adopts the Consistent Rank Logits (CORAL) neural network architecture, an ordinal learning framework specifically designed for ordered classification problems [28,29,43]. Unlike conventional multiclass classification neural networks, CORAL enforces monotonicity constraints on the model outputs, ensuring probabilistic consistency across ordered categories. Instead of predicting each category independently, CORAL reformulates the ordinal classification problem as a sequence of cumulative binary classification tasks that share a common latent representation and ordered decision thresholds. This strategy preserves the ordinal structure of the perception scale, leading to probabilistically consistent and more interpretable predictions.
Given an ordinal response variable with K ordered categories indexed as , the CORAL framework decomposes the original ordinal classification problem into cumulative binary classification tasks. For each threshold , the cumulative binary target is defined as
where denotes the indicator function.
For the three-class problem considered in this study (), the cumulative encoding adopted by the CORAL framework is summarized in Table 4.
Table 4.
Cumulative binary encoding adopted by the CORAL framework for the three ordinal dissatisfaction classes.
Therefore, for an ordinal problem with K ordered categories, the CORAL network contains output neurons, each estimating one cumulative probability associated with a binary classification task.
Each output neuron estimates the cumulative probability that the dissatisfaction category exceeds threshold j, given by
where denotes the input feature vector, denotes the shared latent scoring function, represents the jth ordered decision threshold, and denotes the logistic sigmoid function, defined as
The latent score is obtained from the nonlinear transformation of the input feature vector performed by the hidden layers of the neural network. This shared latent representation is used by all cumulative binary classifiers to estimate the cumulative probabilities associated with the ordered dissatisfaction categories. To preserve the ordinal structure of the target variable, CORAL enforces ordered decision thresholds:
In the implementation adopted in this study, the ordered decision thresholds were parameterized as cumulative sums of positive increments obtained by applying the Softplus transformation to trainable threshold parameters. This parameterization guarantees that the thresholds remain strictly ordered throughout the optimization process.
As a consequence, the cumulative probabilities satisfy
The cumulative probabilities are subsequently converted into class probabilities as follows:
For the three-class outcome considered in this study, the reconstructed class probabilities define the proposed Predicted Probability of Dissatisfaction Index ():
where the three components represent the estimated probabilities of Low, Moderate, and High Dissatisfaction, respectively, given the measured indoor environmental conditions .
Unlike the classical Predicted Percentage of Dissatisfied (PPD) introduced by Fanger [25], which estimates the percentage of thermally dissatisfied occupants from the Predicted Mean Vote (PMV), the proposed represents the estimated probability distribution of professors’ perceived dissatisfaction with overall indoor environmental quality inferred from measured thermal, indoor air quality, visual, and acoustic variables.
The reconstructed class probabilities constituting the proposed were subsequently used in the One-Factor-at-a-Time (OFAT) probability analysis described in Section 3.3.3. Rather than using the cumulative probabilities directly, the OFAT analysis was performed on the reconstructed class probabilities to characterize the probabilistic transitions among the ordinal dissatisfaction levels.
The model parameters are estimated by minimizing the cumulative binary cross-entropy loss function :
where denotes the set of trainable neural network parameters, including the weight matrices and bias vectors; and denotes the vector of ordered decision thresholds.
This loss function jointly optimizes the network weights and the ordered decision thresholds while preserving the ordinal structure of the classification problem. Consequently, the CORAL framework maintains ordinal consistency and allows the neural network to model potential nonlinear relationships among the IEQ variables without treating the dissatisfaction levels as independent classes.
The selection of CORAL over conventional multiclass neural network approaches was motivated by its ordinal-aware formulation. Unlike standard multiclass models, which generally treat the target categories as independent, CORAL reformulates ordinal regression as a sequence of rank-consistent cumulative binary classification tasks with shared weight parameters across threshold classifiers [43]. This architecture is designed to preserve the ordering of the cumulative predicted probabilities and reduce rank violations between adjacent dissatisfaction levels. Such a formulation is appropriate for perceived IEQ assessment because the transition from low to moderate and High Dissatisfaction represents an ordered progression rather than a set of unrelated states.
Ordinal learning strategies have also been applied to subjective human-response problems, including perception- and emotion-related tasks, in which the ordering among categories contains relevant information [28]. More recent rank-consistent neural network formulations have similarly emphasized the preservation of ordinal relationships in probabilistic prediction problems [29].
In addition, the shared-parameter structure of CORAL avoids estimating completely independent parameters for each cumulative binary task. This structure may be advantageous in limited-sample settings; however, its effect on model stability and generalization remains dependent on the validation procedure and the characteristics of the dataset.
2.4. Computational Implementation
The predictive framework was implemented in Python (v. 3.10) using TensorFlow/Keras within the Google Colaboratory environment. Due to the relatively small sample size (), characteristic of synchronized IEQ field studies involving subjective occupant responses [1,14,23,24], particular attention was devoted to controlling overfitting and ensuring robust model evaluation. Previous studies have emphasized that psychophysical perception datasets frequently exhibit high variability and limited sample sizes, requiring careful regularization and resampling strategies to obtain reliable estimates of model generalization [7,20,37].
The predictive dataset consisted of four environmental variables—operative temperature, carbon dioxide concentration, illuminance, and sound pressure level—and the corresponding ordinal dissatisfaction class derived from the proposed index. Given the characteristics of this relatively small psychophysical dataset, the computational framework was designed to minimize overfitting, prevent information leakage, and provide an unbiased estimate of predictive performance.
To accomplish these objectives, all stages of model development were performed within a Nested Cross-Validation framework, which explicitly separates model selection from final model evaluation and provides an unbiased estimate of predictive performance [32,33]. The complete training pipeline incorporated grouped data partitioning, feature standardization, class-weight estimation, systematic hyperparameter optimization, regularization techniques, and fixed random seeds for NumPy and TensorFlow (seed = 42) to improve experimental reproducibility. These procedures ensured that all preprocessing and model-selection steps were carried out exclusively using the training data associated with each validation fold, thereby preventing optimistic bias during performance estimation.
In addition, the proposed CORAL framework and the benchmark Artificial Neural Network (ANN) shared the same candidate network architectures, optimization strategy, preprocessing pipeline, and validation protocol. Consequently, differences in predictive performance can be attributed primarily to the ordinal learning formulation rather than to differences in network architecture or training methodology.
The following subsections describe the Nested Cross-Validation strategy, the hyperparameter optimization procedure, and the benchmark models used for model selection and unbiased performance evaluation. Upon completion of this procedure, a representative CORAL architecture was selected, retrained using the complete dataset, and subsequently employed exclusively for the model interpretability analyses presented in Section 3.3, including the confusion matrix, predictor contribution analysis, One-Factor-at-a-Time (OFAT) probability analysis, and exploratory latent-space visualization through Principal Component Analysis (PCA).
2.4.1. Nested Cross-Validation
To obtain an unbiased estimate of predictive performance while preventing information leakage during model development, all experiments were conducted using a Nested Cross-Validation framework, which explicitly separates model selection from final model evaluation through two independent validation loops [32,33]. As illustrated in Figure 2, the proposed workflow begins with the complete dataset and sequentially partitions the procedures associated with model selection, hyperparameter optimization, and final performance evaluation. While the inner loop is exclusively responsible for model selection and hyperparameter optimization, the outer loop provides an unbiased estimate of the model’s generalization performance using data that remain completely unseen throughout the optimization process.
Figure 2.
Nested StratifiedGroupKFold workflow illustrating the separation between model selection (inner loop) and unbiased performance evaluation (outer loop).
The outer validation procedure employed a five-fold StratifiedGroupKFold strategy. In each iteration, one fold was reserved as an independent test partition, while the remaining four folds constituted the corresponding outer-training partition. Consequently, every observation served exactly once as unseen test data, and all reported performance metrics correspond to the mean and standard deviation computed across the five outer folds.
Grouping was performed according to professor identity, ensuring that observations associated with the same professor were never assigned simultaneously to the training and testing partitions. This design reduces statistical dependence among samples and provides a more realistic estimate of model generalization under previously unseen instructional conditions. At the same time, stratification preserved the relative proportions of the three ordinal dissatisfaction classes across all folds, mitigating the effects of class imbalance throughout the validation process.
Within each outer-training partition, an independent four-fold StratifiedGroupKFold procedure was used to optimize the neural network architecture, activation function, and dropout configuration. For the proposed CORAL framework, the ordinal decision threshold was simultaneously selected by maximizing the mean Quadratic Weighted Cohen’s Kappa (QWK) across the inner-validation folds. During this optimization process, predictor variables were standardized using a StandardScaler fitted exclusively on each inner-training subset and subsequently applied to the corresponding validation subset. After the optimal configuration had been identified, a new model was trained on the corresponding outer-training partition using the selected architecture, while reserving an internal validation split exclusively for early stopping. The benchmark ANN followed the same optimization procedure, except for threshold selection, whereas the remaining machine learning models were trained using the identical outer-training partitions.
All preprocessing operations were fully embedded within the nested validation framework. During the outer evaluation, feature scaling was estimated exclusively from the corresponding outer-training partition before being applied to the unseen outer-test partition. Likewise, class weights were computed independently for every training partition to compensate for class imbalance. As a result, feature scaling, class-weight estimation, architecture selection, hyperparameter optimization, threshold optimization, and early stopping were performed without access to any information from the outer-test partitions, thereby preventing information leakage throughout model development.
Finally, the optimized models were evaluated on the previously unseen outer-test partition. Predictive performance was quantified using Accuracy, Balanced Accuracy, Macro-F1, Quadratic Weighted Cohen’s Kappa (QWK), Mean Absolute Error (MAE), and Root Mean Squared Error (RMSE), with the final results reported as the mean and standard deviation across the five outer folds.
This validation protocol provides an unbiased estimate of the expected generalization performance of the proposed framework while substantially reducing the optimistic bias associated with performing model selection outside the cross-validation process [32,33].
2.4.2. Hyperparameter Optimization
Hyperparameter optimization was performed exclusively within the inner loop of the Nested Cross-Validation framework described in Section 2.4.1. Consequently, all model-selection procedures were performed using only the corresponding outer-training partition, ensuring that neither architectural optimization nor threshold selection had access to the independent outer-test partition.
Given the relatively small size of the psychophysical dataset, a targeted hyperparameter search was adopted instead of an exhaustive exploration of the search space. Three candidate feed-forward network topologies were investigated, comprising one hidden layer with 8 neurons, one hidden layer with 16 neurons, and two hidden layers containing 16 and 8 neurons, respectively. These architectures were combined with ReLU or hyperbolic tangent (tanh) activation functions and different dropout configurations, resulting in eight candidate neural network architectures.
To ensure a fair comparison, both the conventional ANN and the proposed CORAL framework shared the same candidate architectures, activation functions, optimization algorithm, regularization strategy, preprocessing pipeline, and training protocol. The only architectural distinction concerned the output layer: whereas the ANN employed a conventional Softmax classifier, CORAL replaced the Softmax layer with an ordinal output layer composed of cumulative binary classifiers.
Model training employed the Adam optimizer with a learning rate of and regularization. Early stopping monitored the validation loss and restored the weights corresponding to the best validation performance. To mitigate class imbalance, class weights were independently estimated for each training partition and applied during network optimization.
Unlike the conventional ANN, the proposed CORAL framework also requires the optimization of a decision threshold to convert cumulative probabilities into ordinal class predictions. Therefore, both the neural network architecture and the decision threshold were jointly optimized during the inner validation procedure. Candidate threshold values uniformly distributed between 0.35 and 0.65 (15 equally spaced values) were evaluated, and the threshold maximizing the mean Quadratic Weighted Cohen’s Kappa (QWK) across the inner-validation folds was selected for each candidate architecture.
The mean QWK across the inner-validation folds was adopted as the primary model-selection criterion because it explicitly accounts for the ordinal structure of the response variable while assigning progressively larger penalties to disagreements between more distant ordinal categories. After selecting the optimal model configuration for each outer-training partition—including the network architecture, activation function, dropout configuration, and, for CORAL, the corresponding decision threshold—a new model was retrained on the associated outer-training partition using an internal validation split exclusively for early stopping before being evaluated on the previously unseen outer-test partition.
The principal hyperparameters adopted throughout the optimization procedure are summarized in Table 5.
Table 5.
Training hyperparameters adopted during the optimization procedure.
2.5. Model Interpretability and Sensitivity Analysis Framework
Following completion of the benchmark procedure described in the previous subsections, a representative CORAL model was selected according to the Nested Cross-Validation results and subsequently retrained using the complete dataset while preserving the selected network architecture and structural hyperparameters. This final fitted model was employed exclusively for the interpretability analyses presented in this subsection and was not used to estimate predictive performance.
To transform the CORAL architecture from a predictive “black-box” into an interpretable decision-support framework, complementary interpretability analyses were performed using the retrained representative model. These analyses comprised One-Factor-at-a-Time (OFAT) probability-response analysis and permutation feature importance. The OFAT procedure characterized the dynamic behavior of the index by varying each indoor environmental quality (IEQ) predictor ( concentration, operative temperature, sound pressure level, and illuminance) individually across its observed operational range while the remaining predictors were fixed at their median values.
The CORAL framework models cumulative ordinal probabilities through a shared-threshold decomposition of the ordinal target variable [16]. Since the network outputs cumulative probabilities, , a decision threshold is required to convert these probabilities into discrete ordinal predictions, . During the benchmark procedure, the decision threshold was optimized independently within each inner cross-validation loop by maximizing the Quadratic Weighted Cohen’s Kappa (QWK), thereby avoiding information leakage into the outer-test partitions. The optimized thresholds obtained across the five outer folds yielded a mean value of . Consequently, the representative model adopted the rounded mean threshold, , for all interpretability analyses.
The representative threshold was used to convert cumulative probabilities into ordinal predictions according to
where denotes the cumulative probability associated with the jth ordinal threshold and denotes the representative decision threshold adopted by the retrained CORAL model.
For each environmental predictor, One-Factor-at-a-Time (OFAT) analysis was performed by varying the selected predictor over its observed range while fixing the remaining predictors at their median values. The trained CORAL model produced two cumulative probabilities, denoted by and . Class probabilities were then reconstructed as
corresponding to the probabilities of Low, Moderate, and High Dissatisfaction, respectively.
For each environmental predictor, the decision boundary was identified as the first value within the evaluated OFAT grid at which the predicted dissatisfaction class changed from one ordinal category to the next. These transition points therefore represent model-derived probabilistic decision boundaries inferred from the fitted CORAL model under controlled variations in individual predictors. They should not be interpreted as universal physiological thresholds or standardized IEQ limits.
To complement the OFAT sensitivity analysis, the relative importance of each environmental predictor was quantified using permutation feature importance. Predictor importance was estimated by repeatedly permuting each input variable while measuring the corresponding reduction in Quadratic Weighted Cohen’s Kappa (QWK). The resulting importance scores were normalized to obtain the relative contribution of each environmental predictor.
Together, the permutation-based feature importance and the OFAT probability-response curves provide complementary perspectives on the nonlinear relationships learned by the proposed CORAL framework. Whereas permutation importance quantifies the overall contribution of each predictor to the model performance, the OFAT analysis illustrates how controlled variations in individual environmental variables influence the predicted dissatisfaction probabilities. Consequently, the proposed index constitutes an interpretable virtual-sensing framework for identifying environmental conditions associated with changes in faculty members’ perceived dissatisfaction.
2.6. Exploratory PCA of the Learned Latent Representation
To complement the probability-response analysis, an exploratory analysis of the learned latent representation was performed using Principal Component Analysis (PCA). PCA is a widely adopted dimensionality reduction technique that projects high-dimensional data onto orthogonal components capturing the largest sources of variance, thereby facilitating visualization and exploratory analysis [45].
After retraining the representative CORAL model using the complete dataset, PCA was applied to the activations of the last hidden layer learned by the CORAL network from operative temperature (), carbon dioxide concentration (), illuminance (E), and sound pressure level (L).
Consequently, the resulting projection summarizes the nonlinear feature representation learned during ordinal classification rather than the original environmental measurements.
The resulting two-dimensional PCA projection was used exclusively as an exploratory visualization of the learned latent representation. The corresponding projection and its interpretation are presented in Section 3.3.4.
Unlike visualizations based on the original environmental variables, the latent-space projection reflects the internal feature representation learned by the neural network. Therefore, the principal components should not be interpreted as physical environmental dimensions or perceptual thresholds. Instead, they provide an interpretable visualization of the learned feature geometry, allowing a qualitative assessment of how the nonlinear transformations performed by the CORAL architecture organize the ordinal dissatisfaction classes [28,29,43].
It should be emphasized that PCA is used exclusively as an exploratory visualization tool. The principal components are linear combinations of the learned latent features and do not have direct physical meaning. Their purpose is to facilitate the qualitative interpretation of the latent representation learned by the CORAL model rather than to establish new environmental indices or decision boundaries.
The PCA analysis was designed to complement the permutation-based feature importance and the OFAT probability-response analysis by providing an additional qualitative visualization of the latent feature space learned by the representative CORAL model.
2.7. Computational Implementation and Generative AI Disclosure
The computational pipeline, statistical analyses, and machine learning modeling procedures were implemented using Python (v. 3.10) within the Google Colaboratory environment. The implementation relied on specialized scientific computing, machine learning, and visualization libraries, including TensorFlow (v. 2.14.0), Keras (v. 2.14.0), Scikit-Learn (v. 1.2.2), Matplotlib (v. 3.7.1), Seaborn (v. 0.12.2), NumPy (v. 1.23.5), and Pandas (v. 2.0.3). All preprocessing procedures, Nested Cross-Validation routines, hyperparameter optimization, representative model retraining, statistical hypothesis testing (Wilcoxon signed-rank test), confusion matrix generation, permutation-based feature importance, One-Factor-at-a-Time (OFAT) sensitivity analysis, and latent-space Principal Component Analysis (PCA) were implemented using custom Python scripts developed specifically for this study.
To support transparency and reproducibility, the computational workflow, including model architecture specifications, Nested Cross-Validation procedures, retraining of the representative CORAL model, and analysis procedures, is fully described in the present manuscript. The dataset analyzed during this study may be made available from the corresponding author upon reasonable request, subject to institutional and ethical restrictions related to human participant data.
In compliance with journal policies regarding advanced digital tools, generative artificial intelligence tools were used during the preparation of this manuscript solely to assist with language refinement, grammatical correction, structural organization, and improvement of technical clarity. The use of these tools was limited to editorial support and was not involved in data collection, dataset generation, statistical analysis, machine learning model development, interpretation of results, or formulation of scientific conclusions.
3. Results
The experimental evaluation was conducted in two complementary stages. First, the proposed CORAL (Consistent Rank Logits) framework was benchmarked against conventional statistical and machine learning models using a strict 5-fold Nested Stratified Grouped Cross-Validation (Nested CV) scheme. This stage provided an unbiased comparison of predictive performance while identifying a representative CORAL architecture through independent hyperparameter optimization, threshold calibration, and statistical comparison using Wilcoxon signed-rank tests. Subsequently, the representative CORAL architecture selected during the benchmark was retrained using the complete dataset and employed exclusively for the model interpretability analyses presented in Section 3.3, including the confusion matrix, permutation-based feature importance, One-Factor-at-a-Time (OFAT) probability-response analysis, and latent-space Principal Component Analysis (PCA).
By reformulating the ordinal prediction task as a sequence of cumulative binary subproblems sharing a joint feature representation, the CORAL framework enforces rank consistency across predicted dissatisfaction levels while preventing information leakage during hyperparameter optimization and decision-threshold calibration.
This separation between benchmark evaluation and model interpretability ensures that the analyzed model corresponds exactly to the architecture selected during the benchmark, thereby maintaining methodological consistency throughout the study.
3.1. Nested Cross-Validation Model Selection and Architectural Stability
To ensure complete independence between hyperparameter optimization and performance estimation, candidate neural network architectures were evaluated strictly within the inner cross-validation loops of each outer fold. The candidate pool encompassed varying hidden-layer topologies (single and double layers), activation functions ( and tanh), and dropout rates (, , and ). For clarity, neural architectures are denoted as ReLU(16), ReLU(16–8), and tanh(8), where the numbers indicate the number of neurons in each hidden layer. In addition to providing an unbiased estimate of predictive performance, this benchmark stage identified the representative CORAL architecture subsequently retrained using the complete dataset for the model interpretability analyses.
Unlike conventional cross-validation schemes that select a single global architecture prior to evaluation, the Nested CV framework reveals the consistency of the model selection process across independent data partitions. Table 6 summarizes the optimal architectures, calibrated decision thresholds (), and associated hyperparameters selected by the inner validation loops for each of the five outer folds.
Table 6.
Selected optimal architectures, activation functions, dropout rates, and calibrated decision thresholds () for the CORAL framework across the five outer CV folds.
The hyperparameter selection frequencies revealed a consistent preference for compact neural architectures. Although four distinct configurations were selected across the five outer folds, all winning models contained one or two hidden layers with a maximum of 16 neurons, indicating that satisfactory predictive performance was achieved without increasing architectural complexity. The ReLU activation function dominated the selection process, being chosen in of the outer folds (Folds 2–5). This preference was split evenly between single-layer compact architectures (ReLU (16) in of folds) and two-layer configurations (ReLU (16–8) in of folds). The tanh activation function was selected in only a single fold (, Fold 1).
Furthermore, low dropout regularization rates ( to ) were favored in of the folds, indicating that compact, moderately regularized networks effectively prevented overfitting under the limited sample size () while preserving task-relevant feature representations.
The calibrated decision threshold exhibited moderate variability across the outer folds, yielding an average value of . The optimized thresholds ranged from 0.44 to 0.61, indicating that the conventional default threshold () was not consistently optimal across independent training partitions. This variability supports the inclusion of threshold optimization within the Nested CV framework rather than adopting a fixed decision boundary.
The architecture selection process showed that the Nested CV framework consistently favored compact CORAL models with moderate regularization and fold-specific decision thresholds. The representative architecture identified through this benchmark was subsequently retrained using the complete dataset and employed exclusively for the model interpretability analyses presented in Section 3.3.
3.2. Benchmark Model Comparison and Statistical Validation
The predictive performance of the proposed CORAL framework was evaluated against conventional statistical and machine learning approaches to contextualize its predictive capacity across alternative modeling paradigms. The benchmark suite comprised Ordinal Logistic Regression (OLR), representing a traditional parametric approach for ordered categorical responses [42,46]; a conventional multiclass Artificial Neural Network (ANN) with a Softmax output layer, which treats the dissatisfaction categories as nominal classes [47]; Random Forest (RF); Support Vector Machine (SVM) with a radial basis function kernel; and Extreme Gradient Boosting (XGBoost).
All models were evaluated using the same five-fold outer Stratified Group Cross-Validation procedure. The grouping variable was used to prevent records belonging to the same group from being distributed between the corresponding training and test partitions. For the CORAL framework and the conventional ANN, a four-fold inner Stratified Group Cross-Validation loop was used to optimize the hidden-layer architecture, activation function, and dropout rate. In addition, the CORAL inner loop jointly optimized the common classification threshold using 15 candidate values uniformly spaced between and . The remaining benchmark models were fitted using the fixed implementations and hyperparameter settings specified in the computational procedure, without an additional inner-loop hyperparameter search.
During the inner cross-validation procedure, each candidate neural network configuration was evaluated on the inner validation partitions. For each CORAL candidate configuration, QWK was calculated for every candidate threshold in each inner validation fold. The architecture–threshold combination attaining the highest mean QWK across the four inner validation folds was selected for the corresponding outer fold. The conventional ANN configurations were selected analogously according to their mean inner-validation QWK, but without threshold optimization. After model selection, the winning configuration was fitted using the corresponding outer-training data and evaluated on the outer test partition. The outer test partitions were strictly excluded from architecture and threshold selection and were reserved exclusively for out-of-sample performance estimation.
The primary evaluation metrics were Balanced Accuracy, Macro-F1 score, and Quadratic Weighted Cohen’s Kappa (QWK) [48]. Balanced Accuracy averages the recall obtained for each class and is therefore informative under unequal class distributions. Macro-F1 assigns equal importance to the class-specific F1 scores, independently of class prevalence. QWK additionally incorporates the ordered nature of the outcome by applying larger penalties to disagreements between more distant dissatisfaction categories.
Table 7 presents the out-of-sample performance obtained across the five outer test folds.
Table 7.
Out-of-sample predictive performance of the CORAL framework and benchmark models under five-fold outer Stratified Group Cross-Validation. Values represent the mean ± standard deviation across the five outer test folds.
The benchmark results indicate that no single model consistently achieved the highest value across all evaluation metrics. SVM obtained the highest mean Balanced Accuracy (), whereas RF achieved the highest mean Macro-F1 score () and QWK (). XGBoost also produced comparatively high point estimates across the three metrics.
The proposed CORAL framework achieved a mean Balanced Accuracy of , a Macro-F1 score of , and a QWK of . Its point estimates were higher than those obtained by OLR for all three metrics. Conversely, the conventional multiclass ANN produced the lowest performance among the evaluated models, including a mean QWK of , indicating substantially lower agreement with the observed ordinal labels.
Table 8 summarizes the complete hyperparameter configurations selected by the inner cross-validation procedure for the two neural network models. Considering the complete combination of hidden-layer topology, activation function, and dropout rate, the single-hidden-layer ReLU (16) configuration with a dropout rate of was selected in two of the five outer folds (40.0%), whereas each of the remaining CORAL configurations was selected in only one outer fold (20.0%). Because ReLU (16) (Dropout: 0.05) was the only complete hyperparameter configuration selected in more than one outer fold, it was adopted as the representative CORAL architecture for retraining on the complete dataset and for the subsequent model interpretability analyses.
Table 8.
Frequency of the complete neural network hyperparameter configurations selected by the inner cross-validation procedure across the five outer folds.
A single fitted CORAL model was required for the subsequent global interpretability analyses, including permutation feature importance, One-Factor-At-a-Time sensitivity analysis, the confusion matrix, and latent-space PCA. Therefore, the most frequently selected complete CORAL configuration—ReLU (16) with a dropout rate of —was adopted as the representative architecture. It was the only identical complete CORAL configuration selected in more than one outer fold. Although the ReLU (16,8) topology also appeared twice, those occurrences involved different dropout rates ( and ) and consequently represented distinct complete hyperparameter configurations.
The representative ReLU (16) architecture was subsequently retrained using the complete dataset () for the model interpretability analyses. This full-data retraining step was performed exclusively to obtain a single representative fitted model and did not contribute to the benchmark performance estimates reported in Table 7.
The classification thresholds selected for CORAL across the five outer folds had a mean value of , ranging from approximately to . This variation indicates that the default probability threshold of was not consistently optimal across the different training partitions and supports the optimization of exclusively within the inner validation loop. These values represent the common probability thresholds used to convert the cumulative CORAL outputs into predicted ordinal classes and should not be confused with the ordered cutoffs internally learned by the CORAL output layer.
The comparatively poor performance of the conventional ANN should be interpreted cautiously. Its Softmax output treats the dissatisfaction categories as nominal classes and does not explicitly encode their ordering. By contrast, CORAL represents the ordinal outcome through cumulative binary tasks with shared weights and ordered cutoffs. In the present dataset, explicitly incorporating this ordinal structure resulted in substantially higher Balanced Accuracy, Macro-F1, and QWK than those obtained by the tested conventional ANN. However, these results do not establish that nominal neural networks are intrinsically unsuitable for all Likert-type outcomes, particularly given the limited sample size and the variability observed across the outer folds.
Figure 3 illustrates the distribution of Balanced Accuracy, Macro-F1 score, and QWK obtained across the five outer test folds.
Figure 3.
Distribution of the out-of-sample Balanced Accuracy, Macro-F1, and QWK values obtained for the CORAL framework, Ordinal Logistic Regression (OLR), Random Forest (RF), Support Vector Machine (SVM), XGBoost, and the conventional ANN across the five outer test folds.
Pairwise statistical comparisons between CORAL and each benchmark model were performed using two-sided Wilcoxon signed-rank tests applied to the five paired outer-fold QWK values. The statistical test results are presented in Table 9. None of the pairwise comparisons reached the predefined significance level of .
Table 9.
Two-sided Wilcoxon signed-rank comparisons between the outer-fold QWK values obtained by CORAL and the benchmark models.
Although CORAL achieved a substantially higher mean QWK than the conventional ANN ( versus ), the corresponding comparison did not reach statistical significance (, ). Similarly, the differences between CORAL and OLR, RF, SVM, and XGBoost were not statistically significant. These results should be interpreted considering that the Wilcoxon tests were based on only five paired outer-fold observations, which limits the statistical power and the resolution of the resulting p-values.
The benchmark results therefore do not support a claim of statistical superiority of CORAL over the competing models. RF, SVM, and XGBoost achieved higher QWK point estimates, whereas CORAL obtained higher point estimates than OLR and the conventional ANN. The representative CORAL model was retained for the subsequent interpretability analyses because the objective of the study was to examine a neural architecture that explicitly preserves the ordered structure of the dissatisfaction outcome through cumulative probabilities and rank-consistent outputs, rather than because CORAL demonstrated statistically superior predictive performance over all benchmarks.
3.3. Model Interpretability Results
The Nested Cross-Validation benchmark described in the preceding section was designed to compare the predictive performance of CORAL with the benchmark models while preventing the outer test partitions from influencing architecture selection or threshold optimization. Because the optimal CORAL configuration could differ across the outer folds, this procedure did not directly yield a single fitted model suitable for the subsequent model interpretability analyses.
A representative CORAL configuration was therefore defined from the hyperparameter selections obtained during the benchmark. The complete configuration comprising one hidden layer with 16 ReLU units and a dropout rate of 0.05 was selected in two of the five outer folds (40.0%), whereas each remaining complete configuration was selected only once (20.0%). Consequently, ReLU (16) with a dropout rate of 0.05 was adopted as the representative architecture because it was the most frequently selected complete hyperparameter configuration across the Nested Cross-Validation procedure.
The representative model retained the structural and training hyperparameters used during the benchmark, including the ReLU activation function, a dropout rate of 0.05, an Adam learning rate of , an regularization coefficient of , a batch size of 8, and class-balanced sample weights. The common classification threshold was fixed at , corresponding to the mean of the thresholds selected independently across the five outer folds. After standardizing the four predictors using parameters estimated from the complete dataset, the representative CORAL model was trained using all available observations ().
This full-data model was used exclusively for model interpretation. Its results did not contribute to the out-of-sample benchmark estimates reported in Table 7. Accordingly, the accuracy, QWK, confusion matrix, predictor contributions, OFAT response curves, decision boundaries, and latent-space PCA presented in this section describe the behavior of the representative model fitted to the complete dataset and should not be interpreted as independent estimates of generalization performance.
Four complementary analyses were conducted. First, a row-normalized confusion matrix was calculated to describe the fitted model’s classification behavior on the complete dataset. Second, Permutation feature importance was used to quantify the relative contribution of each IEQ predictor to the model’s QWK. Third, a One-Factor-at-a-Time (OFAT) analysis was performed to examine how the predicted ordinal probabilities and classes changed across the observed range of each environmental variable. Finally, PCA was applied to the representations generated by the 16-unit hidden layer to explore the internal organization of the learned latent space.
3.3.1. Classification Behavior of the Representative Model
The representative CORAL model achieved an overall Accuracy of 84.42% and a Quadratic Weighted Kappa (QWK) of 0.8276 when fitted to the complete dataset. These values represent apparent training performance and are reported exclusively to characterize the representative model used for the interpretability analyses. The corresponding estimates of predictive generalization remain those obtained from the outer folds of the Nested Cross-Validation benchmark.
Figure 4 presents the row-normalized confusion matrix of the representative CORAL model. The matrix summarizes the fitted classification behavior across the three dissatisfaction categories and complements the global performance metrics by illustrating how the model distributed correct classifications and misclassifications among the ordinal classes.
Figure 4.
Row-normalized confusion matrix of the representative CORAL model fitted to the complete dataset.
As shown in Figure 4, all observations belonging to the Low Dissatisfaction category were classified correctly, corresponding to a class-specific accuracy of 100.0%. For the Moderate category, 75.6% of the observations were correctly classified, whereas 9.8% and 14.6% were assigned to the adjacent Low and High categories, respectively. For the High Dissatisfaction category, 92.9% of the observations were classified correctly, with the remaining 7.1% assigned to the adjacent Moderate category.
No direct confusion was observed between the Low and High Dissatisfaction extremes. Instead, all misclassifications involving an extreme category occurred only with the adjacent ordinal category. This error pattern is consistent with the ordinal formulation of the CORAL framework, in which neighboring dissatisfaction levels are expected to exhibit greater similarity than the opposite ends of the response scale. Because the confusion matrix was obtained from the representative model fitted to the complete dataset, these results should be interpreted as descriptive evidence of the learned classification behavior rather than as an independent estimate of predictive generalization.
3.3.2. Permutation-Based Predictor Contribution Analysis
The global contribution of each environmental predictor was estimated using permutation feature importance. For each predictor, its values were randomly permuted while the remaining variables were kept unchanged, and the resulting reduction in QWK was recorded. This procedure was repeated 30 times using a fixed random seed. Larger decreases in QWK indicate a greater dependence of the fitted representative model on the corresponding predictor.
The mean permutation importance values were truncated at zero to avoid interpreting negative values as positive contributions. The resulting non-negative importance scores were then normalized by their sum, yielding relative contributions that totaled 100%. Consequently, the reported percentages quantify the relative dependence of the representative model on each predictor and should not be interpreted as causal effects or as proportions of explained variance.
Figure 5 presents the normalized permutation-based contributions of the four environmental predictors. Carbon dioxide concentration was the most influential predictor, accounting for 48.2% of the total normalized importance, followed by operative temperature (24.8%), sound pressure level (14.7%), and illuminance (12.4%).
Figure 5.
Relative permutation-based contributions of the environmental predictors in the representative CORAL model.
The predominance of concentration indicates that the predictive performance of the representative model was most sensitive to perturbations in this variable, whereas operative temperature provided the second largest contribution. Although sound pressure level and illuminance exhibited lower relative importance, all four environmental variables contributed positively to the predictive performance of the model, supporting the multidimensional nature of the proposed framework.
Permutation importance should be interpreted as a measure of model dependence rather than variable causality. Furthermore, because the analysis was performed using the same dataset employed to fit the representative model, the reported percentages describe the behavior of the fitted model within the present sample and should not be interpreted as independent estimates of predictor relevance in other classroom environments or populations.
The interpretation of permutation importance may also be influenced by correlations among predictors. When two environmental variables contain overlapping information, permuting one variable may underestimate or redistribute its apparent contribution because related information remains available through the correlated predictor. Consequently, the reported contributions characterize the internal dependence structure of the representative CORAL model rather than isolated effects of individual environmental variables.
3.3.3. OFAT Probability Responses and Model-Derived Decision Boundaries
The response of the representative CORAL model to each environmental predictor was investigated using a One-Factor-at-a-Time (OFAT) analysis. For each variable, a grid of 200 equally spaced values spanning the observed range of the complete dataset was generated. The predictor under evaluation was varied across this grid, whereas the remaining three predictors were fixed at their respective sample median values, thereby defining a common reference condition for all analyses.
Each synthetic input profile was standardized using the scaler fitted to the complete dataset and subsequently submitted to the representative CORAL model. The model produced two cumulative probabilities corresponding to the probabilities of exceeding the successive ordinal thresholds. These cumulative outputs were converted into class probabilities according to:
The predicted ordinal class at each grid point was obtained by counting the cumulative probabilities exceeding the common threshold , with the resulting prediction restricted to the valid class range from 0 to 2.
For each environmental variable, the model-derived decision boundary was defined as the first grid value at which the predicted ordinal class changed relative to the preceding grid point. Let denote the ordered grid values and the corresponding predicted classes. The reported decision boundary was computed as
Consequently, the reported boundary does not correspond to the intersection of class-probability curves, but rather to the first predicted-class transition detected along the OFAT grid. If multiple class transitions occurred, only the first transition was retained. Therefore, the numerical precision of the reported boundary depends on the spacing of the 200-point grid and should be regarded as an approximate model-derived value.
Figure 6 illustrates the OFAT probability-response curves obtained for the four environmental predictors. As each predictor varies individually, the remaining predictors remain fixed at their sample median values, allowing the isolated influence of each environmental variable on the predicted dissatisfaction probabilities to be visualized.
Figure 6.
OFAT probability-response curves of the representative CORAL model.
The probability curves exhibit smooth transitions between adjacent dissatisfaction categories, reflecting the cumulative ordinal formulation of the CORAL framework. The vertical dashed line in each panel indicates the first predicted-class transition identified by the computational procedure described above. Because the remaining predictors were fixed at their sample medians, the resulting curves describe conditional model responses under a common reference condition rather than observed classroom trajectories.
The corresponding numerical values of the first predicted-class transitions are summarized in Table 10. The first transition occurred at approximately 19.97 °C for operative temperature, 933.26 ppm for concentration, 158.38 lux for illuminance, and 59.16 dB for sound pressure level.
Table 10.
Model-derived OFAT decision boundaries corresponding to the first predicted-class transition.
These values should not be interpreted as universal comfort thresholds, physiological limits, recommended exposure values, or regulatory criteria. They represent model-derived transition points obtained under the specific OFAT reference condition in which one predictor varied while the remaining predictors were fixed at their sample median values. Different combinations of the remaining environmental variables would generally produce different probability trajectories and transition points.
Likewise, the OFAT curves do not represent out-of-sample predictions. Instead, they provide synthetic response profiles generated by the representative CORAL model fitted to the complete dataset. Their purpose is to illustrate the local behavior of the fitted model within the observed predictor ranges rather than to establish causal relationships or predict responses under independent environmental conditions.
Finally, the reported boundaries identify only the first predicted-class transition encountered as each predictor increases from its observed minimum to its maximum value. Depending on the learned probability profiles, subsequent transitions may also occur. Therefore, the numerical boundary values reported in Table 10 should always be interpreted together with the complete probability-response curves shown in Figure 6.
3.3.4. Exploratory Latent-Space Representation via Principal Component Analysis
As a final model-interpretation analysis, Principal Component Analysis (PCA) was applied to the latent representations learned by the representative CORAL model. Following the benchmark stage, the representative architecture (ReLU (16) with a dropout rate of 0.05) was retrained using the complete dataset (), and the activations of its single hidden layer were extracted. Because the selected architecture contains one hidden layer with 16 neurons, each observation is represented by a 16-dimensional latent activation vector before entering the ordinal output layer.
PCA was subsequently applied to these learned latent representations rather than to the four original standardized environmental variables. Consequently, the resulting principal components summarize how the neural network internally organizes the multidimensional IEQ information after nonlinear feature extraction instead of representing direct combinations of the original physical measurements.
The first latent principal component explained 36.89% of the total variance in the learned representations, whereas the second explained 22.34%. Together, the first two components retained 59.22% of the total variance, providing a two-dimensional projection that summarizes a substantial, although incomplete, portion of the information contained in the 16-dimensional latent space.
Figure 7 presents the PCA projection of the learned latent representations. Each point corresponds to one classroom observation and is colored according to its observed dissatisfaction category. The dashed ellipses summarize the within-class dispersion and orientation of the projected latent representations and are included only as descriptive visual aids.
Figure 7.
PCA projection of the latent representations generated by the representative CORAL model.
As shown in Figure 7, the projection reveals a gradual spatial organization of the dissatisfaction categories. The Moderate class occupies an intermediate region between the Low and High Dissatisfaction groups and partially overlaps both neighboring categories, which is compatible with the ordinal nature of the response variable.
The Low Dissatisfaction observations form the most compact cluster, whereas the High Dissatisfaction category exhibits greater spatial dispersion. The overlap involving the Moderate category is also consistent with the classification behavior previously observed in the confusion matrix, where Moderate Dissatisfaction presented the lowest class-specific accuracy and most prediction errors occurred between adjacent ordinal categories rather than between the two extremes of the ordinal scale.
It is important to note that the sign and orientation of the principal components are mathematically arbitrary. Consequently, the position of the Low Dissatisfaction observations predominantly on the positive side of the first principal component and the High Dissatisfaction observations on the opposite side has no intrinsic physical interpretation. Only the relative spatial organization and overlap among the categories are meaningful.
The covariance ellipses were computed from the class-specific covariance matrices and scaled using the two-dimensional 95% chi-square factor. They summarize the within-class dispersion of the projected latent representations and should not be interpreted as confidence regions or as statistical evidence of class separation.
Neither the latent neurons nor the principal components possess direct physical meaning. Instead, they represent nonlinear combinations of operative temperature, concentration, illuminance, and sound pressure level learned during network training. Therefore, the principal components should not be interpreted as individual environmental factors or physiological mechanisms.
The PCA analysis complements the previous interpretability results by providing an exploratory visualization of the latent feature space learned by the representative CORAL model. Together with the confusion matrix, permutation-based predictor contribution analysis, and OFAT probability-response curves, it helps explain how the model internally organizes multidimensional environmental information before producing ordinal dissatisfaction predictions. Because the projection was obtained from the representative model retrained on the complete dataset, these findings remain descriptive and should be validated using larger independent datasets.
4. Discussion
The discussion interprets the predictive performance, methodological implications, and practical applicability of the proposed framework. Following the workflow adopted throughout this study, the discussion is organized into three complementary parts. First, the ordinal predictive performance and robustness of the CORAL framework are analyzed in relation to the benchmark models evaluated under the Nested Stratified Group Cross-Validation protocol. Second, the environmental predictors and the model-derived perceptual transition patterns learned by the representative CORAL model are discussed based on the predictor contribution analysis and the One-Factor-at-a-Time (OFAT) response analysis. Finally, the latent representations generated by the representative CORAL model are examined through Principal Component Analysis (PCA) to explore how multidimensional indoor environmental quality (IEQ) information is internally organized and to discuss the potential of the proposed framework as a virtual sensing strategy for university classrooms.
4.1. Ordinal Predictive Performance and Model Robustness
The application of the Consistent Rank Logits (CORAL) framework to model professors’ perceived dissatisfaction under indoor environmental conditions demonstrated the potential of ordinal neural network approaches for representing ordered perception responses in IEQ assessment. Unlike conventional nominal classifiers, CORAL explicitly incorporates the ordinal structure of the outcome through cumulative probability modeling and rank-consistent outputs. Consequently, transitions between dissatisfaction levels are represented as ordered changes rather than as predictions among unrelated categories.
The predictive performance reported in this study was estimated using a five-fold Nested Stratified Grouped Cross-Validation protocol. In each outer fold, architecture selection and decision-threshold optimization were performed exclusively within the corresponding inner validation procedure. The selected architecture and threshold were subsequently evaluated on the independent outer test partition. This separation prevented the outer test observations from contributing to model selection, threshold calibration, or preprocessing estimation and provided an out-of-sample assessment of the CORAL framework and the benchmark models.
Accordingly, the reported predictive metrics characterize the generalization performance of the complete model-selection procedure rather than that of a single fixed neural network. Because both the neural architecture and the decision threshold were selected independently within each outer fold, the benchmark evaluates the predictive performance that can be expected when the entire optimization pipeline is applied to previously unseen data.
The predictive results should be interpreted in light of the complexity of modeling subjective environmental perception. Human responses to indoor environmental conditions may be influenced by physiological, behavioral, temporal, and contextual factors that are not fully represented by environmental measurements alone. In addition, the experimental dataset consisted of observations collected under real classroom operation, including naturally ventilated environments and different seasonal conditions. These characteristics increase ecological validity but also introduce variability that may limit predictive stability.
Under the Nested Cross-Validation protocol, the CORAL framework achieved an Accuracy of , Balanced Accuracy of , Macro-F1 score of , Quadratic Weighted Kappa (QWK) of , and Mean Absolute Error (MAE) of . The mean calibrated cumulative decision threshold was . These results indicate that the proposed framework achieved moderate predictive agreement while maintaining relatively balanced discrimination across the three dissatisfaction categories despite the limited sample size and heterogeneous environmental conditions.
The variation observed across the outer folds was also reflected in the architectures selected by the inner validation procedures. The ReLU activation function was selected in four of the five outer folds, whereas a tanh architecture was selected in one fold. The single-hidden-layer ReLU architecture with 16 neurons and a dropout rate of was selected in two folds, while the remaining folds selected distinct configurations. This variability indicates that no single architecture was uniformly optimal across all training partitions, reinforcing the importance of performing architecture selection independently within each outer fold rather than fixing a global architecture before performance estimation.
Although different architectures achieved the highest inner-validation performance in different outer folds, the complete configuration comprising a single hidden layer with 16 ReLU neurons and a dropout rate of was the only configuration selected more than once. For this reason, it was adopted as the representative CORAL architecture for the subsequent interpretability analyses. This choice was based on its greater selection stability across independent training partitions rather than on superior predictive performance in a single fold.
The class-wise evaluation provided additional insight into the ordinal behavior of the framework. The aggregated normalized confusion matrix showed that errors occurred predominantly between adjacent dissatisfaction categories, whereas confusion between the Low and High classes was limited. This error pattern is consistent with the ordered nature of the response variable, since subjective dissatisfaction is expected to vary progressively rather than through abrupt transitions between opposite levels.
After identifying the representative architecture through the benchmark procedure, this configuration was retrained using all available observations (). The retrained model was subsequently employed exclusively for the interpretability analyses presented in Section 3.3, including permutation-based predictor contributions, One-Factor-at-a-Time (OFAT) response analyses, and latent-space visualization. Consequently, the benchmark and interpretability analyses serve complementary purposes: the former estimates out-of-sample predictive performance, whereas the latter provides descriptive insights into the behavior of the representative model fitted to the complete dataset.
To assess the relative predictive behavior of the proposed framework, CORAL was compared with Ordinal Logistic Regression (OLR), Random Forest, Support Vector Machine (SVM), XGBoost, and a conventional Artificial Neural Network with a nominal Softmax output. All models were evaluated using the same outer partitions and model-specific inner optimization procedures, providing comparable out-of-sample evaluation conditions.
The benchmark results reveal different trade-offs among the evaluated approaches. Random Forest achieved the highest overall Accuracy (), Macro-F1 score (), and QWK (), whereas SVM achieved the highest Balanced Accuracy (). XGBoost also presented competitive performance, with a Balanced Accuracy of , Macro-F1 score of , and QWK of .
Compared with OLR, CORAL achieved lower overall Accuracy ( versus ) and a higher MAE ( versus ). Nevertheless, CORAL achieved higher Balanced Accuracy ( versus ), Macro-F1 score ( versus ), and QWK ( versus ). This result suggests that the ordinal neural framework produced a more balanced classification pattern across the dissatisfaction categories, whereas OLR obtained higher overall Accuracy but was less effective in representing all classes uniformly.
The conventional ANN presented the lowest performance among the evaluated approaches, with an Accuracy of , Balanced Accuracy of , Macro-F1 score of , QWK of , and MAE of . The contrast between CORAL and the conventional ANN suggests that explicitly incorporating the ordering of the response categories may provide a more appropriate inductive structure than treating dissatisfaction levels as independent nominal classes, particularly under small-sample and class-imbalanced conditions.
The two-tailed Wilcoxon signed-rank tests applied to the paired outer-fold QWK values did not identify statistically significant differences between the CORAL framework and any of the benchmark models at the significance level. Specifically, the comparisons yielded and for Ordinal Logistic Regression, Random Forest, and XGBoost, and for SVM, and with for the conventional ANN.
Although the descriptive performance measures indicate noticeable differences among the evaluated approaches, the Wilcoxon results suggest that these differences cannot be considered statistically significant under the present experimental conditions. This outcome should not be interpreted as evidence that all algorithms perform equivalently. Instead, it primarily reflects the limited statistical power associated with comparing only five paired outer-fold observations, which is an inherent consequence of the five-fold Nested Cross-Validation protocol adopted for unbiased performance estimation.
Interestingly, the comparison between CORAL and the conventional ANN produced the smallest Wilcoxon statistic () and the lowest p-value (), indicating the strongest empirical evidence among all pairwise comparisons despite remaining marginally above the conventional significance threshold. This finding is consistent with the large differences observed in the descriptive performance metrics, particularly for QWK ( versus ), Balanced Accuracy ( versus ), and Macro-F1 ( versus ). A larger dataset would likely increase the statistical power available to detect such differences formally.
Although Random Forest, SVM, and XGBoost achieved higher point estimates for several predictive metrics, CORAL offers a structural advantage that is not represented by accuracy-based comparisons alone. Its cumulative outputs explicitly model the probability that dissatisfaction exceeds successive ordinal thresholds, thereby preserving the hierarchical relationship among the response categories. This formulation provides ordinal probabilities that are directly aligned with the organization of the perception scale and may facilitate interpretation of transitions among dissatisfaction levels.
Unlike tree-based ensembles and kernel methods, which directly predict nominal class labels, the CORAL framework estimates cumulative probabilities while enforcing rank consistency through shared parameters across ordinal thresholds. Consequently, the model naturally supports probability-response analyses, latent-space visualization, and predictor contribution analyses that remain coherent with the ordered nature of the dissatisfaction scale. These characteristics motivated the adoption of the representative CORAL architecture for the interpretability analyses presented in Section 3.3.
Direct numerical comparisons with previous IEQ prediction studies remain difficult because of differences in sample size, monitored variables, occupant populations, target definitions, data collection procedures, and validation strategies. Nevertheless, previous investigations provide useful methodological context for positioning data-driven approaches to occupant perception modeling. Table 11 summarizes representative studies involving regression-based, nominal classification, and ordinal modeling approaches. The metrics reported for the present study represent the mean ± standard deviation across the five outer folds of the Nested Cross-Validation protocol.
Table 11.
Summary of machine learning approaches in IEQ modeling and comparison with the proposed CORAL framework.
As shown in Table 11, most previous studies employed regression models or conventional classification approaches and frequently evaluated perception responses without explicitly incorporating their ordinal organization. In contrast, the present study formulates professors’ perceived dissatisfaction as an ordinal classification problem and estimates predictive performance through a Nested Stratified Grouped Cross-Validation procedure. The numerical values should not be interpreted as direct rankings among studies because the reported metrics, datasets, target variables, and validation procedures differ substantially.
Taken together, the benchmark results indicate that several machine learning algorithms achieved competitive predictive performance for modeling professors’ perceived indoor environmental dissatisfaction. The representative CORAL architecture was adopted for the subsequent interpretability analyses not because it achieved the highest numerical score in every evaluation metric, but because it combines competitive predictive performance with an explicit probabilistic formulation that preserves the ordinal structure of the response variable. This characteristic enables meaningful interpretation of latent representations, predictor contributions, and OFAT response analyses while maintaining consistency with the ordered nature of subjective dissatisfaction.
4.2. Hierarchy of Environmental Predictors and Perceptual Dynamics
To improve the interpretability of the selected ordinal model, predictor contributions and One-Factor-at-a-Time (OFAT) analyses were performed using the representative CORAL architecture identified during the benchmark stage and subsequently retrained on the complete dataset (). Consequently, the analyses presented in this section describe the behavior of the final representative model rather than the individual models fitted within the Nested Cross-Validation procedure.
The permutation-based predictor contribution analysis indicated that all monitored indoor environmental quality (IEQ) domains contributed to the estimation of professors’ perceived dissatisfaction, although with different relative importance. Carbon dioxide () concentration exhibited the largest contribution (48.2%), followed by operative temperature (24.8%), sound pressure level (14.7%), and illuminance (12.4%).
The predominance of concentration suggests that, within the environmental conditions represented in the present dataset, the representative CORAL model relied more heavily on indicators associated with indoor air quality than on the remaining environmental variables. Nevertheless, these percentages quantify the dependence of the fitted model on each predictor and should not be interpreted as evidence of causal effects or physiological importance. Rather, they reflect the contribution of each variable to the predictions produced by the representative model under the observed environmental conditions.
The ranking of predictor contributions also indicates that dissatisfaction was not determined by a single environmental domain. Although concentration accounted for nearly half of the total relative contribution, the remaining predictors jointly represented approximately 52% of the model importance, reinforcing the multidimensional nature of indoor environmental perception.
The probabilistic behavior learned by the representative CORAL framework was further investigated through a One-Factor-at-a-Time (OFAT) sensitivity analysis. Unlike conventional classifiers that directly assign observations to mutually exclusive classes, CORAL estimates cumulative ordinal probabilities, allowing dissatisfaction levels to change progressively as environmental conditions vary.
For each environmental variable, OFAT curves were generated by varying a single predictor across its observed range while fixing the remaining predictors at their respective median values. The reported decision boundary corresponds to the point at which the predicted probability of the High Dissatisfaction category became greater than that of the Moderate Dissatisfaction category. Therefore, these boundaries describe transitions learned by the representative CORAL model under controlled reference conditions rather than empirical comfort limits.
The OFAT analysis identified transition points at approximately 19.97 °C for operative temperature, 933.26 ppm for concentration, 158.38 lux for illuminance, and 59.16 dB for sound pressure level.
These values should not be interpreted as universal comfort thresholds, regulatory limits, or experimentally validated transition points. Instead, they represent model-derived decision boundaries obtained from synthetic OFAT scenarios in which only one predictor varied while all remaining variables were held constant. Consequently, the reported values describe the behavior of the representative CORAL model and should be interpreted as exploratory summaries of its learned decision function.
Taken together, the permutation-based predictor contributions and the OFAT response analysis indicate that the proposed framework integrates information from multiple environmental domains while preserving the ordinal structure of dissatisfaction. The predictor contribution analysis identifies the variables on which the representative model relies most strongly, whereas the OFAT analysis illustrates how predicted dissatisfaction changes as individual environmental variables vary under controlled reference conditions. These complementary analyses improve model interpretability without implying causal relationships or establishing universal environmental thresholds.
4.3. Multidimensional Environmental Representation and Virtual Sensing Potential
Principal Component Analysis (PCA) was applied to the latent representations generated by the representative CORAL model retrained on the complete dataset. Rather than operating on the original environmental measurements, the PCA was performed on the 16-dimensional hidden-layer activations learned from operative temperature, carbon dioxide concentration, illuminance, and sound pressure level. Consequently, the projection summarizes the internal feature representation learned by the neural network before the ordinal output layer.
The first latent principal component explained 36.89% of the total variance, whereas the second explained 22.34%. Together, the first two components accounted for 59.22% of the variance contained in the learned latent representations. Although this two-dimensional projection captures a substantial portion of the latent variability, approximately 41% of the information remains distributed among the remaining principal components. Therefore, the visualization should be interpreted as an exploratory summary rather than a complete representation of the learned feature space.
Figure 7 illustrates the projection of the observations onto the first two latent principal components.
The projection suggests a gradual organization of the dissatisfaction categories within the learned latent space. Observations associated with Low and High Dissatisfaction tend to occupy different regions of the projection, whereas Moderate Dissatisfaction is distributed between these two extremes and exhibits partial overlap with both neighboring categories. This pattern is consistent with the ordinal nature of the response variable, in which intermediate dissatisfaction levels are expected to share characteristics with adjacent categories rather than forming completely distinct clusters.
The partial overlap observed for the Moderate Dissatisfaction category is also coherent with the classification behavior of the representative model. As indicated by the normalized confusion matrix, most prediction errors occurred between adjacent dissatisfaction levels, whereas direct confusion between the Low and High categories was rare. Accordingly, the PCA visualization provides an exploratory representation that is compatible with the ordinal decision structure learned by the CORAL framework.
Neither the hidden-layer activations nor the resulting principal components possess direct physical meaning. The latent principal components correspond to mathematical combinations of the learned feature representations and should not be interpreted as independent environmental dimensions or physiological mechanisms. Instead, they provide a qualitative visualization of how the representative CORAL model internally organizes multidimensional environmental information before generating ordinal predictions.
From an applied perspective, these findings reinforce the potential of the proposed framework as a virtual sensing approach for indoor environmental quality assessment. By integrating thermal, air-quality, acoustic, and visual measurements into a unified latent representation, the framework transforms continuous environmental observations into ordinal dissatisfaction probabilities while preserving the ordered structure of the response variable.
Nevertheless, the latent-space projection remains descriptive and dataset-dependent because it was obtained from the representative model fitted to the complete dataset. Future studies using larger and independent datasets are needed to evaluate the stability and generalizability of these learned latent representations before broader conclusions regarding their applicability to occupant-centered environmental monitoring can be established.
5. Conclusions
This study proposed an ordinal deep-learning framework based on the Consistent Rank Logits (CORAL) architecture for modeling professors’ dissatisfaction under multidimensional indoor environmental quality (IEQ) conditions in university classrooms. The study followed a two-stage strategy. First, the predictive performance of the proposed framework was benchmarked against conventional statistical and machine learning models using a rigorous Nested Stratified Group Cross-Validation protocol. Subsequently, the representative CORAL architecture identified during the benchmark stage was retrained using the complete dataset and employed exclusively for the model interpretability analyses. By reformulating the prediction problem as cumulative ordinal learning, the proposed framework preserves the hierarchical ordering of dissatisfaction levels while producing cumulative probabilities that remain consistent with the ordinal response structure.
The benchmark demonstrated that the proposed CORAL framework achieved competitive predictive performance despite the challenging characteristics of the dataset, including the limited sample size (), environmental variability, and the inherent subjectivity of human perception. Although Random Forest, Support Vector Machine, and XGBoost achieved higher point estimates for some predictive metrics, pairwise Wilcoxon signed-rank tests performed on the outer-fold Quadratic Weighted Kappa values detected no statistically significant differences between CORAL and any benchmark model ( for all comparisons). Consequently, the benchmark does not provide sufficient statistical evidence to conclude that any evaluated algorithm consistently outperformed the others under the adopted validation protocol.
The interpretability analyses performed on the representative CORAL model provided complementary insights into the learned ordinal relationships. The predictor contribution analysis indicated that carbon dioxide concentration was the most influential predictor (48.2%), followed by operative temperature (24.8%), sound pressure level (14.7%), and illuminance (12.4%). Although indoor air quality received the highest contribution, all monitored IEQ domains participated in the estimation of perceived dissatisfaction, reinforcing the multidimensional nature of indoor environmental perception. Because these contributions were obtained from the representative model retrained on the complete dataset, they should be interpreted as descriptive characteristics of the fitted model rather than population-level estimates.
The One-Factor-at-a-Time (OFAT) analysis further characterized the behavior of the representative model by identifying transition regions at approximately 19.97 °C for operative temperature, 933.26 ppm for concentration, 158.38 lux for illuminance, and 59.16 dB for sound pressure level. These values represent model-derived transition regions under the adopted reference conditions and should not be interpreted as universal comfort thresholds or regulatory recommendations.
The exploratory Principal Component Analysis complemented the interpretation of the proposed framework by illustrating how multidimensional IEQ information was internally organized before the ordinal output layer. The first two latent principal components explained 59.22% of the total variance, providing an informative visualization of the learned latent representations while preserving the gradual organization expected for ordinal dissatisfaction categories. Because these latent representations were obtained from the representative model trained on the complete dataset, they should be interpreted as exploratory descriptions of the learned feature space.
From a practical perspective, the proposed framework represents a virtual sensing approach capable of translating continuous environmental measurements into ordinal probabilities of professors’ perceived dissatisfaction. By combining benchmark validation with model interpretability, the proposed methodology provides a transparent framework that may support future occupant-centered environmental assessment and intelligent building-management systems.
Some limitations should be acknowledged. The experimental dataset comprised only 77 observations collected from professors under naturally ventilated classroom conditions at a single institution, limiting both the statistical power of the hypothesis tests and the generalizability of the learned relationships. Furthermore, the interpretability analyses were performed on the representative model retrained using the complete dataset and therefore provide descriptive insights into model behavior rather than external validation of the learned representations.
Future research should evaluate the proposed framework using larger and independent datasets collected from different educational buildings and occupant populations. Additional investigations may explore alternative ordinal neural network architectures, automated hyperparameter optimization strategies, multimodal environmental sensing, temporal environmental dynamics, and external validation of the learned latent representations. Such developments may further improve predictive performance while preserving the ordinal consistency, interpretability, and practical applicability of the proposed virtual sensing framework for indoor environmental quality assessment.
Author Contributions
Conceptualization, I.d.C.R.d.S. and E.E.B.; methodology, L.d.V.A.M. and I.d.C.R.d.S.; software, I.d.C.R.d.S.; validation, I.d.C.R.d.S.; investigation, L.d.V.A.M., R.d.O. and I.d.C.R.d.S.; writing—original draft preparation, I.d.C.R.d.S. and L.d.V.A.M.; writing—review and editing, R.d.O., I.d.C.R.d.S. and E.E.B.; supervision, E.E.B.; project administration, E.E.B. All authors have read and agreed to the published version of the manuscript.
Funding
This research received no external funding.
Institutional Review Board Statement
The study was conducted in accordance with the Declaration of Helsinki, and approved by the Institutional Ethics Committee of the Federal University of Technology—Paraná (protocol code CAAE 68457223.0.0000.0177 on 11 May 2023) for studies involving human subjects.
Informed Consent Statement
Informed consent was obtained from all subjects involved in the study.
Data Availability Statement
The raw data supporting the conclusions of this article will be made available by the authors on request.
Acknowledgments
The authors thank the Federal University of Technology—Paraná (UTFPR) for the technical support, and the faculty members who participated in the field study. Assistance from Grammarly (v. 14.1317.0) was used solely for English language editing, grammatical improvements, and readability polishing.
Conflicts of Interest
The authors declare no conflicts of interest.
Abbreviations
The following abbreviations are used in this manuscript:
| ANN | Artificial Neural Network |
| CO2 | Carbon Dioxide |
| CORAL | Consistent Rank Logits |
| CV | Cross-Validation |
| IEQ | Indoor Environmental Quality |
| HVAC | Heating, Ventilation, and Air Conditioning |
| MAE | Mean Absolute Error |
| OFAT | One-Factor-at-a-Time |
| OLR | Ordinal Logistic Regression |
| PCA | Principal Component Analysis |
| PMV | Predicted Mean Vote |
| Predicted Probability of Dissatisfaction Index for Professors | |
| QWK | Quadratic Weighted Cohen’s Kappa |
| ReLU | Rectified Linear Unit |
| RF | Random Forest |
| RMSE | Root Mean Squared Error |
| SD | Standard Deviation |
| SVM | Support Vector Machine |
| XGBoost | Extreme Gradient Boosting |
References
- Zhang, X.; Du, J.; Chow, D. Association between perceived indoor environmental characteristics and occupants’ mental well-being, cognitive performance, productivity, satisfaction in workplaces: A systematic review. Build. Environ. 2023, 246, 110985. [Google Scholar] [CrossRef] [Scilit]
- Niza, I.L.; Gomes, G.C.C.; Broday, E.E. Indoor environmental quality models: A bibliometric, mapping and clustering review. Renew. Sustain. Energy Rev. 2024, 203, 114791. [Google Scholar] [CrossRef] [Scilit]
- Yang, D.; Mak, C.M. Relationships between indoor environmental quality and environmental factors in university classrooms. Build. Environ. 2020, 186, 107331. [Google Scholar] [CrossRef] [Scilit]
- Papadopoulos, G.; Tolis, E.I.; Panaras, G. IEQ assessment in free-running university classrooms. Sci. Technol. Built Environ. 2022, 28, 823–842. [Google Scholar] [CrossRef] [Scilit]
- Hou, H.C.; Lan, H.; Lin, M.; Xu, P. Investigating library users’ perceived indoor environmental quality: SEM-Logit analysis study in a university library. J. Build. Eng. 2024, 93, 109805. [Google Scholar] [CrossRef] [Scilit]
- Mahgoub, M.; Ahmed, T.M.; Santamouris, M. Modeling indoor environmental quality impacts on student comfort in hot-arid universities. Smart Sustain. Built Environ. 2025; in press. [CrossRef] [Scilit]
- Pellegatti, M.; Visentin, C.; Torresin, S.; Prodi, N.; Babisch, W. Indoor soundscape, speech perception, and cognition in classrooms: A systematic review on the effects of ventilation related sounds on students. Build. Environ. 2023, 236, 110194. [Google Scholar] [CrossRef] [Scilit]
- Loraas, D.M. Exploring the Relationship Between Teacher Well-Being and the Physical Environment. Ph.D. Thesis, University of Missouri Columbia, Columbia, MO, USA, 2022. [Google Scholar]
- Wu, J.; Weng, J.; Xia, B.; Zhao, Y.; Song, Q. The synergistic effect of PM2.5 and CO2 concentrations on occupant satisfaction and work productivity in a meeting room. Int. J. Environ. Res. Public Health 2021, 18, 4109. [Google Scholar] [CrossRef] [Scilit] [PubMed]
- Van der Walt, R.E.; Grobbelaar, S.S.; Booysen, M.J. Indoor temperature and CO2 in South African primary school classrooms: Inspecting brick, container, and prefab structures. J. Clean. Prod. 2024, 470, 143120. [Google Scholar] [CrossRef] [Scilit]
- Brink, H.W.; Loomans, M.G.L.C.; Mobach, M.P.; Kort, H.S.M. Classrooms’ indoor environmental conditions affecting the academic achievement of students and teachers in higher education: A systematic literature review. Indoor Air 2021, 31, 405–425. [Google Scholar] [CrossRef] [Scilit] [PubMed]
- Gonçalves, V.S.B.; Silva, L.B.D.; Coutinho, A.S. Noise as an agent compromising the intelligibility of teachers’ speech. Produç Ao 2009, 19, 466–476. [Google Scholar] [CrossRef] [Scilit]
- Nwoko, J.C.; Emeto, T.I.; Malau-Aduli, A.E.O.; Malau-Aduli, B.S. A systematic review of the factors that influence teachers’ occupational wellbeing. Int. J. Environ. Res. Public Health 2023, 20, 6070. [Google Scholar] [CrossRef] [Scilit] [PubMed]
- Roche, I.V.; Ubalde-Lopez, M.; Daher, C.; Nieuwenhuijsen, M.; Gascon, M. The health-related and learning performance effects of air pollution and other urban-related environmental factors on school-age children and adolescents: A scoping review of systematic reviews. Curr. Environ. Health Rep. 2024, 11, 300–316. [Google Scholar] [CrossRef] [Scilit] [PubMed]
- United Nations. Sustainable Development Goals; United Nations: New York, NY, USA, 2026.
- Agresti, A. Analysis of Ordinal Categorical Data, 2nd ed.; John Wiley & Sons: Hoboken, NJ, USA, 2010. [Google Scholar]
- Mui, K.W.; Tsang, T.W.; Wong, L.T.; Yu, Y.P. Evaluation of an indoor environmental quality model for very small residential units. Indoor Built Environ. 2019, 28, 470–478. [Google Scholar] [CrossRef] [Scilit]
- Buratti, C.; Belloni, E.; Merli, F.; Ricciardi, P. A new index combining thermal, acoustic, and visual comfort of moderate environments in temperate climates. Build. Environ. 2018, 139, 27–37. [Google Scholar] [CrossRef] [Scilit]
- Fassio, F.; Fanchiotti, A.; de Lieto Vollaro, R. Linear, non-linear and alternative algorithms in the correlation of IEQ factors with global comfort: A case study. Sustainability 2014, 6, 8113–8127. [Google Scholar] [CrossRef] [Scilit]
- Latoń, D.; Grela, J.; Ożadowicz, A.; Wisniewski, L. Artificial intelligence and machine learning approaches for indoor air quality prediction: A comprehensive review of methods and applications. Energies 2025, 18, 5194. [Google Scholar] [CrossRef] [Scilit]
- Cho, J.H.; Moon, J.W. Integrated artificial neural network prediction model of indoor environmental quality in a school building. J. Clean. Prod. 2022, 344, 131083. [Google Scholar] [CrossRef] [Scilit]
- Croffi, J.; Soebarto, V.; Kroll, D.; Barrie, H. A machine-learning approach for evaluating occupants’ indoor environment satisfaction in high-rise mixed-use buildings. Smart Sustain. Built Environ. 2025; in press. [CrossRef] [Scilit]
- Carton, Q.; Kolarik, J.; Breesch, H. Design of a Retrospective Survey for Occupant Satisfaction with IEQ in Classrooms. In Proceedings of the AIVC Conference; Air Infiltration and Ventilation Centre (AIVC): Ghent, Belgium, 2023. [Google Scholar]
- Ma, N.; Zhang, Q.; Murai, F.; Braham, W.W.; Samuelson, H.W. Learning building occupants’ indoor environmental quality complaints and dissatisfaction from text-mining Booking.com reviews in the United States. Build. Environ. 2023, 237, 110319. [Google Scholar] [CrossRef] [Scilit]
- Fanger, P.O. Thermal Comfort: Analysis and Applications in Environmental Engineering; Danish Technical Press: Copenhagen, Denmark, 1970. [Google Scholar]
- Fritz, H.; Tang, M.; Kinney, K.; Nagy, Z. Evaluating machine learning models to classify occupants’ perceptions of their indoor environment and sleep quality from indoor air quality. J. Air Waste Manag. Assoc. 2022, 72, 1381–1397. [Google Scholar] [CrossRef] [Scilit] [PubMed]
- Khoshnaw, D.S.; Mustafa, F.A.; Katona, T.J.; Baranyai, B. Indoor environmental quality and achieving performance goals for classroom enhancement: A systematic literature review and bibliometric analysis. Results Eng. 2025, 27, 106082. [Google Scholar] [CrossRef] [Scilit]
- Han, W.; Jiang, T.; Li, Y.; Schuller, B.; Ruan, H. Ordinal learning for emotion recognition in customer service calls. In Proceedings of the IEEE International Conference on Acoustics, Speech and Signal Processing (ICASSP); IEEE: Piscataway, NJ, USA, 2020; pp. 6494–6498. [Google Scholar]
- Shi, X.; Cao, W.; Raschka, S. Deep neural networks for rank-consistent ordinal regression based on conditional probabilities. Pattern Anal. Appl. 2023, 26, 941–955. [Google Scholar] [CrossRef] [Scilit]
- Temprano, J.P.; Eichholtz, P.; Willeboordse, M.; Kok, N. Indoor environmental quality and learning outcomes: Study protocol. BMJ Open 2020, 10, e031233. [Google Scholar] [CrossRef] [Scilit] [PubMed]
- Alam, A.G.; Bartonova, A.; Høiskar, B.A.K.; Fredriksen, M.F.; Sharma, J.; Mathisen, H.M.; Cao, G. Predicting the student’s perceptions of multi-domain environmental factors in a Norwegian school building: Machine learning approach. Build. Environ. 2025, 280, 113144. [Google Scholar] [CrossRef] [Scilit]
- Varma, S.; Simon, R. Bias in Error Estimation When Using Cross-Validation for Model Selection. BMC Bioinform. 2006, 7, 91. [Google Scholar] [CrossRef] [Scilit] [PubMed]
- Cawley, G.C.; Talbot, N.L.C. On Over-fitting in Model Selection and Subsequent Selection Bias in Performance Evaluation. J. Mach. Learn. Res. 2010, 11, 2079–2107. [Google Scholar]
- Instituto Nacional de Meteorologia. Banco de Dados Meteorológicos. 2026. Available online: https://portal.inmet.gov.br/ (accessed on 15 May 2026).
- Broday, E.E.; de Paula Xavier, A.A.; de Oliveira, R. Comparative analysis of methods for determining the metabolic rate in order to provide a balance between man and the environment. Int. J. Ind. Ergon. 2014, 44, 570–580. [Google Scholar] [CrossRef] [Scilit]
- Pereira, P.F.c.; Broday, E.E. Determination of Thermal Comfort Zones through Comparative Analysis between Different Characterization Methods of Thermally Dissatisfied People. Buildings 2021, 11, 320. [Google Scholar] [CrossRef] [Scilit]
- Da Silva, M.G.; van Cappellen, L.W.; Sanjuanello, E. Assessing and communicating indoor environmental quality. REHVA J. 2019, 56, 14–18. [Google Scholar]
- ISO 7726:1998; Ergonomics of the Thermal Environment—Instruments for Measuring Physical Quantities. International Organization for Standardization: Geneva, Switzerland, 1998.
- Zhang, D.; Bluyssen, P.M. Energy consumption, self-reported teachers’ actions and children’s perceived indoor environmental quality of nine primary school buildings in the Netherlands. Energy Build. 2021, 235, 110735. [Google Scholar] [CrossRef] [Scilit]
- Geng, Y.; Ji, W.; Lin, B.; Zhu, Y. The combined effects of temperature, CO2 concentration and illuminance on human perceived indoor environmental quality and productivity. Build. Environ. 2017, 121, 158–167. [Google Scholar] [CrossRef] [Scilit]
- James, G.; Witten, D.; Hastie, T.; Tibshirani, R.; Taylor, J. Linear regression. In An Introduction to Statistical Learning: With Applications in Python; Springer: New York, NY, USA, 2023; pp. 69–134. [Google Scholar]
- Fox, J. Applied Regression Analysis and Generalized Linear Models, 3rd ed.; SAGE Publications: Thousand Oaks, CA, USA, 2015. [Google Scholar]
- Cao, W.; Mirjalili, V.; Raschka, S. Rank consistent ordinal regression for neural networks with application to age estimation. Pattern Recognit. Lett. 2020, 140, 325–331. [Google Scholar] [CrossRef] [Scilit]
- Barthwal, A.; Kumar, N.; Avikal, S.; Wroye, N.D. Indoor Environmental Quality Prediction Using Hybrid Deep Learning and a Comprehensive Environment Index. Indoor Air 2025, 2025, 9243817. [Google Scholar] [CrossRef] [Scilit]
- Jolliffe, I.T.; Cadima, J. Principal Component Analysis: A Review and Recent Developments. Philos. Trans. R. Soc. A 2016, 374, 20150202. [Google Scholar] [CrossRef] [Scilit] [PubMed]
- McCullagh, P. Regression models for ordinal data. J. R. Stat. Soc. Ser. B 1980, 42, 109–127. [Google Scholar] [CrossRef] [Scilit]
- Bishop, C.M. Pattern Recognition and Machine Learning; Springer: New York, NY, USA, 2006. [Google Scholar]
- Cohen, J. Weighted Kappa: Nominal Scale Agreement with Provision for Scale Disagreement. Psychol. Bull. 1968, 70, 213–220. [Google Scholar] [CrossRef] [Scilit] [PubMed]
- Amangeldy, B.; Tasmurzayev, N.; Imankulov, T.; Imanbek, B.; Wójcik, W.; Nurakhov, Y. A hybrid machine learning approach for high-accuracy energy consumption prediction using indoor environmental quality sensors. Energies 2025, 18, 4164. [Google Scholar] [CrossRef] [Scilit]
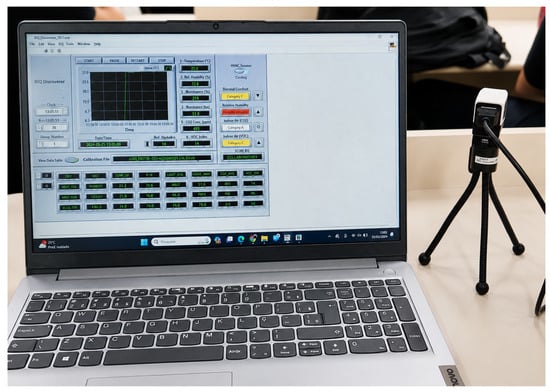
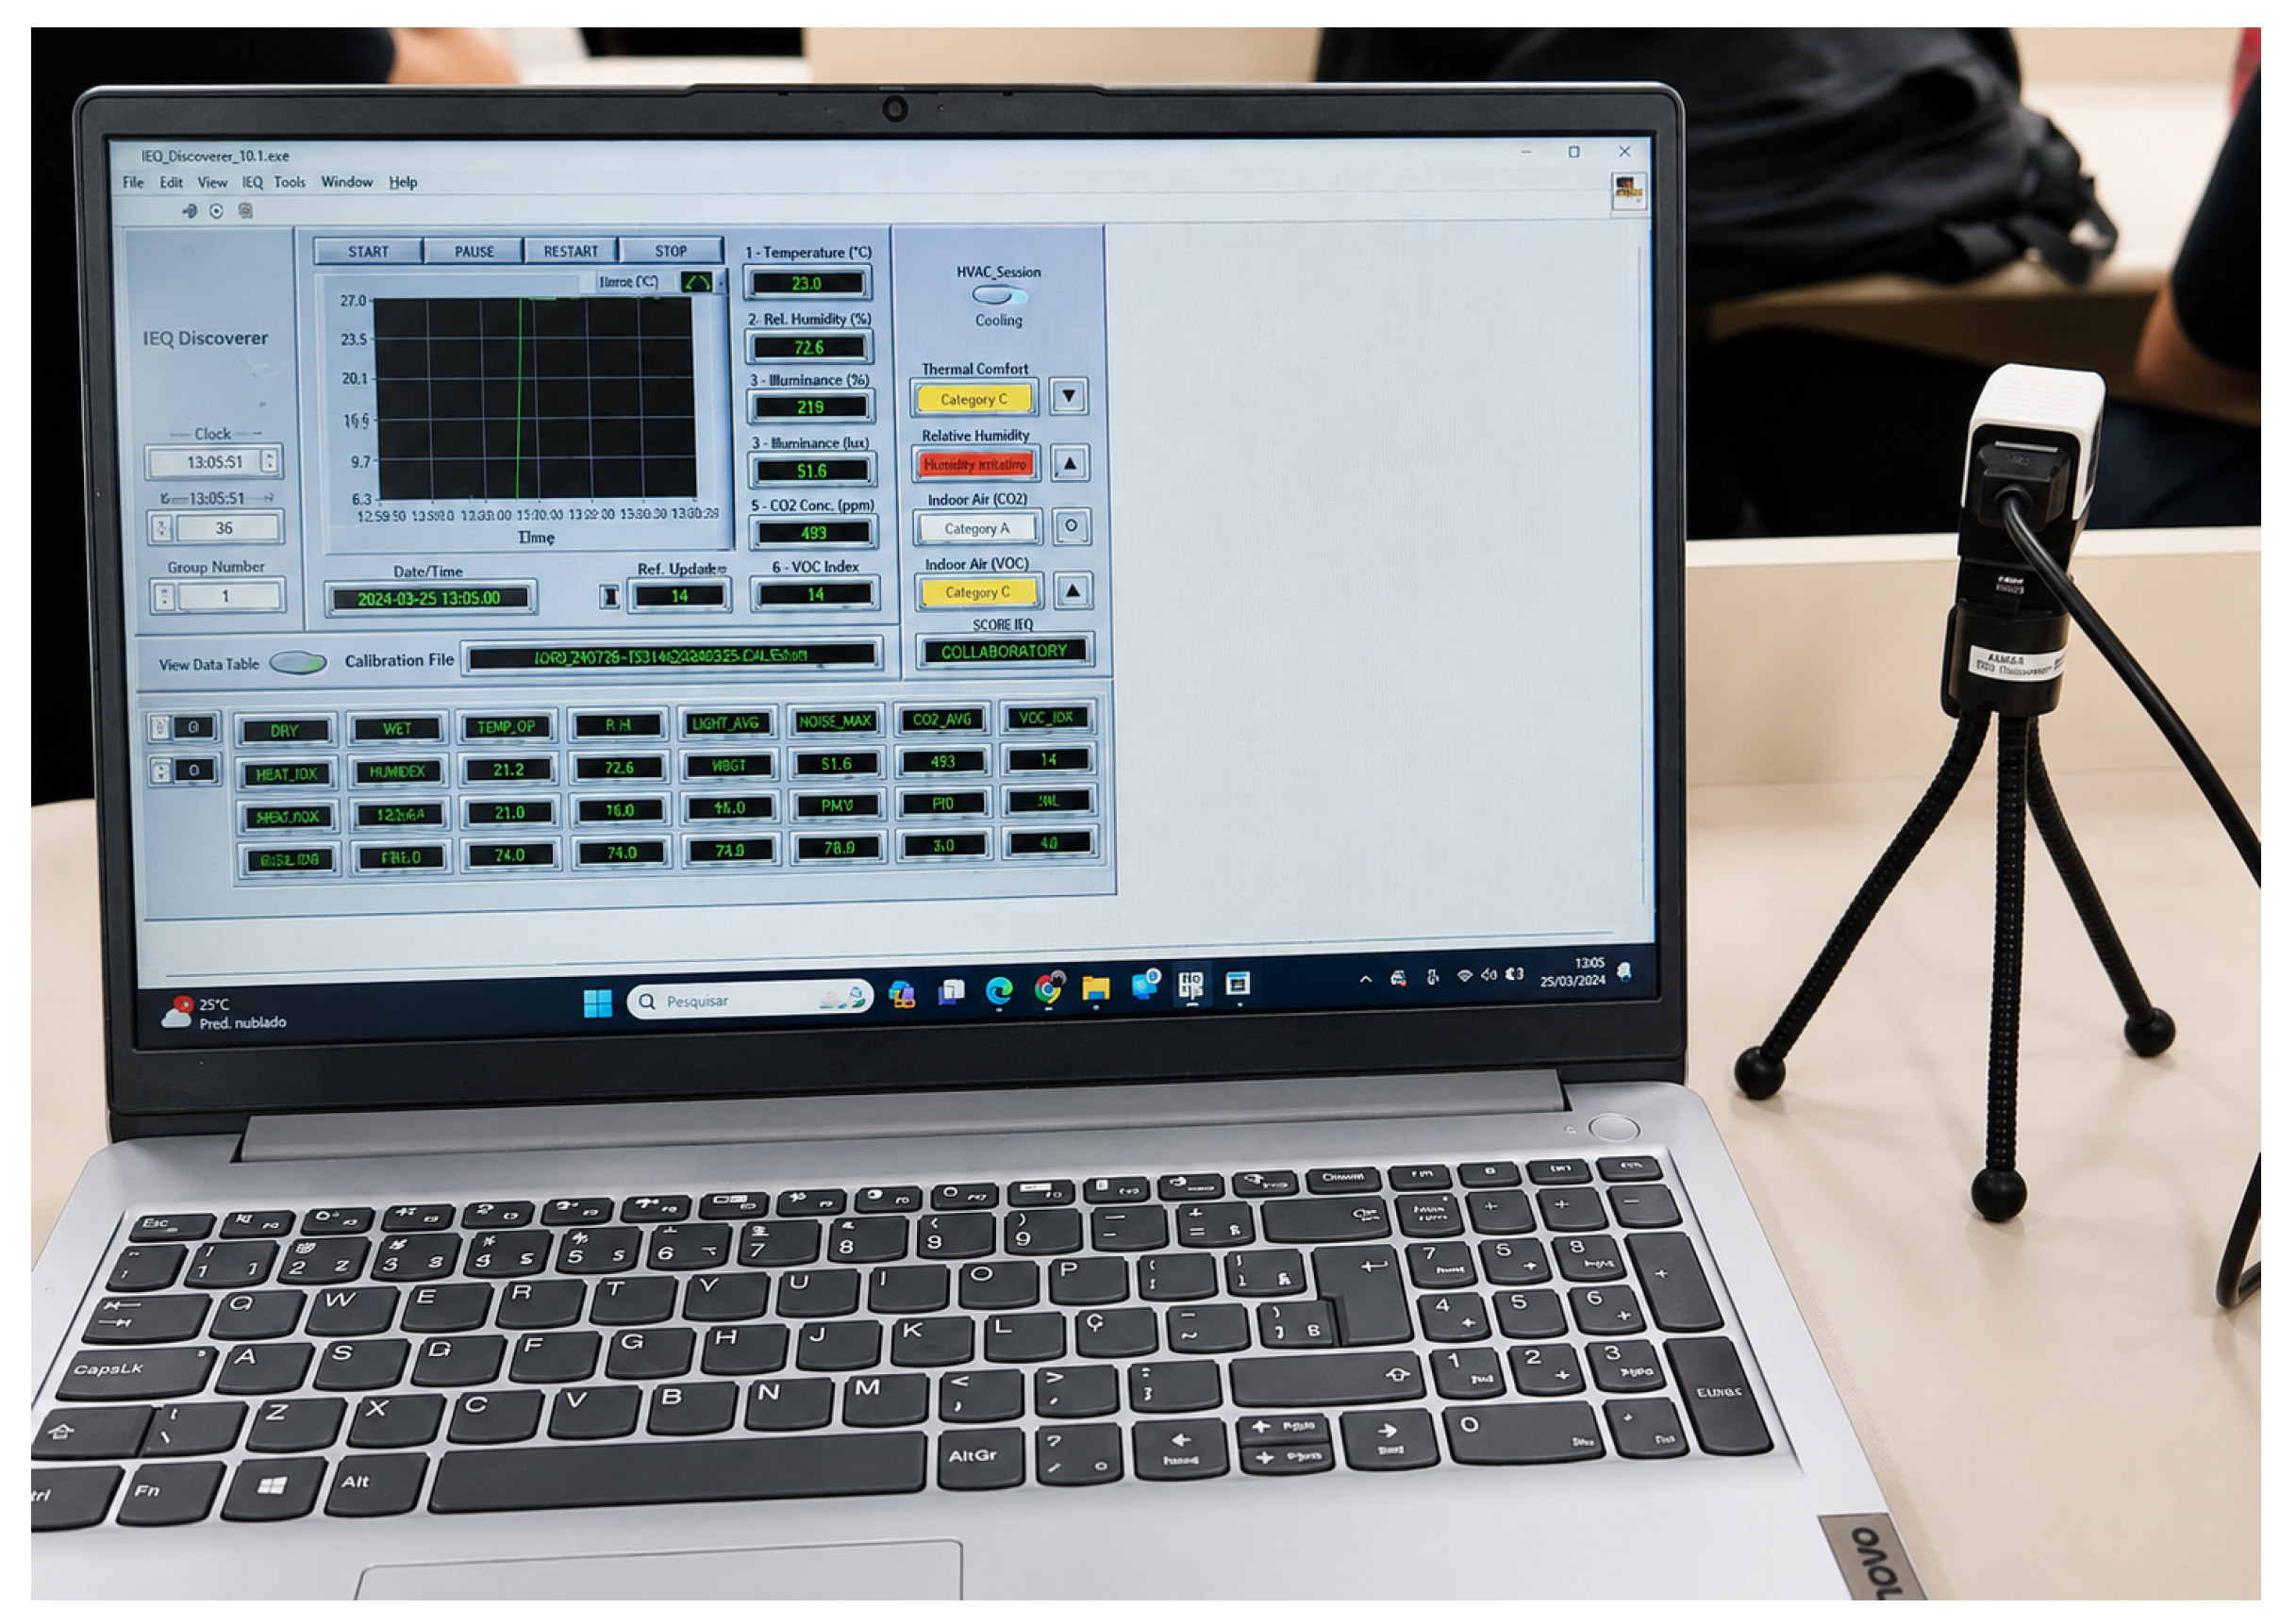
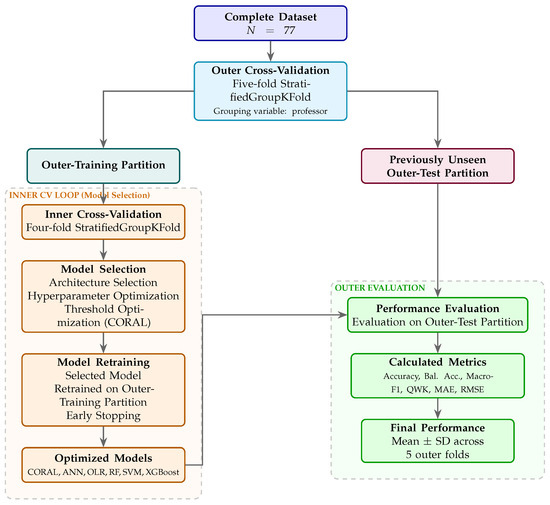
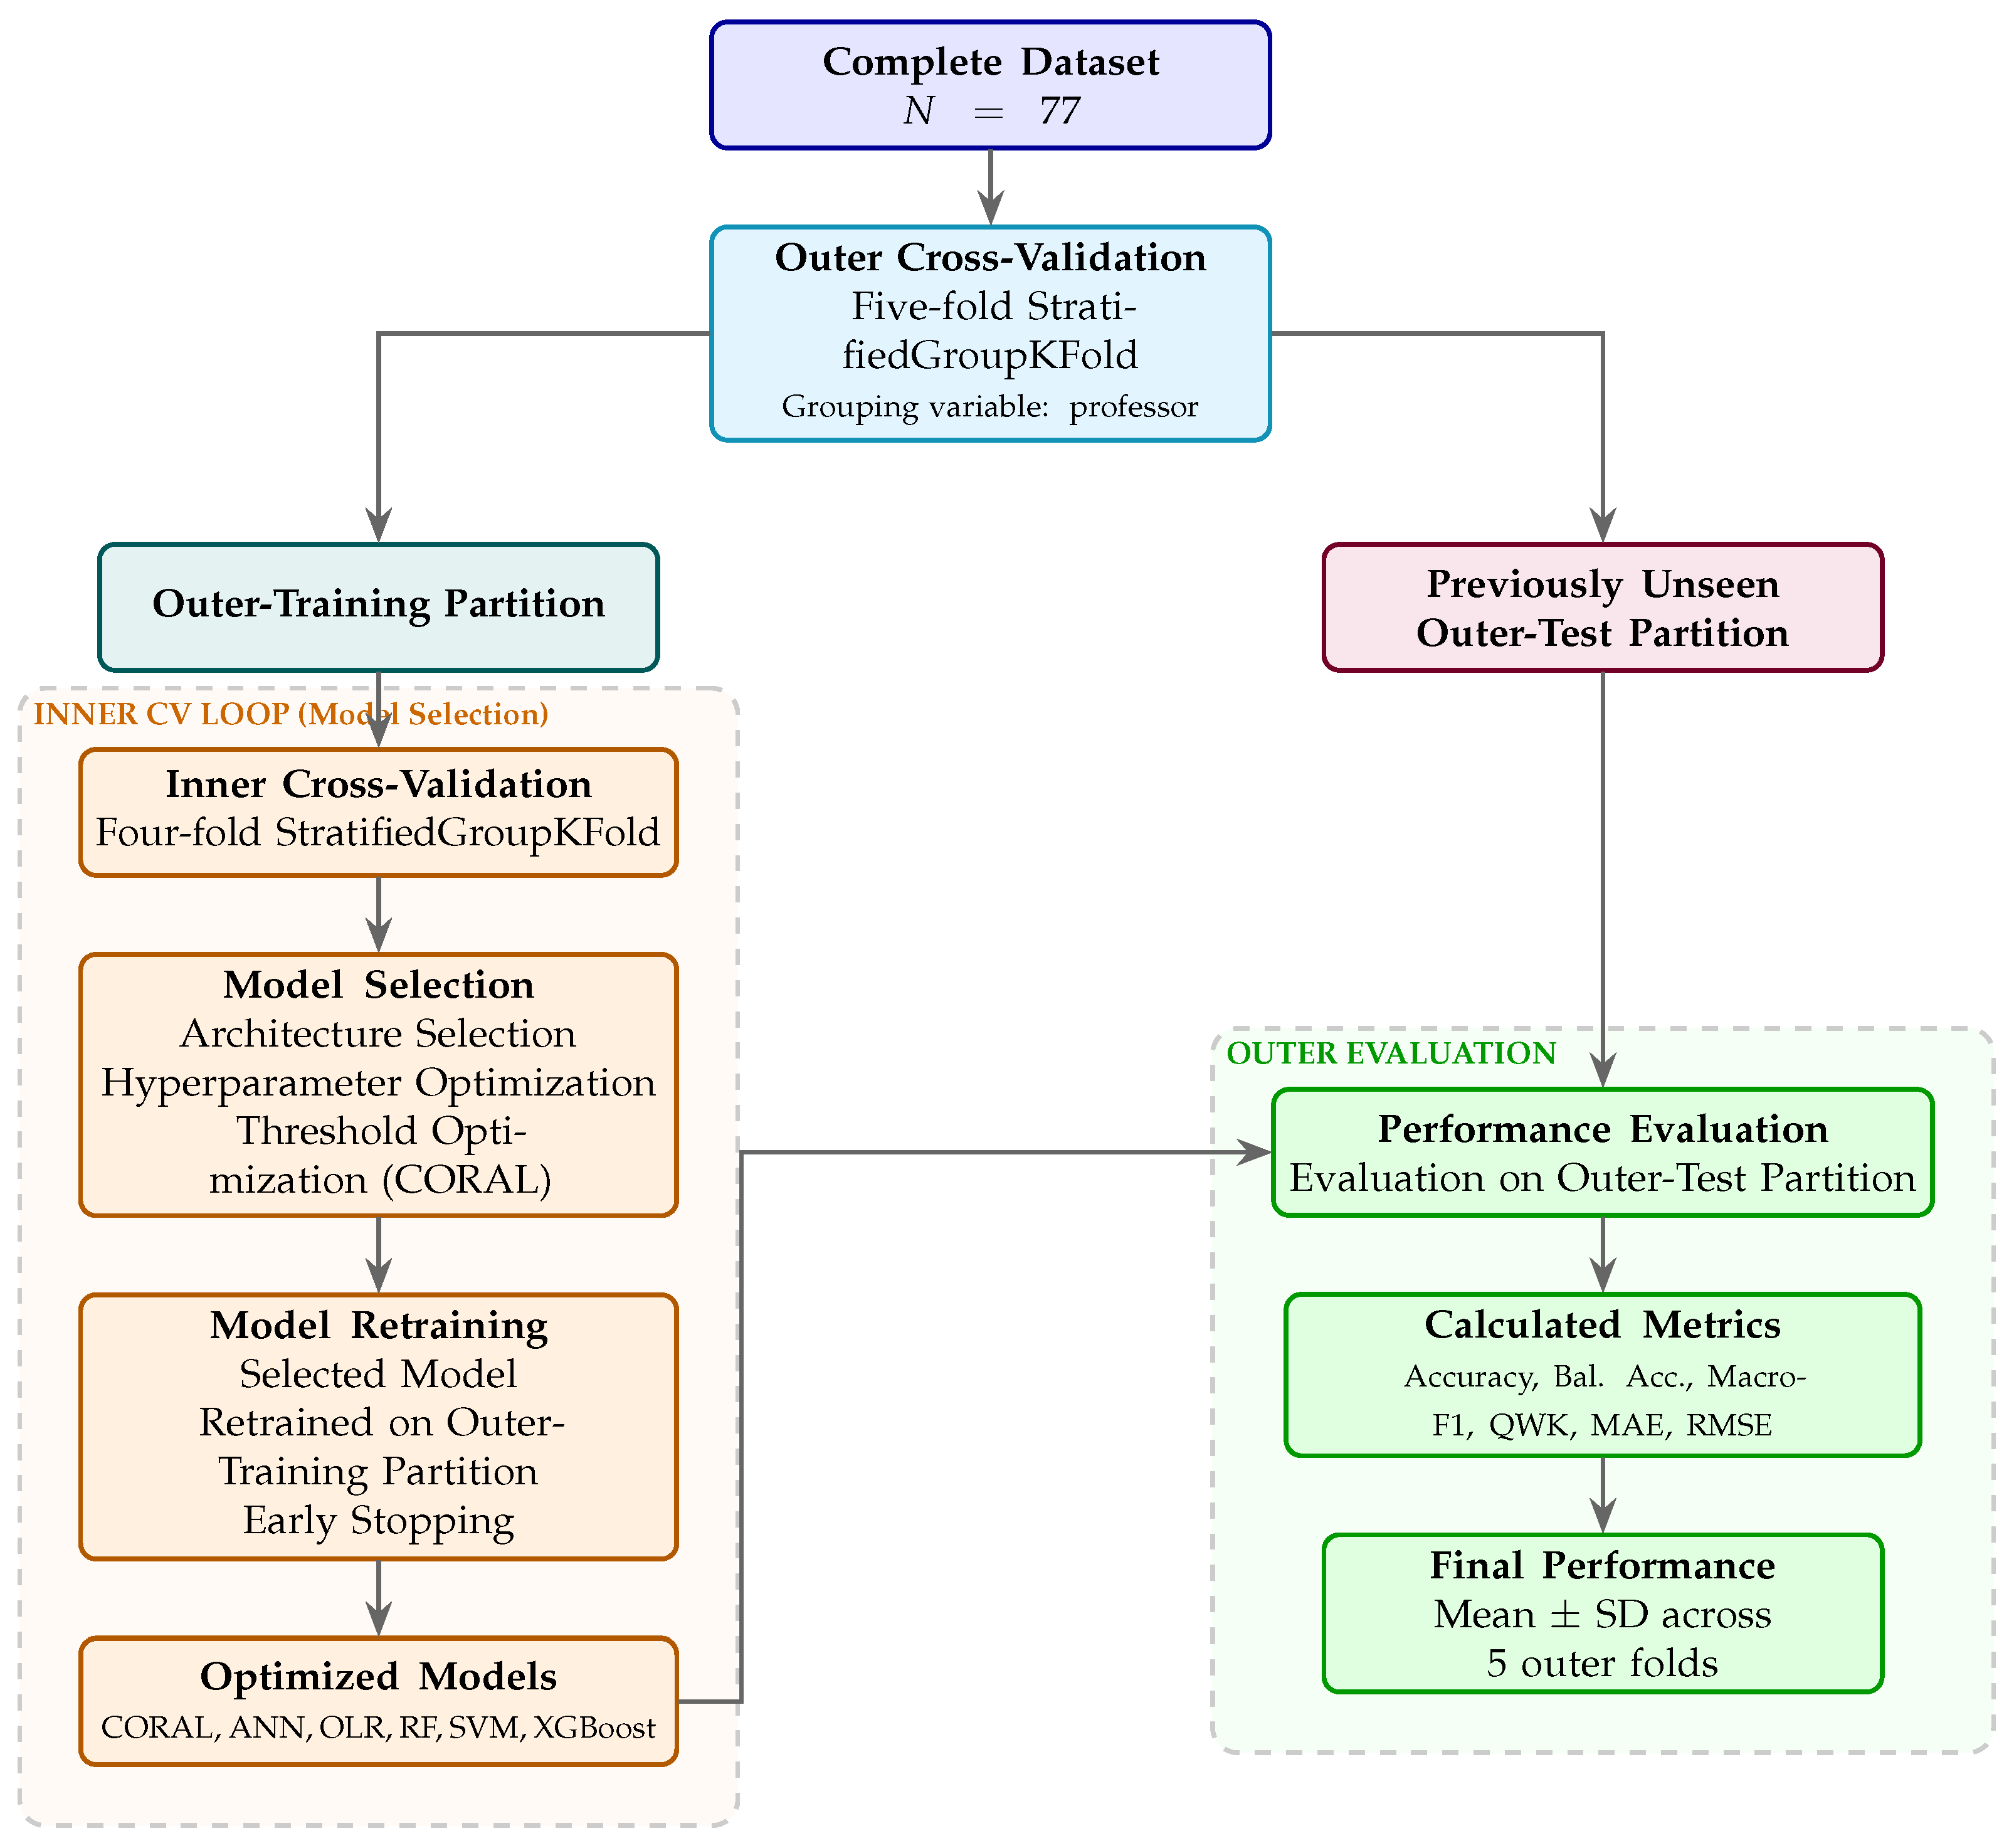
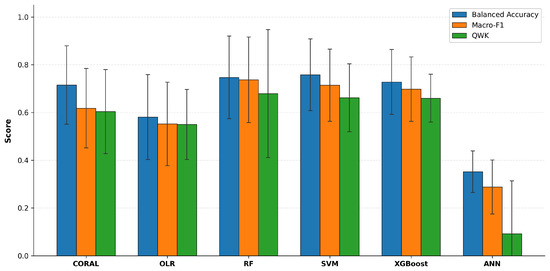
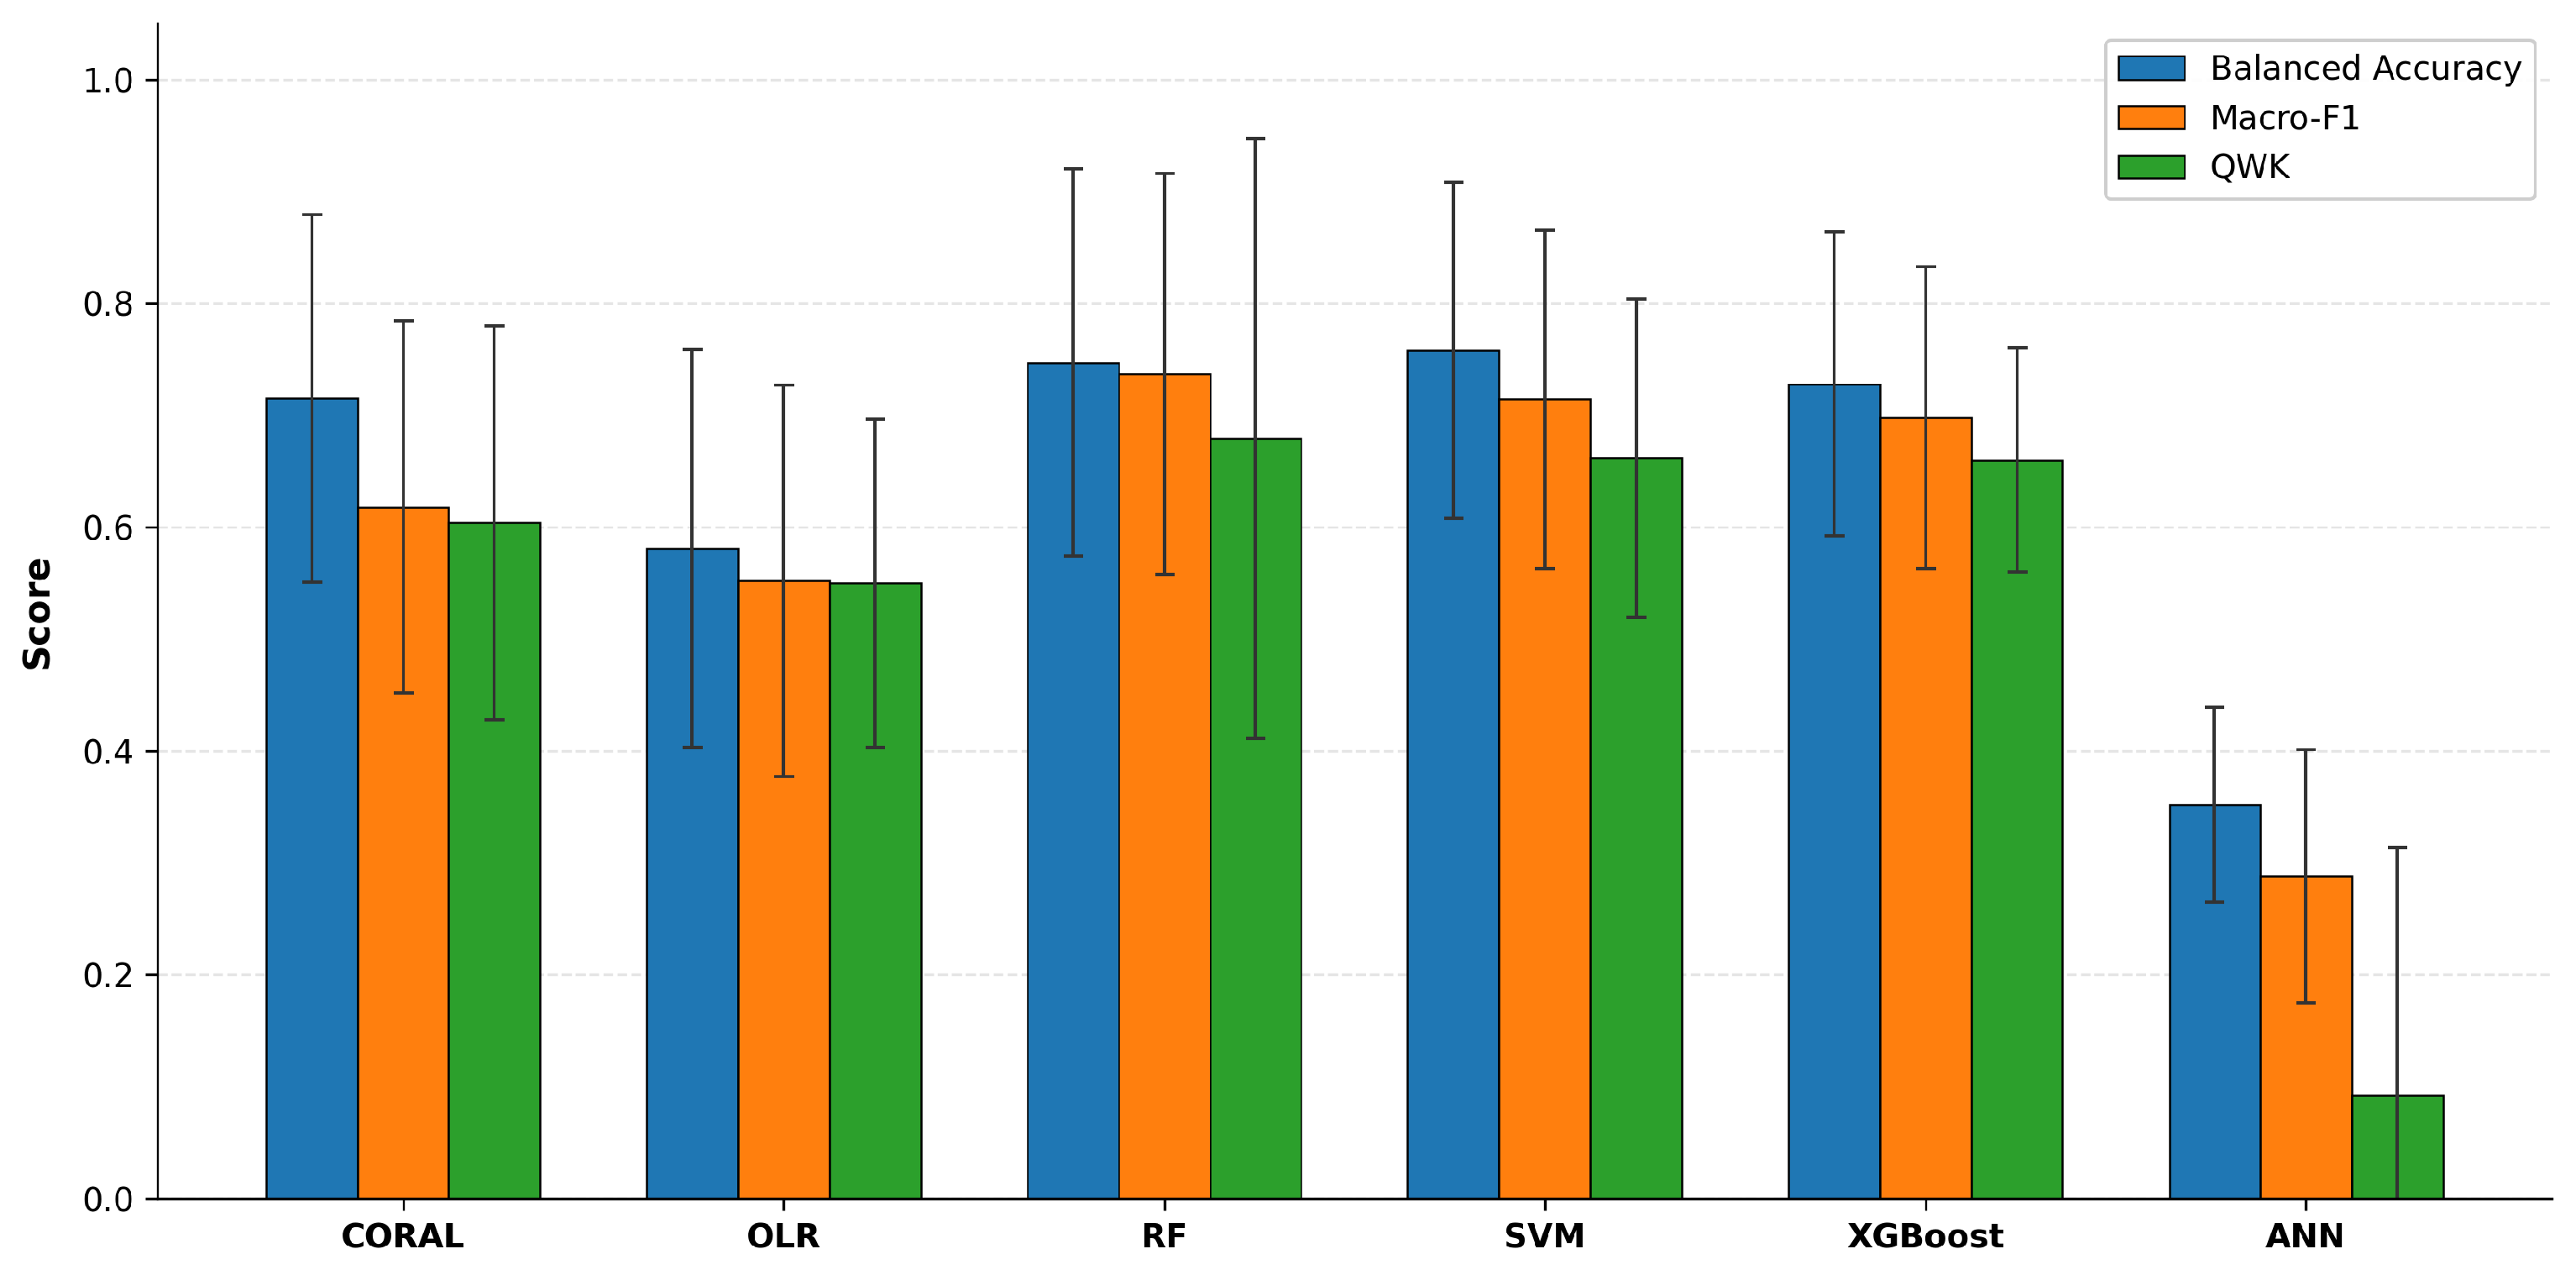
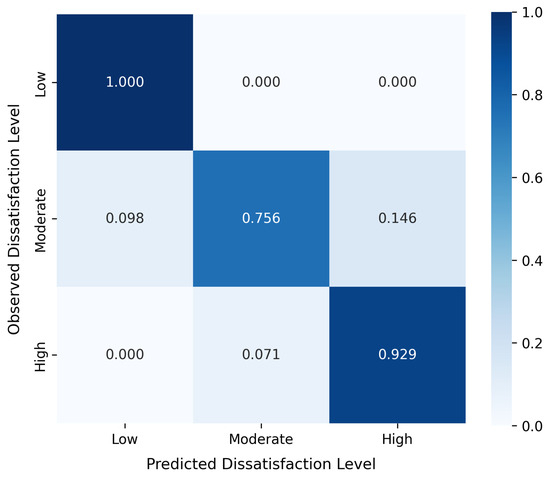
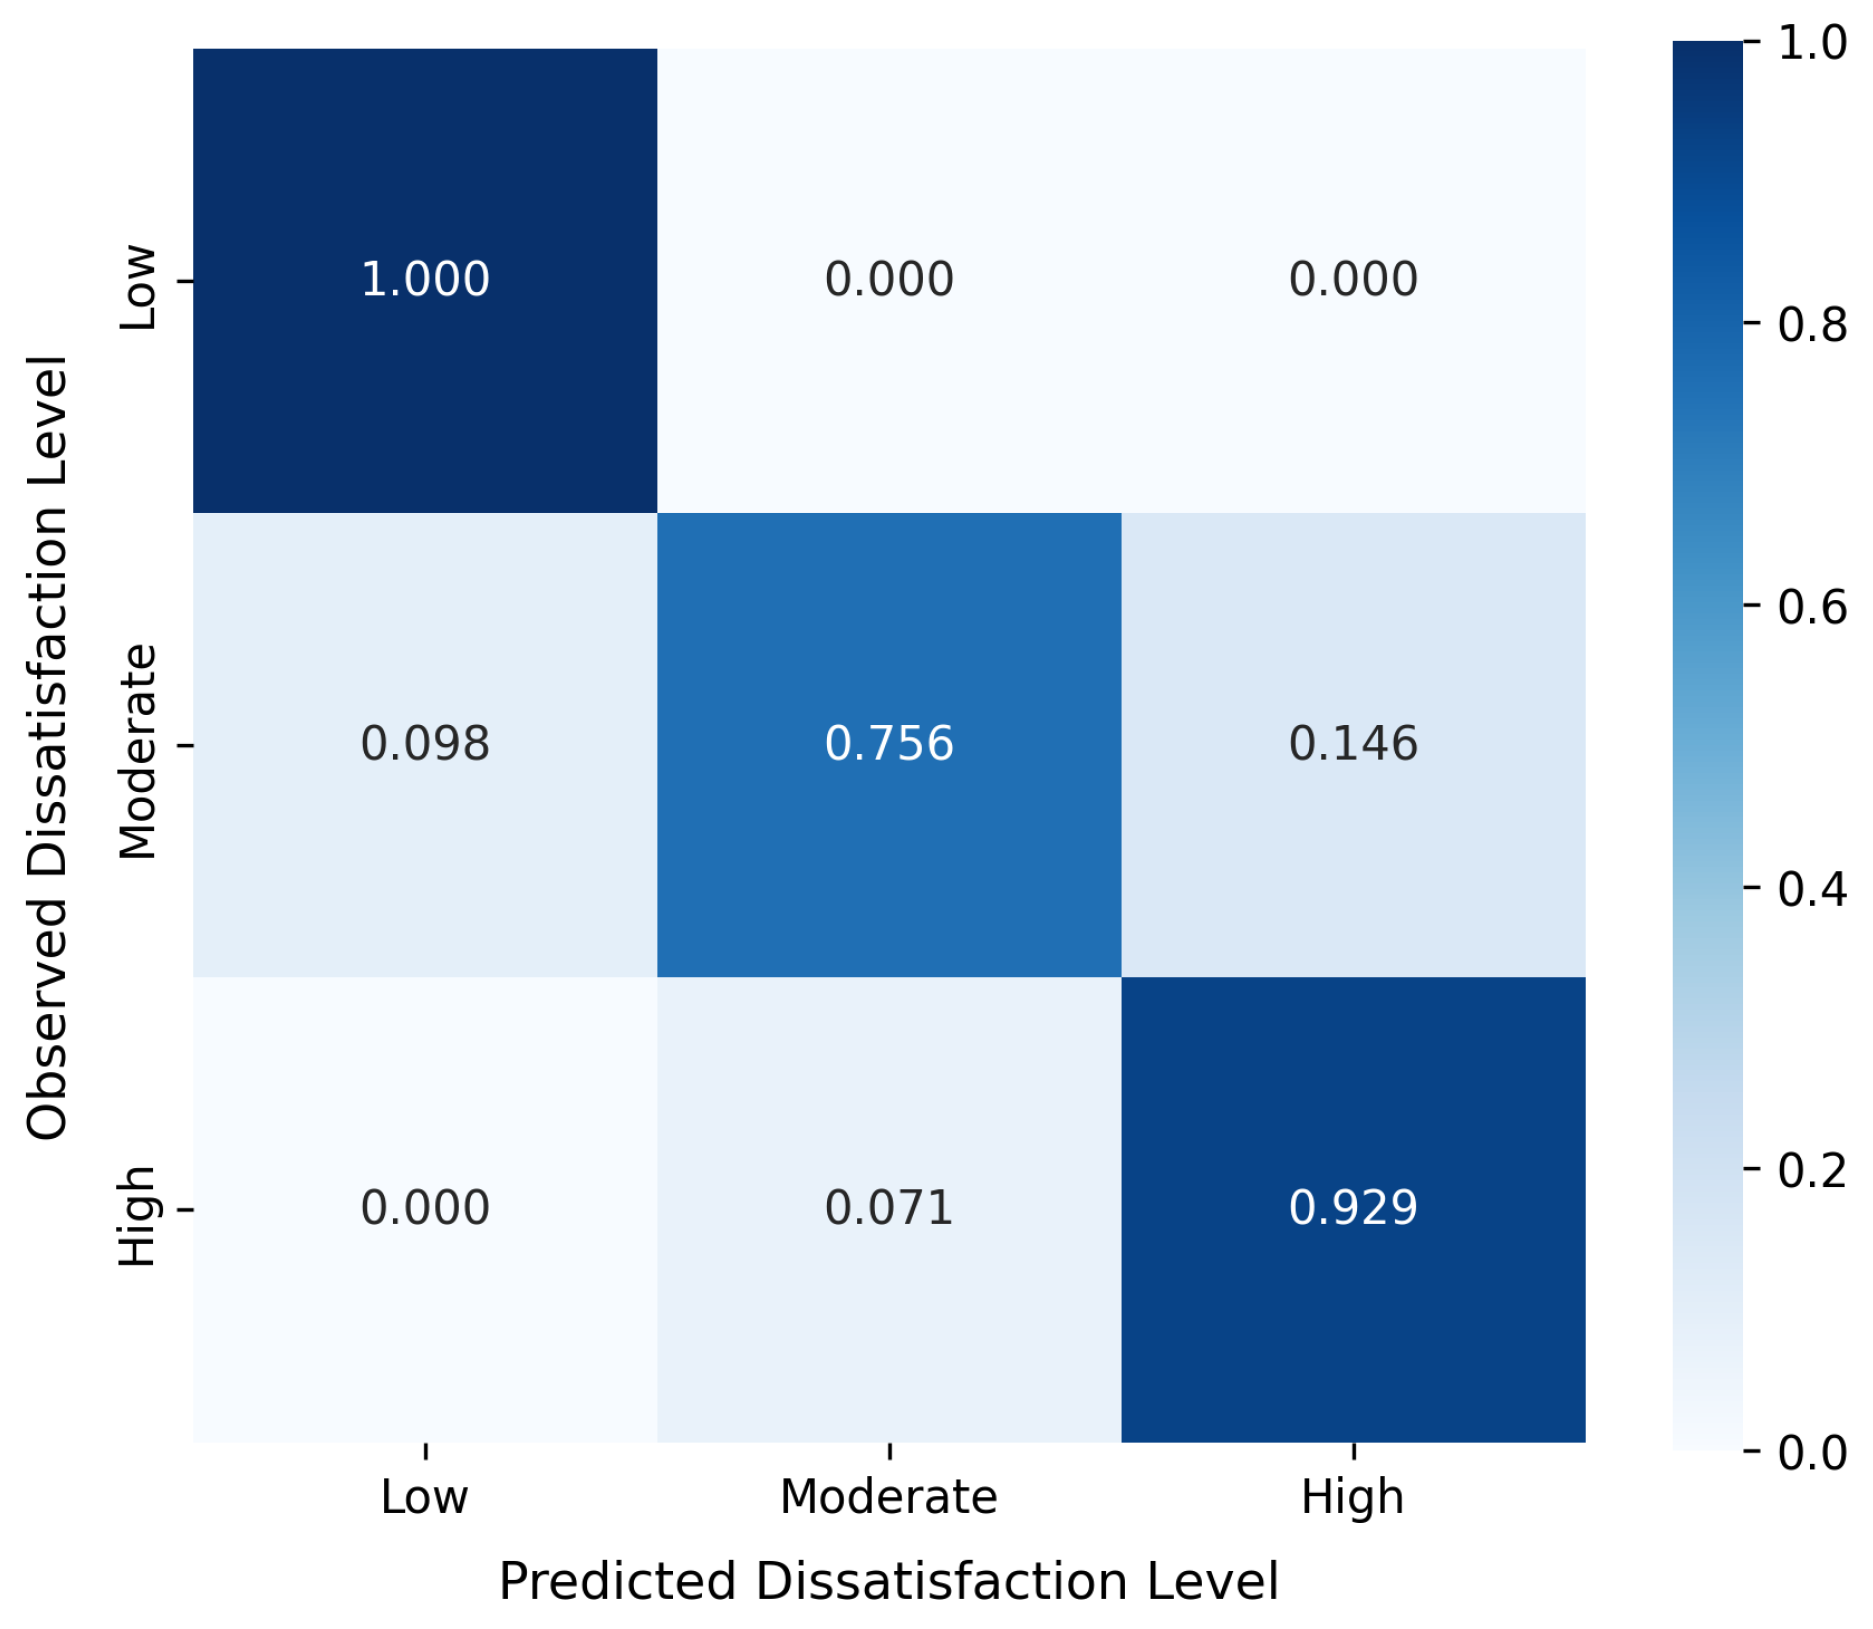
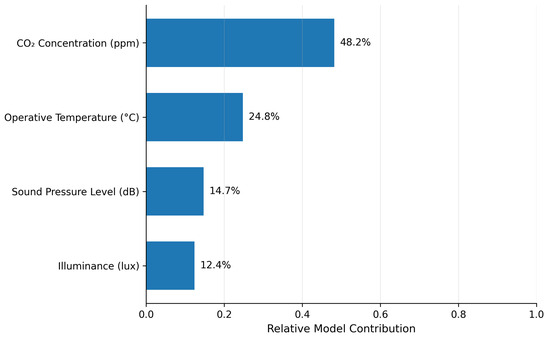
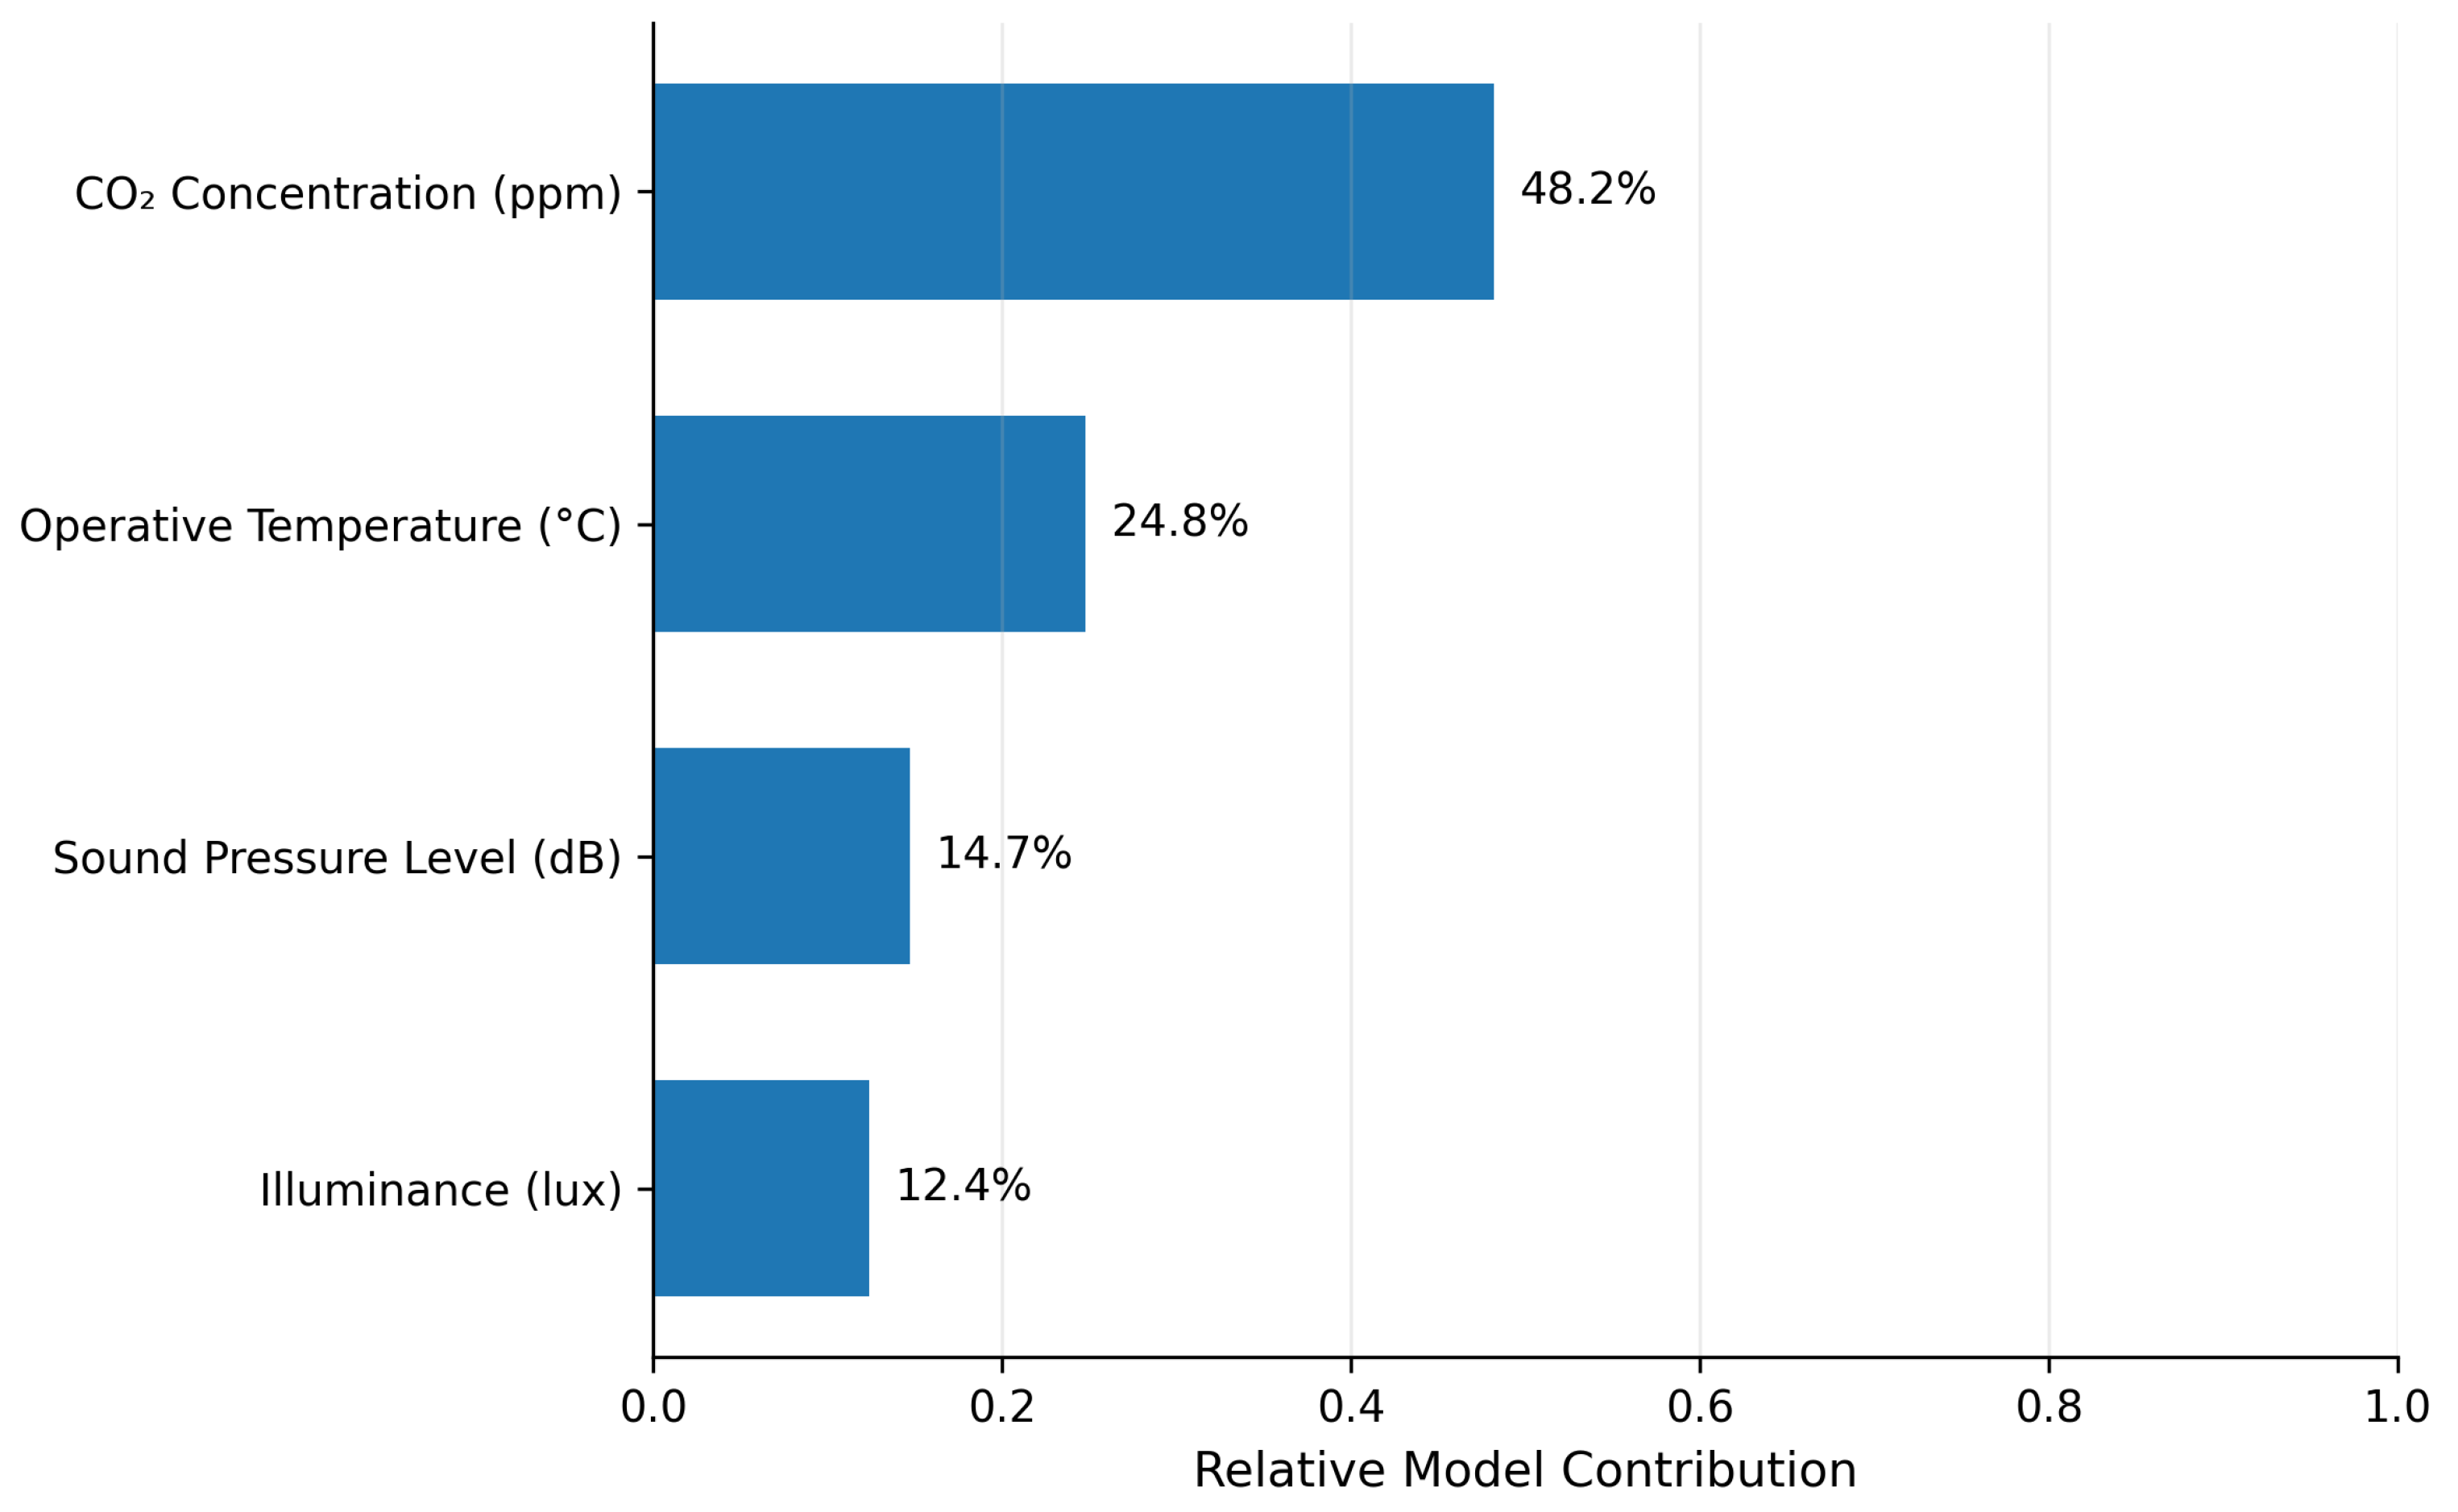
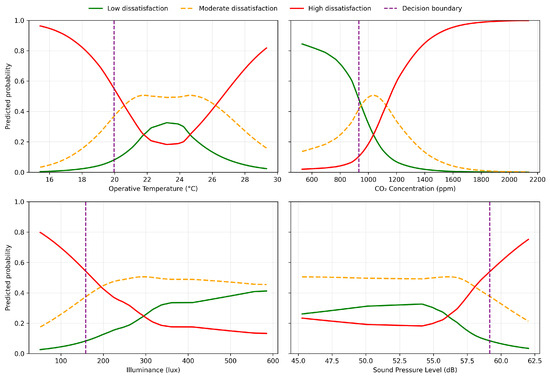
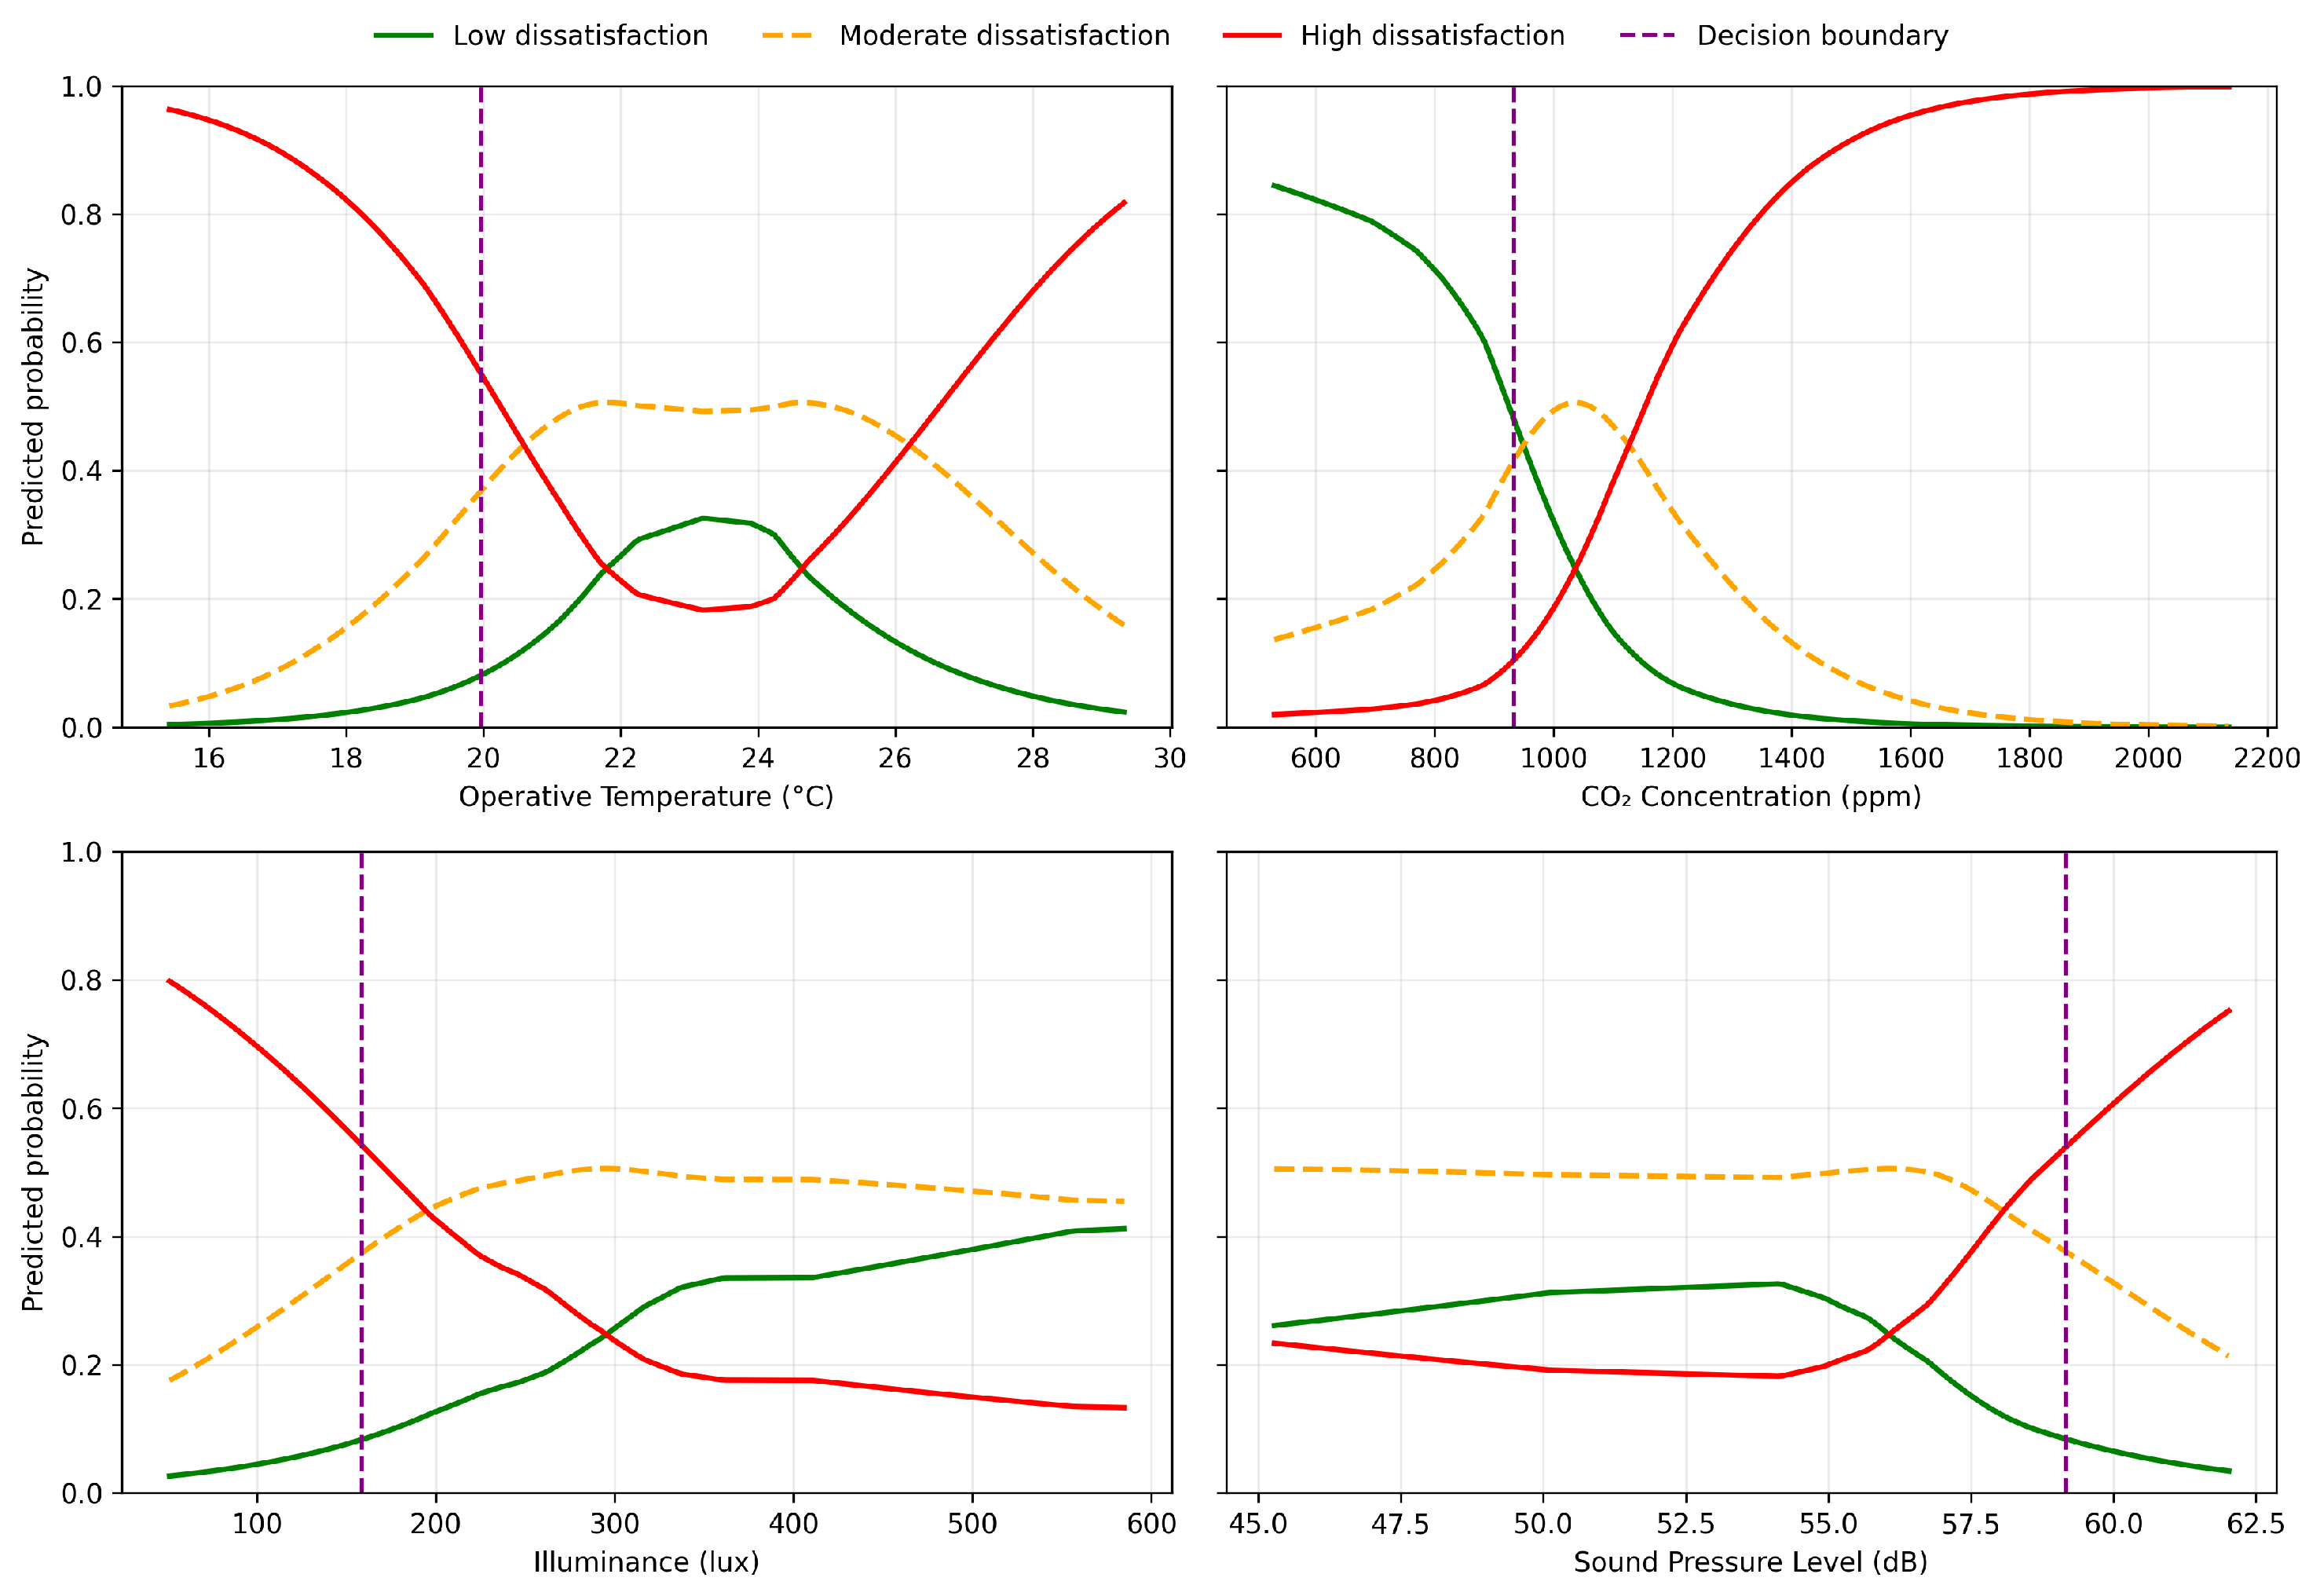
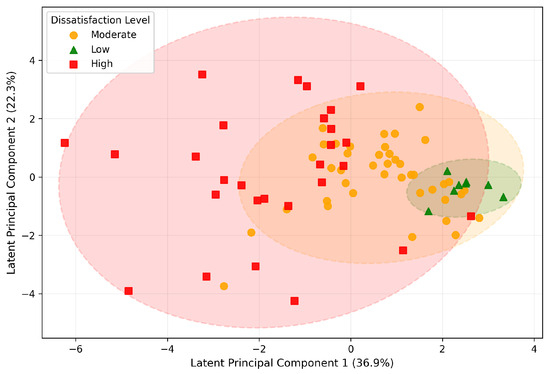
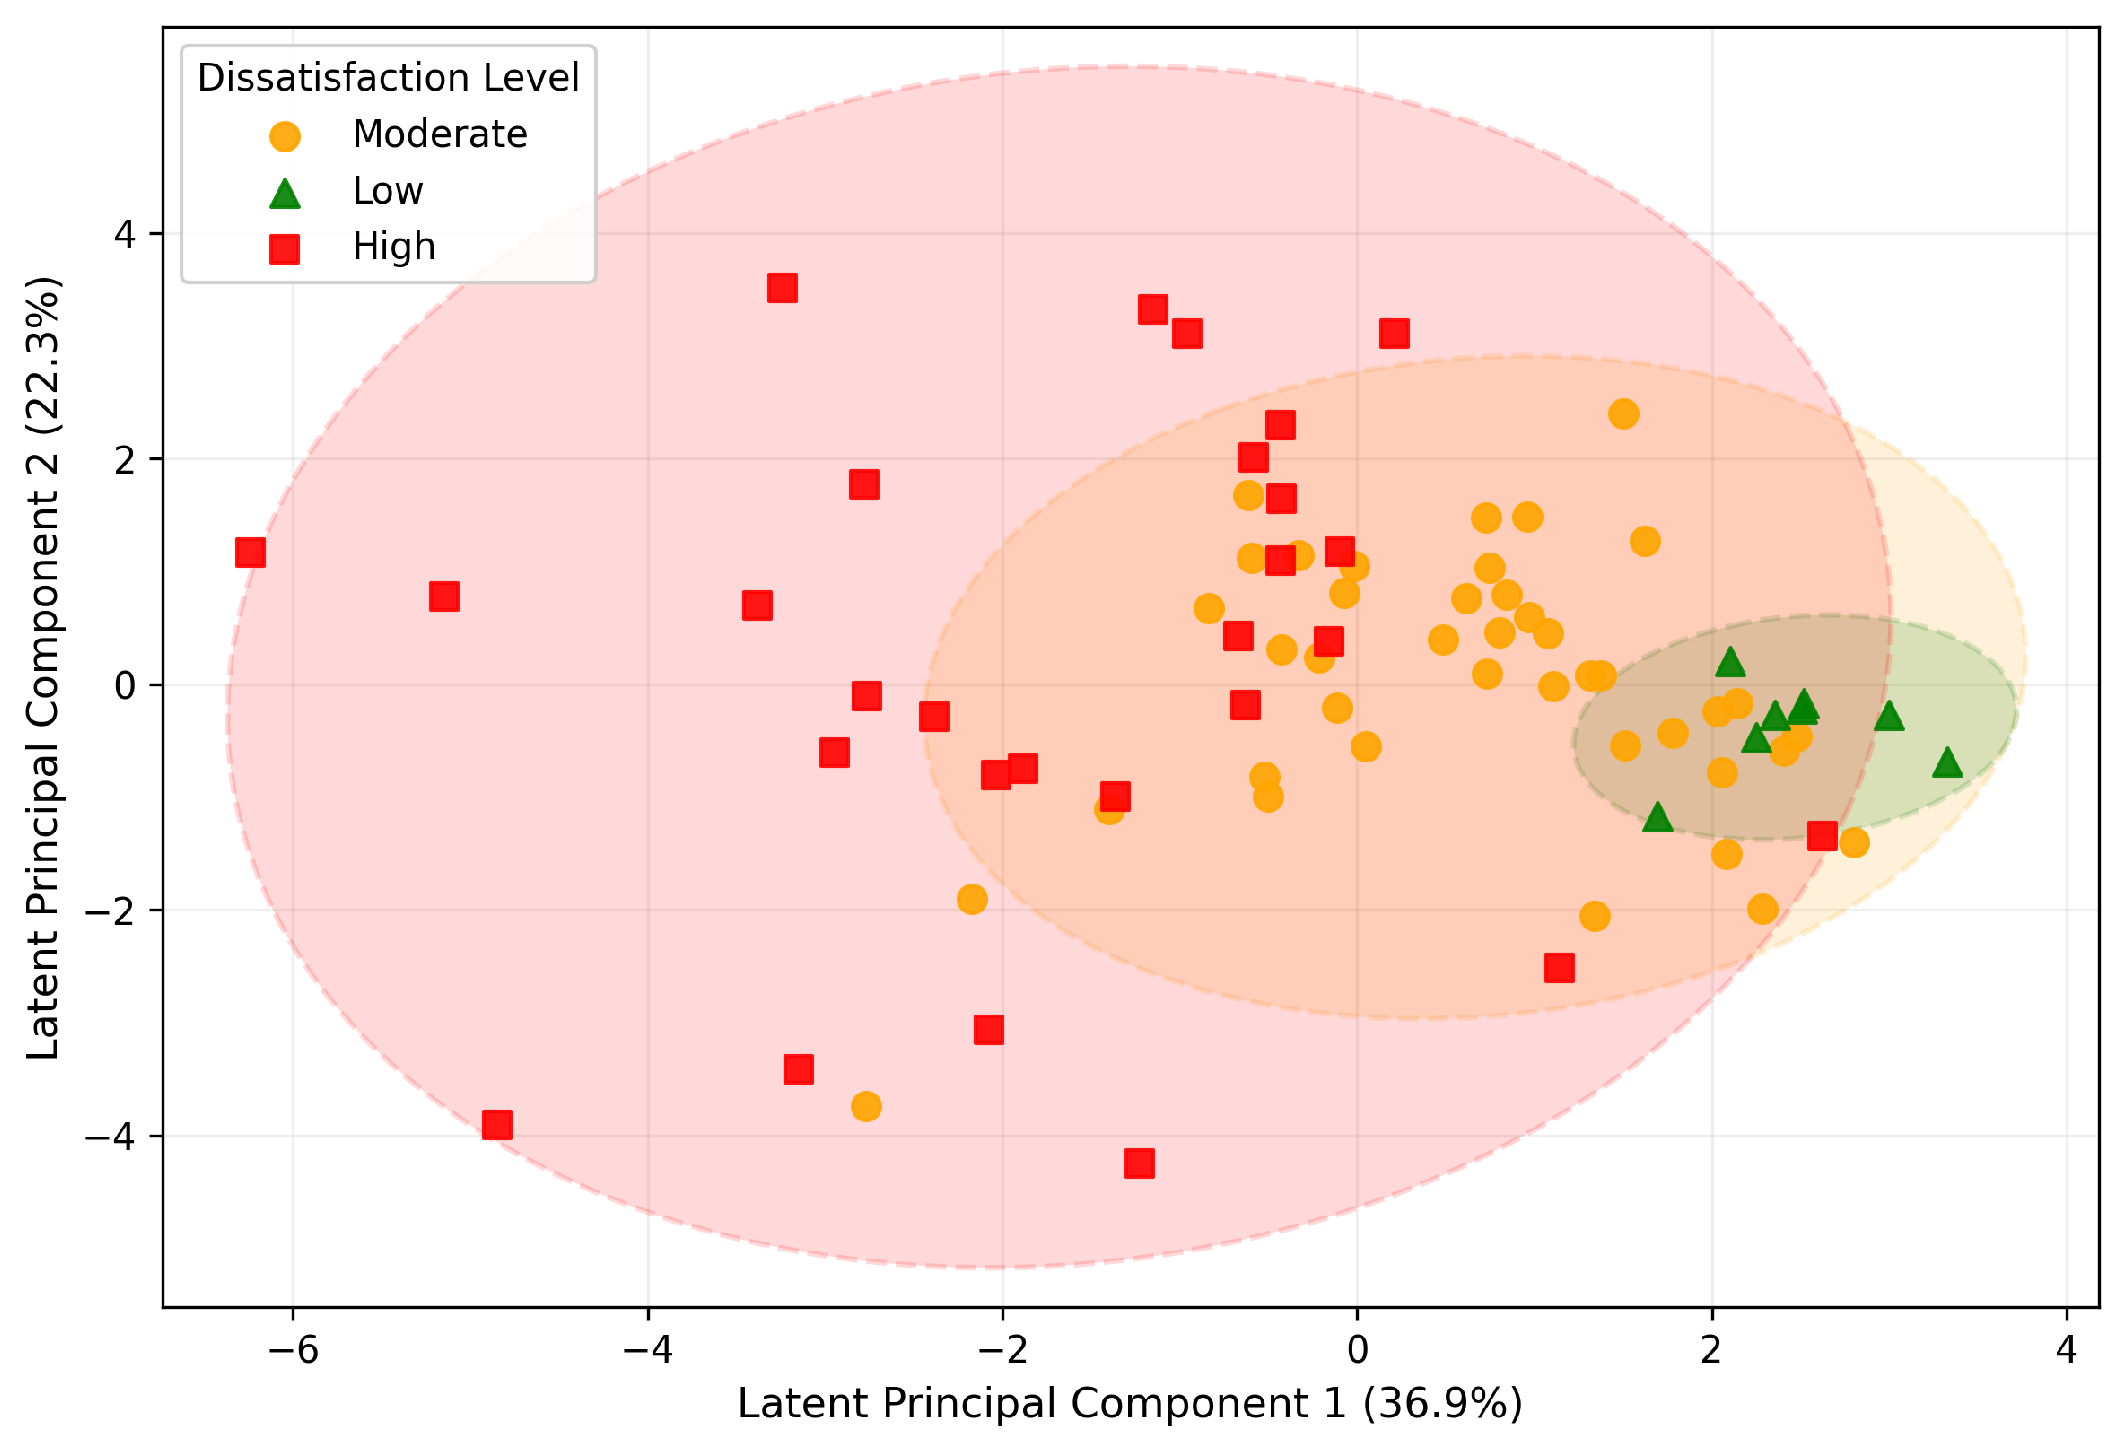

Disclaimer/Publisher’s Note: The statements, opinions and data contained in all publications are solely those of the individual author(s) and contributor(s) and not of MDPI and/or the editor(s). MDPI and/or the editor(s) disclaim responsibility for any injury to people or property resulting from any ideas, methods, instructions or products referred to in the content. |
© 2026 by the authors. Licensee MDPI, Basel, Switzerland. This article is an open access article distributed under the terms and conditions of the Creative Commons Attribution (CC BY) license.