


Abstract
Microplastic contamination is an emerging global concern, but its occurrence in high-altitude protected areas has been understudied. This study systematically assessed microplastic abundance, morphology, and spatial distribution in Sagarmatha National Park (SNP), Nepal, a UNESCO World Heritage Site. Soil samples were collected from 25 sites across four land-use types, including settlement, farmland, forest, and floodplain, at two depths along the Lukla–Phortse trekking corridor during the pre-monsoon season of 2023. Samples were pretreated by density separation and Fenton’s reagent digestion, and microplastics were then detected using a YOLOv11n-seg instance segmentation model. A subset of extracted particles was chemically confirmed by optical photothermal infrared (O-PTIR) spectroscopy. Microplastics were present in all samples, with concentrations ranging from 80 to 960 particles·kg−1. Fragments were the dominant morphological type, accounting for 65.7% of all particles, followed by fibers and films. Negative binomial regression revealed significant effects of land use and soil depth and their interaction on microplastic abundance. Settlement soils showed the highest concentrations with significant surface enrichment, while farmland soils showed no significant depth effect, consistent with human-dominated plastic sources and tillage-driven redistribution. Elevation was not a significant predictor of contamination. Hotspot analysis identified statistically significant clustering around Lukla and Namche, the two primary tourism hubs. The baseline established in this study provides a foundation for long-term monitoring and targeted waste management in SNP and offers insights to other protected high-altitude environments. Meanwhile, the application of deep learning and O-PTIR to balance the counting efficiency and accuracy is a novel approach that could be adopted by other researchers.
1. Introduction
Plastic pollution is a pressing global environmental challenge. Global plastic production reached approximately 400 million metric tons in 2022 and is projected to nearly double by 2050, while recycling rate remains below 10% [1]. As plastic debris accumulates in the environment, it gradually fragments into microplastics, which are plastic particles smaller than 5 mm [2]. In addition to forming through the breakdown of larger plastic items, microplastics can also be intentionally manufactured, as these small particles are widely used in consumer and industrial products [3]. Microplastics persist in the environment because common polymers such as polyethylene (PE), polypropylene (PP), polyethylene terephthalate (PET), and polyamide (PA) resist biodegradation under natural conditions [4]. These particles occur in a range of morphologies, including fragments, fibers, and films, that influence their transport, retention, and biological availability in soils [5,6,7,8]. Microplastics have now been documented across a wide range of environments, including terrestrial soils, aquatic ecosystems, and the atmosphere [9,10,11].
Remote mountain ecosystems are increasingly recognized as vulnerable to microplastic contamination [12]. In these environments, particles can be introduced by both local human activity and long-range atmospheric transport [12,13,14]. High-elevation conditions may also favor the formation and persistence of microplastics in soils. Intense ultraviolet radiation and repeated freeze–thaw cycles which promotes fragmentation, and alter particle surfaces and soil structure [15]. Also, low temperatures may constrain microbial degradation of these particles [16].
Sagarmatha National Park (SNP), a UNESCO World Heritage Site, is exposed to substantial tourism pressure from trekkers and climbers each year [17]. Previous studies have detected microplastics in snow and stream water within the park [14,18], yet soil remains poorly studied despite its importance as a long-term terrestrial sink [11,19,20]. Addressing this gap is critical because soils integrate both direct local inputs and longer-term accumulation processes.
However, identifying microplastics in soil remains analytically challenging. Conventional approaches based on visual sorting and spectroscopy are labor-intensive, time-consuming, and subject to observer bias when applied to large heterogeneous environmental samples [21,22]. Deep learning offers a promising complementary approach for rapid image-based particle detection, and the You only Look Once (YOLO) family of models has become widely used for this purpose in environmental sample workflows [23,24]. However, chemical confirmation remains essential, as image-based methods alone may introduce errors and cannot identify polymer composition. Optical photothermal infrared (O-PTIR) spectroscopy is a non-contact, non-destructive technique that provides high-resolution infrared measurements and has demonstrated strong spectral agreement with conventional attenuated total reflectance Fourier transform infrared (ATR-FTIR) spectroscopy for microplastic identification in complex environmental samples [25].
This study combines deep learning and O-PTIR to provide systematic assessments of soil microplastic contamination in SNP, examining microplastic abundance, morphology, and spatial distribution across land-use types, elevation, and soil depth. A YOLOv11n-seg instance segmentation model was used to support image-based particle detection in microscopy images, and O-PTIR spectroscopy was applied to confirm polymer identity for a selected subset of visually identified particles. Three hypotheses were tested: (1) microplastic concentrations differ among land-use types and are highest in settlement areas, (2) concentrations decline with elevation, and (3) concentrations are higher in surface soils (0–5 cm) than in subsurface soils (5–10 cm).
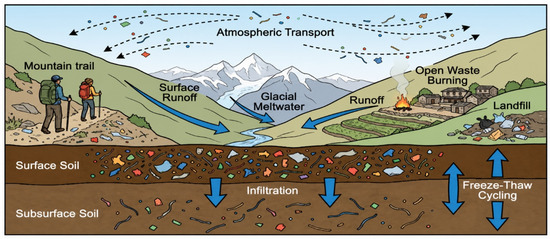
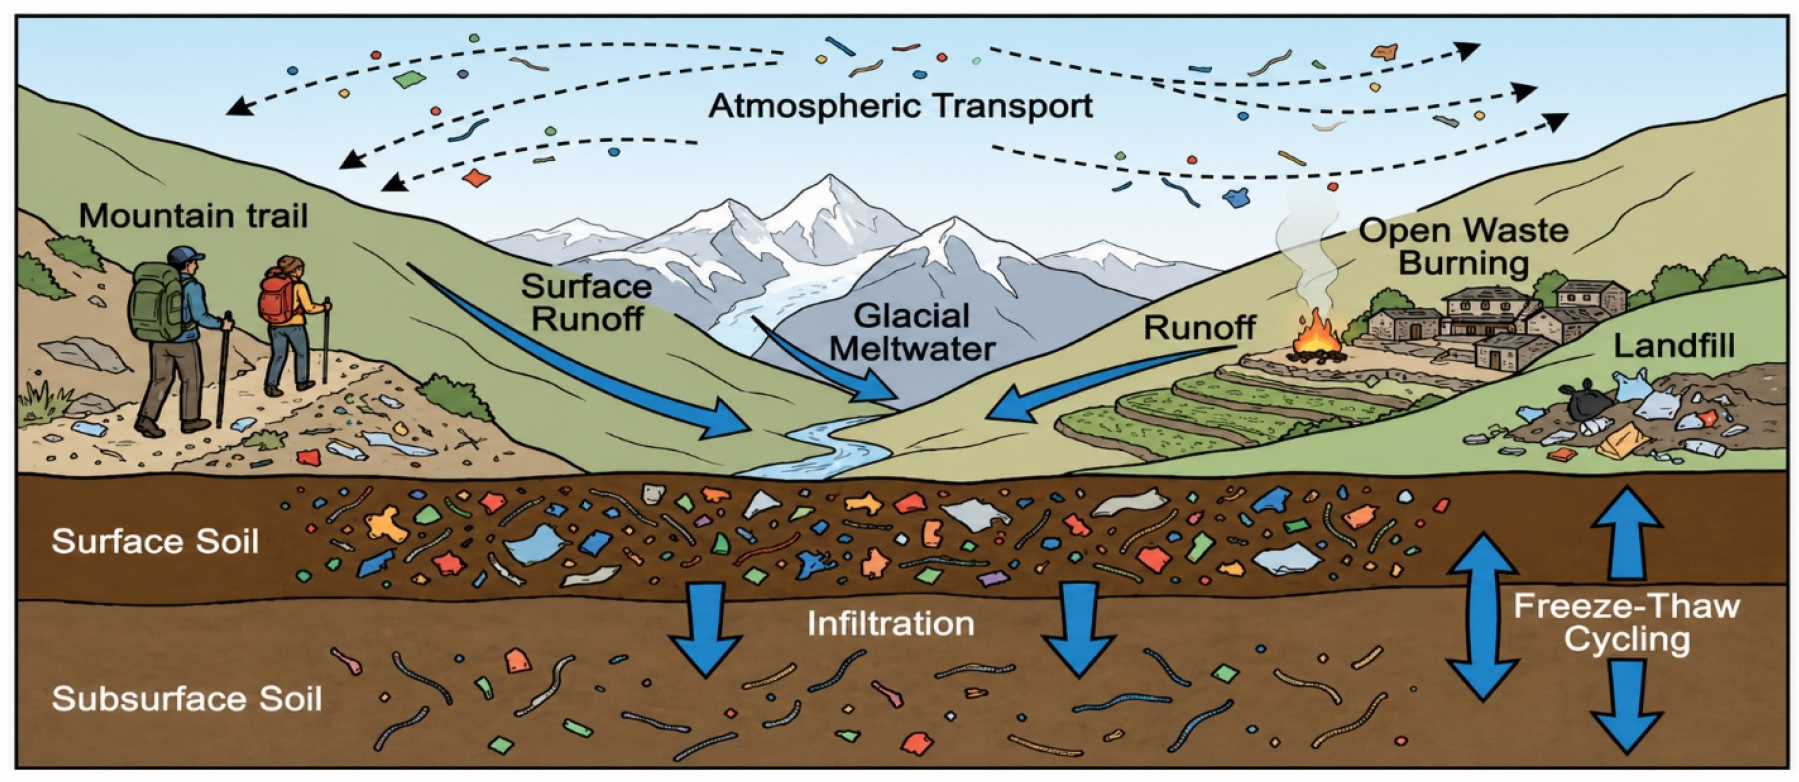
To guide interpretation of spatial contamination patterns, we conceptualize microplastic distribution in SNP through a source–pathway–retention lens in which local tourism-related waste, litter fragmentation, and fiber shedding from clothing and gear represent likely direct inputs. At the same time, hydrologic and atmospheric redistribution may transport particles beyond immediate point sources (Figure 1). This conceptual framing is used to interpret how land use, soil depth, and elevation shape contamination patterns across the study area, while recognizing that the specific pathways remain inferential rather than directly tracked in this study.
Figure 1.
Conceptual framework for microplastic contamination in SNP soils, illustrating the source–pathway–retention model linking tourism-related inputs to soil accumulation. Figure was created with the assistance of Google Gemini.
2. Materials and Methods
2.1. Study Area and Sample Collection
SNP is located in the Solukhumbu district of eastern Nepal, covers 1148 km2, and spans elevations from 2845 m above sea level (m a.s.l.) at Monjo to 8848 m a.s.l. at the summit of Mount Everest [26]. The park is surrounded by a 275 km2 buffer zone. Together, these areas form a protected high-altitude landscape characterized by strong elevational gradients, heterogeneous land cover, and varying levels of human activity [17]. Designated as a UNESCO World Heritage Site in 1979, SNP supports diverse alpine ecosystems and is home to approximately 8700 residents, predominantly Sherpa communities [27,28]. At the same time, the park receives tens of thousands of trekkers annually [17]. Rapid tourism growth has contributed to unmanaged solid waste disposal, with more than 75 dump sites documented across the park, where plastics and packaging materials are among the most common waste types [29]. This combination of ecological sensitivity, steep environmental gradient, and intense tourism pressure makes SNP an important setting for examining microplastic contamination in high-altitude terrestrial ecosystems.
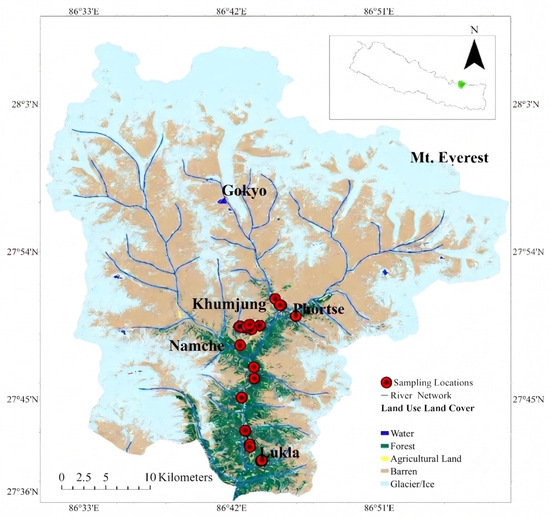
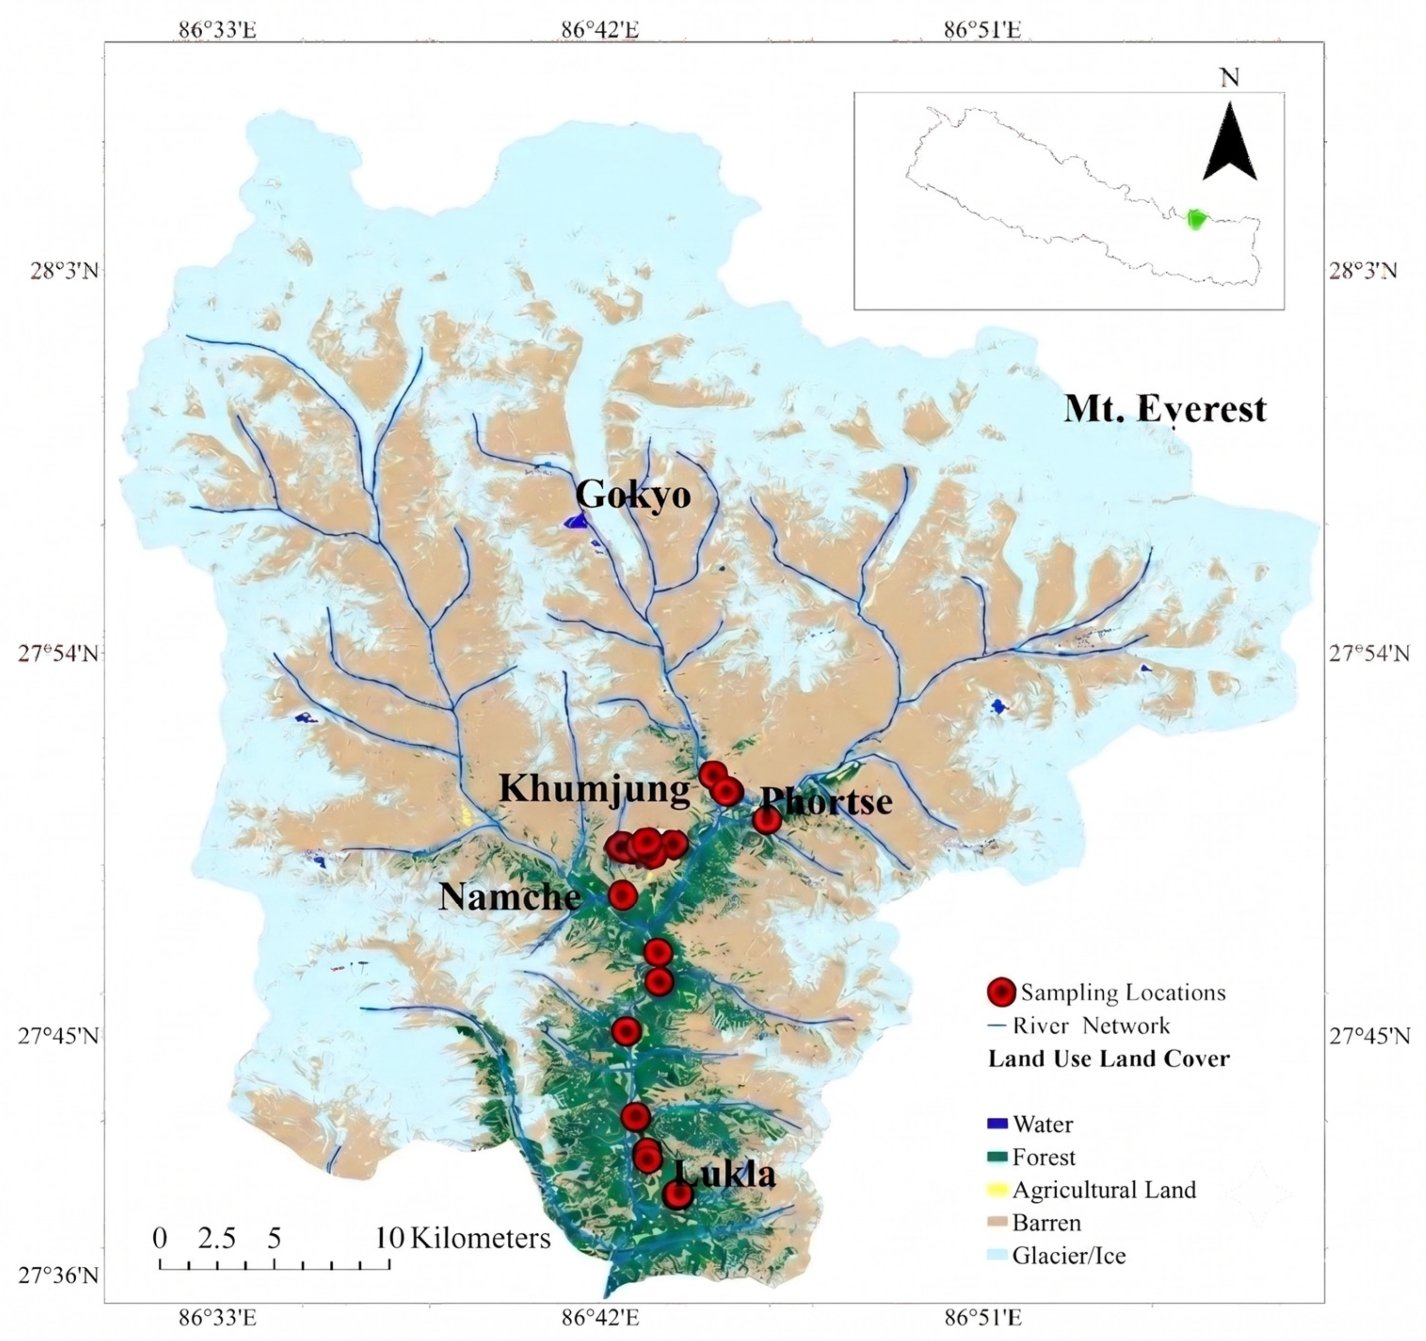
Field sampling was conducted in May 2023 during the pre-monsoon season, coinciding with peak trekking activity and favorable field access. Sampling was concentrated along established trekking corridors between Lukla and Phortse, where the range of land-use types and accessibility permitted systematic sampling across anthropogenic gradients (Figure 2). Sampling sites were distributed across four land-use/land-cover categories: settlement (n = 7), farmland (n = 8), forest (n = 5), and floodplain (n = 5), reflecting major land-use types along the corridor (Table 1). This distribution was built on the land-cover framework developed by Humagain [30] for SNP, enabling comparison of microplastic contamination across gradients of anthropogenic pressure.
Figure 2.
Study area map of SNP, Nepal, showing the 25 sampling locations along the Lukla–Phortse trekking corridor, river network, and land-use/land-cover types. The inset indicates the park’s location within Nepal.
Table 1.
Sampling site locations, land-use classification, and elevation along the Lukla–Phortse trekking corridor, SNP. n = 25 sites. See Table S5.1 for corresponding microplastic concentrations.
At each site, soil samples were collected using a stainless-steel auger from the surface (0–5 cm) and the subsurface (5–10 cm) layers, to evaluate vertical variation. Samples at each depth consisted of composites from two to three subsamples collected within a 1 m radius and homogenized on-site. Sampling tools were rinsed with deionized water and wiped with aluminum foil between sites to minimize cross-contamination. All samples were stored in aluminum foil-covered containers and transported to the Aquatic Ecology Center in Dhulikhel, Nepal, for initial processing.
2.2. Laboratory Analysis
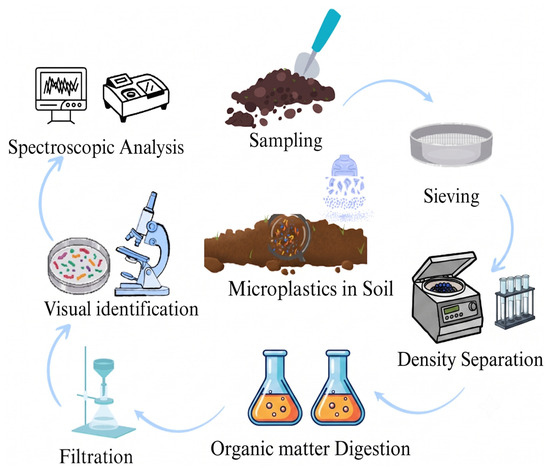
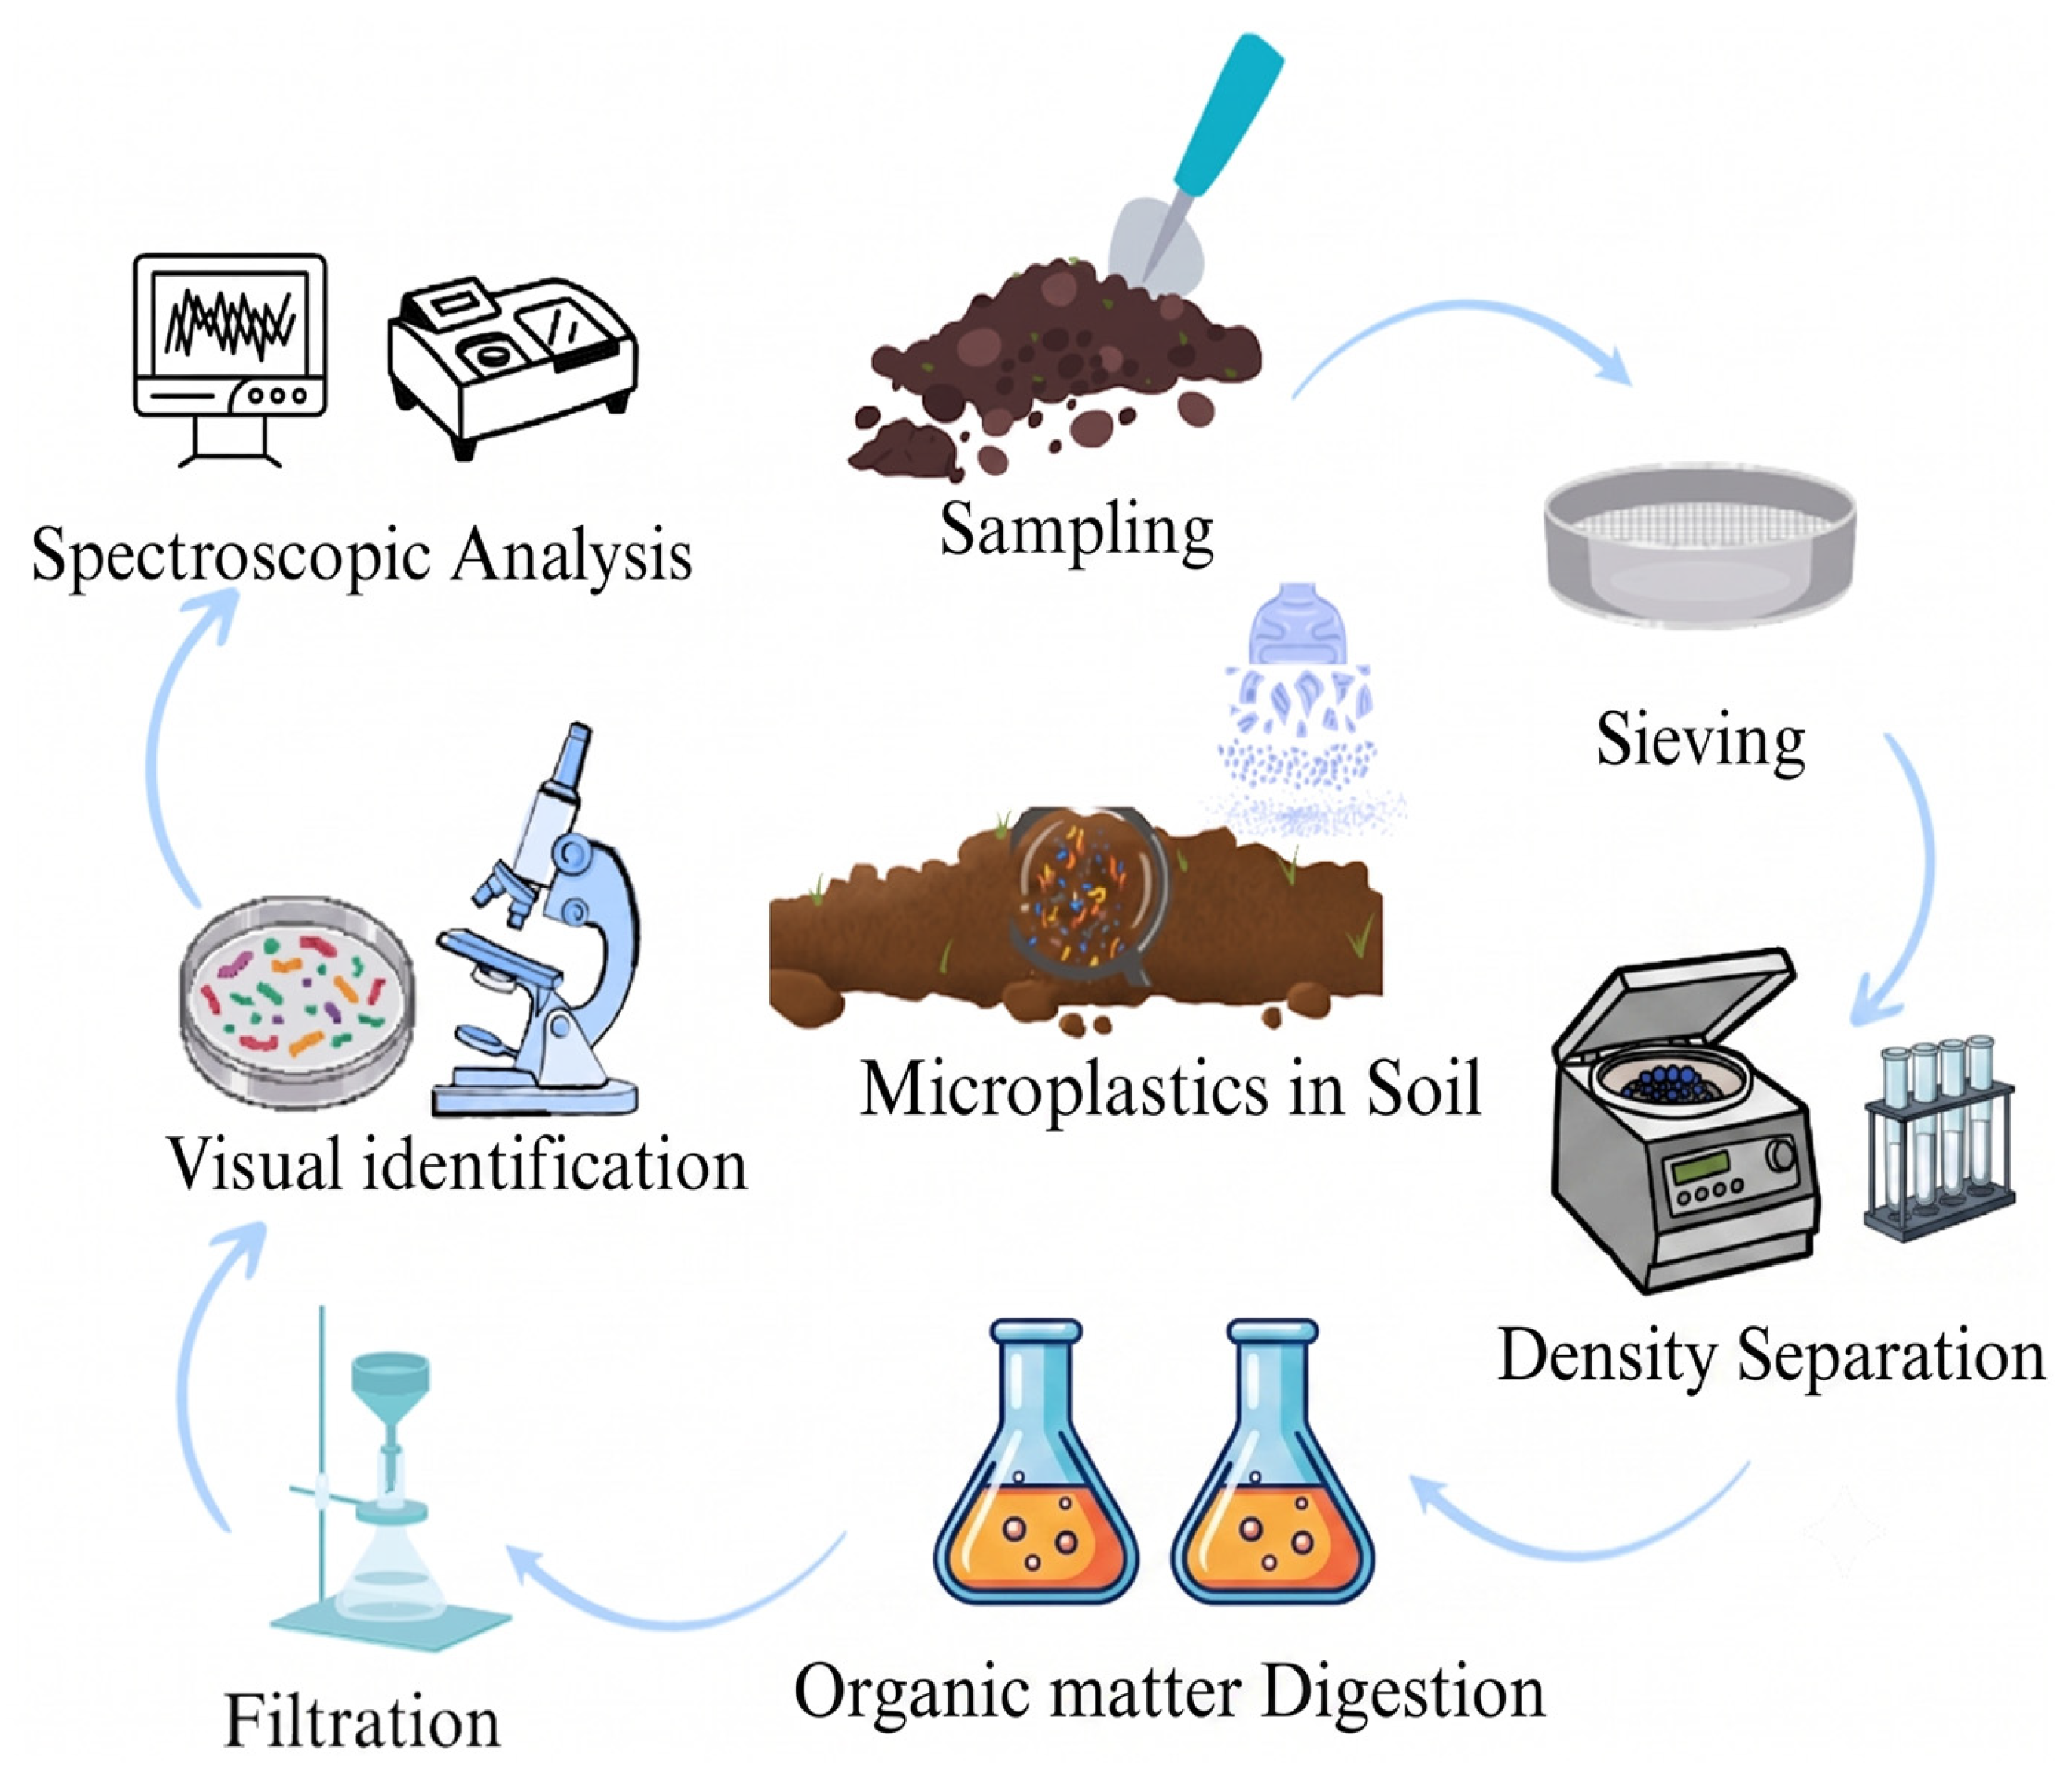
Microplastic extraction and identification were conducted across two institutions: preliminary processing at the Aquatic Ecology Center (AEC), Kathmandu University, Nepal, and advanced extraction and identification at Ball State University (BSU), USA (Figure 3). This two-stage approach reflected resource and logistical constraints in Nepal and the need to reduce sample complexity prior to international transport.
Figure 3.
Typical workflow for microplastic extraction and analysis from soil samples, from sample collection through density separation, organic matter digestion, filtration, and microscopic examination.
At AEC, soil samples were air-dried at room temperature to a constant weight under aluminum foil covers to minimize airborne contamination. Dried samples were then sieved through a stainless-steel 10 mm mesh to remove coarse debris [31]. All concentrations were reported as particles per kilogram of dry soil. Density separation was performed using a mixed sodium chloride (NaCl) and zinc chloride (ZnCl2) solution at approximately 1.26 g/cm3, with 50 g of soil per sample centrifuged (Eppendorf, Enfield, CT, USA) at 3900 rpm for 10 min in 50 mL polypropylene centrifuge tubes consistent with established soil microplastic extraction protocols [32]. This density was sufficient to recover low-density polymers such as PE and PP, though denser polymers, including PET and polyvinyl chloride (PVC), were likely underrepresented. Due to high particulate load and equipment constraints, supernatants retained residual mineral and organic materials, which were vacuum filtered through 0.45 µm glass fiber filters, transferred into sealed Petri dishes, and stored at room temperature for transport to BSU, where further processing was conducted.
At BSU, residual organic matter was removed using Fenton’s reagent, which is a solution of hydrogen peroxide (H2O2) and an iron catalyst, following the protocol of Radford et al. [33]. The iron(II) catalyst solution was prepared by dissolving 10 g of iron sulfate heptahydrate (FeSO4·7H2O, ACS reagent, Fisher Scientific, Waltham, MA, USA) in 500 mL of deionized (DI) water acidified to pH ≈ 3 with 0.1 N sulfuric acid (H2SO4, Fisher Chemical, Waltham, MA, USA). Ten milliliters of this solution were added to each sample, followed by a gradual addition of 20 mL of 30% H2O2. Approximately 1 mL of concentrated sulfuric acid was then added to control the reaction, and the reaction was allowed to proceed for 30 min under fume hood conditions. A second density separation was then performed using ZnCl2 solution at approximately 1.5 g/cm3, centrifuged at 3900 rpm for 10 min. The resulting supernatant was vacuum-filtered through 0.45 µm glass fiber filters, dried in a desiccator for 24 h, and stored in sealed Petri dishes prior to microscopic and deep learning-based analysis.
2.3. Deep Learning-Based Microplastic Detection
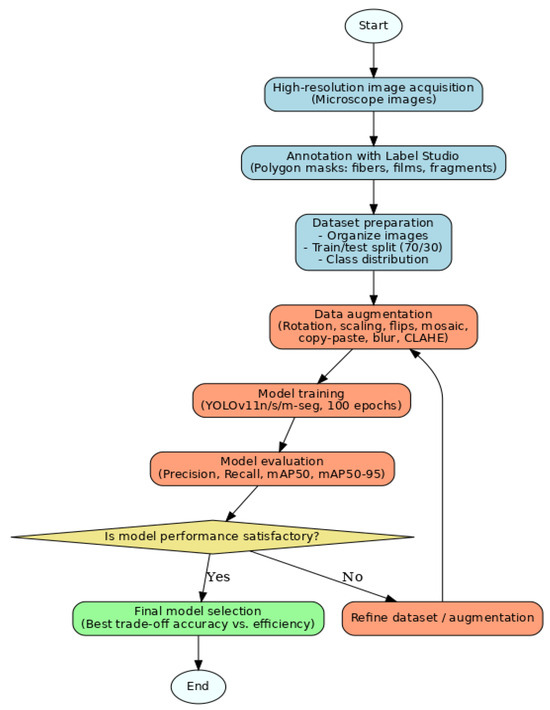
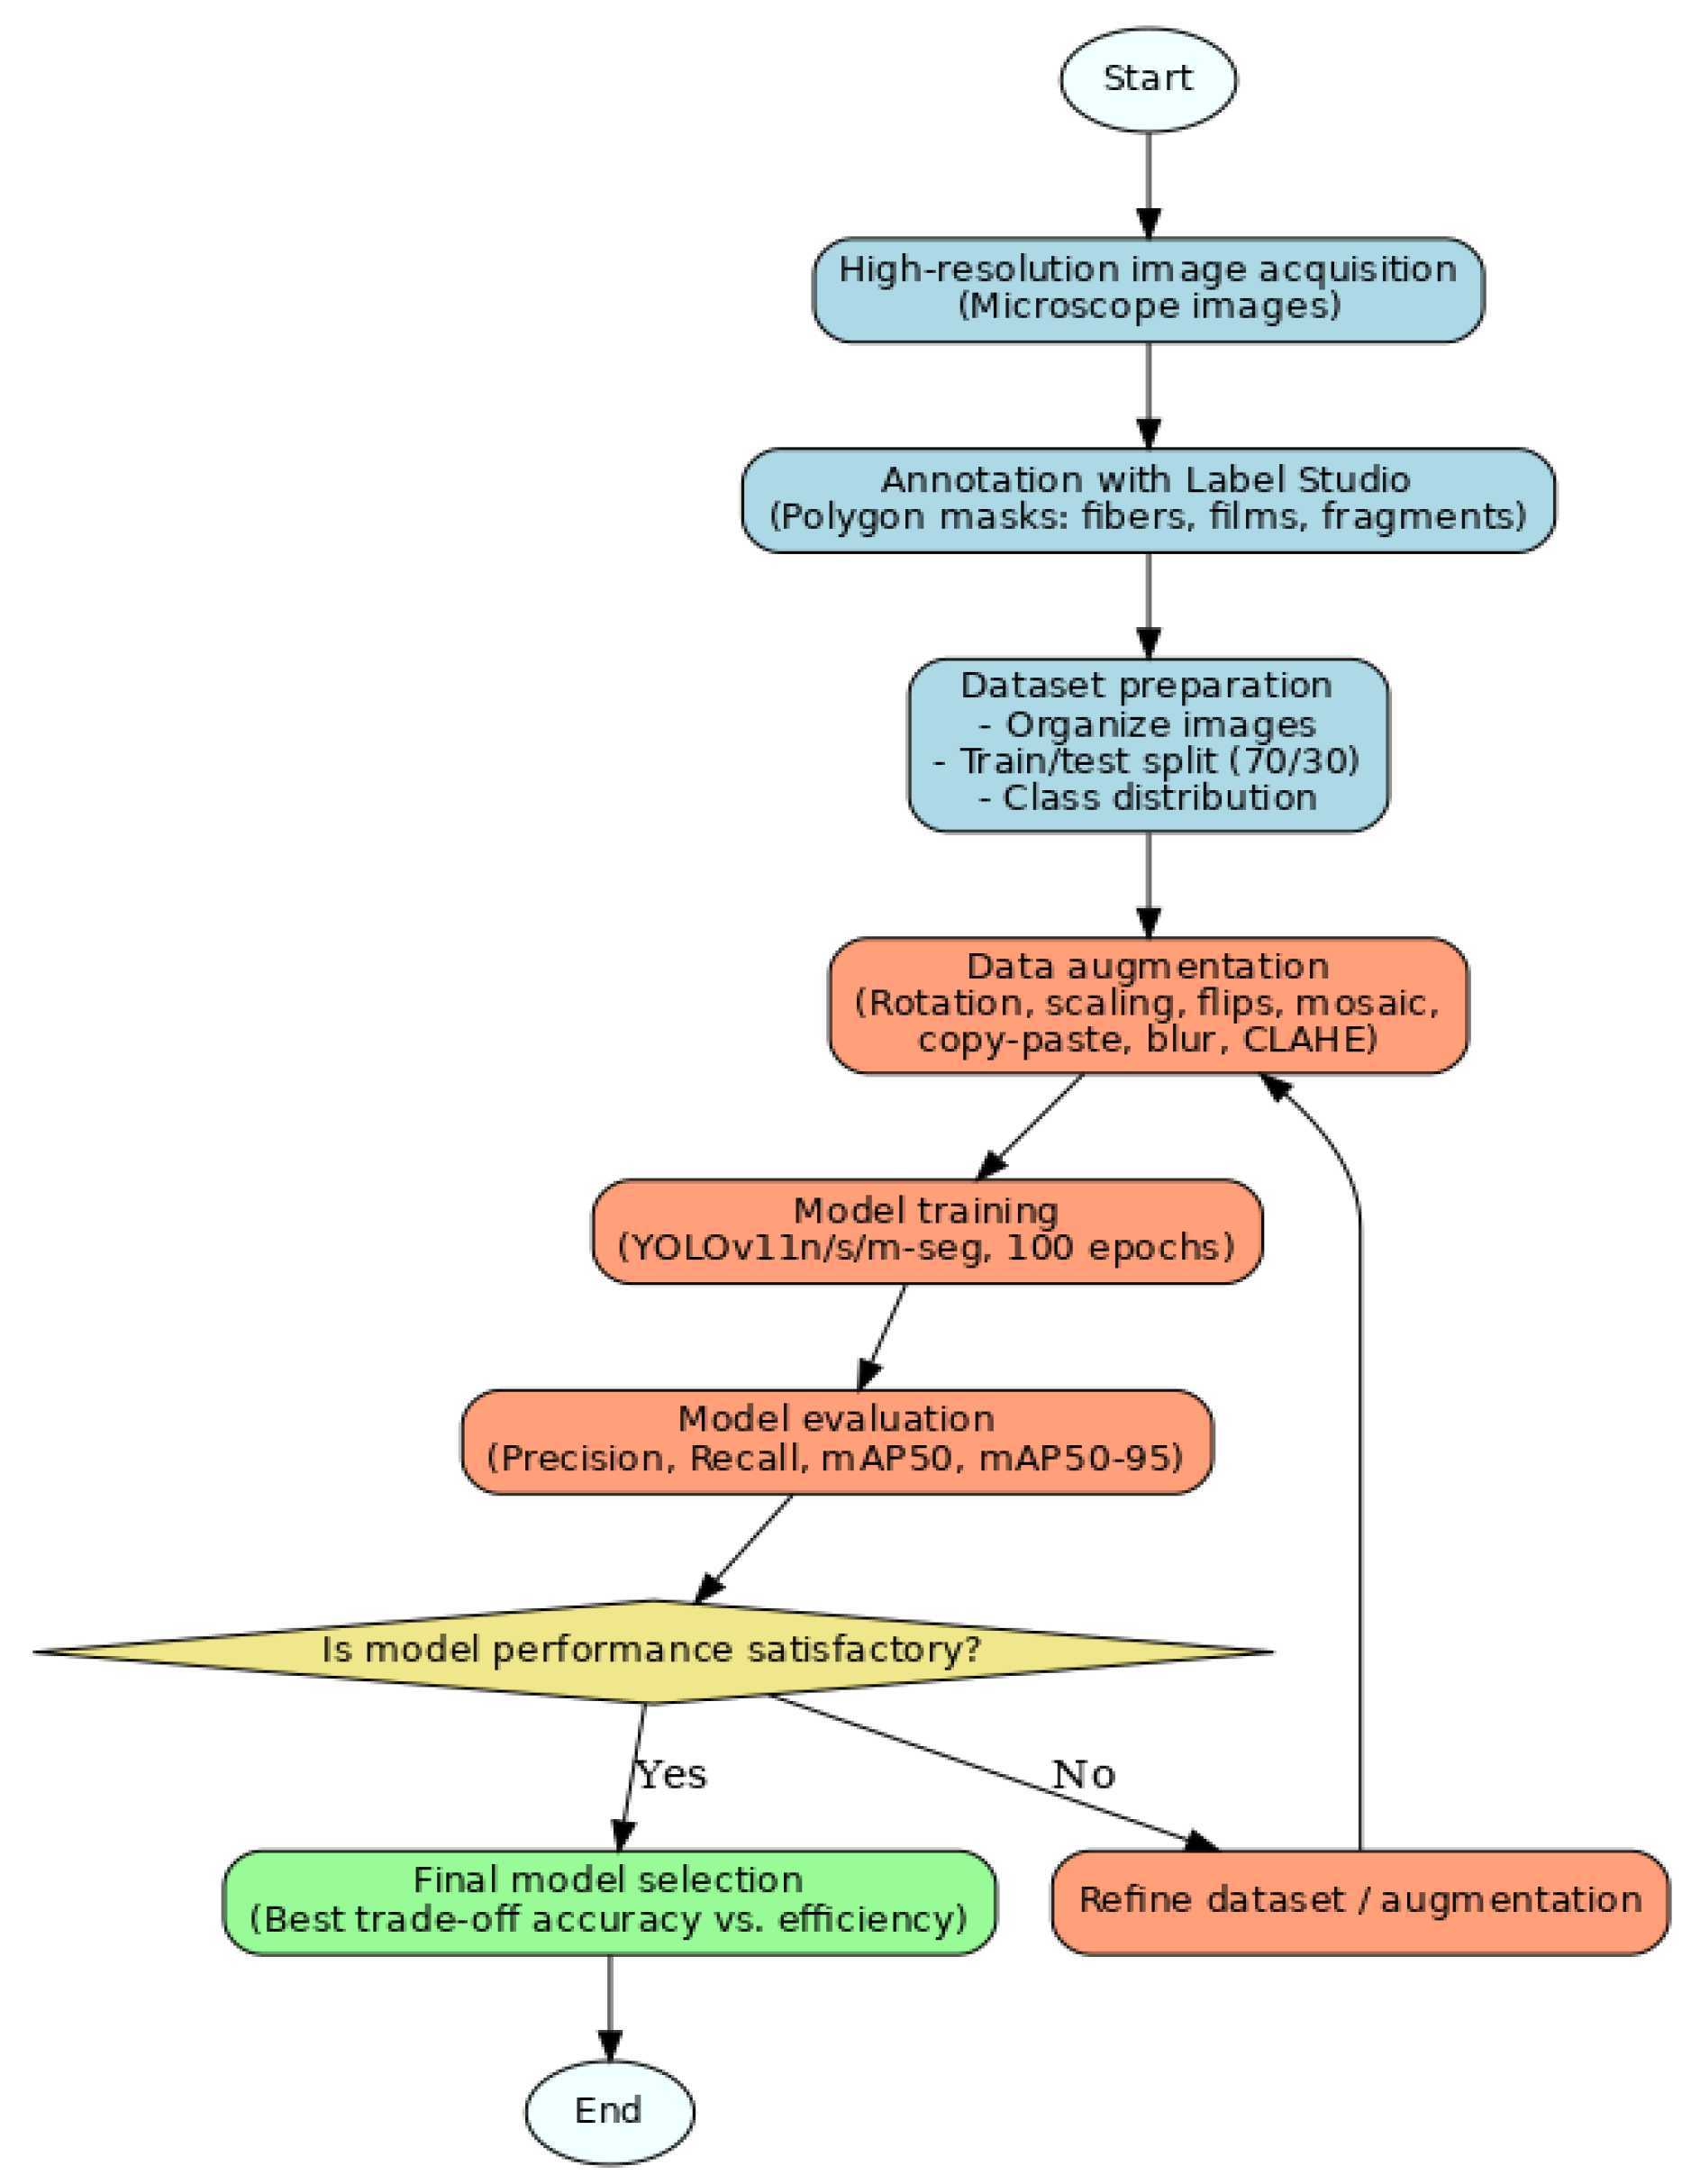
High-resolution images of the extracted filter papers were captured using a Nikon SMZ18 stereomicroscope (Nikon Instruments Inc., Melville, NY, USA) at 40× magnification via NIS-Elements software (v4.3). Filter papers (47 mm diameter, 0.45 µm pore size) were examined, and all areas containing visually identifiable particles or particle-like objects were imaged, including potential plastics, soil aggregates, and organic materials. An average of approximately 30 images was captured per sample. A subset of blank filter areas was also imaged to represent clean background conditions. Imaging was conducted using manual stage translation across non-overlapping fields of view. The effective lower detection limit of the imaging and classification pipeline was approximately 50 µm at 40× magnification. The overall deep learning workflow, from dataset preparation through model selection, is summarized in Figure 4.
Figure 4.
Workflow of the deep learning pipeline for microplastic segmentation. Blue boxes represent dataset preparation, orange boxes represent augmentation and training, the yellow diamond indicates performance evaluation, and the green box denotes final model selection.
Particle annotation was performed in Label Studio (v1.9) using polygon segmentation masks. Each particle was classified as a fragment, film, or fiber according to predefined morphological criteria adapted from Markley et al. [34] (see Table S4.2 in Supplementary Materials for complete classification criteria). Briefly, fragments were defined as irregular, broken plastic pieces with non-uniform shape and jagged or rough edges; films as thin, flat, flexible sheets with smooth surfaces and relatively uniform thickness; and fibers as long, narrow, highly flexible strands elongated in one dimension with generally consistent width. Objects showing characteristics of natural material, such as cellular structure, twisting, segmentation, or uneven fibrous morphology, were excluded from annotation. A randomly selected subset of images was independently annotated by two researchers. Agreement was assessed in terms of particle presence, morphological classification, and particle count per image, yielding Cohen’s Kappa of 0.882. Discrepancies were jointly reviewed and resolved according to predefined criteria, and adjudicated labels were incorporated into the final dataset.
The dataset comprised 309 images, containing 386 annotated instances across three morphological classes: 246 fragments, 89 fibers, and 51 films. The dataset was then split into training (72%; 223 images, 279 instances) and test (28%; 86 images, 107 instances) subsets (Table S1.1), consistent with practice in comparable deep learning microplastic studies [35]. To prevent data leakage across multiple images collected from the same filter, partitioning was performed at the filter level to ensure that no images from the same filter appeared in more than one subset. Background images without microplastic particles were included in both subsets to improve the model’s ability to distinguish particles from visually complex soil backgrounds.
Three YOLOv11-seg variants were evaluated on a held-out test set, and the nano variant was selected based on its superior performance (Table S1.2); final performance metrics are reported on the same test set. The selected model was trained for 100 epochs on Google Colab using an NVIDIA T4 GPU (PyTorch 2.6.0, Ultralytics 8.3.119), with input images resized to 640 × 640 pixels, batch size 16, and an AdamW optimizer with a learning rate of 0.001429. Data augmentation included random rotation (±12°), scaling (down to 50%), vertical flips (probability 0.7), horizontal flips (probability 0.5), and blur, grayscale, and CLAHE transformations at low probabilities. Model inference used a confidence threshold of 0.536, corresponding to the peak F1-score of 0.89, and a non-maximum suppression IoU threshold of 0.45. Model performance was evaluated using precision, recall, and mean average precision at IoU thresholds of 0.5 (mAP50) and 0.5–0.95 (mAP50–95) on the test set (see Tables S1.3–S1.5 and Figure S1 for complete training and test set metrics, processing times, and confidence threshold selection).
To evaluate counting performance at the sample level, a subset of 16 filters (2 sites per land-use type × 2 depths) was selected for manual validation. Each filter was independently counted by a trained analyst through visual inspection of the microscopic filter images, without prior knowledge of YOLO-derived counts. A deviation of ≤15% was used as the benchmark for acceptable counting performance, consistent with the maximum deviation target established by Giardino et al. [36] for automated microplastic counting on filter images.
2.4. O-PTIR Spectroscopy
A subset of visually identified particles was subsequently analyzed by O-PTIR spectroscopy to identify polymer type. Spectra were acquired using an mIRage IR Microscope (Photothermal Spectroscopy Corp., Santa Barbara, CA, USA) operated at the Center for Functional Nanomaterials, Brookhaven National Laboratory, NY, USA. Particles were analyzed directly on the 0.45 µm glass fiber filters after desiccation, with no additional substrate transfer or preparation required. Spectra were acquired using the avalanche photodiode (APD) detector in reflection mode with a co-propagating laser configuration, at 46% IR power and 0.1% probe power. These parameters were selected to minimize thermal damage to environmentally weathered microplastic particles while retaining interpretable IR spectra, following the optimized workflow established for the same instrument and environmental sample type in Yacoub et al. [25]. IR spectra were averaged over 5 scans per particle. Spectral data were processed using PTIR Studio v4.4 software. Polymer identification was based on agreement among multiple characteristic absorption bands in the fingerprint region (975–1800 cm−1) as detailed in Table 2 and interpreted in conjunction with particle morphology observed in microscope images. Spectra were compared with reference spectra using the OpenSpecy library [37], and a minimum match score of ≥0.70 was applied as the acceptance threshold for polymer identification [25,38]. Spectra lacking clear diagnostic features or showing poor agreement with reference patterns were interpreted conservatively and were not treated as definitive confirmation.
Table 2.
Diagnostic vibrational bands used for polymer identification via O-PTIR spectroscopy within the fingerprint region (975–1800 cm−1). Polymer assignments were based on agreement across multiple characteristic bands. n = 160 particles analyzed. See Table S4.1 for the expanded version with source attribution.
2.5. Quality Assurance and Quality Control
Contamination control measures were implemented throughout field sampling and laboratory processing. In the field, sampling tools were rinsed with deionized water and covered by aluminum foil between sites to prevent cross-contamination. Collected samples were immediately sealed in aluminum foil-covered containers and handled with nitrile gloves to minimize exposure to synthetic fibers during transport.
In the laboratory, all equipment and containers were cleaned with deionized water prior to use. To minimize airborne fiber deposition during processing, samples were kept covered with aluminum foil except during active handling steps, and laboratory personnel wore cotton garments rather than synthetic clothing throughout all processing stages. Procedural blanks using deionized water were processed alongside samples at both AEC and BSU to monitor contamination introduced during extraction steps. No microplastics were detected in any procedural blank.
Field blanks could not be implemented due to logistical constraints of high-altitude sampling. This limitation was partially mitigated by minimizing open exposure time during sample collection and immediately sealing containers after sampling.
2.6. Statistical Analysis
Descriptive statistics, including mean, standard deviation, minimum, and maximum, were computed for microplastic concentrations at both soil depths using R (version 4.3.1). ArcGIS Pro (version 2.4.0, Esri, Redlands, CA, USA) was used to map sampling locations and conduct spatial analyses. Microplastic concentrations were reported as particles per kilogram dry soil weight (particles·kg−1). As 50 g of soil was processed per sample, particle counts were normalized to a per-kilogram basis by applying a scaling factor of 20 (1000 g/50 g).
Prior to statistical model selection, the Shapiro–Wilk test was used to assess normality of surface and subsurface concentrations, and the variance-to-mean ratio was calculated to evaluate overdispersion in raw count data. The effects of land use, soil depth, and their interaction on raw microplastic counts were examined using a negative binomial generalized linear mixed model (GLMM) with site as a random intercept, fitted using the MASS package in R. Floodplain subsurface soils were specified as the reference condition, and effect sizes were reported as incidence rate ratios (IRRs) with 95% confidence intervals.
Spearman’s rank correlation was used to examine the relationships between surface and subsurface concentrations, and between elevation and total microplastic concentration. Spatial autocorrelation was assessed using Global Moran’s I, and local clustering was identified using the Getis-Ord Gi* statistic, both implemented in ArcGIS Pro with a fixed distance band of 1500 m. Hotspot significance was evaluated at 95% and 99% confidence levels.
3. Results
3.1. YOLOv11n-Seg Detection Performance
The YOLOv11n-seg model demonstrated strong performance on the held-out test set, achieving an overall mask mAP50 (0.908), precision (0.907), and recall (0.864), indicating reliable detection across all three morphological classes. Among individual classes, films achieved the highest segmentation precision (0.987), fibers showed the strongest recall (0.897), and fragments were the most challenging class due to their irregular morphology, yielding the lowest recall (0.827). The primary error type across all classes was false negatives, i.e., particles present in the image but not detected, rather than cross-class misclassification, suggesting that the morphological category assignments of detected particles are reliable even where some particles may have been missed. The nano variant (YOLOv11n-seg) outperformed both the small and medium variants on the test set despite its substantially smaller parameter count (2.84 M vs. 10.08 M and 22.34 M), processing each image in 8.1 milliseconds, confirming its suitability for high-throughput environmental sample analysis (Table S1.5). A full evaluation, including variant comparison, class-level metrics, confusion matrices, and precision–recall curves, is provided in Supplementary Materials S1.
At the sample level, manual validation across 16 held-out filters yielded an agreement rate of 82% and strong linear correspondence between manual and automated counts (R2 = 0.932; Figure S6).
3.2. Microplastic Concentrations Across Soil Depths
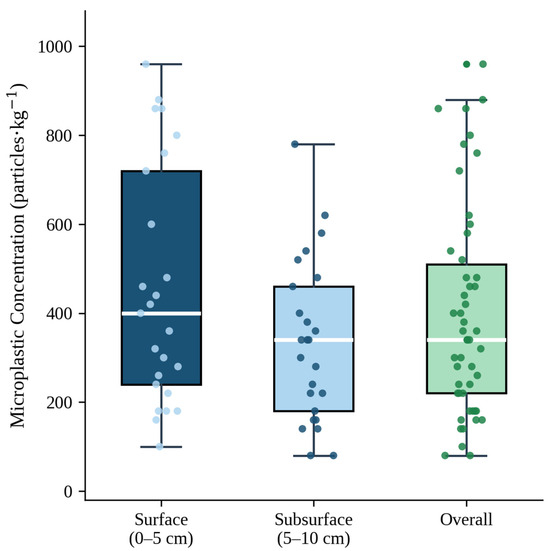
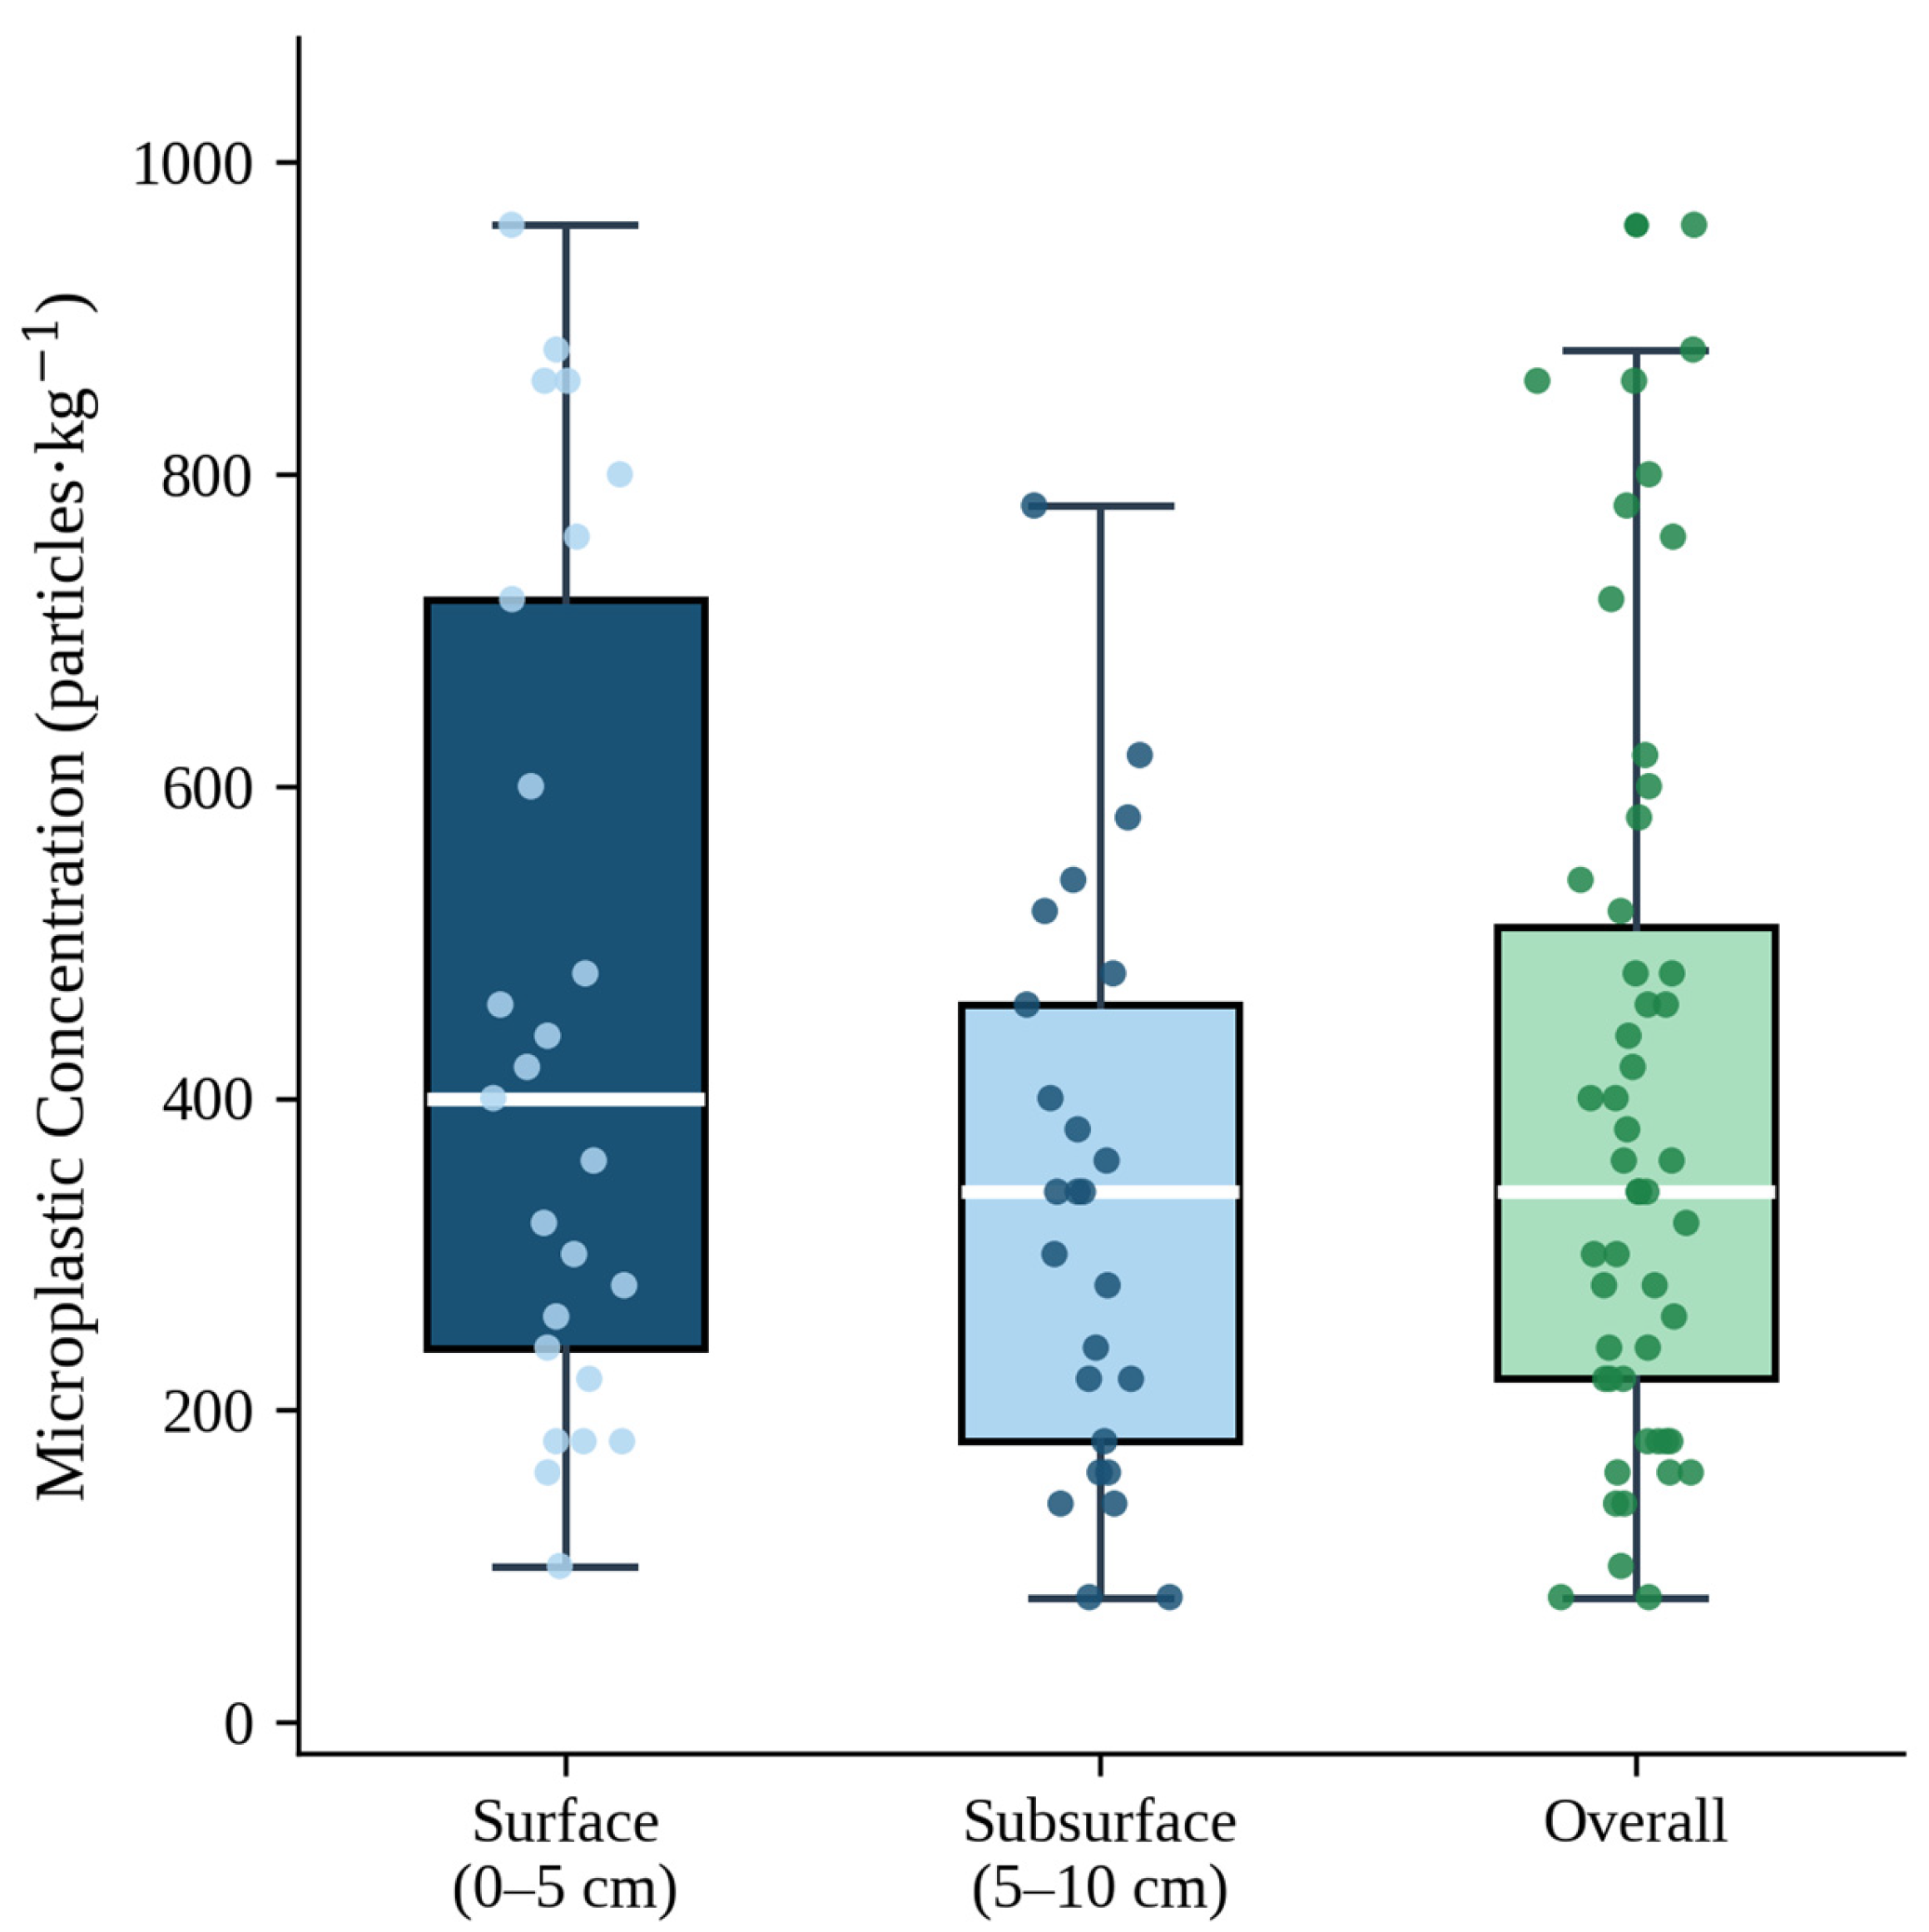
Microplastics were detected in all 50 soil samples analyzed (Figure 5). Concentrations ranged from 80 to 960 particles·kg−1, with a mean of 395 ± 235 particles·kg−1 and an interquartile range of 290 particles·kg. Surface soils (0–5 cm) exhibited a higher mean concentration (457 ± 269) particles·kg−1 than subsurface soils (5–10 cm; 334 ± 181) particles·kg−1.
Figure 5.
Boxplot of microplastic concentrations (particles·kg−1 dry soil) in surface soils (0–5 cm), subsurface soils (5–10 cm), and all samples combined. Boxes represent the interquartile range (25th–75th percentile), horizontal lines indicate medians, whiskers extend to minimum and maximum values, and points show individual sample observations. n = 25 sites per depth; n = 50 overall. See Table S2.1 for normality test results.
3.3. Morphological Composition
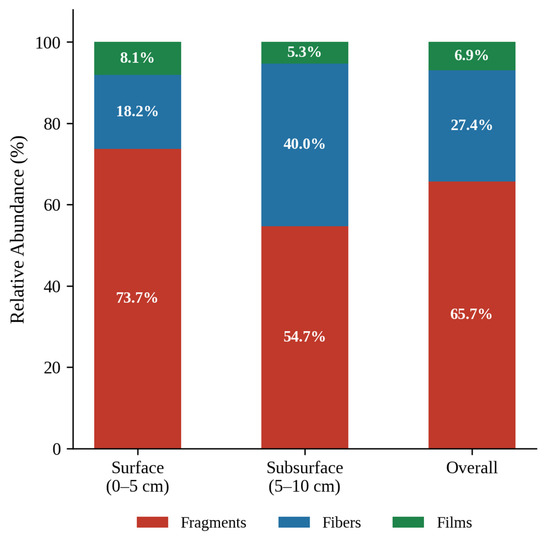
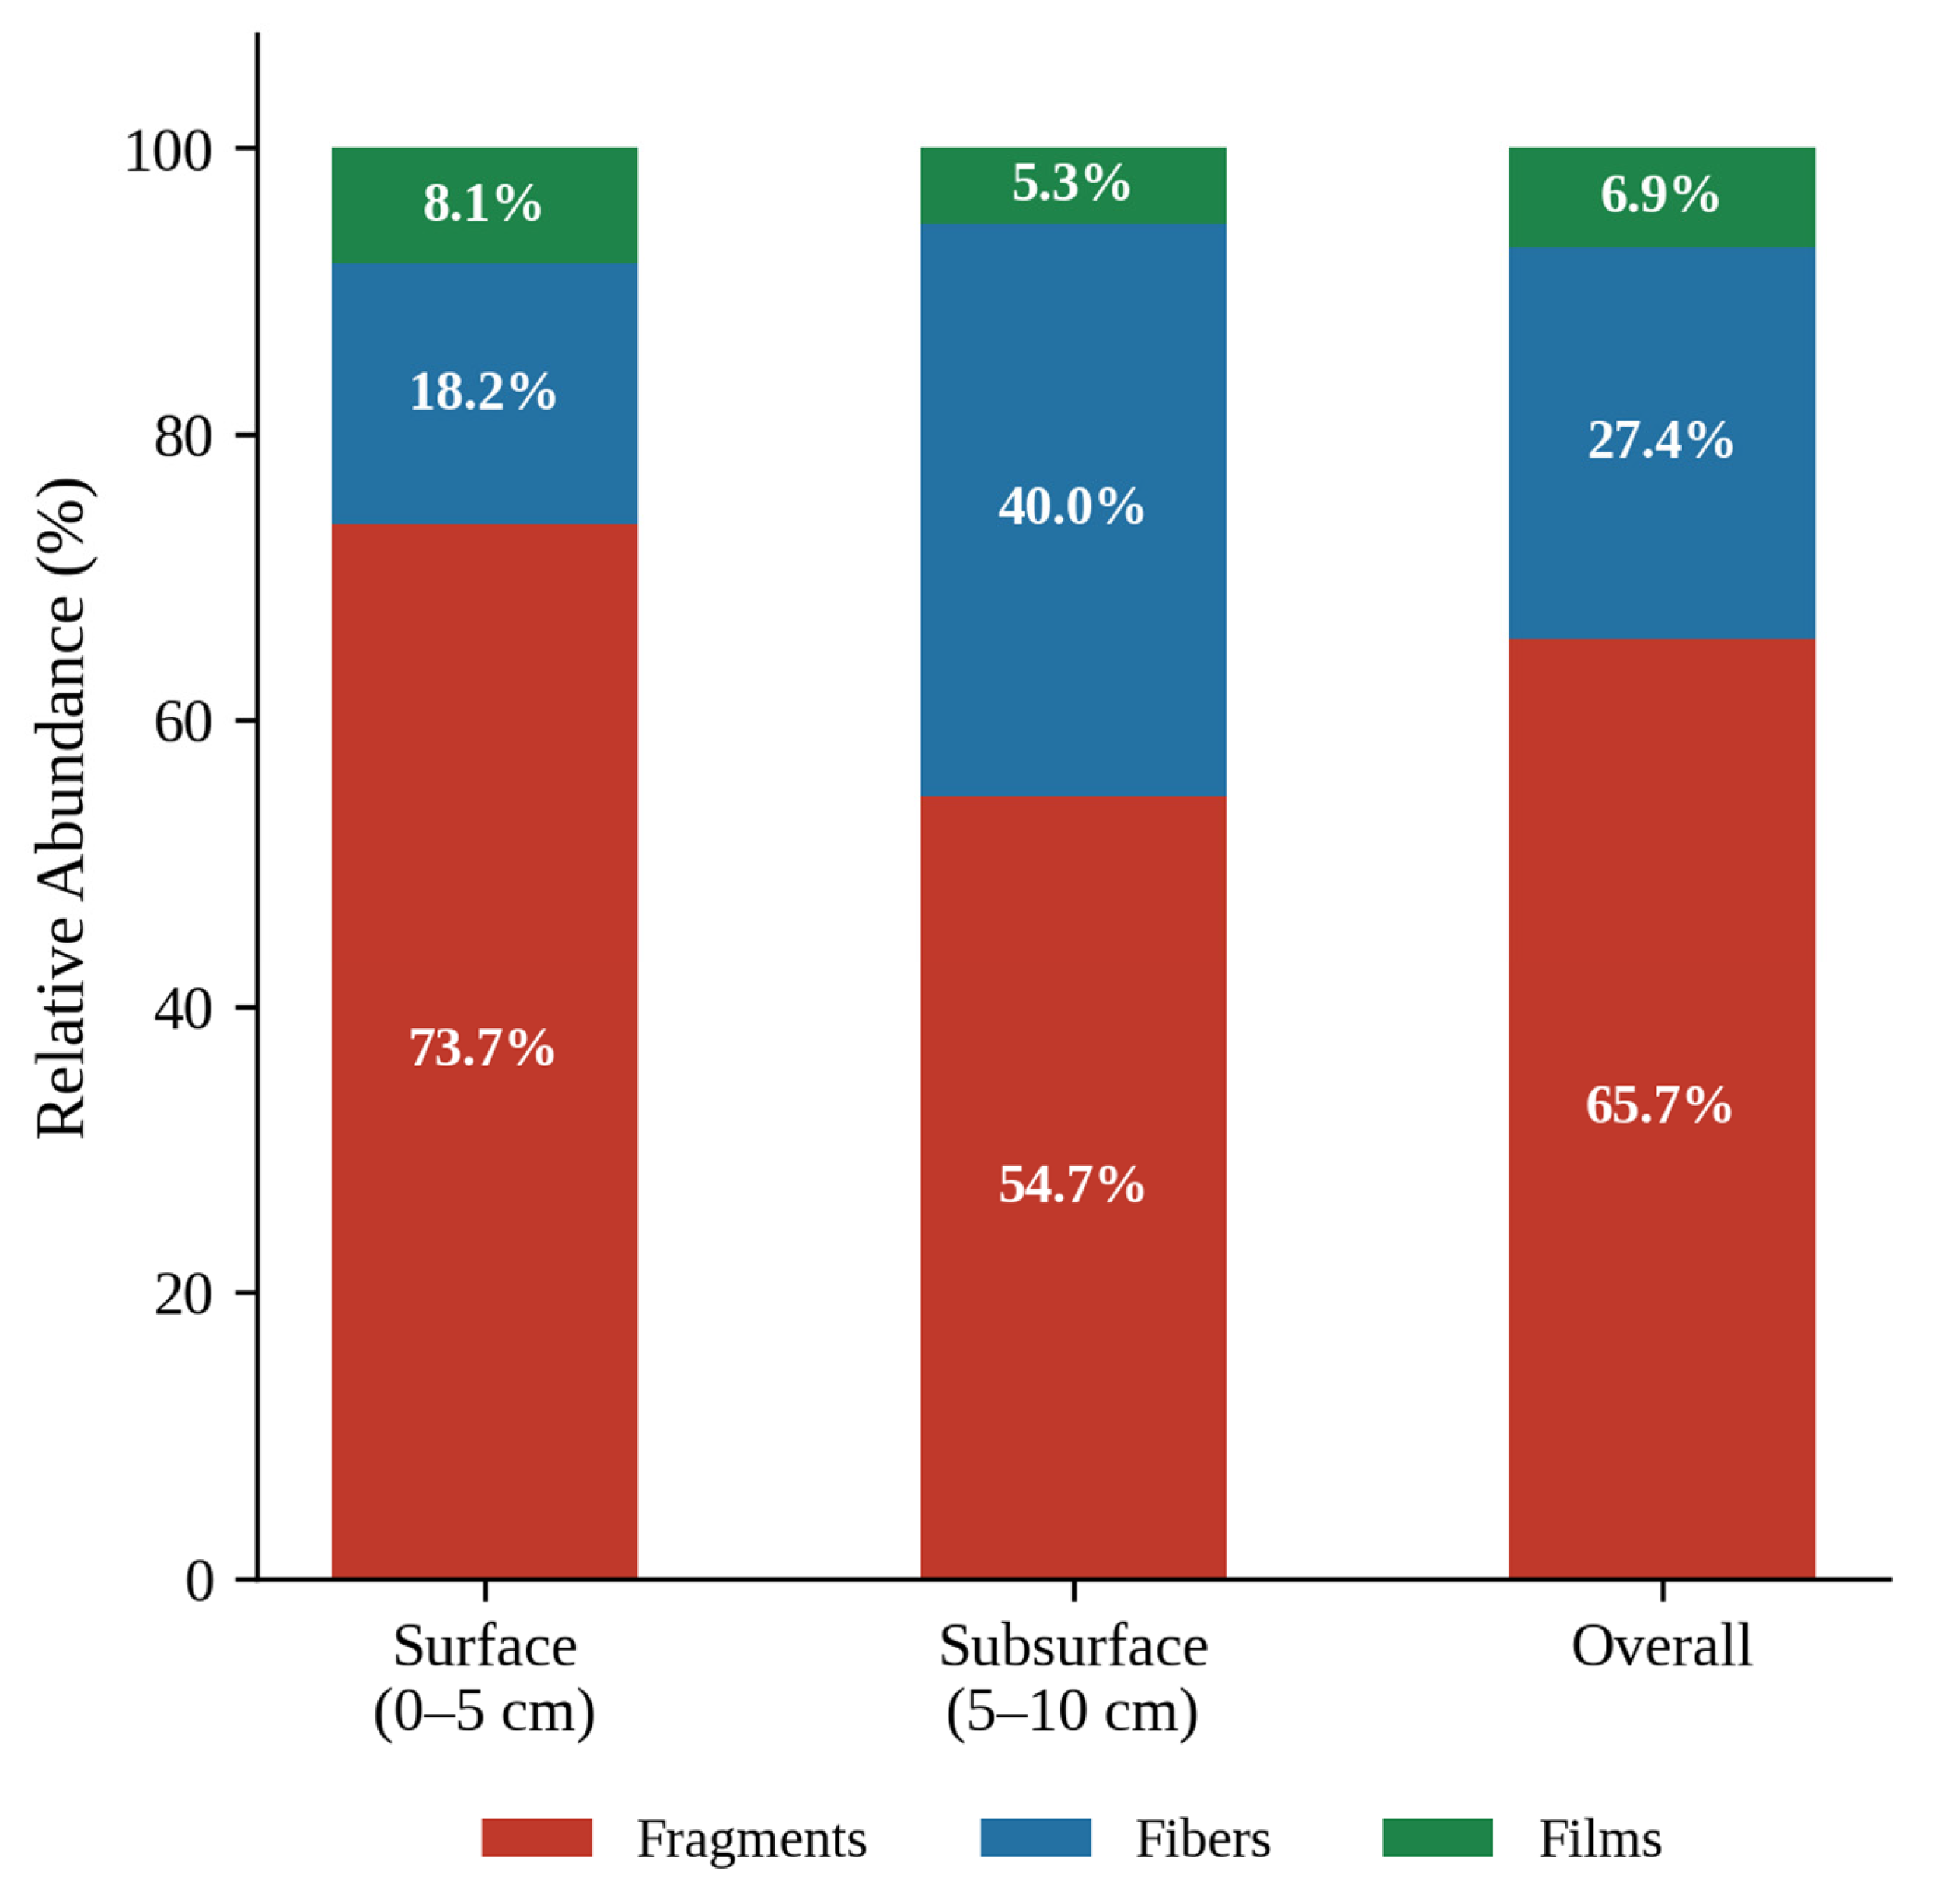
Fragments were the dominant morphological type across all samples, accounting for 65.7% of total particles, followed by fibers and films, which accounted 27.4% and 6.9%, respectively (Figure 6). The relative abundance of morphological types varied with depth. In surface soils, fragments comprised 73.7% of particles, with fibers and films accounting for 18.2% and 8.1%, respectively. In subsurface soils, the proportion of fragments declined to 54.7%, while fibers increased to 40.0%, and films accounted for 5.3%.
Figure 6.
Proportional distribution of microplastic morphological types (fragments, fibers, and films) in surface soils (0–5 cm), subsurface soils (5–10 cm), and overall. Percentages are calculated from total particle counts within each depth category.
3.4. Land-Use and Depth Effects on Microplastic Abundance
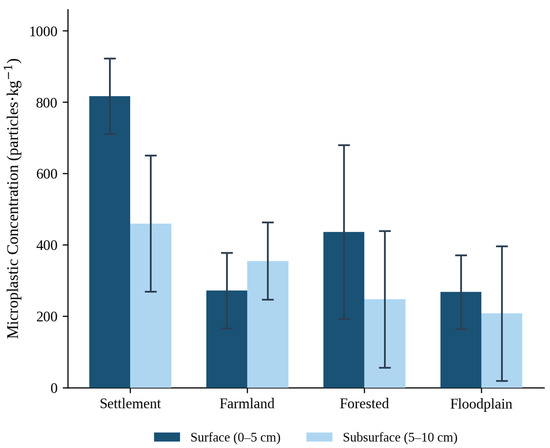
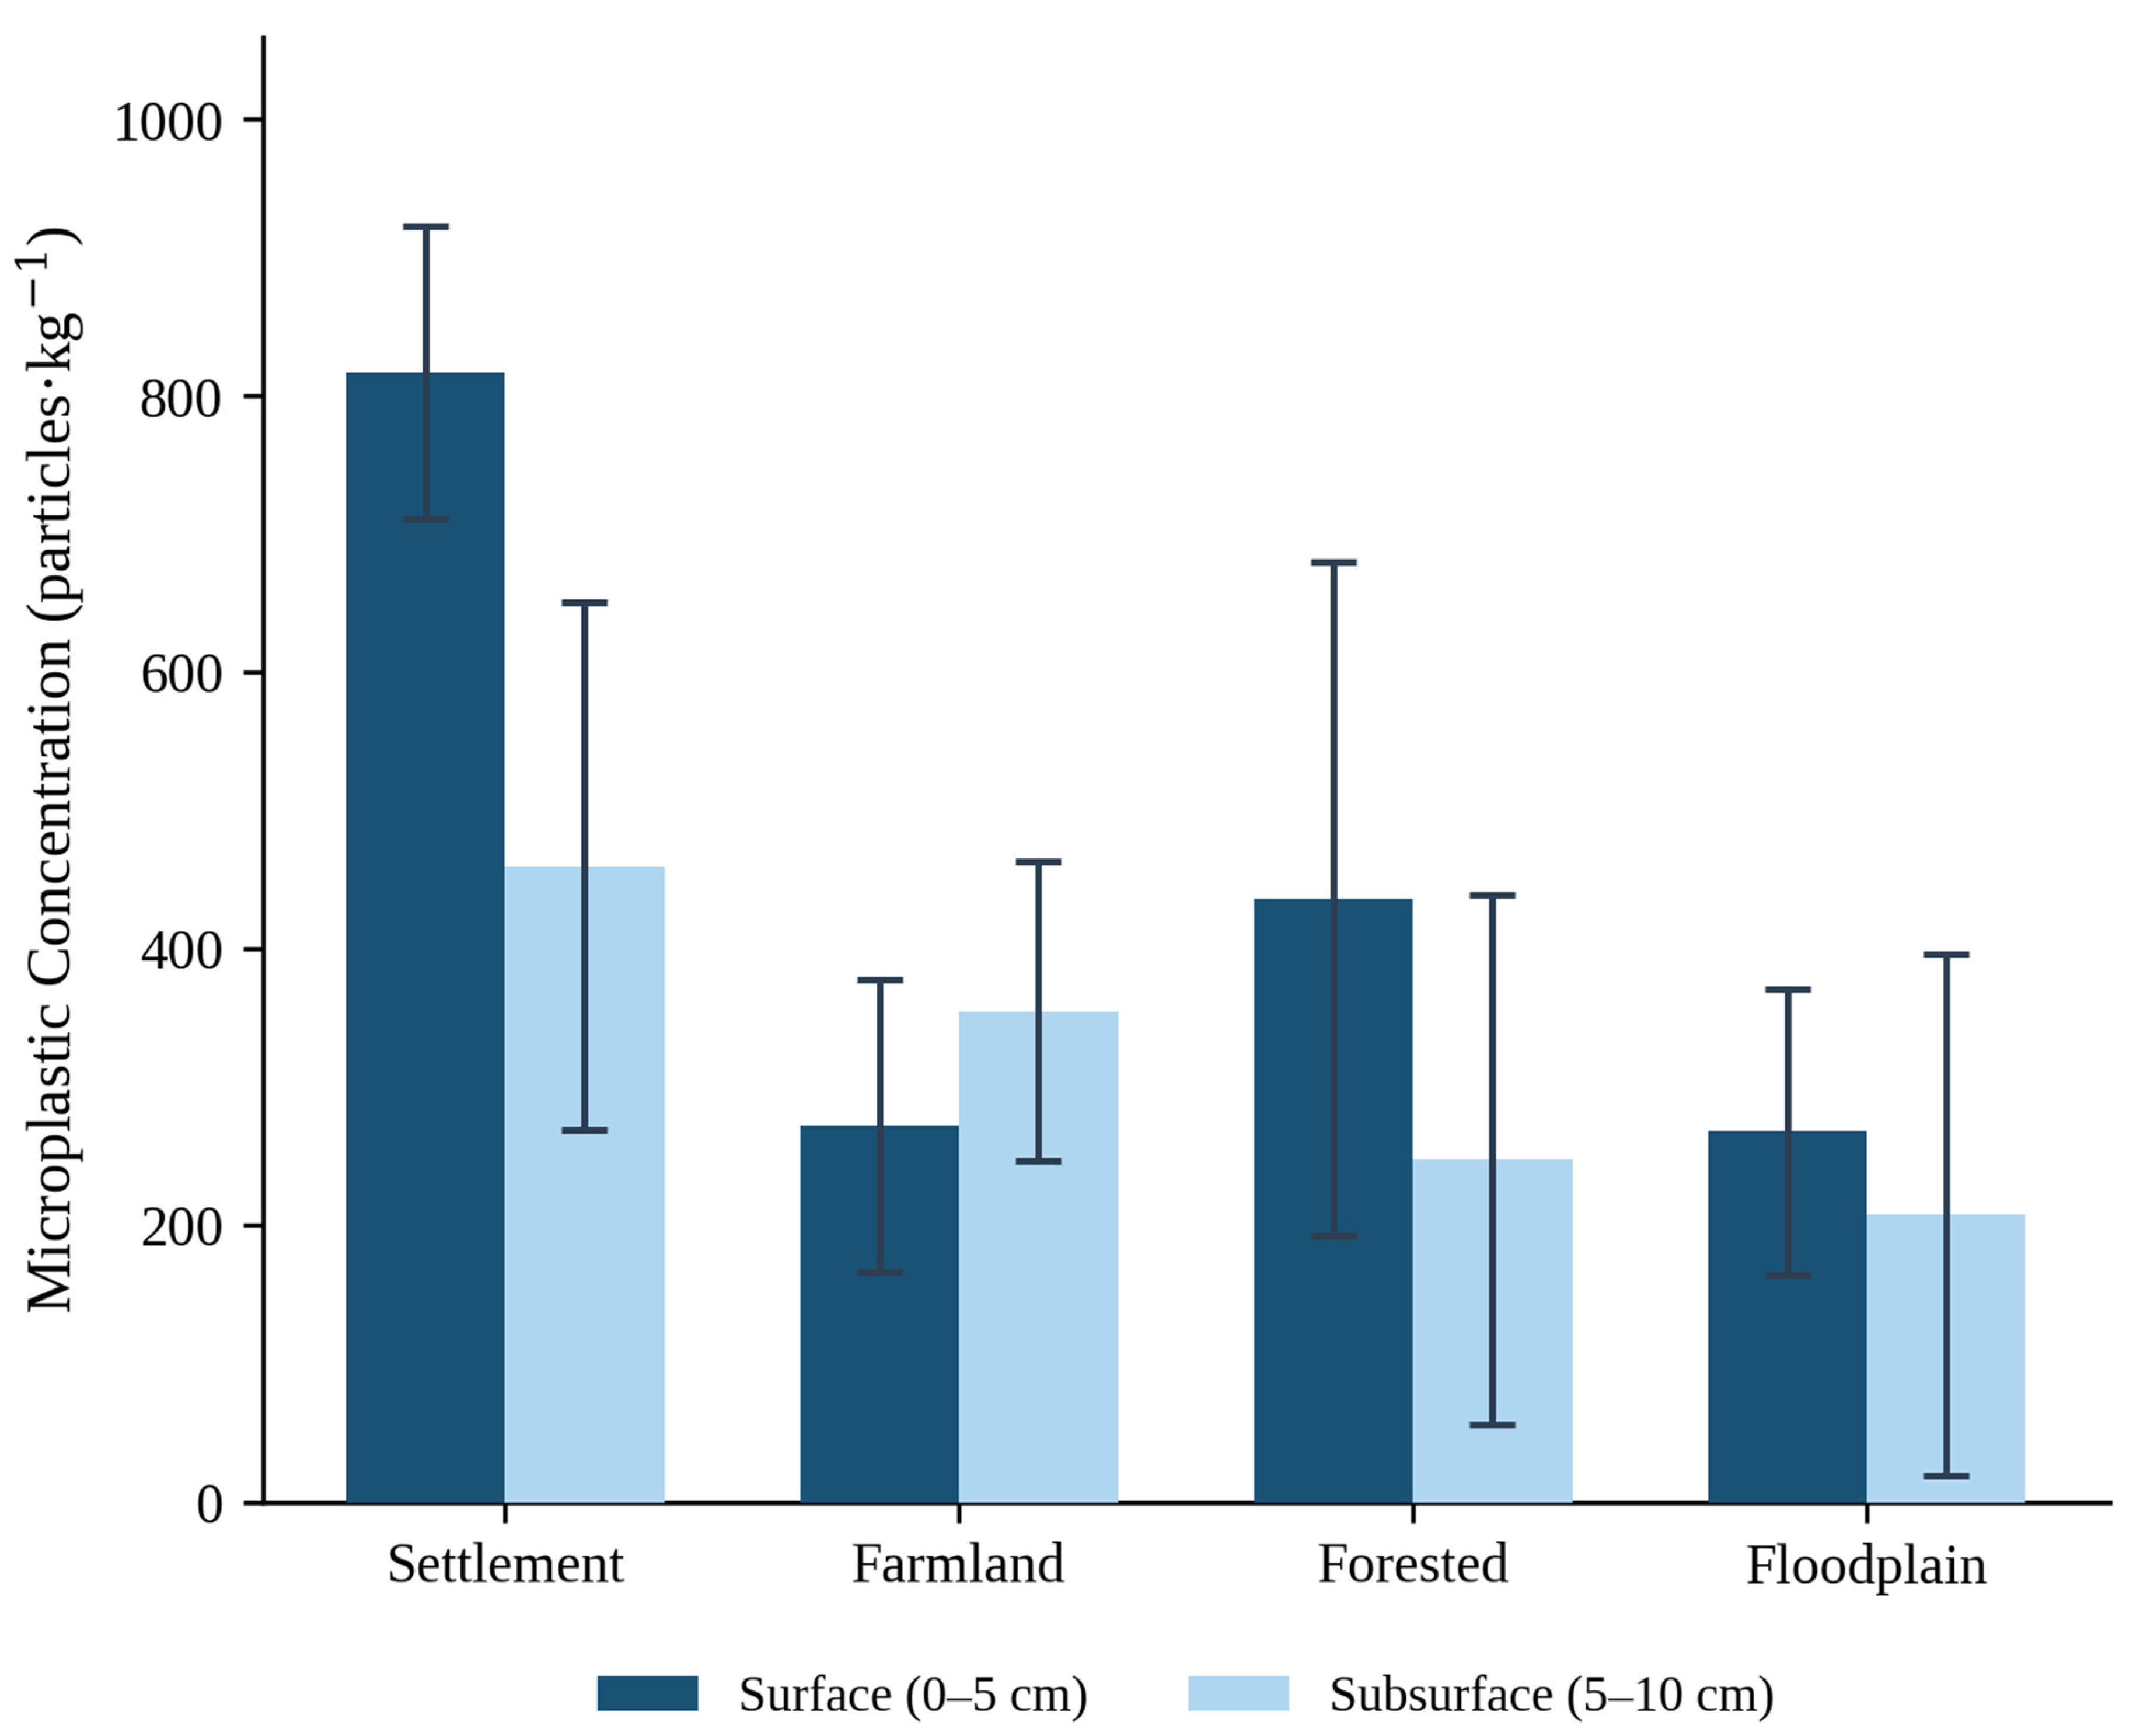
A negative binomial generalized linear mixed model with site as a random intercept was used to test the effects of land use, soil depth, and their interactions on raw particle abundance per sample. For interpretability, descriptive summaries and figures are presented as concentrations in particles·kg−1 dry soil (Figure 7). The model revealed significant effects of land use (χ2 = 37.13, p < 0.001), depth (χ2 = 4.07, p = 0.044), and their interaction (p = 0.012) on microplastic abundance. Full model output is provided in Supplementary Materials Tables S2.4–S2.6.
Figure 7.
Mean microplastic concentrations (particles·kg−1 dry soil) by land-use type and soil depth (0–5 cm surface; 5–10 cm subsurface). Error bars represent 95% confidence intervals derived from the negative binomial regression model. See Tables S2.4–S2.6 for full regression output.
Using floodplain subsurface soils as the reference condition, settlement subsurface soils showed the highest enrichment (IRR = 2.25, 95% CI [1.40, 3.61], p = 0.006), corresponding to a 125% increase in concentration relative to the reference. Farmland subsurface soils were also significantly elevated (IRR = 1.76, 95% CI [1.10, 2.81], p = 0.042), while forest subsurface soils showed no significant difference from floodplains (IRR = 1.19, 95% CI [0.70, 2.02], p = 0.567).
Depth-related patterns varied among land-use types. Surface soils showed higher concentrations than subsurface soils overall (IRR = 1.34, 95% CI [0.86, 2.09], p = 0.257), though this effect was not significant across all land-use types when considered independently. Surface enrichment was significant in settlement soils (IRR = 1.78, p < 0.05) and forest soils (IRR = 1.63, p < 0.05). In contrast, farmland soils showed no significant depth effect (IRR = 0.78, p > 0.05), with surface soils containing slightly fewer microplastics than subsurface soils.
3.5. Elevation and Spatial Distribution of Contamination
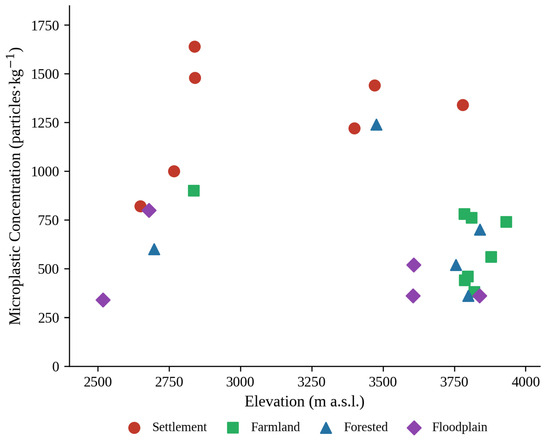
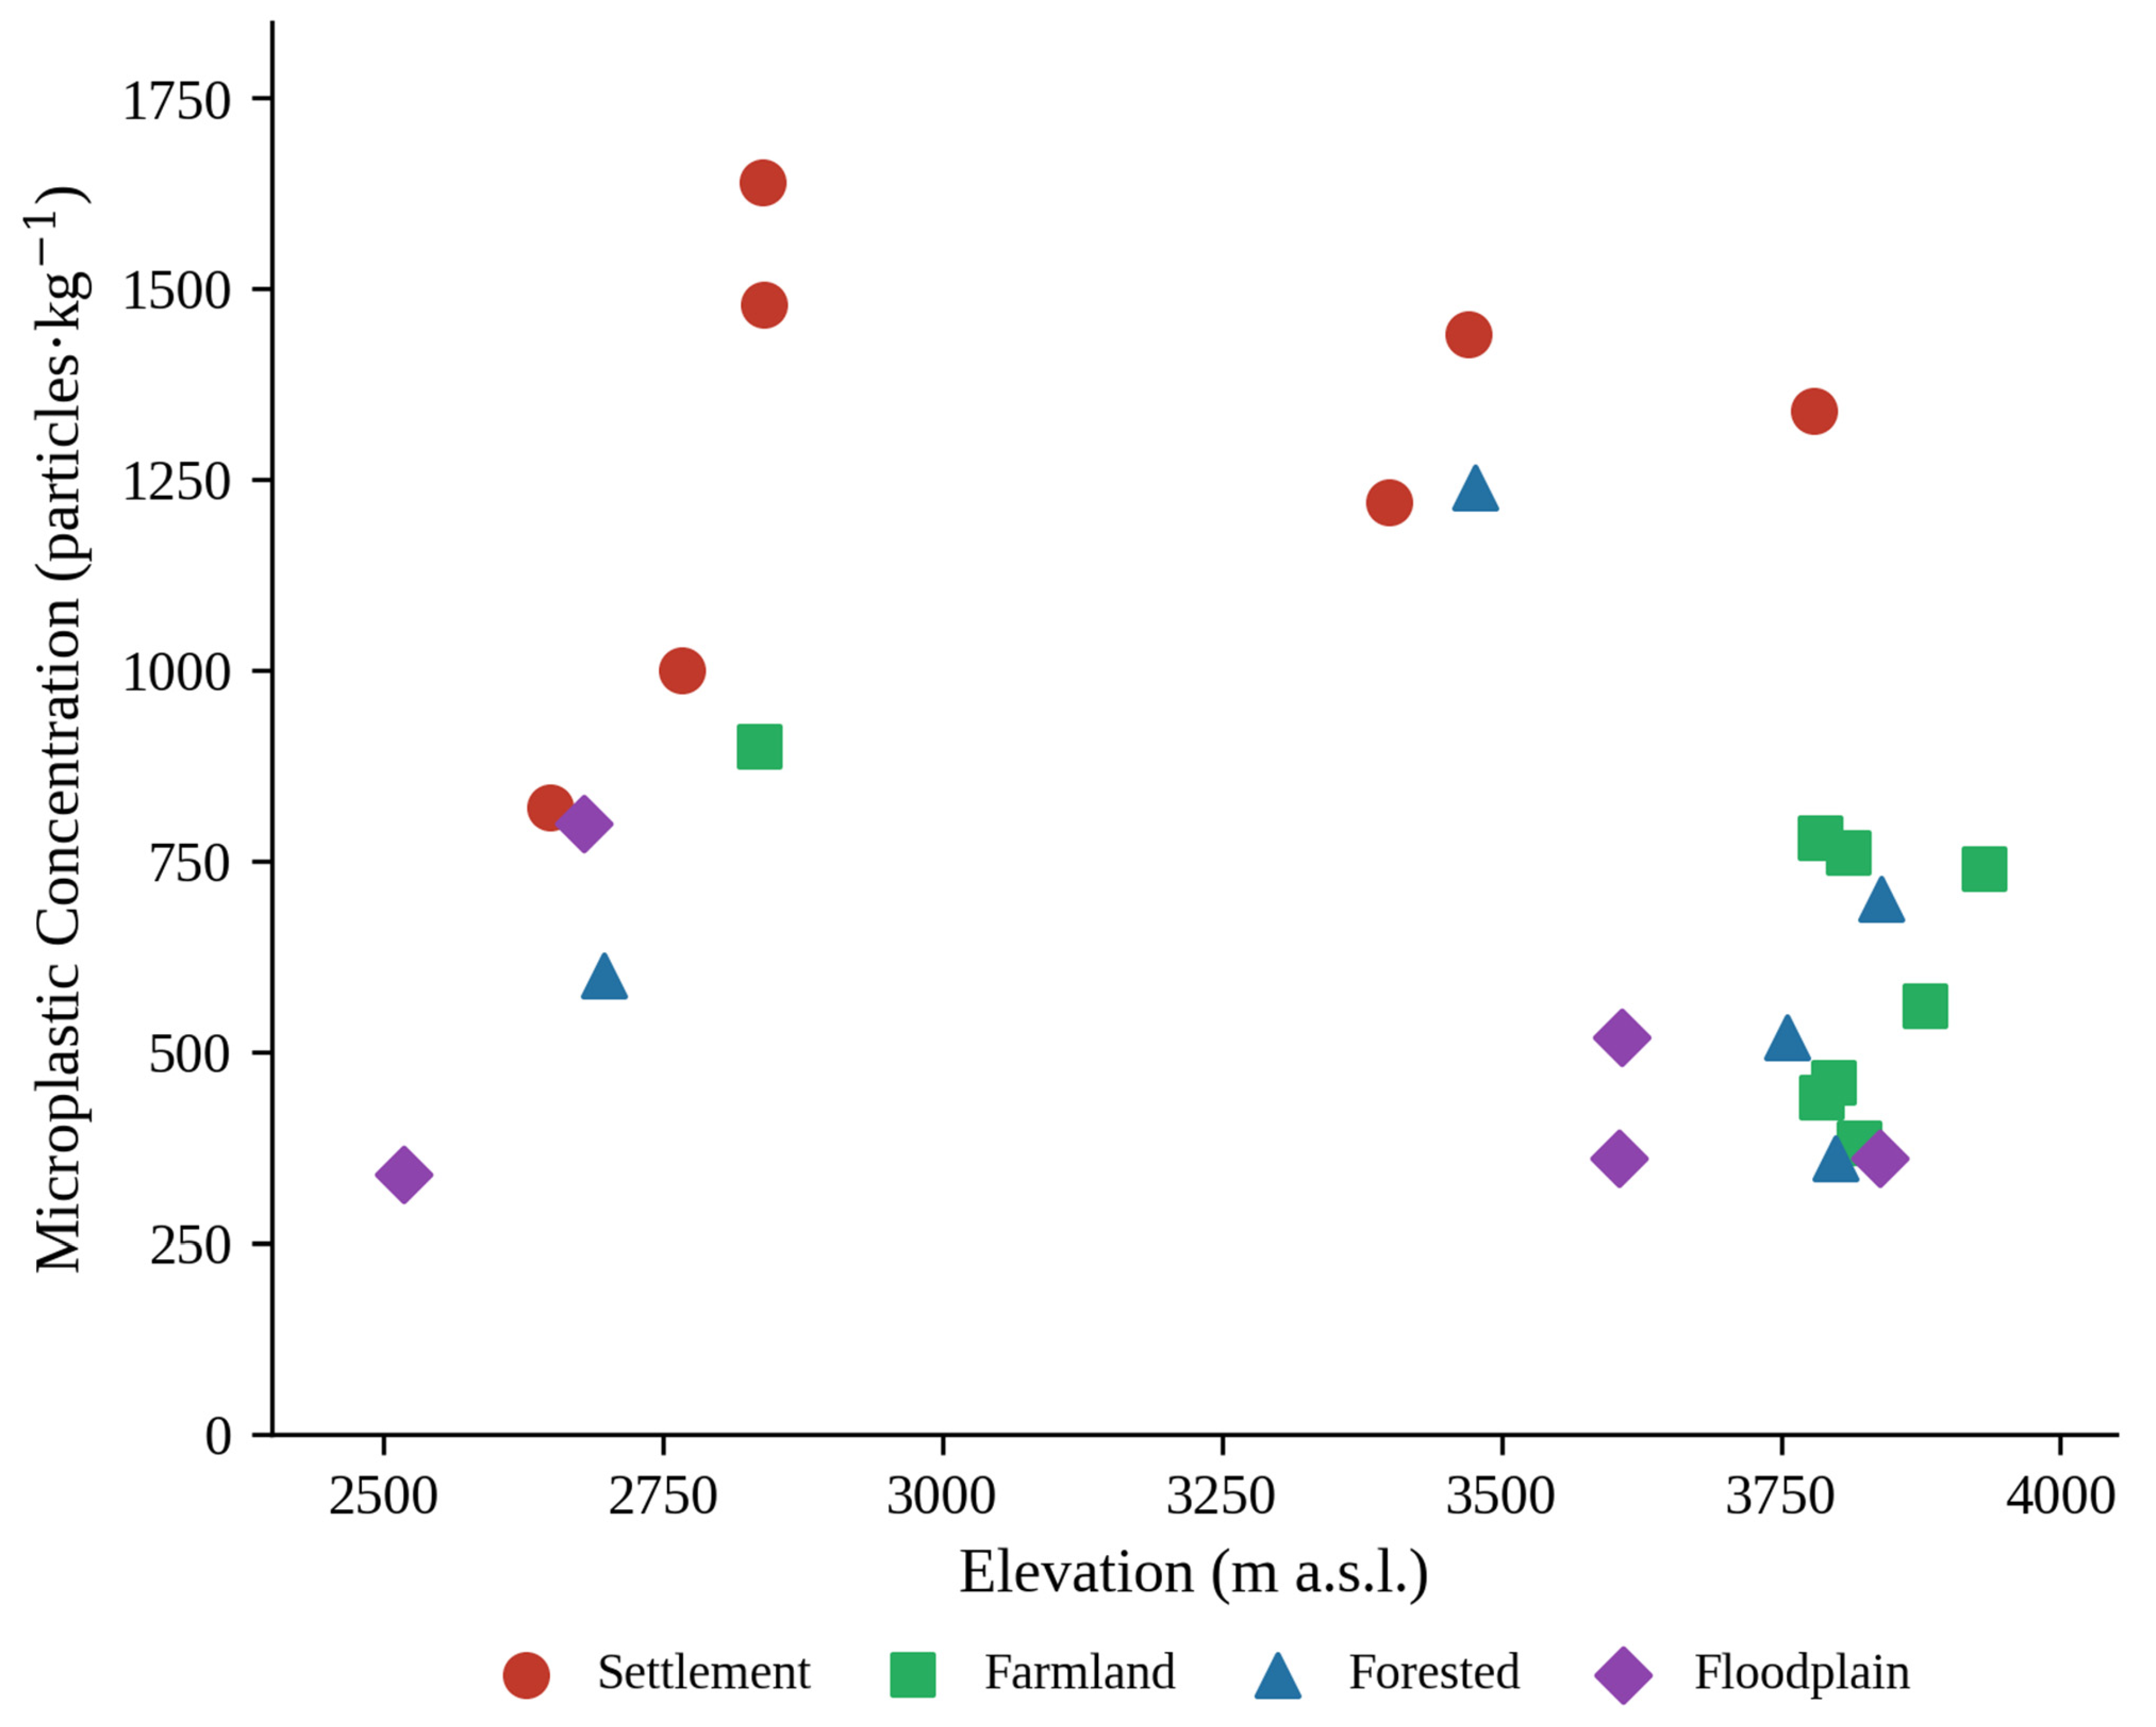
Microplastic concentrations did not show a significant monotonic relationship with elevation across all sampling sites (Spearman ρ = −0.365, p = 0.072; Table S2.2). Settlement sites, distributed across a wide elevation range of 2650 to 3779 m, consistently recorded the highest concentrations regardless of altitude. Among non-settlement sites, i.e., farmland, forest, and floodplain, no significant relationship between elevation and microplastic concentration was observed (Spearman ρ = −0.112, p = 0.659; Table S2.2), indicating that elevation did not systematically predict contamination within the range sampled (2519–3932 m a.s.l.) due to the influence of human activities. A sensitivity analysis comparing linear, quadratic, and GAM models confirmed that the elevation–concentration relationship is best described by a nonlinear unimodal pattern (Figure 8). However, this result should be interpreted with caution, given the small sample size and the confounding of elevation with land use (Table S2.7).
Figure 8.
Microplastic concentration (particles·kg−1 dry soil) versus elevation (m a.s.l.), color-coded by land-use type. Settlement sites (red) consistently recorded the highest concentrations regardless of elevation. n = 25 sites. See Table S2.2 for correlation statistics and Table S2.7 for model comparison.
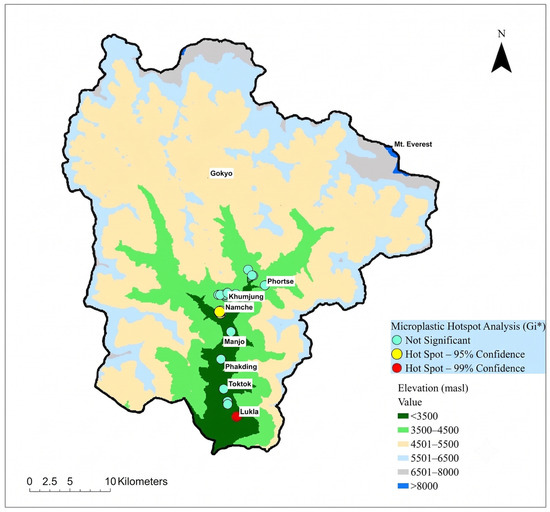
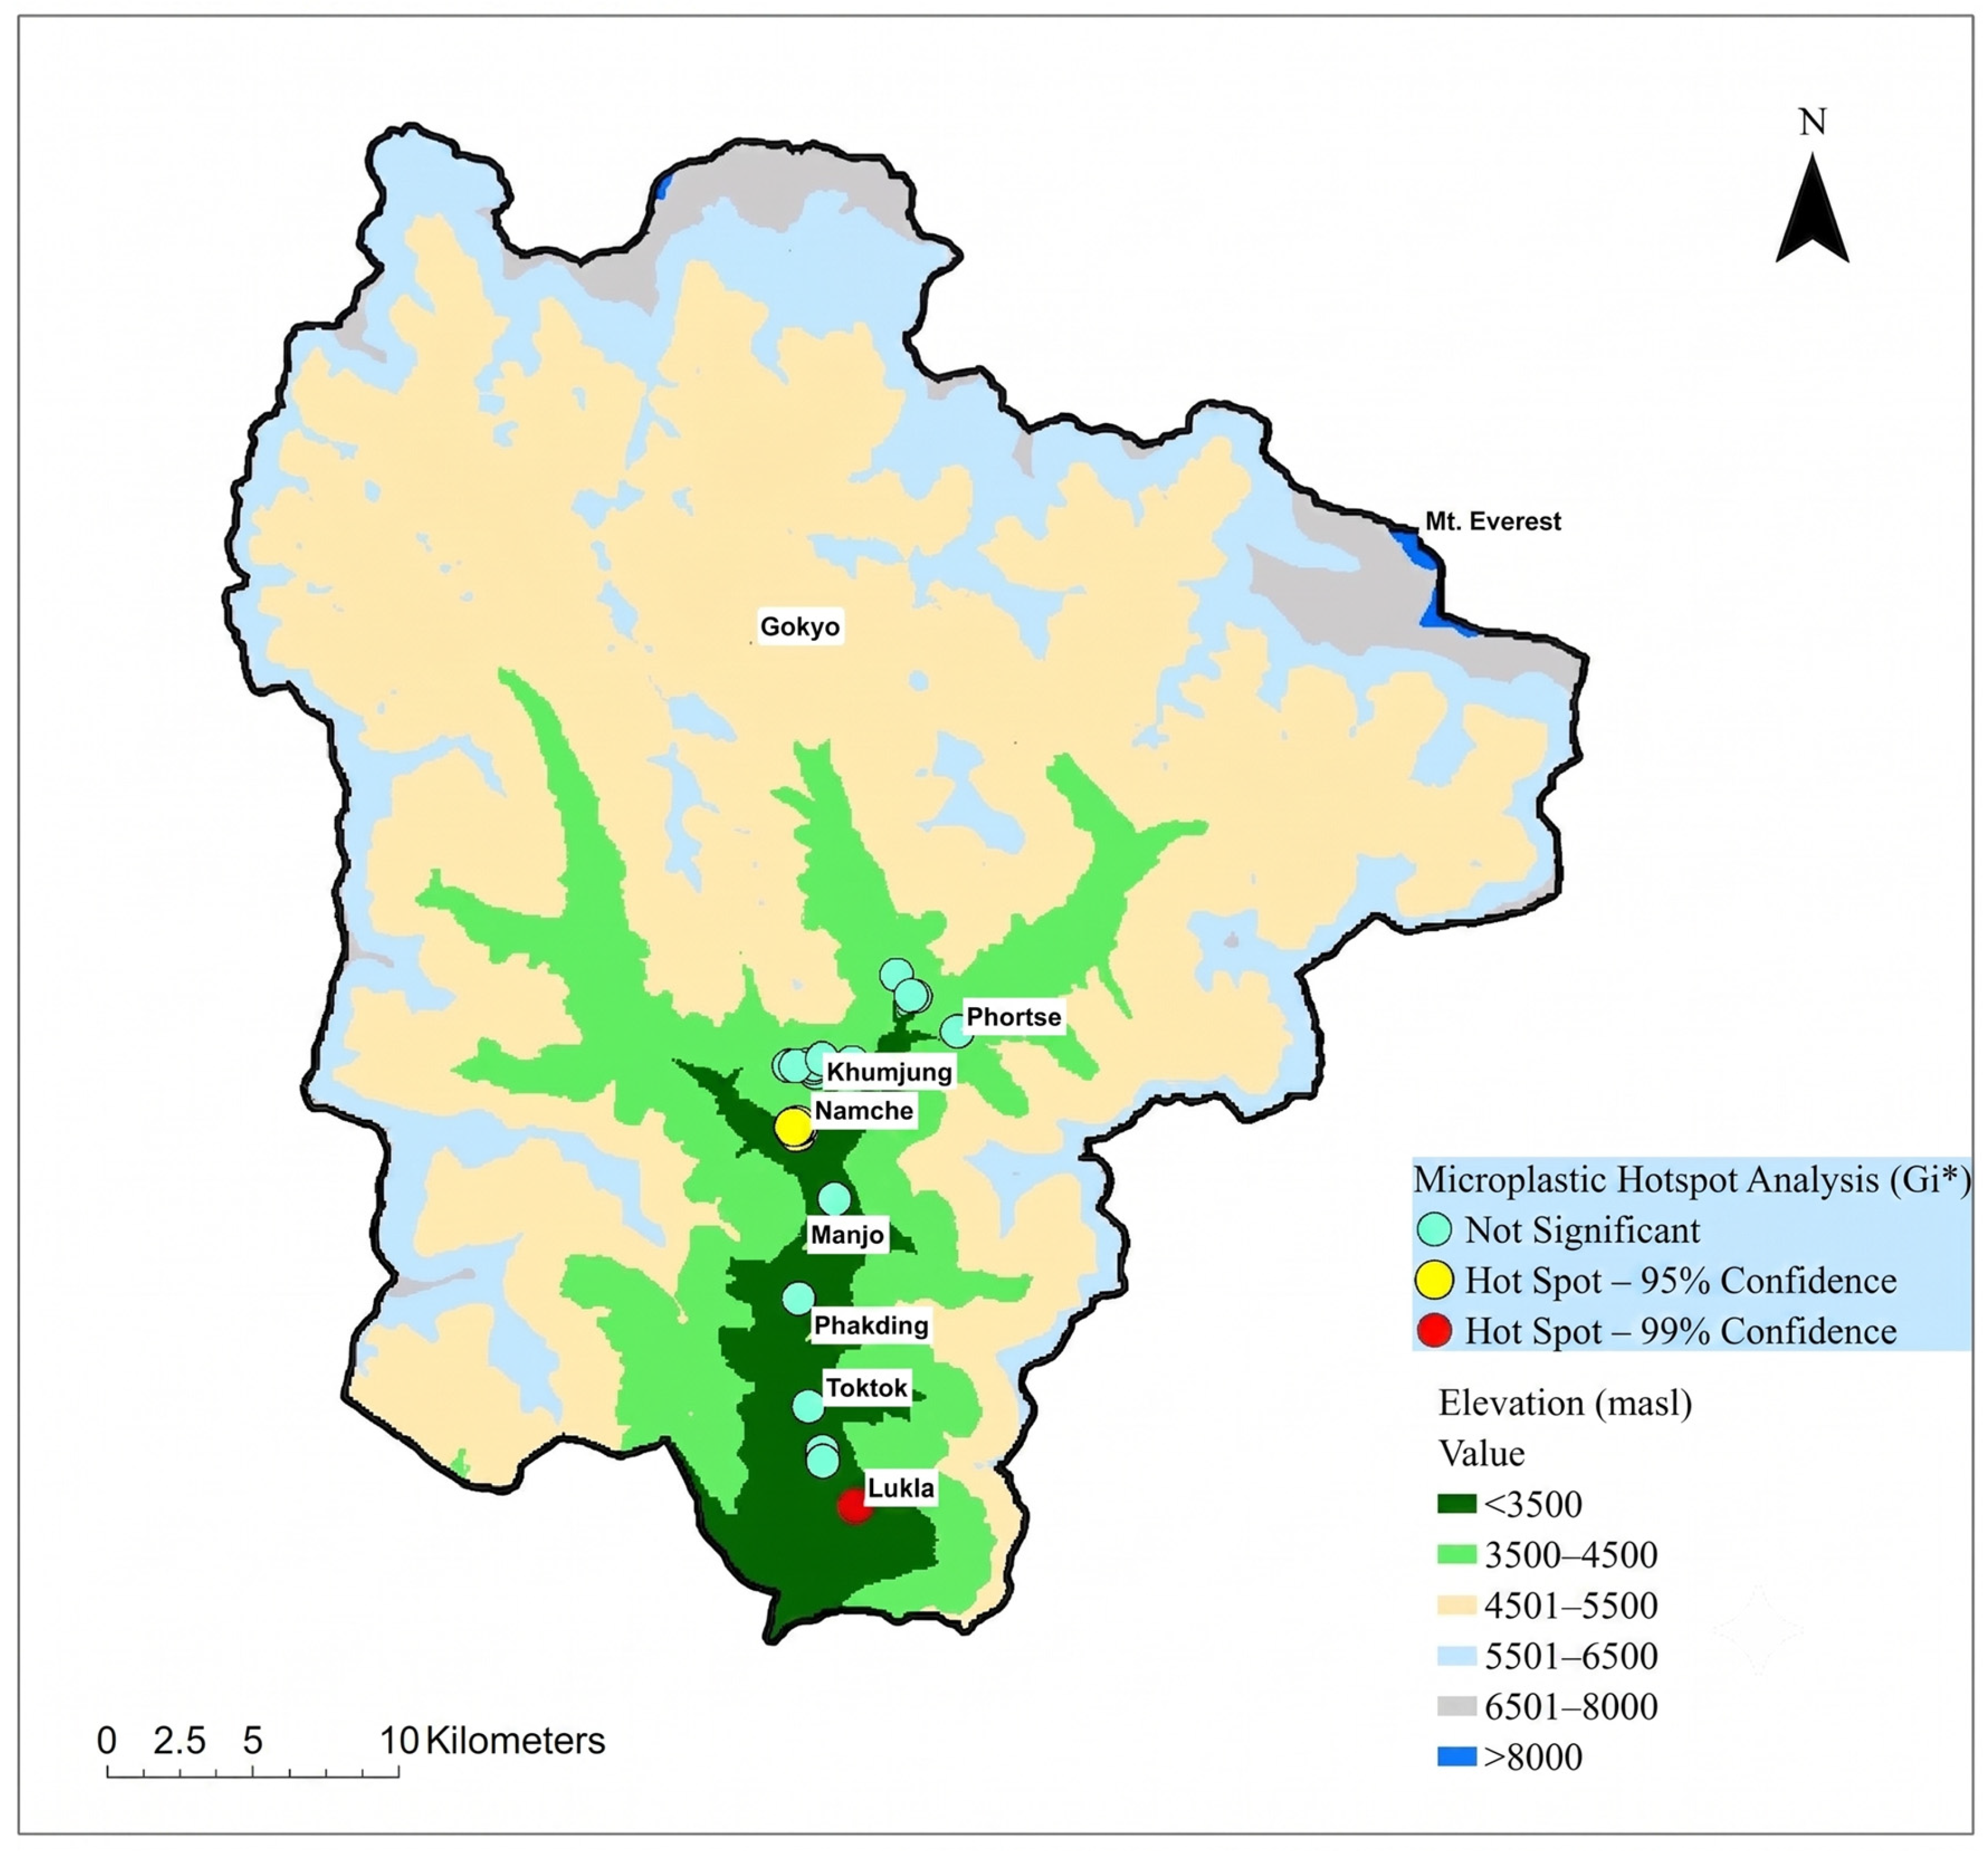
Spatial autocorrelation analysis confirmed that microplastic contamination was not randomly distributed across the study area (Global Moran’s I = 0.354, Z = 2.83, p = 0.005; Supplementary Materials Section S3.1). Local hotspot analysis using the Getis-Ord Gi* statistic identified two statistically significant clusters: Lukla (99% confidence) and Namche (95% confidence), both of which are major tourism hubs along the Everest trekking corridor (Figure 9, Table S3.1).
Figure 9.
Microplastic hotspot analysis (Getis-Ord Gi*) across the study area in SNP. Significant hotspots were detected at Lukla (99% confidence) and Namche (95% confidence), both major tourism hubs along the Everest trekking route. Other sites showed no significant clustering. Background shading indicates elevation gradients. See Table S3.1 for complete Gi* results for all 25 sites.
3.6. Polymer Composition
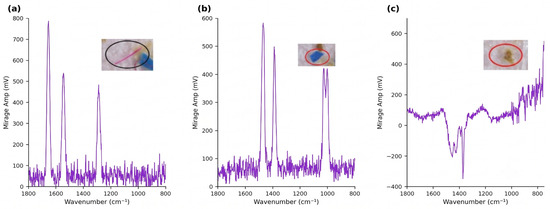
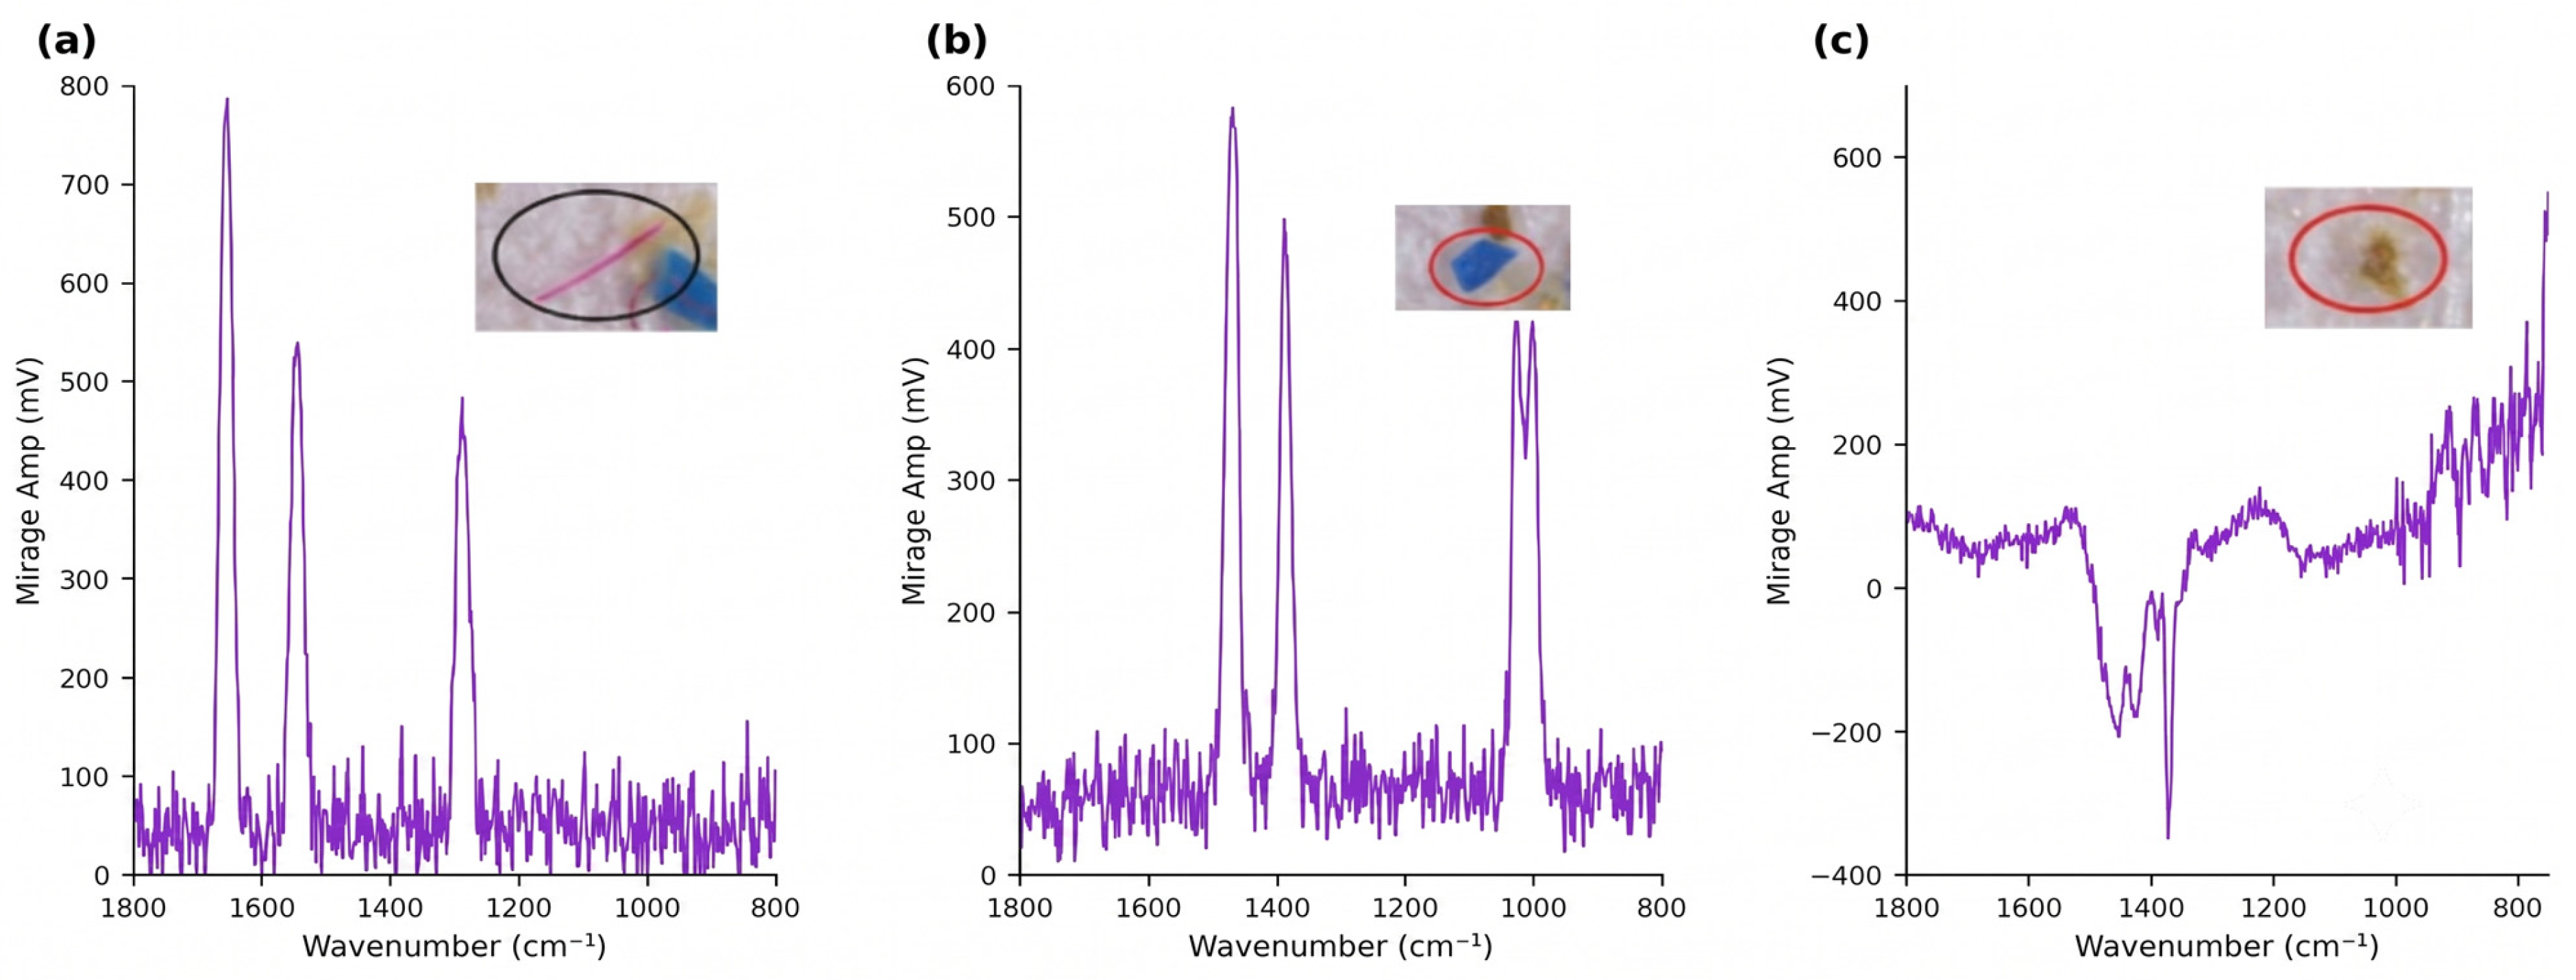
A subset of visually identified particles was analyzed using O-PTIR spectroscopy to confirm synthetic identity and characterize the polymer composition (Figure 10). Of the 160 particles analyzed, 124 showed spectral features consistent with synthetic polymers, while the remaining 36 were identified as non-plastic materials, including minerals and organic matter. Applying the ≥0.70 spectral match threshold described in Section 2.4 to the 124 plastic-identified particles yielded 53 high-confidence polymer identifications retained for polymer-type reporting.
Figure 10.
Representative O-PTIR spectra from soil particle analysis. (a) Pink fiber showing absorption peaks consistent with polyamide (PA/nylon) at ~1630, ~1540, and ~1270 cm−1. (b) Blue fragment showing peaks consistent with polypropylene (PP) at ~1460 and ~1000 cm−1. (c) Brown irregular particle with spectral features inconsistent with synthetic polymer reference spectra, classified as non-plastic. Spectra are displayed as raw Mirage amplitude values (mV) and are not normalized. The inset images show the analyzed particles. See Table S4.1 for complete diagnostic band assignments.
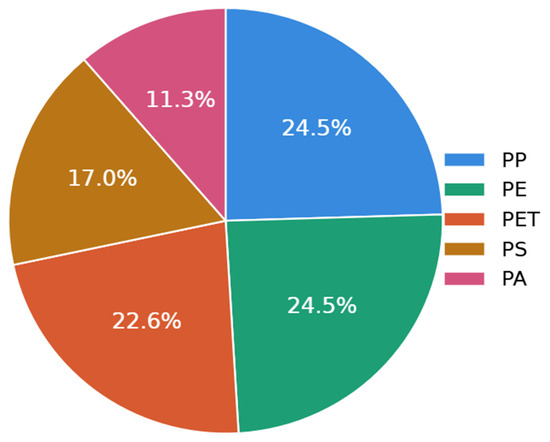
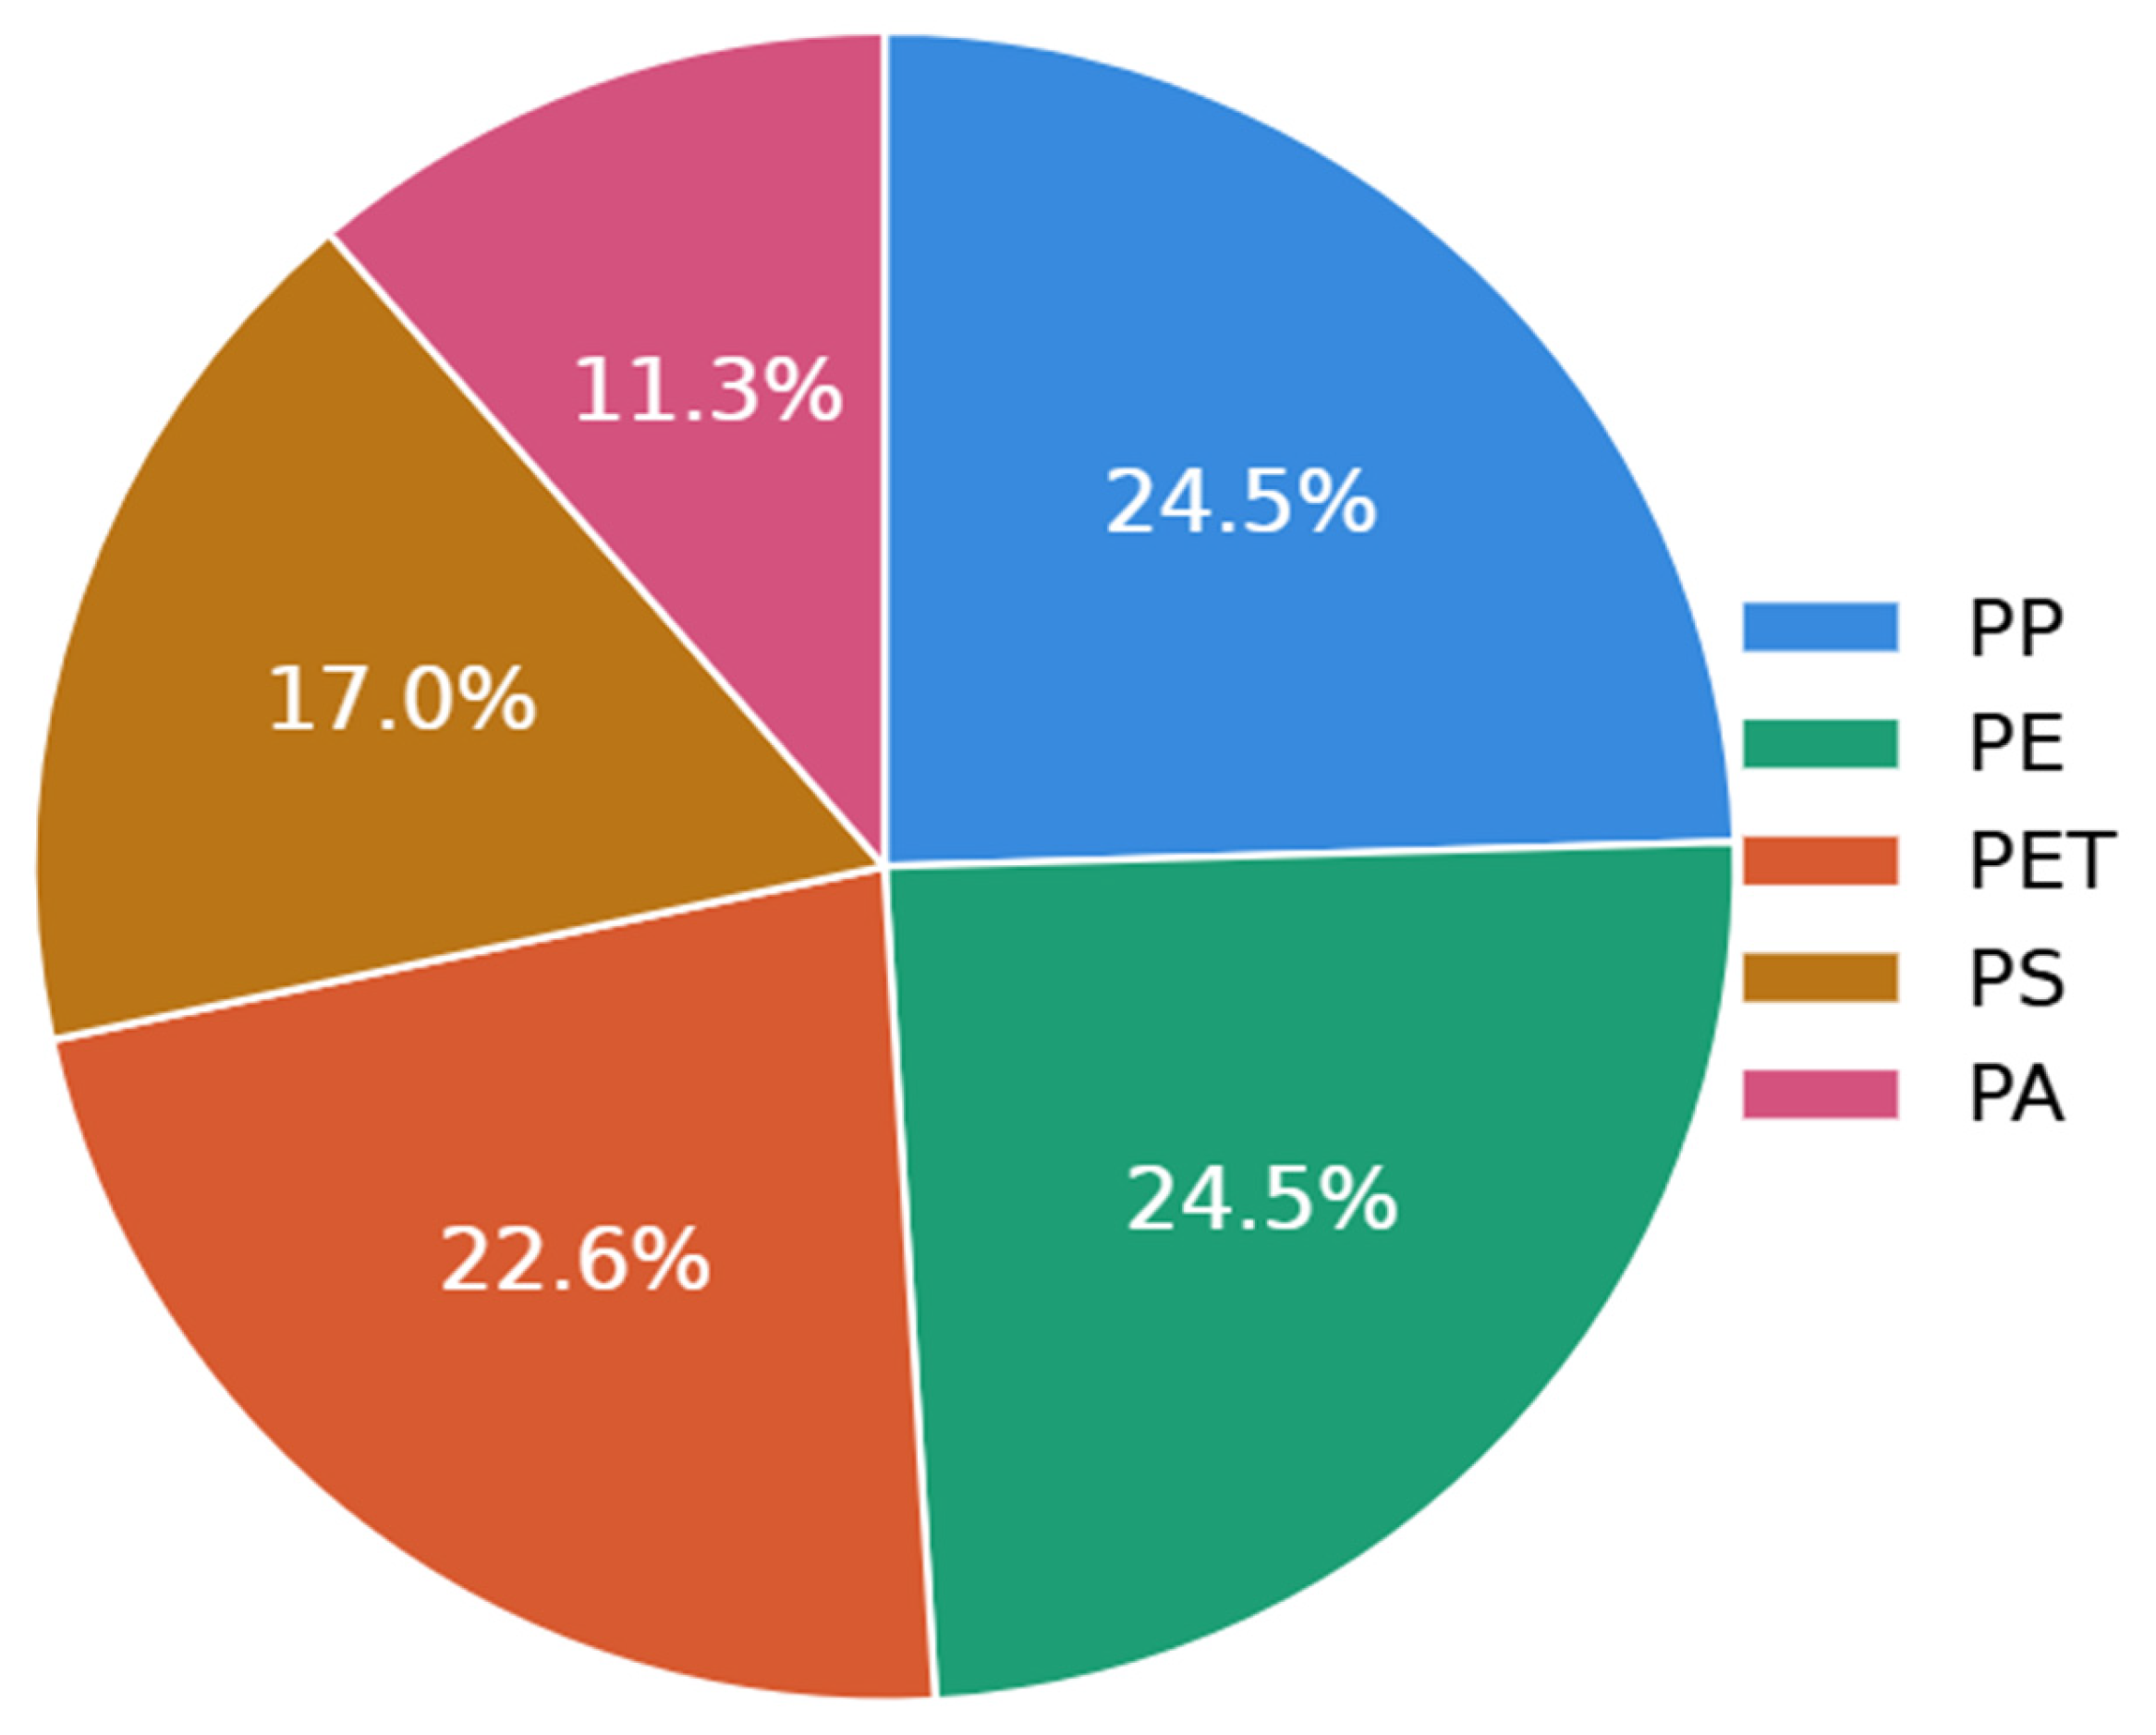
Five polymer types were confirmed among these high-confidence identifications based on diagnostic absorption features within the fingerprint region (Table 2): PP (24.5%), PE (24.5%), PET (22.6%), PS (17.0%), and PA (11.3%) (Figure 11).
Figure 11.
Polymer composition of microplastic identifications confirmed via O-PTIR spectroscopy (n = 53). PP, polypropylene; PE, polyethylene; PET, polyethylene terephthalate; PS, polystyrene; PA, polyamide.
PP and PE were the most frequently identified polymers, consistent with their prevalence in packaging and textile materials associated with tourism activity in SNP. The detection of PET, despite the lower-density solution (1.26 g/cm3) used during initial processing at AEC, is likely attributable to partial carryover of PET particles into the supernatant due to a high particulate load, and subsequent recovery during the second density separation at BSU using ZnCl2. Full counts, match value ranges, and representative spectral overlays for each polymer type are provided in Table S4.2 and Figures S4.1–S4.5.
4. Discussion
4.1. SNP Concentrations in a Global Context
The detection of microplastics in all 50 samples confirms that plastic contamination has reached the high-altitude soils of SNP despite its remoteness and protected status. The concentrations observed are substantially lower than those reported for urban and peri-urban soils, for example, in eastern China [39]. Among high-altitude environments, SNP concentrations exceed those from remote sites on the Tibetan Plateau, where anthropogenic presence is minimal [40] but fall within the range reported for tourism-influenced areas of the Northeastern Plateau [41]. This pattern is consistent with a meaningful contribution from localized human activity, including tourism-related inputs, beyond what atmospheric deposition alone would be expected to produce. Further studies with more substantial source apportionment will help reveal the relative contributions and pathways of microplastics in the region.
Within SNP, prior work has documented microplastics in snow [18] and in all sampled streams across the park, with higher concentrations near settlements [14]. The present study extends these findings to the soil compartment, suggesting that microplastic contamination in SNP is not confined to a single environmental medium but may be broadly distributed across terrestrial and aquatic systems. The ubiquitous detection across all samples, including subsurface soils and sites distant from settlements, indicates both ongoing inputs and residual accumulation from previously deposited material, and suggests that soils may function as an important long-term sink for microplastics in this landscape.
The documentation of microplastics across multiple environmental compartments in SNP points to landscape-scale contamination in which locally generated and atmospherically transported particles converge and accumulate across media. This multi-compartment distribution is not unique to SNP. Scheurer and Bigalke [42] detected microplastics in 90% of Swiss floodplain soils within nature reserves, including remote high-altitude sites with no permanent inhabitants, attributing the pattern to diffuse aeolian transport—demonstrating that legal protection does not preclude soil contamination where atmospheric pathways are active. The long-range transport capacity of atmospheric pathways is well established; global simulations by Evangeliou et al. [43] demonstrate that road-derived microplastics are transported with high efficiency to remote regions, while Brahney et al. [44] documented deposition rates averaging 132 particles per square meter per day across remote protected lands in the western United States. Although atmospheric deposition was not directly quantified in this study, the detection of microplastics at forest and floodplain sites with no direct plastic inputs is consistent with a diffuse atmospheric contribution superimposed on the more spatially concentrated tourism-derived signal. The extent to which atmospheric deposition contributes to this background signal remains an open question that is beyond the scope of the present study.
These findings suggest that UNESCO World Heritage designation and national park protections do not insulate high-altitude soils from microplastic contamination where tourism-derived waste is inadequately managed. Similar patterns have been reported in other formally protected mountain environments [12,41], suggesting that visitor infrastructure and waste management deficits may be more important determinants of contamination than legal protection status alone.
4.2. Morphological Patterns
Fragments were the dominant morphology across all samples, consistent with in situ degradation of larger plastic debris at dump sites and along trekking corridors [29]. The prevalence of fibers across all land-use types, including forests and floodplains distant from settlements, suggests that atmospheric deposition of synthetic textile fibers may represent an important secondary pathway, as documented in other remote mountain environments [12,18]. At the same time, morphology-specific detectability should be considered when interpreting these patterns, because thin, transparent, or otherwise visually subtle particles may be more difficult to identify and therefore could be underrepresented, particularly in the case of films [21,45,46].
The proportional abundance of fibers was higher in subsurface soils (40.0%) than in surface soils (18.2%), whereas fragments showed the opposite pattern. This distribution likely reflects greater accumulation of fragments at the surface through in situ degradation of larger plastic debris. In contrast, the higher proportion of fibers at depth may reflect their physical properties that facilitate downward transport through soil pore networks. Zhang and Liu [47] found that fiber abundance was significantly greater in micro-aggregates than macro-aggregates in agricultural soils in southwestern China, with 72% of plastic particles associated with soil aggregates, suggesting that the elongated morphology of fibers may facilitate their incorporation into finer soil structural units and their preferential retention at depth. Freeze–thaw cycling is likely an additional driver of vertical redistribution in SNP, as Hsieh et al. [48] demonstrated that freeze–thaw processes significantly increase vertical migration of microplastics in natural soils by forming preferential flow pathways and co-mobilizing with soil colloids. However, morphology-specific differences in transport rates remain to be quantified.
4.3. Polymer Composition
The five polymer types confirmed via O-PTIR are consistent with plastics commonly associated with tourism and settlement activity in high-altitude environments. PP and PE, which together accounted for nearly half of the identified particles, are widely reported as the dominant polymer types in high-altitude Himalayan and Tibetan Plateau environments [41,49], consistent with their extensive use in single-use packaging and consumer goods associated with tourism waste in SNP. The detection of PET is similarly linked to beverage bottles and food packaging, consistent with the dominance of these items among waste recovered at SNP dump sites [29]. Moreover, the presence of PA is particularly consistent with the trekking-dominated character of the study area, as synthetic fibers, including nylon from the same Everest corridor, have been attributed to high-performance outdoor clothing, tents, and climbing ropes used by trekkers and mountaineers [18]. Their occurrence in our soils, together with the fiber-rich subsurface morphology reported in Section 3.4, supports textile shedding as an important contamination pathway.
However, the relative proportions of polymer types in our soils differ from studies sampling other matrices in the same region, where PET and acrylic accounted for the majority of particles in snow and stream water [18] and PA and PET were the most abundant polymers in glacially influenced streams and sediments [50]. The methodological differences in extraction density may also contribute to the lower PET proportions observed in this study. The higher proportions of PP and PE in our soils likely reflect the broader mix of waste-derived polymer fragments from packaging and daily-use plastics that accumulate in lower-elevation trekking settlements, alongside textile inputs. However, the variation in polymer profiles across studies reflects meaningful environmental gradients in source proximity, elevation, and matrix dynamics and highlights the need for multi-compartment monitoring strategies that integrate soil, water, and atmospheric sampling to fully characterize microplastic pollution in high-altitude protected areas.
4.4. Land Use as a Driver of Contamination
Microplastics were detected in all subsurface soil samples (5–10 cm), confirming that vertical transport occurs across all land-use types. In high-altitude environments such as SNP, freeze–thaw cycling represents an important mechanism, as repeated freeze–thaw processes alter soil pore structure and create preferential flow pathways that promote downward particle migration [48]. Subsurface detection across all sites suggests residual accumulation reflecting longer-term inputs rather than only recent deposition or settlement-induced vertical redistribution. The negative binomial regression revealed that the magnitude of depth-related differences varied significantly by land-use type, however, indicating that vertical distribution is not uniform across the landscape.
The strong association between settlement land use and elevated microplastic concentrations is consistent with the high density of tourism-related infrastructure in villages like Lukla, Namche, and Khumjung, where lodges, restaurants, and gear shops generate substantial plastic waste [29]. Fiber shedding from synthetic clothing and trekking gear along heavily trafficked corridors likely provides an additional diffuse input to settlement soils. The significant surface enrichment observed in settlements further supports the interpretation that direct local deposition is important. However, the present data do not isolate tourism-derived sources from other forms of human activity.
Farmland soils contained lower concentrations than settlements. Unlike intensively managed agricultural systems, where microplastics primarily derive from sewage sludge and plastic mulch films [51,52,53], farming in SNP and the broader Nepal Himalayas relies on traditional methods with minimal synthetic inputs [54]. Microplastic inputs to farmland here are more likely attributable to atmospheric deposition from nearby settlements and irrigation water. The lack of a significant depth effect in farmland soils reflects limited tillage redistributing particles across the sampled depth profile.
Forest soils showed concentrations comparable to those in farmland despite having no direct plastic inputs, suggesting contamination via atmospheric deposition, surface runoff, and proximity to settlements. Forests in SNP are multi-use landscapes where residents collect firewood, fodder, and graze livestock, creating additional pathways for microplastic deposition from clothing and equipment. The particularly high concentrations at one forested site near Namche likely reflect its proximity to the SNP headquarters, which attracts both tourists and local residents.
Floodplain soils recorded the lowest concentrations, consistent with their greater distance from settlements and tourism infrastructure. Floodplains function as dynamic components of river systems where microplastics can be both deposited during flood events and remobilized during subsequent high flows [55], and seasonal flushing during monsoon flows may dilute or relocate deposited microplastics in SNP.
The land-use patterns observed here suggest a contamination gradient driven primarily by proximity to tourism infrastructure rather than by land management intensity. While settlement soils clearly receive the highest direct inputs, the detection of microplastics across all land-use types, including forest and floodplain soils distant from settlements, indicates that secondary redistribution through atmospheric deposition, surface runoff, and hydrological transport is an important equalizing mechanism across the landscape. de Souza Machado et al. [56] demonstrated that microplastics can alter soil biophysical properties, including porosity, aggregate stability, and water retention, even at relatively low concentrations, suggesting that the contamination levels documented in SNP, while lower than urban or agricultural contexts, may nonetheless have functional consequences for the alpine soil systems that support this ecologically sensitive landscape.
4.5. Elevation, Spatial Clustering, and Anthropogenic Drivers
The absence of a significant monotonic elevation gradient, combined with the concentration of hotspots around major tourism hubs regardless of altitude, suggests that local human activity may be more strongly associated with microplastic contamination than elevation alone within the sampled range in SNP. The spatial clustering of hotspots around Lukla and Namche supports this interpretation, as both serve as major logistical hubs along the Everest trekking corridor. Similar findings have been reported on the Tibetan Plateau, where microplastic abundance was higher near cities and settlements than in remote areas and showed no correlation with elevation [40]. Within SNP, Han et al. [14] observed comparable patterns in stream water, with higher microplastic concentrations near villages than near glacial sources, indicating that both soil and aquatic compartments respond to the spatial intensity of human presence.
The concentration of hotspots at Lukla and Namche also has direct implications for waste management. Byers et al. [29] identified more than 75 dump sites across SNP, with plastics and packaging materials among the most common waste types, providing a plausible direct source mechanism for the elevated concentrations and significant spatial clustering observed at these hubs. The fragmentation of deposited plastic waste at dump sites and along trekking corridors represents a sustained source of microplastic fragments, while fiber shedding from synthetic clothing and footwear used by trekkers constitutes an additional diffuse input. Forster et al. [57] demonstrated that hiking and trail running are a direct source of microplastics in protected wilderness environments through the abrasion and fragmentation of footwear and clothing, with shedding rates increasing on rough and sloped surfaces typical of mountain terrain. These combined inputs are likely to persist as long as waste management infrastructure remains inadequate relative to tourist volumes in SNP.
The results of the present study suggest that in tourism-impacted mountain settings, land-use stratification is a more informative design criterion than elevation gradient alone for detecting contamination patterns, consistent with findings from other high-altitude environments where human activity was a stronger predictor of microplastic abundance than altitude [40,49].
4.6. Deep Learning for Microplastic Detection
The YOLOv11n-seg model achieved an F1-score of 0.89 on the test set, suggesting that instance segmentation can support consistent and repeatable particle detection in soil microplastic studies. The strong inter-annotator agreement during dataset development (Cohen’s Kappa = 0.882) indicates that morphological classification criteria were applied consistently, which is a prerequisite for generating reliable training data and a meaningful performance benchmark. Manual visual identification remains the standard approach in most soil microplastic research, but is time-intensive and subject to inter-analyst variability [6]. The YOLO model applied here thus has major advantages over the manual approach, dramatically reducing counting time and avoids subjectivity.
The dominant error type in the model was false negatives, meaning that reported concentrations in this study are likely conservative. This is a preferable error direction for baseline monitoring purposes. However, it also means that thin films and visually subtle particles may be systematically underdetected—a limitation shared with manual visual sorting [21,45]. Deep learning models inherit the biases of their training data [58], and the present dataset, while carefully annotated, reflects a single sampling campaign and a single imaging setup. Performance on particles from different environments, soil types, or imaging configurations would require validation before the model could be applied more broadly.
Computer vision approaches have been applied to microplastic detection in marine and laboratory settings [35,59], but applications to heterogeneous soil matrices from remote field environments remain limited. The results here suggest the approach is feasible in such contexts. However, performance on particles from different environments, soil types, or imaging configurations would require validation before the model could be applied more broadly, as has been noted for CNN-based segmentation in other complex environmental matrices [22]. The combination of automated detection with targeted O-PTIR confirmation used in this study represents one practical way to balance throughput with chemical certainty.
5. Limitations and Future Directions
Due to the remote nature and the monsoon weather of the region, long term and frequent sample collection was very difficult. In this study, sampling was conducted only along the Lukla–Phortse trekking corridor in May 2023, prior to the monsoon season, capturing dry-season conditions. Logistical constraints prevented sampling at probable hotspots such as Everest Base Camp, and a single campaign cannot establish temporal trends. The relatively narrow elevation range sampled in this study (2500–4000 m), where atmospheric conditions are broadly similar across sites, may explain the reason that elevation alone was a poor predictor of contamination.
On the methodological side, the density separation solution used in Nepal (1.26 g/cm3) underrepresents denser polymers such as PET and PVC (see Supplementary Material Section S4.3), and O-PTIR confirmation was applied to a selected rather than a random subset of particles, leaving some uncertainty in polymer identification. The model’s dominant error type was false negatives, so reported concentrations are likely conservative. Overall, the reported numbers of microplastics in this study are more conservative, especially for high-density particles, thus underrepresenting microplastic pollution in the region. Nonetheless, the major draws that reflect the relative abundance of microplastics across land use types and their vertical distribution remain valid.
In addition, polypropylene centrifuge tubes were used during the density separation steps. While this is a common practice in microplastic studies and procedural blanks were included to monitor contamination during sample processing, these controls were primarily designed to assess background contamination rather than the specific effects of particle-tube contact during centrifugation. Because soil, sediment, or mineral particles may interact with the tube walls while suspended in dense ZnCl2 solution, future studies could include a dedicated abrasion-control experiment to further evaluate this potential source. Therefore, although the procedural blanks provided an important quality-control measure, the polypropylene particles reported in this study should be interpreted as a cautious upper-bound estimate of the polypropylene detected in the samples analyzed in this study, with the possibility that a small proportion may have originated from the density separation process. Future work should prioritize longitudinal monitoring to assess whether contamination is responding to policy interventions such as Nepal’s single-use plastics ban. Atmospheric deposition pathways remain unquantified in the Himalayan region and warrant dedicated passive sampler studies. Deeper soil cores, particularly in floodplain and valley settings, would resolve vertical transport dynamics beyond the 0–10 cm window sampled here. Ecotoxicological studies targeting soil communities native to high-altitude environments are needed to translate contamination levels into ecological risk assessments.
6. Conclusions
This study provides a comprehensive assessment of microplastic contamination in SNP soils, documenting microplastics across all 50 samples. Concentrations ranged from 80 to 960 particles·kg−1, with an overall mean of 395 ± 235 particles·kg−1. Surface soils (0–5 cm) were more contaminated on average 457 ± 269 particles·kg−1 than subsurface soils (5–10 cm; 334 ± 181) particles·kg−1, and fragments dominated the morphological composition (65.7%), followed by fibers (27.4%) and films (6.9%). O-PTIR spectroscopic analysis confirmed the presence of five dominant polymer types: PP (24.5%), PE (24.5%), PET (22.6%), PS (17.0%), and PA (11.3%). These polymers are commonly associated with packaging and textile materials, reflecting the influence of tourism activity on microplastic composition in SNP.
Contamination varied markedly among sampling points, and these differences were primarily associated with land use rather than elevation. Settlement soils recorded the highest concentrations, with settlement subsurface soils showing a 125% increase relative to floodplain reference soils (IRR = 2.25, p = 0.006), followed by farmland (IRR = 1.76, p = 0.042). In contrast, forest soils did not differ significantly from floodplains. Depth-related patterns were also land use dependent: surface enrichment was significant in settlement (IRR = 1.78) and forest (IRR = 1.63) soils but absent in farmland soils, where minimal tillage and limited synthetic inputs resulted in a more uniform vertical distribution. Spatial analysis confirmed that contamination was non-random (Global Moran’s I = 0.354, p = 0.005), with statistically significant hotspots at Lukla and Namche, the two primary tourism hubs along the Everest trekking corridor. Elevation showed no significant monotonic relationship with contamination (Spearman ρ = −0.365, p = 0.072), and settlement sites consistently recorded the highest concentrations across a wide altitudinal range (2650–3779 m), reinforcing that localized human activity, rather than altitude, governs the spatial pattern of contamination.
The detection of microplastics at all sites, including subsurface soils and locations distant from settlements, suggests that contamination extends beyond immediate point sources and that high-altitude soils may function as long-term sinks for plastic pollution. These results demonstrate that protected area designation and geographic remoteness do not insulate high-altitude soils from microplastic contamination where tourism-derived waste is inadequately managed. The integration of deep learning-based detection with targeted O-PTIR confirmation provides a reproducible and scalable workflow for processing large numbers of environmental particles, offering a practical template for future monitoring in logistically challenging settings. The baseline established here provides a foundation for long-term monitoring in SNP and similar high-altitude environments. It highlights the need for waste management strategies that address both diffuse microplastic sources and visible macroplastic debris.
Supplementary Materials
The following supporting information can be downloaded at: https://www.mdpi.com/article/10.3390/microplastics5030145/s1.
Author Contributions
S.B.: conceptualization, field work and sample collection, methodology and analysis, and original draft; T.M.: lead field work and preliminary lab analysis at the Aquatic Ecology Center; M.Y.: manuscript review and editing, field and lab work support, O-PTIR lab analysis; U.D.: deep learning analysis; A.L.: statistical analysis, manuscript review and editing; I.S.: preliminary lab analysis at the Aquatic Ecology Center, Kathmandu University; K.N.: logistic and funding support, field work, manuscript review; S.S.: local logistic support, manuscript review; B.H.: conceptualization, methodology and analysis, manuscript review and editing, and resources and funding support. All authors have read and agreed to the published version of the manuscript.
Funding
This research was partially funded by The Nature Conservancy Grant Number 0221-26G002. The APC was waived by MDPI.
Data Availability Statement
The data supporting the findings of this study, including model weights, training code, annotated image examples, and the detection pipeline, are openly available on GitHub at https://github.com/simonspurs/Microplastic- (accessed on 9 July 2026). Additional supporting data are provided in the Supplementary Materials.
Acknowledgments
Chase Cobb, Sasha Sunwar, Prashna Kunwar, Sarana Tuladhar for help with field work and preliminary lab analysis at AEC, KU. Suman Prakash Pradhan and Eric Lange for lab support. Jack Nomaldin and Samuel Tenney for help with O-PTIR analysis.
Conflicts of Interest
The authors declare no conflict of interest.
References
- Houssini, K.; Li, J.; Tan, Q. Complexities of the global plastics supply chain revealed in a trade-linked material flow analysis. Commun. Earth Environ. 2025, 6, 257. [Google Scholar] [CrossRef] [Scilit]
- Yacoub, M.; Han, B. Enhancing wastewater pretreatment for microplastic detection: Optimization of Fenton’s reagent for organic matter removal. Microplast. Nanoplast. 2026, 6, 15. [Google Scholar] [CrossRef] [Scilit]
- Adjornor, B.Y.; Han, B.S.; Zahran, E.M.; Pichtel, J.; Wood, R. Transport and Deposition of Microplastics at the Water-Sediment Interface: A Case Study of the White River near Muncie, Indiana. Hydrology 2024, 11, 141. [Google Scholar] [CrossRef] [Scilit]
- Barnes, D.K.; Galgani, F.; Thompson, R.C.; Barlaz, M. Accumulation and fragmentation of plastic debris in global environments. Philos. Trans. R. Soc. B-Biol. Sci. 2009, 364, 1985–1998. [Google Scholar] [CrossRef] [Scilit] [PubMed]
- Hartmann, N.B.; Huffer, T.; Thompson, R.C.; Hassellov, M.; Verschoor, A.; Daugaard, A.E.; Rist, S.; Karlsson, T.; Brennholt, N.; Cole, M.; et al. Are We Speaking the Same Language? Recommendations for a Definition and Categorization Framework for Plastic Debris. Environ. Sci. Technol. 2019, 53, 1039–1047. [Google Scholar] [CrossRef] [Scilit] [PubMed]
- Hidalgo-Ruz, V.; Gutow, L.; Thompson, R.C.; Thiel, M. Microplastics in the marine environment: A review of the methods used for identification and quantification. Environ. Sci. Technol. 2012, 46, 3060–3075. [Google Scholar] [CrossRef] [Scilit] [PubMed]
- Rillig, M.C.; Ingraffia, R.; de Souza Machado, A.A. Microplastic Incorporation into Soil in Agroecosystems. Front. Plant Sci. 2017, 8, 1805. [Google Scholar] [CrossRef] [Scilit] [PubMed]
- Lozano, Y.M.; Lehnert, T.; Linck, L.T.; Lehmann, A.; Rillig, M.C. Microplastic Shape, Polymer Type, and Concentration Affect Soil Properties and Plant Biomass. Front. Plant Sci. 2021, 12, 616645. [Google Scholar] [CrossRef] [Scilit] [PubMed]
- Ammendolia, J.; Castle, D.; Richardson, K.; Walker, T.R. Atmospheric microplastics must be addressed in the global plastics treaty. Camb. Prism. Plast. 2025, 3, e12. [Google Scholar] [CrossRef] [Scilit]
- Sunny, A.R.; Sazzad, S.A.; Islam, M.A.; Mithun, M.H.; Hussain, M.; Raposo, A.; Bhuiyan, M.K.A. Microplastics in Aquatic Ecosystems: A Global Review of Distribution, Ecotoxicological Impacts, and Human Health Risks. Water 2025, 17, 1741. [Google Scholar] [CrossRef] [Scilit]
- Yacoub, M.; Han, B. Terrestrial Microplastic Pollution: Occurrence, Fate, and Ecological Effects on Soil Systems. Microplastics 2026, 5, 67. [Google Scholar] [CrossRef] [Scilit]
- Allen, S.; Allen, D.; Phoenix, V.R.; Le Roux, G.; Durántez Jiménez, P.; Simonneau, A.; Binet, S.; Galop, D. Atmospheric transport and deposition of microplastics in a remote mountain catchment. Nat. Geosci. 2019, 12, 339–344. [Google Scholar] [CrossRef] [Scilit]
- Akdemir, T.; Terzi, Y.; Gündoğdu, S.; Öztürk, R.Ç.; Gedik, K. Microplastic contamination in high-altitude glacier lakes in Northern Anatolia. Environ. Sci. Eur. 2025, 37, 92. [Google Scholar] [CrossRef] [Scilit]
- Han, B.; Yacoub, M.; Li, A.; Nicholson, K.; Gruver, J.; Neumann, K.; Sharma, S. Human Activities Increased Microplastics Contamination in the Himalaya Mountains. Hydrology 2024, 11, 4. [Google Scholar] [CrossRef] [Scilit]
- Haque, F.; Fan, C. Fate of microplastics under the influence of climate change. iScience 2023, 26, 107649. [Google Scholar] [CrossRef] [Scilit] [PubMed]
- Ruthi, J.; Cerri, M.; Brunner, I.; Stierli, B.; Sander, M.; Frey, B. Discovery of plastic-degrading microbial strains isolated from the alpine and Arctic terrestrial plastisphere. Front. Microbiol. 2023, 14, 1178474. [Google Scholar] [CrossRef] [Scilit] [PubMed]
- Sun, Y.; Watanabe, T. Tourism-Related Facility Development in Sagarmatha (Mount Everest) National Park and Buffer Zone, Nepal Himalaya. Land 2021, 10, 925. [Google Scholar] [CrossRef] [Scilit]
- Napper, I.E.; Davies, B.F.R.; Clifford, H.; Elvin, S.; Koldewey, H.J.; Mayewski, P.A.; Miner, K.R.; Potocki, M.; Elmore, A.C.; Gajurel, A.P.; et al. Reaching New Heights in Plastic Pollution-Preliminary Findings of Microplastics on Mount Everest. One Earth 2020, 3, 621–630. [Google Scholar] [CrossRef] [Scilit]
- Wang, C.; Zhao, J.; Xing, B. Environmental source, fate, and toxicity of microplastics. J. Hazard. Mater. 2021, 407, 124357. [Google Scholar] [CrossRef] [Scilit] [PubMed]
- Kang, Q.; Zhang, K.; Dekker, S.C.; Mao, J. Microplastics in soils: A comprehensive review. Sci. Total Environ. 2025, 960, 178298. [Google Scholar] [CrossRef] [Scilit] [PubMed]
- Shim, W.J.; Hong, S.H.; Eo, S.E. Identification methods in microplastic analysis: A review. Anal. Methods 2017, 9, 1384–1391. [Google Scholar] [CrossRef] [Scilit]
- Xu, J.; Wang, Z. Efficient and accurate microplastics identification and segmentation in urban waters using convolutional neural networks. Sci. Total Environ. 2024, 911, 168696. [Google Scholar] [CrossRef] [Scilit] [PubMed]
- Redmon, J.; Divvala, S.; Girshick, R.; Farhadi, A. You Only Look Once: Unified, Real-Time Object Detection. In Proceedings of the 2016 IEEE Conference on Computer Vision and Pattern Recognition (CVPR), Las Vegas, NV, USA, 27–30 June 2016; pp. 779–788. [Google Scholar]
- Jocher, G.; Chaurasia, A.; Qiu, J. Ultralytics YOLOv8, version 8.0.0; GitHub: San Francisco, CA, USA, 2023.
- Yacoub, M.; Normandin, J.; Baniya, S.; Tenney, S.; Han, B. Advancing microplastic characterization in environmental samples using optical photothermal infrared (O-PTIR) spectroscopy. Environ. Geochem. Health 2026, 48, 279. [Google Scholar] [CrossRef] [Scilit] [PubMed]
- Subedi, I.; Baniya, S.; Pradhan, S.P.; Subedi, S.; Nicholson, K.N.; Han, B.; Sharma, S. Hydro-geochemistry and drinking water quality of the Sagarmatha National Park, Nepal. Sustain. Water Resour. Manag. 2024, 10, 164. [Google Scholar] [CrossRef] [Scilit]
- Central Bureau of Statistics. National Population and Housing Census 2021: Khumbu Pasanglhamu Gaunpalika. Available online: https://nsonepal.gov.np/ (accessed on 12 February 2026).
- Nicholson, K.; Hayes, E.; Neumann, K.; Dowling, C.; Sharma, S. Drinking Water Quality in the Sagarmatha National Park, Nepal. J. Geosci. Environ. Prot. 2016, 4, 43–53. [Google Scholar] [CrossRef]
- Byers, A.C.; Gustafsson, T.; Shrestha, M.; Chhetri, N. A Sustainable Solid Waste Management Plan for Sagarmatha (Mt Everest) National Park and Buffer Zone, Nepal. Mt. Res. Dev. 2020, 40, A1. [Google Scholar] [CrossRef] [Scilit]
- Humagain, K. Examining Land Use/Land Cover Change and Potential Causal Factors in the Context of Climate Change in Sagarmatha National Park, Nepal. Master’s Thesis, Western Kentucky University, Bowling Green, KY, USA, 2012. [Google Scholar]
- Blasing, M.; Amelung, W. Plastics in soil: Analytical methods and possible sources. Sci. Total Environ. 2018, 612, 422–435. [Google Scholar] [CrossRef] [Scilit] [PubMed]
- Pfohl, P.; Roth, C.; Wohlleben, W. The power of centrifugation: How to extract microplastics from soil with high recovery and matrix removal efficiency. MethodsX 2024, 12, 102598. [Google Scholar] [CrossRef] [Scilit] [PubMed]
- Radford, F.; Zapata-Restrepo, L.M.; Horton, A.A.; Hudson, M.D.; Shaw, P.J.; Williams, I.D. Developing a systematic method for extraction of microplastics in soils. Anal. Methods 2021, 13, 1695–1705. [Google Scholar] [CrossRef] [Scilit] [PubMed]
- Markley, L.A.T.; Driscoll, C.T.; Hartnett, B.; Mark, N.; Mateos Cárdenas, A.; Hapich, H. Guide for the Visual Identification and Classification of Plastic Particles; Syracuse University: Syracuse, NY, USA, 2024. [Google Scholar]
- Royer, S.-J.; Wolter, H.; Delorme, A.E.; Lebreton, L.; Poirion, O.B. Computer vision segmentation model—Deep learning for categorizing microplastic debris. Front. Environ. Sci. 2024, 12, 1386292. [Google Scholar] [CrossRef] [Scilit]
- Giardino, M.; Balestra, V.; Janner, D.; Bellopede, R. Automated method for routine microplastic detection and quantification. Sci. Total Environ. 2023, 859, 160036. [Google Scholar] [CrossRef] [Scilit] [PubMed]
- Cowger, W.; Steinmetz, Z.; Gray, A.; Munno, K.; Lynch, J.; Hapich, H.; Primpke, S.; De Frond, H.; Rochman, C.; Herodotou, O. Microplastic Spectral Classification Needs an Open Source Community: Open Specy to the Rescue! Anal. Chem. 2021, 93, 7543–7548. [Google Scholar] [CrossRef] [Scilit] [PubMed]
- Renner, G.; Nellessen, A.; Schwiers, A.; Wenzel, M.; Schmidt, T.C.; Schram, J. Data preprocessing & evaluation used in the microplastics identification process: A critical review & practical guide. TrAC Trends Anal. Chem. 2019, 111, 229–238. [Google Scholar] [CrossRef] [Scilit]
- Zhou, Y.; Liu, X.; Wang, J. Characterization of microplastics and the association of heavy metals with microplastics in suburban soil of central China. Sci. Total Environ. 2019, 694, 133798. [Google Scholar] [CrossRef] [Scilit] [PubMed]
- Yang, L.; Kang, S.; Wang, Z.; Luo, X.; Guo, J.; Gao, T.; Chen, P.; Yang, C.; Zhang, Y. Microplastic characteristic in the soil across the Tibetan Plateau. Sci. Total Environ. 2022, 828, 154518. [Google Scholar] [CrossRef] [Scilit] [PubMed]
- Li, S.; Li, Z.; Xue, J.; Chen, S.; Li, H.; Ji, J.; Liang, Y.; Fei, J.; Jiang, W. Pollution and Distribution of Microplastics in Grassland Soils of Qinghai-Tibet Plateau, China. Toxics 2023, 11, 86. [Google Scholar] [CrossRef] [Scilit] [PubMed]
- Scheurer, M.; Bigalke, M. Microplastics in Swiss Floodplain Soils. Environ. Sci. Technol. 2018, 52, 3591–3598. [Google Scholar] [CrossRef] [Scilit] [PubMed]
- Evangeliou, N.; Grythe, H.; Klimont, Z.; Heyes, C.; Eckhardt, S.; Lopez-Aparicio, S.; Stohl, A. Atmospheric transport is a major pathway of microplastics to remote regions. Nat. Commun. 2020, 11, 3381. [Google Scholar] [CrossRef] [Scilit] [PubMed]
- Brahney, J.; Hallerud, M.; Heim, E.; Hahnenberger, M.; Sukumaran, S. Plastic rain in protected areas of the United States. Science 2020, 368, 1257–1260. [Google Scholar] [CrossRef] [Scilit] [PubMed]
- Cowger, W.; Gray, A.; Christiansen, S.H.; DeFrond, H.; Deshpande, A.D.; Hemabessiere, L.; Lee, E.; Mill, L.; Munno, K.; Ossmann, B.E.; et al. Critical Review of Processing and Classification Techniques for Images and Spectra in Microplastic Research. Appl. Spectrosc. 2020, 74, 989–1010. [Google Scholar] [CrossRef] [Scilit] [PubMed]
- Kotar, S.; McNeish, R.; Murphy-Hagan, C.; Renick, V.; Lee, C.T.; Steele, C.; Lusher, A.; Moore, C.; Minor, E.; Schroeder, J.; et al. Quantitative assessment of visual microscopy as a tool for microplastic research: Recommendations for improving methods and reporting. Chemosphere 2022, 308, 136449. [Google Scholar] [CrossRef] [Scilit] [PubMed]
- Zhang, G.S.; Liu, Y.F. The distribution of microplastics in soil aggregate fractions in southwestern China. Sci. Total Environ. 2018, 642, 12–20. [Google Scholar] [CrossRef] [Scilit] [PubMed]
- Hsieh, L.; Rong, H.; He, L.; Guo, J.; Li, M.; Tong, M. Impact of freeze-thaw cycles on the remobilization behaviors of microplastics in natural soils. Environ. Pollut. 2024, 363, 125143. [Google Scholar] [CrossRef] [Scilit] [PubMed]
- Feng, S.; Lu, H.; Yao, T.; Tang, M.; Yin, C. Analysis of microplastics in soils on the high-altitude area of the Tibetan Plateau: Multiple environmental factors. Sci. Total Environ. 2023, 857, 159399. [Google Scholar] [CrossRef] [Scilit] [PubMed]
- Chen, M.; Gao, T.; Zhang, Y.; Kang, S.; Wang, Z. Riverine microplastics in the Mount Everest region affected by glacier meltwater. J. Hazard. Mater. 2025, 488, 137331. [Google Scholar] [CrossRef] [Scilit] [PubMed]
- Ng, E.L.; Huerta Lwanga, E.; Eldridge, S.M.; Johnston, P.; Hu, H.W.; Geissen, V.; Chen, D. An overview of microplastic and nanoplastic pollution in agroecosystems. Sci. Total Environ. 2018, 627, 1377–1388. [Google Scholar] [CrossRef] [Scilit] [PubMed]
- Corradini, F.; Meza, P.; Eguiluz, R.; Casado, F.; Huerta-Lwanga, E.; Geissen, V. Evidence of microplastic accumulation in agricultural soils from sewage sludge disposal. Sci. Total Environ. 2019, 671, 411–420. [Google Scholar] [CrossRef] [Scilit] [PubMed]
- Huang, Y.; Liu, Q.; Jia, W.; Yan, C.; Wang, J. Agricultural plastic mulching as a source of microplastics in the terrestrial environment. Environ. Pollut. 2020, 260, 114096. [Google Scholar] [CrossRef] [Scilit] [PubMed]
- Bhusal, K.; Udas, E.; Bhatta, L.D. Ecosystem-based adaptation for increased agricultural productivity by smallholder farmers in Nepal. PLoS ONE 2022, 17, e0269586. [Google Scholar] [CrossRef] [Scilit] [PubMed]
- Weber, C.J.; Opp, C.; Prume, J.A.; Koch, M.; Andersen, T.J.; Chifflard, P. Deposition and in-situ translocation of microplastics in floodplain soils. Sci. Total Environ. 2022, 819, 152039. [Google Scholar] [CrossRef] [Scilit] [PubMed]
- de Souza Machado, A.A.; Kloas, W.; Zarfl, C.; Hempel, S.; Rillig, M.C. Microplastics as an emerging threat to terrestrial ecosystems. Glob. Change Biol. 2018, 24, 1405–1416. [Google Scholar] [CrossRef] [Scilit] [PubMed]
- Forster, N.A.; Wilson, S.C.; Tighe, M.K. Microplastic surface retention and mobility on hiking trails. Environ. Sci. Pollut. Res. 2023, 30, 46368–46382. [Google Scholar] [CrossRef] [Scilit] [PubMed]
- Zhang, Y.; Zhang, D.; Zhang, Z. A Critical Review on Artificial Intelligence-Based Microplastics Imaging Technology: Recent Advances, Hot-Spots and Challenges. Int. J. Environ. Res. Public Health 2023, 20, 1150. [Google Scholar] [CrossRef] [Scilit] [PubMed]
- Huang, H.; Cai, H.; Qureshi, J.U.; Mehdi, S.R.; Song, H.; Liu, C.; Di, Y.; Shi, H.; Yao, W.; Sun, Z. Proceeding the categorization of microplastics through deep learning-based image segmentation. Sci. Total Environ. 2023, 896, 165308. [Google Scholar] [CrossRef] [Scilit] [PubMed]

Disclaimer/Publisher’s Note: The statements, opinions and data contained in all publications are solely those of the individual author(s) and contributor(s) and not of MDPI and/or the editor(s). MDPI and/or the editor(s) disclaim responsibility for any injury to people or property resulting from any ideas, methods, instructions or products referred to in the content. |
© 2026 by the authors. Licensee MDPI, Basel, Switzerland. This article is an open access article distributed under the terms and conditions of the Creative Commons Attribution (CC BY) license.