


Abstract
Urban tree-pruning residues are an underused bioactive resource. This study evaluated a short three-stage crosscurrent process for valorising Maclura pomifera pruning leaves with water and aqueous ethanol. Each stage contacted the preceding residue with fresh solvent and was optimised independently by response surface methodology for temperature, time and, for hydroethanol, ethanol concentration. Responses were total phenolic content (TPC), total flavonoid content (TFC), ABTS radical scavenging, potassium ferricyanide reducing antioxidant power (PFRAP) and silver nanoparticle antioxidant capacity (SNPAC). Extracts from all three optimised stages were pooled per solvent and assessed by UPLC–ESI–MS/MS and for cytotoxicity in four mammalian cell lines. Cumulative TPC reached 21.49 (aqueous) and 23.39 (hydroethanolic) mg gallic acid equivalents/g dry weight, and ABTS reached 52.59 and 49.58 mg ascorbic acid equivalents/g dry weight. Two aqueous stages recovered over 90% of cumulative TPC and ABTS in 15 min. The ethanol-rich third stage contributed 39.2% of cumulative TFC and 28.8% of SNPAC. Hydroethanol favoured flavonoids, whereas water phenolic acids and simple aromatics. Both pooled extracts gave higher IC50 values than ascorbic acid, with the hydroethanolic extract being more cytotoxic. Crosscurrent extraction with water or hydroethanol recovers phenolics rapidly, and staging the ethanol concentration yields compositionally distinct fractions whose suitability for specific applications requires further toxicological evaluation.
1. Introduction
Urban trees provide shade, improve air quality, and support climate resilience [1], but they require regular pruning to control growth and maintain safety, generating recurrent streams of leaves, branches, and other residues [2,3]. These materials are generally discarded [4] or used for low-value energy recovery [5,6,7], despite the possibility of containing extractable organic compounds with potential applications in food, cosmetic, pharmaceutical, agricultural, and biotechnological industries [8,9,10,11].
Maclura pomifera (Osage orange, Moraceae) is widely planted as an ornamental and windbreak species for its robust growth and rot-resistant wood [12,13,14], and like other urban trees it requires regular pruning that generates abundant, potentially low-cost foliage. Phytochemical research on the species has focused almost exclusively on the fruit, a rich source of prenylated isoflavones (osajin, pomiferin) with antioxidant, anti-inflammatory, and anticancer activities [15,16,17,18]; by comparison, the chemical composition and valorisation potential of the leaves have received considerably less attention. Developing processes that can efficiently recover and characterise bioactive constituents from M. pomifera pruning leaves would therefore support their use as a value-added urban biomass resource.
Phenolic compounds and flavonoids are among the principal classes of secondary metabolites investigated in plant biomass valorisation, valued in particular for their antioxidant properties [19,20,21]. Increased interest in natural antioxidants, driven by safety concerns over synthetic additives and the shift towards bio-based ingredients, has encouraged the use of agricultural and forestry residues as sources of phenolic-rich extracts for food, nutraceutical, cosmetic, and biomedical applications [20,22,23,24,25,26]. Phenolic-rich extracts are also of interest beyond direct antioxidant use: their reducing and capping constituents can support plant-mediated nanoparticle synthesis [27,28], a property this study exploits analytically, using silver nanoparticle formation as one of three antioxidant-capacity assays.
Valorising this class of compounds requires more than a yield or activity value; the chemical composition and safety profiles of the resulting extracts must also be characterised to determine possible downstream applications. Liquid chromatography coupled to mass spectrometry can resolve the relative distribution of phenolic acids, flavonoids, and other constituents across extracts obtained under different solvent conditions [29,30], while cell-based cytotoxicity assays offer a fast, ethically preferable first screen ahead of any in vivo testing [31,32,33,34,35,36,37,38]. Ascorbic acid, a reference antioxidant that is safe at nutritional levels but cytotoxic at high concentrations [39,40,41,42], provides a practical benchmark for interpreting extract activity against non-specific cytotoxicity. Several studies describe the bioactivity and cytotoxicity of M. pomifera fruit extracts [15,16,17,18,43], but no comparable data exist for the leaves, which currently limits their incorporation into value chains that require a preliminary safety assessment.
The extraction process is a central factor in converting plant residues into higher-value products. Conventional techniques such as maceration, digestion, decoction, and Soxhlet extraction require long extraction times and, in several cases, sustained heating, which increases energy demand and risks degrading thermolabile compounds [44,45]. Single-stage solid–liquid extraction is also inherently inefficient; as solutes accumulate in the liquid phase, and the concentration gradient that drives extraction declines, added time or solvent brings diminishing returns [46,47,48]. Multistage crosscurrent extraction offers a process intensification alternative, contacting the solid with fresh solvent across short successive stages whose operating conditions can be set independently. Renewing the solvent restores the concentration gradient, and stage-wise adjustment of extraction conditions can selectively recover chemically distinct fractions, giving both higher cumulative recovery and a degree of compositional fractionation. When sustainable solvents such as water or aqueous ethanol are used at moderate temperatures, this approach aligns with green extraction principles [49,50,51,52]. Despite these advantages, crosscurrent extraction remains rarely applied to urban pruning residues, and its potential for M. pomifera leaves in particular, how successive aqueous and hydroethanolic stages affect cumulative recovery, antioxidant response, and extract composition, has not been examined.
Research on the valorisation of lignocellulosic biomass has advanced considerably through green-solvent process intensification, particularly in the deconstruction of the structural matrix. Deep eutectic solvents, including microwave-responsive and ternary formulations, achieve rapid and selective delignification under mild conditions and enable downstream conversion of the carbohydrate fraction to fuels and platform chemicals [53,54]. These approaches target the structural polymers of the biomass. The present work addresses the complementary fraction: the extractable secondary metabolites that can be recovered before any structural processing, leaving a delignifiable residue. Recovering this fraction first is a prerequisite for cascading valorisation, in which the highest-value constituents are isolated ahead of bulk conversion.
The present study aimed to develop and evaluate a green crosscurrent extraction process for M. pomifera pruning leaves, integrating process optimisation, chemical profiling, and preliminary cytotoxicity assessment. Three successive extraction stages were independently optimised for aqueous and hydroethanolic systems using response surface methodology. Extraction temperature, extraction time, and, for the hydroethanolic system, ethanol concentration were evaluated using total phenolic content, total flavonoid content, and three complementary antioxidant responses, 2,2′-azino-bis(3-ethylbenzothiazoline-6-sulfonic acid (ABTS) radical-scavenging capacity, potassium ferricyanide reducing antioxidant power (PFRAP), and silver nanoparticle antioxidant capacity (SNPAC), as process-performance indicators. The optimised stage extracts were subsequently combined and characterised by ultra-performance liquid chromatography coupled to electrospray ionisation tandem mass spectrometry (UPLC–ESI–MS/MS), and their preliminary cytotoxicity was evaluated using BHK21, IBRS2, MDBK, and Vero cell lines. The specific contribution of this work is threefold. First, each extraction stage was optimised independently rather than applying a single set of conditions repeatedly, which allows the operating point to be adapted to a feedstock whose composition changes as extraction proceeds. Second, this reveals a behaviour not captured by conventional single-stage optimisation: the ethanol-rich final stage functions as a targeted fractionation step, contributing a disproportionate share of flavonoid and silver-nanoparticle antioxidant capacity while adding little to bulk phenolic recovery. Multistage extraction is therefore shown to act as a means of compositional fractionation rather than simply of yield improvement. Third, the study provides the first extraction, chemical profiling and preliminary cytotoxicity data for M. pomifera leaves, a fraction of an already widely planted urban species for which phytochemical work has focused almost exclusively on the fruit.
2. Materials and Methods
2.1. Plant Material
M. pomifera pruning waste was collected in September from the alleys and gardens of the National Polytechnic School of Algiers (Algiers, Algeria). Leaves were separated from branches, rinsed thoroughly with tap water, and air-dried at room temperature in the dark for ten days. The dried leaves were milled and sieved to a particle size between 74 and 149 µm, then stored in airtight containers until use.
The moisture content of the plant material was determined gravimetrically by drying to constant weight. Fresh leaves contained 59.7 ± 1.2% w/w moisture (105 °C, n = 3). The residual moisture content of the milled, air-dried powder used in all extractions was 4.1 ± 0.2% (105 °C, n = 3).
2.2. Solvents and Reagents
Absolute ethanol (≥99.8%), Folin–Ciocalteu reagent, gallic acid, sodium carbonate, aluminium chloride, potassium acetate, quercetin, ABTS, potassium persulfate, ferric chloride, potassium ferricyanide, ascorbic acid, and silver nitrate were obtained from Sigma-Aldrich (St. Louis, MO, USA). Dulbecco’s modified Eagle medium (DMEM), foetal bovine serum (FBS), penicillin–streptomycin, and trypsin–EDTA were supplied by Gibco (Thermo Fisher Scientific, Waltham, MA, USA). Resazurin was purchased from Sigma-Aldrich. All chemicals were of analytical grade or higher; ultrapure water was produced using a Milli-Q system (Merck Millipore, Darmstadt, Germany).
2.3. Experimental Design and Optimisation
Response surface methodology (RSM) was used to optimise extraction parameters for both aqueous and hydroethanolic systems across a three-stage process. A face-centred central composite design evaluated the effects of extraction time, temperature, and (for the hydroethanolic system) ethanol concentration on TPC, TFC, and antioxidant activity. The factor ranges were identical at every stage and for both solvent systems, and the composition of each design is summarised in Table 1. The hydroethanolic design comprised 16 runs per stage (8 factorial, 6 axial and 2 centre points). The aqueous design comprised 10 runs at stage 1 (4 factorial, 4 axial and 2 centre points) and 13 runs at stages 2 and 3, in which five centre-point replicates were run; the additional replicates provide a more robust pure error estimate for the lower-magnitude responses obtained at these stages.
Table 1.
Face-centred central composite designs used for the aqueous and hydroethanolic extraction systems. (a) Factors and coded levels. (b) Design composition.
The factor ranges were established from preliminary trials on the same feedstock, combined with process and equipment constraints, and are summarised in Table 1. The temperature range (15–60 °C) was bounded below by 15 °C, held using the refrigerated function of the incubator shaker as a controlled room-temperature reference requiring no heating, and above by 60 °C, which is both the maximum operating temperature of the incubator (MaxQ 4000R, Thermo Fisher Scientific, Waltham, MA, USA) and the upper end of the range generally reported as optimal for polyphenol recovery [55,56]. Phenolic compounds are reported to remain substantially stable at this temperature over short contact times, with thermal degradation becoming significant only after prolonged exposure [57]. The extraction-time range (1–10 min) was determined from preliminary trials, in which the readily extractable fraction was released within the first minutes of contact and longer contact gave only marginal increments. The ethanol range (30–70% v/v) was bounded above at 70% v/v, the highest level at which chlorophyll co-extraction remained acceptable in preliminary trials. Higher ethanol contents recovered chlorophyll in amounts that add non-phenolic mass to the extract, which is undesirable for downstream applications [58]; co-extraction remained acceptable at 70% v/v, which is why this level was retained as the upper bound. A lower bound below 30% v/v was unnecessary because the parallel aqueous system already provides the 0% v/v condition, so the two designs together span a polarity ladder of 0, 30, 50 and 70% v/v ethanol.
Regression and analysis of variance were performed in SAS JMP (Version 19.03; SAS Institute Inc., Cary, NC, USA) to assess model significance, factor effects, interactions, quadratic terms and lack of fit for all responses. Significance was assessed at α = 0.05. Full second-order models were fitted and reduced through backward elimination to remove non-significant terms (p > 0.05) with hierarchy preserved. Lack of fit was tested against the pure error estimated from the replicated centre points. Residuals were examined as externally studentised residuals; where lack of fit was significant, the influence of the run with the largest residual was assessed by refitting the model without it. Predictive performance was assessed by leave-one-out cross-validation, in which each model was refitted with one run omitted in turn, the predicted residual error sum of squares (PRESS) accumulated over all runs, and the predicted R2 were calculated.
Optimal conditions for each stage were identified with SAS JMP (SAS Institute Inc., Cary, NC, USA) by maximising a desirability function applied to the reduced response surface models. Each response was assigned a maximisation goal and rescaled to an individual desirability, d, on a 0–1 scale increasing monotonically with the response, with the low and high anchor points set at the minimum and maximum response values observed in the design for the stage concerned. The responses optimised together were combined into a composite desirability, D, taken as the geometric mean of the individual desirabilities. All responses were given equal importance, so the geometric mean was unweighted. The variables entering the optimisation were the design factors alone: extraction temperature (X1), extraction time (X2) and, for the hydroethanolic system, ethanol concentration (X3). No covariates or blocking terms were included in any model or in the optimisation. D was maximised numerically within the experimental domain of each design. For the aqueous system, a single composite desirability was maximised simultaneously across all five responses (TPC, TFC, ABTS, PFRAP and SNPAC). For the hydroethanolic system, the responses divided into two groups with opposing dependence on ethanol concentration: TPC, ABTS and PFRAP favoured water-rich compositions, whereas TFC and SNPAC favoured ethanol-rich compositions. A single composite desirability across all five responses would therefore have selected an intermediate ethanol concentration that optimises neither group. Two desirability functions were consequently evaluated at each hydroethanolic stage, one maximising TPC, ABTS and PFRAP and one maximising TFC and SNPAC. The first was used to select the conditions for stages 1 and 2, and the second for stage 3.
The conditions identified by numerical optimisation were validated experimentally. Each optimal condition set was applied in triplicate and the measured responses were compared with the model predictions.
2.4. Extraction Procedure
All runs used 5.0 g of milled leaf powder and 50 mL of solvent (1:10 w/v), pre-equilibrated at the target temperature. The ratio refers to the air-dried powder as weighed. Extractions were performed in 250 mL closed flasks with orbital shaking in an incubator shaker (MaxQ 4000R, Thermo Fisher Scientific, Waltham, MA, USA) at 150 rpm. After the specified time, mixtures were vacuum-filtered (Whatman No. 4, 20–25 µm) and the filtrates stored at −20 °C; the solid cake from individual design runs was not retained.
The feedstock for each subsequent stage was prepared separately (Figure 1). A bulk extraction was carried out under the optimal conditions identified for the preceding stage, and the recovered cake was dried at 45 °C overnight and homogenised. This bulk residue was then used for all runs of the following stage, so that every run within a design started from an identical feedstock and differences between runs could be attributed to the factor settings alone. Inter-stage drying was therefore a requirement of the experimental design rather than of the process itself. In continuous operation the cake would pass directly to the next stage without drying. Some residue was lost during vacuum filtration of the bulk preparations. These losses were not quantified; the purpose of the bulk step was to generate a homogeneous feedstock for the following design rather than to establish a mass balance. These losses do not affect the response surface models because all runs within a stage used the same homogeneous residue. Responses at each stage are expressed per gram of the material fed to that stage. Each design run was performed in triplicate, as were the validation experiments carried out under the optimised conditions. Results were expressed as means ± standard deviations, and response surface models were fitted to the mean of the three replicates for each run.
Figure 1.
Crosscurrent extraction procedure and downstream analysis.
For UPLC-ESI-MS/MS and cytotoxicity assays, extracts from the optimal conditions of all three stages were combined and concentrated under reduced pressure (30 mbar) at 45 °C (Hei-VAP, Heidolph, Schwabach, Germany). Solvent was not recovered at any point in the process. Extracts were concentrated under reduced pressure and the distillate discarded, solvent recovery being outside the objectives of the present study.
After completion of the optimised three-stage process, a single additional extraction was carried out on the final residue under deliberately exhaustive conditions (60 °C, 60 min) to assess how much extractable phenolic material remained. This fourth stage was not optimised and was not part of the experimental design; water was used for the aqueous system and 70% v/v ethanol, corresponding to the stage 3 optimum, for the hydroethanolic system. Only TPC was determined.
2.5. Analytical Methods
2.5.1. Total Phenolic Content
TPC was determined by the Folin–Ciocalteu method [59], with slight modification: 0.5 mL diluted extract was mixed with 2.5 mL of ultrapure water and 2.5 mL of Folin–Ciocalteu reagent, incubated for 5 min in the dark, and then treated with 0.75 mL 20% (w/v) sodium carbonate and 1 mL ultrapure water. After 20 min, absorbance was read at 750 nm (Uviline 9000, SECOMAM, Alès, France). Results were expressed as mg gallic acid equivalents (GAE) per g dry weight (DW) using a gallic acid calibration curve that ranged from 10 to 100 µg/mL. Cumulative values are the sum of the three stage-wise yields.
2.5.2. Total Flavonoid Content
TFC was determined by the aluminium chloride method [60]: 0.5 mL extract, 2 mL water, and 0.15 mL 5% sodium nitrite were mixed and incubated 5 min; 0.15 mL 10% AlCl3 was added, followed after 1 min by 1 mL 1 M NaOH and 1.2 mL ultrapure water. After 5 min, absorbance was read at 510 nm. Results were expressed as mg quercetin equivalents (QE) per g DW using a calibration curve that ranged from 10 to 100 µg/mL.
2.5.3. Antioxidant Assays
Because antioxidant activity depends on the underlying reaction mechanism, radical-scavenging, reducing-power, and metal-based assays can rank the same extracts differently, and no single assay fully captures this behaviour; combining complementary responses gives a more reliable picture of an extract’s antioxidant potential [19,61,62]. Three complementary assays probed radical-scavenging and reducing mechanisms [63,64]. For ABTS, a 7 mM ABTS/2.45 mM potassium persulfate solution was incubated in the dark for 12–16 h, diluted with phosphate buffer (0.1 M, pH 7.4) to A735 = 0.700 ± 0.05, and then mixed with 100 µL of extract (2.9 mL of solution); absorbance was read at 735 nm after 10 min [65]. For PFRAP, 2.5 mL phosphate buffer, 2.5 mL of 1% (w/v) potassium ferricyanide, and 1 mL of extract were incubated at 50 °C for 15 min; the reaction was stopped with 2.5 mL 10% (w/v) trichloroacetic acid, centrifuged (3000 rpm, 10 min), and 2.5 mL supernatant was mixed with 2.5 mL of water and 0.5 mL of 0.1% FeCl3 before reading at 700 nm [61]. For SNPAC, 1 mM AgNO3 was heated for 10 min, and then 10% (v/v) trisodium citrate (1% w/v) was added under stirring to form a colloidal solution; 100 µL of extract was added to 2.9 mL of SNPAC solution and absorbance was read at 423 nm after 10 min [66]. Ascorbic acid served as the standard for all three assays; results were expressed as mg ascorbic acid equivalents (AAE) per g DW. A calibration curve was constructed for each assay in the following ranges: 20–120 µg/mL for ABTS, 50–400 µg/mL for PFRAP, and 20–200 µg/mL for SNPAC. The calibration curves along with their corresponding R2 are provided in Figure S1.
2.5.4. UPLC-ESI-MS/MS
UPLC-ESI-MS/MS analyses were performed on a Shimadzu LCMS-8040 ultra-high-sensitivity system equipped with a Nexera XR LC-20AD binary pump (Shimadzu LCMS-8040, Shimadzu Corporation, Kyoto, Japan). The electrospray ionisation conditions were as follows: collision-induced dissociation (CID) gas, 230 kPa; conversion dynode, −6.00 kV; desolvation line temperature, 250 °C; nebulising gas flow, 3.0 L/min; heat block temperature, 400 °C; and drying gas flow, 10.0 L/min. Separation was carried out on a Restek Ultra C18 column (3 µm, 150 × 4.6 mm) (Restek Corporation, Bellefonte, PA, USA) with a mobile phase consisting of water with 0.1% formic acid (solvent A) and methanol (solvent B) at 0.20 mL/min. The gradient programme was: 0–0.2 min, 98% A; 0.2–2.5 min, 98–25% A; 2.5–4.0 min, 25–0% A; 4.0–7.0 min, 0% A; 7.0–7.1 min, 0–98% A; 7.1–12.0 min, 98% A. The injection volume was 5 µL. Identification of phenolic compounds was performed in multiple reaction monitoring (MRM) mode using LabSolutions-LCMS software (Version 5.97; Shimadzu Corporation, Kyoto, Japan) to obtain the phenolic profiles of the identified constituents. Multiple reaction monitoring transitions were established in-house by injection of standards on the same instrument, with the precursor ion and the quantifier and qualifier product ions selected by automated optimisation for each compound. Compounds were identified by matching the precursor ion and both product ions to those of the corresponding standard acquired under identical ionisation conditions. Relative peak areas are reported for comparison between the two extracts and are semi-quantitative: they were not converted to concentrations by external calibration, and differences in ionisation efficiency between compounds mean that areas are comparable for a given compound across extracts but not between different compounds.
2.5.5. Cytotoxicity Assays
Cytotoxicity was assessed as a preliminary screening. Its purpose was to compare the two solvent systems and a reference antioxidant over a common concentration range. The assay was performed on four different mammalian cell lines: Vero (African green monkey kidney epithelium), BHK21 (baby hamster kidney fibroblast), MDBK (bovine kidney epithelium) and IBRS2 (porcine kidney epithelium) (National Institute of Veterinary Medicine, Algiers, Algeria), all continuous non-tumour lines of renal origin. They were selected on the basis of availability and were used to screen for non-specific cytotoxicity, not as models of a particular target tissue.
Combined optimal-condition extracts were evaporated at a bath temperature of 45 °C (30 mbar, Hei-VAP, Heidolph, Schwabach, Germany), then resuspended in phosphate-buffered saline (PBS, pH 7.4), and sterile-filtered (0.2 µm). The cell lines were maintained in DMEM with 10% FBS and 1% penicillin–streptomycin at 37 °C, 5% CO2. Cells were seeded at 1 × 10⁴ cells/well in 96-well plates, allowed to adhere for 24 h, and then exposed to extracts (0.2–6.5 mg/mL, quadruplicate) for 24 h. Resazurin (20 µL, 0.15 mg/mL) was added and plates incubated 1–4 h at 37 °C before reading fluorescence (560 nm excitation/590 nm emission, Fluoroskan) [67]. Residual-ethanol controls (70% ethanol evaporated under the same conditions and redissolved in PBS) were included alongside PBS-only negative controls. Ascorbic acid served as the reference compound over the same concentration range. Half-maximal inhibitory concentration (IC50) values were calculated by fitting a four-parameter logistic model on the SkanIt software (Version 5.0.0.42; Thermo Fisher Scientific, Waltham, MA, USA).
2.6. Multivariate Analysis
Multivariate statistical analyses were employed to elucidate the relationships between the extraction stages, phenolic and flavonoid contents, and antioxidant capacities. Pearson correlation analysis was conducted to quantify the linear associations between TPC, TFC, and the three complementary antioxidant responses (ABTS, PFRAP, and SNPAC) across all three stages for both solvent systems. To visualise the clustering of extraction stages and identify the dominant variables driving sample variance, Principal Component Analysis (PCA) was executed. Prior to PCA, all analytical data were standardised (mean-centred and scaled by unit variance) to ensure that variables with disparate units and magnitudes contributed equally to the model. The PCA biplots were generated to map the distribution of the sequential extraction stages against the variable loading vectors. All multivariate calculations, data standardisation, and visualisations were executed in a Python 3.14.7 environment utilising the pandas 2.3.3, scikit-learn 1.9.0, matplotlib 3.11.1, and seaborn 0.13.2 libraries.
3. Results and Discussion
3.1. Model Evaluation and Fitting
Second-order polynomial models were fitted to TPC, TFC and the three antioxidant responses across the three extraction stages for both solvent systems. All models were significant after removal of non-significant terms, with p-values ≤ 0.0063, with R2 between 0.893 and 0.989 and adjusted R2 between 0.872 and 0.982 (Table 2 and Table S1). Predicted R2, obtained by leave-one-out cross-validation, ranged from 0.614 to 0.953 and was positive for every model, indicating that each model reproduces observations withheld from its estimation better than the response mean does. Lack-of-fit tests were non-significant (p > 0.05) for 28 of the 30 models, indicating that these second-order models adequately describe the relationship between extraction variables and responses within the tested domain and can support optimisation and interpretation of factor effects. Lack of fit was significant for two aqueous stage 2 models, TFC (p = 0.037) and PFRAP (p = 0.022). For both, the pure error estimated from the five centre-point replicates was the lowest of the five stage 2 responses (coefficients of variation of 1.9% and 1.8%, against 3.1–5.7% for TPC, ABTS and SNPAC), which makes the test sensitive to the deviation of a single run from the fitted surface. Residual analysis identified one such run in each design, at 60 °C/1 min for TFC and at 37.5 °C/10 min for PFRAP (externally studentised residuals of −6.0 and −4.7). When the models were refitted without the outlier run, neither model showed significant lack of fit (p = 0.66 and 0.18), and the stage 2 optimum was unchanged. As no experimental cause was found that would justify discarding either observation, both models were kept as fitted to all runs and were used with caution. They are not interpreted individually in Section 3.2 and enter the analysis only through the aqueous stage 2 desirability function, in which the fitted surfaces of all five responses reach their maximum at the same vertex of the design (60 °C, 10 min), so that the selected optimum does not depend on them.
Table 2.
Goodness-of-fit statistics (R2, R2 adjusted, predicted R2, lack-of-fit p-value) for response surface models describing aqueous and hydroethanolic extraction of M. pomifera leaves (TPC, TFC, ABTS, PFRAP, SNPAC) across three stages.
Terms that were not significant at α = 0.05 were removed from the models, and their estimates and p-values in the full second-order fits are reported alongside the reduced models in Tables S3 and S4.
3.2. Factor Effects and Response Surface Morphology
The main significant regression coefficients are summarised in Table 3. Three-dimensional response surfaces illustrate the most influential factors for aqueous (Figure 2) and hydroethanolic (Figure 3) extraction. PFRAP and TFC broadly followed the trends of ABTS and SNPAC, respectively (Pearson |r| ≥ 0.8 in most cases, Section 3.3), and are discussed only briefly. The regression coefficients of the reduced models are given in Table 3. Complete statistics for every term, in both the full second-order models and the reduced models, are reported in Tables S3 and S4 for the aqueous and hydroethanolic systems, respectively; the corresponding coded polynomial equations are given in Table S5 and the complete design and response data in Table S2.
Table 3.
Regression coefficients of the reduced response surface models, in coded units, for (a) the aqueous and (b) the hydroethanolic system at each extraction stage.
Figure 2.
Response surface plots for aqueous extraction: combined effects of extraction time and temperature on (a,b) TPC in stages 1 and 2, (c) ABTS radical-scavenging activity in stage 1, and (d) SNPAC in stage 1. Surface colour encodes the fitted response value, from low (blue) to high (red).
Figure 3.
Response surface plots for hydroethanolic extraction: effects of ethanol concentration and temperature on (a,b) TPC in stages 1 (time = 5 min) and 3 (time = 10 min), (c,e) ABTS radical-scavenging activity in stages 1 (time = 5 min) and 3 (time = 10 min), and (d,f) SNPAC in stages 1 (time = 5 min) and 3 (time = 10 min). Surface colour encodes the fitted response value, from low (blue) to high (red).
3.2.1. Temperature and Extraction Time
Temperature was the dominant factor across all stages and both solvents, with strong positive linear effects on TPC, ABTS, and SNPAC and significant quadratic terms in several models (Table 3). Elevated temperature enhances polyphenol diffusion, solubility, and matrix permeability, but high temperatures can also lead to thermal degradation of the more labile constituents above a threshold that depends on the plant matrix and on the duration of exposure [55,68,69,70,71,72,73].
In the aqueous system, stage 1 TPC increased with both time and temperature, with a positive quadratic temperature term, favouring the recovery of water-soluble phenolics at higher temperatures and a moderately longer time (Figure 2a). ABTS, however, showed a negative quadratic time term and a negative time × temperature interaction (Figure 2c), indicating that prolonged extraction at high temperature reduced radical-scavenging activity even as TPC continued to rise, suggesting that ABTS-active constituents degrade faster than the bulk phenolic pool. SNPAC displayed a convex surface with negative quadratic terms for both factors (Figure 2d), peaking at intermediate conditions, which is consistent with the higher thermal sensitivity typically reported for flavonoids, which correlate strongly with SNPAC in this study [55,56,74,75,76,77]. In stages 2 and 3, significant time × temperature interactions for TPC (Figure 2b), ABTS, and SNPAC (Table 3) indicate that once the readily extractable fraction is depleted in stage 1, further recovery depends on the combined effect of thermal energy and longer contact time to mobilise less accessible phenolics [78,79,80].
In the hydroethanolic system, time had a weaker effect on stage 1 TPC, while temperature showed a strong positive effect on ABTS and a marked negative quadratic effect on TPC (Figure 3a,c), suggesting rapid extraction of ethanol-soluble phenolics with limited additional time dependence within the 1–10 min window. Unlike the aqueous system, the hydroethanolic stage 3 ABTS response showed a positive time × temperature interaction (Table 3; Figure 3e), with no evidence of thermal degradation, which is consistent with reports that, for some plant matrices, hydroalcoholic mixtures stabilise thermally labile flavonoids and phenolic acids more effectively than water under comparable conditions [71,81,82]. Overall, water-based extraction showed signs of ABTS-active compound degradation at high temperatures and long times, whereas the hydroethanolic system maintained or improved ABTS activity under the same conditions.
3.2.2. Solvent Composition
Ethanol concentration strongly influenced the hydroethanolic system. In stage 1, TPC and ABTS declined with increasing ethanol, reaching a maximum value at 30% v/v (Figure 3a,c), indicating that the most readily extractable phenolics in M. pomifera leaves are predominantly hydrophilic, consistent with trends reported for other plant matrices [83,84,85]. SNPAC showed the opposite pattern, increasing with ethanol content and achieving the highest recovery at 70% v/v (Figure 3d), suggesting that constituents responsible for silver-ion reduction and nanoparticle stabilisation are less polar [86,87,88].
By stage 3, the TPC–ethanol relationship reversed to a positive linear dependence, while SNPAC showed a curvilinear increase with ethanol (Figure 3b,f), and ABTS also favoured higher ethanol content (Figure 3e). This shift indicates that once the most polar fraction is depleted in earlier stages, the residual pool is enriched in less polar phenolics and flavonoids that are better solubilised at higher ethanol contents. This pattern is reported in other multistage extraction studies, where fractions extracted using solvents with high ethanol content favoured flavonoid recovery [89].
Together, the time–temperature and solvent–composition patterns support a compositional partitioning between polar phenolics recovered early in water-rich conditions and less polar constituents recovered later under ethanol-rich conditions, contributing more strongly to TFC and SNPAC. This suggests that multistage extraction can act as a simple fractionation approach, enriching early aqueous stages in more polar phenolics and later ethanol-rich stages in flavonoid-rich, high-SNPAC fractions.
3.3. Relationships Between Phenolic Content and Antioxidant Responses
Pearson correlations and principal component analysis (PCA) were used to examine relationships between phenolic contents (TPC, TFC) and antioxidant responses (ABTS, PFRAP, SNPAC) across extraction stages. Correlation heatmaps (Figure 4) summarise pairwise relationships across all three stages in both solvent systems, and PCA biplots on standardised data (Figure 5) visualise how these relationships structure the overall response space and separate the extraction stages.
Figure 4.
Correlation heatmaps for aqueous (stages 1, 2, 3) and hydroethanolic (stages 1, 2, 3) extraction, showing pairwise Pearson coefficients among TPC, TFC, ABTS, PFRAP, and SNPAC.
Figure 5.
PCA biplots of the aqueous and hydroethanolic extracts, coloured by stage (standardised variables).
Across both solvents and all three stages, TPC correlated strongly with ABTS (r = 0.84–0.95), consistent with the well-documented association between phenolic content and radical-scavenging capacity in mixed hydrogen atom transfer (HAT) and electron-transfer assays [62,90,91,92]. TFC and SNPAC showed a comparable strong positive association that strengthened progressively from stage 1 (r = 0.78–0.79) through stage 2 to stage 3 (r = 0.97–0.98), while the TPC–SNPAC relationship diverged sharply between solvents in stage 1 (aqueous r = 0.44; hydroethanolic r = −0.73), narrowed in stage 2, and converged towards strongly positive values by stage 3. This pattern indicates that flavonoids, rather than total phenolics broadly, are the principal contributors to silver-ion reduction and nanoparticle stabilisation [93,94].
The PCA biplots corroborate this structure. In both solvent systems, samples separated along PC1 by extraction stage, reflecting the progressive depletion of readily extractable solutes described in Section 3.2, with stage 2 samples consistently occupying an intermediate position between stages 1 and 3. Loading vectors for TPC, ABTS, and PFRAP clustered together in both systems, consistent with their consistently strong pairwise correlations, while TFC and SNPAC formed a distinct cluster, particularly in the hydroethanolic system—visually confirming the flavonoid-driven SNPAC association identified above. The weak TPC–TFC coupling evident in stage 1 (r = 0.34 aqueous; r = −0.32 hydroethanolic) converged to near-uniform positive correlations (r > 0.94 for most pairs) by stage 3 in both systems, indicating that the residual extractable fraction behaves as a compositionally homogeneous pool released in parallel.
Overall, TPC is the strongest correlate of the ABTS and PFRAP responses, while TFC is the strongest correlate of SNPAC, with the two pools becoming increasingly co-extracted as the multistage process progresses.
These correlations describe the chemical reactivity of the extracts under defined assay conditions. ABTS, PFRAP and SNPAC each probe a different reaction mechanism and none reproduces the conditions of a biological system, so the associations reported here should not be read as evidence of antioxidant efficacy in vivo [64,65].
3.4. Optimisation and Stage-Wise Contributions
Optimal conditions identified as described in Section 2.3 were validated experimentally (Table 4). Relative deviations between predicted and measured responses remained below 12% for all response and stage combinations, and below 1% for five responses, including TPC and ABTS in the aqueous system at stage 3.
Table 4.
Experimental validation of optimised extraction conditions: measured responses and relative prediction error at each stage.
In the aqueous system, stage 1 was optimised at 60 °C/5.4 min (TPC 16.15 ± 0.42 mg GAE/g DW, ABTS 40.52 ± 0.83 mg AAE/g DW); stages 2–3 were both optimised at 60 °C/10 min. Cumulative yields reached 21.49 mg GAE/g DW (TPC), 52.59 mg AAE/g DW (ABTS), and 23.20 mg AAE/g DW (PFRAP). In the hydroethanolic system, stage 1 was optimised at 54 °C/5 min/30% ethanol (TPC 15.21 ± 0.42 mg GAE/g DW, ABTS 36.89 ± 0.72 mg AAE/g DW); stages 2–3 were optimised at 60 °C/10 min, with ethanol at 30% (stage 2) and 70% (stage 3). Cumulative yields reached 23.39 mg GAE/g DW (TPC), 19.09 mg QE/g DW (TFC), and 49.58 mg AAE/g DW (ABTS), notably higher in TFC than the aqueous system, consistent with Section 3.2’s flavonoid enrichment in ethanol.
Stage 1 TPC yields with pure water (16.15 mg GAE/g DW) and 30% ethanol (15.21 mg GAE/g DW) were of comparable magnitude, as were the corresponding ABTS and PFRAP values, and optimal time/temperature conditions were similar across both solvents at every stage. This indicates that water alone can recover the most polar phenolic fraction as effectively as dilute ethanol. Water is the cheaper and more readily available solvent, although establishing an environmental advantage would require the recovery and energy consumption of each to be quantified.
Stage-wise contribution analysis (Figure 6) showed that stage 1 accounted for approximately 65–77% of cumulative recovery across most responses, stage 2 for approximately 16–28%, and stage 3 for a marginal 4.5–12% additional gain, except for TFC and SNPAC in the hydroethanolic system, where stage 3 contributed a substantially larger share (39.2% and 28.8%, respectively). This diminishing-return pattern reflects the progressive depletion of easily accessible solutes typical of multistage extraction [95,96,97].
Figure 6.
Relative contribution of stages 1, 2, and 3 to the cumulative recovery of phenolics and antioxidant activities (TPC, TFC, ABTS, PFRAP, SNPAC) in (a) aqueous and (b) hydroethanolic multistage extraction of M. pomifera leaves. Error bars represent the propagated standard deviation (n = 3 independent extractions) at each stage.
On a solvent-demand basis, the full three-stage process consumes 30 mL of solvent per gram of feed material, comparable to the solid-to-liquid ratios commonly applied in single-stage conventional maceration rather than lower. The advantage of the crosscurrent configuration therefore is not solvent volume reduction but the reduction in contact time and operating temperature, the ability to mitigate thermal degradation, and the option of stopping after two stages. The appropriate number of stages therefore differs between the two solvent systems. For the aqueous process, limiting the extraction to two stages reduces solvent demand to 20 mL/g while retaining more than 90% of the cumulative TPC and ABTS within roughly 15 min of contact time, improving solvent intensity from 1.40 to 0.99 mL per mg GAE recovered. For the hydroethanolic system, the pronounced stage 3 contribution to TFC and SNPAC implies that the ethanol-rich final stage acts as a targeted fractionation step for recovering a flavonoid-enriched, high-SNPAC fraction rather than simply exhausting residual bulk phenolics, and it is retained on that basis. Distributing the contact time across successive short stages also limits the loss of radical-scavenging activity observed when high temperature is combined with prolonged contact within a single stage (Section 3.2.1).
To assess how much extractable material remained after three stages, a single unoptimised extraction was carried out on the final residue under deliberately exhaustive conditions (60 °C, 60 min), using water and, for the hydroethanolic system, 70% v/v ethanol matching the stage 3 optimum. This recovered only approximately 0.25 and 0.21 mg GAE/g DW respectively, corresponding to 1.1% and 0.8% of the cumulative totals (Table S7). Although this fourth stage was not optimised, the extraction time was substantially longer than any design run. The small quantity recovered suggests that the three-stage process captures approximately 99% of the phenolic material extractable under these conditions, and indicates that additional stages would not be productive. The reported cumulative values can therefore be interpreted as near-exhaustive rather than as the sum of three arbitrary fractions.
When compared to other species, the cumulative TPC obtained here (≈23 mg GAE/g DW) falls within the mid-upper range reported for aqueous or ethanolic leaf extracts from other species under conventional extraction (typically 10–20 mg GAE/g DW) [58,98,99], but remains slightly lower than the values achieved with more intensive methods such as deep eutectic solvents or ultrasound assistance (40–80 mg GAE/g DW) [100,101], yet without requiring specialised solvents or equipment. These results demonstrate that a compact multistage scheme recovers most of the antioxidant phenolic pool within short contact times, which is relevant for informing preliminary process design considerations. However, further work is needed at pilot scale to assess solvent recovery, energy demand, and operational feasibility before drawing conclusions on industrial scale-up.
Studies focusing on the life-cycle assessment of phenolic recovery from woody and agro-industrial residues indicate the material and energy needs for such processes. In an assessment of polyphenol extraction from spruce bark, electricity used for heating dominated most impact categories, followed by the production and use of ethanol as solvent [102]. A comparison of extraction techniques applied to pine needles reached a related conclusion; simple maceration carrying the lowest impact despite its long duration and microwave-assisted extraction the highest, since electricity consumption rather than contact time governed the result [103]. Analyses of agro-industrial residues have similarly identified solvent production and electrical energy as the principal contributors, with solvent recovery as the main means of reducing them [104,105]. The process described here operates at or below 60 °C for contact times of ten minutes or less and requires no specialised equipment, and in its aqueous configuration uses no organic solvent at all. The aqueous route avoids the solvent production requirements and confines energy demand to moderate heating, whereas the hydroethanolic route incurs environmental impacts associated with solvent use and production that would have to be mitigated through recovery, which was not attempted here. To compare the present process to the studies cited, a life-cycle inventory would be required, which was not collected in this work.
3.5. Chemical Profiles
UPLC-ESI-MS/MS identified nineteen phenolic and related constituents across the optimised extracts (Table 5; full qualifier ion transitions in Table S6), spanning phenolic acids, flavonoids, and other secondary metabolites. The comparisons that follow are semi-quantitative: peak areas were not converted to concentrations, and because ionisation efficiency differs between compounds, they indicate the relative distribution of a given compound between the two extracts but do not support comparison of abundance between different compounds.
Table 5.
UPLC-ESI-MS/MS identification of phenolic and related constituents in optimised aqueous and hydroethanolic M. pomifera leaf extracts. ND: not detected.
A comparison of relative peak areas revealed distinct solvent selectivity, governed by the dielectric properties of the extraction media and by the physicochemical features of the individual analytes. Among phenolic acids and simple aromatics, the aqueous extract showed higher relative abundances of vanillin, sinapic acid, 2-methoxybenzoic acid and salicylic acid. These are low-molecular-weight compounds in which polar functional groups, principally carboxyl and aldehyde moieties, account for a large proportion of the molecular surface, and the high dielectric constant and hydrogen-bond-donor capacity of water favour the solvation of such compact, strongly polar structures [21,44]. Caffeic and ferulic acids were the two members of this group recovered preferentially in the hydroethanolic system. Within the hydroxycinnamic acids the distribution tracked the availability of free hydroxyl groups ortho to the ring hydroxyl: caffeic acid, bearing an unsubstituted catechol, and ferulic acid, in which one position is methylated, favoured the hydroethanolic extract, whereas p-coumaric acid, which lacks ortho substitution, was distributed similarly between the two systems, and sinapic acid, in which both positions are methylated, favoured the aqueous extract. Free ortho-hydroxyl groups form strong hydrogen bonds with cell-wall polysaccharides, and their retention appears to shift the balance towards the ethanol-containing medium. Chrysin and kojic acid were detected only in the aqueous extract.
The hydroethanolic extract was consistently enriched in flavonoids, including naringenin, quercetin and rutin, with epicatechin detected exclusively in this system. The C6–C3–C6 skeleton confers an amphiphilic character, combining several hydrogen-bonding hydroxyl groups with a comparatively apolar ring framework, so that neither pure water nor pure ethanol provides an optimal solvation environment. The addition of ethanol lowers the bulk dielectric constant of the medium to an intermediate value better matched to this dual character, and simultaneously weakens the hydrogen bonding that retains these compounds within the matrix, enhancing their recovery [21,83]. The behaviour observed here is not ordered by lipophilicity: rutin, the most polar flavonoid identified, was recovered preferentially in the hydroethanolic system, indicating that the relevant factor is the accommodation of hydroxyl functionality rather than hydrophobic surface area alone. A comparable distinction is apparent in the flavonoid skeleton itself. Quercetin and luteolin share the same hydroxylation pattern and catechol B-ring and differ only by the hydroxyl at C-3, yet were recovered preferentially in opposite systems; rutin, epicatechin and naringenin, each carrying a C-3 substituent or a saturated C2–C3 bond, followed quercetin, while chrysin, the remaining unsubstituted flavone, followed luteolin. These findings agree with reports that ethanol-containing mixtures favour the extraction of flavonoid aglycones and glycosides in Moraceae and related taxa [106,107,108].
Luteolin therefore diverged from the broader class trend, showing higher relative abundance in the aqueous extract, which indicates that solvent selectivity is not reducible to class membership. Two explanations are consistent with the present data. Its 3′,4′,5,7-tetrahydroxylated structure may support an extensive hydrogen-bonded hydration shell that stabilises the molecule in aqueous medium. Alternatively, the result may be analytical in origin: more polar luteolin glycosides, preferentially recovered in water, could undergo in-source fragmentation and contribute to the monitored transition at m/z 286.75 → 153.00. Distinguishing between these possibilities would require chromatographic resolution of the intact glycosides. The predominance of most flavonoids in the hydroethanolic extract nevertheless aligns with the higher total flavonoid content and stronger SNPAC response recorded for this system (Section 3.2, Section 3.3 and Section 3.4), both determined independently of the chromatographic analysis.
Among other secondary metabolites, resveratrol gave a moderately higher relative peak area in the hydroethanolic extract, while curcumin and oleuropein were similar in both systems, and oleanolic acid was recovered preferentially in the aqueous extract. Glycosylation was not determining, since rutin favoured the hydroethanolic extract while oleuropein, also a glycoside, favoured the aqueous system. Given the number of compounds identified within each class, the structural relationships described above are presented as observations consistent with the present data rather than as established structure–solvent relationships.
Overall, despite comparable antioxidant activities between the two solvent systems (Section 3.1, Section 3.2, Section 3.3 and Section 3.4), the chemical profiles differed markedly: aqueous extraction favoured polar phenolic acids and simple aromatics, while hydroethanolic extraction favoured most flavonoids, supporting the compositional fractionation described in Section 3.4.
3.6. Cytotoxicity of the Optimised Extracts in Mammalian Cell Lines
The pooled optimised aqueous and hydroethanolic extracts from all three stages were evaluated in BHK21, IBRS2, MDBK, and Vero cells using a resazurin assay after 24 h of exposure to concentrations ranging from 0.2 to 6.5 mg/mL. Dose–response curves were fitted using a four-parameter logistic model, and the corresponding IC50 values are reported in Table 6 and illustrated in Figure 7.
Table 6.
IC50 (mg/mL) of the pooled aqueous and hydroethanolic extracts, and of ascorbic acid, in BHK21, IBRS2, MDBK and Vero cell lines after 24 h of exposure.
Figure 7.
Dose–response curves for the optimised aqueous and hydroethanolic M. pomifera leaf extracts and ascorbic acid in BHK21, IBRS2, MDBK, and Vero cells after 24 h of exposure, fitted using a four-parameter logistic model.
The hydroethanolic extract was more cytotoxic than the aqueous extract in all four cell lines. Its IC50 values were 3.10 mg/mL in BHK21, 3.02 mg/mL in IBRS2, 0.70 mg/mL in MDBK, and 1.60 mg/mL in Vero. The aqueous extract was less cytotoxic, with IC50 values of 6.42, 5.47, 5.40, and 5.19 mg/mL in BHK21, IBRS2, MDBK, and Vero, respectively. MDBK cells were the most sensitive to the hydroethanolic extract, while BHK21 cells were the least sensitive among the hydroethanolic-treated lines.
The residual–ethanol control did not differ from the PBS control, indicating that the stronger response observed for the hydroethanolic extract was not attributable to residual solvent under the conditions tested. Ascorbic acid produced the lowest IC50 values in all cell lines, with values of 0.57 mg/mL in BHK21, 0.39 mg/mL in IBRS2, <0.20 mg/mL in MDBK, and 0.36 mg/mL in Vero.
These results indicate that both plant extracts were less cytotoxic than ascorbic acid over the tested concentration range, although the hydroethanolic extract showed a clearly stronger effect than the aqueous extract. Ascorbic acid served as a reference for non-specific cytotoxicity rather than as a safety threshold. The greater response of the hydroethanolic extract may reflect its higher abundance of flavonoids and less polar constituents, but the present data do not identify the compounds responsible for the effect. These findings are consistent with other reports on M. pomifera, in which fruit extracts showed selective antiproliferative or pro-apoptotic effects in malignant cell lines and lower cytotoxicity on normal cell lines [16,109,110,111,112]. Data for the leaves remain scarce. Aqueous leaf extracts have been reported to cause no significant loss of viability or change in morphology in HEp-2 cells at concentrations up to 25 mg/mL over 24 h, while retaining antibacterial and antiviral activity [113]. These concentrations are not directly comparable with those reported here, since the cell line, the viability endpoint and the extract preparation all differ, but the direction of that result is consistent with the comparatively high IC50 values obtained for the aqueous extract in the present work.
The present cytotoxicity results should be interpreted as a preliminary in vitro screening rather than a full safety assessment. The resazurin assay primarily reflects cellular metabolic activity and does not reveal the mechanism of the response. In addition, the assay was limited to 24 h exposure and four cell lines. All four lines are of renal origin, and the panel does not include models of the epithelia that would be exposed first in the food, cosmetic and materials uses envisaged for these extracts. The results accordingly a support comparison between the two extracts and the reference antioxidant under common conditions, and do not constitute a tissue-specific or application-specific safety assessment.
Further work should therefore include additional non-tumour and primary cell models, longer or repeated exposures, and complementary assays addressing membrane integrity, apoptosis, and oxidative stress before any application-specific safety conclusions are drawn.
4. Conclusions
This study demonstrated the feasibility of a short, laboratory-scale crosscurrent extraction process for the valorisation of Maclura pomifera pruning leaves as a source of antioxidant-rich extracts. Water and aqueous ethanol produced comparable cumulative total phenolic contents, ABTS capacities, and PFRAP responses, whereas the hydroethanolic process gave higher total flavonoid content and SNPAC activity. These differences indicate that the choice of solvent and the sequence of extraction stages can be used not only to increase recovery but also to influence the composition and in vitro antioxidant characteristics of the resulting fractions.
The first stage accounted for approximately 65–77% of cumulative recovery for most measured responses, and the second stage provided a further 16–28%. In the aqueous process, these results indicate that two stages were sufficient to recover more than 90% of the cumulative TPC and ABTS response within approximately 15 min of effective contact time. The third stage therefore offered limited additional bulk phenolic recovery in water. In the hydroethanolic process, however, the ethanol-rich third stage contributed 39.2% of the cumulative flavonoid response and 28.8% of SNPAC, supporting its use as a targeted step for recovering a flavonoid-enriched fraction rather than simply as an additional exhaustion stage.
UPLC–ESI–MS/MS confirmed that the two solvent systems generated chemically different extracts. The aqueous extract generally contained higher relative levels of selected phenolic acids and simple aromatics, whereas the hydroethanolic extract was richer in several flavonoids, including naringenin, quercetin, rutin, and epicatechin. Luteolin did not follow this general trend and was more abundant in the aqueous extract, illustrating that solvent selectivity cannot be predicted solely from broad compound classes. The cytotoxicity results are preliminary. Both extracts gave higher IC50 values than ascorbic acid in the four cell lines after 24 h of exposure. This comparison was obtained under a single set of experimental conditions and does not establish the definitive safety of either extract.
Overall, the results support crosscurrent aqueous extraction as a simple route for recovering most of the polar antioxidant fraction from M. pomifera pruning leaves, with an optional ethanol-rich stage when flavonoid-oriented fractionation is desired. The process remains at laboratory scale, and the present work does not constitute an assessment of its environmental performance. Further studies should now address process scale-up to the pilot scale, solvent recycling to evaluate and enhance process sustainability, full gravimetric tracking of the solid phase to close a complete mass balance, and the valorisation of the residual solids, alongside comprehensive environmental impact assessments, specifically quantifying mass and energy balances, solvent recycling efficiencies, and life-cycle impacts. Additionally, broader toxicological and application-oriented studies are needed to define safe and effective use levels of the different fractions in specific food, cosmetic or green materials formulations.
Supplementary Materials
The following supporting information can be downloaded at: https://www.mdpi.com/article/10.3390/biomass6050092/s1, Table S1: Model-level ANOVA and goodness-of-fit summary for all response-surface models; Table S2: Raw experimental design and response data for all extraction stages; Table S3: Complete and reduced second-order model statistics for the aqueous system; Table S4: Complete and reduced second-order model statistics for the hydroethanolic extraction models; Table S5: Coded-variable second-order polynomial equations for all responses (TPC, TFC, ABTS, PFRAP, SNPAC) in the aqueous and hydroethanolic multistage extraction models; Table S6: UPLC-ESI-MS/MS transition parameters and relative peak areas in aqueous and hydroethanolic extracts; Table S7: Residual extractable phenolic content after the optimised three-stage crosscurrent process, determined by a single unoptimised extraction of the final solid residue under exhaustive conditions; Figure S1: Calibration curves for the spectrophotometric determinations: (a) total phenolic content against gallic acid; (b) total flavonoid content against quercetin; and (c) ABTS radical scavenging, (d) potassium ferricyanide reducing antioxidant power and (e) silver nanoparticle antioxidant capacity, each against ascorbic acid. Circles are the measured calibration points and the solid line the linear least-squares fit.
Author Contributions
All authors contributed to the study conception and design. Material preparation, experimentation, and data collection were performed by M.K. Experimental planning was performed by M.K., R.C. and N.M. Chemical analysis was performed by M.K. and M.M.-A. Data and statistical analysis were performed by M.K. and L.A. Resource acquisition and supervision were performed by N.M. and R.C. The first draft of the manuscript was written by M.K. and all authors commented on previous versions of the manuscript. All authors have read and agreed to the published version of the manuscript.
Funding
This research received no external funding.
Data Availability Statement
Data is contained within the article or Supplementary Material.
Acknowledgments
The authors would like to thank the BIOGEP laboratory at the Ecole Nationale Polytechnique for providing support to this project. The authors also acknowledge the National Institute of Veterinary Medicine of Algiers for kindly providing the cell lines used in this study. During the preparation of this manuscript, the authors used Perplexity (Pro, august 2026) and Paperpal v 4.32.20.0 to assist in refining technical phrasing and grammar and improving overall language fluency and formatting. All outputs were reviewed, edited, and validated by the authors, who assume full responsibility for the final content of this publication.
Conflicts of Interest
The authors declare no conflicts of interest.
References
- Oliveira, W.; Silva, J.L.S.; Tabarelli, M.; Lopes, A.V. Benefits of Urban Trees to People and Their Potential Contribution to All the 17 Sustainable Development Goals. Trees For. People 2026, 24, 101198. [Google Scholar] [CrossRef] [Scilit]
- Ryder, C.M.; Moore, G.M. The Arboricultural and Economic Benefits of Formative Pruning Street Trees. Arboric. Urban For. (AUF) 2013, 39, 17–24. [Google Scholar] [CrossRef] [Scilit]
- Muscas, D.; Orlandi, F.; Petrucci, R.; Proietti, C.; Ruga, L.; Fornaciari, M. Effects of Urban Tree Pruning on Ecosystem Services Performance. Trees For. People 2024, 15, 100503. [Google Scholar] [CrossRef] [Scilit]
- de Meira, A.M.; Nolasco, A.M.; de Souza, E.C.; de Souza, M.P.; Pereira, A.K.S.; Ucella-Filho, J.G.M.; Dias Júnior, A.F. Integrated Municipal Management of Waste from Tree Pruning and Removal. Urban For. Urban Green. 2024, 94, 128238. [Google Scholar] [CrossRef] [Scilit]
- Hagel, S.; Lüssenhop, P.; Walk, S.; Kirjoranta, S.; Ritter, A.; Bastidas Jurado, C.G.; Mikkonen, K.S.; Tenkanen, M.; Körner, I.; Saake, B. Valorization of Urban Street Tree Pruning Residues in Biorefineries by Steam Refining: Conversion into Fibers, Emulsifiers, and Biogas. Front. Chem. 2021, 9, 779609. [Google Scholar] [CrossRef] [Scilit] [PubMed]
- de Jesus Paula, R.; de Almeida Pereira, V.; Latorre, F.L.; Oliveira de Souza Nogueira, C.; de Almeida, I.A.; Freitas e Silva, P.A.; Ferreira, O.E.; de Lima, R.P.; da Silva Bezerra, A.C.; Machado, A.R.T. Pyrolysis Converts Urban Pruning Waste into Biochar with Soil and Climate Benefits. Sci. Rep. 2025, 15, 45071. [Google Scholar] [CrossRef] [Scilit] [PubMed]
- Granado, M.P.P.; Alves, G.L.; Correia, A.J.B.; Nanda, S.; Kozinski, J.A.; De Conti, A.C. Solid Biofuel Production from Torrefaction of Urban Tree Pruning Biomass Using a Combined Mixture-Process Experimental Design. Biomass Bioenergy 2026, 208, 108841. [Google Scholar] [CrossRef] [Scilit]
- Lo Giudice, V.; Faraone, I.; Bruno, M.R.; Ponticelli, M.; Labanca, F.; Bisaccia, D.; Massarelli, C.; Milella, L.; Todaro, L. Olive Trees By-Products as Sources of Bioactive and Other Industrially Useful Compounds: A Systematic Review. Molecules 2021, 26, 5081. [Google Scholar] [CrossRef] [Scilit] [PubMed]
- Rincón, E.; Espinosa, E.; Pinillos, M.; Serrano, L. Bioactive Absorbent Chitosan Aerogels Reinforced with Bay Tree Pruning Waste Nanocellulose with Antioxidant Properties for Burger Meat Preservation. Polymers 2023, 15, 866. [Google Scholar] [CrossRef] [Scilit] [PubMed]
- Valdebenito, F.; Ramírez-Álvarez, R.; Alexandra Muñoz, M.; Pecchi, G.; Canales, R.; Ormazabal, S.; Muñoz, R.; Alejandro-Martín, S.; Quero, F.; Adam, R.; et al. Biomass Characterization and Solvent Extraction as Tools to Promote Phenol Production from Urban Pruning. Fuel 2024, 362, 130830. [Google Scholar] [CrossRef] [Scilit]
- Tumminelli, E.; Cavalloro, V.; Ratto, D.; Marrubini, G.; Martino, E.; Rossi, P.; Rossi, D.; Collina, S. Unseparated Olive Pruning Waste as a Sustainable Feedstock: DoE-Optimized Extracts with Antioxidant Activity Equivalent to Isolated Leaves. Antioxidants 2025, 14, 1441. [Google Scholar] [CrossRef] [Scilit] [PubMed]
- Kurbaniyazov, B.; Matmuratov, M.; Nagashybaeva, A.; Perdebaeva, G. Bioecological Features of Ornamental Woody Plants in the Conditions of the City of Nukus. BIO Web Conf. 2025, 190, 01016. [Google Scholar] [CrossRef] [Scilit]
- Smith, J.L.; Perino, J.V. Osage Orange (Maclura pomifera): History and Economic Uses. Econ. Bot. 1981, 35, 24–41. [Google Scholar] [CrossRef] [Scilit]
- Arab, R.; Majd, A.; Tajadod, G.; Rezanejad, F.; Mirzaei, M. The Morphological and Anatomical Studies of Inflorescence, Flower, Embryo and Fruit Development in Maclura pomifera (Moraceae). Cogent Biol. 2019, 5, 1663698. [Google Scholar] [CrossRef] [Scilit]
- Sainz-Hernández, J.C.; Rueda-Puente, E.O.; Cornejo-Ramírez, Y.I.; Bernal-Mercado, A.T.; González-Ocampo, H.A.; López-Corona, B.E. Biological Application of the Allopathic Characteristics of the Genus Maclura: A Review. Plants 2023, 12, 3480. [Google Scholar] [CrossRef] [Scilit] [PubMed]
- Rumpa, M.M.; Maier, C. TRPV1-Dependent Antiproliferative Activity of Dioecious Maclura pomifera Extracts in Estrogen Receptor-Positive Breast Cancer Cell Lines Involves Multiple Apoptotic Pathways. Int. J. Mol. Sci. 2024, 25, 5258. [Google Scholar] [CrossRef] [Scilit] [PubMed]
- Bailly, C. Pharmacological Properties of Extracts and Prenylated Isoflavonoids from the Fruits of Osage Orange (Maclura pomifera (Raf.) C.K.Schneid.). Fitoterapia 2024, 177, 106112. [Google Scholar] [CrossRef] [Scilit] [PubMed]
- Gajić, I.; Dinić, A.; Stanojević, L.; Zvezdanović, J.; Nikolić, V.; Urošević, M.; Nikolić, L.; Savić, V. Osage Orange (Maclura pomifera (Raf.) Schneid) Fruit Extracts: UHPLC-DAD-ESI-MS/MS Analysis, Antioxidant Activity and in vivo Skin Tests. Nat. Prod. Res. 2024, 38, 3080–3085. [Google Scholar] [CrossRef] [Scilit] [PubMed]
- Lang, Y.; Gao, N.; Zang, Z.; Meng, X.; Lin, Y.; Yang, S.; Yang, Y.; Jin, Z.; Li, B. Classification and Antioxidant Assays of Polyphenols: A Review. J. Future Foods 2024, 4, 193–204. [Google Scholar] [CrossRef] [Scilit]
- Bhuyan, U.; Handique, J.G. Chapter 6—Plant Polyphenols as Potent Antioxidants: Highlighting the Mechanism of Antioxidant Activity and Synthesis/Development of Some Polyphenol Conjugates. In Studies in Natural Products Chemistry; Atta-ur-Rahman, Ed.; Elsevier: Amsterdam, The Netherlands, 2022; Volume 75, pp. 243–266. [Google Scholar] [CrossRef] [Scilit]
- Alara, O.R.; Abdurahman, N.H.; Ukaegbu, C.I. Extraction of Phenolic Compounds: A Review. Curr. Res. Food Sci. 2021, 4, 200–214. [Google Scholar] [CrossRef] [Scilit] [PubMed]
- Hernández-Montesinos, I.Y.; Carreón-Delgado, D.F.; Lazo-Zamalloa, O.; Tapia-López, L.; Rosas-Morales, M.; Ochoa-Velasco, C.E.; Hernández-Carranza, P.; Cruz-Narváez, Y.; Ramírez-López, C. Exploring Agro-Industrial By-Products: Phenolic Content, Antioxidant Capacity, and Phytochemical Profiling via FI-ESI-FTICR-MS Untargeted Analysis. Antioxidants 2024, 13, 925. [Google Scholar] [CrossRef] [Scilit] [PubMed]
- Shahidi, F. Antioxidants in Food and Food Antioxidants. Nahrung 2000, 44, 158–163. [Google Scholar] [CrossRef] [Scilit]
- Ji, X.; Liang, J.; Wang, Y.; Liu, X.; Li, Y.; Liu, Q.; Liu, R. Synthetic Antioxidants as Contaminants of Emerging Concern in Indoor Environments: Knowns and Unknowns. Environ. Sci. Technol. 2023, 57, 21550–21557. [Google Scholar] [CrossRef] [Scilit] [PubMed]
- Othón-Díaz, E.D.; Fimbres-García, J.O.; Flores-Sauceda, M.; Silva-Espinoza, B.A.; López-Martínez, L.X.; Bernal-Mercado, A.T.; Ayala-Zavala, J.F. Antioxidants in Oak (Quercus sp.): Potential Application to Reduce Oxidative Rancidity in Foods. Antioxidants 2023, 12, 861. [Google Scholar] [CrossRef] [Scilit] [PubMed]
- Rudrapal, M.; Rakshit, G.; Singh, R.P.; Garse, S.; Khan, J.; Chakraborty, S. Dietary Polyphenols: Review on Chemistry/Sources, Bioavailability/Metabolism, Antioxidant Effects, and Their Role in Disease Management. Antioxidants 2024, 13, 429. [Google Scholar] [CrossRef] [Scilit] [PubMed]
- Flieger, J.; Flieger, W.; Baj, J.; Maciejewski, R. Antioxidants: Classification, Natural Sources, Activity/Capacity Measurements, and Usefulness for the Synthesis of Nanoparticles. Materials 2021, 14, 4135. [Google Scholar] [CrossRef] [Scilit] [PubMed]
- Selvam, K.; Ragu Prasath, A.; Alanazi, A.K. A Review of Recent Developments in Green Synthesis of Silver Nanoparticles: Antioxidant and Antibacterial Applications. Microsc. Res. Tech. 2026, 89, 134–147. [Google Scholar] [CrossRef] [Scilit] [PubMed]
- Hernández, M.; Ventura, J.; Castro, C.; Boone, V.; Rojas, R.; Ascacio-Valdés, J.; Martínez-Ávila, G. UPLC-ESI-QTOF-MS2-Based Identification and Antioxidant Activity Assessment of Phenolic Compounds from Red Corn Cob (Zea mays L.). Molecules 2018, 23, 1425. [Google Scholar] [CrossRef] [Scilit] [PubMed]
- González-Domínguez, R.; Sayago, A.; Santos-Martín, M.; Fernández-Recamales, Á. High-Throughput Method for Wide-Coverage and Quantitative Phenolic Fingerprinting in Plant-Origin Foods and Urine Samples. J. Agric. Food Chem. 2022, 70, 7796–7804. [Google Scholar] [CrossRef] [Scilit] [PubMed]
- Madorran, E.; Stožer, A.; Bevc, S.; Maver, U. In Vitro Toxicity Model: Upgrades to Bridge the Gap between Preclinical and Clinical Research. Bosn. J. Basic Med. Sci. 2019, 20, 157–168. [Google Scholar] [CrossRef] [Scilit] [PubMed]
- Poh, W.T.; Stanslas, J. The New Paradigm in Animal Testing—“3Rs Alternatives”. Regul. Toxicol. Pharmacol. 2024, 153, 105705. [Google Scholar] [CrossRef] [Scilit] [PubMed]
- Husain, A.; Meenakshi, D.U.; Ahmad, A.; Shrivastava, N.; Khan, S.A. A Review on Alternative Methods to Experimental Animals in Biological Testing: Recent Advancement and Current Strategies. J. Pharm. Bioallied Sci. 2023, 15, 165–171. [Google Scholar] [CrossRef] [Scilit] [PubMed]
- Huang, H.-J.; Lee, Y.-H.; Hsu, Y.-H.; Liao, C.-T.; Lin, Y.-F.; Chiu, H.-W. Current Strategies in Assessment of Nanotoxicity: Alternatives to In Vivo Animal Testing. Int. J. Mol. Sci. 2021, 22, 4216. [Google Scholar] [CrossRef] [Scilit] [PubMed]
- Pearson, R.M. In-Vitro Techniques: Can They Replace Animal Testing? Hum. Reprod. 1986, 1, 559–560. [Google Scholar] [CrossRef] [Scilit] [PubMed]
- Sun, H.; Xia, M.; Austin, C.P.; Huang, R. Paradigm Shift in Toxicity Testing and Modeling. AAPS J. 2012, 14, 473–480. [Google Scholar] [CrossRef] [Scilit] [PubMed]
- Joshi, P.; Kang, S.-Y.; Yu, K.-N.; Kothapalli, C.; Lee, M.-Y. High-Content Imaging of 3D-Cultured Neural Stem Cells on a 384-Pillar Plate for the Assessment of Cytotoxicity. Toxicol. In Vitro 2020, 65, 104765. [Google Scholar] [CrossRef] [Scilit] [PubMed]
- Caloni, F.; De Angelis, I.; Hartung, T. Replacement of Animal Testing by Integrated Approaches to Testing and Assessment (IATA): A Call for in Vivitrosi. Arch. Toxicol. 2022, 96, 1935–1950. [Google Scholar] [CrossRef] [Scilit] [PubMed]
- Ledinski, M.; Caput Mihalić, K.; Šimić Jovičić, M.; Ostojić, K.; Škibola, Z.; Kolundžić, R.; Urlić, I. Dehydroascorbic Acid Induces Cell Death in Sarcoma Stem Cells Under bFGF-Mediated Stemness-Supporting Conditions. Antioxidants 2025, 14, 1376. [Google Scholar] [CrossRef] [Scilit] [PubMed]
- Sato, A.; Kondo, Y.; Ishigami, A. The Evidence to Date: Implications of l-Ascorbic Acid in the Pathophysiology of Aging. J. Physiol. Sci. 2024, 74, 29. [Google Scholar] [CrossRef] [Scilit] [PubMed]
- Dodevska, T.; Hadzhiev, D.; Shterev, I. A Review on Electrochemical Microsensors for Ascorbic Acid Detection: Clinical, Pharmaceutical, and Food Safety Applications. Micromachines 2022, 14, 41. [Google Scholar] [CrossRef] [Scilit] [PubMed]
- Doseděl, M.; Jirkovský, E.; Macáková, K.; Krčmová, L.; Javorská, L.; Pourová, J.; Mercolini, L.; Remião, F.; Nováková, L.; Mladěnka, P.; et al. Vitamin C—Sources, Physiological Role, Kinetics, Deficiency, Use, Toxicity, and Determination. Nutrients 2021, 13, 615. [Google Scholar] [CrossRef] [Scilit] [PubMed]
- Maslov, A.; Komisarenko, M.; Kolesnik, S.; Sebiy, S.; Kostina, T.; Moroz, V.; Ahmedov, E. Comparison of Chemical Composition and Antioxidant Activity from Fresh and Dried Osage Orange (Maclura pomifera) Fruits Extracts. Ann. Mechnikov Inst. 2023, 3, 49–54. [Google Scholar] [CrossRef]
- Osorio-Tobón, J.F. Recent Advances and Comparisons of Conventional and Alternative Extraction Techniques of Phenolic Compounds. J. Food Sci. Technol. 2020, 57, 4299–4315. [Google Scholar] [CrossRef] [Scilit] [PubMed]
- Bitwell, C.; Indra, S.S.; Luke, C.; Kakoma, M.K. A Review of Modern and Conventional Extraction Techniques and Their Applications for Extracting Phytochemicals from Plants. Sci. Afr. 2023, 19, e01585. [Google Scholar] [CrossRef] [Scilit]
- Vu, G.T.; Lehr, A.; Seidel-Morgenstern, A. Short-Cut Model to Design an Efficient Continuous Counter-Current Extraction Process Applied to Recover Artemisinin from Artemisia annua. Chem. Eng. J. 2026, 527, 171458. [Google Scholar] [CrossRef] [Scilit]
- Manyele, S.V. Analysis of the Factors Affecting the Oil Recovery from Oilseeds in a Multistage Crosscurrent Leaching Process. Tanzan. J. Eng. Technol. 2024, 43, 1–22. [Google Scholar] [CrossRef] [Scilit]
- Cansino-Jácome, F.; Méndez-Campos, G.K.; Hidalgo-Morales, M.; García-Alvarado, M.A.; Rodríguez-Jimenes, G.C. Extraction of Bioactive Compounds from Papaya Leaves (Carica papaya L.) by Multistage Countercurrent Extraction as Function of Solvent Polarity and Temperature. Food Chem. 2025, 488, 144824. [Google Scholar] [CrossRef] [Scilit] [PubMed]
- Herrero, M. Towards Green Extraction of Bioactive Natural Compounds. Anal. Bioanal. Chem. 2024, 416, 2039–2047. [Google Scholar] [CrossRef] [Scilit] [PubMed]
- Chemat, F.; Vian, M.A.; Cravotto, G. Green Extraction of Natural Products: Concept and Principles. Int. J. Mol. Sci. 2012, 13, 8615–8627. [Google Scholar] [CrossRef] [Scilit] [PubMed]
- Alazaiza, M.Y.D.; Mokaizh, A.A.B.; Nour, A.H.; Alzghoul, T.M.; Baarimah, A.O. Green Extraction of Natural Products: A Bibliometric Review of Global Research Trends, Technological Advances, and Environmental Implications. Results Eng. 2026, 29, 108913. [Google Scholar] [CrossRef] [Scilit]
- de Souza Mesquita, L.M.; Contieri, L.S.; E Silva, F.A.; Bagini, R.H.; Bragagnolo, F.S.; Strieder, M.M.; Sosa, F.H.B.; Schaeffer, N.; Freire, M.G.; Ventura, S.P.M.; et al. Path2Green: Introducing 12 Green Extraction Principles and a Novel Metric for Assessing Sustainability in Biomass Valorization. Green Chem. 2024, 26, 10087–10106. [Google Scholar] [CrossRef] [Scilit] [PubMed]
- Tan, J.; Yu, D.; Yuan, J.; Wu, H.; Luo, H.; Zhang, H.; Li, X.; Li, H.; Yang, S. Efficient Delignification of Wheat Straw for Microbial Lipid Production Enabled by a Novel Ternary Deep Eutectic Solvent Containing Ethylene Glycol. Fuel 2023, 347, 128485. [Google Scholar] [CrossRef] [Scilit]
- Wang, H.; Chen, J.; Pei, Z.; Huang, J.; Wang, J.; Yang, S.; Li, H. Enhancing Lignocellulosic Biorefinery Sustainability: Mechanisms and Optimization of Microwave-Responsive Deep Eutectic Solvents for Rapid Delignification. Biofuel Res. J. 2025, 12, 2306–2318. [Google Scholar] [CrossRef] [Scilit]
- Antony, A.; Farid, M. Effect of Temperatures on Polyphenols during Extraction. Appl. Sci. 2022, 12, 2107. [Google Scholar] [CrossRef] [Scilit]
- Chaves, J.O.; De Souza, M.C.; Da Silva, L.C.; Lachos-Perez, D.; Torres-Mayanga, P.C.; Machado, A.P.D.F.; Forster-Carneiro, T.; Vázquez-Espinosa, M.; González-de-Peredo, A.V.; Barbero, G.F.; et al. Extraction of Flavonoids From Natural Sources Using Modern Techniques. Front. Chem. 2020, 8, 507887. [Google Scholar] [CrossRef] [Scilit] [PubMed]
- Spigno, G.; Tramelli, L.; De Faveri, D.M. Effects of Extraction Time, Temperature and Solvent on Concentration and Antioxidant Activity of Grape Marc Phenolics. J. Food Eng. 2007, 81, 200–208. [Google Scholar] [CrossRef] [Scilit]
- Ebrahimi, P.; Bayram, I.; Mihaylova, D.; Lante, A. A Strategy to Minimize the Chlorophyll Content in the Phenolic Extract of Sugar Beet Leaves: Can This Extract Work as a Natural Antioxidant in Vegetable Oils? Food Bioprocess Technol. 2025, 18, 2493–2506. [Google Scholar] [CrossRef] [Scilit]
- Singleton, V.L.; Orthofer, R.; Lamuela-Raventós, R.M. [14] Analysis of Total Phenols and Other Oxidation Substrates and Antioxidants by Means of Folin-Ciocalteu Reagent. In Methods in Enzymology; Elsevier: Amsterdam, The Netherlands, 1999; Volume 299, pp. 152–178. [Google Scholar] [CrossRef] [Scilit]
- Chang, C.-C.; Yang, M.-H.; Wen, H.-M.; Chern, J.-C. Estimation of Total Flavonoid Content in Propolis by Two Complementary Colometric Methods. J. Food Drug Anal. 2002, 10, 3. [Google Scholar] [CrossRef] [Scilit]
- Xiao, F.; Xu, T.; Lu, B.; Liu, R. Guidelines for Antioxidant Assays for Food Components. Food Front. 2020, 1, 60–69. [Google Scholar] [CrossRef] [Scilit]
- Stajčić, S.; Ćetković, G.; Tumbas Šaponjac, V.; Travičić, V.; Ilić, P.; Brunet, S.; Tomić, A. Bioactive Compounds and the Antioxidant Activity of Selected Vegetable Microgreens: A Correlation Study. Processes 2024, 12, 1743. [Google Scholar] [CrossRef] [Scilit]
- Fratelli, C.; Burck, M.; Amarante, M.C.A.; Braga, A.R.C. Antioxidant Potential of Nature’s “Something Blue”: Something New in the Marriage of Biological Activity and Extraction Methods Applied to C-Phycocyanin. Trends Food Sci. Technol. 2021, 107, 309–323. [Google Scholar] [CrossRef] [Scilit]
- Munteanu, I.G.; Apetrei, C. Analytical Methods Used in Determining Antioxidant Activity: A Review. Int. J. Mol. Sci. 2021, 22, 3380. [Google Scholar] [CrossRef] [Scilit] [PubMed]
- Alam, M.N.; Bristi, N.J.; Rafiquzzaman, M. Review on in vivo and in vitro Methods Evaluation of Antioxidant Activity. Saudi Pharm. J. 2013, 21, 143–152. [Google Scholar] [CrossRef] [Scilit] [PubMed]
- Özyürek, M.; Güngör, N.; Baki, S.; Güçlü, K.; Apak, R. Development of a Silver Nanoparticle-Based Method for the Antioxidant Capacity Measurement of Polyphenols. Anal. Chem. 2012, 84, 8052–8059. [Google Scholar] [CrossRef] [Scilit] [PubMed]
- Sunil, D.; Kamath, P.R.; Raghu Chandrashekhar, H. In Vitro Bioassay Techniques for Anticancer Drug Discovery and Development, 1st ed.; Sunil, D., Kamath, P.R., Raghu Chandrashekhar, H., Eds.; CRC Press: Boca Raton, FL, USA, 2017. [Google Scholar]
- Drużyńska, B.; Łukasiewicz, J.; Majewska, E.; Wołosiak, R. Optimization of the Extraction Conditions of Polyphenols from Red Clover (Trifolium pratense L.) Flowers and Evaluation of the Antiradical Activity of the Resulting Extracts. Antioxidants 2024, 13, 414. [Google Scholar] [CrossRef] [Scilit] [PubMed]
- Alanzi, H.; Alenezi, H.; Adeyi, O.; Adeyi, A.J.; Olusola, E.; Gan, C.-Y.; Olalere, O.A. Process Optimization, Multi-Gene Genetic Programming Modeling and Reliability Assessment of Bioactive Extracts Recovery from Phyllantus emblica. J. Eng. Res. 2025, 13, 453–471. [Google Scholar] [CrossRef] [Scilit]
- Hazra, S.; Ray, A.S.; Das, S.; Das Gupta, A.; Rahaman, C.H. Phytochemical Profiling, Biological Activities, and In Silico Molecular Docking Studies of Causonis trifolia (L.) Mabb. & J.Wen Shoot. Plants 2023, 12, 1495. [Google Scholar] [CrossRef] [Scilit] [PubMed]
- Baron, G.; Ferrario, G.; Marinello, C.; Carini, M.; Morazzoni, P.; Aldini, G. Effect of Extraction Solvent and Temperature on Polyphenol Profiles, Antioxidant and Anti-Inflammatory Effects of Red Grape Skin By-Product. Molecules 2021, 26, 5454. [Google Scholar] [CrossRef] [Scilit] [PubMed]
- Kasapoğlu, K.N.; Demircan, E.; Gültekin-Özgüven, M.; Kruger, J.; Frank, J.; Arslaner, A.; Özçelik, B. Recovery of Polyphenols Using Pressurized Hot Water Extraction (PHWE) from Black Rosehip Followed by Encapsulation for Increased Bioaccessibility and Antioxidant Activity. Molecules 2022, 27, 6807. [Google Scholar] [CrossRef] [Scilit] [PubMed]
- Shi, Y.; Ma, Y.; Li, R.; Zhang, R.; Song, Z.; Lu, Y.; Chen, Z.; Wang, Y.; Wu, Y. Deep Learning Enabled Optimization and Mass Transfer Mechanism in Ultrasound-Assisted Enzymatic Extraction of Polyphenols from Tartary Buckwheat Hulls. Foods 2025, 14, 2915. [Google Scholar] [CrossRef] [Scilit] [PubMed]
- Sharma, K.; Ko, E.Y.; Assefa, A.D.; Ha, S.; Nile, S.H.; Lee, E.T.; Park, S.W. Temperature-Dependent Studies on the Total Phenolics, Flavonoids, Antioxidant Activities, and Sugar Content in Six Onion Varieties. J. Food Drug Anal. 2015, 23, 243–252. [Google Scholar] [CrossRef] [Scilit] [PubMed]
- Valencia-Pérez, N.S.; Garrido-Hernández, A.; Yáñez-Fernández, J.; Cerón-Montes, G.I. Extraction Kinetic Modelling of Polyphenols from Artichoke Bracts Using a System with Continuous Detection by Ultraviolet–Visible Monitoring. Int. J. Food Sci. Technol. 2026, 61, vvaf284. [Google Scholar] [CrossRef] [Scilit]
- Bayram, Y. Optimizing the Extraction of Polyphenols from Prunus spinosa L. Fruit Using Response Surface Methodology and Production of Powders from Optimized Extracts by Foam Mat Drying. J. Food Meas. Charact. 2024, 18, 6673–6686. [Google Scholar] [CrossRef] [Scilit]
- Duarah, P.; Joardar, S.; Debnath, B.; Purkait, M.K. Optimized Extraction of Polyphenols from Tea Factory Waste and Cost-Effective Drying Methods for Sustainable Utilization. Bioresour. Technol. Rep. 2024, 26, 101833. [Google Scholar] [CrossRef] [Scilit]
- Marillán, C.; Uquiche, E. Extraction of Bioactive Compounds from Leptocarpha rivularis Stems by Three-Stage Sequential Supercritical Extraction in Fixed Bed Extractor Using CO2 and Ethanol-Modified CO2. J. Supercrit. Fluids 2023, 197, 105903. [Google Scholar] [CrossRef] [Scilit]
- Kiss, A.; Rapi, S.; Korozs, M.; Forgo, P. Elaboration of Novel Extraction Procedure to Reveal Bioactive Component Profile of Anthocyanin-Rich Plants. Czech. J. Food Sci. 2014, 32, 384–390. [Google Scholar] [CrossRef] [Scilit]
- Gómez-Cruz, I.; Contreras, M.D.M.; Romero, I.; Castro, E. Sequential Extraction of Hydroxytyrosol, Mannitol and Triterpenic Acids Using a Green Optimized Procedure Based on Ultrasound. Antioxidants 2021, 10, 1781. [Google Scholar] [CrossRef] [Scilit] [PubMed]
- Klongdee, S.; Klinkesorn, U. Optimization of Accelerated Aqueous Ethanol Extraction to Obtain a Polyphenol-Rich Crude Extract from Rambutan (Nephelium lappaceum L.) Peel as Natural Antioxidant. Sci. Rep. 2022, 12, 21153. [Google Scholar] [CrossRef] [Scilit] [PubMed]
- Natolino, A.; Passaghe, P.; Brugnera, G.; Comuzzo, P. Intensification of Grape Marc (Vitis vinifera) Exploitation by Subcritical Water-Ethanol Extraction: Effect on Polyphenol Bioactivities and Kinetic Modelling. J. Food Eng. 2024, 381, 112185. [Google Scholar] [CrossRef] [Scilit]
- Weremfo, A.; Adulley, F.; Adarkwah-Yiadom, M. Simultaneous Optimization of Microwave-Assisted Extraction of Phenolic Compounds and Antioxidant Activity of Avocado (Persea americana Mill.) Seeds Using Response Surface Methodology. J. Anal. Methods Chem. 2020, 2020, 7541927. [Google Scholar] [CrossRef] [Scilit] [PubMed]
- Mohamed Ahmed, I.A.; Al-Juhaimi, F.; Adisa, A.R.; Adiamo, O.Q.; Babiker, E.E.; Osman, M.A.; Gassem, M.A.; Ghafoor, K.; Alqah, H.A.S.; Elkareem, M.A. Optimization of Ultrasound-Assisted Extraction of Phenolic Compounds and Antioxidant Activity from Argel (Solenostemma argel Hayne) Leaves Using Response Surface Methodology (RSM). J. Food Sci. Technol. 2020, 57, 3071–3080. [Google Scholar] [CrossRef] [Scilit] [PubMed]
- Upadhyay, R.; Nachiappan, G.; Mishra, H.N. Ultrasound-Assisted Extraction of Flavonoids and Phenolic Compounds from Ocimum tenuiflorum Leaves. Food Sci. Biotechnol. 2015, 24, 1951–1958. [Google Scholar] [CrossRef] [Scilit]
- Chiguvare, H.; Oyedeji, O.; Matewu, R.; Aremu, O.; Oyemitan, I.; Oyedeji, A.; Nkeh-Chungag, B.; Songca, S.; Mohan, S.; Oluwafemi, O. Synthesis of Silver Nanoparticles Using Buchu Plant Extracts and Their Analgesic Properties. Molecules 2016, 21, 774. [Google Scholar] [CrossRef] [Scilit] [PubMed]
- Gul, A.; Fozia; Shaheen, A.; Ahmad, I.; Khattak, B.; Ahmad, M.; Ullah, R.; Bari, A.; Ali, S.S.; Alobaid, A.; et al. Green Synthesis, Characterization, Enzyme Inhibition, Antimicrobial Potential, and Cytotoxic Activity of Plant Mediated Silver Nanoparticle Using Ricinus communis Leaf and Root Extracts. Biomolecules 2021, 11, 206. [Google Scholar] [CrossRef] [Scilit] [PubMed]
- Muthu, K.; Rini, S.; Nagasundari, S.M.; Akilandaeaswari, B. Photocatalytic Reduction and Antioxidant Potential of Green Synthesized Silver Nanoparticles from Catharanthus roseus Flower Extract. Inorg. Nano-Metal Chem. 2021, 51, 579–589. [Google Scholar] [CrossRef] [Scilit]
- De Souza, C.G.; Rodrigues, T.H.; E Silva, L.M.; Ribeiro, P.R.; De Brito, E.S. Sequential Extraction of Flavonoids and Pectin from Yellow Passion Fruit Rind Using Pressurized Solvent or Ultrasound. J. Sci. Food Agric. 2018, 98, 1362–1368. [Google Scholar] [CrossRef] [Scilit] [PubMed]
- Birhanie, Z.M.; Xiao, A.; Yang, D.; Huang, S.; Zhang, C.; Zhao, L.; Liu, L.; Li, J.; Chen, A.; Tang, H.; et al. Polysaccharides, Total Phenolic, and Flavonoid Content from Different Kenaf (Hibiscus cannabinus L.) Genotypes and Their Antioxidants and Antibacterial Properties. Plants 2021, 10, 1900. [Google Scholar] [CrossRef] [Scilit] [PubMed]
- Ni, D.; Chen, C.; Yang, Y.; Tian, J.; Tu, H.; Yang, F.; Ye, X. Changes in Polyphenols and Antioxidant Activity in Fermentation Substrate during Maotai-Flavored Liquor Processing. Foods 2024, 13, 1928. [Google Scholar] [CrossRef] [Scilit] [PubMed]
- Sawicki, T.; Jabłońska, M.; Danielewicz, A.; Przybyłowicz, K.E. Phenolic Compounds Profile and Antioxidant Capacity of Plant-Based Protein Supplements. Molecules 2024, 29, 2101. [Google Scholar] [CrossRef] [Scilit] [PubMed]
- Yaglioglu, A.S.; Erenler, R.; Gecer, E.N.; Yildiz, I.; Genc, N.; Temiz, C.; Yanar, Y. Evaluation of Antioxidant Activities of Silver Nanoparticles Synthesized by Aqueous Extract of Maclura pomifera (Raf.) Schneid. Fruit. J. Nano Res. 2025, 90, 123–133. [Google Scholar] [CrossRef] [Scilit]
- Liu, L.; Yu, C.; Ahmad, S.; Ri, C.; Tang, J. Preferential Role of Distinct Phytochemicals in Biosynthesis and Antibacterial Activity of Silver Nanoparticles. J. Environ. Manag. 2023, 344, 118546. [Google Scholar] [CrossRef] [Scilit] [PubMed]
- Ferreira, M.C.; Gonçalves, D.; Bessa, L.C.B.A.; Rodrigues, C.E.C.; Meirelles, A.J.A.; Batista, E.A.C. Soybean Oil Extraction with Ethanol from Multiple-Batch Assays to Reproduce a Continuous, Countercurrent, and Multistage Equipment. Chem. Eng. Process.-Process Intensif. 2022, 170, 108659. [Google Scholar] [CrossRef] [Scilit]
- Yuan, X.; Jiang, T.; Tay, C.Y.; He, Y.; Wang, H.; Zhang, G. Magnetization Roasting Combined with Multi-Stage Extraction for Selective Recovery of Lithium from Spent Lithium-Ion Batteries. Sep. Purif. Technol. 2024, 338, 126349. [Google Scholar] [CrossRef] [Scilit]
- Boukettaya, N.; Mhemdi, H.; Kechaou, N. Multi-Stage Microwave-Assisted Extraction of Phenolic Compounds from Tunisian Walnut (Juglans regia L.) Bark. Processes 2025, 13, 2914. [Google Scholar] [CrossRef] [Scilit]
- Irfan, S.; Ranjha, M.; Nadeem, M.; Safdar, M.; Jabbar, S.; Mahmood, S.; Murtaza, M.; Ameer, K.; Ibrahim, S. Antioxidant Activity and Phenolic Content of Sonication- and Maceration-Assisted Ethanol and Acetone Extracts of Cymbopogon citratus Leaves. Separations 2022, 9, 244. [Google Scholar] [CrossRef] [Scilit]
- Ang, A.M.G.; Enot, M.M.; Baltazar, G.J.D.; Alinapon, C.V.; Buncales, E.O.; Barbosa, G.B. Antioxidant and Cytotoxic Activity of the Leaf Ethanolic Extracts of Tithonia diversofilia and Gliricidia sepium from Bukidnon, Philippines. Asian J. Biol. Life Sci. 2019, 8, 8–15. [Google Scholar] [CrossRef] [Scilit]
- Kaur, K.; Schmitt-Kopplin, P.; Malik, A.K. Green and Efficient Extraction of Phenolic Compounds from Neem Leaves Using Deep Eutectic Solvents Based Ultrasonic-Assisted Extraction. Food Chem. 2024, 451, 139500. [Google Scholar] [CrossRef] [Scilit] [PubMed]
- Wang, Z.; Tian, Y.; Yang, M.; Yang, J.; Wang, Y.; Tao, L.; Sheng, J.; Shi, C. Extraction of Phenolic Compounds from Moringa oleifera Lam. Leaves with Ultrasonic-Assisted Deep Eutectic Solvents. Front. Nutr. 2024, 11, 1405128. [Google Scholar] [CrossRef] [Scilit] [PubMed]
- Barjoveanu, G.; Pătrăuțanu, O.-A.; Teodosiu, C.; Volf, I. Life Cycle Assessment of Polyphenols Extraction Processes from Waste Biomass. Sci. Rep. 2020, 10, 13632. [Google Scholar] [CrossRef] [Scilit] [PubMed]
- Salzano De Luna, M.; Vetrone, G.; Viggiano, S.; Panzella, L.; Marotta, A.; Filippone, G.; Ambrogi, V. Pine Needles as a Biomass Resource for Phenolic Compounds: Trade-Off between Efficiency and Sustainability of the Extraction Methods by Life Cycle Assessment. ACS Sustain. Chem. Eng. 2023, 11, 4670–4677. [Google Scholar] [CrossRef] [Scilit]
- Carpentieri, S.; Ghanem, A.; Khwaldia, K.; Silva, A.S.; Ferrari, G. Life Cycle Assessment of Agro-Industrial Residues Valorization Processes to Obtain Phenolic-Rich Extracts. Front. Sustain. Food Syst. 2025, 9, 1693181. [Google Scholar] [CrossRef] [Scilit]
- Voccia, D.; Milvanni, G.; Leni, G.; Lamastra, L. Life Cycle Assessment and Circular Economy Evaluation of Extraction Techniques: Energy Analysis of Antioxidant Recovery from Wine Residues. Energies 2025, 18, 4851. [Google Scholar] [CrossRef] [Scilit]
- Martín-García, B.; Aznar-Ramos, M.J.; Verardo, V.; Gómez-Caravaca, A.M. The Establishment of Ultrasonic-Assisted Extraction for the Recovery of Phenolic Compounds and Evaluation of Their Antioxidant Activity from Morus alba Leaves. Foods 2022, 11, 314. [Google Scholar] [CrossRef] [Scilit] [PubMed]
- Alshaal, S.; Daghestani, M.; Karabet, F. Determination of the Isolated Rutin and Quercetin Contents in Syrian Ficus carica L. Leaves Extracts. J. Turk. Chem. Soc. Sect. A Chem. 2020, 7, 197–206. [Google Scholar] [CrossRef] [Scilit][Green Version]
- Batiha, G.E.-S.; Al-Snafi, A.E.; Thuwaini, M.M.; Teibo, J.O.; Shaheen, H.M.; Akomolafe, A.P.; Teibo, T.K.A.; Al-kuraishy, H.M.; Al-Garbeeb, A.I.; Alexiou, A.; et al. Morus Alba: A Comprehensive Phytochemical and Pharmacological Review. Naunyn-Schmiedeberg’s Arch. Pharmacol. 2023, 396, 1399–1413. [Google Scholar] [CrossRef] [Scilit] [PubMed]
- Zhao, D.; Yao, C.; Chen, X.; Xia, H.; Zhang, L.; Liu, H.; Jiang, X.; Dai, Y.; Liu, J. The Fruits of Maclura pomifera Extracts Inhibits Glioma Stem-Like Cell Growth and Invasion. Neurochem. Res. 2013, 38, 2105–2113. [Google Scholar] [CrossRef] [Scilit] [PubMed]
- Polbuppha, I.; Maneerat, W.; Sripisut, T.; Limtharakul (Née Ritthiwigrom), T.; Cheenpracha, S.; Pyne, S.G.; Muanprasat, C.; Seemakhan, S.; Borwornpinyo, S.; Laphookhieo, S. Antioxidant, Cytotoxic and α-Glucosidase Inhibitory Activities of Compounds Isolated from the Twig Extracts of Maclura fruticosa. Nat. Prod. Commun. 2017, 12, 1934578X1701200718. [Google Scholar] [CrossRef] [Scilit]
- Su, Z.; Wang, P.; Yuan, W.; Grant, G.; Li, S. Phenolics from the Fruits of Maclura pomifera. Nat. Prod. Commun. 2017, 12, 1934578X1701201122. [Google Scholar] [CrossRef] [Scilit]
- Saeed, S.; Khan, M.I.A.; Ayesha, S.; Zahid, Z.; Younis, M.; Kashan, M.W.; Khan, G.Z.; Tahir, M.; Khan, S.A.; Kamal, M.; et al. Screening of Phytochemicals and Anticancer Potential of Maclura pomifera Leaves Extract. Pak. J. Med. Health Sci. 2023, 17, 468–471. [Google Scholar] [CrossRef] [Scilit]
- Nenadovich, M.; Kubal, M.; Hopp, M.R.; Crawford, A.D.; Hardewig, M.E.; Sedlock, M.G.; Jawad, R.; Khan, Z.A.; Smith, A.M.; Mroueh, M.A.; et al. Osage Orange (Maclura pomifera) and Spearmint (Mentha spicata) Leaf Extracts Exhibit Antibacterial Activity and Inhibit Human Respiratory Syncytial Virus (hRSV). Pathogens 2025, 14, 776. [Google Scholar] [CrossRef] [Scilit] [PubMed]
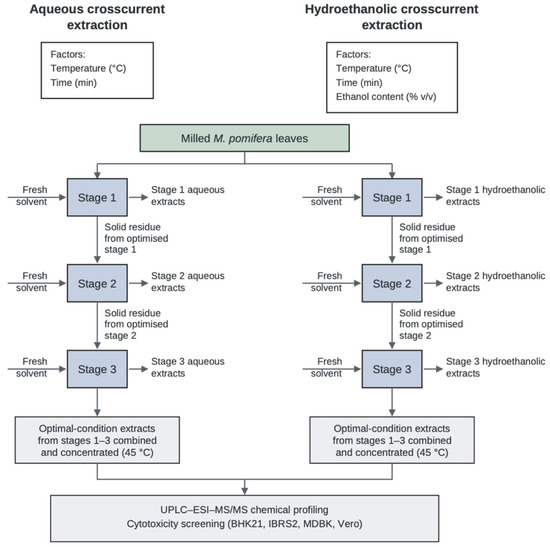
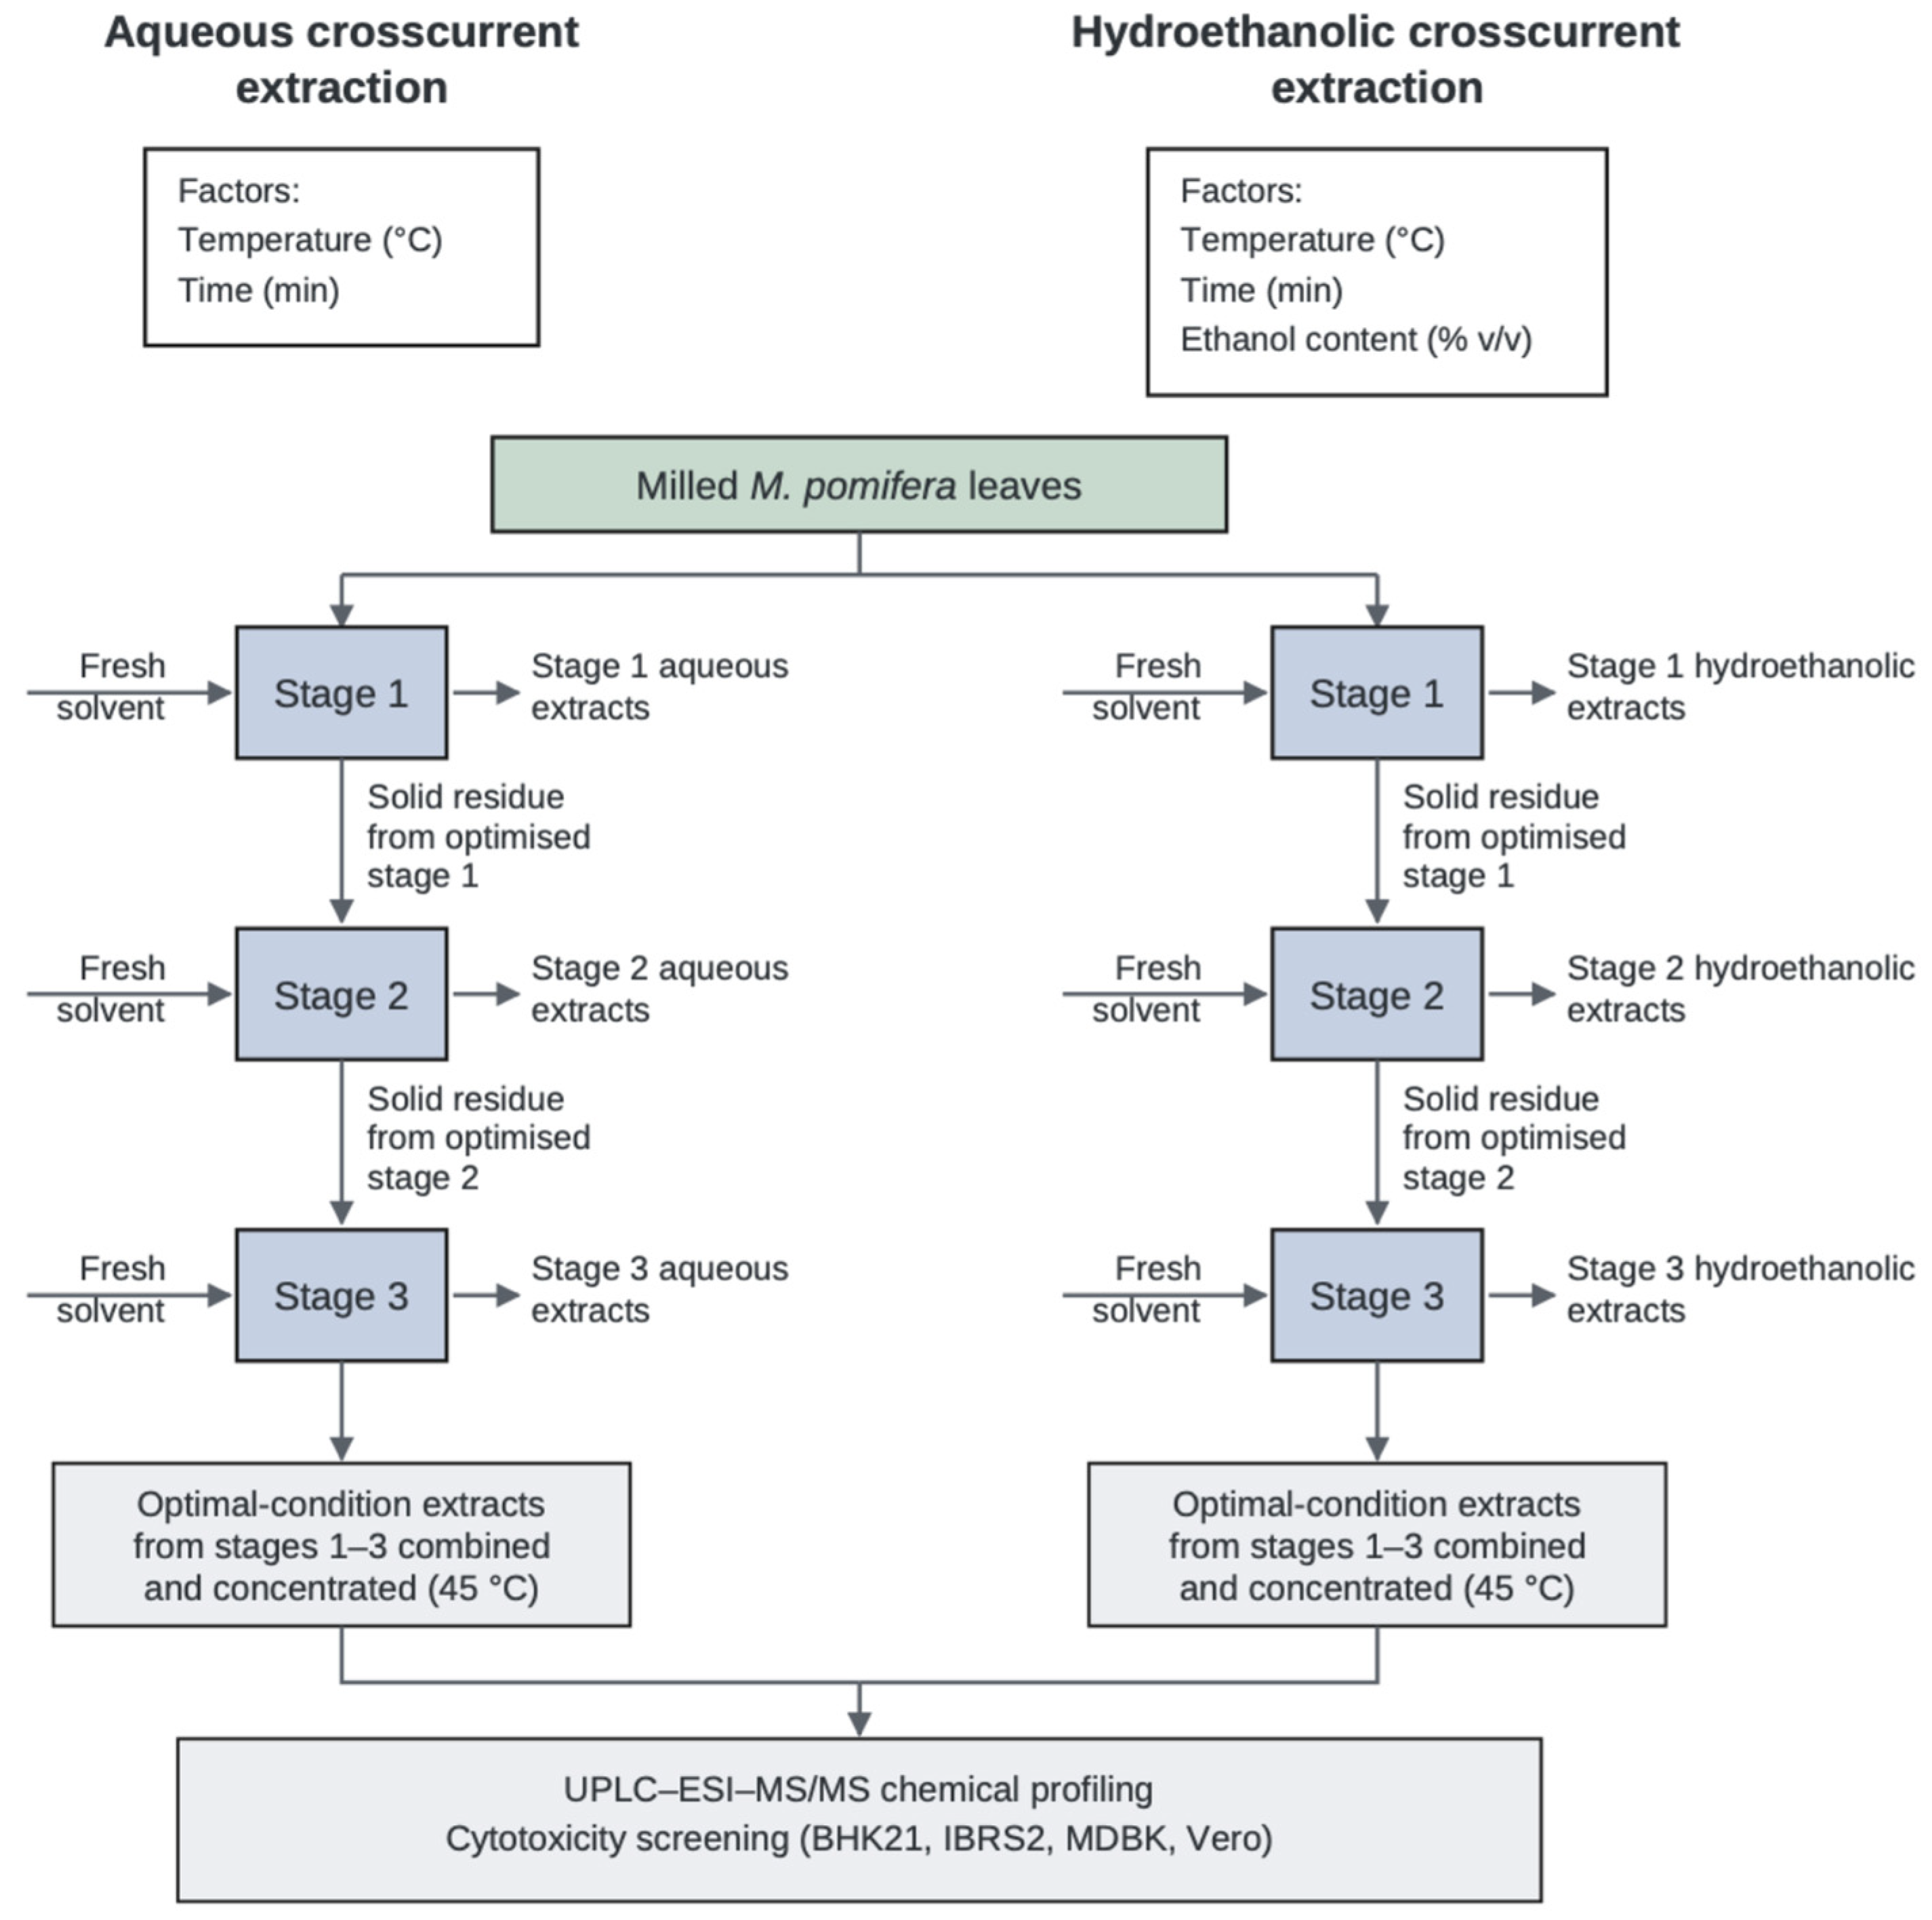
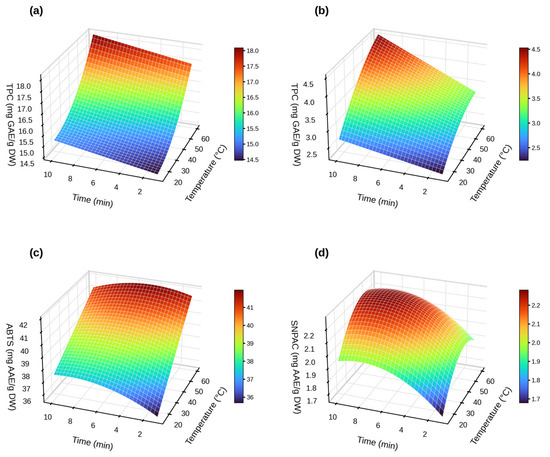
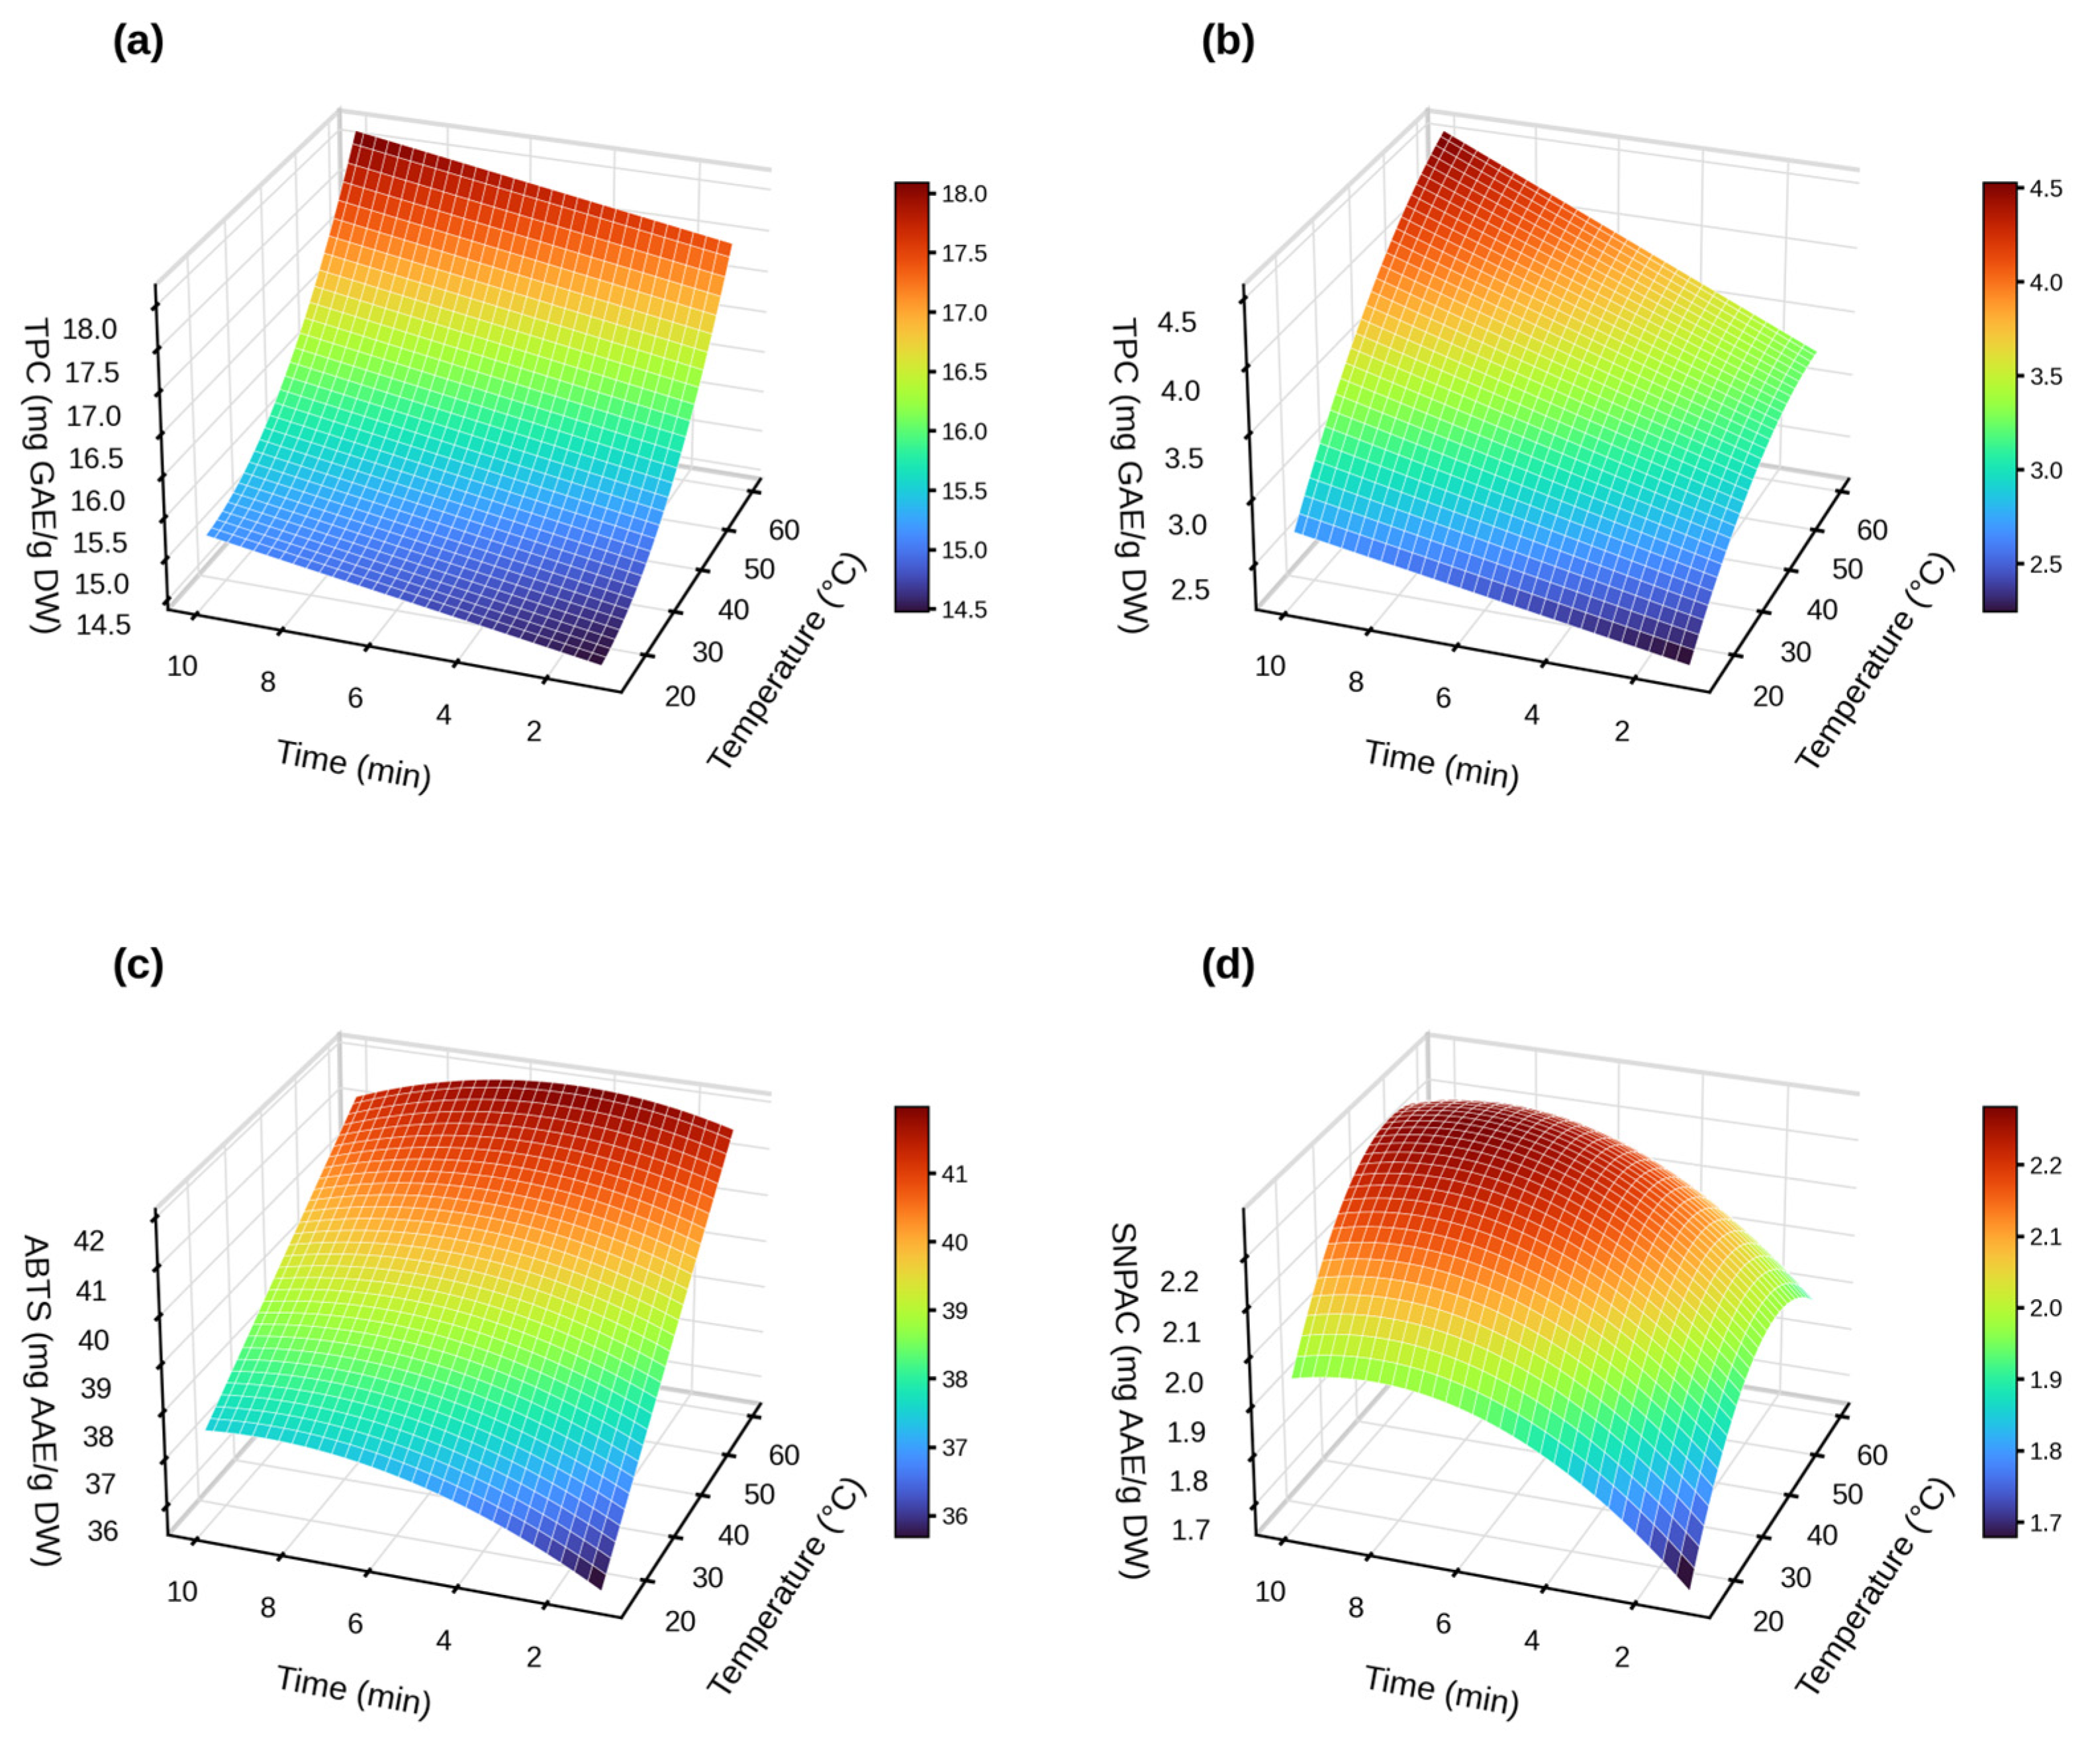
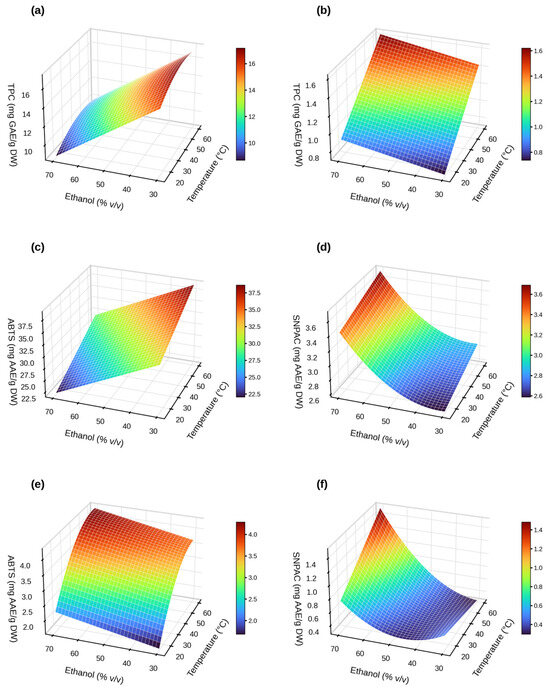
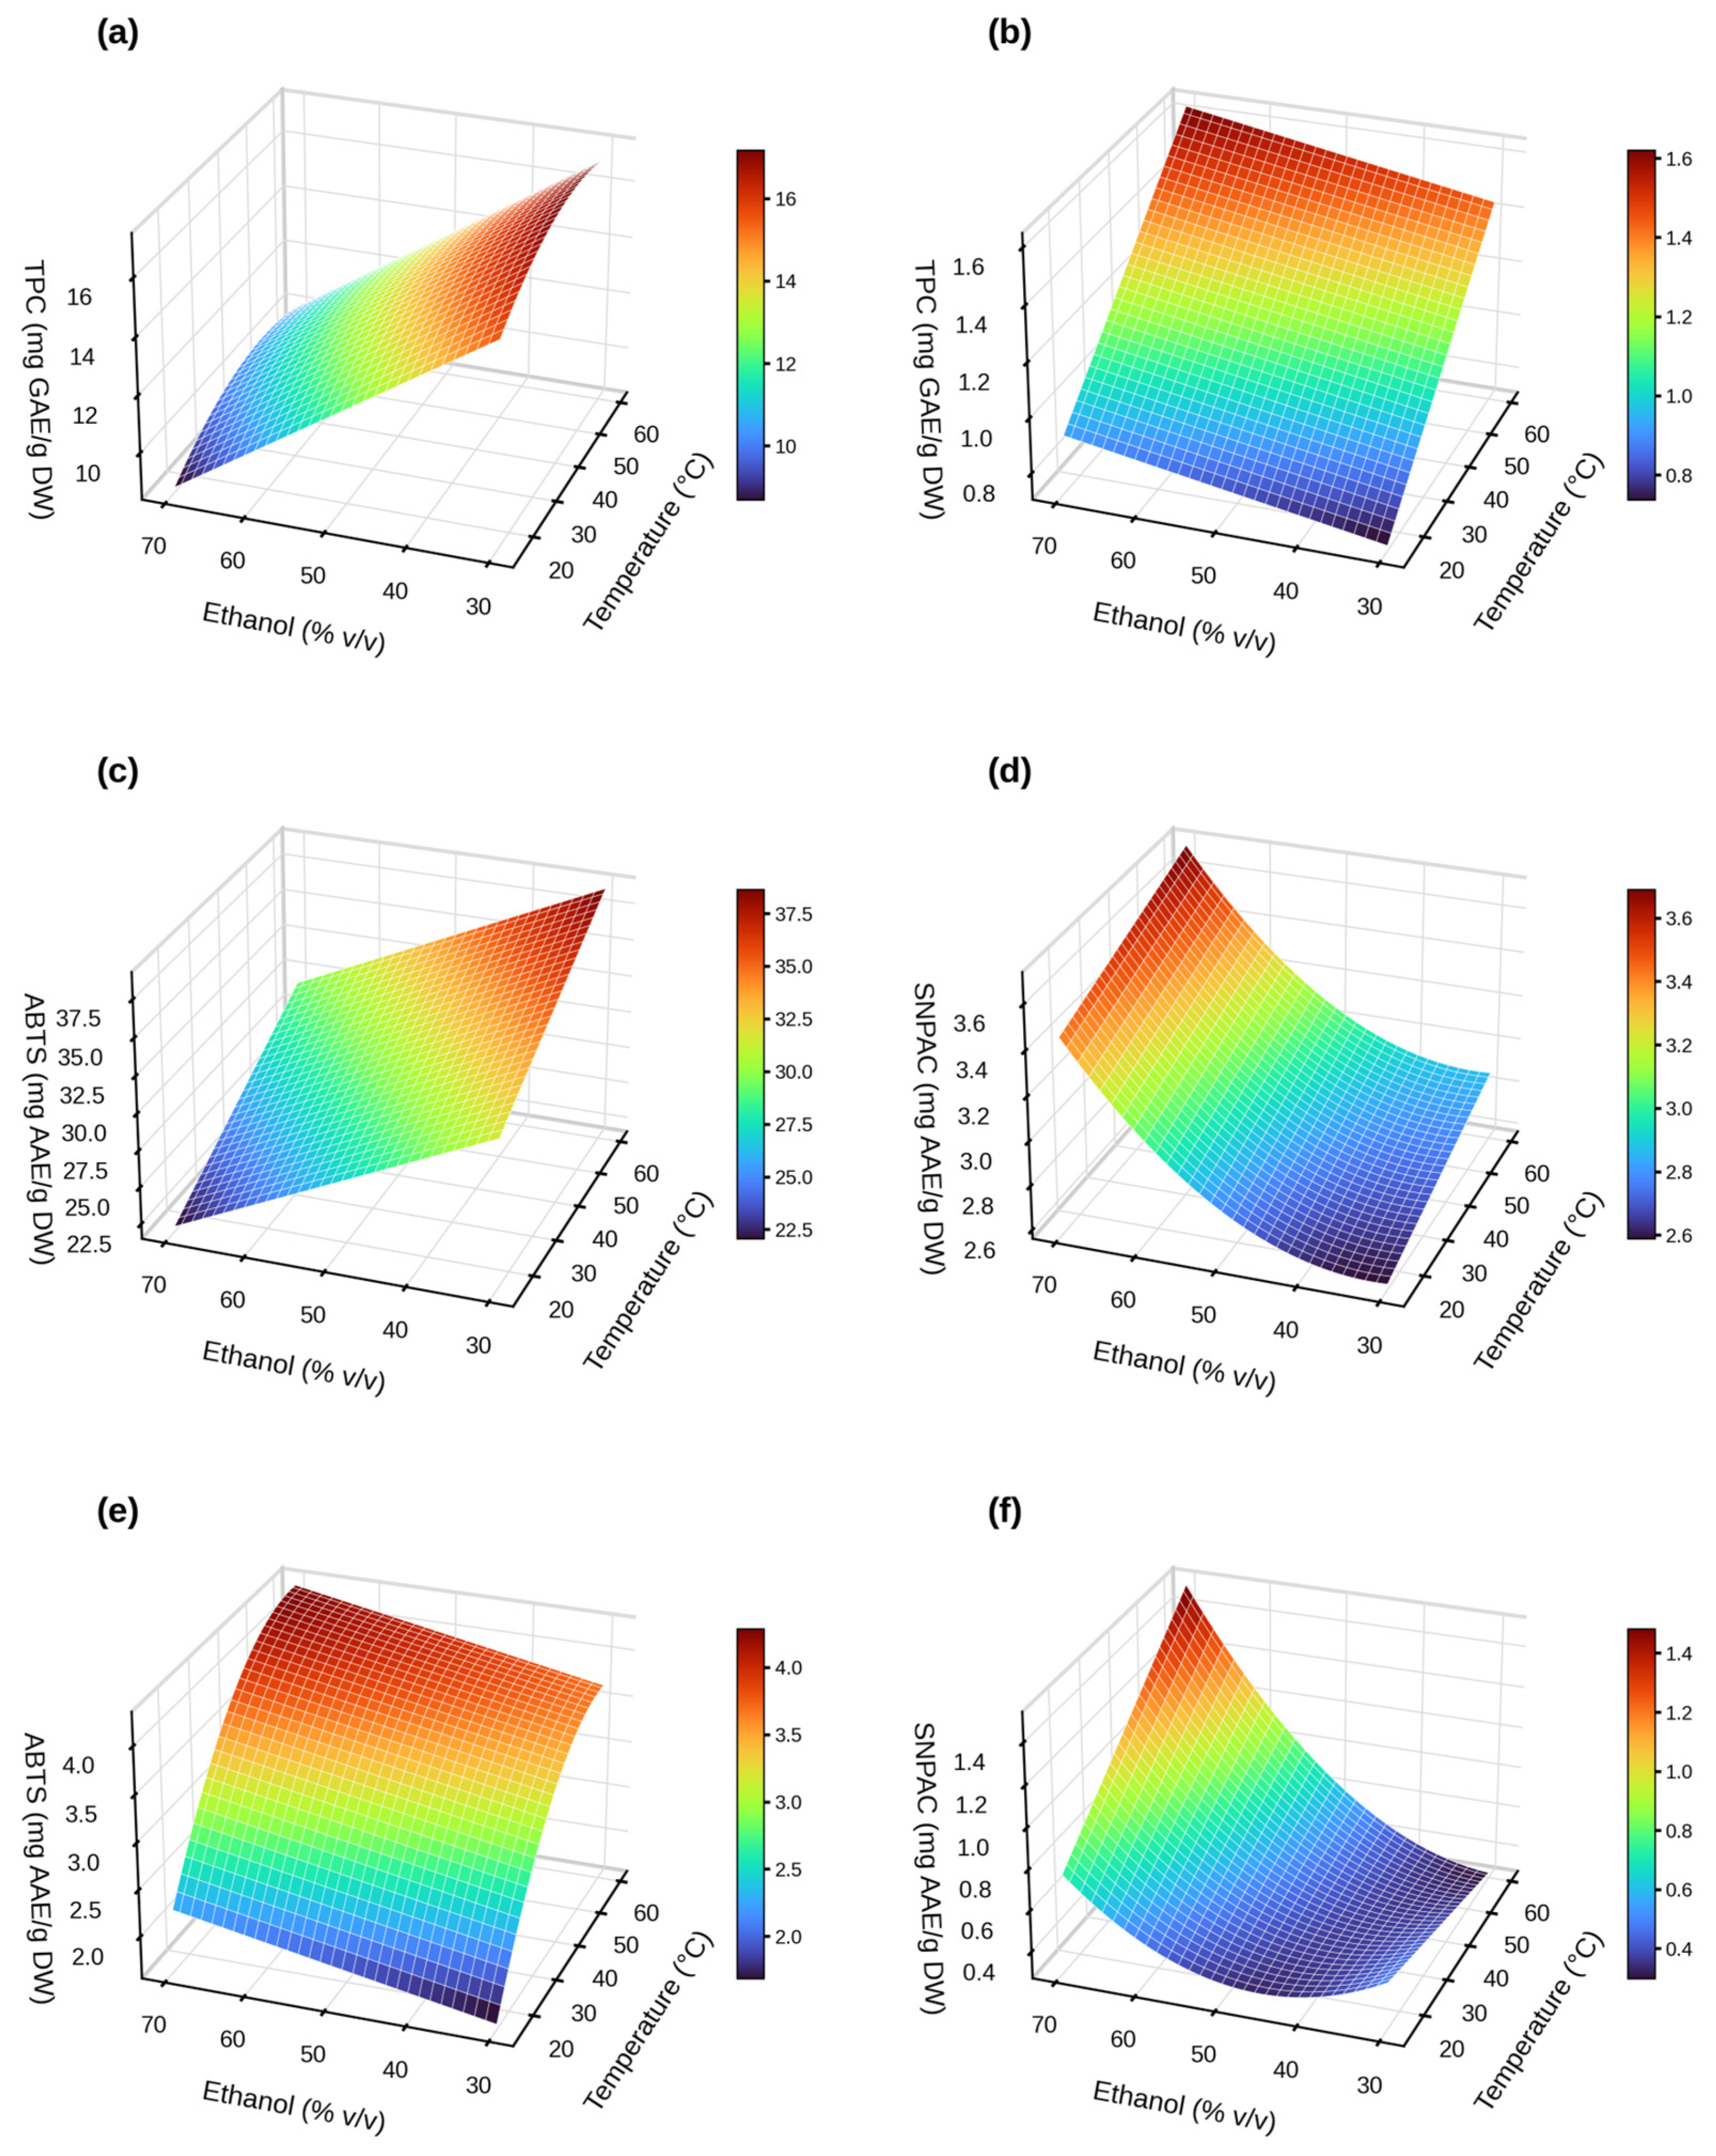
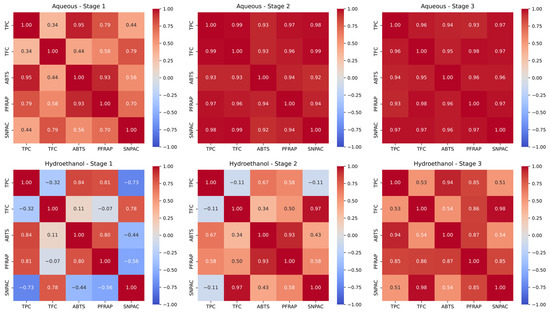
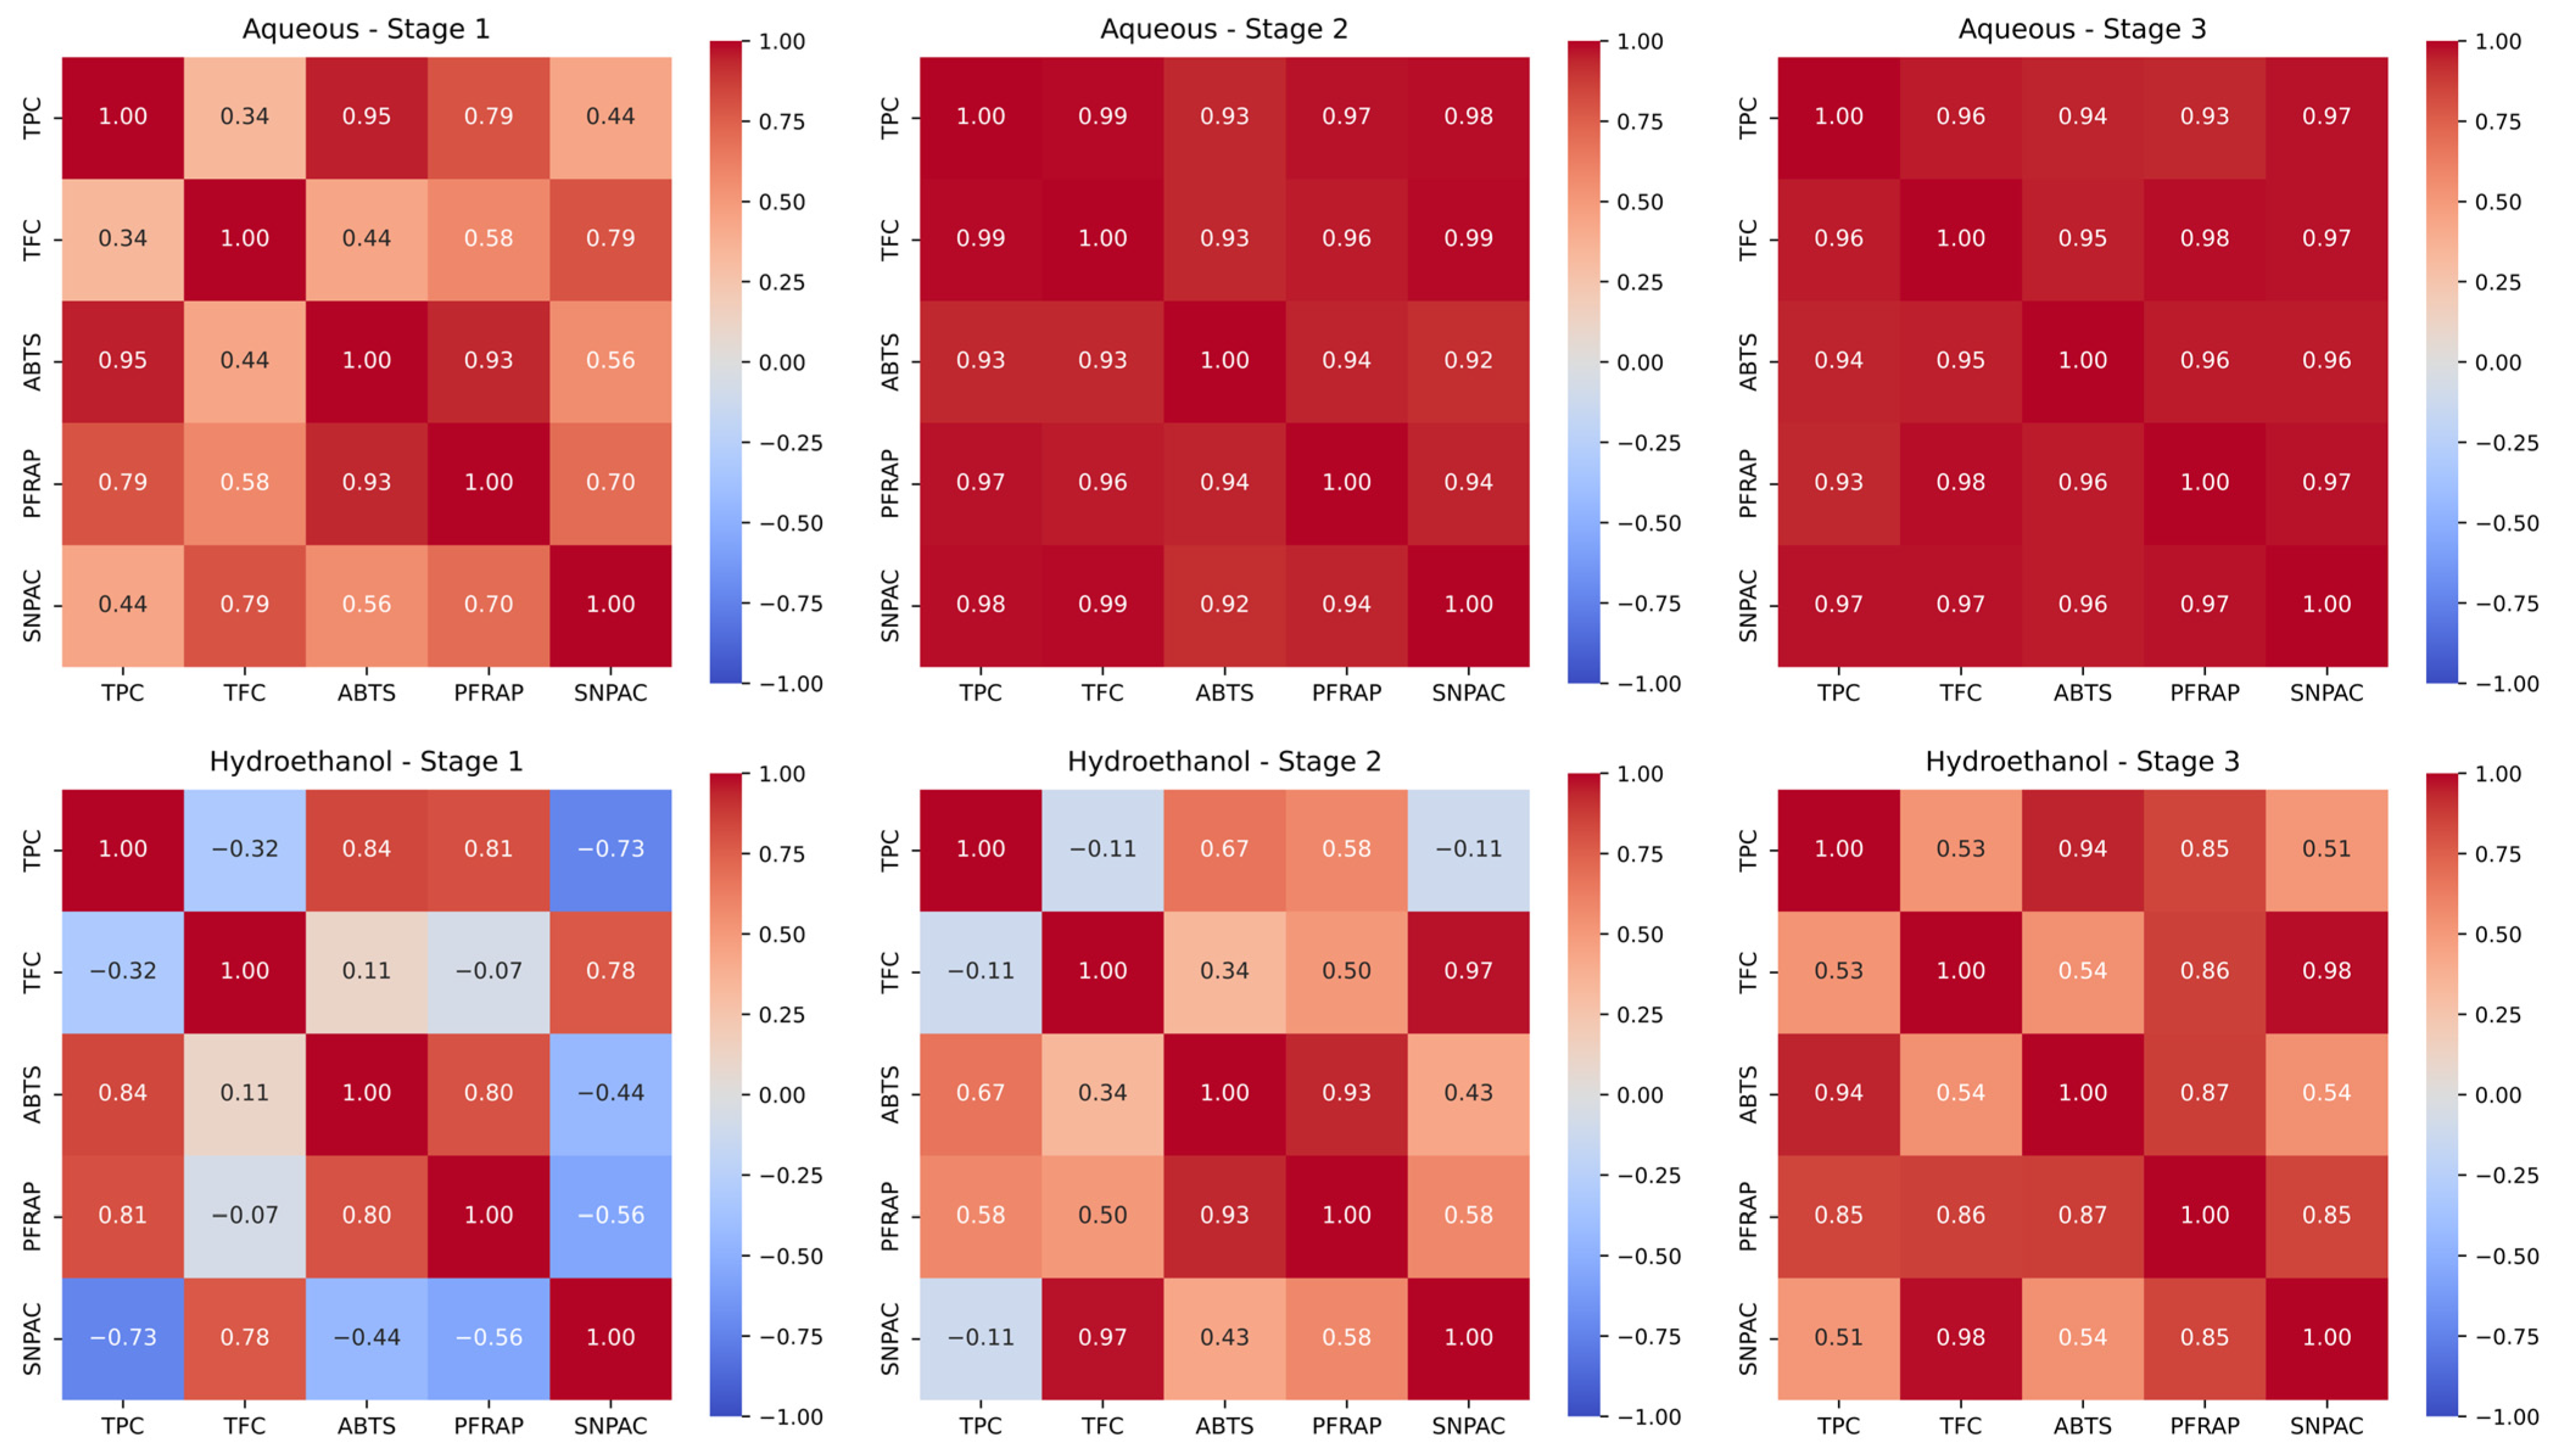
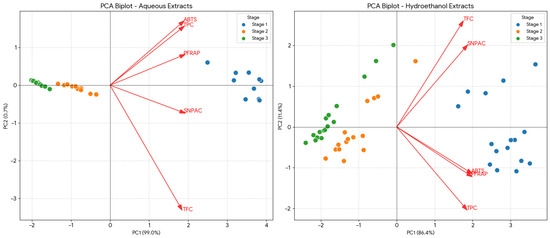
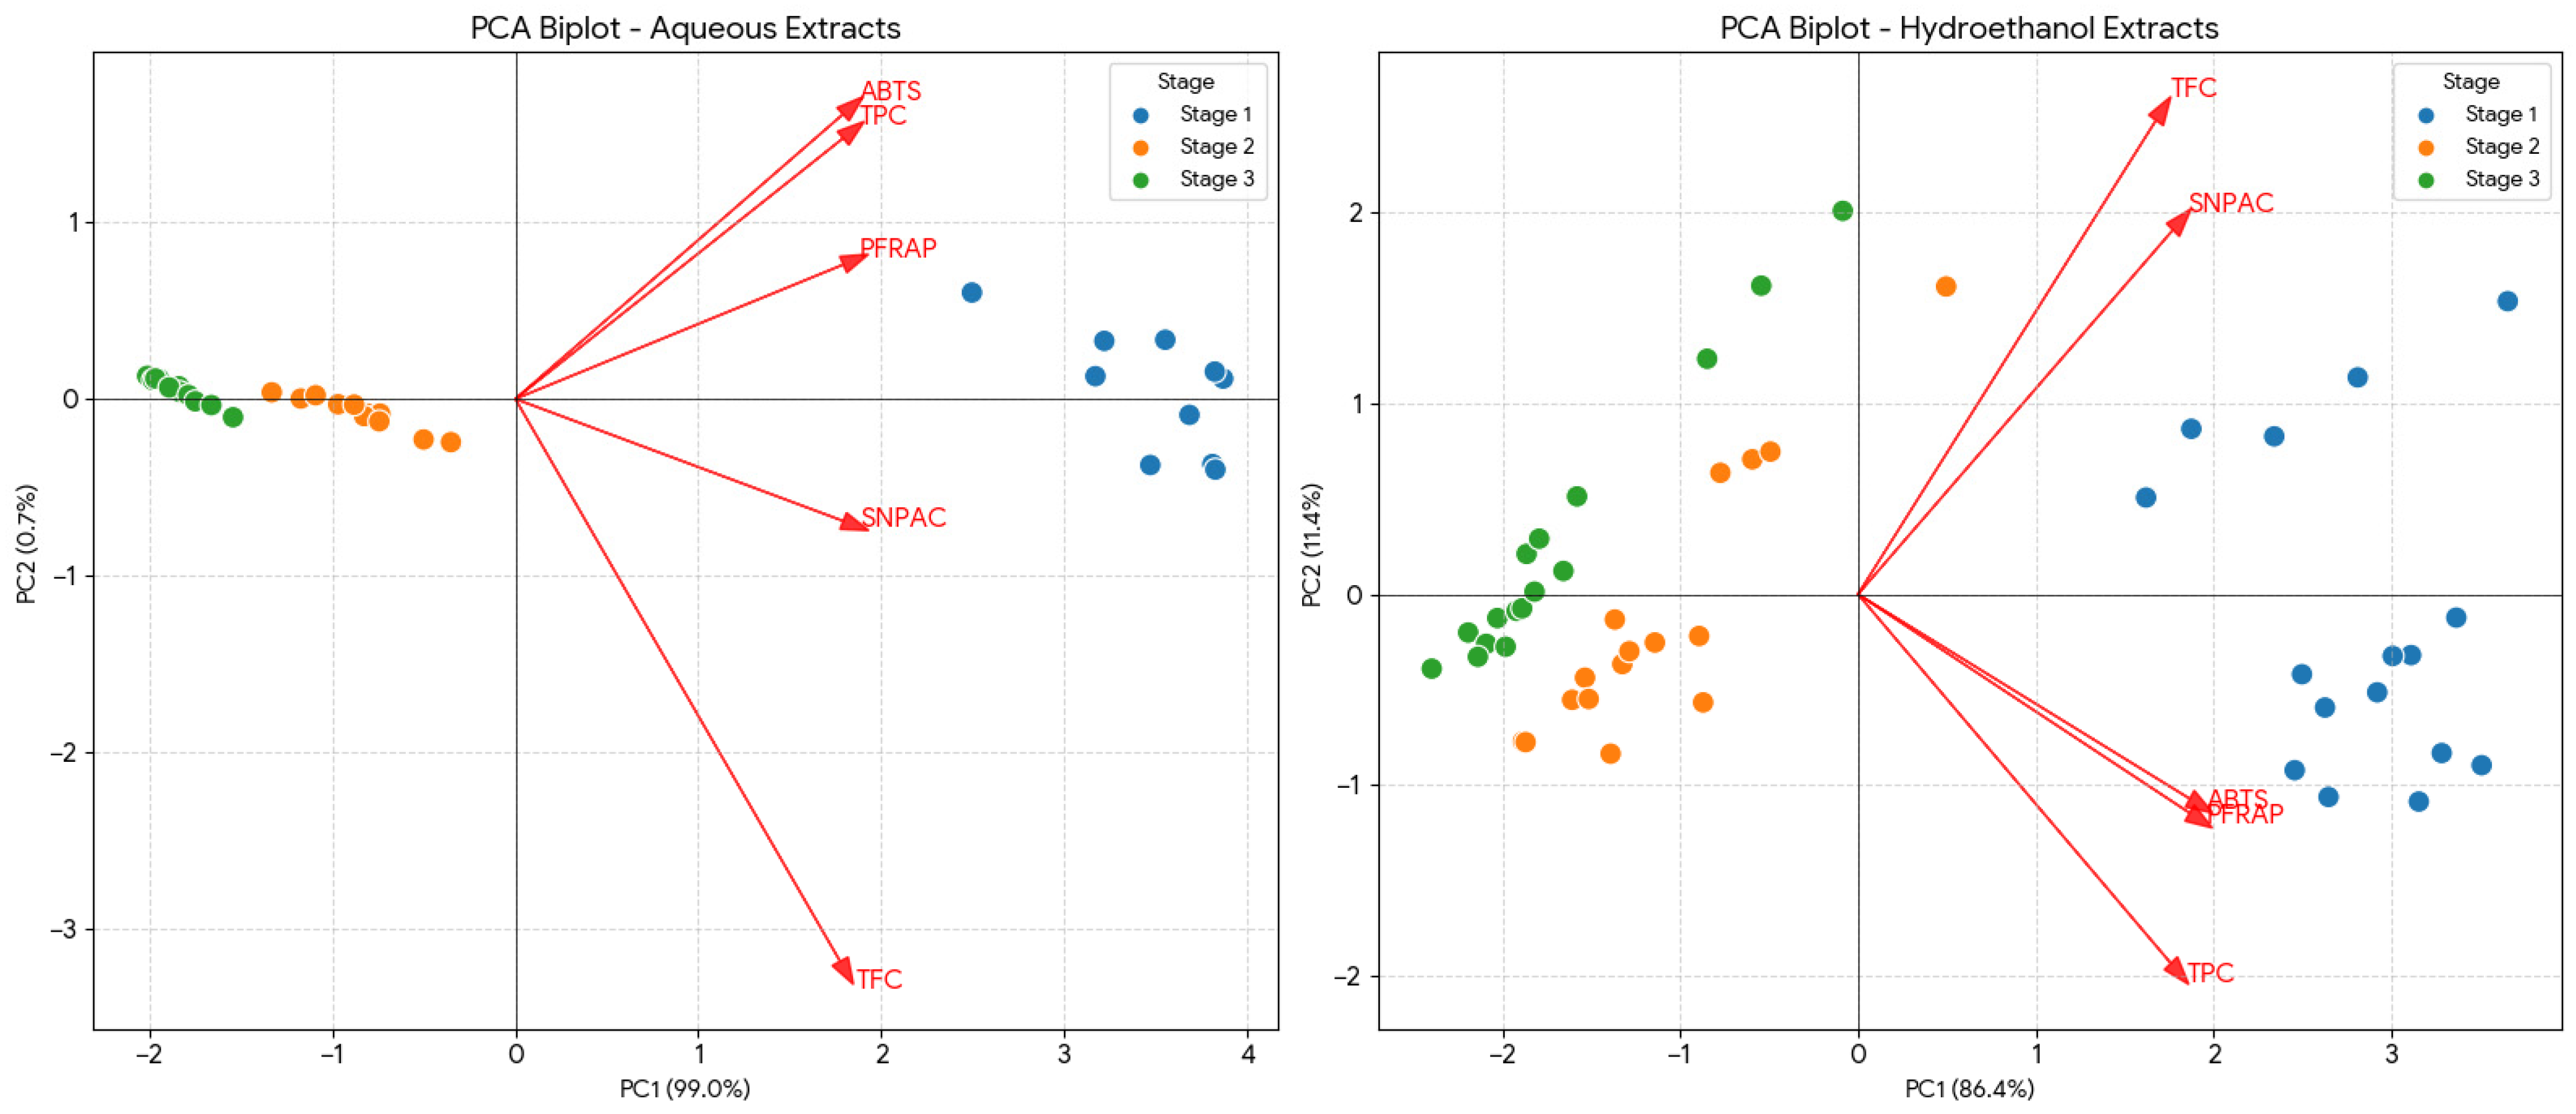
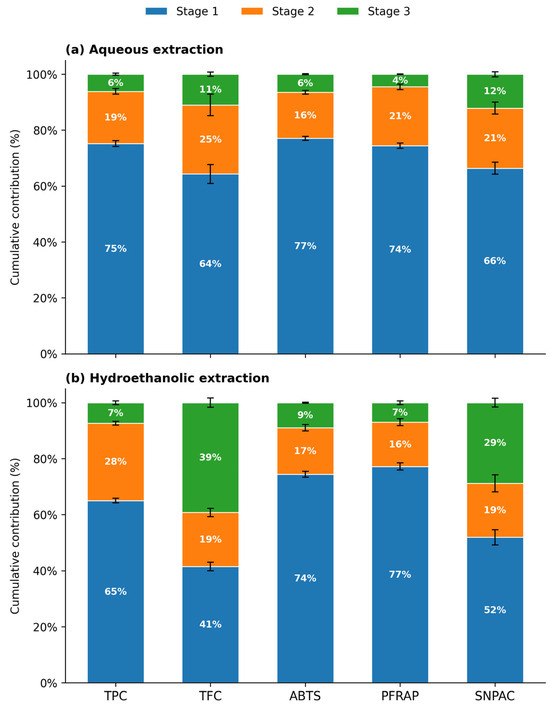
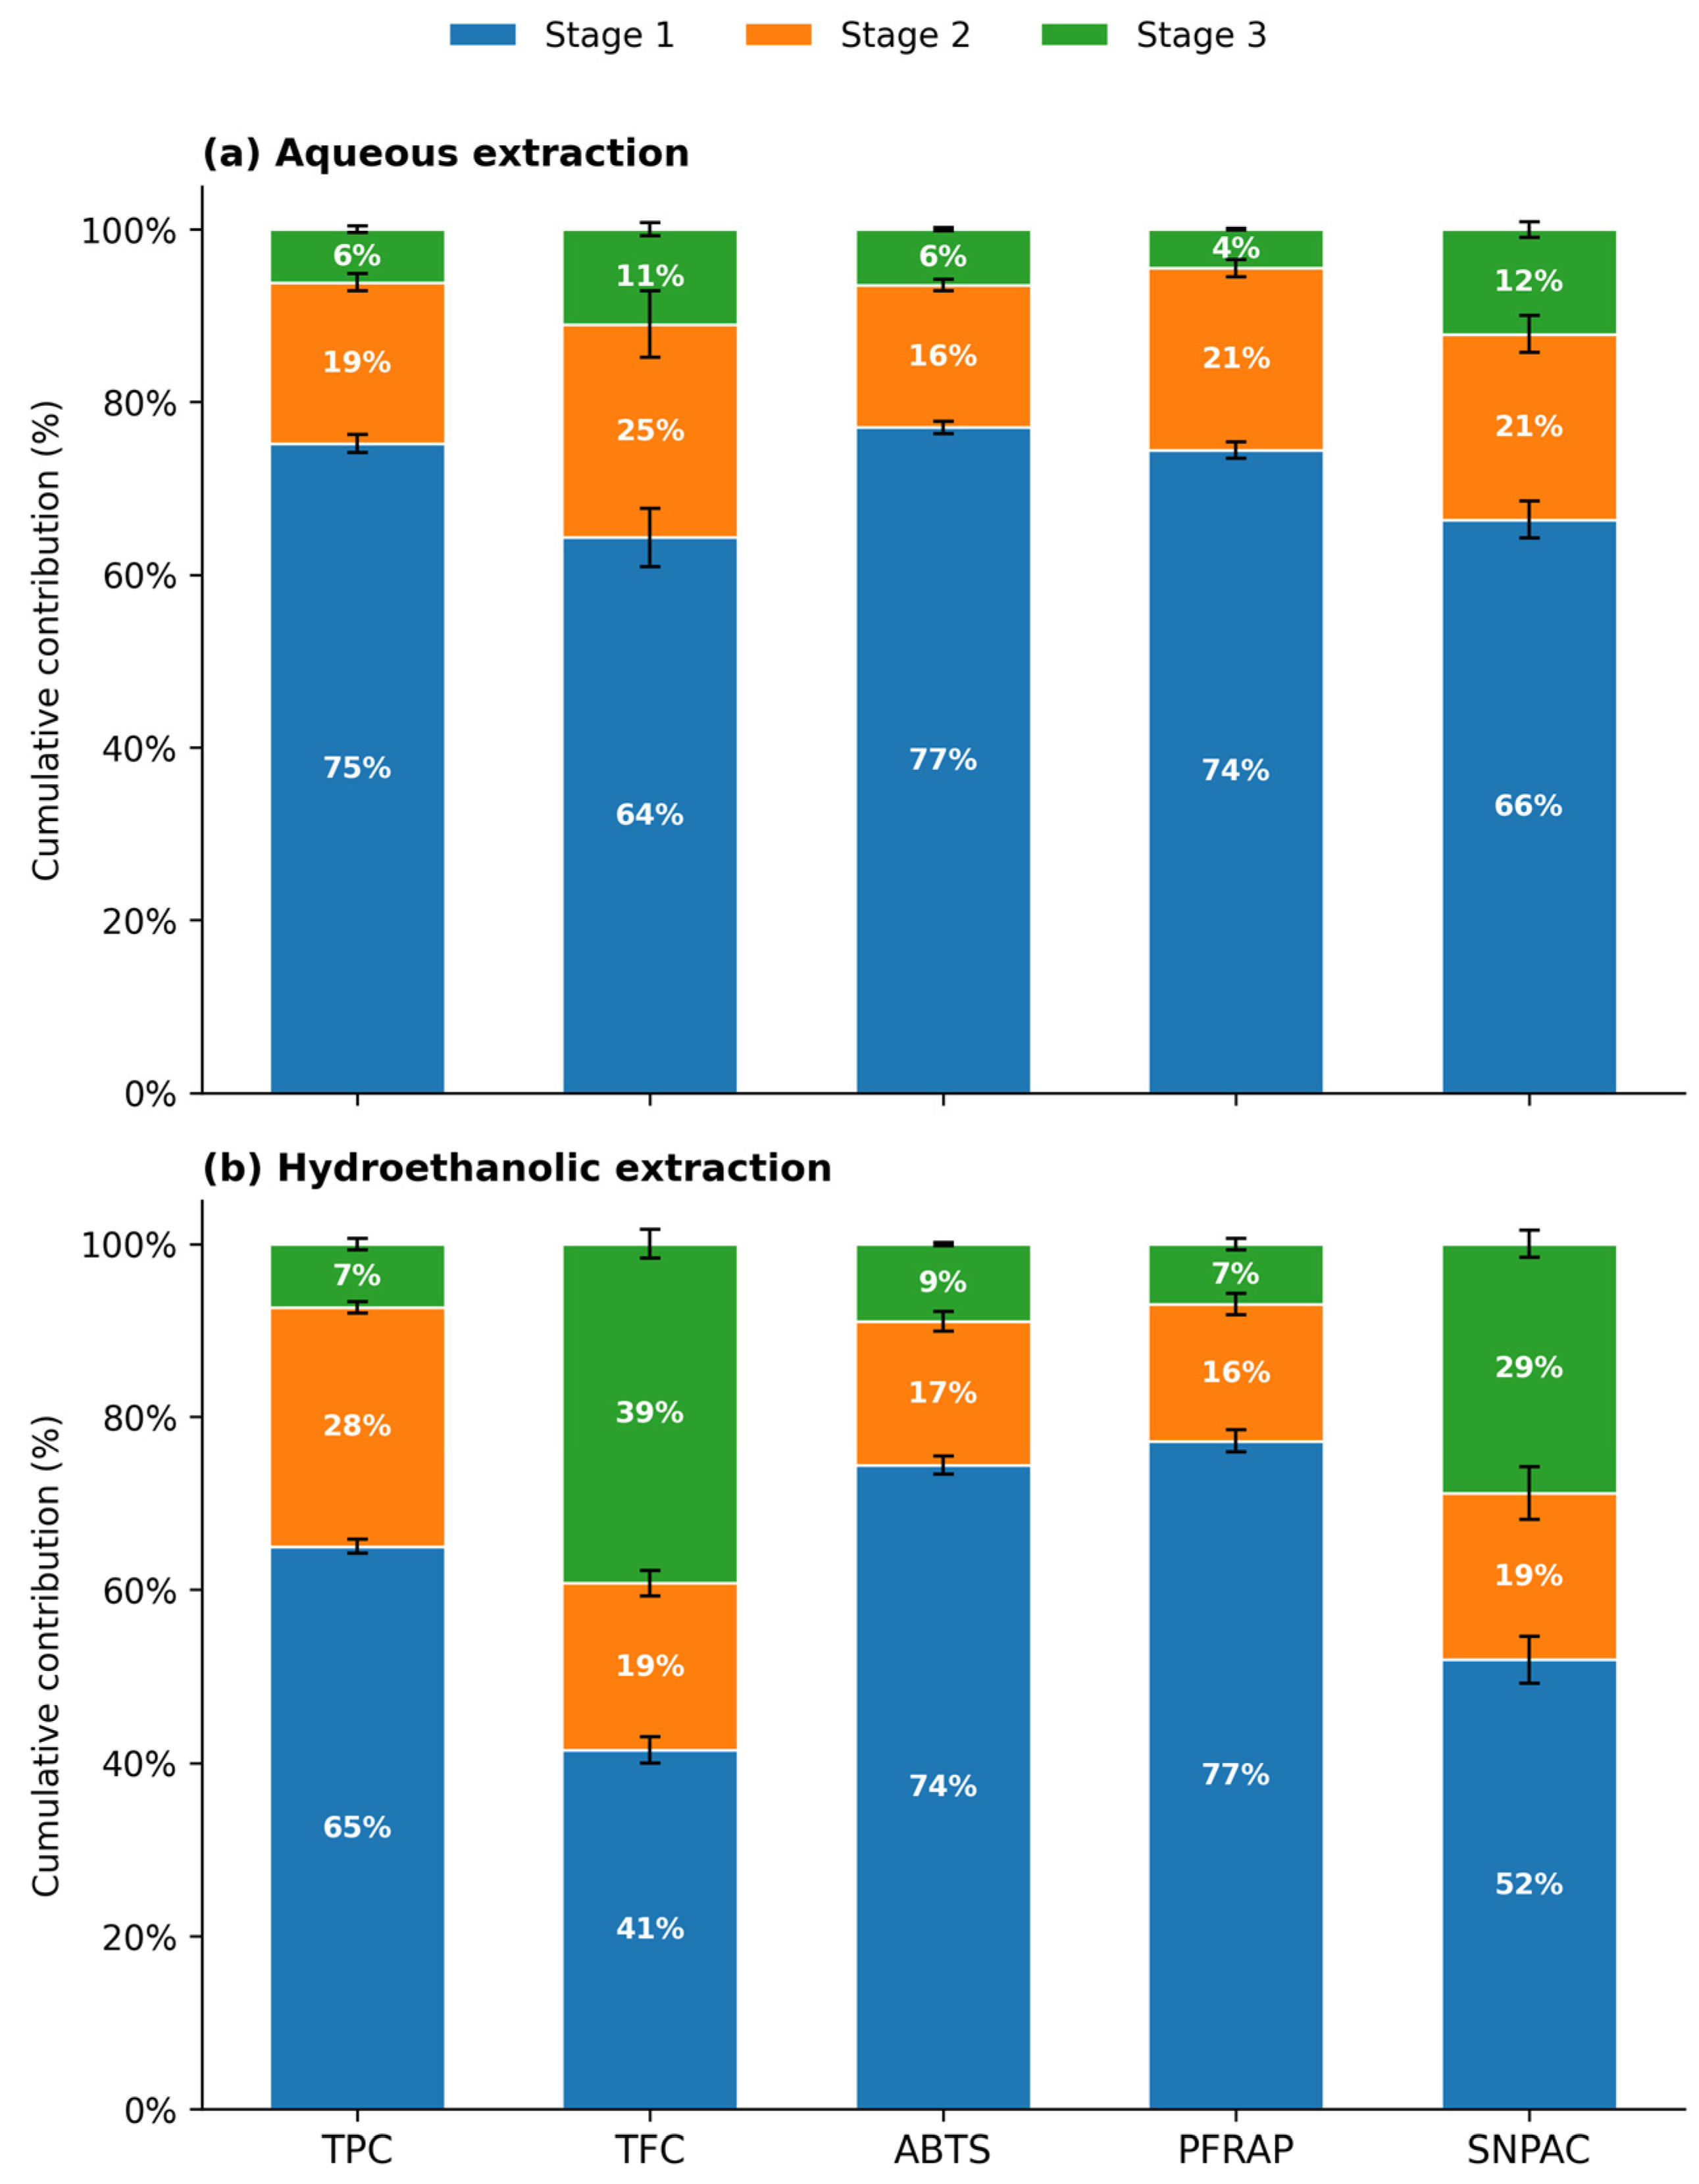
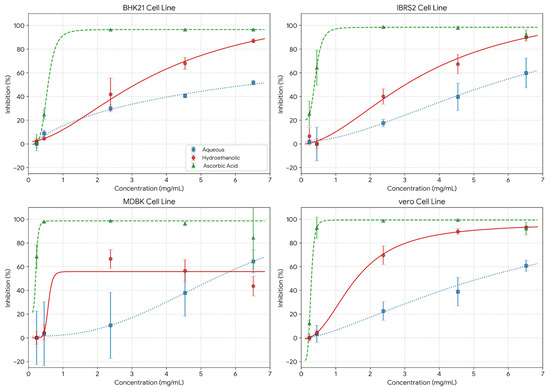
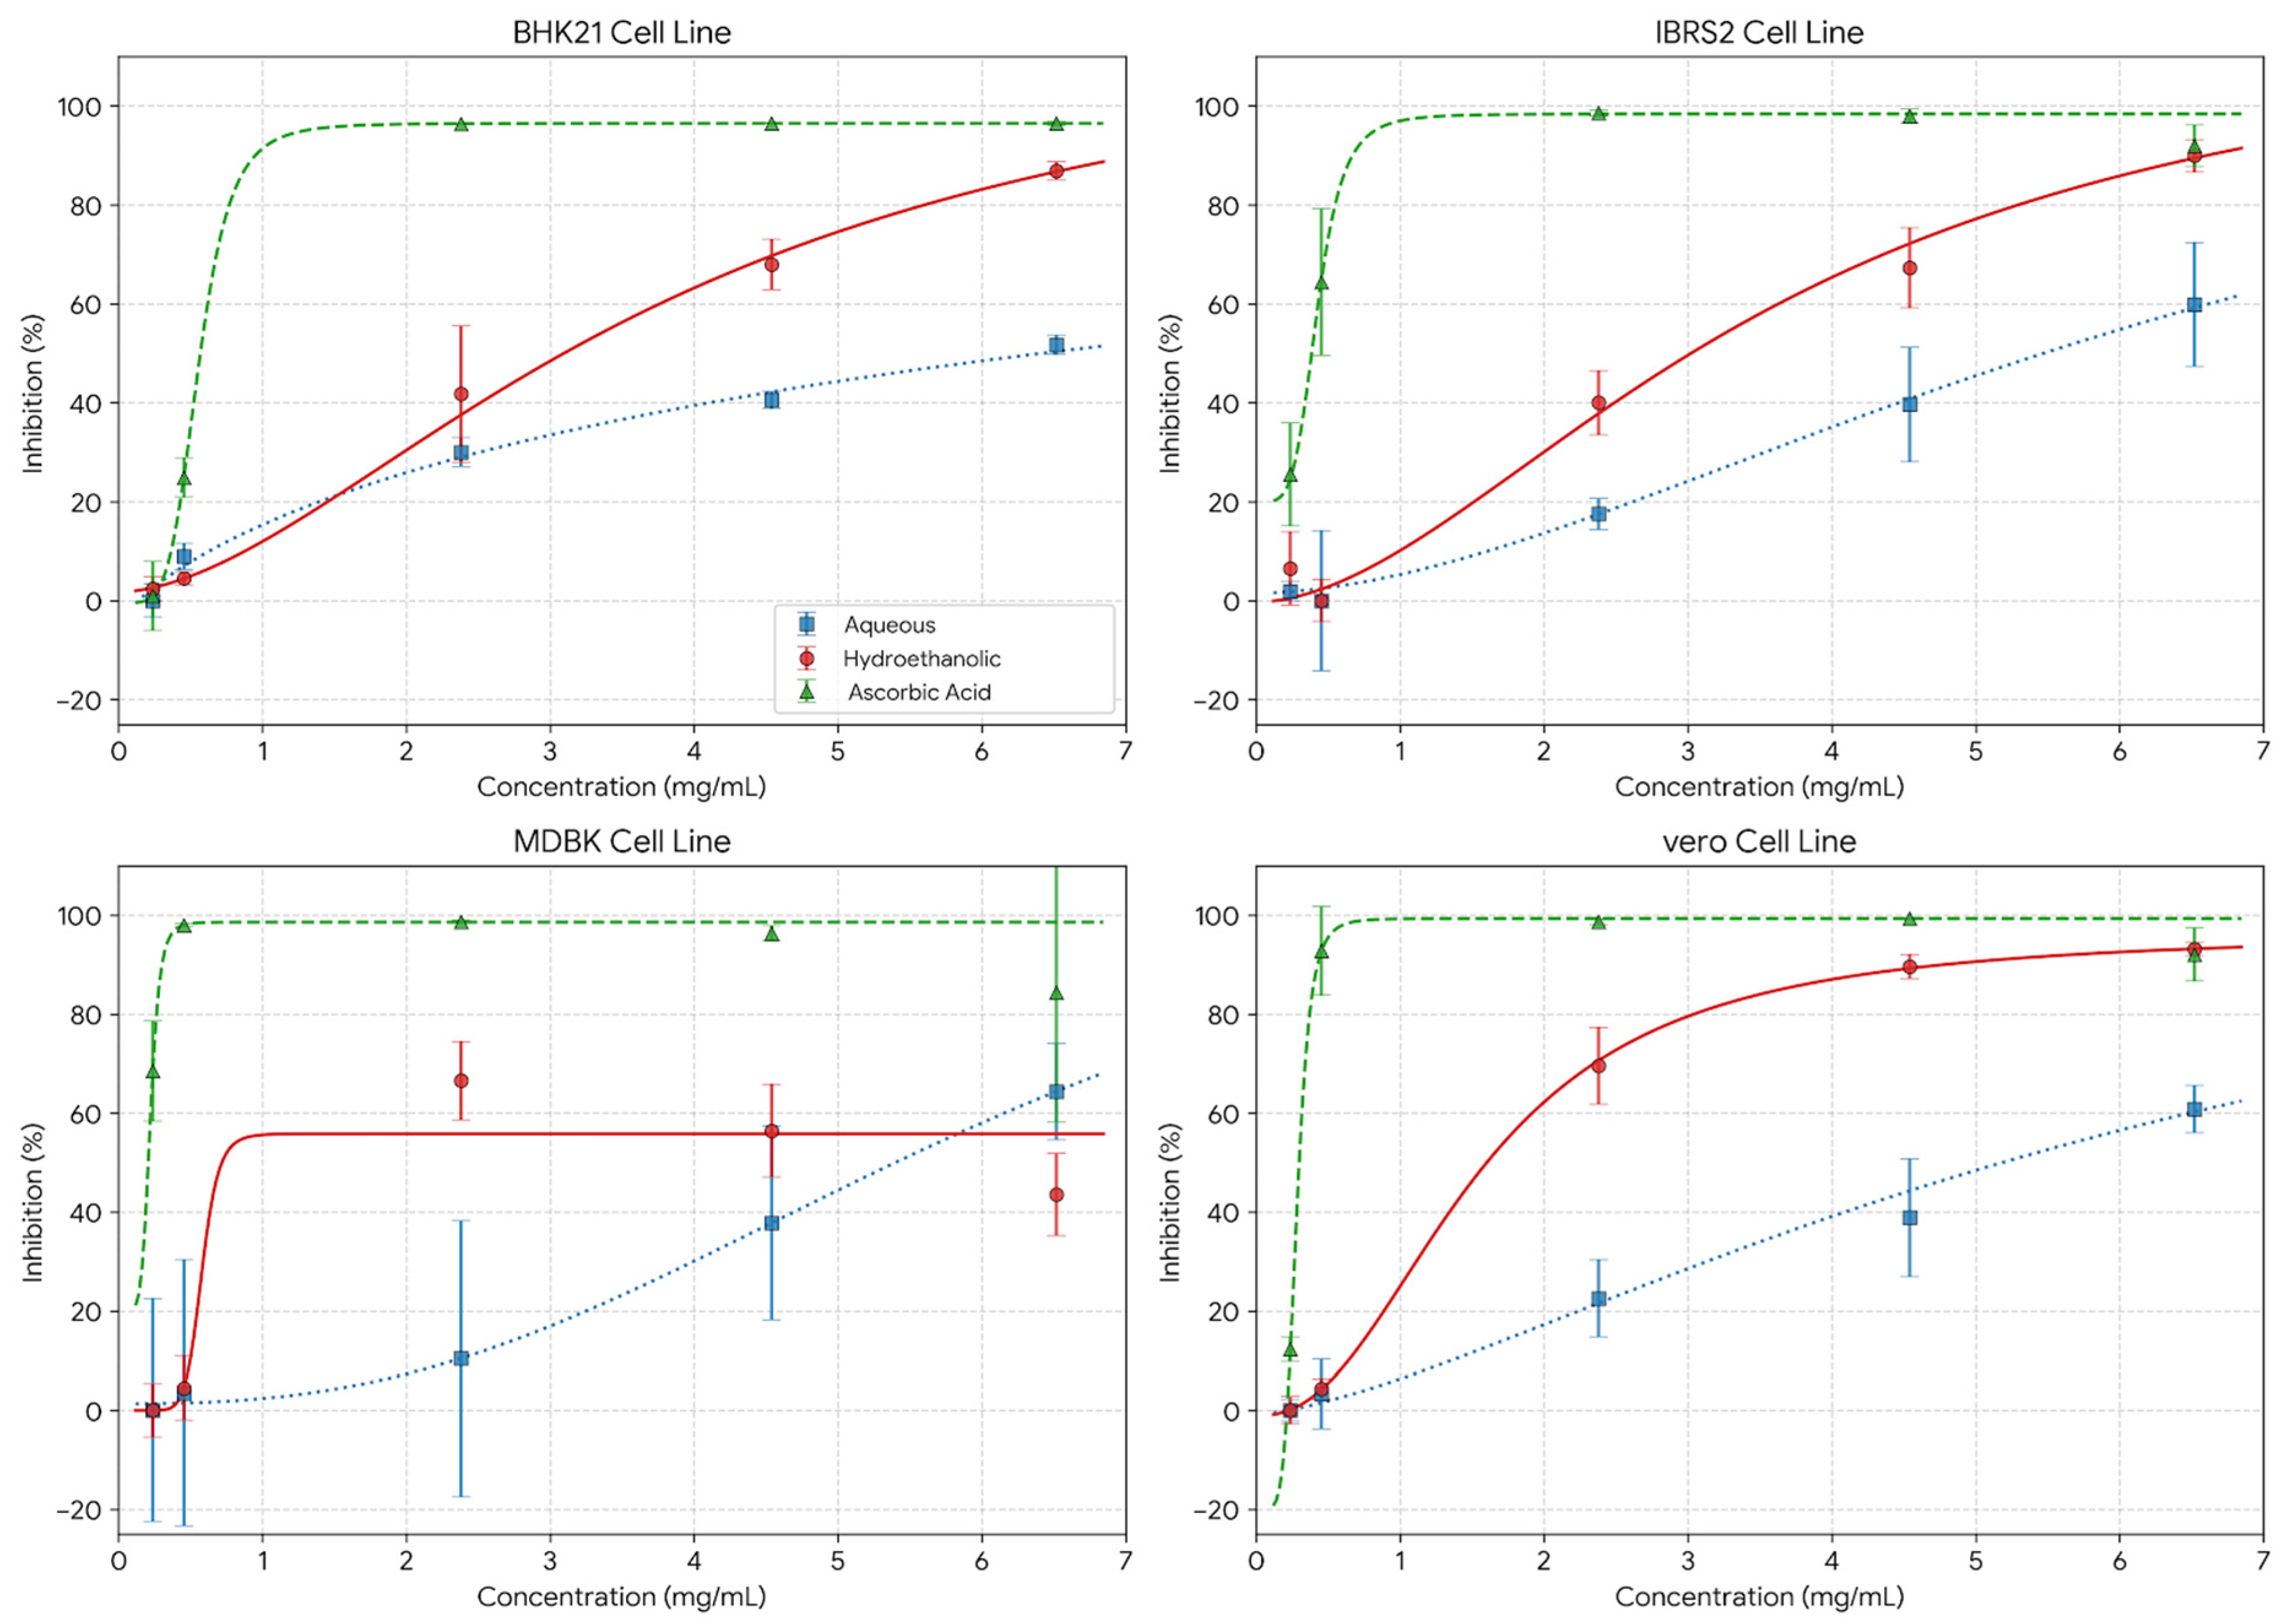

Disclaimer/Publisher’s Note: The statements, opinions and data contained in all publications are solely those of the individual author(s) and contributor(s) and not of MDPI and/or the editor(s). MDPI and/or the editor(s) disclaim responsibility for any injury to people or property resulting from any ideas, methods, instructions or products referred to in the content. |
© 2026 by the authors. Licensee MDPI, Basel, Switzerland. This article is an open access article distributed under the terms and conditions of the Creative Commons Attribution (CC BY) license.