


Abstract
Vehicle-to-Everything (V2X) networks may experience intermittent connectivity and frequent link disruption due to high node mobility and variable density. When an end-to-end path cannot be guaranteed, Delay-Tolerant Networking (DTN) enables message delivery through store-carry-forward communication. Among DTN routing protocols, PRoPHET exploits historical and transitive encounters to estimate destination-specific delivery predictability, enabling forwarding decisions without requiring a contemporaneous end-to-end path. However, its Greater Than (GRTR) forwarding rule has limited contextual awareness because relay selection relies on relative delivery predictability. This paper proposes ProphetRouterRL, a two-stage routing protocol that augments PRoPHET with Q-learning. PRoPHET first handles contacts, predictabilities, and direct delivery; a Q-learning agent then chooses SEND or HOLD for each message from a six-dimensional state (hop count, relay buffer space, relay node type, relay as destination, remaining time-to-live, and destination-encounter history). ProphetRouterRL was evaluated against conventional PRoPHET using the ONE Simulator in a map-based urban scenario of UKM Bangi, Malaysia, with 129 heterogeneous nodes. Across four 12-h runs with different movement seeds, ProphetRouterRL delivered 90.26% (SD 0.54%) against 46.40% (SD 0.20%) for PRoPHET, with a 36.8% lower overhead ratio and 39.5% lower latency (). These results demonstrate the potential of context-aware learned forwarding decisions in opportunistic V2X environments.
1. Introduction
Vehicle-to-Everything (V2X) communication is an important component of intelligent transportation systems, enabling information exchange between vehicles, roadside infrastructure, pedestrians, and communication networks through Vehicle-to-Vehicle (V2V), Vehicle-to-Infrastructure (V2I), Vehicle-to-Pedestrian (V2P), and Vehicle-to-Network (V2N) communication [1]. V2X services are primarily supported by two technology families: IEEE 802.11p-based Dedicated Short-Range Communications (DSRC) and Cellular-V2X (C-V2X), including LTE-V2X and 5G New Radio V2X (NR-V2X) [2]. These technologies enable applications such as collision warning, traffic coordination, and cooperative perception [3,4].
However, conventional V2X communication does not always provide a contemporaneous end-to-end path, particularly under sparse traffic, limited roadside-infrastructure coverage, urban obstruction, or network disruption. Vehicular Delay-Tolerant Networking (VDTN) addresses such conditions through store-carry-forward communication [5]. A node stores a message when no suitable forwarding path is available, carries it while moving, and forwards it when an appropriate relay or destination is encountered [6,7]. Thus, vehicle mobility can create future forwarding opportunities rather than being treated solely as a cause of link disruption. Because delivery may be delayed, this approach is primarily suitable for delay-tolerant V2X applications rather than latency-critical safety services [4].
Urban V2X environments contain vehicles, pedestrians, cyclists, public transport, and fixed roadside infrastructure with heterogeneous mobility, connectivity, and contact patterns. Together with variable vehicle density, wireless obstruction, and limited infrastructure coverage, these characteristics can produce rapidly changing or intermittently connected network topologies. Conventional routing protocols that require a contemporaneous end-to-end path may therefore perform poorly under such conditions, motivating VDTN routing protocols that select forwarding opportunities over time. Among DTN routing protocols considered for opportunistic V2X scenarios, the Probabilistic Routing Protocol using History of Encounters and Transitivity (PRoPHET) estimates destination-specific delivery predictability from direct encounters, aging, and transitive contact information [8,9].
Compared with Epidemic routing, which extensively replicates messages among encountered nodes [10], PRoPHET uses delivery predictability to identify relays with stronger historical delivery potential. This selective approach can reduce unnecessary replication and resource consumption, although its performance depends on mobility, traffic load, buffer capacity, and contact conditions. Comparative evaluations in a city-scale evaluation with real vehicle and pedestrian mobility have examined this trade-off across delivery performance and resource cost [11]. The conventional PRoPHET forwarding strategy, however, relies primarily on the relative delivery predictability of the current carrier and the encountered node. Although this metric captures historical and transitive contact information, the forwarding decision does not jointly consider message urgency and current relay-resource conditions [12]. Consequently, a relay may exhibit higher delivery predictability while being unsuitable under the current message and network state.
Reinforcement Learning (RL) provides a means of introducing adaptive, context-aware decision-making into this process. In particular, Q-learning is a model-free RL algorithm that can estimate the long-term utility of alternative actions from accumulated experience without requiring an explicit analytical model of vehicle mobility or contact dynamics [13]. Previous studies indicate that RL-assisted routing can improve trade-offs among message delivery, routing overhead, delay, and resource utilization in opportunistic vehicular networks [12]. Nevertheless, existing learning-based approaches differ in what they learn. Some construct an independent adaptive routing mechanism, others extend the Spray-and-Wait family, and others use RL to modify PRoPHET’s own predictability criterion or the number of copies that are forwarded [12,14,15]. To the authors’ knowledge, a decision layer that learns from message and relay context and is added as a second stage to a PRoPHET router has received little attention, particularly in heterogeneous urban V2X environments.
This study investigates ProphetRouterRL, designed as a modular, two-stage extension of PRoPHET that preserves its encounter and delivery-predictability calculations while adding a Q-learning layer for per-message forwarding decisions. The first stage uses the standard PRoPHET router to manage contacts, delivery predictabilities, direct delivery, queues, and transfers. In the second stage, the Q-learning policy uses message and relay context to decide, for each message-neighbor pair, whether to send or hold the message. The objective is to improve the balance among message delivery, routing overhead, and end-to-end latency. The learned policy is proposed to be stored as a Q-table because the state is small and discrete. For larger or continuous state descriptions, a function approximator would replace the table. Kolmogorov–Arnold Networks (KANs), which place learnable functions on the edges of the network instead of fixed activation functions, are one possible candidate for approximating routing policies in more complex network environments [16].
The remainder of this paper is organized as follows. Section 2 reviews related work on DTN routing in opportunistic V2X environments and reinforcement-learning-based routing, before identifying the research gap and presenting the contributions of this study. Section 3 describes the system model, including the network environment, PRoPHET formulation, and performance metrics. Section 4 presents ProphetRouterRL, including its two-stage architecture, state representation, reward function, and Q-learning algorithm. Section 5 describes the simulation setup and evaluation methodology, while Section 6 presents and analyzes the results. Section 7 discusses the principal findings, implications, and limitations. Finally, Section 8 concludes the paper and outlines directions for future research.
2. Related Work
This section surveys vehicular routing studies that are applicable to intermittently connected V2X environments, representative DTN routing strategies, and learning-based approaches to improve opportunistic forwarding. The review specifically addresses the limitations of conventional PRoPHET that justify the introduction of the ProphetRouterRL framework.
2.1. DTN Routing in Vehicular Networks
DTN routing uses store-carry-forward communication to deliver messages across a sequence of opportunistic contacts when an end-to-end path does not continuously exist [6,7]. Representative approaches include Epidemic routing, Spray and Wait, and PRoPHET, which differ mainly in the way they control replication and select relay nodes. Epidemic routing copies messages to encountered nodes that do not already have them, potentially achieving high delivery under favorable resource conditions but producing significant transmission and storage overhead [10]. Spray and Wait restricts this replication by giving each message a finite copy budget. Message copies are distributed during the spray phase, after which their carriers wait for direct contact with the destination [17]. Although this limits resource consumption, its fixed copy budget does not explicitly evaluate the delivery suitability of individual relays.
PRoPHET takes a more selective approach by exploiting the non-randomness of node encounters. It estimates destination-specific delivery predictabilities from direct encounters, aging, and transitive contact information [8]. Unlike Epidemic routing, PRoPHET uses these estimates to preferentially forward messages through nodes with stronger historical delivery potential, thereby limiting indiscriminate replication. Nevertheless, the default Greater Than (GRTR) relay-selection rule relies primarily on the relative delivery predictability of the current carrier and the encountered node [9]. Although delivery predictability represents historical and transitive contact information, the GRTR comparison does not jointly incorporate message urgency, current relay-resource conditions, or node heterogeneity. Previous studies suggest that such contextual information can improve forwarding decisions in dynamic vehicular and opportunistic networks [12,18,19]. This limitation has motivated extensions that supplement probabilistic routing with contextual information or adaptive decision-making.
2.2. Reinforcement Learning for DTN Routing
Opportunistic DTN forwarding can be formulated as a sequential decision-making problem because the effect of a forwarding action may only become evident after several subsequent encounters. A relay selected at one encounter may improve the probability of eventual delivery, but it may also consume transmission and buffer resources without contributing to delivery. Reinforcement Learning (RL) is suitable for this setting because it can learn forwarding policies from interactions with the network environment while accounting for delayed outcomes [13]. Under an RL formulation, the observable message and network conditions constitute the state, forwarding alternatives constitute the actions, and delivery performance and resource consumption inform the reward. Q-learning, as a model-free RL algorithm, is particularly relevant because it learns state-action values without requiring an explicit transition model of node mobility and future contacts [13,20]. However, its effectiveness depends strongly on the state representation, action definition, and reward design.
Several recent studies have applied reinforcement learning and related online-learning methods to routing in intermittently connected networks. Rezaei and Derakhshanfard [12] integrated Q-learning with PRoPHET-derived routing information. Their formulation uses an encounter-based state and a multi-copy action space, allowing RL to influence the delivery and replication decision. This differs from the present work, in which Q-learning neither recomputes the delivery predictabilities nor selects a number of copies, but makes a binary SEND/HOLD decision for each message-neighbor pair in a second stage that follows the PRoPHET router’s own processing.
Phutela et al. [15] proposed LearnRouter, an adaptive routing protocol based on the multi-armed bandit framework. LearnRouter employs the Upper Confidence Bound algorithm to balance exploration of alternative forwarding choices against exploitation of previously successful choices. It reported improved delivery and delay relative to several conventional and learning-based baselines. Unlike ProphetRouterRL, however, LearnRouter operates as an independent routing mechanism rather than as a second decision stage on top of a PRoPHET router.
Schindlegger and Hupperich [14] proposed Spray-Learn-Wait, which combines movement-based node clustering with Q-learning within a spray-based routing architecture. The protocol reported improvements in delivery and overhead relative to PRoPHET, although with increased latency in the evaluated scenarios. It therefore represents an RL-assisted spray-based routing architecture, whereas ProphetRouterRL retains PRoPHET’s encounter-predictability mechanism and adds a modular Q-learning layer for per-message SEND/HOLD decisions.
Lozano-Cuadra et al. [21] applied graph-attention-based multi-agent reinforcement learning to lunar delay-tolerant networks. Their policy is trained centrally, executed on each rover from local observations, and routes without packet replication. Deep models of this kind can use richer observations than a tabular method, but they are considerably less compact and less directly inspectable than a tabular policy.
Table 1 summarizes the distinction between these studies and the present work. Collectively, they use learning to modify PRoPHET-derived routing criteria, to construct independent adaptive routing mechanisms (bandit-based or deep multi-agent), or to enhance spray-based forwarding. ProphetRouterRL differs in which decision is learned and where it is placed: in its second stage, a tabular Q-learning policy makes a binary SEND/HOLD decision for each message–neighbor pair within the PRoPHET router, without modifying the predictability estimates and without controlling the number of copies. Its contribution is therefore a specific design and its evaluation in a heterogeneous V2X scenario, not the general idea of combining reinforcement learning with a DTN router, which previous studies have already explored.
Table 1.
Comparison of RL-based approaches in DTN routing and related vehicular network applications.
2.3. Positioning and Contributions
The second-stage policy conditions on message and relay context that the conventional GRTR comparison does not evaluate jointly, including hop count, relay buffer space, whether the encountered node is the destination, and node type. Relative to the studies above, the technical differences of ProphetRouterRL are of three kinds. First, the learned decision is different: the agent does not recompute delivery predictabilities, choose a number of copies, or act as an independent router, but makes only a binary SEND/HOLD decision for each message–neighbor pair that the PRoPHET router considers after its direct-delivery step. Second, this decision rests on a compact discrete state that combines message context (hop count), relay context (free buffer space and node type), a destination indicator, and two auxiliary indicators (remaining TTL and destination-encounter history), and on a five-component reward (delivery, hop count, buffer status, urgency, and node type) that favors short paths, relays with free buffer space, and infrastructure nodes, while HOLD receives zero reward. Third, the learned policy is a Q-table of about 40 KB that can be inspected state by state, and its benefit is measured against the same router without the second stage and against the same agent started from an empty table in a heterogeneous map-based V2X scenario (Section 6.3). The Q-learning update itself is standard; the contribution lies in these design choices and their evaluation. Furthermore, existing RL-based DTN studies are commonly evaluated in generic opportunistic-network settings. Evaluation under a heterogeneous urban V2X configuration containing pedestrians, cyclists, private vehicles, public transport, and stationary communication points remains comparatively limited. Assessing the proposed routing strategy in such an environment is necessary because different node classes exhibit different mobility, contact, and resource characteristics.
Based on the identified gaps, the main contributions of this work are:
- Two-stage PRoPHET–RL architecture: ProphetRouterRL extends the PRoPHET router in two stages. In the first stage, the PRoPHET router, which maintains the delivery predictabilities, handles contact detection, delivery-predictability updates, direct delivery to connected destinations, queue management, and message transfer. In the second stage, a Q-learning policy decides SEND or HOLD for each message-neighbor pair considered after the direct-delivery step. The agent neither recomputes the delivery predictabilities nor selects a number of copies.
- Compact tabular formulation: The agent works on a small discretized state (846 distinct states were visited during training), so the learned policy is stored in a Q-table of about 40 KB that can be inspected state by state. The state combines message, relay, and destination information, and the reward has five components, with zero reward for HOLD.
- Heterogeneous map-based V2X evaluation and open release: ProphetRouterRL is evaluated against conventional PRoPHET using a seven-day ONE Simulator scenario with 129 heterogeneous nodes moving over an OpenStreetMap-derived representation of the UKM Bangi area. Performance is assessed using delivery rate, overhead ratio, and average latency. The code, configuration, maps, Q-tables, and logs are publicly available on Zenodo.
3. System Model
This section presents the formal system model underlying the ProphetRouterRL approach. Figure 1 illustrates the ProphetRouterRL system architecture, comprising two components that communicate via a TCP socket: (i) the DTN simulation environment running the UKM-Bangi scenario with 129 heterogeneous nodes, and (ii) the Q-learning agent, which receives the six-dimensional state vector and selects a SEND/HOLD action.
Figure 1.
System overview of ProphetRouterRL, showing the spatial distribution of the 129 heterogeneous nodes across the UKM-Bangi campus area alongside the integration between the DTN environment and the Q-learning agent.
3.1. Network Model
The V2X delay-tolerant network is modeled as a time-varying graph , where represents the set of mobile and static nodes at time t, and denotes the set of communication links that exist at time t. The network exhibits intermittent connectivity due to node mobility, limited transmission range, and physical obstacles, making it suitable for DTN-based communication.
The network operates within a geographic region representing a realistic urban area. In this implementation, corresponds to the UKM-Bangi campus region in Malaysia, covering an area of approximately 36.56 km2 (7.24 km × 5.05 km) extracted from OpenStreetMap data. The road network was extracted from OpenStreetMap and converted to Well-Known Text (WKT) format using QGIS Desktop 3.44.1 (QGIS.ORG Association, Grüt, Switzerland) with metric coordinates, representing the physical road infrastructure through MULTILINESTRING geometries that define traversable paths for mobile nodes. The topology is composed of road networks, pathways, and dedicated routes for different types of vehicles, providing realistic mobility constraints.
The network topology for the distribution of 129 nodes across the UKM-Bangi campus is shown in Figure 2.
Figure 2.
Network topology of UKM-Bangi showing the spatial distribution of 129 nodes at the campus area (36.56 km2).
3.1.1. Node Composition
The network consists of heterogeneous nodes, which are classified into six different types based on their mobility features and communication capabilities, as presented in Table 2.
Table 2.
Node type characteristics.
Each node is characterized by a tuple of:
- denotes the node’s geographic coordinates at time t
- represents the velocity vector
- indicates current buffer occupancy with maximum capacity
- specifies the node category
The node type classification follows:
- SLOW (type = 0): Pedestrians and cyclists
- FAST (type = 1): Cars and buses
- TRAM (type = 2): Metro trains
- HUB (type = 3): Static communication hubs
3.1.2. Mobility Model
The movement of the nodes is based on the ShortestPathMapBasedMovement approach, where mobile nodes travel along the shortest path between randomly chosen waypoints on the map. The shortest paths between map nodes are computed by the model using Dijkstra’s algorithm, considering the road network structure and mobility limitations. The waypoints are chosen from the Points of Interest (POIs) scattered on the map, and nodes generate new paths after each destination, thus mimicking realistic urban mobility patterns limited by real road infrastructure.
The MapRouteMovement model is used for the movement of buses and metro trains, which utilizes pre-defined routes (defined in WKT files with defined stops) and calculates the path between two stops using Dijkstra’s algorithm. The buses operate on four different routes with a total length of 75.91 km, with 12–22 s waiting time at the bus stops. Metro trains operate on two lines (KTM1: 5.87 km, KTM2: 5.48 km) with 20–40 s waiting time. Static hubs employ the StationaryMovement model, remaining at fixed positions (5490, 3160), (4460, 2300), (3700, 1800) meters throughout the simulation to provide persistent communication infrastructure.
3.1.3. Communication Model
Communication between nodes occurs opportunistically when they are within transmission range. A directed communication link exists at time t if and only if
where denotes Euclidean distance and R is the transmission range. The network employs two communication interfaces: Bluetooth, available on all nodes with a 100 m transmission range and 250 kbps bandwidth, and a high-speed interface, available only on metro trains, buses, and static hubs, with a 150 m range and 50 Mbps bandwidth.
The contact duration representing the continuous time interval during which communication is allowed between nodes i and j is defined as
3.1.4. Message Model
Messages are generated with inter-arrival times drawn uniformly from 25 to 35 s. Each message m is characterized by a tuple of:
- : Source and destination nodes
- : Timestamp of message generation
- : Time-to-live, initially set to min s
- : Message payload size
- : Message priority level
The set of messages in the network at time t is denoted , and each node i maintains a local message buffer subject to the buffer capacity constraint:
A message m expires when , at which point it is removed from all node buffers. Message delivery occurs when a node carrying message m encounters the destination node , at which point m is transferred and removed from the network.
3.2. PRoPHET Protocol Model
The Probabilistic Routing Protocol using History of Encounters and Transitivity (PRoPHET) operates on the principle that nodes which have frequently encountered a destination in the past are likely to encounter it again in the future. This section formalizes the forwarding decision rule and the delivery predictability mechanism of PRoPHET.
3.2.1. Delivery Predictability
For each known destination , each node i maintains a delivery predictability metric that represents the estimated probability that node i can successfully deliver a message to destination d. The delivery predictability is updated by three mechanisms:
- (i)
- Encounter Update (Direct Contact): When node i encounters node j at time t, the delivery predictability is updated according towhere is the initialization constant. This update increases the delivery predictability based on the fresh encounter, with diminishing returns as approaches 1.
- (ii)
- Transitivity Update (Indirect Information): PRoPHET exploits the transitive property of encounters: if node i frequently meets node j, and node j frequently meets destination d, then node i has an increased likelihood of delivering messages to d through j. When nodes i and j encounter, for every destination d known to j, node i updates:where is the transitivity scaling factor controlling the influence of transitive information.
- (iii)
- Aging Update (Temporal Decay): To reflect that predictability decreases in the absence of recent encounters, delivery predictability values decay over time according to:where
- is the aging constant
- k is the number of time units elapsed since the last update (one time unit is 30 s, Table 3)
- Time unit duration in seconds
Table 3. PRoPHET protocol parameters.The aging mechanism ensures that predictability values reflect recent mobility patterns rather than obsolete historical data.
3.2.2. PRoPHET Forwarding Rule
The baseline PRoPHET protocol employs a deterministic forwarding rule based solely on delivery predictability comparison. When node i carrying message m with destination d encounters node j, the forwarding decision follows:
Algorithm details of baseline PRoPHET’s forwarding rule follow the standard formulation in [8,9].
3.2.3. State Information Underutilization
A key finding that motivates the ProphetRouterRL upgrade is that the forwarding decision of the baseline PRoPHET ignores the available context information. In particular, the forwarding rule depends only on the delivery predictability difference and it does not depend on message attributes or relay node statuses.
The baseline PRoPHET code-level analysis confirms the availability of message properties (remaining TTL, creation time, hop count), relay node states (buffer occupancy, encounter frequency, message load) and temporal factors (time till TTL expiration, buffer dynamics) through use of Message and Connection objects. The forwarding decision is reduced to a single comparison: if (otherPred > myPred), without any contextual information. This underutilization leaves room for improvement: the ProphetRouterRL strategy, presented in Section 4, builds upon the combination of decision-making that makes use of these ignored factors with the existing delivery predictability mechanism of PRoPHET.
3.2.4. PRoPHET Protocol Parameters
The implementation uses the PRoPHET parameter setting of Table 3 to trade off responsiveness to new encounters (, ) and stability against transient mobility patterns (). These parameters are similar to the commonly used parameters for PRoPHET in the literature [8,9]. The initialization constant and the transitivity factor provide a good compromise between responsiveness and stability, and the aging constant and the 30-s time unit suit the timescales of vehicular networks.
3.3. Performance Metrics
Three categories of performance metrics are employed to evaluate ProphetRouterRL.
3.3.1. Protocol Performance Metrics
These metrics evaluate the end-to-end performance of the routing protocol from a network perspective.
- (i)
- Delivery Rate (DR) as the fraction of created messages successfully delivered to their destinations:where is the total number of messages generated during the simulation and is the number of messages successfully delivered. Higher delivery rate indicates better routing effectiveness. This is the primary performance metric.
- (ii)
- Overhead Ratio (OR) as the ratio of redundant message relays to successful deliveries:where is the total number of message relay operations (transmissions between nodes). Only completed transfers of data messages are counted; aborted transfers and control exchanges such as the PRoPHET predictability update are not. Both protocols are measured with the same ONE message-statistics report and the same equation, and ProphetRouterRL adds no transmissions of its own, so the overhead ratio is comparable between them. A lower overhead ratio indicates more efficient use of network resources. An overhead ratio of 300 means each delivered message generated 300 additional transmissions on average.
- (iii)
- Average Latency () as the mean time between message creation and successful delivery, measured in seconds:Lower latency indicates faster message delivery.
- (iv)
- Average Hop Count () as the mean number of relay hops messages traverse before delivery:where counts the number of node-to-node transmissions for message m.
3.3.2. Reinforcement Learning Metrics
These metrics assess the learning process and policy quality of the Q-learning agent.
- (i)
- Q-Values () as the expected cumulative reward for taking action a in state s:The average Q-values are tracked for both actions:
- : Mean Q-value for forwarding actions
- : Mean Q-value for holding actions
If the Q-value is positive, the policy is optimistic. If it is negative, it is pessimistic. - (ii)
- State Space Coverage (SC) as the fraction of state space explored during training:where is the number of unique states observed and is the total state space size (detailed in Section 4). Higher coverage indicates more comprehensive exploration, though effective policies may emerge with sparse coverage if critical states are well-learned.
- (iii)
- SEND Rate (SR) as the fraction of forwarding decisions where the agent chooses to send:Lower SEND rates indicate more selective forwarding policies.
- (iv)
- Convergence Indicators
- (a)
- Rolling standard deviation: Standard deviation of Q-values over a sliding time window, used to detect policy stabilization
- (b)
- Q-value delta: Magnitude of Q-value updates, which should decrease as learning converges
3.3.3. Statistical Validation Metrics
For reproducibility analysis, the following metrics are employed:
- (i)
- Coefficient of Variation (CV)where is the standard deviation and is the mean across the random seeds. indicates excellent reproducibility.
- (ii)
- 95% Confidence Interval where n is the number of random seeds.where is the 97.5th percentile of Student’s t distribution with degrees of freedom.
4. ProphetRouterRL: Proposed Approach
This section presents the two-stage routing architecture, the complementary roles of the two stages, and the system integration.
4.1. Two-Stage Architecture Overview
Stage 1: Standard PRoPHET Router. Stage 1 is the standard PRoPHET router from which ProphetRouterRL inherits. When node i carrying message m with destination d encounters node j, this stage detects the contact, updates the delivery predictabilities, delivers messages directly to a connected destination, and manages the message queues and transfers. Each message–neighbor pair that remains after the direct-delivery step (the neighbor does not yet hold the message) is passed to Stage 2, which decides between SEND and HOLD.
If the decision is HOLD, the message stays in the buffer of node i. There is no explicit timer for this retention; however, the store-carry-forward paradigm [6] applies again at each subsequent encounter, at which the pair is passed to Stage 2 again.
The message is still eligible for forwarding until one of the following three conditions occurs:
- (i)
- A later encounter at which Stage 2 chooses SEND.
- (ii)
- The message’s TTL expires (), upon which it is purged from all buffers.
- (iii)
- Buffer capacity is exhausted, triggering the buffer management policy to drop lower-priority messages.
Stage 2: Q-Learning-based SEND/HOLD Decision. In the second forwarding stage, a trained Q-learning agent decides whether to send or hold the message for each message-neighbor pair passed on by Stage 1, using a rich state representation that includes message attributes, relay node properties, and temporal constraints:
where s is the current state vector (explained in Section 4.2) and is the chosen action from the action vector, a. The decision in this stage takes into account contextual factors not captured by the single-dimensional predictability comparison of the baseline PRoPHET forwarding rule, but relevant for DTN routing performance: buffer availability (the baseline rule cannot infer near-full buffers, leading to irreversible message loss from overflow without retransmission mechanisms),auxiliary message urgency (remaining TTL, as delivery predictability does not imply immediate expiration), relay node characteristics (node type and whether the node has encountered the destination before, which have significant effects on relay reliability in sparse DTN topologies), whether the encountered node is the destination, and routing context (hop count, as unconstrained multi-hop circulation increases overhead in environments with limited contact opportunities).
The state representation of the Q-learning agent does not include . With a component of nine levels, the number of possible states would be 104,544 instead of 11,616 (89% fewer without it). This concerns the size of the representation only: its effect on the learning speed was not measured. Only visited states are stored, so the size of the table depends on the states visited, and the cost of a decision does not depend on the number of possible states (Section 6.1 and Section 6.2). Moreover, the six-dimensional state vector can be fully derived from the Message and Connection objects which are provided by the routing protocol, without any further signaling overhead on the DTN network. Figure 3 presents the detailed flowchart of the routing decision process. It shows the combination of the two steps inside the simulation loop and inside the Q-learning cycle with state extraction, action selection, execution, reward observation, and Q-table update.
Figure 3.
Detailed two-stage routing decision process in ProphetRouterRL.
4.2. State Space Design
Design of the state space is critical for the performance of ProphetRouterRL as it determines what information can be taken into account by the Q-learning agent when making forwarding decisions. The proposed six-dimensional compact state representation captures the routing-relevant elements missed by baseline PRoPHET, while remaining computationally tractable.
4.2.1. State Vector Formulation
At each forwarding decision point, the state s is represented as a six-dimensional vector:
where each component captures a specific aspect of the routing context: Four of the components (hop count, buffer free space, the destination indicator, and node type) describe the message and the relay directly. The remaining TTL () and the destination-encounter indicator () are auxiliary features.
- : Hop Count.
The number of relay hops the message has traversed from its source:
Messages that have traveled numerous hops may be propagated inefficiently and may benefit from more selective forwarding. The hop count is discretized into 11 bins, with all values in the maximum bin to handle outliers.
- : Buffer Free Space.
The available buffer capacity at the encountered relay node j, expressed as a percentage:
The availability of buffers is an important factor: forwarding to a node with an almost full buffer increases the chance of message drop due to buffer overflow. Buffer free space is discretized into 11 bins with 10% granularity (0%, 10%, 20%, …, 100%).
- : Remaining Time-to-Live.
The message’s remaining TTL before expiration:
Remaining TTL is an auxiliary urgency feature. The TTL, in minutes, is mapped to the nearest of six levels. The messages in the evaluated scenario have a TTL of at most 180 min, so they all fall into the lowest level (100) and the feature adds little discrimination here; it would separate messages in scenarios with longer TTLs.
- : Is Final Destination.
A binary indicator of whether the encountered node is the message’s final destination:
When the encountered node is the destination, forwarding should always occur regardless of other factors. This feature enables the agent to learn deterministic delivery behavior.
- : Neighbor Seen Destination.
A binary indicator of whether the encountered relay node has previously encountered the message’s destination:
Nodes that have encountered the destination before are more likely to encounter it again, making them potentially valuable relays. This feature captures encounter history beyond the magnitude of delivery predictability used in Stage 1. It is an auxiliary feature and adds little discrimination in the evaluated scenario. Since a positive predictability can also result from transitive updates, the indicator does not separate direct from indirect encounters, and the agent learns one value for both. Recording a direct encounter whenever the encounter update is applied would allow a third value, at the cost of enlarging the state space by a factor of 1.5; this was, however, not tested in the scope of this study.
- : Neighbor Node Type.
The mobility category of the encountered relay node:
where types are mapped as defined in Section 3.1: 0 = SLOW (pedestrians, cyclists), 1 = FAST (cars, buses), 2 = TRAM (metro trains), 3 = HUB (static infrastructure). This is useful for relay selection, as different node types have different mobility patterns and encounter possibilities.
This compact model trades expressiveness for learnability. This state space is far smaller than high-dimensional alternatives that consider full encounter histories or network data, which keeps the table compact, while still retaining the most routing-relevant information.
4.2.2. Design Rationale
The total state space size for the study is
Several key principles guided the state space design:
Delivery Predictability Difference
Note that the delivery predictability difference is intentionally (not included) in the state representation, even though it is available from the PRoPHET router. By removing this feature, the state space is reduced from 104,544 states to 11,616 states (89%). Neither the sign nor the magnitude of is part of the state, and whether including it would improve the decisions was not tested systematically.
Exploitation of Underutilized Information
A state feature is an available piece of information for the baseline PRoPHET that is not exploited in its forwarding decision (Section 3.2). The state space design addresses the underutilization problem directly: the buffer status, TTL, hop count and node characteristics are all available through the Message and Connection objects in the routing protocol implementation, but the if (otherPred > myPred) rule of baseline PRoPHET never makes use of them.
Composition: WHO vs. WHEN
The state features naturally divide into two categories:
- Relay characteristics (WHO): (buffer), (encounter history), (node type), (is destination)—4 dimensions (67%)
- Temporal factors (WHEN): (hop count), (TTL)—2 dimensions (33%)
This composition suggests that the relay node features are the primary contributors to the effective forwarding decisions, and the remaining TTL is an auxiliary factor. The approach enables the Q-learning agent to learn complex policies that consider both who and when to forward, and beyond the simple gradient-following behavior of PRoPHET.
Each variable answers a question that PRoPHET does not ask at a contact. How far has the message already travelled, and so how much overhead has it cost (hop count)? Can the relay take it without dropping another message (buffer space)? How much time is left (TTL)? Is the relay the destination? Has the relay been near the destination before (encounter history)? What kind of carrier is it (node type)? The last question matters here because the scenario mixes pedestrians, cyclists, cars, buses, trams, and static hubs, with buffers from 10 to 150 MB. All six can be read at the moment of contact, so no global knowledge is needed, and their coarse binning keeps the table at 11,616 states, small enough to be learned within one week of simulated traffic and inspected state by state.
4.3. Reward Function Design
The reward function reflects the learning objective by mapping the routing outcomes to scalar feedback signals that guide Q-learning. A multi-component reward system attempts to balance several DTN objectives: maximizing delivery rate, minimizing path length, buffer resource management, timing limitations, and exploitation of infrastructure capabilities. This section describes the reward structure (Section 4.3.1), and explains key design decisions (Section 4.3.2).
4.3.1. Reward Structure
ProphetRouterRL uses a component-based reward function that analyzes forwarding decisions in five dimensions. Rewards are only awarded for SEND actions. HOLD actions receive an immediate reward of zero, which allows the agent to learn when it is better to hold without any artificial pressure to forward.
The complete reward for a SEND action is made up of five parts:
- (i)
- Delivery Rewards ()Direct delivery and relay potential are rewarded to prioritize successful message delivery:The delivery reward (+40) is one of the two largest terms, together with the hop-count term. The encounter history bonus (+8) is a small additional term that captures relay potential beyond the delivery predictability maintained by the PRoPHET router.
- (ii)
- Hop Count Rewards ()Path efficiency is enforced via successive hop penalties and short-path bonuses:where h is the current hop count. The progressive part is very biased toward direct paths and penalizes longer routes with increasing cost:An additional bonus encourages early delivery:The three-component layout offers a large differentiation: a message at hop 1 receives a total hop reward of , whereas one at hop 7 receives . This avoids excessive message circulation.
- (iii)
- Buffer Status Rewards ()Buffer-aware forwarding reduces message drops due to congestion:
- (iv)
- Urgency Penalties ()Temporal constraints discourage forwarding near-expiring or stale messages:
- (v)
- Node Type Bonuses ()Strategic relay selection is encouraged through infrastructure-aware bonuses:
High-capacity static hubs act as strategic storage places, while high-capacity metro trains provide backbone connectivity. These properties allow the agent to learn that the value of a relay depends on its infrastructure features.
4.3.2. Design Rationale
HOLD actions receive a reward of exactly zero rather than a small penalty. Even a small penalty for holding (e.g., ) led to pathological "always hold" policies, so the agent has to be neutral about waiting and not penalized for it.
The infrastructure-aware bonuses for hubs and trams complete the reward by adding node capacity to PRoPHET’s delivery predictability, directly addressing the state underutilization problem discussed in Section 3.2. In multi-hop routing, delivery may be known only long after the decision that allowed it, so the reward is computed at decision time from the message and the relay (see the paragraph on reward timing below). The buffer, urgency, and node-type terms stand in for the later outcome: they favor relays that are less likely to drop the message. Making each component independent makes the reward easier to understand and retune.
The magnitudes follow a priority order. Delivery (+40) and path length (up to +41 at one hop, a penalty of 49 at seven hops) carry the largest values, since reaching the destination with few copies is the objective. Relay quality comes next, with single bonuses of 4 to 8 for hubs and trams. The buffer and urgency terms are only a few units and act as adjustments between otherwise similar states. Beyond the sixth hop, the penalty grows by 35 per hop, because every extra hop costs another copy and more buffer space.
4.3.3. Q-Learning Formulation
The Q-learning agent maintains a Q-table that estimates the expected cumulative discounted reward for taking action a in state s and following the learned policy thereafter:
where is the discount factor that determines the relative importance of immediate versus future rewards, is the reward received at step , and is the policy being followed.
The Q-values are updated using the temporal difference learning rule:
where
- is the learning rate controlling the speed of Q-value updates
- r is the immediate reward received after taking action a in state s
- is the resulting state after the action
- is the maximum Q-value achievable from the next state
- The bracketed term is the temporal difference error
The sign and magnitude of Q-values carry direct semantic significance for routing decisions. Negative Q-values () indicate a pessimistic value estimate, reflecting that forwarding in state s historically yielded net negative cumulative rewards such as forwarding to buffer-saturated nodes or near-expired messages where penalties outweigh rewards under discount factor . Conversely, positive Q-values () indicate an optimistic estimate, where forwarding consistently produced net positive returns. This sign transition during training directly reflects policy maturation, as quantified in Section 6.3.
Reward Timing and Update
A decision is taken for a message-neighbor pair whenever the router considers sending message m to a connected node that does not yet hold it. The reward is computed immediately after the decision and is not postponed until the message is delivered, dropped, or expired. For a SEND, it combines the terms described above, which depend on the message and the relay; for a HOLD, it is zero. The simulator also builds a next state from the current one (hop count increased by one, slightly lower buffer and TTL) and sends it with the reward to the agent, which applies the update in Equation (36) once. There are no terminal states and no episodes: the update bootstraps from the next state also after a delivery. The eventual delivery of a message is not traced back to the earlier decisions that carried it. The sequential effect of a decision enters through the term , which values a SEND at one hop by the best decision at the next hop, and through the hop-count terms of the reward, which charge every additional copy and hop. The method therefore learns a shaped, one-step value of forwarding and not the eventual delivery outcome itself.
4.3.4. Action Selection
During training, actions are selected using -greedy exploration:
where is the exploration rate. With probability , the agent explores by selecting a random action; otherwise, it exploits current knowledge by selecting the action with the highest Q-value.
4.3.5. Hyperparameter Configuration
The following configuration is utilized according to the hyperparameters’ sensitivity analysis and DTN-specific considerations. The learning rate is set to , which is deliberately conservative to accommodate steady learning given the sparse contact opportunities of intermittently connected DTN environments. The discount factor is high so that the value of a decision includes the decisions taken at the following hops of the same message, and the agent should focus on long-term outcomes. The exploration rate is kept low, , and constant in the week-long training and the reproducibility runs (in the 12-h convergence run of Section 6.1 it decreased linearly from 0.05 to 0.01 over the first 10 million decisions), as the store-carry-forward paradigm benefits from converging routing strategies, with periodic exploration to adjust to changing contact patterns. The Q-table itself is also initialized to zeros for each state-action pair, a neutral baseline that lets the reward signal build the values from scratch, rather than from an assumed prior value.
4.3.6. Algorithm Description
The whole ProphetRouterRL forwarding technique combining the two-stage architecture with Q-learning is presented in Algorithm 1. Here is how the algorithm works: First, Stage 1 is the standard PRoPHET router, which detects the contact, updates the delivery predictabilities, and handles direct delivery to a connected destination. Each remaining message–neighbor pair is then passed to Stage 2 (lines 2–20), which retrieves the current state vector, selects an action by means of -greedy exploration, performs the selected action, computes the reward immediately and updates the Q-table. The Q-table is periodically saved to disk (every 100 updates) so that it can be loaded again between simulation runs or used for analysis.
| Algorithm 1 ProphetRouterRL Forwarding Decision |
| Require: Node i carrying message m and neighbor j that does not yet hold m, after Stage 1 (standard PRoPHET router: contacts, predictability updates, direct delivery) |
| Require: Q-table Q, hyperparameters , , |
| Ensure: Forwarding decision (SEND or HOLD) |
| 1: // Stage 2: Q-Learning Decision |
| 2: {Build 6D state vector} |
| 3: // Action Selection (-greedy) |
| 4: |
| 5: ifthen |
| 6: {Explore} |
| 7: else |
| 8: {Exploit} |
| 9: end if |
| 10: // Execute Action |
| 11: ifthen |
| 12: Transfer message m to node j |
| 13: else |
| 14: Keep message m in node i’s buffer |
| 15: end if |
| 16: // Observe Outcome and Learn |
| 17: {Observe resulting state} |
| 18: {Calculate reward} |
| 19: // Q-Table Update |
| 20: |
| 21: // Periodic Q-Table Persistence |
| 22: if update_count mod 100 = 0 then |
| 23: Save Q-table to disk |
| 24: end if |
| 25: return a |
4.4. System Integration
ProphetRouterRL is implemented as a hybrid Java SE 22.0.1 (Oracle, Austin, TX, USA) and Python 3.12.8 (Python Software Foundation, Wilmington, DE, USA) system that integrates Q-learning with the ONE (Opportunistic Network Environment) simulator (version 1.6.0).
4.4.1. Architecture Components
- (i)
- The ONE simulator as a DTN simulation environment in Java hosts the ProphetRouterRL routing protocol implementation (ProphetRouterRL.java), which extends the baseline PRoPHET router. This component:
- Simulates the DTN network with 129 heterogeneous nodes following realistic mobility patterns
- Manages message generation, buffering, and delivery
- Maintains PRoPHET delivery predictability values
- Extracts state vectors from Message and Connection objects
- Communicates forwarding decisions to/from the Q-learning agent
- Tracks message outcomes for reward calculation
- (ii)
- A Python-based Q-learning agent (ProphetRouterRL.py) manages the learning process independently of the simulator. This component:
- Maintains the Q-table as a sparse dictionary structure (stores only visited state-action pairs)
- Receives state information from the simulator via socket communication
- Performs -greedy action selection
- Returns action decisions to the simulator
- Receives reward signals and updates Q-values accordingly
- Periodically saves Q-table snapshots to disk
- Logs training statistics (average Q-values, state coverage, send rate)
4.4.2. Communication Protocol
The Java simulator and Python agent communicate through a TCP socket connection on localhost. The protocol uses JSON-formatted messages:
- (i)
- Decision Request (Java → Python)For each message-neighbor pair passed to Stage 2, the simulator sends a JSON request containing the current state:{"type": "decision","state": {"hop_count": 3,"buffer_free": 800,"ttl": 700,"is_final_destination": 0,"neighbor_seen_destination": 1,"neighbor_type": 1}}
- (ii)
- Action Response (Python → Java)The agent responds with the selected action:{"action": "SEND" // or "HOLD"}
- (iii)
- Reward Update (Java → Python)Immediately after the decision, the simulator sends reward information:{"type": "reward","reward": 10.0,"next_state": { … }}The agent acknowledges receipt and updates its Q-table accordingly.
4.4.3. Q-Table Management
The Q-table is implemented as a Python dictionary with tuples as keys and Q-values as values:
Q_table = {
((3, 800, 700, 0, 1, 1), "SEND"): 5.23,
((3, 800, 700, 0, 1, 1), "HOLD"): 8.47,
…
}
This sparse form stores only state-action pairings encountered during training and therefore greatly reduces the memory requirements over dense tabular representations. The Q-table is automatically stored every 100 updates and can be loaded again for further training sessions or evaluation runs. This enables incremental learning and reproducible experiments.
4.4.4. Training Statistics
During training, the system tracks several statistics:
- Total decisions made: Count of all forwarding decisions
- State space coverage: Number of unique states visited
- Average Q-values: Mean Q-values for SEND and HOLD actions
- Send rate: Percentage of decisions resulting in SEND
- Exploration actions: Count of random exploration actions
- Exploitation actions: Count of greedy action selections
These statistics are regularly logged and stored with the Q-table, which allows the learning dynamics and convergence behavior to be analyzed (detailed in Section 6).
5. Experimental Setup
This section presents the simulation environment, network scenario, and experimental methodology used for the evaluation of ProphetRouterRL.
5.1. Simulation Environment
The ONE simulator [22] provides realistic mobility modeling, message routing, and network performance metrics, which are required for the evaluation of opportunistic routing algorithms. Key simulation parameters are configured as follows:
- Simulation duration: 604,800 s (7 days)
- Update interval: 0.1 s
- World size: 8000 × 6000 m (the map covers 7.24 × 5.05 km, 36.56 km2)
- Warmup period: 1000 s
- Random seed: MovementModel.rngSeed = 1 in the 7-day runs and 1 to 4 in the reproducibility validation (Section 6.4)
The ProphetRouterRL implementation integrates with The ONE simulator through a TCP socket connection (localhost) to a Python-based Q-learning agent, with a 1-s communication timeout to prevent blocking during learning updates.
5.2. Network Scenario
The experimental scenario is developed to simulate the UKM-Bangi campus area, which is a realistic urban-suburban environment with pedestrian areas, roads and public transport lines. The network contains 129 heterogeneous nodes divided into six mobility classes, and consecutive node IDs are assigned to each class (e.g., p0–p39 for pedestrians, b0–b3 for buses). The full node attributes are listed in Table 2.
The scenario is heterogeneous in three respects: mobility (shortest-path map-based movement for pedestrians, cars, and cyclists, fixed-route movement for buses and trams, and static hubs), radio (a Bluetooth interface and a high-speed interface), and storage (buffers from 10 to 150 MB). The number of nodes, the map, and the mobility models are the same in all experiments; only the random seed of the node movement changes between repeated runs.
The transportation system has four bus lines with a total of 75.91 km and two metro lines (KTM1: 5.87 km, KTM2: 5.48 km) which connect the Bangi and UKM stations. All mobile nodes follow map-based movement models using real road network data, while static hubs are positioned at strategic locations: h10 (5490, 3160), h20 (4460, 2300), and h30 (3700, 1800).
In terms of communication parameters, messages are generated uniformly across all nodes (excluding hubs) with inter-arrival times of 25–35 s, sizes of 500 KB–1 MB, and a time-to-live (TTL) of 180 min. PRoPHET-specific parameters follow standard configurations [8]: delivery predictability initialization , transitivity scaling , aging constant , and time unit 30 s.
5.3. Experimental Methodology
Four experimental phases are conducted to evaluate ProphetRouterRL’s performance and validate learning effectiveness. In Phase 1: Baseline Evaluation, standard PRoPHET (without RL augmentation) is evaluated over the 7-day simulation period to establish baseline performance. This provides the comparison reference for measuring ProphetRouterRL’s improvement. In Phase 2, ProphetRouterRL is trained for the full 7-day period with Q-learning enabled. The agent starts with an empty Q-table (all values initialized to 0.0) and learns through experience. Hyperparameters are set as follows: learning rate , discount factor , and exploration rate (fixed). The Q-table is saved every 100 updates for later analysis.
In Phase 3: Learning Validation, three configurations are evaluated over identical 12-h windows, matching the duration of the convergence analysis in Section 6.1: (1) baseline PRoPHET without RL augmentation, (2) a fresh empty Q-table combined with the two-stage architecture, and (3) the mature Q-table learned from Phase 2. Configuration (2) starts from an empty table and learns online (, ), whereas configuration (3) runs without learning or exploration (, ). The gap between (1) and (2) is the gain of a cold start over PRoPHET, and the gap between (2) and (3) compares a trained table with a cold start.
Finally, in Phase 4: Reproducibility Validation, ProphetRouterRL and baseline PRoPHET were each run for 12 h with four different random seeds (1 to 4) for the node movement. The messages generated are the same in all runs. ProphetRouterRL started every run from the mature Q-table of Phase 2, restored from the same file, with the training hyperparameters (, , ). This design tests the consistency of the learned policy for different realizations of the node movement, not the training process. The delivery rate is analyzed over the runs to compute the mean, standard deviation, and coefficient of variation.
All tests are performed with the same scenario settings (number of nodes, mobility patterns, message production, PRoPHET parameters) for fair comparison. The performance evaluation is carried out based on the metrics defined in Section 3.3 with the main emphasis on delivery rate, overhead ratio, and average latency. For the week-long comparison with the baseline PRoPHET (Section 6.2) and the reproducibility validation (Section 6.4), paired t-tests are also performed on hourly-aggregated metrics at the 95% confidence level and a paired t-test over the random seeds against baseline PRoPHET, respectively, to determine statistical significance.
6. Results and Analysis
This section evaluates ProphetRouterRL experimentally. It is organized to show the learning behavior first and the overall performance afterwards.
6.1. Q-Learning Convergence Analysis
To provide an in-depth characterization of the learning dynamics of ProphetRouterRL, a dedicated convergence analysis experiment was run over 12 h (43,200 s) with continuous tracking of Q-values, state space exploration, and decision patterns. The controlled experiment provides a detailed picture of the agent’s transition from random exploration to stable policy convergence.
To analyse convergence, a new Q-table was used (all values set to 0.0) with , , and an exploration rate that decreased linearly from 0.05 to 0.01 over the first 10 million decisions and stayed at 0.01 afterwards. The 12 h were selected so as to capture the entire learning process from first exploration to convergence to steady operation. In the UKM-Bangi scenario with 129 nodes, the agent made 35.3 million routing decisions in the training phase and found 764 unique states (6.58% of the state space of 11,616). The learning progress was tracked by taking Q-table snapshots every 100 updates and aggregating performance indicators every hour.
6.1.1. Q-Value Evolution and Convergence
Figure 4 shows the evolution of and during the 12 h of training. Both action values exhibit typical reinforcement learning convergence patterns, with initial volatility during exploration and steady stabilization as the agent gains experience. is initially very volatile (mean 39.53 at hour 0) as the agent receives its first rewards for send actions. It decreases and stabilizes around 3.43 at hour 10, indicating that most SEND actions in visited states lead to small positive or negative returns. starts at about 0.61 and increases to 8.73. This means that the agent learns that in many cases it is better to hold than go forward immediately. The convergence of both values after approximately 10 h indicates the agent has learned a stable policy for the encountered state distribution.
Figure 4.
Q-value evolution during 12-h training.
The temporal convergence pattern corresponds directly to the accumulation of Q-learning update steps: during the 12-h training period, the agent processed 35.3 million routing decisions, each of which was followed by a Q-table update (about 35.3 million update steps). The high initial volatility of corresponds to the first 2 h ( million update steps), during which the agent explores diverse state-action pairs with falling from 0.05 to 0.01 and . Stabilization after hour 10 ( million update steps) reflects the diminishing temporal difference error:
indicating that Q-value estimates have converged to stable fixed points under discount factor .
Critically, the final Q-values reveal the learned policy preference: by a factor of 2.54×. This indicates the agent learned a conservative forwarding strategy that prioritizes selective message transmission over aggressive dissemination.
6.1.2. Learning Dynamics and State Space Exploration
Figure 5 shows the state space exploration in Panel A and the SEND rate (share of decisions in which the agent chooses SEND) in Panel B. In the first 2 h, the agent learns >600 states quickly, indicating that it is efficient in discovering common routing contexts. Then the number of visited states levels off at 764 by the end of the simulation. Such asymptotic behavior indicates that the agent has already discovered the most visited states early on and that it is spending the later training time improving Q-values rather than exploring new contexts. A coverage of 6.58% of the state space is sufficient for good routing: the visited states are high-probability routing situations, whereas the unvisited 93.42% are rare or impossible state combinations.
Figure 5.
Learning dynamics during 12-h training.
The share of decisions in which the agent chooses SEND decreases from about 70% at the start to 5.6% in steady state. This decrease is due to the learned conservative policy, in which the agent increasingly chooses HOLD instead of SEND, so that most message-neighbor pairs end with HOLD. This selective forwarding limits replication and is consistent with the high delivery rate achieved.
6.1.3. Convergence Stability and Policy Preference
Figure 6 shows the rolling standard deviation (Panel A) and the evolution of the policy preference (Panel B) as measures of convergence. The stability of the Q-values is measured by the rolling standard deviation (calculated over 1-h periods). Both and show a rapidly decreasing standard deviation: for it drops from > to ≈, while for it decreases from ≈ to <. The decline is shown on a log scale. The values drop to small levels at hour 10, indicating that the Q-values have stabilized to steady estimates. The standard deviation of is lower than that of , so the HOLD action is more predictable (zero immediate reward, predictable future return), while the reward of the SEND action depends on several factors (delivery, buffer status, hop count, etc.).
Figure 6.
Convergence stability analysis.
Panel B shows the and paths and the resulting policy preference. For both values, the variation is large at the beginning (0–2 h). is always larger than after hour 2, which indicates the conservative policy choice. The gap increases up to hour 10, after which the two values stabilize with maintaining a 2.54× lead. The final policy (HOLD-dominant) is a plausible learned policy: the agent sends only in those states in which the message and relay context favor success, and holds otherwise.
The convergence experiment achieved a delivery rate of 91.03% (1329/1460 messages) and shows that effective routing performance is achieved together with the convergence of Q-values. The overhead ratio was 303.76 (average of 304 relay copies per delivered message), indicating selective but sufficient replication. The average latency was 1046 s (17.4 min) which is well within the 180-min TTL limit. These measurements show the feasible routing performance of the learned policy and thus confirm the validity of the convergence analysis as an indicator of the operational behavior.
6.2. Overall Performance Comparison
The learning convergence is established now, and the performance of ProphetRouterRL is compared with the baseline PRoPHET during the entire week-long simulation (604,800 s). This lengthy assessment evaluates whether the learned policy remains effective over a full week of operation and quantifies the improvement over the conventional approach.
6.2.1. Week-Long Training Results
ProphetRouterRL was trained for 7 days, starting with an empty Q-table and using , , and a constant . Baseline PRoPHET was simulated with the same scenario setting for 7 days. The results are summarized in Table 4. ProphetRouterRL achieves an average delivery rate of 93.12% compared to 46.47% for baseline PRoPHET, representing a 100.4% relative improvement. ProphetRouterRL successfully delivers 19,083 out of 20,494 messages generated (vs. 9523 for baseline), an increase of 9560 more successful deliveries (absolute terms). The improvement indicates that the learned policy mitigates the state under-utilization problem discussed in Section 3.2.
Table 4.
Overall performance comparison: ProphetRouterRL vs. baseline PRoPHET (7-day simulation).
6.2.2. Resource Efficiency and Latency
ProphetRouterRL also improves resource efficiency in addition to delivery rate. The overhead ratio decreases from 545.68 to 330.91 (39.4% reduction), showing that the learned conservative policy can prevent wasteful message repetition with a high delivery rate. The average latency reduces from 1953 s (32.6 min) to 1144 s (19.1 min), a reduction of 41.4%. The reduction in latency means that the learned policy is more able to forward messages by not taking long detours, and therefore achieves a smaller time-to-delivery.
ProphetRouterRL and baseline PRoPHET were compared using paired t-tests on hourly aggregated data. All improvement results are statistically significant (, 95% confidence level). The gain is sustained over the full 7-day period, in which the agent learns online, and is not limited to the early hours.
The overhead ratio counts transfers per delivered message, so it also falls because deliveries double. In absolute terms, ProphetRouterRL completes 6.33 million transfers over the week against 5.21 million for PRoPHET (21.7% more), while delivering 19,083 messages instead of 9523; the overhead ratio, which is the number of extra transfers per delivered message, drops from 545.68 to 330.91. Counting all started transfers, including the aborted ones (6.96 million against 5.70 million, 22.1% more), gives overhead ratios of 363.6 against 597.5, a reduction of 39.1%, so the comparison does not depend on this choice. Energy was not simulated. If the energy spent is taken, as a rough proxy, to be proportional to the number of transfers, ProphetRouterRL uses about 39% less energy per delivered message and 21.7% more in total.
6.2.3. Computational Cost
Training was run offline in the simulator. The 12-h convergence run (Section 6.1) processed 35.3 million decisions in 15.2 h of wall-clock time on Ubuntu 22.04.4 LTS (Canonical Ltd., London, UK) with an Intel® Core™ i7-13700H processor (Intel Corporation, Santa Clara, CA, USA) (20 logical cores) and 32 GB of memory, which is about 650 decisions per second, including the simulation itself, the socket exchange with the agent, and periodic saving of the Q-table. The week-long training run processed 284 million decisions, and each 12-h evaluation run about 120 million.
The cost of one decision does not depend on the number of nodes, messages, or states. The agent builds a six-element state, reads two Q-values, and takes the larger one; a learning update reads two values and writes one. The router still evaluates each buffered message against each connected neighbor, as PRoPHET does, so the learned policy adds a constant amount of work per evaluated pair. In a benchmark of the released agent without simulator or socket, on the same machine (Python 3.12.8), a decision took 1.9 microseconds on average, with 99% of calls under 4 microseconds, and a learning update took 1.1 microseconds.
The Q-table of the week-long run holds 846 visited states (1692 state–action values) and occupies 39,595 bytes (about 40 KB) on disk and about 360 KB as Python objects in memory; a dense table over all 11,616 states would need 186 KB in double precision. In the simulation, each decision is a round trip to the Python agent over a local TCP socket, and the wall-clock time per decision, including the simulation, was 1.5 ms (median) in the convergence run, which is an upper bound on the decision latency. On a real node, the table would be held locally, and a decision would be a table lookup of the order of microseconds. The table size and the cost of a decision do not grow with the number of nodes, although the number of decisions grows with the number of contacts and buffered messages. Measurements on embedded or on-board hardware, and with different numbers of nodes, were not made.
6.3. Learning Impact Validation
A validation was conducted comparing ProphetRouterRL with a mature Q-table (learned from week-long training) against ProphetRouterRL with a fresh empty Q-table. The mature Q-table is the table acquired after the whole seven-day training run (604,800 s), not the 12-h convergence snapshot studied in Section 6.1.
Both configurations ran for 12 h on the same scenario and message set. The fresh run started from an empty Q-table and learned online with and . A high exploration rate was used for the empty table because it holds no knowledge and the agent has to visit many states in order to learn, whereas the trained table was used greedily. The mature run used the table from the seven-day run with and , without learning or exploration. Table 5 therefore compares a cold start with high exploration against a trained table, so its gap also contains the cost of exploration. Under identical settings, the 12-h run from an empty table of Section 6.1 (, ) delivered 91.03% of the messages (overhead ratio 303.76, average latency 1046 s), close to the 90.26% (333.9, 1070 s) of the trained table in Table 6.
Table 5.
Q-learning effectiveness validation: mature Q-table (trained for 7 days, evaluated for 12 h) vs. fresh Q-table (12-h evaluation).
Table 6.
Reproducibility validation: ProphetRouterRL vs. baseline PRoPHET over four random seeds (12-h runs).
The two configurations are compared over a common 12-h period in Table 5. The mature Q-table delivered 91.16% of the messages against 58.42% for the fresh one (a 56.0% relative improvement), with lower overhead, latency, and average hop count.
The validation results can be read in three steps:
- 1.
- Cold start: In the 12-h window, the fresh Q-table configuration (empty table, online learning, ) achieves 58.42% compared to 46.64% for baseline PRoPHET.
- 2.
- Trained table: The mature Q-table trained over seven days and evaluated for 12 h without learning or exploration (, ) achieves 91.16% compared to 58.42% for the fresh Q-table. This gap compares a trained table with a cold start with high exploration; the comparison under identical settings is given above.
- 3.
- Extended training contribution: The week-long training result (93.12%) marginally exceeds the 12-h evaluation of the mature Q-table (91.16%), indicating that most learning converges within the first 12 h, with extended training providing measurable but diminishing refinement.
The Q-value comparison in Figure 7 further illustrates the difference between the two tables: the sign transition from (fresh, pessimistic) to (mature, optimistic) is consistent with the performance gap observed in Table 5.
Figure 7.
Average Q-value () comparison between the fresh Q-table (12-h evaluation) and the mature Q-table (trained for 7 days, evaluated for 12 h).
The mature Q-table (846 visited states) also shows which variable shapes the policy most. SEND is the preferred action in 91% of the states with at most two hops, in 44% of those with three to five hops, and in only one of the 384 states with six or more hops, in line with the hop terms of the reward. Relay type and free buffer space change the preference by smaller margins. This describes the learned policy and is not an ablation; the comparison of the trained table with a cold start is given in Table 5.
6.4. Statistical Validation and Reproducibility
The consistency of the learned policy was tested with four 12-h runs of ProphetRouterRL, each with a different random seed (1 to 4) for the node movement. The messages generated are the same in all runs, so the seed changes where the nodes move and which nodes meet. Every run started from the mature Q-table of the week-long training (Section 6.3), restored from the same file, and used the training hyperparameters (, , ), so the agent keeps learning and exploring as in normal operation. Baseline PRoPHET was simulated with the same four seeds.
Table 6 lists the results and Figure 8 shows the delivery rates. ProphetRouterRL delivered 89.73%, 90.75%, 90.68%, and 89.86% of the 1460 messages (mean 90.26%, standard deviation 0.54%, CV = 0.60%), while PRoPHET delivered between 46.16% and 46.64% (mean 46.40%, standard deviation 0.20%). Averaged over the seeds, ProphetRouterRL delivers 43.85 percentage points more (95% confidence interval 42.8 to 44.9), the overhead ratio is 36.8% lower (333.9 against 528.4), and the average latency is 39.5% lower (1070 s against 1768 s). Paired t-tests over the four seeds give for all three metrics.
Figure 8.
Delivery rate of ProphetRouterRL for four random seeds (mature Q-table).
These runs use the agent as in training, with learning and exploration switched on, which explains why the overhead ratio here (about 334) is higher than in the controlled evaluation of Section 6.3, where both were switched off (Table 5: 194.97).
The low standard deviation shows that the result does not depend on one realization of the node movement. The message set is fixed, and only one map and one node density were used, so this does not cover other traffic patterns or other topologies (see the limitations in Section 7). In every seed, the gain over PRoPHET is large, and the two ranges of delivery rate do not overlap (46.2–46.6% against 89.7–90.8%).
7. Discussion
The experimental results show that ProphetRouterRL can significantly improve the performance of the baseline PRoPHET routing by combining reinforcement learning with contact prediction. The two stages have different jobs. The PRoPHET router handles contacts, predictability updates, and message transfer. The Q-learning policy then decides whether to SEND or HOLD, based on the hop count of the message, the buffer space and type of the encountered node, whether it is the destination, and, as auxiliary features, the remaining TTL and the destination-encounter history. The reward is computed at decision time, and the eventual delivery of a message is not traced back to the earlier decisions, so the method learns a shaped value of forwarding; delayed credit assignment along the message path is left for future work. The GRTR comparison looks only at the delivery predictability of the two nodes, whereas the learned policy can also weigh the cost of long paths and the condition of the relay. Section 6.2 compares the two protocols under identical map, nodes, traffic, and settings, and Section 6.4 shows that the result is repeatable across four random seeds.
The convergence analysis shows that the learning is fast (10–12 h) and that the resulting policies heavily favor selective forwarding over aggressive transmission. The learned preference for HOLD actions in non-optimal states reduces the overhead ratio by 39.4% (from 545.68 to 330.91) with high delivery rates (93.12%), which indicates that selective message retention based on message and relay context outperforms the predictability-driven replication of PRoPHET in the evaluated scenario. The four runs with different seeds (delivery rate 90.26% with a standard deviation of 0.54%, against 46.40% for PRoPHET) show that the gain does not depend on one realization of the node movement.
There are a few limitations to note. The experiments are conducted in one mobility scenario (UKM-Bangi). First, performance in several network topologies and contact patterns needs to be verified. Secondly, the implementation is based on tabular Q-learning, which may have scaling problems in networks with larger state spaces. Third, the system assumes that nodes can maintain persistent Q-tables; thus, applications that require fresh deployments would need other methodologies or pre-trained models. Ablation studies that vary single state variables or reward terms are left for future work, since they require retraining the agent. The reward magnitudes and thresholds were set manually, and the sensitivity of the policy to them was not tested. Evaluation under other maps, mobility models, node densities, communication ranges, message-generation settings, and levels of network uncertainty (for example, link failures) is also left for future work, since it would require retraining the agent. The results should therefore be read as valid for the evaluated scenario. The comparison in this study is limited to PRoPHET, the router that ProphetRouterRL extends; a wider comparison with other DTN and RL-based routers is outside its scope. The RL-based routers reviewed in Section 2.2 were evaluated by their authors in other scenarios, so their reported results cannot be compared directly with those of this study, and no conclusion is drawn here about how ProphetRouterRL performs relative to them.
8. Conclusions and Future Work
This study presents ProphetRouterRL, a two-stage routing architecture that combines PRoPHET’s delivery predictability with Q-learning-based decision optimization for V2X delay-tolerant networks. In the proposed approach, the standard PRoPHET router handles contacts, delivery predictability, and direct delivery, while a Q-learning policy decides SEND or HOLD for each message-neighbor pair using relay node attributes and message constraints. The system is capable of learning effectively within a short period of training (convergence within 10–12 h) with a compact six-dimensional state space design. Future research directions include:
- (i)
- Extending to deep reinforcement learning architectures to handle larger state spaces and improve scalability and security.
- (ii)
- Developing transfer learning approaches to adapt learned policies across different urban scenarios with minimal retraining.
- (iii)
- Conducting real-world testbed validation to evaluate performance under actual vehicular mobility patterns and wireless channel conditions, including measurements of energy use and decision latency on embedded or on-board hardware.
- (iv)
- Evaluating additional maps, mobility models, node densities, and levels of network uncertainty, and widening the comparison to other DTN protocols, under identical settings.
Author Contributions
Conceptualization, U.S.H. and A.A.-S.; Formal analysis, U.S.H.; Investigation, U.S.H.; Validation: A.A.-S. and E.A.A.A.; Methodology, U.S.H., A.A.-S. and N.F.A.; Writing—original draft, U.S.H.; Writing—review and editing, A.A.-S., N.F.A. and E.A.A.A. All authors have read and agreed to the published version of the manuscript.
Funding
This research received no external funding.
Institutional Review Board Statement
Not applicable.
Informed Consent Statement
Not applicable.
Data Availability Statement
The original data and code presented in this study are openly available in Zenodo at https://doi.org/10.5281/zenodo.23146543 [23].
Conflicts of Interest
The authors declare no conflicts of interest.
Abbreviations
The following abbreviations are used in this manuscript:
| V2X | Vehicle-to-Everything |
| V2V | Vehicle-to-Vehicle |
| V2I | Vehicle-to-Infrastructure |
| V2P | Vehicle-to-Pedestrian |
| V2N | Vehicle-to-Network |
| DSRC | Dedicated Short-Range Communications |
| C-V2X | Cellular Vehicle-to-Everything |
| LTE-V2X | Long-Term Evolution Vehicle-to-Everything |
| NR-V2X | New Radio Vehicle-to-Everything |
| DTN | Delay-Tolerant Networking |
| VDTN | Vehicular Delay-Tolerant Networking |
| PRoPHET | Probabilistic Routing Protocol using History of Encounters and Transitivity |
| GRTR | Greater Than |
| RL | Reinforcement Learning |
| UCB | Upper Confidence Bound |
| TTL | Time-to-Live |
| ONE | Opportunistic Network Environment |
| TCP | Transmission Control Protocol |
| JSON | JavaScript Object Notation |
| WKT | Well-Known Text |
| BT | Bluetooth |
| HS | High-Speed |
| IF | Interface |
| KB | Kilobyte |
| MB | Megabyte |
| UKM | Universiti Kebangsaan Malaysia |
| DR | Delivery Rate |
| OR | Overhead Ratio |
| SC | State Space Coverage |
| SR | SEND Rate |
| CV | Coefficient of Variation |
| CI | Confidence Interval |
References
- Lang, P.; Zhang, P.; Duan, X.; Zhou, J.; Leung, V. Towards 6G vehicular networks: Vision, technologies, and open challenges. Comput. Netw. 2025, 257, 110940. [Google Scholar] [CrossRef] [Scilit]
- Abdullah, N.; Shen, T.; Abu Samah, A.; Nordin, R. Internet of vehicles based on cellular-vehicle-to-everything (C-V2X). Int. J. Integr. Eng. 2023, 15, 244–252. [Google Scholar] [CrossRef] [Scilit]
- Yu, H.; Zhang, Y.; Wang, X.; Chen, L.; Liu, Z. V2X fusion communication framework based on VANETS collaborative autonomous driving. Trans. Emerg. Telecommun. Technol. 2025, 36, e70263. [Google Scholar] [CrossRef] [Scilit]
- U.S. Department of Transportation. Vehicle-to-Everything (V2X) Technology: Executive Briefing 2024; Technical Report; U.S. DOT Intelligent Transportation Systems: Washington, DC, USA, 2024.
- Benamar, N.; Singh, K.; Benamar, M.; Ouadghiri, D.E.; Bonnin, J. Routing protocols in vehicular delay tolerant networks: A comprehensive survey. Comput. Commun. 2014, 48, 141–158. [Google Scholar] [CrossRef] [Scilit]
- Fall, K. A delay-tolerant network architecture for challenged internets. In Proceedings of the ACM SIGCOMM 2003 Conference, Karlsruhe, Germany, 25–29 August 2003; pp. 27–34. [Google Scholar] [CrossRef] [Scilit]
- Cerf, V.; Burleigh, S.; Hooke, A.; Torgerson, L.; Durst, R.; Scott, K.; Fall, K.; Weiss, H. Delay-Tolerant Networking Architecture. RFC 4838, Internet Engineering Task Force (IETF). 2007. Available online: https://www.rfc-editor.org/info/rfc4838 (accessed on 8 November 2026).
- Lindgren, A.; Doria, A.; Schelén, O. Probabilistic routing in intermittently connected networks. ACM SIGMOBILE Mob. Comput. Commun. Rev. 2003, 7, 19–20. [Google Scholar] [CrossRef] [Scilit]
- Lindgren, A.; Doria, A.; Davies, E.; Grasic, S. Probabilistic Routing Protocol for Intermittently Connected Networks. RFC 6693, Internet Engineering Task Force (IETF). 2012. Available online: https://www.rfc-editor.org/info/rfc6693 (accessed on 8 November 2026).
- Vahdat, A.; Becker, D. Epidemic Routing for Partially Connected Ad Hoc Networks; Technical Report CS-2000-06; Duke University: Durham, NC, USA, 2000. [Google Scholar]
- Abdelkader, T.; Naik, K.; Nayak, A.; Goel, N.; Srivastava, V. A Performance Comparison of Delay-Tolerant Network Routing Protocols. IEEE Netw. 2016, 30, 46–53. [Google Scholar] [CrossRef] [Scilit]
- Rezaei, P.; Derakhshanfard, N. Reinforcement learning based routing in delay tolerant networks. Wirel. Netw. 2025, 31, 2909–2923. [Google Scholar] [CrossRef] [Scilit]
- Sutton, R.; Barto, A. Reinforcement Learning: An Introduction, 2nd ed.; MIT Press: Cambridge, MA, USA, 2018. [Google Scholar]
- Schindlegger, F.; Hupperich, T. Reinforcement learning and movement prediction for adaptive routing in opportunistic networks. Comput. Netw. 2026, 278, 112084. [Google Scholar] [CrossRef] [Scilit]
- Phutela, A.; Koshta, S.; Pal, S.; Sampalli, S. LearnRouter: A Reinforcement Learning-Based Routing for Opportunistic Mobile Networks Using Multi-Armed Bandit Approach. IEEE Trans. Mob. Comput. 2025, 25, 6443–6454. [Google Scholar] [CrossRef] [Scilit]
- Noorizadegan, A.; Wang, S.; Ling, L.; Dominguez-Morales, J. A practitioner’s guide to Kolmogorov–Arnold networks. Comput. Sci. Rev. 2026, 62, 100991. [Google Scholar] [CrossRef] [Scilit]
- Spyropoulos, T.; Psounis, K.; Raghavendra, C. Spray and wait: An efficient routing scheme for intermittently connected mobile networks. In Proceedings of the ACM SIGCOMM Workshop on Delay-Tolerant Networking, Philadelphia, PA, USA, 22–26 August 2005; pp. 252–259. [Google Scholar] [CrossRef] [Scilit]
- Tripura, S.; Bera, D.; Panda, S.; Mishra, S. Adaptive Q-learning-based event-prioritized QoS and incentive optimization for enhancing safety in vehicular fog networks. J. Netw. Comput. Appl. 2025, 234, 100821. [Google Scholar]
- Chauhan, P.; Sharma, N.; Kumar, A. Q-learning based nature inspired algorithm for traffic optimization in vehicular networks. Int. J. Intell. Transp. Syst. Res. 2025, 23, 1849–1873. [Google Scholar] [CrossRef] [Scilit]
- Mammeri, Z. Reinforcement learning based routing in networks: Review and classification of approaches. IEEE Access 2019, 7, 55916–55950. [Google Scholar] [CrossRef] [Scilit]
- Lozano-Cuadra, F.; Soret, B.; Sanchez Net, M.; Cauligi, A.; Rossi, F. Learning decentralized routing policies via graph attention-based multi-agent reinforcement learning in lunar delay-tolerant networks. arXiv 2025, arXiv:2510.20436. [Google Scholar]
- Keränen, A.; Ott, J.; Kärkkäinen, T. The ONE simulator for DTN protocol evaluation. In Proceedings of the SIMUTools 2009, Rome, Italy, 2–6 March 2009. [Google Scholar] [CrossRef] [Scilit]
- Hachim, U.S.; Abu-Samah, A.; Abdellaoui Alaoui, E.A.; Abdullah, N.F. ProphetRouterRL: Code, Simulation Setup and Results; Data Set and Code; Zenodo: Geneva, Switzerland, 2026. [Google Scholar] [CrossRef]
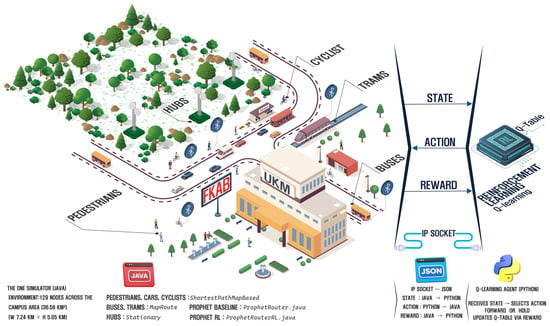
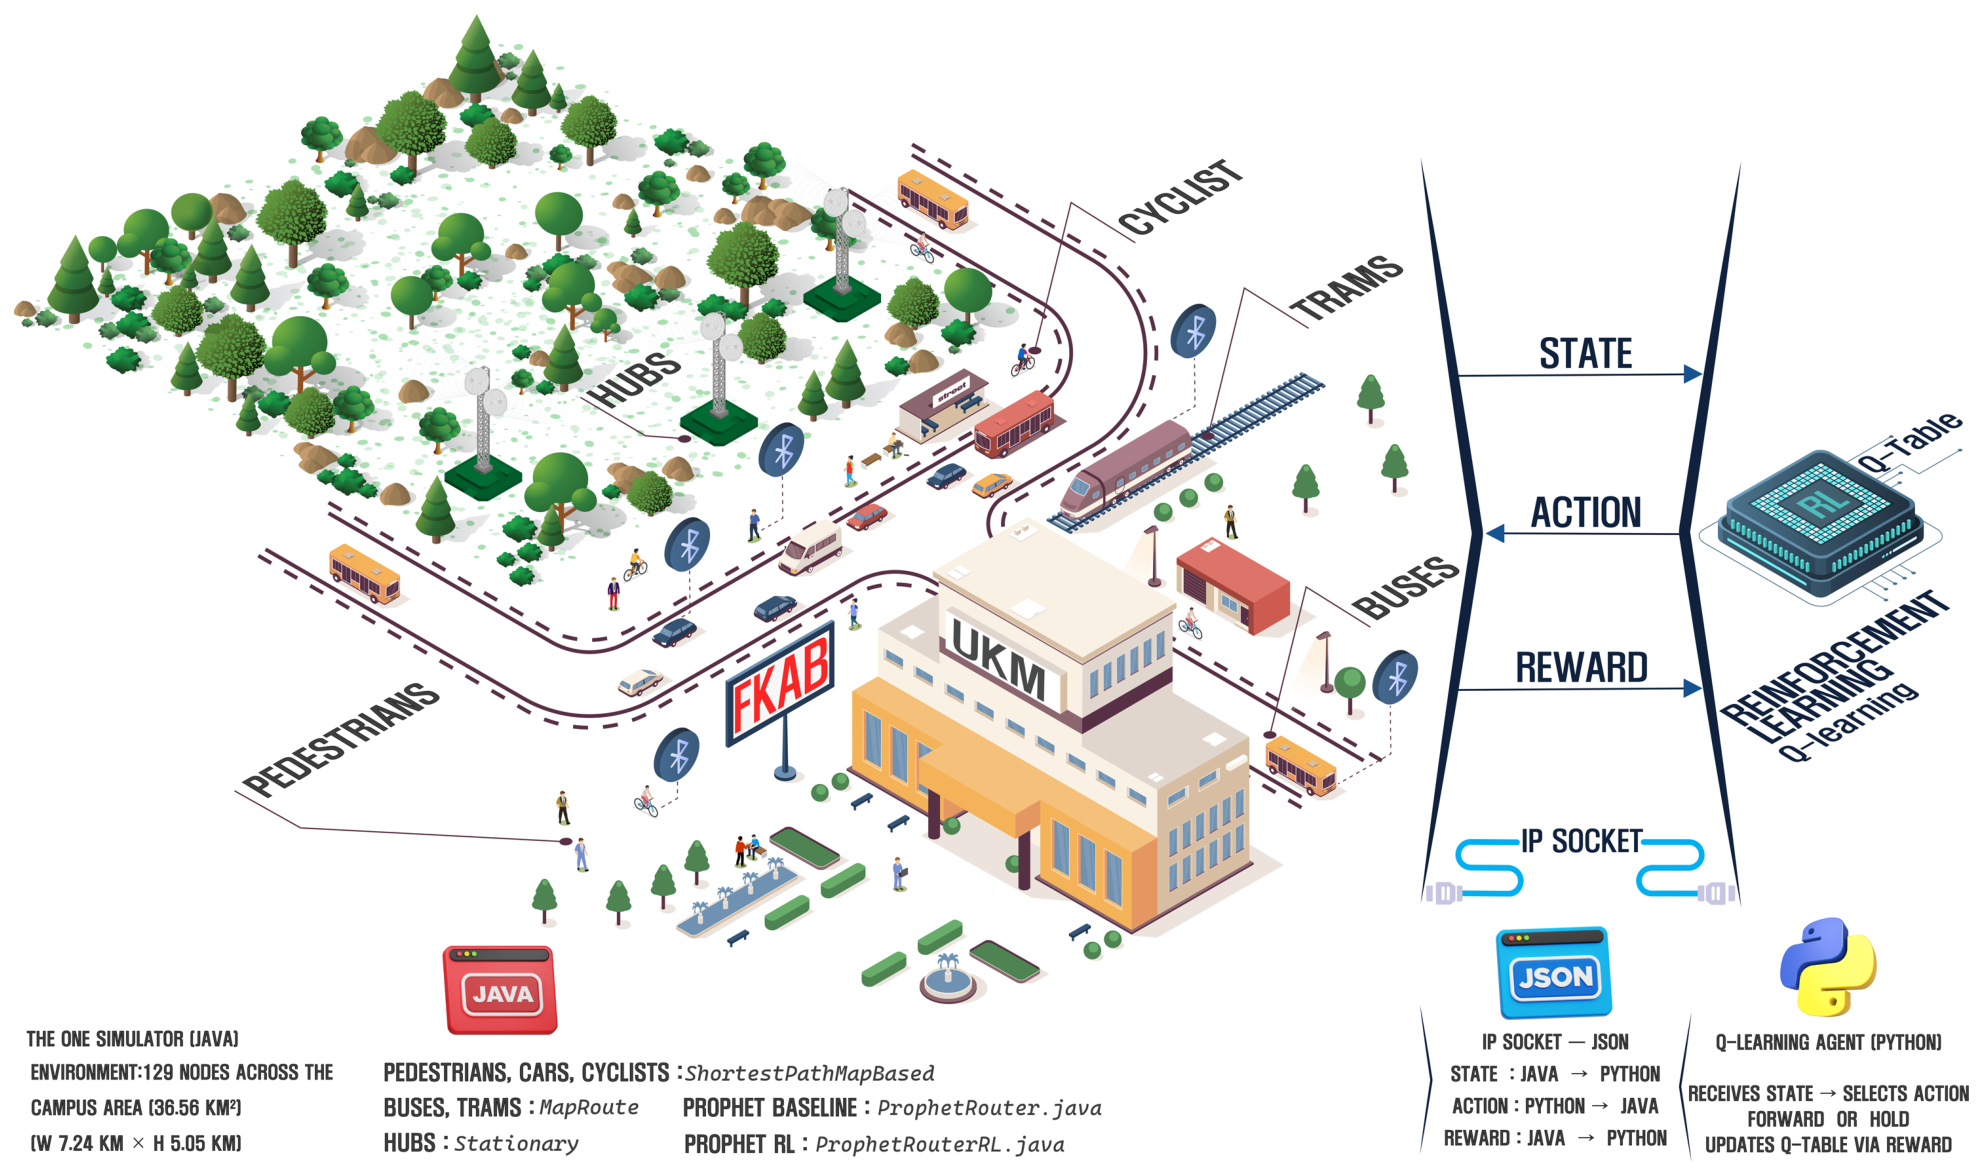
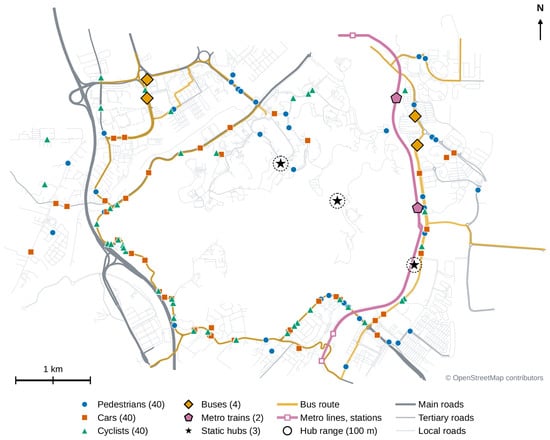
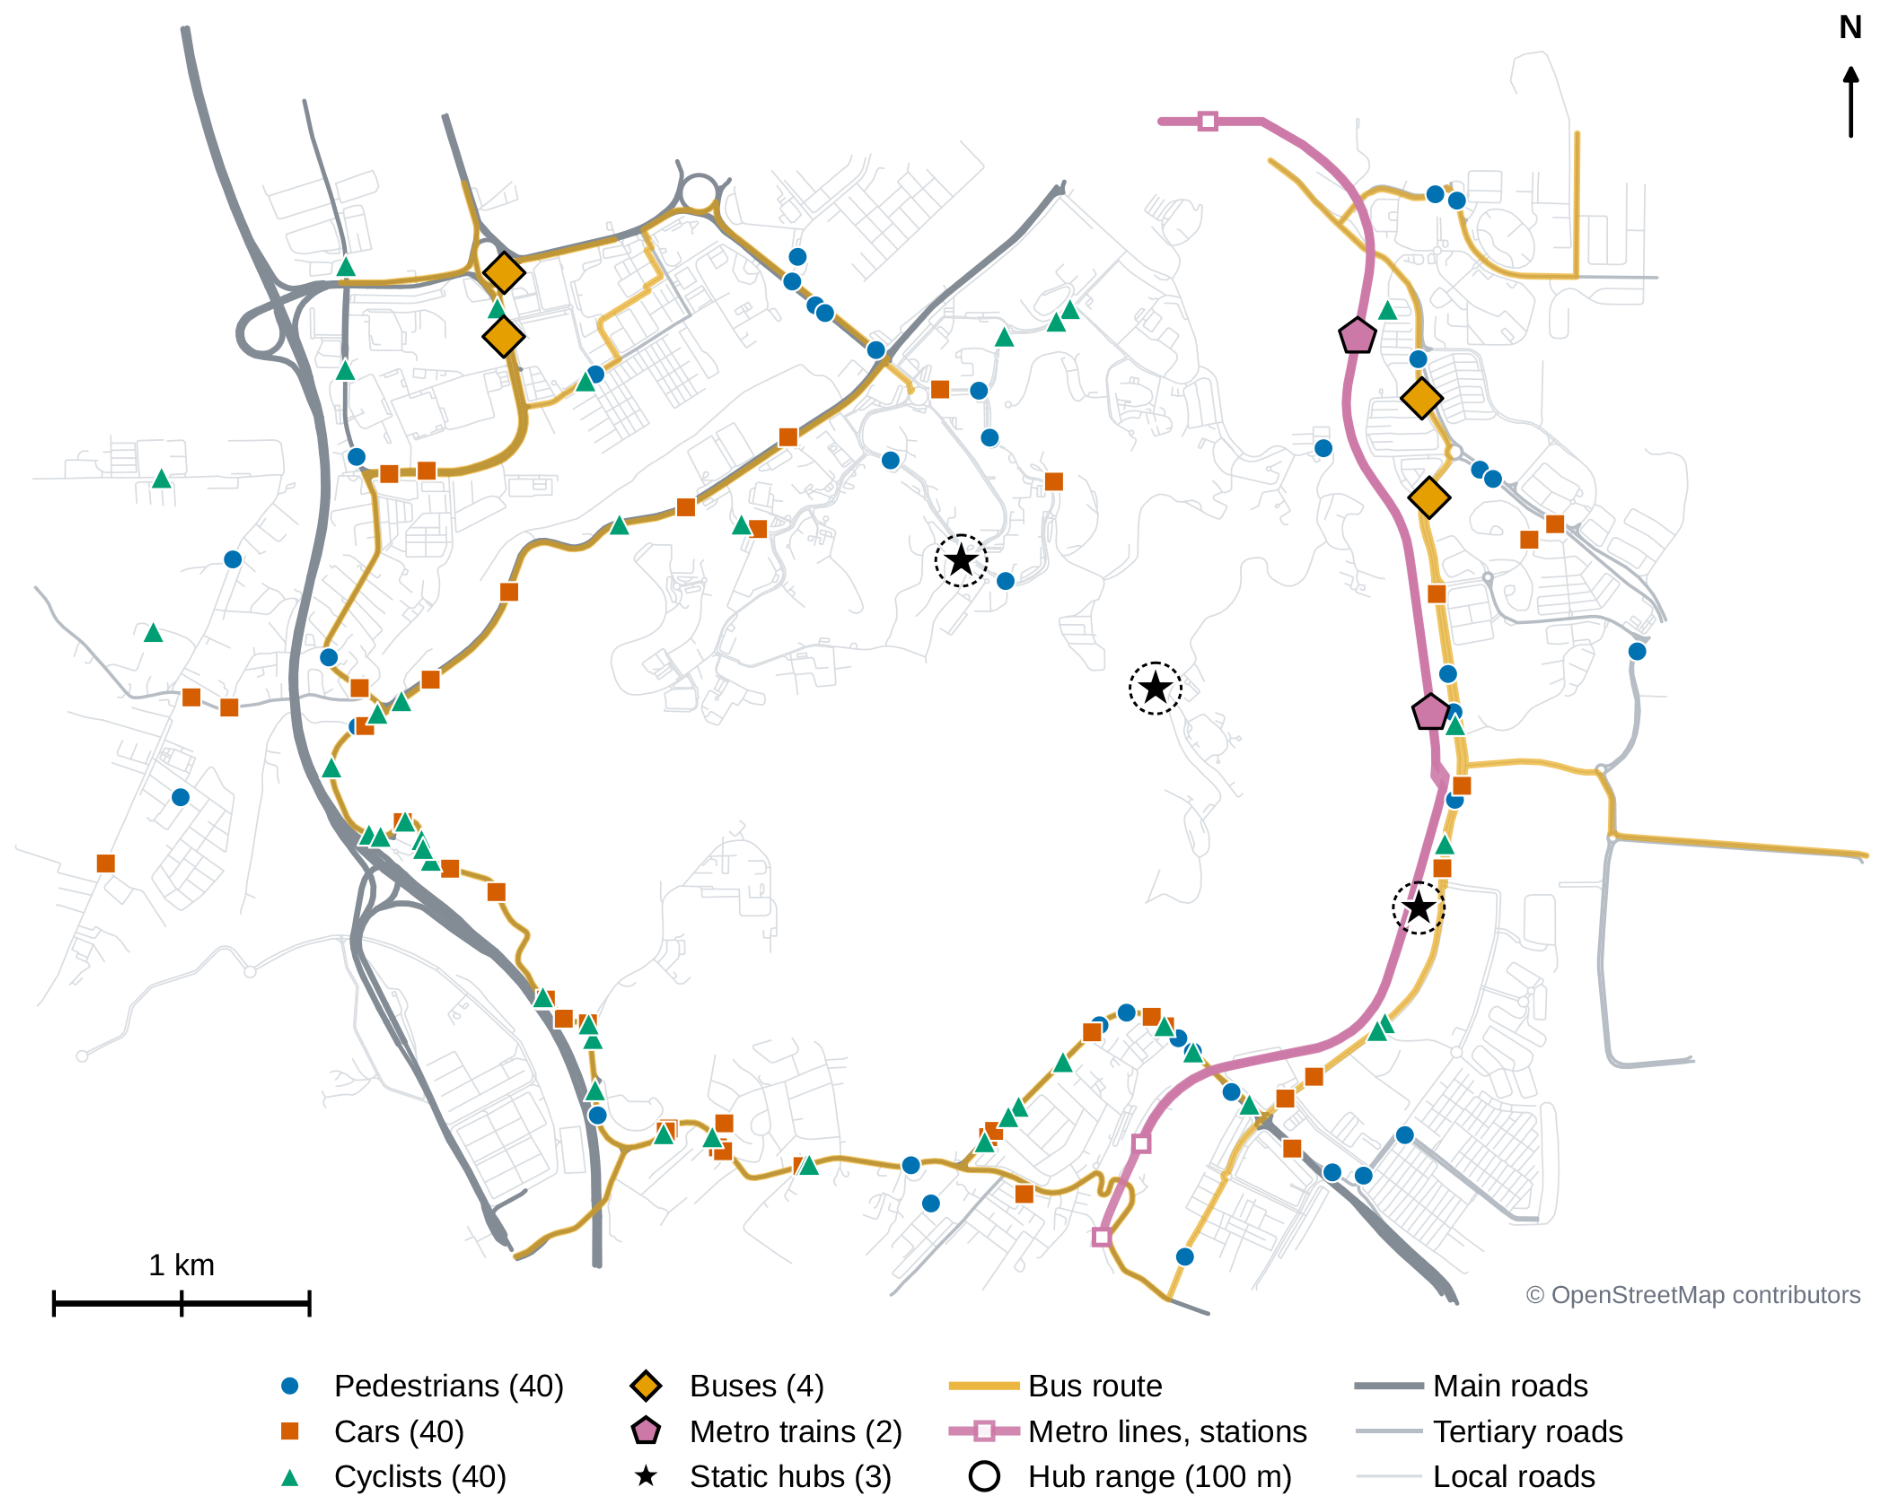
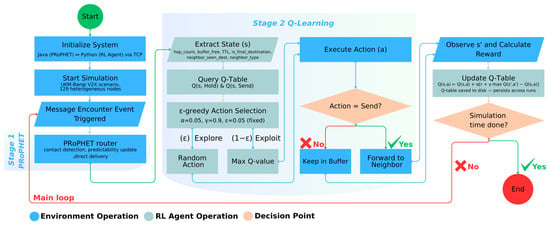
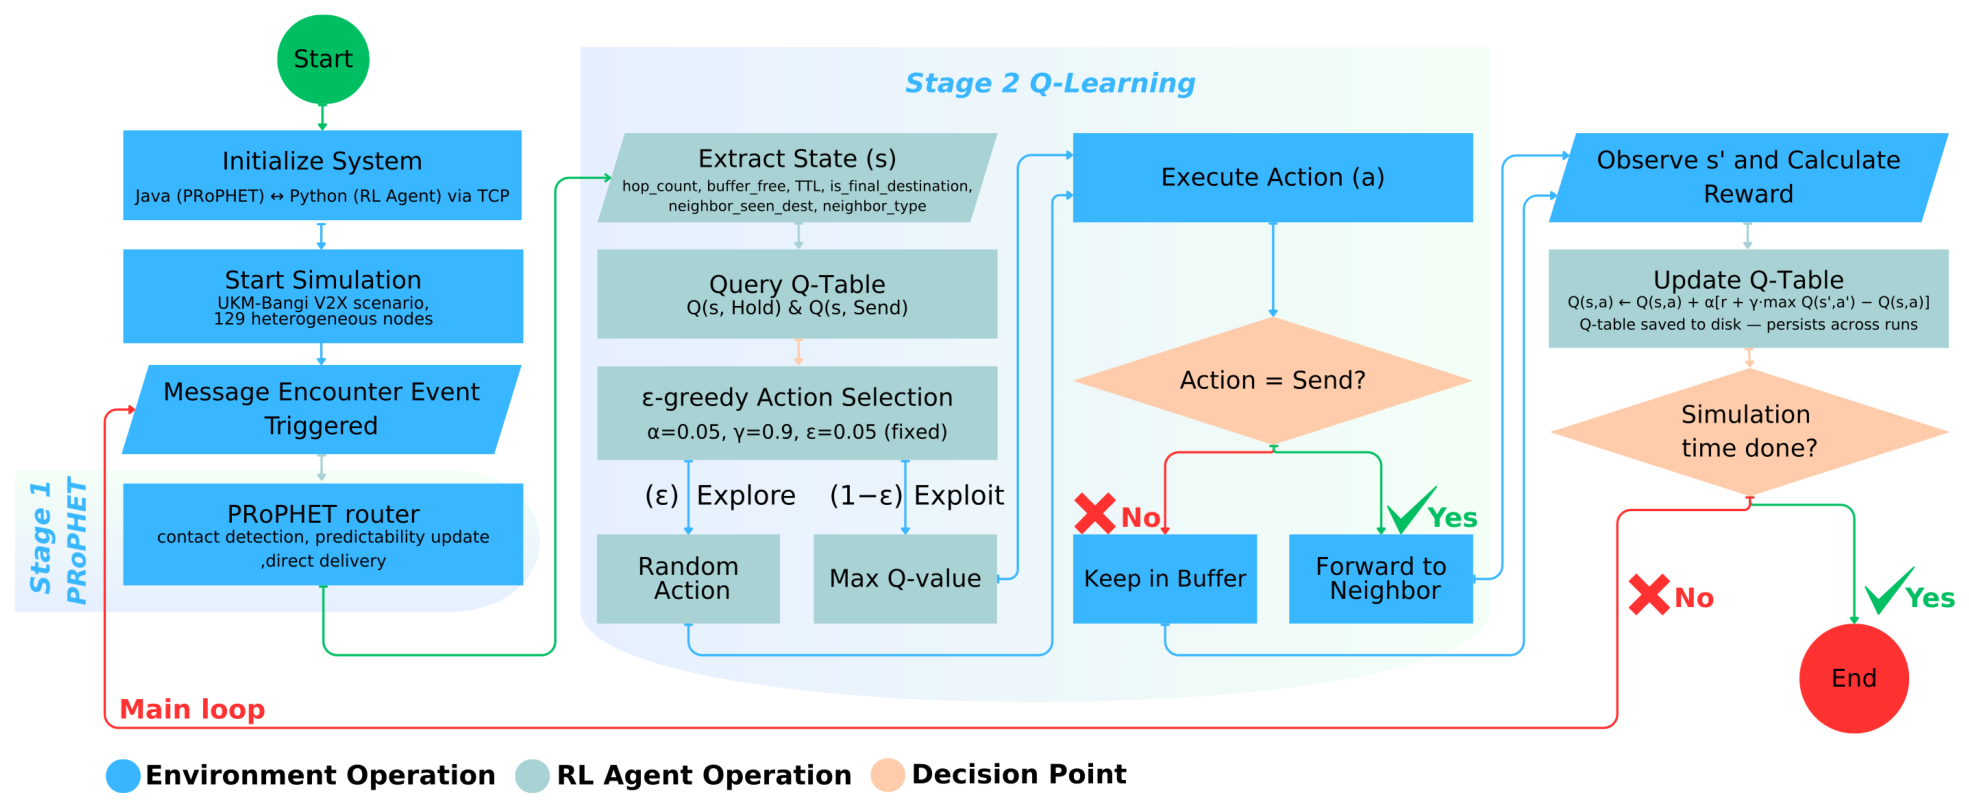
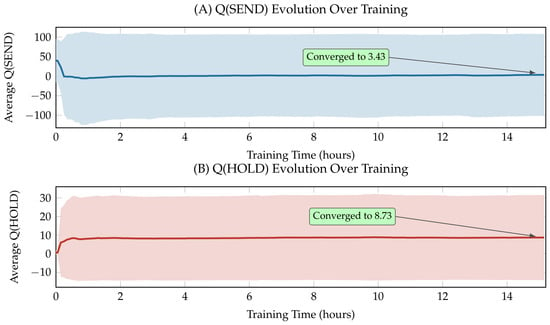
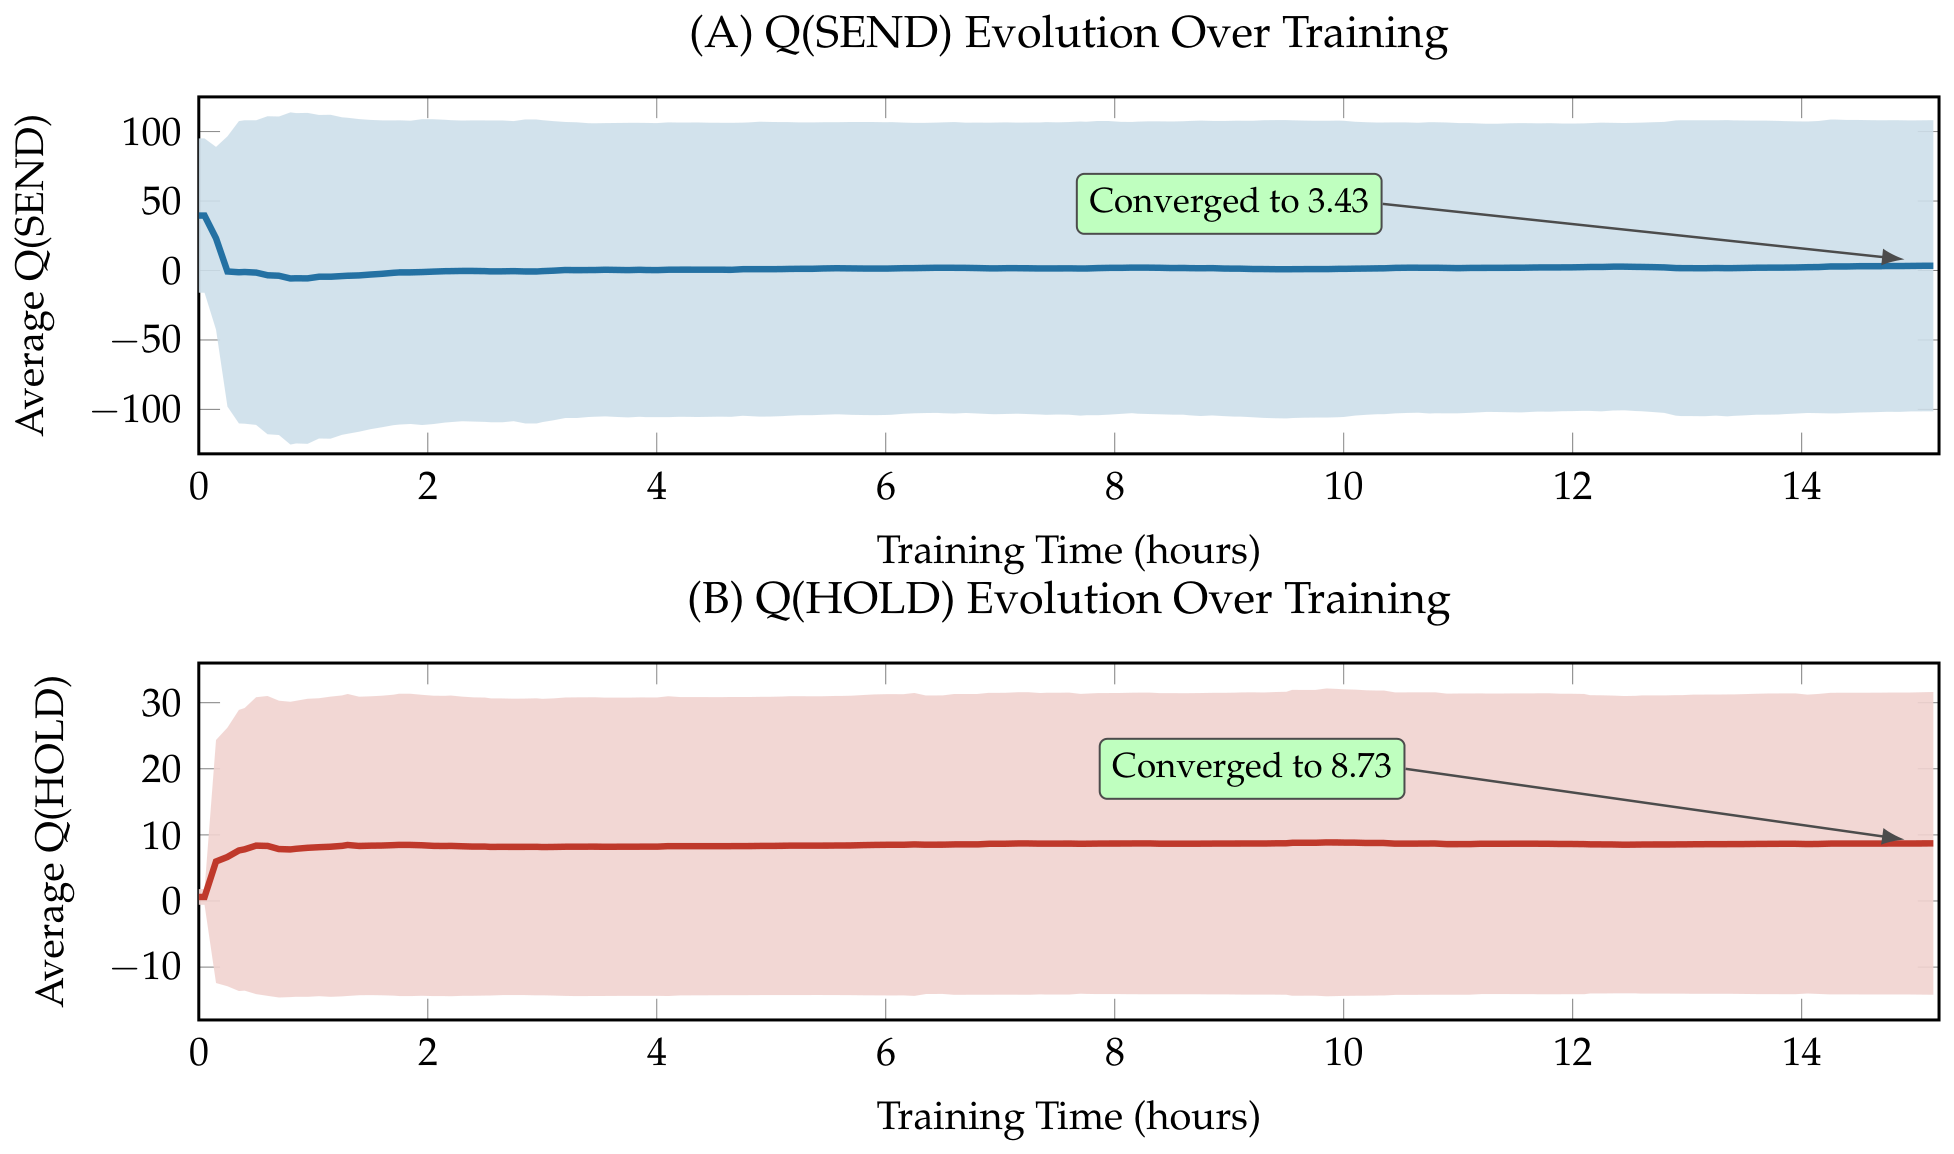
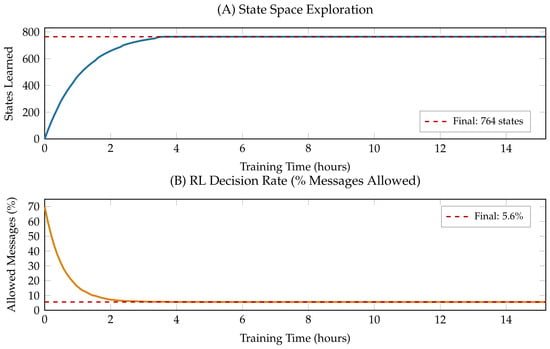
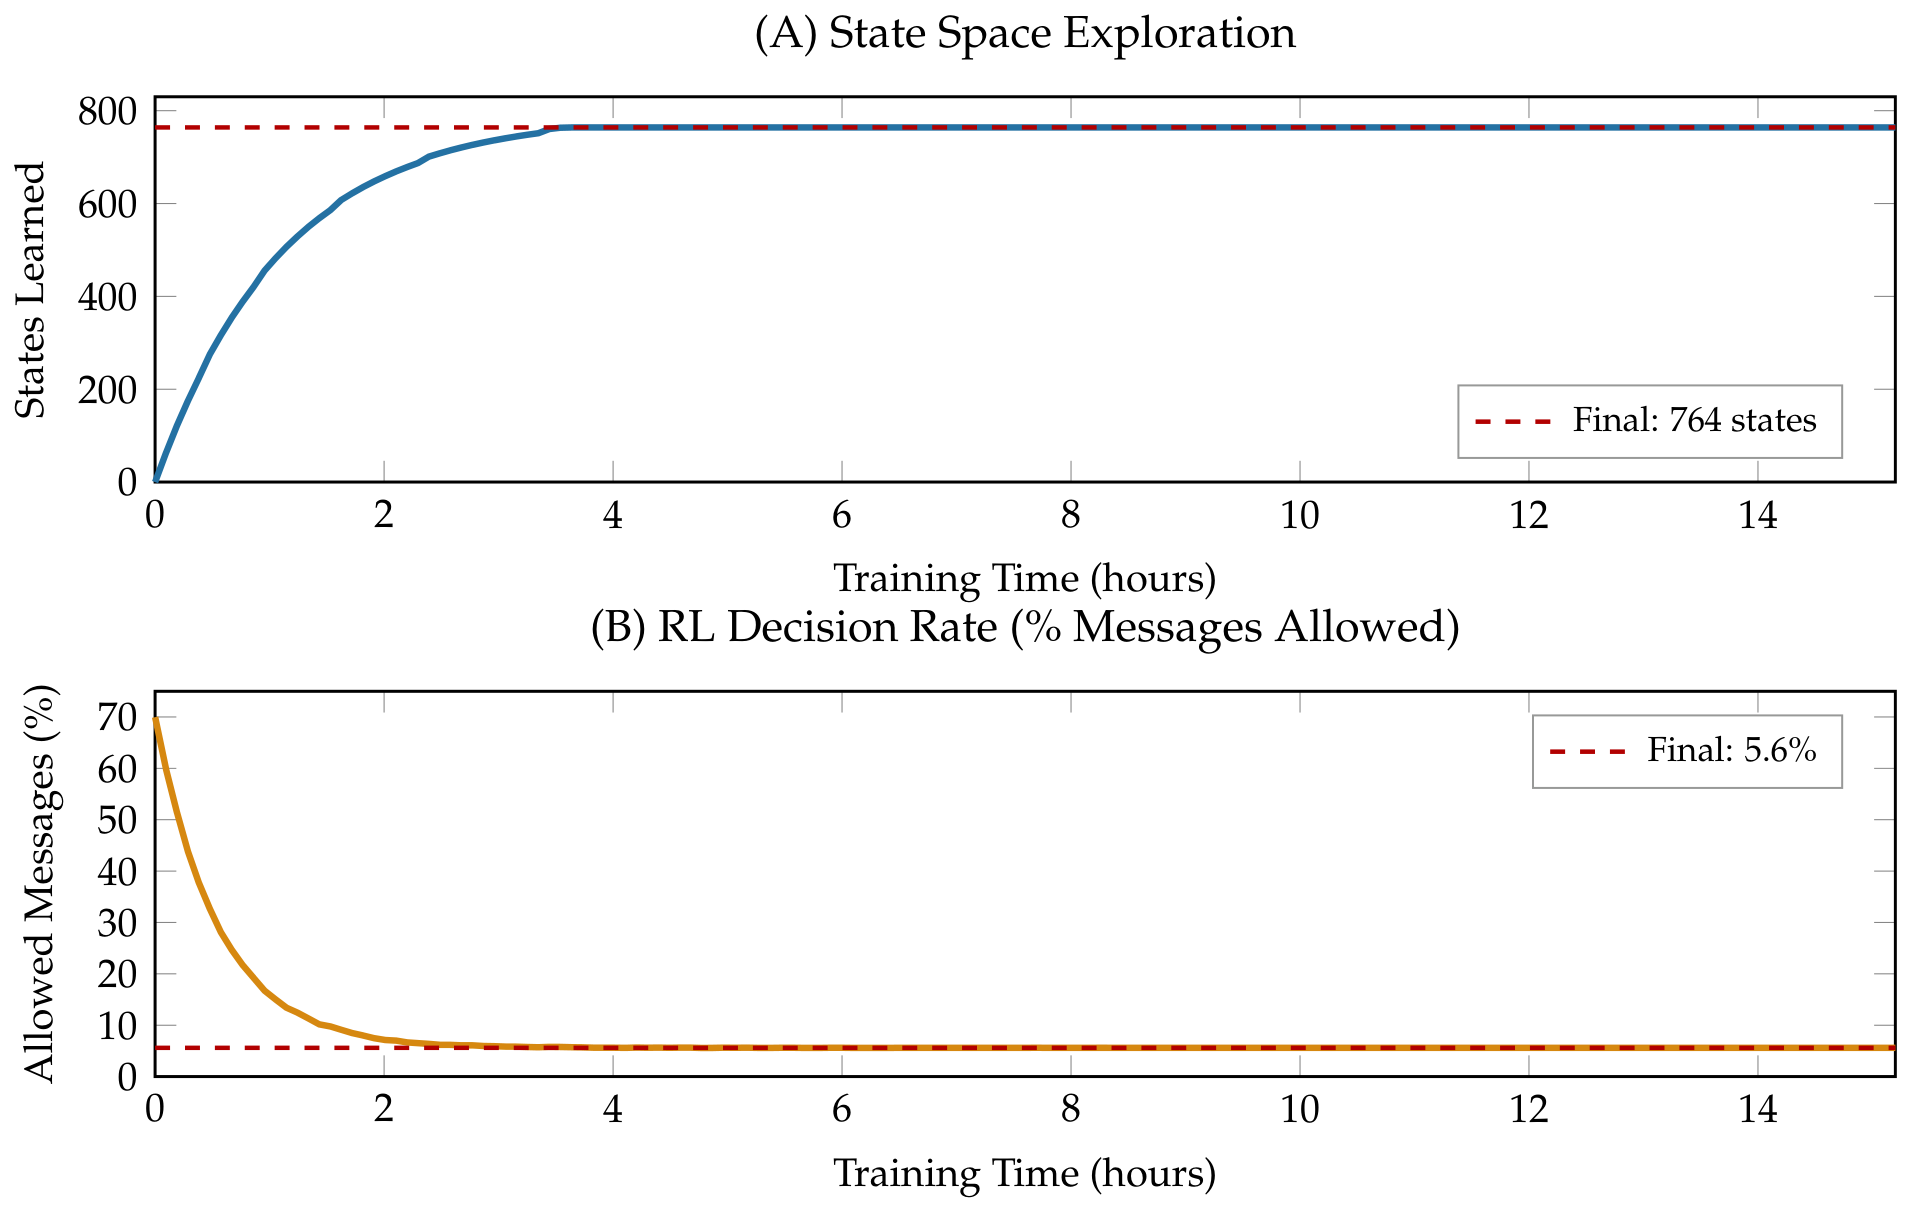
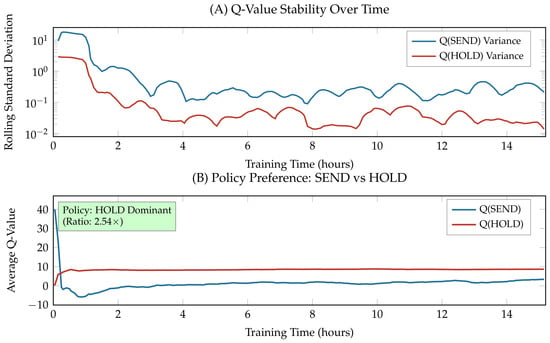
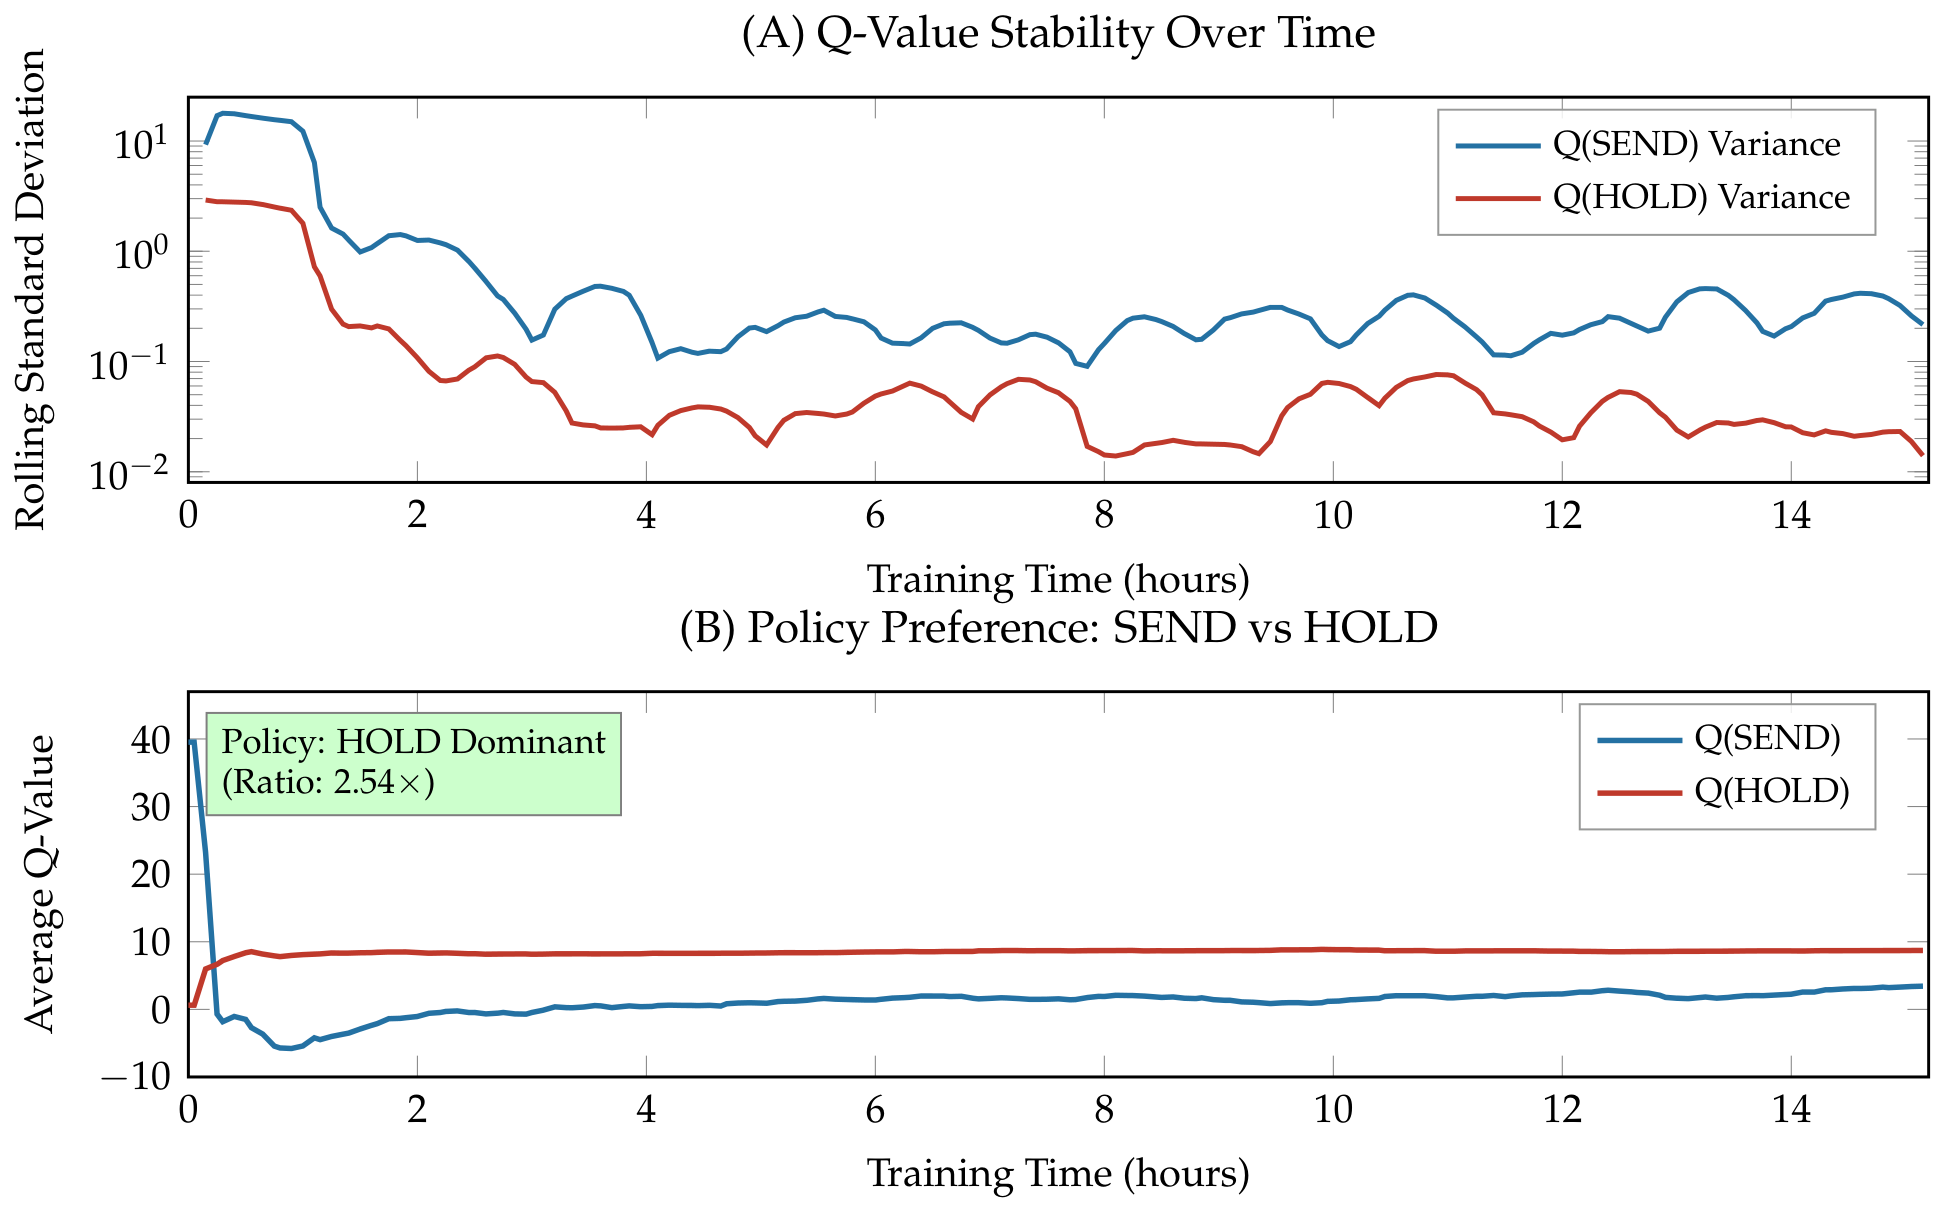
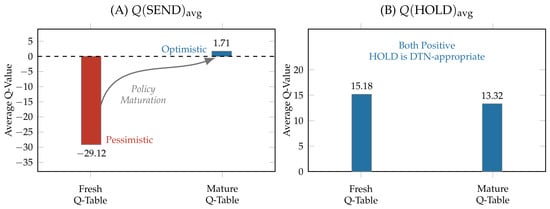
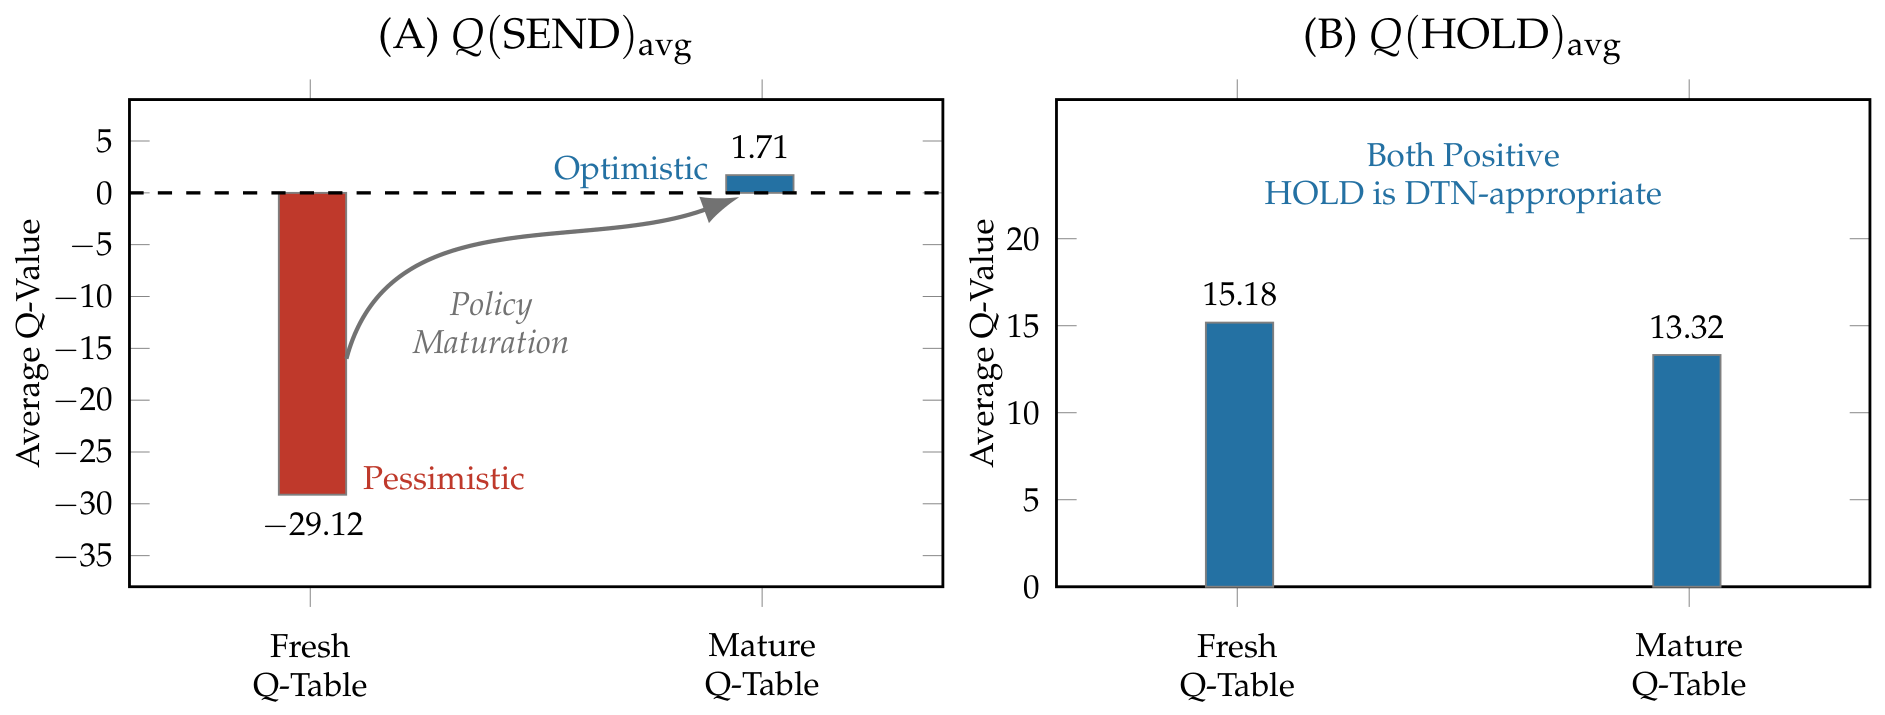
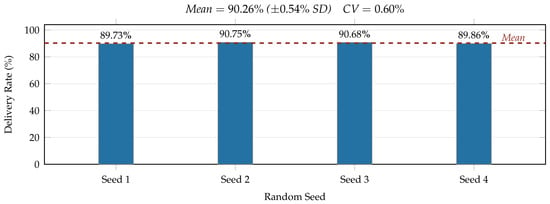
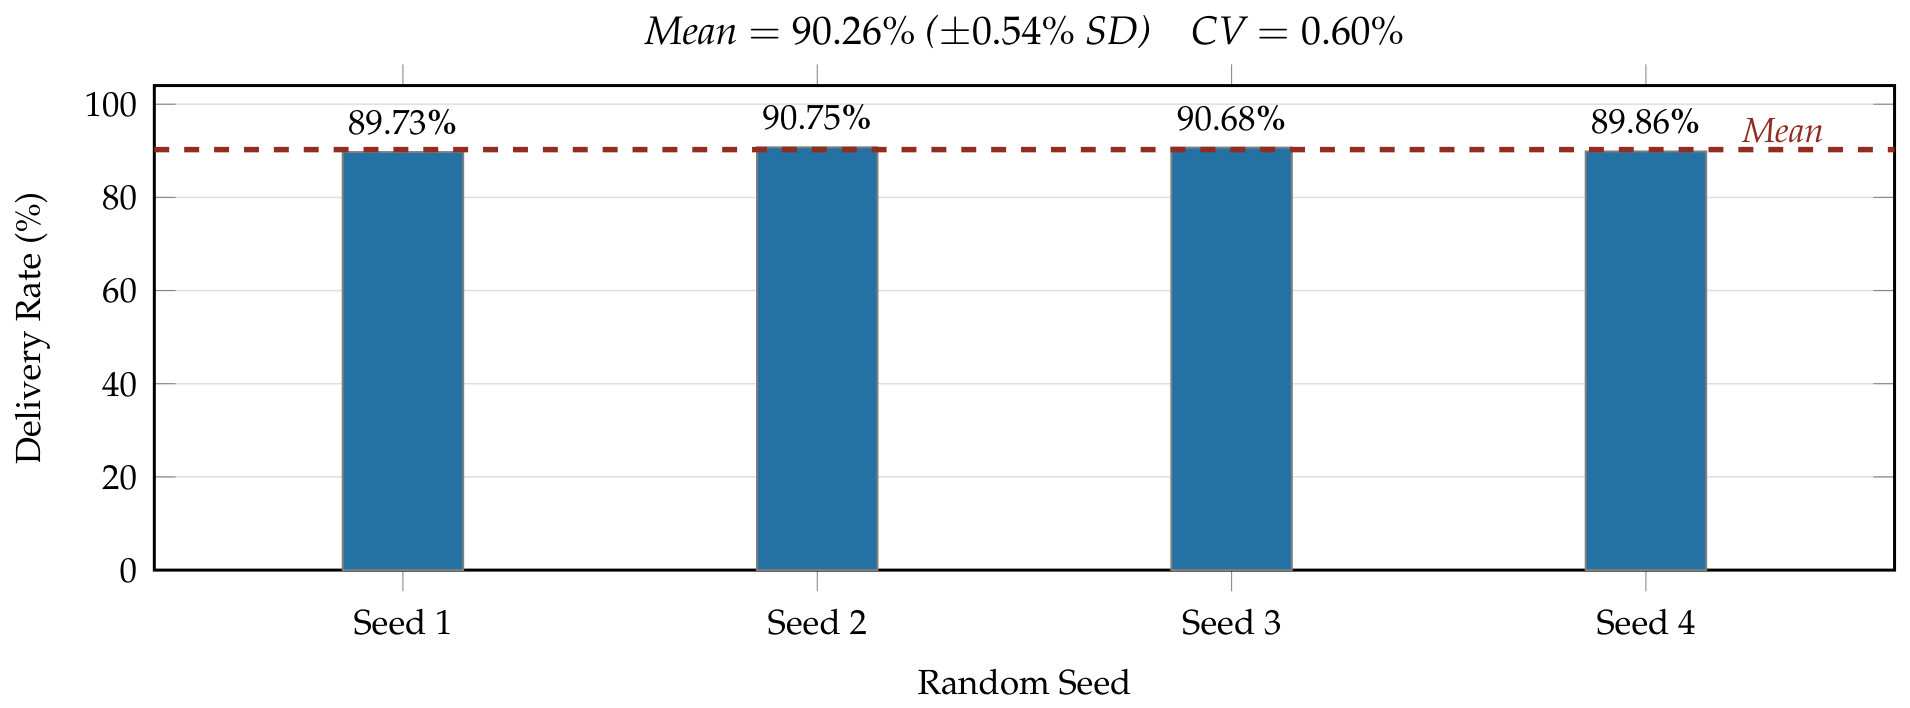

Disclaimer/Publisher’s Note: The statements, opinions and data contained in all publications are solely those of the individual author(s) and contributor(s) and not of MDPI and/or the editor(s). MDPI and/or the editor(s) disclaim responsibility for any injury to people or property resulting from any ideas, methods, instructions or products referred to in the content. |
© 2026 by the authors. Licensee MDPI, Basel, Switzerland. This article is an open access article distributed under the terms and conditions of the Creative Commons Attribution (CC BY) license.