


Abstract
Over the last two decades, the automotive industry has spearheaded a shift toward data-centric manufacturing, where Real-Time Ethernet (RTE) networks defined in IEC61784-2 serve as critical components for ensuring deterministic communication at the Operation Technology level. Although AI-based systems offer significant potential for predictive maintenance and cybersecurity, their effectiveness is currently limited by a lack of structured datasets from real-world industrial environments. Most existing research relies on small-scale simulations or laboratory setups that fail to capture the scale and complexity of actual production. To address this gap, this paper introduces a novel methodology for repurposing network data collected throughout a plant’s lifecycle, specifically during the commissioning and validation phases of RTE networks according to IEC61918. An additional important contribution is the creation of the first multi-plant dataset for real RTE (PROFINET) traffic in the automotive sector, aggregating 300 GB of data from 54,000+ devices across nearly 700 production lines in 17 industrial sites. The work defines standardized methodologies and replicable processes for systematic data acquisition, validation, and labeling to ensure long-term usability for training AI models. Finally, four case studies (focused on performance, maintenance, security, and machine learning) show how this dataset can be used to enhance the reliability of modern smart manufacturing.
1. Introduction
In the last 20 years, the automotive industry has led the deep transformation of the production industry, whose primary drivers are digitalization, automation, and data-centric manufacturing paradigms. Within this context, Real-Time Ethernet (RTE) networks, defined in IEC61784-2 [1] and IEC61158 [2], have become a fundamental component of actual production systems, ensuring deterministic and time-constrained communication among distributed controllers, sensors, and actuators. As a matter of fact, RTE networks are installed at the Operation Technology (OT) level following IEC61784-5 [3] and IEC61918 [4], and are different from Information Technology (IT) networks [5].
As production systems have become increasingly interconnected, the reliability and security of RTE industrial communication networks have started to directly affect overall plant availability and production efficiency. In a complex production chain, as in the automotive sector, this is a critical aspect. Even minor network degradations, such as frame losses, jitter variations, or redundancy misconfiguration, can propagate through the automation hierarchy, leading to performance deterioration, production downtime, or unexpected maintenance operations. Furthermore, from the production point of view, security breaches may have the same consequences as spontaneous faults. Consequently, the ability to continuously assess and monitor the communication layer has emerged as a key enabler for predictive maintenance, condition-based monitoring, and cybersecurity enhancement in smart manufacturing [6].
Modern AI-based systems for condition monitoring and predictive maintenance have proven very effective for RTE, too [7]. Machine-learning algorithms have demonstrated remarkable capabilities in extracting meaningful patterns from high-dimensional recorded data, and in identifying incipient failures before they escalate into critical breakdowns [8]. These approaches enable manufacturers to transition from reactive maintenance strategies to proactive interventions, significantly reducing unplanned downtime and optimizing spare parts inventory. The performance of these AI models is heavily dependent on the availability of “representative training data” or, in other words, training data that adequately capture both normal operational conditions and failure modes across various operational scenarios and environmental conditions [9,10,11].
AI-based analysis tools are also used to implement the strong cybersecurity strategy required by RTE machines and plants. AI tools for intrusion detection and suspicious-activity pinpointing are widely investigated, and many positive reports are available in the literature [12,13]. Advanced anomaly-detection algorithms have shown significant promise in identifying deviations from normal network behavior (which may indicate cyberattacks, unauthorized access attempts, or compromised devices). These techniques can detect both known attack signatures and zero-day threats, but only after they have learned the baseline communication patterns specific to industrial automation protocols. The integration of AI-driven security monitoring with traditional IT firewall and segmentation strategies creates a multi-layered defense mechanism capable of protecting critical infrastructure against increasingly sophisticated cyber-threats targeting operational technology environments with RTE [14].
Despite the recognized importance of network health assessment and cybersecurity, the lack of structured datasets on real industrial RTE networks represents a major limitation for the research community. The extensive literature research produced in this work shows that most of the existing datasets focus on small-scale laboratory setups or simulated conditions, not able to capture the complexity, scale, and variability of real-world industrial environments. Moreover, RTE network architectures are highly heterogeneous, limiting the transfer of training sets between systems using different RTE protocols. Last, but not least, the RTE data exchange is strictly correlated with production data; confidentiality constraints may often restrict data sharing.
1.1. The Core Idea
In order to fill this lack of a dataset based on real systems, this work introduces the idea of reprocessing and reusing any available network-related data collected during the life of the plant/machine. The goal is to build up a high-quality dataset suitable for any application that uses huge amounts of data and, in particular, for the training of AI-based models.
The main consideration behind this work is that, during the life of an industrial plant/machine, there are many data collected, for various purposes, about the industrial networks. Once these data are processed for the intended scope, they are generally discarded or sometimes stored but forgotten. As an example specific to RTE networks, let’s consider the data collected: during the network design phase (e.g., device datasheets, preliminary laboratory tests, etc.); in the proof-of-concept stage (e.g., simulated production, scaled production line, etc.); during the plant/machine-commissioning phase (e.g., network acceptance tests, sample production, etc.); and then in normal operation of the plant (e.g., diagnostic systems of controllers, RTE monitoring systems [15], etc.). In addition, these abundant sources of data have another important quality that makes them very valuable for AI training: the data produced are well (and often, almost completely) labeled.
The following research questions emerge from the previous considerations:
- Q1:
- What is the current landscape of industrial network datasets, and what are the limitations of existing data in capturing the scale and complexity of RTE protocols in real-world production settings?
- Q2:
- How can typically discarded IEC61918 commissioning and validation data be systematically reprocessed and standardized through a replicable process to become strategic assets for AI?
- Q3:
- What are the technical and architectural challenges in building and organizing a large-scale (e.g., 300 GB) multi-site database that ensures data anonymization without losing the labels needed for AI training?
- Q4:
- How effective is a real-world dataset in providing diagnostic and safety metrics for critical smart manufacturing applications, such as predictive maintenance and cybersecurity?
1.2. Novel Contributions
The following original contributions of this paper originate from the answers to the research questions. In detail, they are:
- A1:
- A comprehensive literature research about available datasets at the OT level of RTE network traffic for maintenance or cybersecurity has been conducted, clearly highlighting uncovered areas and identifying the ”realism gap” in existing academic testbeds.
- A2:
- A new methodology for the systematic reprocessing and reuse of RTE network data collected during IEC61918 compliant commissioning is proposed, alongside a replicable procedure for data acquisition during network validations. This framework provides a useful template to transform raw field measurements into strategic AI assets.
- A3:
- A scalable database structure for the aggregation and labeling of large datasets is defined, ensuring that extracted features remain accessible even under confidentiality constraints. This led to the creation of a valuable multi-plant dataset in the automotive sector, aggregating 300 GB of real traffic from 17 industrial sites and 54,000 devices.
- A4:
- A detailed characterization of the dataset content (encompassing plants, networks, control complexity, and redundancy) is provided to support AI learning phases. The work further presents four practical case studies on performance benchmarking, maintenance, security, and machine learning to show the utility and statistical richness of the realized dataset.
1.3. Content Details and Paper Structure
The experimental results of this paper are obtained considering PROFINET as the RTE protocol. The choice of PROFINET as a case study is justified by its dominant market share in the automotive sector; the authors personally collected a huge volume of PROFINET network data in past research activities [16,17,18,19].
However, the proposed reprocess-and-reuse methodology is designed to be protocol-independent, leveraging the standardized commissioning tasks (defined in IEC61784-5 and IEC61918) that are common to all major RTE protocols under the IEC61784-2 and IEC61158 umbrella.
The remainder of the paper is organized as follows: Section 2 reviews related works on industrial communication datasets; Section 3 introduces the core idea of the paper and Section 4 details the proposed validation methodology and data collection process; Section 5 introduces the PROFINET-based reference use case; Section 6 presents the structure of the dataset and aggregated results; Section 7 gives dataset main insights; Section 8 discusses representative case studies; Section 9 outlines future developments; and, last Section 10 concludes the paper.
2. Literature Overview
The effective monitoring and maintenance of industrial communication networks requires access to representative datasets that capture the complexity and variability of real-world operational conditions. However, the availability of such datasets remains severely limited, particularly for RTE protocols deployed in large-scale production environments. This section reviews existing datasets and studies related to industrial network monitoring, highlighting their characteristics, limitations, and the gap addressed by the present work.
Table 1 provides a comprehensive overview of publicly available and restricted datasets for Industrial Control Systems (ICS), organized by application domain, protocol, duration of each single traffic record inside the dataset, type of environment (simulated, testbed, or real), and overall size of collected network traffic. Most existing datasets focus on cybersecurity applications (such as intrusion detection, anomaly detection, and vulnerability assessment) rather than predictive maintenance or network performance monitoring.
Table 1.
Overview of datasets utilized for security and diagnosis in ICS using Industrial protocols. The Env. column indicates T: Testbed, S: Simulation, R: Real Plant.
Several studies have contributed datasets based on non-strict RTE protocols, particularly Modbus TCP/IP and S7comm. For instance, Dobrády et al. in [20] developed the ModRTU_InjectX system, which collects data by interacting with real hardware (slave microcontrollers) through serial interfaces. The methodology involves real-time monitoring and event-based command injection, capturing actual physical responses from the hardware. The primary purpose is the generation of annotated datasets for industrial cybersecurity research, enabling the modeling of realistic attack scenarios such as manipulated command injection and response suppression to train intrusion detection systems. The dataset consists of approximately 60 kB and addresses the Modbus RTU protocol under simulated attack conditions.
Gaggero et al. in [21,22] created the ICS-ADD dataset using an emulated testbed that integrates both real and virtual components, including OpenPLC, ScadaBR, and pfSense. The data collection encompasses not only raw network traffic (.pcap files) but also security monitoring logs generated by tools such as Suricata and OSSIM. The dataset is specifically oriented toward benchmarking cybersecurity monitoring technologies, analyzing how open-source defense systems respond to complex attack chains, and identifying gaps in standard detection rules.
Dehlaghi-Ghadim et al. in [23] implemented the ICS-Flow dataset using the ICSSIM simulation framework based on Docker containers to emulate a bottle-filling factory. Over 25 million raw packets are captured via TCPdump on a virtual switch, resulting in a dataset of approximately 2 GB. The dataset serves as a benchmark for evaluating Machine-Learning algorithms in the ICS cybersecurity domain, specifically for detecting and identifying diversified attacks such as DDoS, Man-in-the-Middle (MitM), Replay, and Reconnaissance.
Perales Gómez et al. in [24] generated the Electra dataset from a realistic railway traction substation scenario. Data collection spanned over 12 h, capturing traffic generated by PLCs and SCADA systems communicating via S7comm and Modbus protocols. The dataset comprises two separate collections: Electra Modbus (56 MB) and Electra S7comm (1.7 GB). Attacks are distributed through a Man-in-the-Middle node that poisoned the network’s ARP tables. The dataset is used for evaluating Deep Learning techniques in identifying cybersecurity anomalies and is one of the few to include replay attacks specifically on the S7comm protocol, alongside false data injection and network scanning. The same authors also provide a comprehensive overview of more than ten publicly available datasets for anomaly detection in ICSs.
Lemay and Fernandez in [25] developed a SCADA sandbox using electrical grid simulators to introduce physical realism into the experimental setup. The dataset includes Modbus TCP/IP traffic captured during the deployment of real attack tools interacting with the simulators, ensuring network timing fidelity. The dataset, totaling approximately 123 MB, is designed to provide labeled datasets for supervised machine-learning cybersecurity research. It is particularly valuable for studying covert communication channels that exploit the least significant bits of Modbus data to transport hidden information.
The X-IIoTID dataset [26,27] is a large-scale intrusion detection dataset generated from a realistic Industrial IoT testbed designed to emulate a complete IIoT environment. It comprises approximately 338.85 MB of data collected from a heterogeneous testbed including over 100 interconnected devices, such as sensors, actuators, PLCs, edge gateways, and cloud components. The dataset covers multiple attack stages and classes.
The Canadian Institute for Cybersecurity released the CICModbusDataset2023 [28] dataset, comprising over 1 million labeled network flows of Modbus TCP/IP traffic from a realistic ICS testbed. The dataset includes benign traffic and several different cyberattack types (DoS, reconnaissance, injection attacks, MitM) for training intrusion detection systems.
Zhou et al. in [29] introduced the ICS-NAD dataset, collected from a real-world ICS test site comprising three sets of ICSs from three well-known brands (ABB, Siemens, and Schneider) controlling thermal power generation and sewage treatment processes through different network protocols (private TCP, S7Comm, and Modbus). The dataset comprises 245.96 GB of raw network traffic in pcap format and 60 extracted features (both flow-based and packet-based) in CSV format, covering 20 common ICS attacks grouped into Reconnaissance, DoS/DDoS, FDI, and MitM categories. The authors validated its usability through ten machine learning and deep learning classification models, achieving accuracy values generally exceeding 90%.
A second body of literature focuses specifically on RTE protocols, which introduce additional protocol-specific aspects relevant to dataset design. RTE protocols typically support multiple real-time classes with different timing guarantees, redundancy mechanisms for ring topologies, and strict cyclic communication requirements that shape the structure of the captured traffic. The following works address these aspects in different ways.
Two relevant datasets for this study are SWaT [30,31,32] and WaDI [30,33,34]. Both datasets originate from high-fidelity ICS testbeds that emulate real-world water treatment and distribution infrastructure, each comprised of large numbers of sensors and actuators, reflecting the complexity of modern critical infrastructure systems. The SWaT dataset has been derived from a scaled-down but realistic water treatment facility testbed that processes water through a sequence of interconnected stages, with comprehensive instrumentation across physical and cyber components. The SWaT dataset comprises continuous multivariate time-series of up to 100 h, recorded from multiple sensors and actuators under both normal operation and controlled cyber-physical attacks.
In a similar manner, the WaDI dataset captures data from a water distribution testbed, thereby extending the water treatment context to distribution infrastructure. The scope of the study encompasses 16 consecutive days of operation, incorporating both periods of normal functionality and injected attack scenarios. Continuous recordings are obtained from over 120 sensors and actuators. The scale of the WaDI dataset is such that it is regarded as one of the largest multivariate industrial control system datasets that is available to the public. This enables comprehensive evaluation of anomaly-detection and cybersecurity methods in complex control systems environments.
Gibadullin et al. in [35] took a different approach by collecting diagnostic parameters (directly from a PROFINET-INspektor NT analyzer) such as jitter, network load, error telegrams, and node failures. The dataset, comprising 240,440 packets, is used to train ANNs for predicting overall network health state.
Hormann and Fischer in [36] developed a dataset based on a realistic human-robot collaboration cell for motor assembly. Traffic is captured using a network TAP device positioned on the PLC link, generating two configurations: a dataset focused exclusively on cyclic PROFINET IO communication and a dataset including startup noise (DHCP, LLDP). The dataset, consisting of approximately 71,693 packets, is used to train Self-Organizing Map (SOM) models for anomaly detection with a focus on reducing false positives.
Dias et al. conducted a series of studies on PROFINET-based fault diagnosis using communication data as a soft sensor alternative to dedicated instrumentation. In their first 2021 work [37], they collected traffic from a hydraulic test bench simulating an industrial pumping system, capturing cyclic communication between a PLC and an intelligent relay using a SCALANCE TAP104 sniffer. RMS current values are extracted directly from network packets at a 2 ms sampling rate, totaling approximately 600 packets, and employed for SVM-based fault diagnosis, achieving 88.7% accuracy for cavitation detection and 100% for dry-run conditions. Their second 2021 study [38] captured PROFINET/PROFIdrive telegrams from a rotating machinery test bench, extracting features from speed setpoint and control error signals. The dataset comprises 300 samples per condition (healthy, uncoupling, misalignments) and implements a cloud-based monitoring system, achieving 87.5–100% accuracy. Their 2024 study [39] collected 3510 samples from an experimental piping system, demonstrating edge-based diagnosis with up to 99.9% accuracy using supervised and unsupervised models with minimal feature sets. Most recently [40], they gathered 1515 samples from a real 100-L microbrewery during production phases, comparing Machine Learning and Deep Learning approaches and achieving 100% accuracy for dry-run detection.
Al-Duwairi et al. in [41,42] provided a SCADA traffic dataset collected over 14 consecutive days from a Siemens S7-1500/ET200MP-based system controlling a medical waste incinerator, capturing PROFINET and OPC communications between HMI and PLC for a total of over 19 million packets, 820 MB totals. The authors complemented the baseline traffic with eight attack-injected captures, each containing approximately 20,000 synthetic packets generated through Scapy and covering MitM, Replay, Packet Fuzzing, Command Flooding, Data Spoofing, Protocol Exploitation, Stealthy Command Injection, and SYN Flooding.
Table 2 summarizes the key characteristics of the considered datasets that are relevant for predictive maintenance and network analysis. A critical review reveals several key limitations:
- Limited Scale and Realism: most RTE datasets (including PROFINET ones) are collected from testbeds or laboratory setups with a small number of devices (typically fewer than 100). These environments fail to capture the scale, heterogeneity, and complexity of real automotive production plants, where hundreds of devices, multiple PLCs, and cascaded redundancy rings are common.
- Focus on Cybersecurity Over Maintenance: The majority of existing datasets prioritize intrusion detection and security applications. While important, these datasets do not provide the diagnostic and performance indicators necessary for predictive maintenance and condition-based monitoring of communication networks.
- Lack of Standardized Collection Procedures: Data collection in prior studies is often ad hoc and not guided by industrial validation standards such as the IEC61784-5 and IEC61918. This limits reproducibility and comparability across different studies and industrial contexts.
- Absence of multi-plant and multi-OEM (Original Equipment Manufacturer) coverage: only one publicly documented dataset aggregates network data across multiple production plants, equipment manufacturers, and network configurations, but it does not consider RTE protocols. Both plant diversity and real-time communication are essential for developing robust and generalizable predictive models.
Table 2.
Qualitative comparison of industrial communication datasets highlighting key characteristics relevant for predictive maintenance and network analysis. The included features are marked with ✓.
The last line of Table 2 shows the dataset presented in this work. Our dataset addresses the four limitations simultaneously: it captures real RTE (PROFINET) traffic in production environments with redundancy, aggregates data across multiple plants and OEMs, and follows a standardized collection procedure that ensures consistency over a six-year campaign. The resulting dataset has a total size of 300 GB. Last, it should be noted that the intrinsic value of PROFINET data is taken from real plants, since PROFINET supports multiple real-time requirements (RT_Class 1, 2, and 3), and complex redundancy (i.e., Media Redundancy Protocol-MRP) that are difficult to replicate in laboratory or in simulated environments.
3. The Proposed Approach: Repurpose and Reuse
Many AI-based projects fail or underperform because of poor training due to the limited scope of the original dataset. Unfortunately, gathering a sufficient amount of data from scratch has a high cost. Additionally, in industrial environments, extra manual measurements or, worse, physical installation of new sensors could impact production, with consequent skyrocketing of costs. Generally speaking, in industry, there is also a strong asymmetry of data flowing between different plant areas, machines, and activities: some of them generate huge and constant data (e.g., product identification, logistics), while others are rarely monitored and produce very little information (e.g., manual tool usage). As a matter of fact, RTE networks are included among the least considered components of an industrial plant; generally, they are not monitored after installation, despite being the backbone of the ICS and the most exposed to security threats.
The authors are experts in the field of RTE networks defined in IEC61784-2. They observed that during the lifecycle of any industrial plants there are many data collected in the RTE network for various reasons. These data are processed for the intended scope and then, usually, discarded or stored but undocumented.
For instance, in the typical RTE setup, device datasheets are collected in the design phase, and preliminary laboratory tests and sample production cycle are carried out in the proof-of-concept and commissioning phases. In the normal operation of the plant, most of the data is generated by diagnostic/monitoring systems. These data are stored in different places and, in the case of diagnostics, it is usually delegated to higher levels for the activation of maintenance/supervision actions.
In this paper, it is proposed to systematically reprocess and reuse data collected during commissioning and testing of RTE networks in automotive plants in order to build up an organized dataset. Since the data collected from RTE networks during IEC61918 compliant commissioning is often labeled, the created dataset can be very suitable for the training of AI-based models.
Figure 1 shows the typical standard procedure for RTE network commissioning and final acceptance testing derived from IEC61918. The machine builders assemble their systems and deliver/install them at the production site under the supervision of the plant owner. Before the scope of delivery is completed and the contract paid, a third-party company performs a Network acceptance test, assessing that performance is above the acceptance threshold. Each step during commissioning and acceptance test generates reports and measurement data that generally converge toward a binary outcome (pass, fail). The proposal of this work is to select all relevant generated data, reprocess it, and consolidate it into an organized multidimensional dataset with Algorithm 1. A raw database and a derived database with classifications and labels are created, ready for efficient querying. Anonymization and validation capabilities are added to enable integration to a wide range of AI applications [43].
| Algorithm 1 RTE Data Repurposing and Industrial Dataset Construction |
|
Figure 1.
Repurposing data generated from network commissioning in order to create an organized dataset for AI models.
Clearly, the challenge is starting from an unrelated collection of data with a possible time bias, and ending with a consistent labeled dataset. Fortunately, there are some advantages to dealing with the automotive sector.
The focus on RTE networks for industrial automation for automotive mitigates the effect of time on representativeness: data exchange in the network is programmed at commissioning time, and any change/update of configuration requires a new commissioning phase (refreshing “de facto” the input of the procedure).
Large projects involving huge automotive companies have rigorous scheduling of activities based on the creation of procedures for any tasks, so they are the perfect candidates for proving the author’s idea. The availability of a standardized RTE network acceptance procedure (from IEC61918) must be considered to facilitate the entire process.
The proposed framework can be applied as a template for transforming raw, discarded field measurements into strategic AI assets, regardless of the specific RTE communication protocol, as long as an IEC61918 structured validation procedure is followed during the plant lifecycle. Moreover, the common normative base of all the RTE protocols implies that the choice of a particular RTE to demonstrate the practical feasibility of the proposed approach does not limit the general applicability of the proposed idea.
In detail, the dataset created in this work originates from a huge repository of data collected by the authors during a systematic validation procedure applied to PROFINET networks in multiple automotive production facilities. The measurements campaign spanned across 6 years and multiple plants in the entire globe. The value and the consistency of the origin repository are guaranteed by both the standardized and consistent data acquisition procedure and the stability of the well-known PROFINET ecosystem. For the sake of completeness, a brief overview of PROFINET is included in the Appendix A.
In the following, a more detailed explanation of the general network validation procedure to create a reusable repository is given.
4. Procedures for RTE Network Validation That Enable Reuse
In industrial environments, the validation of communication networks is a crucial step to ensure the reliability and compliance of automation systems. However, plant owners often lack the in-depth technical expertise required for this task and therefore rely on machine builders during the validation phase. Neutral third-party companies are often involved to perform independent assessments and provide objective verification of compliance with industrial RTE communication standards (i.e., IEC61784, IEC61158, and IEC61918).
Fortunately, in the complex manufacturing industry, the compilation of a Network Validation Checklist is often a mandatory part of the overall plant lifecycle. The fulfillment of the Checklist requirements is also mandatory from the financial point of view: to complete the transaction/contract between plant owner and machine manufacturer, the Checklist result must be positive.
In this paper, in order to collect commissioning data in an organized and uniform way, the definition of a checklist is highly recommended. Indeed, the good procedure of standardized step-by-step operation guarantees future reuse of the gathered data. The evaluation of the checklist is executed after the installation phase and prior to the commencement of operation. This crucial procedure verifies that the network design and physical installation adhere strictly to the specified regulatory and performance requirements described in IEC61784-5 (whose title is: Installation of fieldbuses - Installation profiles) and IEC61918 (whose title is: Installation of communication networks in industrial premises). In detail, the IEC61784-5 is divided into parts linked to each RTE (e.g., Part 2 - EtherNET/IP, Part 3 - PROFINET, and then other 13 RTEs) that, in turn, select applicable clauses of the IEC61918. Following this normative structure, several major RTE manufacturer associations offer their own checklist templates.
In this paper, we leveraged the common normative base of IEC61784-5 and IEC61918 to propose a generalized Validation Checklist that has at least four sequential steps:
- 1.
- Visual Inspection.
- 2.
- Acceptance Measurement of Cabling.
- 3.
- Commissioning the RTE network.
- 4.
- Performing the RTE Network Acceptance Test.
The ultimate goal of this procedure is the compilation of a comprehensive Checklist that documents, supported by field measurements, the conformity of each network component, validating all the acceptance criteria before system handover.
It should be noted that, from the point of view of this paper (i.e., creating an organized dataset), the “field measurements” are the origin of the data, while the Checklist use case and the Checklist results are the labels for the data.
The subsequent sections detail the mandatory criteria and measurement techniques applied during the installation acceptance and the final network acceptance test.
4.1. Visual Inspection
The installation acceptance must verify the passive components, such as cables and connectors, focusing on the quality of the RTE end-to-end link. Generally speaking, the RTE end-to-end link is defined as the fixed transmission path between two active RTE devices, inclusive of all connectors and junctions. Although the common practice of considering as “automatically approved” passive components from a specific vendor list is widespread, an acceptance test is strongly recommended for documentation (and as a reference for future maintenance and troubleshooting).
The visual inspection shall always precede all other verification procedures to identify installation faults or deviations. Key inspection items include:
- Verification of mechanical integrity, ensuring RTE cables are undamaged.
- Confirmation that the minimum permissible cable bending radii have been observed.
- Verification of clear labeling and marking of links and nodes.
- Confirmation that strain relief mechanisms have been implemented and properly fixed.
- In copper cabling installations, verification that equipotential bonding and cable shielding have been correctly implemented and connected to the end stations.
The data generated by the visual inspection activity are heterogeneous. They may include: pictures of connectors and cables; pictures of cabinets and electrical panels; pictures of the environment; network schematics, often with handwritten notes; and datasheets of network components. Generally speaking, the reprocessing of this kind of human-generated data requires an advanced approach (e.g., based on AI [44]).
4.2. Acceptance Measurement of Cabling
The verification and acceptance of network cabling in RTE systems (step 2) involve distinct testing procedures according to the required complexity and precision.
Testing of copper cabling is divided into two main categories: (i) Simple Cable Test (Verification), where basic cable testers are employed to verify the physical integrity of the wiring. The test ensures the absence of short circuits (between conductors or between conductors and shield), verifies conductor continuity, and checks the proper connection of the shield. (ii) Extended Cable Test (Certification), where advanced measurement equipment is used to certify compliance with standardized cabling requirements.
The following parameters are determined and documented for copper links:
- Cable length: must not exceed the maximum permissible length of ;
- Attenuation (Insertion Loss) and Crosstalk (near-end and far-end);
- Signal reflections along the link.
- Extra: there could be special RTE measurement profiles to enable end-to-end verification, including connector losses, for ensuring that the complete channel is assessed.
For fiber optic links, the primary measurement is the attenuation (insertion loss), which quantifies total losses introduced by the fiber, connectors, and splices along the optical path.
- Attenuation limits: The measured loss shall not exceed the maximum permissible end-to-end attenuation. Example of limits: for Plastic Optical Fiber (POF) and for multimode optical fiber ().
- Optical Time Domain Reflectometer (OTDR) measurement: Recommended for detailed diagnostics and fault localization. OTDR analysis provides the amplitude and delay of reflected signals to identify issues such as excessive bending, defective splices, or faulty connectors. The corresponding trace diagrams should be archived for future reference. Example of limits: Optical system reserve (i.e., the remaining power margin): a minimum reserve of is required to ensure reliable operation (e.g., for POF links up to ). Values between and are considered within the acceptable measurement range.
The data generated by cable testing is a primary source of organized information. Modern testing instruments produce detailed reports, and some of them can also directly store test results in the cloud. In summary, this step of the checklist can be easily used to increase datasets. Please note that a critical part could be related to the human operator running the experiments; for this reason, identifying the operator in the dataset is recommended.
4.3. Commissioning of the RTE Network
This is the Step-3 of the checklist. The devices are functionally tested. At this stage, the machine is operative, and sample production could be carried out. This part of the checklist is heavily dependent on the product, on the type of industry, and on the interaction between other machine manufacturers in the same plant.
Due to the extreme variability of the data source, the extraction of generalized and meaningful data related to the RTE only may require further specific processing, which is out of the scope of this work.
4.4. RTE Network Acceptance Test
The network acceptance test (Step 4) is the final part of the Checklist. It is performed after all devices have been configured and commissioned (Step 3). It ensures that the installed RTE network meets the required topological and performance criteria before entering operation.
The physical network topology shall be compared against the planned configuration. Compliance with the maximum line depth must be verified, defined as the maximum number of forwarding components (switches or devices with integrated switches) between the controller and the most remote device.
The cyclic real-time network load shall be measured and documented at critical points in the installation, typically where traffic converges (e.g., the controller uplink). The observation period must be sufficiently long to capture representative peak loads, ideally covering a full production cycle.
During the Network Acceptance Test, it is required to set acceptance limits. Violation of limits implies a negative (nonacceptance) result.
The data generated in the Network Acceptance Test may constitute the richest part of the dataset in the entire Validation Checklist. However, the consistency and the usability of this dataset for future activities (including AI training) depend on the degree of procedural organization of the measurement activities. Since human staff is involved, experiments must be reproducible and well documented; in other words, the entire procedure must be planned and agreed upon between parties in advance.
5. The Use Case of This Work: Network Validation Procedure for PROFINET
The proposed repurpose and reuse approach is applied to the use case of automotive plants with PROFINET as the main RTE protocol. Without losing generality with respect to other RTE related to the IEC61918 installation standard, the presented use case is a high-complexity, practical-feasibility example of the proposed general Validation Checklist and repurposing procedure. In this section, the detailed description of the Network Validation procedure for automotive plants with PROFINET is given, while the generated dataset is discussed in the next section.
In this use case, the details of each phase and the entire workflows was agreed in advance between the plant owner (a major automobile company), the machine builders, and a third-party independent validator entity. As a matter of fact, due to budget and time constraints, the four steps of the proposed Validation Checklist are carried out asymmetrically.
5.1. PROFINET Visual Inspection
The Visual Inspection is carried out approximately on the 10% of the networks, and the activity is oriented toward verifying the machine builder’s understanding and implementation of PROFINET installation rules and best practices, instead of punishing it for non-compliance. The audit outcome is not intended as a judgment but as a constructive step to enhance machine builder competence in working with PROFINET networks. Each machine builder selects a representative sample network of its own at the production site. The audit is conducted by a third-party expert, who verifies installation and configuration rules and performs network traffic measurements to assess compliance with PROFINET operational criteria. Results are discussed immediately with the machine builder and the plant owner to provide timely recommendations for improvement.
A complete report summarizing the findings and highlighting any critical issues is then produced by the expert.
5.2. Measurement of PROFINET Cabling
Testing RTE cables in a real production environment is very different from testing Ethernet cables in IT-like scenarios (e.g., ISO/IEC 11801 generic cabling testing). Hostile environment, safety regulations, and rugged connectors and cables make the manipulation of already installed links very difficult. Moreover, the need to stop production for testing cables has a high cost.
For these reasons, in this project, the plant owner created an authorized vendor list for cable and connectors in order to reduce cabling variability. Then, in the agreed PROFINET Validation procedure, the scope of cable testing was very limited. Only the following network cables are certified:
- cables attached to PROFINET devices that are signaling communication errors.
- cables belonging to redundancy rings, including fiber optic links;
- copper cables longer than 75 m.
It has been estimated that the cable testing covered between the 1% and the 2% of the total installed cables, but (from the rules above) at least all the networks with a redundancy ring have two or more cable test results considered in the repository.
Results of the cable measurements are saved in detailed PDF reports automatically generated by the measuring instruments (first-class cable certifiers with calibration certificates).
5.3. Commissioning the PROFINET Network
The commissioning of all (100%) of the PROFINET network is carried out by the machine builder in collaboration with the plant owner. Since the automobile production is a very complex task, the commissioning activity is coordinated by the plant owner, who decides the time schedule. The third-party validator company was not directly involved in this step.
At the end of the activity, commissioning reports are generated by the machine builder and sent directly to the plant owner for approval.
5.4. PROFINET Network Acceptance Test
The final Network Acceptance Test aims to assess the behavior and performance of all PROFINET networks present in the plant. In this phase, 100% of the networks are tested under operational conditions (production or standby mode) by the third-party validator company.
The focus of this stage is on performance verification and reliability assessment. The following limits for PROFINET cyclic RT Class 1/2 load are verified:
- <: No action required.
- : Additional verification of the network design is recommended.
- >: Measures shall be taken to reduce the network load (e.g., increasing device update times).
Broadcast and multicast transmissions (e.g., ARP, DCP, MRP) contribute to the overall PROFINET network load and should be minimized.
- A high number of DCP multicasts (e.g., exceeding 20 messages per second) after system startup indicates excessive non-RT load, which may impair real-time communication.
- In ring topologies employing the Media Redundancy Protocol (MRP), MRP multicasts shall not appear outside the configured ring.
For each network, the following measurements and verifications are carried out in steady conditions during production:
- number of active PROFINET devices;
- link errors detected on connections to PROFINET switches;
- overall network traffic load statistics;
- traffic load on the network controllers (i.e., PLCs);
- traffic load on PROFINET redundancy rings;
- recording of at least 30 s of network traffic at the PLCs.
- recording of at least 30 s of network traffic in the redundancy rings.
For each network with redundancy, the following measurements and verifications are carried out during a manually induced redundancy switchover during production:
- traffic load on the network controllers (i.e., PLCs) during switchover;
- traffic load on PROFINET redundancy rings during switchover;
- recording of at least 30 s of network traffic at the PLCs during switchover.
- recording of at least 30 s of network traffic in the redundancy rings during switchover.
The possible outcomes of the final validation are:
- PASS: all measured and verified parameters are within acceptable limits;
- FAIL: one or more parameters do not meet acceptance criteria.
In the case of non-conformity, the machine builder is promptly requested to correct the issue, after which the network is re-evaluated.
The output of the final validation is a comprehensive Report (with all the data attached) that provides a snapshot of the PROFINET network status and performance on the date of testing.
5.5. Data Produced by the PROFINET Network Validation
All data collected during the PROFINET Network Validation procedure performed by experts ultimately converges into a single repository, currently saved at the validator company.
The authors were granted access rights to the repository for research purposes only. The complete list of material in the repository is shown in Table 3; the data used in this paper to create the proposed dataset of this paper are highlighted. The material not used in this work can be used in further research.
Table 3.
Content of the PROFINET validation repository. The items used for the creation of the dataset in this paper are marked with “yes”. (“-” means not used).
6. The Proposed Database: Architecture and Description
The dataset presented in this work originates from a systematic validation procedure applied to PROFINET networks across multiple automotive production facilities. The acquisition procedure is standardized across all participating OEMs, expert teams, and plants as explained in Section 5, ensuring consistency and comparability of collected data.
Overall, the database aggregates information from 17 production plants, divided into 9 body shops and 8 assembly shops. Across all sites, several thousand PROFINET devices have been validated, including PLCs, field devices, and redundant network rings. In total, the dataset accounts for over 5000 individual validation tests and 300 GB of raw traffic data, which are then consolidated into structured summary tables and a relational database. The details of the dataset are given in Appendix B.
6.1. Database Structure and Organization
The database is organized into multiple hierarchical tables, each describing different levels of granularity within the validation process. This multi-level structure allows for flexible querying and analysis, ranging from plant-level statistics to individual packet-level inspections.
Plant and Line Level Information are summarized in Table A1, where parameters describe each production line at the highest level of abstraction. Each record corresponds to a validated line and index, labels, and values:
- Plant and shop identifiers: anonymized plant codes and production shop type (BODY or ASSEMBLY).
- Validation outcome [label]: overall result (PASS or FAIL) and contributing factors from visual inspection, OEM checklist compliance, and cable certification.
- Network topology info [label]: total number of devices, PROFINET-specific device count, number of PLCs, and number of redundancy rings.
- Traffic statistics: maximum traffic load measured at critical points, expressed both in absolute terms (Mbit/s) and as a percentage of available bandwidth, distinguishing between overall traffic and PROFINET-specific cyclic communication.
This level provides a comprehensive overview of the network’s scale, complexity, and operational status at the time of validation.
Table A2 details PLC Level Information measurements associated with individual PLCs within each line. For each PLC, the following parameters are recorded:
- PLC identifier: anonymized name referencing the specific controller within the project.
- Bidirectional traffic measurements: maximum PROFINET traffic on the PLC uplink, decomposed into field to PLC and PLC to field directions.
- Redundancy testing status [label]: indication of whether redundancy mechanisms were tested and their outcomes.
This granularity enables analysis of traffic distribution patterns, controller loading, and the impact of network design choices on individual PLC performance.
As redundancy rings are a common feature of these systems for ensuring network availability, it was decided to map the information regarding redundancy rings in Table A3. For each ring, the database records:
- Ring identifier: anonymized name of the redundancy ring.
- Traffic breakdown: maximum traffic load within the ring, further decomposed into PROFINET cyclic traffic and IP-based non-real-time traffic (mainly S7Comm-based supervisory or PLC-to-PLC traffic).
- Redundancy validation [label]: status of redundancy switchover tests performed during validation.
These metrics are essential for studying fault tolerance mechanisms and understanding how redundancy configurations affect network behavior under both normal and degraded conditions.
Table A4 provides metadata for each pcap file collected during the validation procedure. Key fields include:
- Temporal information: anonymized date and test duration.
- File characteristics: anonymized filename, file size, and SHA-256 hash for integrity verification.
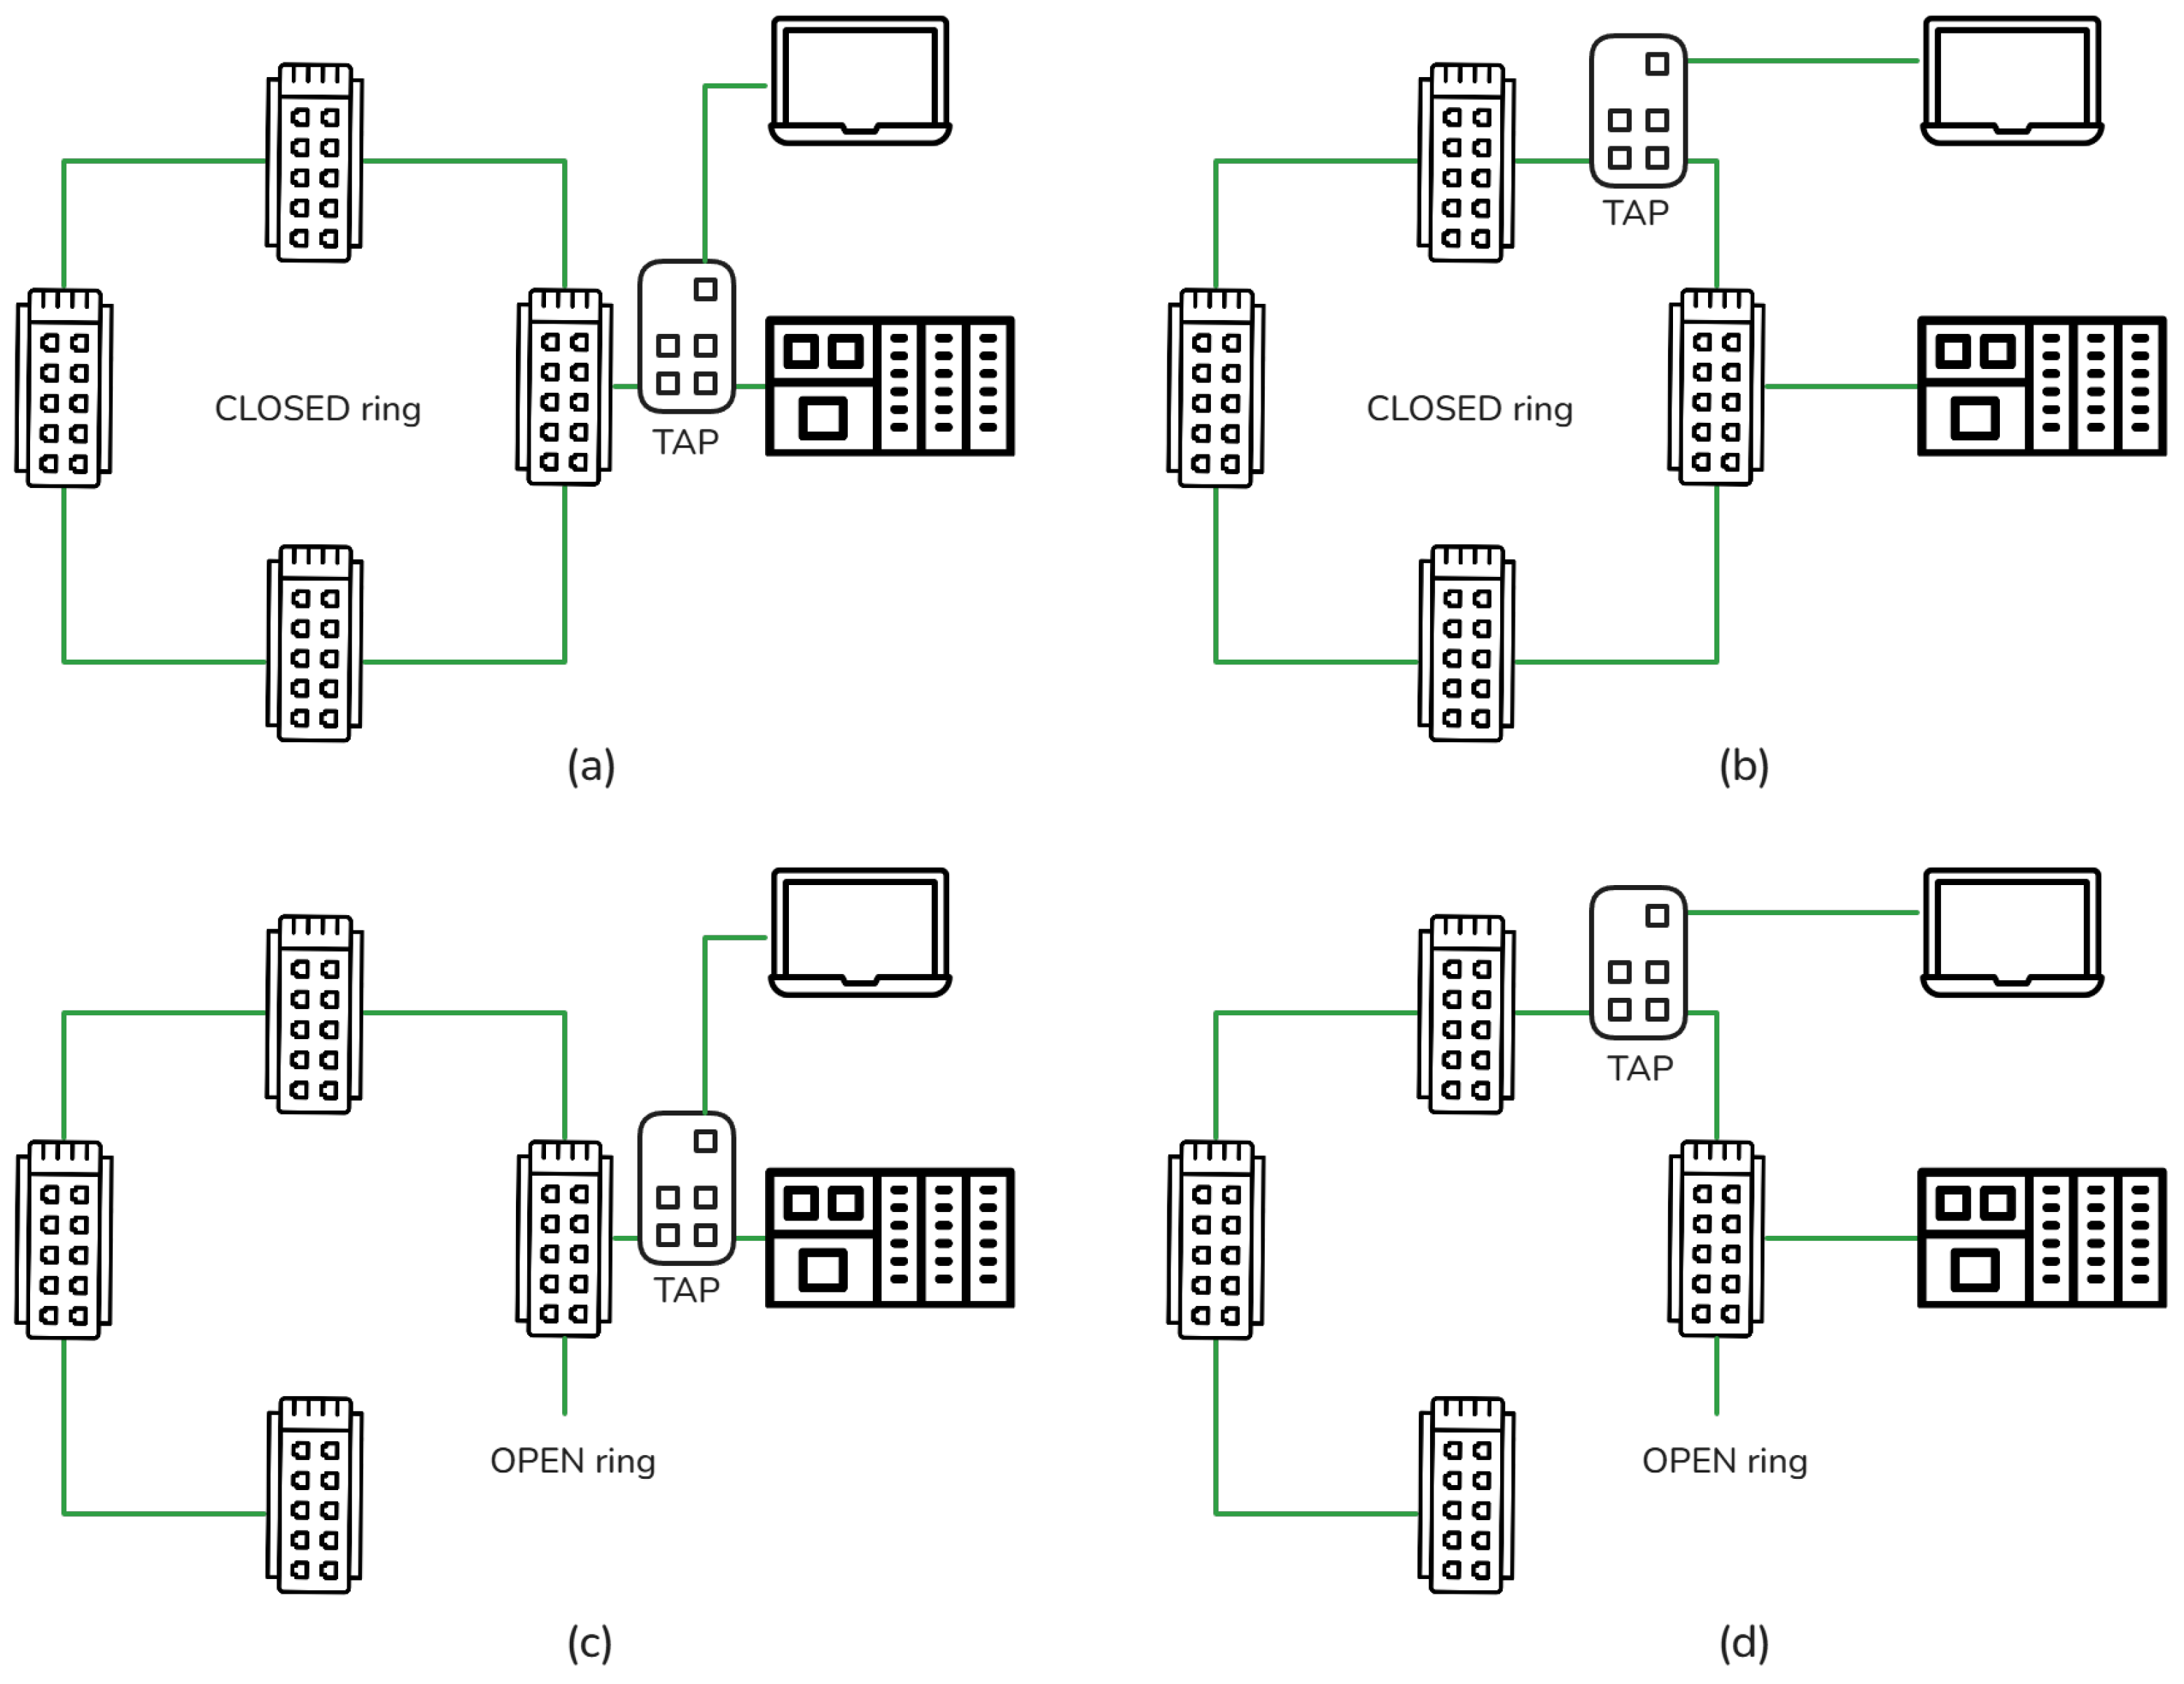
- Test configuration [label]: the state of the redundancy ring during capture (NORMAL or OPEN) and the type of measurement point (PLC uplink, RING internal traffic, or unspecified).
The State field is particularly significant: tests marked as OPEN indicate that the redundancy ring was intentionally opened to observe switchover behavior or to investigate detected anomalies. Conversely, NORMAL indicates standard operational conditions with a closed ring topology.
In addition to the State field, the Type field specifies the measurement point:
- PLC: raw packets collected between the PLC and the rest of the line, capturing all real-time cyclic traffic exchanged with field devices.
- RING: raw packets collected within a redundancy ring, focusing on internal ring traffic and redundancy protocol behavior.
- None: measurement point not explicitly specified, typically corresponding to general network captures (e.g., mirror port).
To clarify the different State and Type scenarios, Figure 2 illustrates all possible combination types. Detailed packet-level statistics are also extracted in Table A4, which provides a depth statistical characterization of each pcap file, automatically extracted through offline analysis. This table includes:
- Protocol distribution: counts and byte totals for different protocol layers (Ethernet, IP, TCP, UDP, ARP, PROFINET, 802.1Q).
- Packet size distribution: histograms categorizing packets into standard Ethernet size classes (0 ÷ 63, 64 ÷ 127, 128 ÷ 511, 512 ÷ 1023, 1024 ÷ 1518 bytes).
- Network behavior indicators: average throughput, total packet count, capture duration, and collector hardware type.
Figure 2.
State and Type combination: (a) NORMAL-PLC, (b) NORMAL-RING, (c) OPEN-PLC, (d) OPEN-RING.
This level of detail supports advanced traffic analysis, protocol behavior studies, and feature extraction for machine-learning applications.
6.2. Data Anonymization Strategy
Given the industrial and commercial sensitivity of the dataset, a rigorous anonymization procedure has been applied to all identifiable information:
- Plant identifiers: encoded alphabetically based on validation date, with no reference to geographical location or customer identity.
- Temporal information: dates of validation are anonymized while preserving relative temporal ordering for longitudinal analysis.
- Device identifiers: MAC addresses and IP addresses are anonymized by means of a specific correspondence table in the database. Uniqueness of synthetic MAC addresses is guaranteed by the table’s unique key.
- File naming: all pcap filenames are anonymized while maintaining cross-references within the database structure.
The granularity of the statistical features captured in the Derived Database (Table A1–Table A4) allows researchers to reconstruct the network’s behavior and train ML models for anomaly detection and performance analysis, effectively mitigating the limitations imposed by the NDA restricted access to the original pcap files.
7. Insights into the Resulting Dataset
This section shows the importance of the dataset of this paper, illustrating its full coverage of all the possible network structures and topologies of automotive plants. Table 4 summarizes the major key points of the dataset created in this work. In the dataset, there is the sampled traffic generated by more than 54.000 PROFINET devices connected to 699 different networks in 17 production sites. The measurements have been collected in almost 5000 different experiments, and the raw data, on which the dataset is based, is close to 300 GB.
Table 4.
Content of the dataset for PROFINET networks in the automotive industry.
In order to demonstrate the meaningfulness of the dataset, the section is divided into two subsections. In Section 7.1, the dataset is discussed considering the coverage of different network statuses (the analysis includes all the validated lines, regardless of the final outcome—PASS or FAIL—to provide a complete picture of the validation landscape); and in Section 7.2, the dataset is classified considering the different grades of network complexity (in this case the analysis is based exclusively on lines that passed the acceptance criteria, ensuring that the extracted statistics represent correctly functioning industrial networks). In both analyses, the separation between the type of shop (respectively, BODY and ASSEMBLY) is maintained. Please note that in the following tables, each line corresponds to the same industrial site, with one BODY shop and one ASSEMBLY shop (if any).
7.1. Dataset Overview Considering the Network Status (PASS or FAIL)
In total, the dataset includes about 5000 validation tests, implemented across multiple plants and covering a broad range of production environments. Table 5 reports a summary of all validation activities across the investigated automotive plants, including both PASS and FAIL outcomes, with a total number of 674 networks (one for each production line). Only 652 of the examined lines have raw data (606 PASS and 46 FAIL), while there are another 25 networks with raw data but PENDING/INCOMPLETE/DISMISSED states that are not considered. For each plant, the table includes aggregated information on:
- the total number of networks tested;
- the breakdown between NORMAL and OPEN ring measurements;
- the amount of raw traffic collected in gigabytes;
- the contribution of VISUAL, CHECKLIST, and CABLE-only tests for lines that did not pass validation.
Table 5.
Dataset content organized by plant and by network state. ("-" means that there is no entry for the combination).
This global overview reflects the substantial size heterogeneity across plants, showing the good coverage of all these cases by the proposed dataset.
Both the number of networks validated and the amount of data generated is different from plant to plant. For example, some plants (e.g., M, P) show large volumes of collected traffic exceeding 30–40 GB, while others feature only a few gigabytes due to a smaller number of production lines or reduced network complexity.
The PASS cases (625 networks, 606 with complete data) typically may include two situations (not mutually exclusive):
- NORMAL situations without problems. The network is working correctly, and sample traffic is collected from the network devices;
- OPEN ring fault situations, which means a network topology fault has been induced in the network for testing purposes. Sample traffic is recorded during the occurrence of the failures.
The FAIL cases (49 networks, 46 with complete data) typically belong to two categories (not mutually exclusive):
- VISUAL failures, indicating installation issues such as incorrect cable shielding, damaged connectors, or excessive bending radii;
- CHECKLIST or CABLE failures, mainly related to incomplete OEM documentation or cabling that did not meet PROFINET certification thresholds during the cable-testing phase.
From Table 5, it is evident that the proposed dataset covers different situations, with both normal (93%) and abnormal behaviors. Different types of documented faults are included, making it possible to have a detailed labeling of data. In detail, there are 60% of networks with both normal situations and open ring topology faults. More rare faults, like networks with installing faults, are covered with a 10% of the dataset. Last, the number of cases of networks with cabling errors is about 4% of the proposed dataset.
In conclusion, all the most significant states of a PROFINET network in automotive plants are considered in the proposed dataset. Hence, for instance, it is valuable for training AI models for fault detection.
7.2. Dataset Overview Considering the PROFINET Network Complexity
This section discusses the representativeness of the proposed dataset with respect to the PROFINET network complexity in an automotive plant. Since the complexity of a faulty network is not meaningful, the remainder of the analysis focuses exclusively on networks that successfully passed (PASS) the validation procedure. Hence, the considered networks in this section are 625, which is the 90% of the total dataset.
In order to classify the networks in the dataset, three main indicators of network complexity are used in this paper: the number of PLCs connected to the network indicates the complexity of the production lines from the control point of view; the number of redundancy rings indicates the complexity from the network topology point of view; and, last, the number of PROFINET device connected to the network shows the complexity of from the network traffic point of view. It should be noted that these three indicators are assigned as further labels to the data since they can be extracted only from validation reports (i.e., they are not obtainable from the analysis of the raw traffic).
Table 6 summarizes PROFINET network PLC and redundancy ring configurations for PASS networks. The majority of validated networks (60%) include at least one MRP ring, often associated with multiple PLCs. 78% of the networks have one PLC, in several plants, networks may have more than 3 connected PLCs per line (9%). This last situation, in particular, reflects the highly distributed control strategy, typical of an automotive BODY shop, where tens of robots must be coordinated.
Table 6.
Networks classified by the number of PLCs and by the number of Redundancy Rings. ("-" means that there is no entry for the combination).
The distribution of networks across multiple ring categories (6% of the networks have more than one ring) confirms that the dataset captures both simple topologies and deeply cascaded configurations. This structural diversity is essential for studying how network design choices influence load distribution and redundancy behavior. Availability data related to normal and faulty states allows the training of AI models for detecting also non-trivial behavior.
Table 7 further shows the network classification according to the number of PROFINET devices and by number of PLCs. Most of the networks fall into the 1–128 devices range (79%), although 5% of the networks exceed 255 devices (especially when more than one PLC is used).
Table 7.
Network classified by the number of PROFINET devices and by the number of PLCs. ("-" means that there is no entry for the combination).
Resuming, the dataset covers situations with any level of PROFINET communication traffic (from very low to very high). These data are particularly relevant for evaluating the scalability of AI-based predictive maintenance models and, more generally, for analyzing the impact of device count on AI approaches (accuracy, training time, memory, etc.).
8. Example of Analysis Based on the Proposed Dataset
The case studies presented in this section are intended as a Proof-of-Value to demonstrate the statistical richness and practical relevance of the repurposed data, rather than providing an exhaustive evaluation of specific AI algorithms, which remains out of the scope of this infrastructural work. The analyses are structured into four use cases in automotive plants: performance comparison between PROFINET network and another RTE network in Section 8.1; design and maintenance of PROFINET networks in automotive plants in Section 8.2; cybersecurity of PROFINET networks in hierarchical plants in Section 8.3; and training of machine-learning algorithm for online detection of redundancy problems (ring-open, ring-close) in Section 8.4.
8.1. Use Case: Performance Comparison
Automotive plant owners have always had the goal of improving their plants, increasing the performance of any parts. The analysis of the current situation and the comparison with other possible solutions are the basis of such improvement actions. This section presents the use of the information included in the proposed dataset for comparing the performance of PROFINET with other RTEs. Figure 3 illustrates the distribution of network devices and the distribution of maximum traffic loads in the dataset (considering only 625 PASS lines, 90% of the total). The boxplots provide aggregated statistics including: median, 25 to 75 quartile range, 5 and 95 percentiles, and outlier values marked with dots. The boxplots highlight heterogeneity among plants in terms of both network size and traffic load intensity. BODY shop plants (A, C, E, G, I, J, L, N, P) generally feature larger networks, with median device counts exceeding 100 in several cases and peak loads reaching values well above 30 Mbit/s. ASSEMBLY shop plants (B, D, F, H, K, M, O, Q) tend to present smaller network sizes and lower traffic loads, consistently below 20 Mbit/s in the majority of cases.
Figure 3.
Distribution of the number of PROFINET devices per network (a,b) and maximum PROFINET traffic load at the PLC uplink (c,d), for BODY (left) and ASSEMBLY (right) shops. The color refers to the site where the plants belong to. Dashed lines indicate traffic levels of the SWaT and WaDI datasets with EtherNet/IP RTE.
As discussed in Section 2, there are just two other datasets that are comparable with the dataset of this paper. The SWaT and WaDI datasets are based on EtherNet/IP, a well-known RTE with application scopes very similar to PROFINET. There is only one network at the origin of the two datasets, and the number of EtherNET/IP devices in this network is 50. From the publicly available information, the average traffic loads of SWaT are approximately 8 Mbit/s, while WaDI has a slightly higher value of 10 Mbit/s. The values of SWaT and WaDI cases have been plotted with dashed horizontal lines in Figure 3. The graphical comparison in Figure 3a,b shows that the SWaT and WaDI EtherNet/IP network is closer to the PROFINET networks in the ASSEMBLY shop than in the BODY shop. As a matter of fact, PROFINET networks in the BODY shop are, by far, bigger and more complex. If needed, a more detailed comparison is possible: the counting of the PROFINET networks in the dataset with a number of devices between 45 and 55 is 26, and the number of networks with a traffic level between 8 Mbit/s and 10 Mbit/s (regardless of the number of devices) is 22. In total, about 10GB of data from the first set and 4GB from the second set are available. However, even if the analysis is focused only on comparable situations, the Figure 3d confirms that real-world PROFINET networks in automotive environments operate at significantly higher load levels than the laboratory testbed realized for the SWaT and WaDI dataset. In conclusion, the authors acknowledge that SWaT and WaDI provide a valuable sample of documented real cyber attacks, but from the preliminary comparison emerges that the SWaT and WaDI testbeds do not reflect the structure of an EtherNet/IP network suitable for the automotive industry. Moreover, generally speaking, this use case underlines the importance of datasets derived from actual (i.e., complex) production plants rather than laboratory or simulated setups.
8.2. Use Case: Design and Maintenance of PROFINET Networks
Expanding or revamping a plant is very common in the automotive industry. The availability of tools for designing or simulating new networks (or modifications to existing networks) before building them is mandatory. For this reason, the estimations obtained from previous plants of the same type are important for planning new systems or maintaining/expanding old ones. The proposed dataset can be the source for this kind of information.
This section presents the use of the proposed database to obtain the distribution of the average PROFINET traffic contribution per device, both at the PLC and within redundancy rings. In this section, two normalized metrics related to traffic load are defined. The first is the average traffic generated by a device when it exchanges data with the PLC; the metric is calculated as:
where is the maximum PROFINET traffic load measured at the PLC, and is the total number of PROFINET devices in the network. The second metric is the average traffic generated by a device in a redundancy ring; the metric is calculated as:
where is the maximum PROFINET traffic loads measured inside the redundancy ring, and is the total number of PROFINET devices in the network.
Figure 4 illustrates the distribution of these normalized indicators across plants, separately for BODY and ASSEMBLY shops. The per-device traffic values are remarkably consistent across plants, with most medians falling in the range 0.2–0.4 Mbit/s per device both at the network level (a, b) and within the rings (c, d). This consistency suggests that the average per-device traffic contribution is a relatively stable characteristic of PROFINET networks in the automotive sector, largely independent of network size or plant type.
Figure 4.
Distribution of normalized PROFINET traffic per device at the network level (a,b) and within redundancy rings (c,d), for BODY (left) and ASSEMBLY (right) shops. The color refers to the site where the plants belong to.
These indicators have direct practical relevance for two complementary purposes. First, they can be used as a design rule to estimate the expected traffic load of new networks or new network expansions. Expected traffic, in turn, is useful during the engineering phase to size the infrastructure, to choose the link speed, and to accept/reject special variants (e.g., PROFINET on wireless). As a second mode of use, knowing the distribution of the average traffic in similar plants can serve as a maintenance baseline: networks whose per-device traffic significantly deviates from the reference distribution shape may indicate misconfiguration, device failures, or abnormal communication patterns, enabling early detection of network degradation.
It should be noted that in Figure 4, several outliers are visible. These networks lie outside the 5–95 percentile, and may represent networks containing uncommon/abnormal devices or configuration errors. A specific training of AI classifiers only on outliers may help to identify singularities.
8.3. Use Case: Cybersecurity of PROFINET Systems
Today, protecting valuable assets from cyber threats is often mandatory for companies. In addition, the cost of cyber attacks that disrupt production is greater for complex manufacturing like the automotive sector. This section shows how the presented dataset can be used for cybersecurity.
The authors suggest the analysis of non-PROFINET IP traffic as a source of cybersecurity indicators. In a correctly configured PROFINET network, the majority of traffic is cyclic real-time communication between PLCs and field devices. IP-based traffic, which includes S7comm at layer 7, TCP, UDP at layer 4, and ARP frames at layer 3, is not associated with the PROFINET protocol. Usually, in a PROFINET network, IP traffic should represent only a marginal fraction of the total load. The non-PROFINET traffic component is defined as:
where is the total measured traffic at the PLC uplink and is the PROFINET-only component.
Figure 5 reports the distribution of non-PROFINET traffic (a, b), IP traffic on the PLC link (c, d), and IP traffic within redundancy rings (e, f), across all validated plants. As expected, the typical median IP traffic load is below 0.5 Mbit/s, with 75 percentile values generally lower than 1 Mbit/s.
Figure 5.
Distribution of non-PROFINET traffic (a,b), IP traffic on the PLC link (c,d), and IP traffic within redundancy rings (e,f), for BODY (left) and ASSEMBLY (right) shops. The color refers to the site where the plants belong to.
It is clear that the shapes of the distribution of the IP traffic in the automotive plant can be used as a first cybersecurity warning. In other words, they can set the thresholds for the detection of additional “active devices” connected to the network, such as unauthorized devices, rogue gateways, or active network scanners. Moreover, another valuable piece of information for intrusion detection is the comparison between IP traffic on the PLC link and IP traffic within the redundancy ring. In a non-compromised network, the inter-PLC communication is minimal, and the IP load within a ring should be lower than or comparable to the IP load on the PLC uplink. Hence, if the ring IP traffic exceeds the PLC IP traffic, a security breach or a severe misconfiguration may be present in the network.
Thus, the presented dataset enables the training of data-driven AI intrusion detection tailored to the specific communication patterns of industrial PROFINET networks. As a matter of fact, the dataset includes labeled per-plant traffic baselines and samples of anomalous deviations: while most networks in Figure 5 exhibit very low non-PROFINET loads, there is a significant percentage (2%) of outliers (dots) with elevated values, particularly in the BODY shops.
8.4. Use Case: Training ML for PROFINET Open Ring Detection
In PROFINET, the detection of redundancy faults (e.g., open ring) is handled by a specific protocol called MRP. However, the real-time detection event is passed to the automation system that applies real-time control actions. Supervision and management of the plant is notified of the problem through the automation system, if and only if it is programmed to do so. By means of an ML algorithm, trained on the proposed dataset, and running in parallel with the automation system, it is possible to add independent evaluation of the OPEN/CLOSE ring state. Thus, a faster reaction from maintenance staff is expected even in the old line, without changing the automation program. Since the size and topology of the network may influence the classifier structure, a homogeneous subset of networks is extracted from the proposed dataset. In detail, medium size lines from both the BODY and ASSEMBLY shops of two different plants are chosen with the following characteristics: 1 PLC, 1 ring, fewer than 100 devices, and maximum traffic between 2 and 20 Mbit/s. The selection query produced 53 matches as reported in Table 8, with a total of 158 PCAP files that constitute the basis for the training. The selection includes anomalies labeled as “ring-open”, which serve as the ground truth for validating the detection system.
Table 8.
Lines selected for the ML training.
The detection pipeline focuses exclusively on time statistics, as these features are physically grounded in the rigorous cyclic timing of PROFINET traffic. Data are processed in fixed-length windows of 256 frames with a 50% overlap. For each window, packet Inter-Arrival Time statistics are computed, including mean, standard deviation, 95-percentile, 99-percentile, maximum, absolute slope, mean absolute difference, and jitter. These window-level statistics are further aggregated into PCAP-level summary functions, such as the mean and maximum of the window statistics. Feature importance analysis confirms that the primary features for identifying anomalies are the ones capturing temporal trends, extreme spikes, and timing variability.
For this example, the ML algorithm is Random Forest, a supervised bagged tree ensemble, available in the scikit-learn-1.8.0 machine-learning library in Python. This classifier was chosen for its high performance and its ability to handle the complexities of industrial network traffic. Random Forest operates by analyzing the learned representation of Inter-Arrival Time distributions to distinguish in each window between normal cyclic timing and the disruptions caused by network failures. Please note that from a cybersecurity perspective, it might also detect network intrusions. The model was evaluated using Leave-One-Out Cross-Validation, ensuring that the detector is tested on production lines it has never seen during training to measure real-world generalization. Random Forest achieved the following performance metrics:
- Area under the Receiver Operating Characteristic (AUROC): 0.941 (with a 95% confidence interval of 0.90–0.96).
- Average Precision (AP): 0.931.
- True Positive Rate at 5% FPR (TPR@5%): 0.860, meaning it correctly identifies 86.0% of anomalies while maintaining a low 5% false positive rate.
- F1 Score: 0.885.
It is interesting to note that the Random Forest model demonstrates high discriminative power (AUROC) across different sites, meaning it can preserve the performance if it is used in different plants with respect to the one it has been trained on (i.e., trained on plants F,G, and used on plants M,L). However, a threshold calibrated on one plant may lead to an increased false positive rate (up to 30%) when deployed on another plant without adjustment. For effective deployment, it is recommended to calibrate the specific alarm threshold in each plant.
9. Discussion of Limitations and Future Works
The results presented in this paper may have partial limitations, as summarized in the following questions: Can the methodology be applied to other protocols and environments? Can the data bias, due to the use of commissioning data only, be mitigated? Can focusing on just one RTE protocol (namely PROFINET) result in a generality validity loss of the dataset?
In the following, the actual impact is discussed:
- The reprocess-and-reuse methodology is intentionally designed to be protocol-independent. It leverages the common normative base of the IEC 61784-5 and IEC 61918 standards, which define installation and validation tasks common to all major RTE protocols. Consequently, the framework serves as a reference template that can be applied to an industrial environment following IEC61918 structured validation procedures, extending its utility beyond the automotive scope.
- The potential time bias associated with commissioning data is mitigated by the operational characteristics of the automotive industry. Because industrial network configurations are strictly programmed and remain static until a new commissioning phase is triggered by a plant update, the data captured during validation remains highly representative of the network’s lifecycle. Furthermore, by including both nominal operations and induced network degradations (such as open-ring tests) during acceptance, the dataset provides the balanced labeling necessary for robust AI training.
- The choice of PROFINET as the primary protocol is strategically justified by its dominant market share in the automotive sector and its inherent technical complexity. By capturing PROFINET real-time traffic with advanced redundancy mechanisms, the dataset provides a challenging validation environment that is significantly more representative than laboratory-scale setups.
The presented dataset can be expanded and improved in many ways in the future. The authors are already working to integrate additional information, such as photographs of cabinets and cables, as well as documentation related to cable certification through multimeter measurements, as described in Section 5.5. In these cases, image processing algorithms and Retrieval-Augmented Generation (RAG) models will be employed to automatically analyze and extract relevant insights from visual and textual documentation, further enriching the dataset and enhancing the scope of automated network assessment. Other add-ons may include: the realization of an LLM-based interface for the interaction with the data, helping non-expert personnel to extract the desired information from the dataset; and the use of Model Context Protocol (MCP) interfaces to enable direct interaction between AI systems and the proposed dataset.
10. Conclusions
The transition toward data-centric manufacturing in the automotive sector has established IEC61784-2 Real-Time Ethernet (RTE) networks as the fundamental backbone of modern production systems. However, the advancement of AI-driven tools for predictive maintenance and cybersecurity has been significantly hindered by a critical lack of structured datasets derived from real-world industrial environments. This research addresses this gap by introducing a novel methodology to repurpose RTE network data collected during the standard commissioning and validation phases of a plant lifecycle. By leveraging the RTE common normative base of IEC61784-5 and IEC61918, which includes network acceptance tests and cable certifications, this work demonstrates that it is possible to generate high-quality labeled data without the prohibitive costs or production risks associated with installing new sensors.
The valuable outcome of this work is the creation of a massive, multi-plant dataset aggregating approximately 300 GB of real RTE (PROFINET) traffic from 17 industrial sites, nearly 700 production lines, and over 54,000 devices. This collection represents the large-scale effort to capture the true complexity, heterogeneity, and scale of actual automotive manufacturing. Unlike existing datasets that rely on small-scale laboratory simulations, this repository provides a realistic foundation for training machine-learning models by including both nominal operations and naturally occurring (or induced) network degradations.
The Proof-of-Value of this dataset is shown through case studies demonstrating its effectiveness in performance benchmarking, maintenance design, and cybersecurity intrusion detection. These analyses prove that the dataset captures essential operational load profiles and redundancy behaviors necessary for building robust AI models, even if the fine-tuning of advanced machine-learning models for each specific scenario is intentionally deferred to future dedicated research works.
Ultimately, the proposed methodology offers a replicable framework for manufacturers to transform discarded validation data into a valuable strategic asset. This approach goes far beyond the sole automotive scope, since it not only enhances the reliability and safety of smart manufacturing today but also paves the way for future developments, such as the integration of visual documentation through advanced image processing and retrieval-augmented generation models.
Author Contributions
Conceptualization, P.F. and M.G.; methodology, E.S., D.B., P.F. and M.G.; software, M.G.; validation, D.B., P.F. and M.G.; formal analysis, E.S. and D.B.; investigation, M.G.; resources, P.F.; data curation, M.G.; writing—original draft preparation, E.S., D.B., P.F. and M.G.; writing—review and editing, E.S., D.B., P.F. and M.G.; visualization, M.G.; supervision, P.F.; project administration, P.F.; funding acquisition, P.F. All authors have read and agreed to the published version of the manuscript.
Funding
This research received no external funding.
Data Availability Statement
While raw pcap files are restricted by non-disclosure agreements, the authors are committed to scientific transparency. A summary of the derived database, containing a limited set of the features and validation labels described in this paper, is available at https://github.com/paoloferrari-unibs/PN4AD, accessed on 20 May 2026, to facilitate benchmarking. The full derived database containing all anonymized statistical features and validation labels is available upon request on a collaborative research basis.
Acknowledgments
The authors acknowledge the organizational support of D. Rovetta of CSMT Gestione Scarl, and the operational support of F. Venturini and P. Kumar of the University of Brescia.
Conflicts of Interest
The authors declare no conflicts of interest.
Appendix A. The PROFINET Protocol
The PROFINET protocol is standardized under IEC 61158-5-10 and IEC 61158-6-10, and represents one of the most widespread industrial communication solutions based on Ethernet technology. It supports multiple traffic classes: hard real-time, soft real-time, and non-real-time (TCP/IP) coexisting on the same physical network. Non-real-time communication can use up to 40% of the total bandwidth, ensuring that control and diagnostic data can share the same medium without compromising deterministic communication.
Within a PROFINET network, three main device roles are defined: the IO-Controller, which acts as the automation controller; the IO-Device, representing sensors and actuators; and the IO-Supervisor, typically corresponding to engineering or diagnostic stations. Communication between these entities follows a cyclic exchange mechanism, where each device transmits its process data at regular intervals determined during configuration. In most implementations, cycle timing is managed by dedicated hardware counters, achieving a high degree of temporal precision. Nevertheless, standard Ethernet introduces potential non-deterministic delays that must be mitigated at the protocol level.
To handle different timing requirements, PROFINET defines multiple real-time communication classes. The RT_Class 1/2 mode is designed for applications that can tolerate small timing jitter, typically within a few communication cycles or a few milliseconds. Conversely, the RT_Class 3 (Isochronous Real-Time, IRT) mode targets highly synchronized applications requiring sub-millisecond cycle times with jitter below 1 s.
A typical PROFINET communication cycle is divided into distinct transmission phases.
- The Isochronous phase is reserved for IRT communication (RT_Class 3) and guarantees deterministic data exchange.
- The Standard real-time phase handles RT_Class 1/2 communication and non–real-time traffic.
- Between these, a Transition phase of variable duration may occur.
Among these, only the standard real-time phase is mandatory. In RT_Class 3, transmission scheduling is computed deterministically based on the network topology, thus eliminating collisions and delays. This class, however, requires dedicated PROFINET-compliant switches and hardware. In contrast, RT_Class 1/2 leverages standard Ethernet VLAN priority tagging to prioritize PROFINET frames using a best-effort approach, making it the most commonly deployed configuration in industrial automation systems. For instance, the sources of the dataset considered in this paper are all based on PROFINET RT_Class 1/2.
As shown in Figure A1, PROFINET supports different topologies:
- The star topology configuration is optimal for deployments within constrained geographical boundaries. This architecture emerges inherently when multiple communication nodes establish connections through a centralized switch. In this configuration, the failure or disconnection of an individual PROFINET node does not compromise the operational integrity of the remaining nodes. However, a critical vulnerability exists at the central switch: its malfunction results in complete communication disruption across all connected nodes.
- The tree topology represents a hierarchical network architecture formed through the integration of multiple star-configured sub-networks. In industrial implementations, functionally related plant components are consolidated at star points, which are subsequently interconnected via adjacent switches. Within each star point, a designated switch functions as a signal distribution hub. The address-based message routing capability of these switches ensures that only destination-relevant data packets are forwarded to neighboring distribution points, thereby optimizing network efficiency.
- The line topology employs a daisy chain connection, where the communication nodes are arranged sequentially. This architecture presents a significant limitation: switch failure at any point in the chain eliminates communication capability for all downstream nodes. Implementation of a linear structure necessitates the deployment of devices equipped with dual-port switching functionality. Despite this vulnerability, linear network architectures offer the advantage of minimal cabling requirements, making them cost-effective for some types of applications.
- The ring topology provides enhanced redundancy through its closed-loop architecture. Implementation of this configuration requires the designation of both a redundancy manager and redundancy clients within the network. This topology offers superior fault tolerance by maintaining alternative communication paths: in the event of a single point failure, data transmission can proceed through the redundant pathway, ensuring continuous network operation. The ring structure effectively addresses the single point of failure limitations inherent in line and star topologies, though it requires more sophisticated configuration and management protocols.
Figure A1.
Profinet Topology.
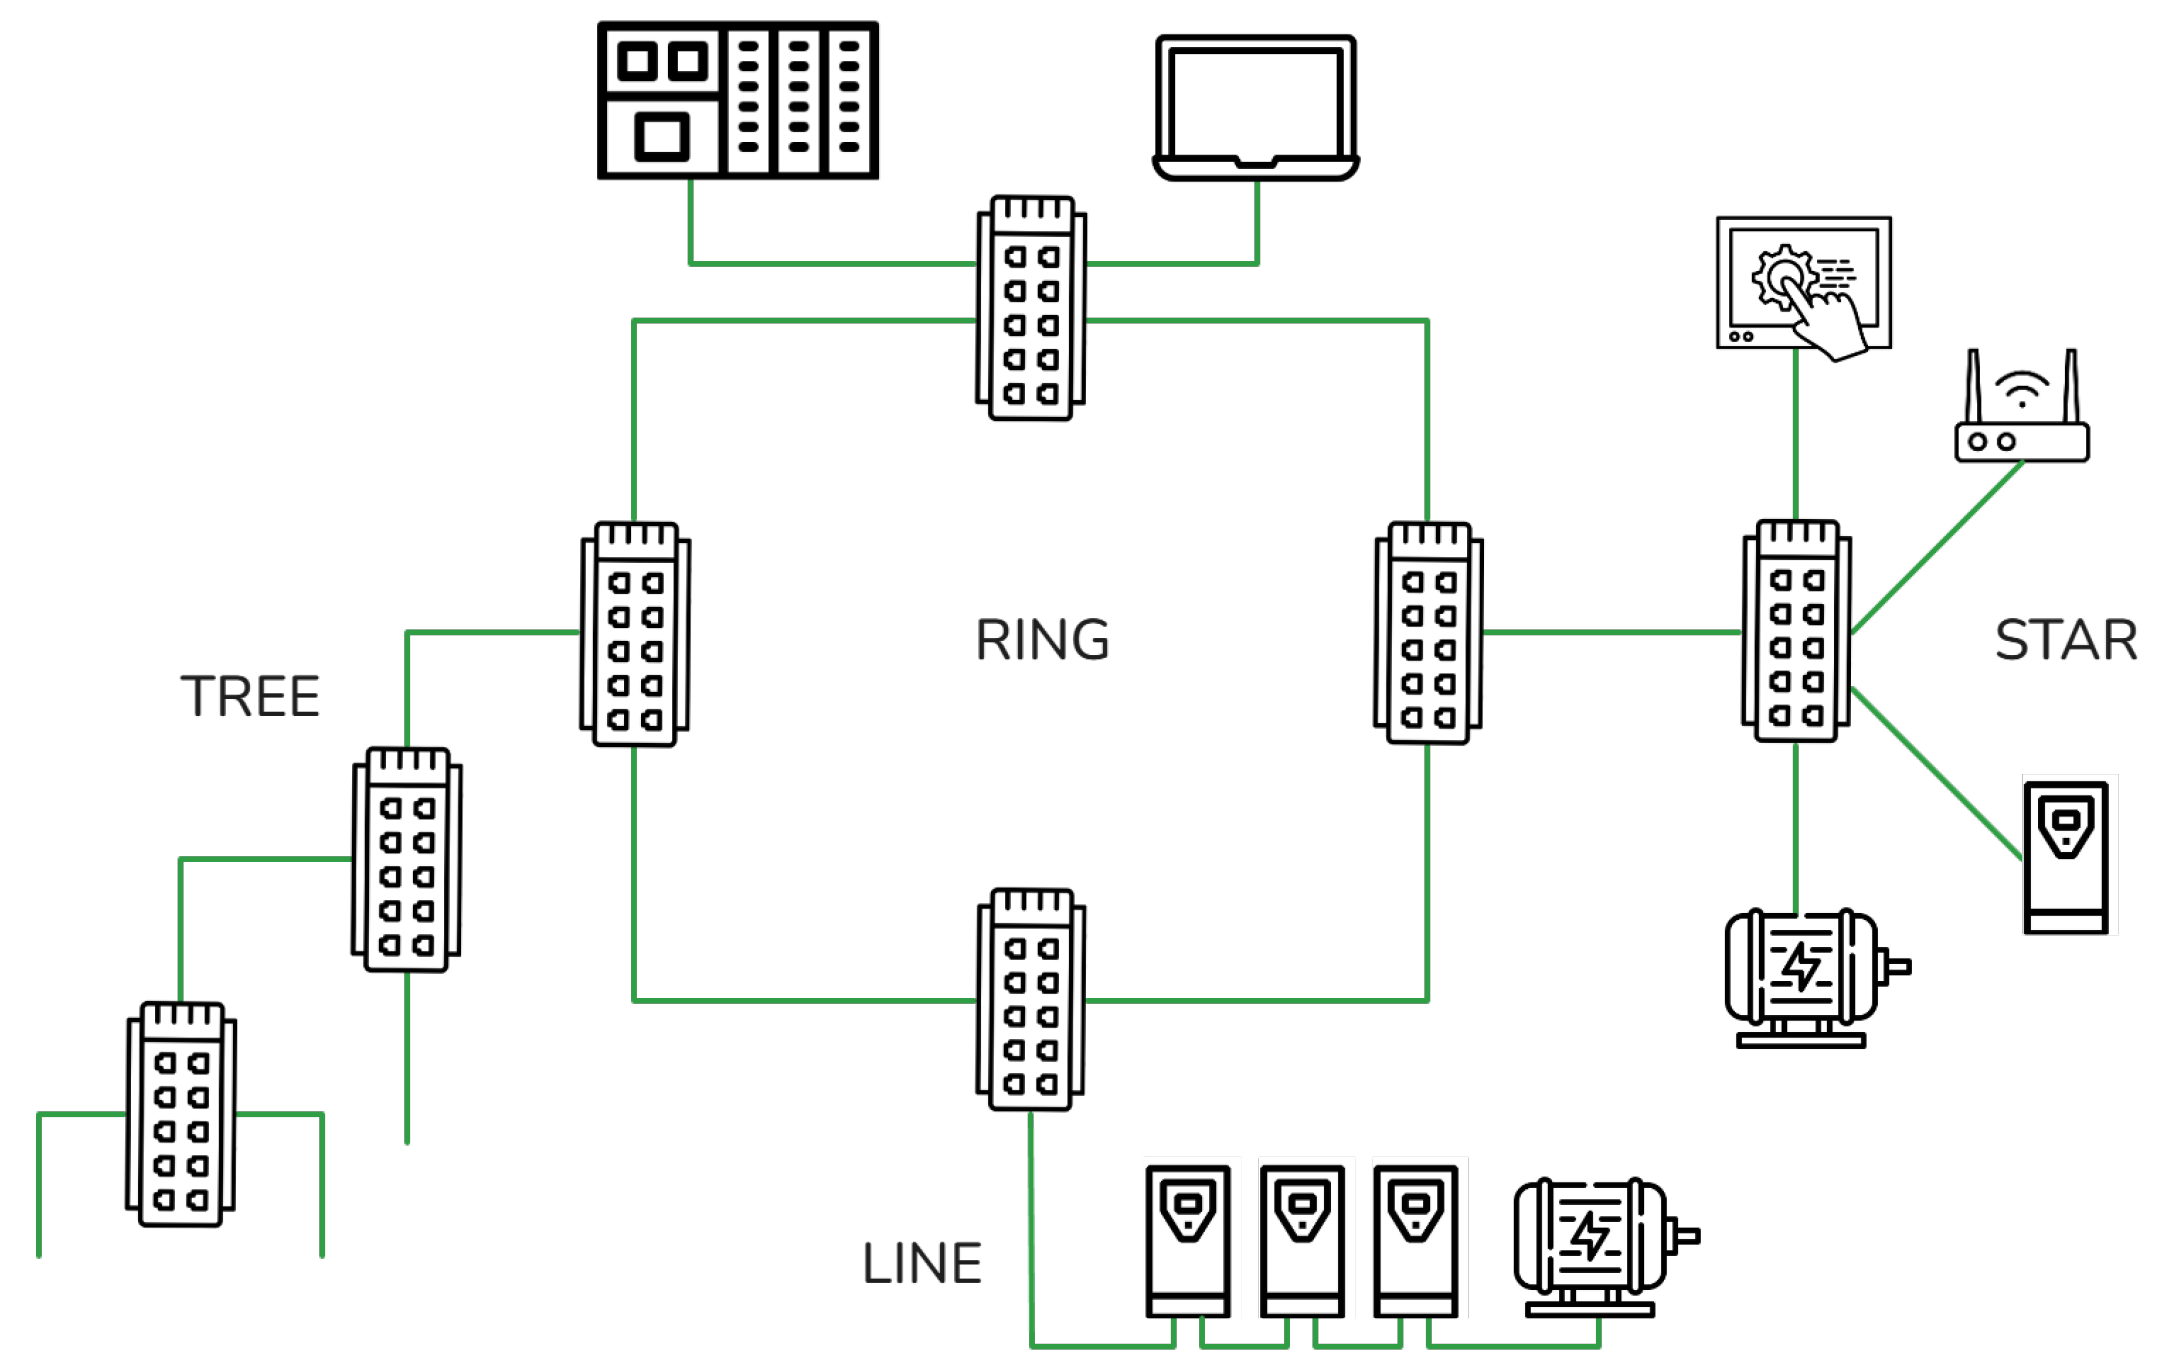
Appendix B. Structure of the Database
The dataset is organized in a database with multiple hierarchical tables. Plant and Line Level Information are summarized in Table A1, where parameters describe each production line at the highest level of abstraction. Table A2 details PLC Level Information measurements associated with individual PLCs within each line. The information regarding redundancy rings is in Table A3. Table A4 provides metadata for each pcap file collected during the validation procedure.
Table A1.
Line of Plant and Line Information parameters.
Table A2.
Description of PLC level network parameters.
Table A3.
Description of redundancy ring network parameters.
Table A4.
Description of Line network parameters.
References
- IEC 61784-2-X:2023; Industrial Communication Networks—Profiles—Part 2-X—Additional Real-Time Fieldbus Profiles Based on ISO/IEC/IEEE 8802-3—Series. IEC—International Electrotechnical Commission: Geneva, Switzerland, 2023.
- IEC 61158-X:2023; Industrial Communication Networks—Fieldbus Specifications—Series. IEC—International Electrotechnical Commission: Geneva, Switzerland, 2023.
- IEC 61784-5-X:2024 CSV; Industrial Communication Networks—Profiles—Part 5-X: Installation of Fieldbuses—Installation Profiles. IEC—International Electrotechnical Commission: Geneva, Switzerland, 2023.
- IEC 61918:2024 CSV; Industrial Communication Networks—Installation of Communication Networks in Industrial Permises. IEC—International Electrotechnical Commission: Geneva, Switzerland, 2024.
- Kok, A.; Martinetti, A.; Braaksma, J. The Impact of Integrating Information Technology With Operational Technology in Physical Assets: A Literature Review. IEEE Access 2024, 12, 111832–111845. [Google Scholar] [CrossRef] [Scilit]
- Ren, Y.; Rupasinghe, L.; Khaksar, S.; Ferdosian, N.; Murray, I. Secured Real-Time Machine Communication Protocol. Network 2024, 4, 567–585. [Google Scholar] [CrossRef] [Scilit]
- Bochie, K.; Gilbert, M.S.; Gantert, L.; Barbosa, M.S.; Medeiros, D.S.; Campista, M.E.M. A survey on deep learning for challenged networks: Applications and trends. J. Netw. Comput. Appl. 2021, 194, 103213. [Google Scholar] [CrossRef] [Scilit]
- Zhang, Q.; Zhang, Y.; Luo, Q.; Yu, C.; Yu, N.; Wang, Q.; Ke, Y. Cloud-edge-end-based aircraft assembly production quality monitoring system framework and applications. J. Manuf. Syst. 2024, 75, 116–131. [Google Scholar] [CrossRef] [Scilit]
- Al Debeyan, F.; Madeyski, L.; Hall, T.; Bowes, D. The impact of hard and easy negative training data on vulnerability prediction performance. J. Syst. Softw. 2024, 211, 112003. [Google Scholar] [CrossRef] [Scilit]
- El-Hajj, M. Enhancing Communication Networks in the New Era with Artificial Intelligence: Techniques, Applications, and Future Directions. Network 2025, 5, 1. [Google Scholar] [CrossRef] [Scilit]
- Lederer, A.; Capone, A.; Umlauft, J.; Hirche, S. How Training Data Impacts Performance in Learning-Based Control. IEEE Control Syst. Lett. 2021, 5, 905–910. [Google Scholar] [CrossRef] [Scilit]
- Sheng, C.; Zhou, W.; Han, Q.L.; Ma, W.; Zhu, X.; Wen, S.; Xiang, Y. Network Traffic Fingerprinting for IIoT Device Identification: A Survey. IEEE Trans. Ind. Inform. 2025, 21, 3541–3554. [Google Scholar] [CrossRef] [Scilit]
- Gòmez, L.P.; Maimò, L.F.; Celdràn, A.H.; Clemente, F.J.G. Detection of Adversarial Attacks Using Deep Learning and Features Extracted From Interpretability Methods in Industrial Scenarios. IEEE Access 2025, 13, 2705–2722. [Google Scholar] [CrossRef] [Scilit]
- Rahmani, J.; Detken, K.O.; Sikora, A. A Testbed for Cyber Attack Emulation and AI-Driven Anomaly Detection in Industrial IoTand OT-Networks. In Proceedings of the 2025 IEEE 13th International Conference on Intelligent Data Acquisition and Advanced Computing Systems: Technology and Applications (IDAACS), Gliwice, Poland, 4–6 September 2025; pp. 255–260. [Google Scholar] [CrossRef] [Scilit]
- Ferrari, P.; Bellagente, P.; Flammini, A.; Gaffurini, M.; Rinaldi, S.; Sisinni, E.; Brandao, D. Anomaly Detection in Industrial Networks using Distributed Observation of Statistical Behavior. In Proceedings of the IEEE International Workshop on Metrology for Industry 4.0 & IoT (MetroInd4.0 & IoT), Florence, Italy, 29–31 May 2024; pp. 180–185. [Google Scholar] [CrossRef] [Scilit]
- Gaffurini, M.; Brandão, D.; Rinaldi, S.; Flammini, A.; Sisinni, E.; Ferrari, P. Characterizing the Real-Time Communication Performance of Virtual PLC in Industrial Edge Platform. IEEE Open J. Instrum. Meas. 2025, 4, 5500311. [Google Scholar] [CrossRef] [Scilit]
- Ferrari, P.; Flammini, A.; Venturini, F.; Augelli, A. Large PROFINET IO RT networks for factory automation: A case study. In Proceedings of the ETFA2011, Toulouse, France, 5–9 September 2011; pp. 1–4. [Google Scholar] [CrossRef] [Scilit]
- Sestito, G.S.; Turcato, A.C.; Dias, A.L.; Rocha, M.S.; da Silva, M.M.; Ferrari, P.; Brandao, D. A Method for Anomalies Detection in Real-Time Ethernet Data Traffic Applied to PROFINET. IEEE Trans. Ind. Inform. 2018, 14, 2171–2180. [Google Scholar] [CrossRef] [Scilit]
- Sisinni, E.; Brandao, D.; Flammini, A.; Gaffurini, M.; Ferrari, P. Clustering of Distributed Observations for Traffic Classification in Industrial Networks. In Proceedings of the IEEE 21st International Conference on Factory Communication Systems (WFCS), Rostock, Germany, 10–13 June 2025; pp. 1–4. [Google Scholar] [CrossRef] [Scilit]
- Dobrády, Z.; Nagy, S.; Hidvégi, T. ModRTU InjectX: A Command Injection Simulation Tool for Industrial Cybersecurity Research. In Proceedings of the 60th International Scientific Conference on Information, Communication and Energy Systems and Technologies (ICEST 2025)-Proceedings, Ohrid, North Macedonia, 26–28 June 2025; pp. 1–4. [Google Scholar] [CrossRef] [Scilit]
- Gaggero, G.B.; Armellin, A.; Portomauro, G.; Marchese, M. Industrial Control System-Anomaly Detection Dataset (ICS-ADD) for Cyber-Physical Security Monitoring in Smart Industry Environments. IEEE Access 2024, 12, 64140–64149. [Google Scholar] [CrossRef] [Scilit]
- Gaggero, G.B.; Armellin, A. ICS-ADD–A Smart Industry Testbed Dataset for Cyber-Physical Security Monitoring Testing; IEEE: New York, NY, USA, 2024. [Google Scholar] [CrossRef]
- Dehlaghi-Ghadim, A.; Moghadam, M.H.; Balador, A.; Hansson, H. Anomaly Detection Dataset for Industrial Control Systems. IEEE Access 2023, 11, 107982–107996. [Google Scholar] [CrossRef] [Scilit]
- Gómez, A.L.P.; Maimó, L.F.; Celdrán, A.H.; Clemente, F.J.G.; Sarmiento, C.C.; Masa, C.J.D.C.; Nistal, R.M. On the Generation of Anomaly Detection Datasets in Industrial Control Systems. IEEE Access 2019, 7, 177460–177473. [Google Scholar] [CrossRef] [Scilit]
- Lemay, A.; Fernandez, J.M. Providing SCADA network data sets for intrusion detection research. In Proceedings of the CSET’16, Austin, TX, USA, 8 August 2016; p. 6. Available online: https://dl.acm.org/doi/10.5555/3241067.3241073 (accessed on 20 May 2026).
- Al-Hawawreh, M.; Sitnikova, E.; Aboutorab, N. X-IIoTID: A Connectivity- and Device-Agnostic Intrusion Dataset for Industrial Internet of Things; IEEE: New York, NY, USA, 2021. [Google Scholar] [CrossRef] [Scilit]
- Al-Hawawreh, M.; Sitnikova, E.; Aboutorab, N. X-IIoTID: A Connectivity-Agnostic and Device-Agnostic Intrusion Data Set for Industrial Internet of Things. IEEE Internet Things J. 2022, 9, 3962–3977. [Google Scholar] [CrossRef] [Scilit]
- Canadian Institute for Cybersecurity, University of New Brunswick. CIC Modbus 2023 Dataset. n.d. Available online: https://www.unb.ca/cic/datasets/modbus-2023.html (accessed on 13 January 2026).
- Zhou, X.; Cheng, Z.; Wang, C.; Wang, S.; Tao, C.; Zhou, Z.; Chen, X.; Luo, J.; Wang, D.; Zhou, H. A dataset collected in real-world industrial control systems for network attack detection. Sci. Data 2026, 13, 399. [Google Scholar] [CrossRef] [Scilit]
- iTrust, Singapore University of Technology and Design. iTrust Labs Datasets–Dataset Information. n.d. Available online: https://itrust.sutd.edu.sg/itrust-labs_datasets/dataset_info/ (accessed on 13 January 2026).
- Mathur, A.P.; Tippenhauer, N.O. SWaT: A water treatment testbed for research and training on ICS security. In Proceedings of the International Workshop on Cyber-Physical Systems for Smart Water Networks (CySWater), Vienna, Austria, 11–14 April 2016; pp. 31–36. [Google Scholar] [CrossRef] [Scilit]
- Goh, J.; Adepu, S.; Junejo, K.N.; Mathur, A. A Dataset to Support Research in the Design of Secure Water Treatment Systems. In Proceedings of the Critical Information Infrastructures Security; Havarneanu, G., Setola, R., Nassopoulos, H., Wolthusen, S., Eds.; Springer: Cham, Switzerland, 2017; pp. 88–99. [Google Scholar] [CrossRef] [Scilit]
- Shahid, S. WADI_14days_new; IEEE Dataport; IEEE: New York, NY, USA, 2025. [Google Scholar] [CrossRef]
- Ahmed, C.; Palletti, V.; Mathur, A. WADI: A water distribution testbed for research in the design of secure cyber physical systems. In Proceedings of the 3rd International Workshop on Cyber-Physical Systems for Smart Water Networks, Pittsburgh, PA, USA, 18–21 April 2017; pp. 25–28. [Google Scholar] [CrossRef] [Scilit]
- Gibadullin, R.F.; Lekomtsev, D.V.; Perukhin, M.Y. Analysis of Industrial Network Parameters Using Neural Network Processing. Sci. Tech. Inf. Process. 2021, 48, 446–451. [Google Scholar] [CrossRef] [Scilit]
- Hormann, R.; Fischer, E. Detecting Anomalies by using Self-Organizing Maps in Industrial Environments. In Proceedings of the 5th International Conference on Information Systems Security and Privacy (ICISSP 2019), Prague, Czech Republic, 23–25 February 2019; pp. 336–344. [Google Scholar] [CrossRef] [Scilit]
- Dias, A.L.; da Silva, J.T.; Turcato, A.C.; Sestito, G.S. An intelligent fault diagnosis for centrifugal pumps based on electric current information available in industrial communication networks. In Proceedings of the 14th IEEE International Conference on Industry Applications (INDUSCON), São Paulo, Brazil, 15–18 August 2021; pp. 102–109. [Google Scholar] [CrossRef] [Scilit]
- Dias, A.L.; Turcato, A.C.; Sestito, G.S.; Brandao, D.; Nicoletti, R. A cloud-based condition monitoring system for fault detection in rotating machines using PROFINET process data. Comput. Ind. 2021, 126, 103394. [Google Scholar] [CrossRef] [Scilit]
- Dias, A.L.; Turcato, A.C.; Sestito, G.S. A soft sensor edge-based approach to fault diagnosis for piping systems. Flow Meas. Instrum. 2024, 97, 102618. [Google Scholar] [CrossRef] [Scilit]
- Dias, A.L.; Buzoli, M.R.; da Silva, V.R.; da Silva, J.C.R.; Turcato, A.C.; Sestito, G.S. Edge-based intelligent fault diagnosis for centrifugal pumps in microbreweries. Flow Meas. Instrum. 2025, 101, 102730. [Google Scholar] [CrossRef] [Scilit]
- Al-Duwairi, B.; Shatnawi, A.; Al-Hammouri, A.; Ababneh, M. Dataset of SCADA traffic captures from a medical waste incinerator with injected cyberattacks. Data Brief 2025, 63, 112294. [Google Scholar] [CrossRef] [Scilit]
- Al-Duwairi, B.; Shatnawi, A.; Al-Hammouri, A.; Ababneh, M. SCADA Traffic Dataset from a Medical Waste Incinerator with Injected Cyber Attacks. Mendeley Data 2025, V4, 1. [Google Scholar] [CrossRef]
- Anjum, N.; Latif, Z.; Chen, H. Security and privacy of industrial big data: Motivation, opportunities, and challenges. J. Netw. Comput. Appl. 2025, 237, 104130. [Google Scholar] [CrossRef] [Scilit]
- Mahadevkar, S.V.; Patil, S.; Kotecha, K.; Soong, L.W.; Choudhury, T. Exploring AI-driven approaches for unstructured document analysis and future horizons. J. Big Data 2024, 11, 92. [Google Scholar] [CrossRef] [Scilit]
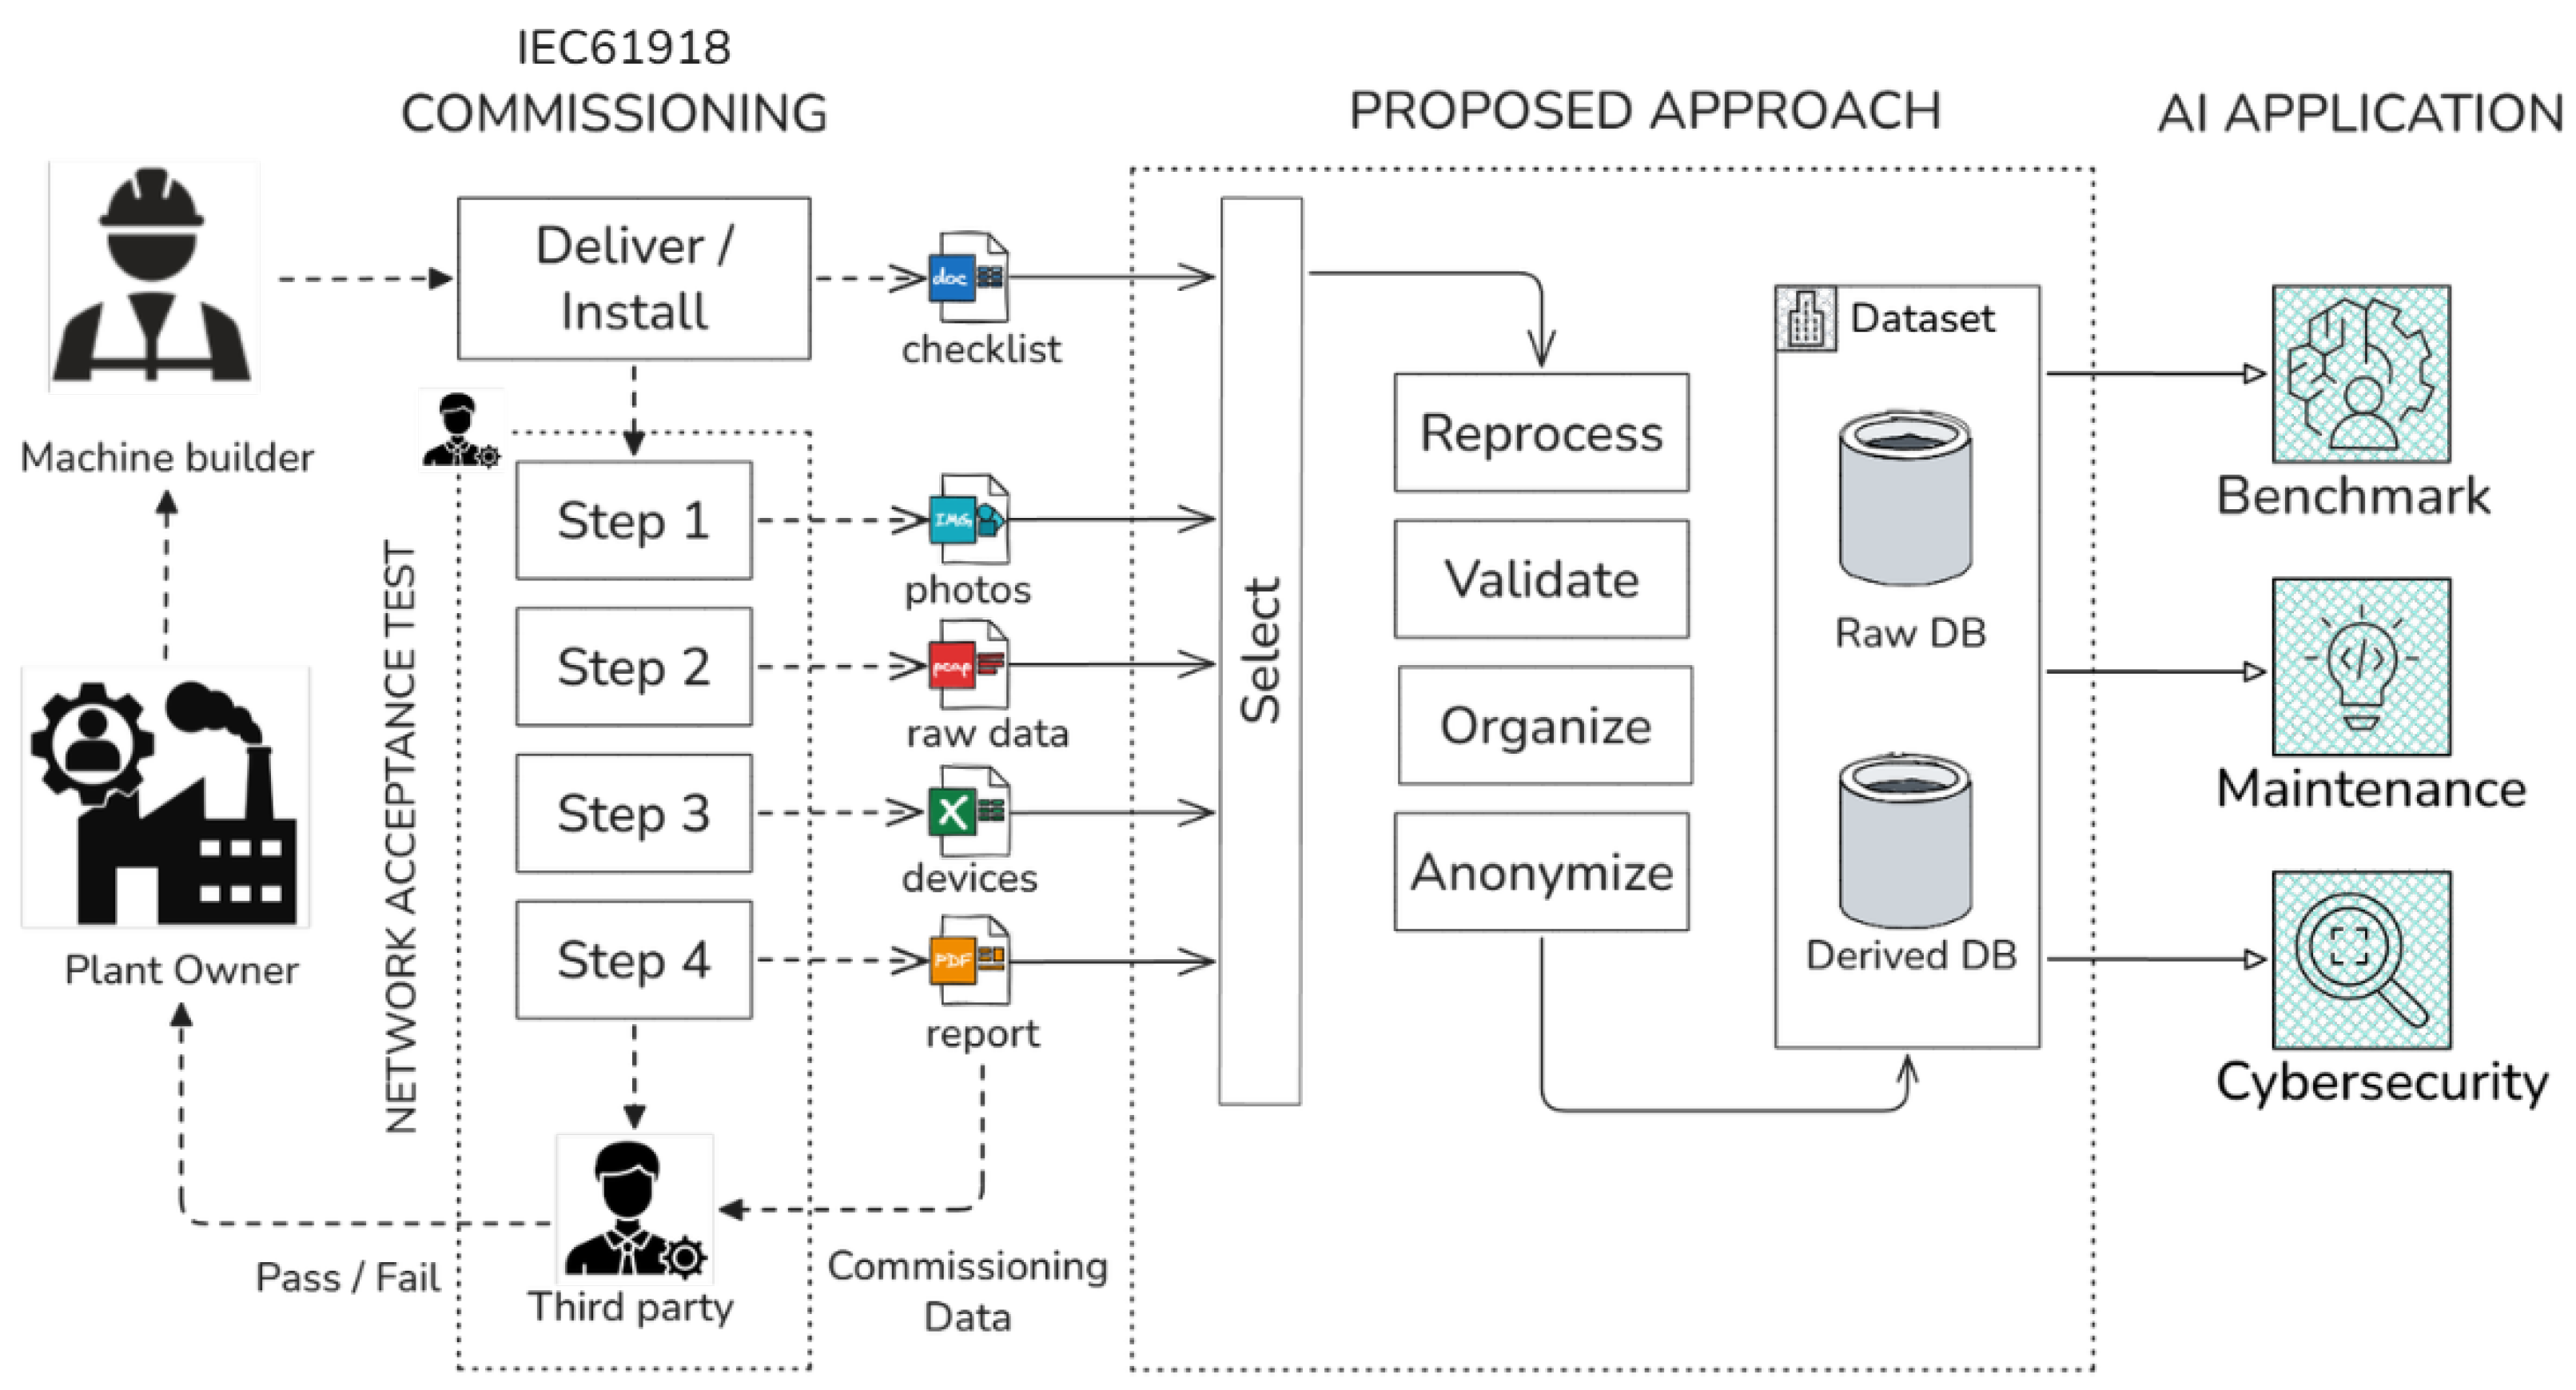
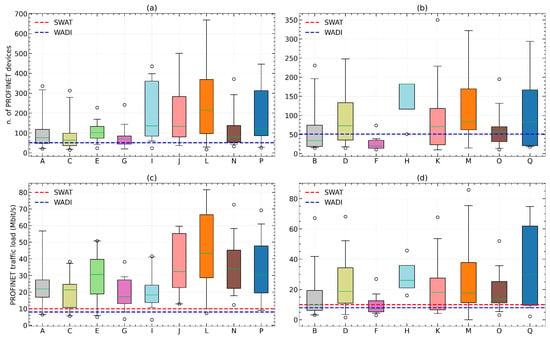
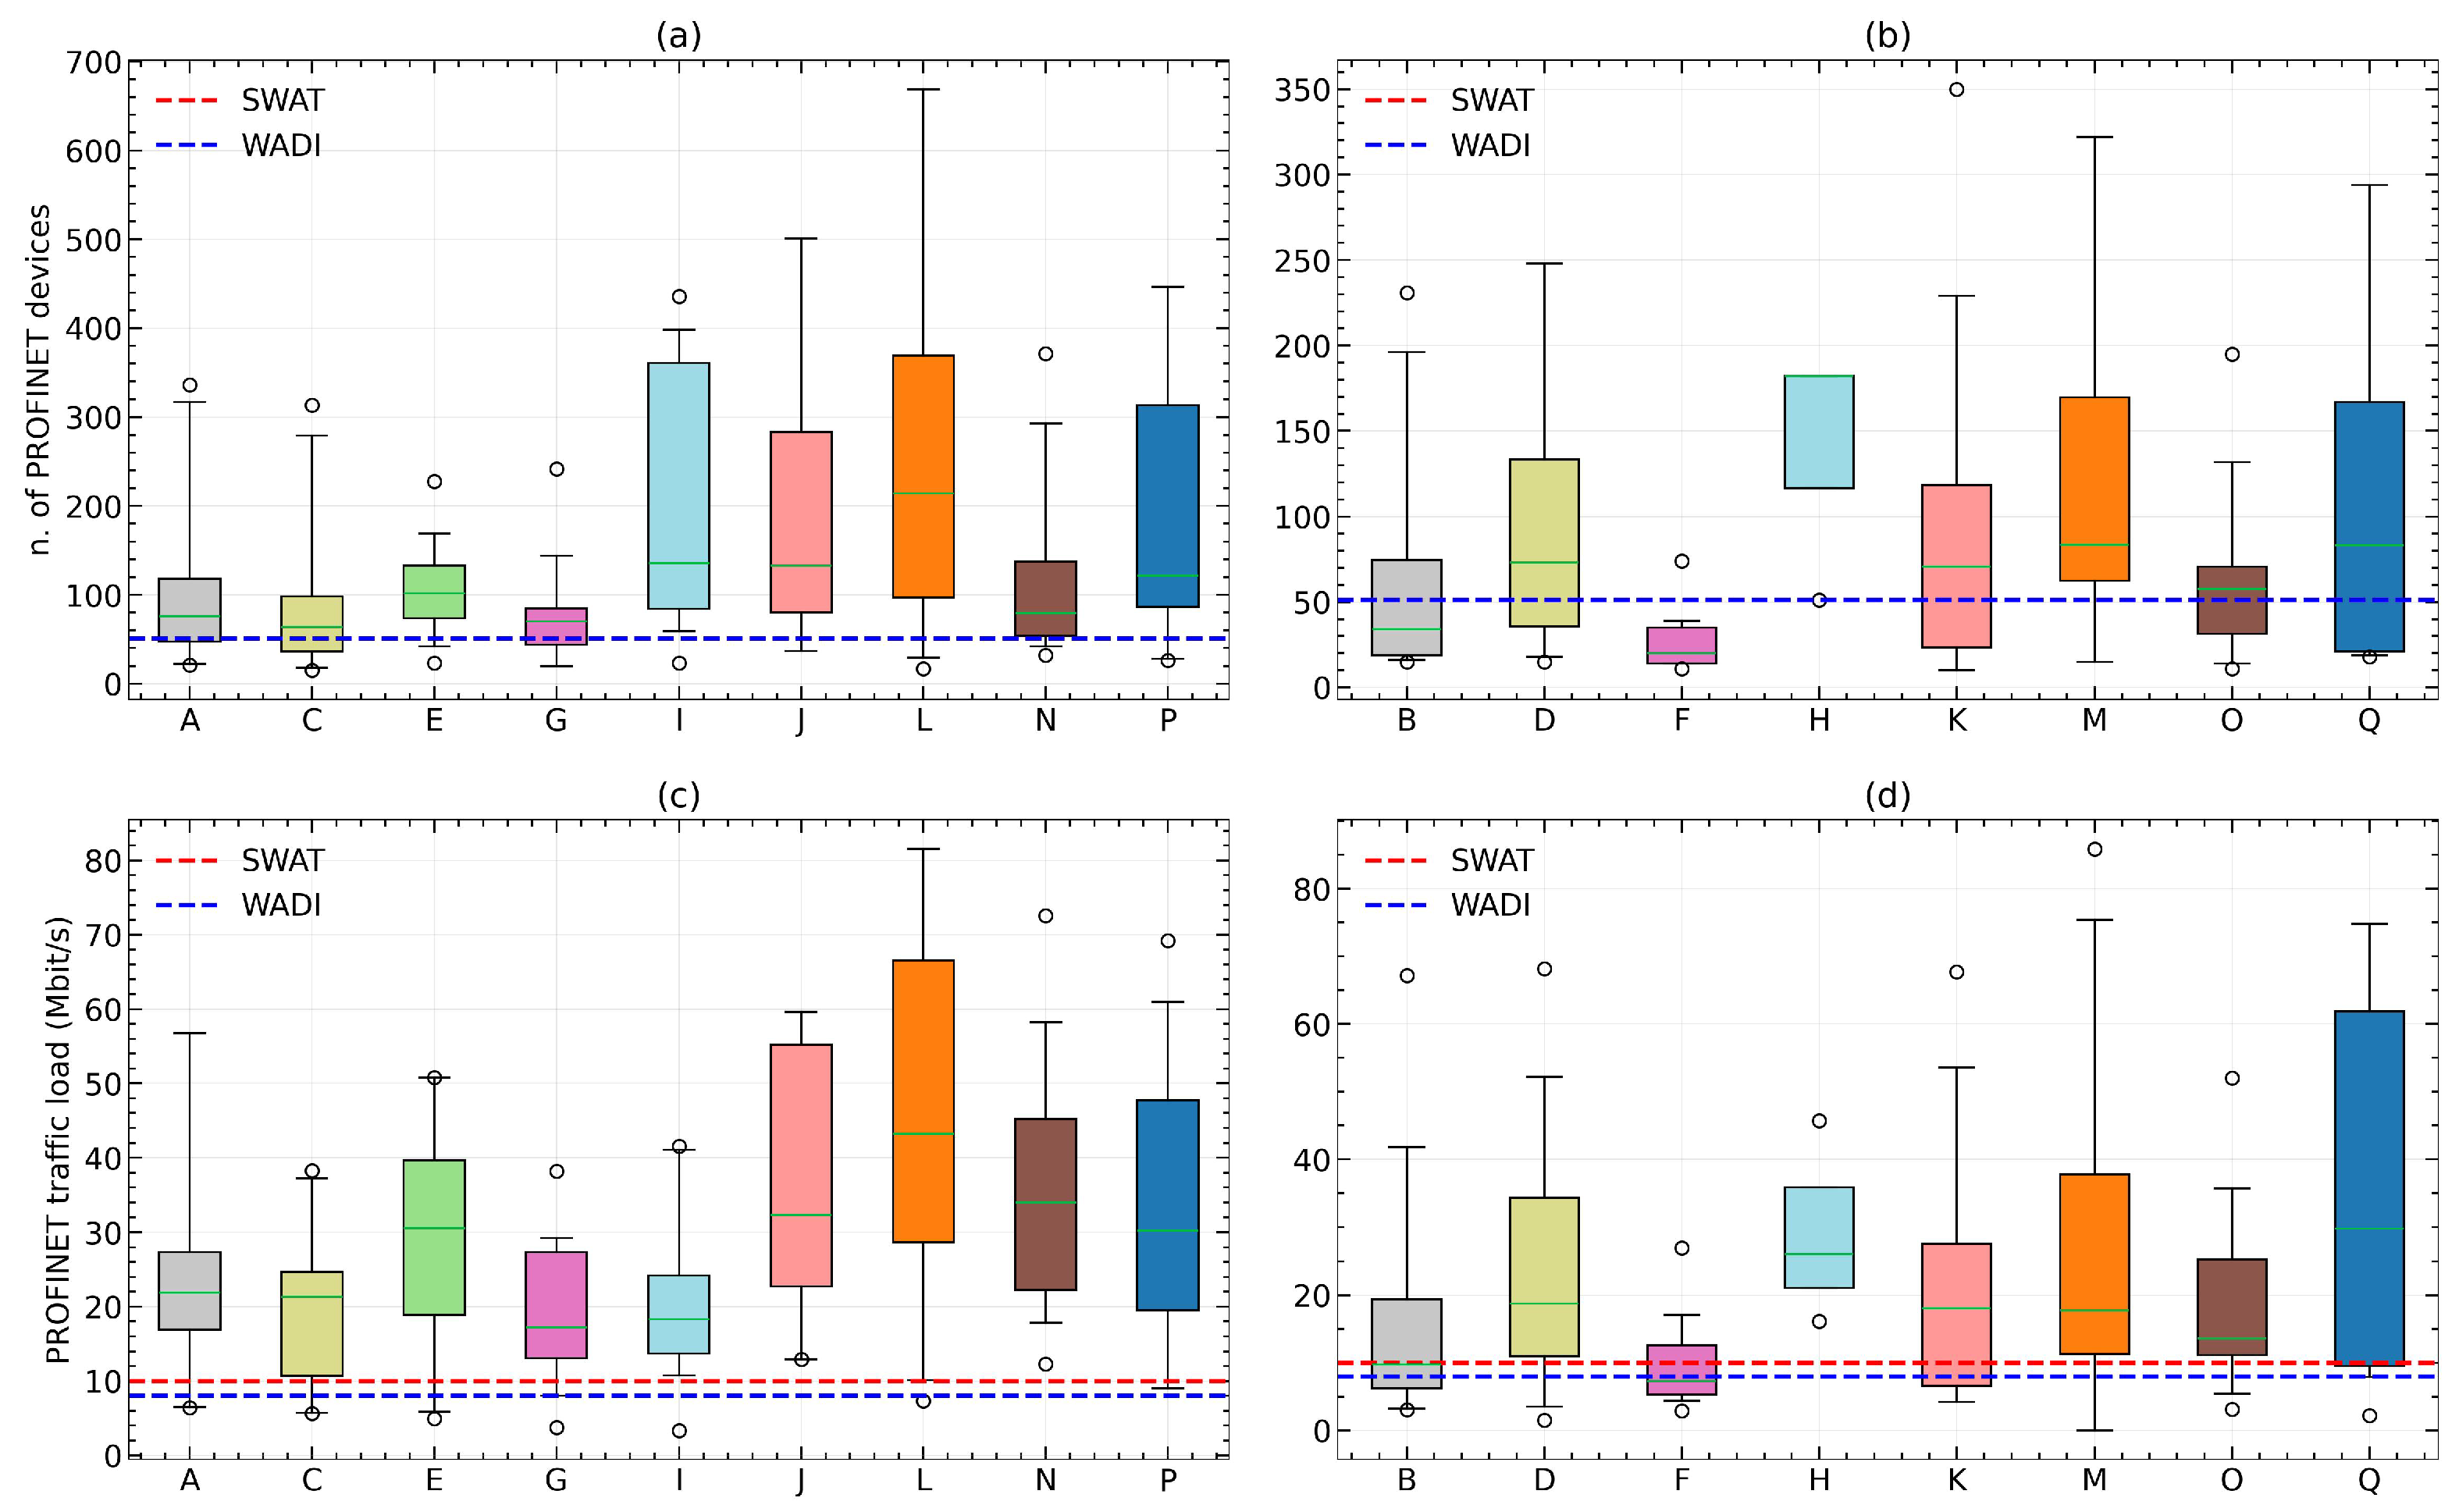
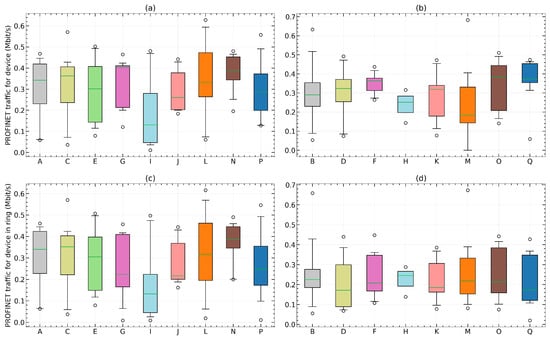
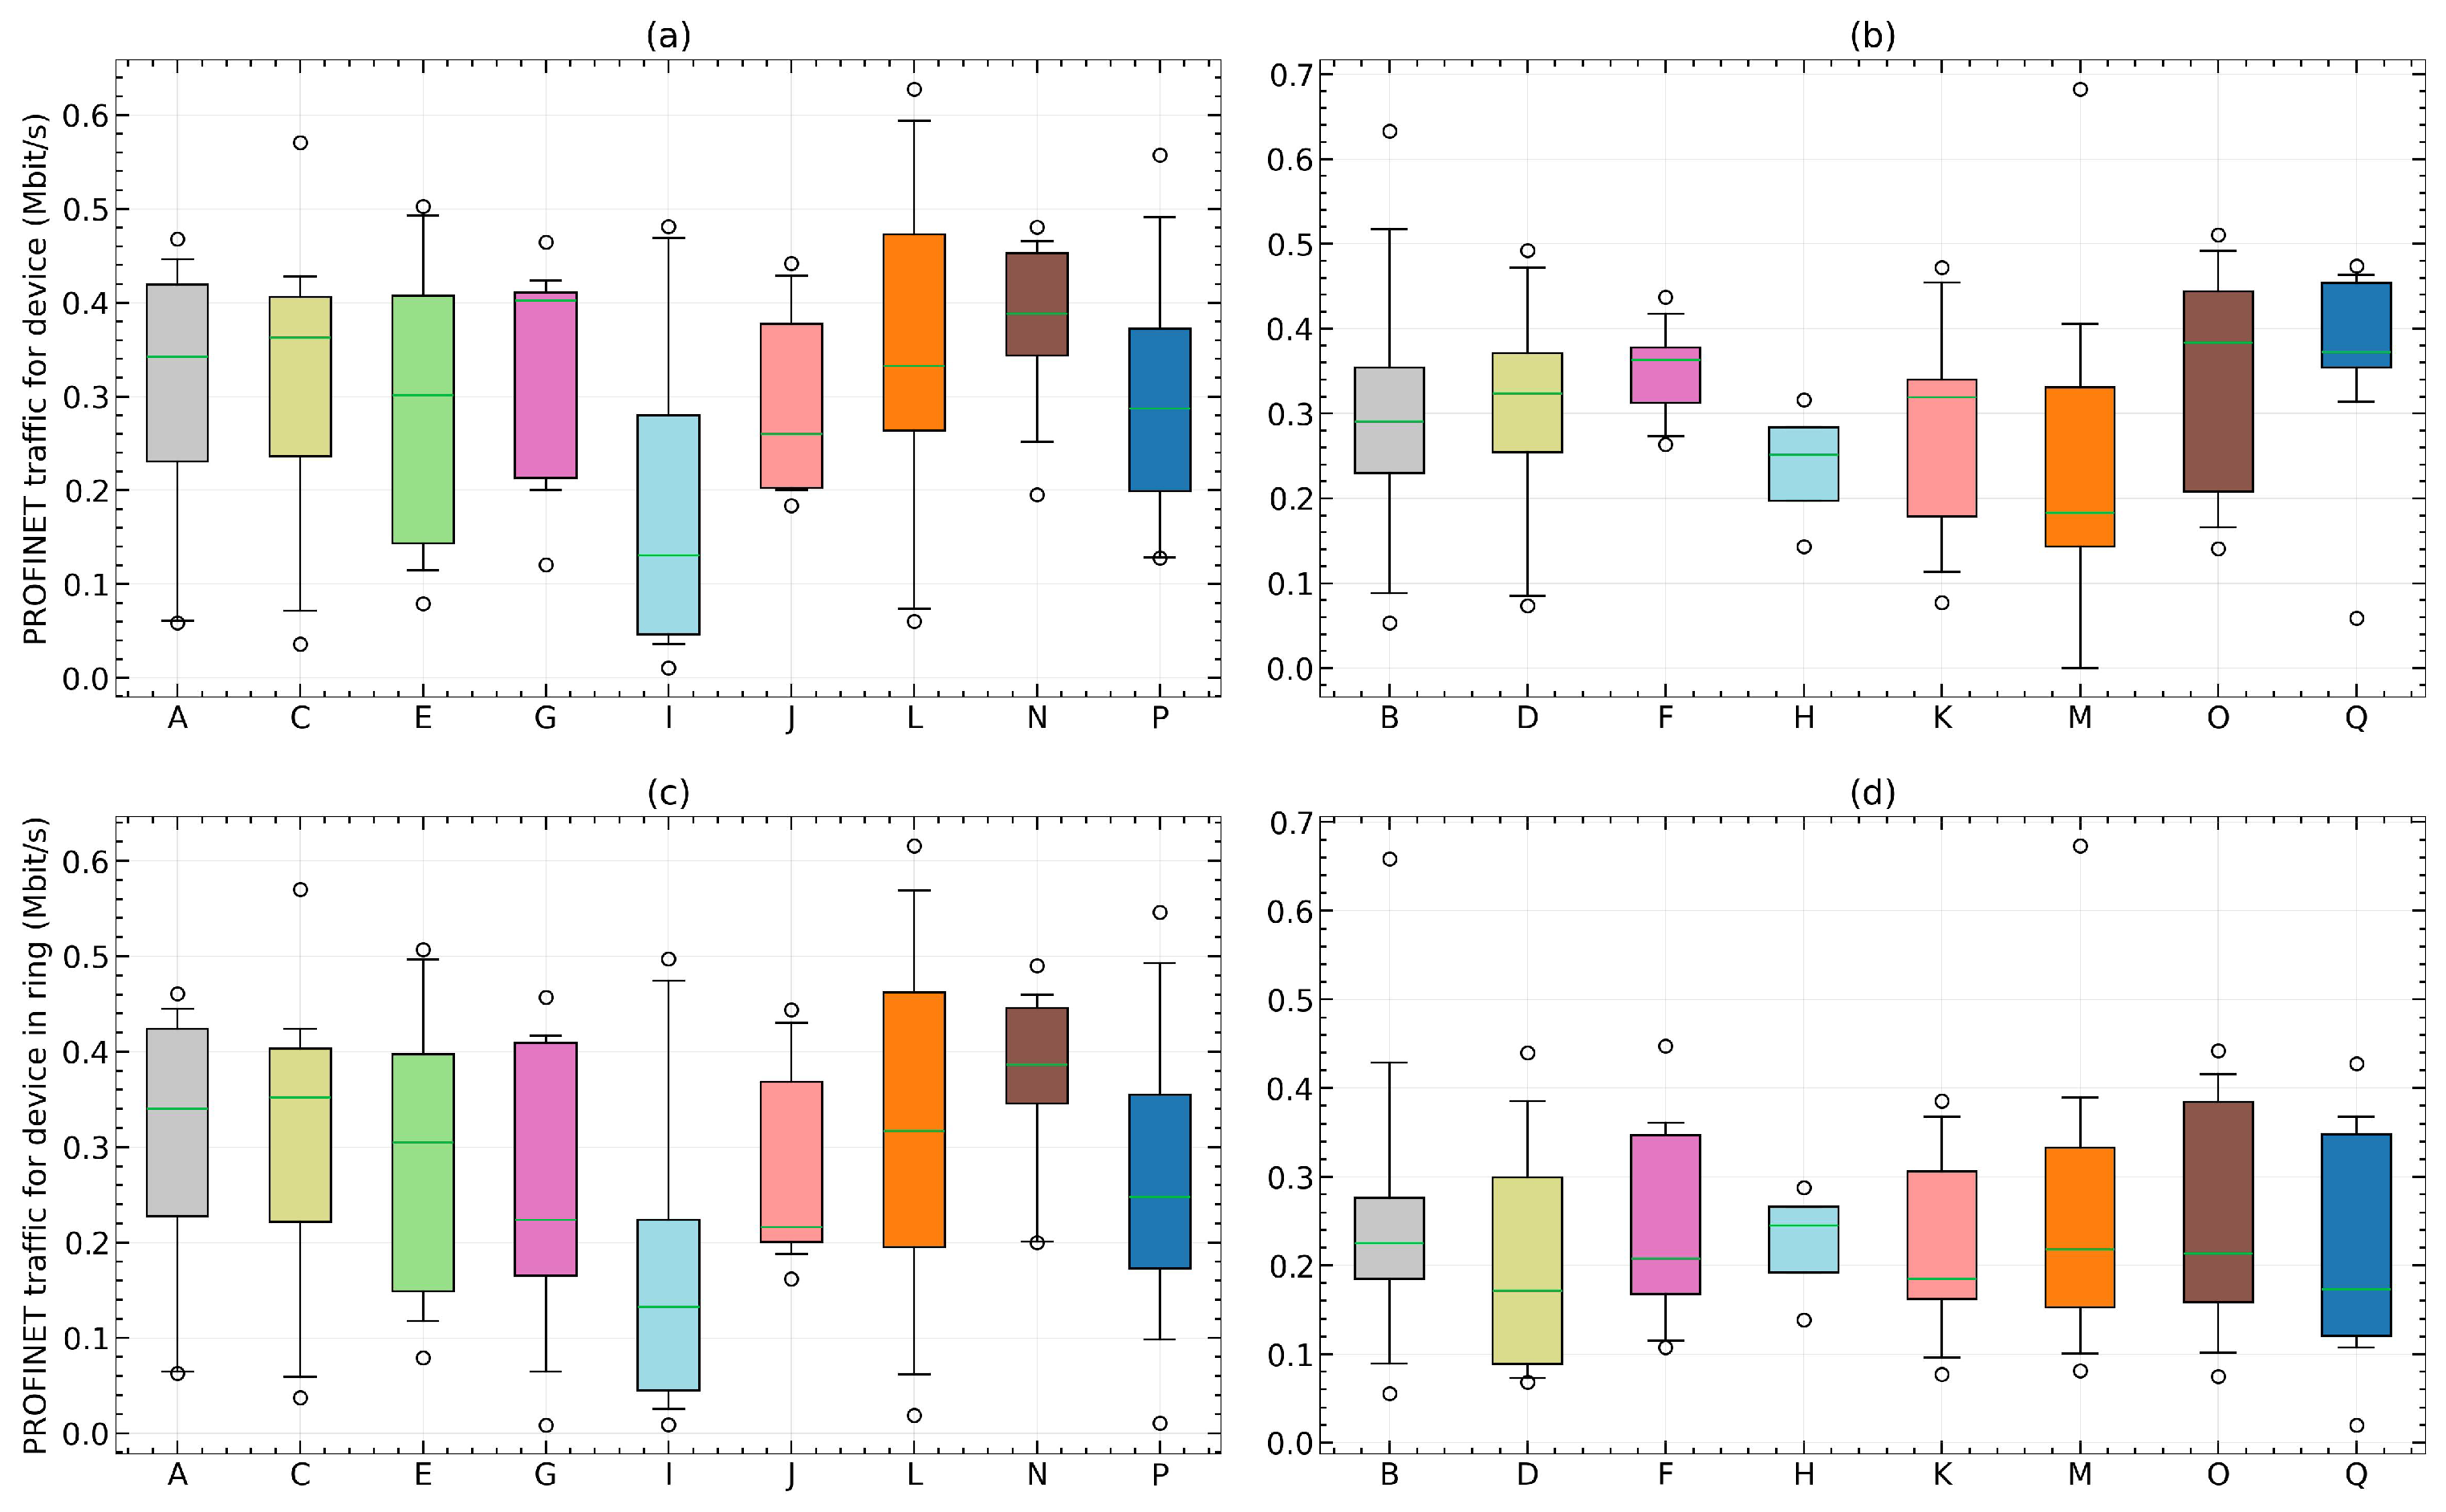
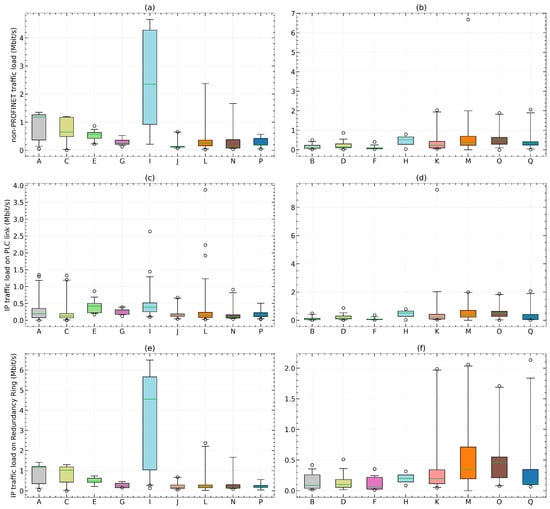
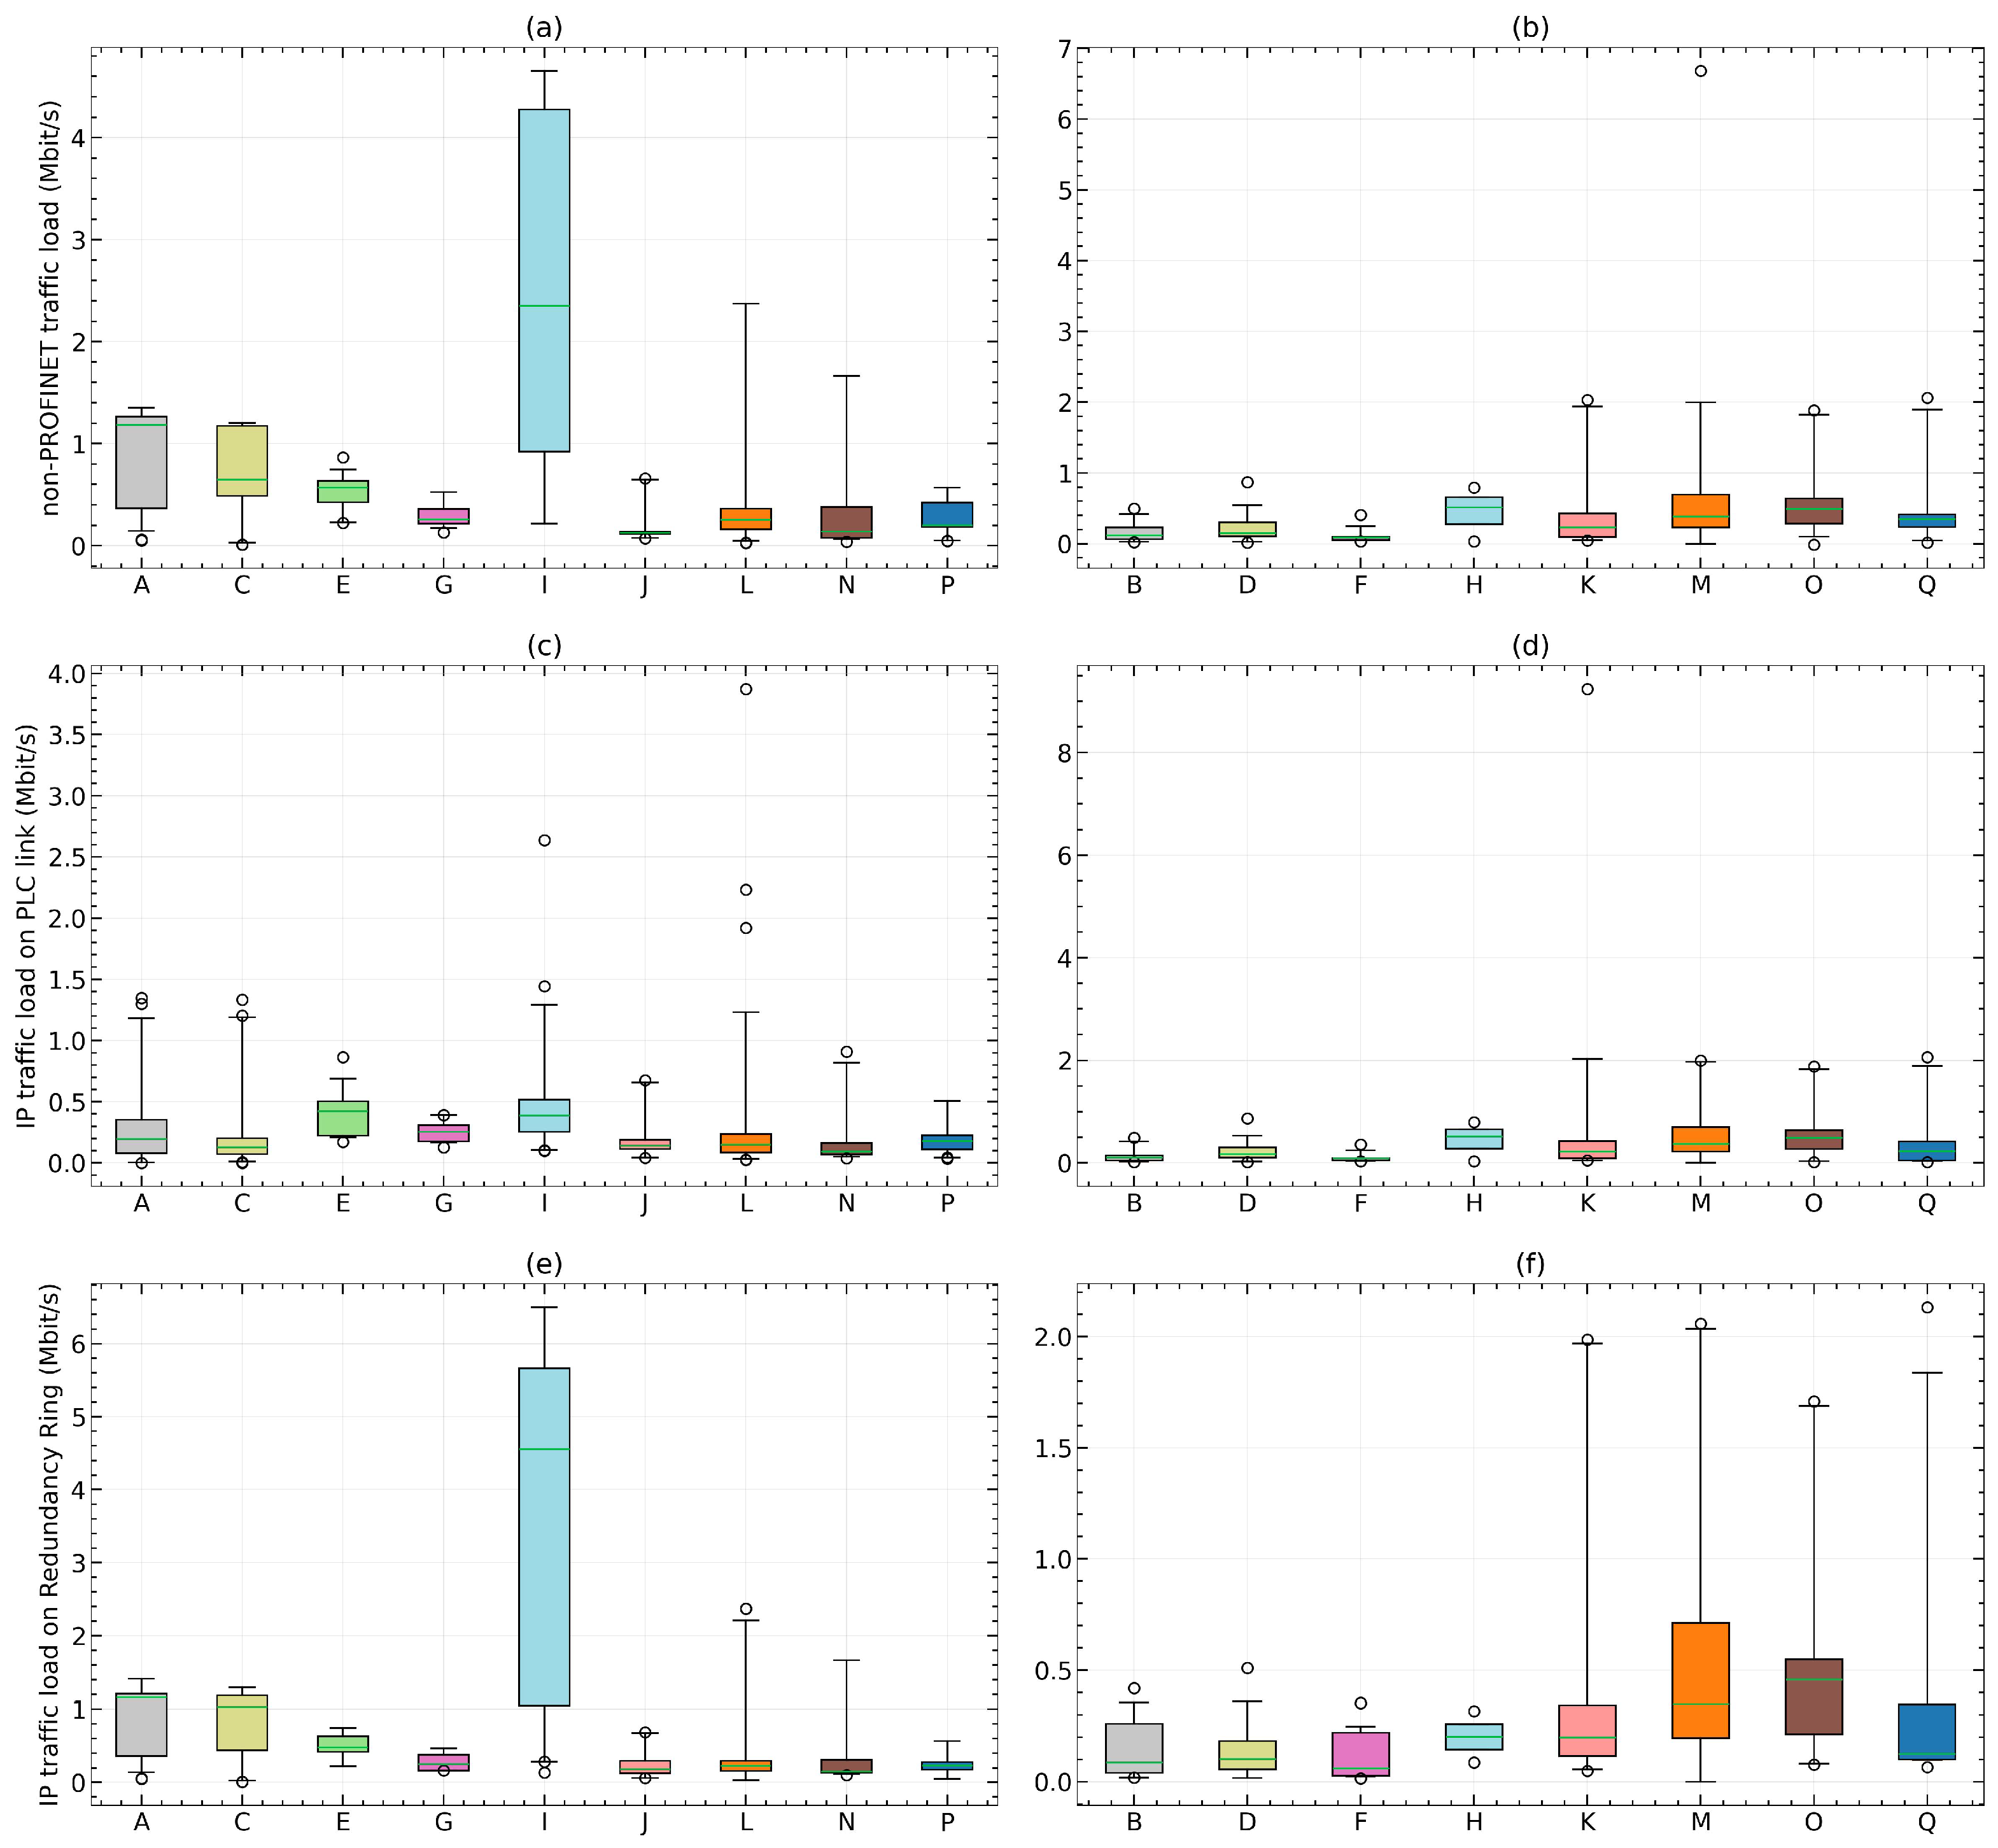

Disclaimer/Publisher’s Note: The statements, opinions and data contained in all publications are solely those of the individual author(s) and contributor(s) and not of MDPI and/or the editor(s). MDPI and/or the editor(s) disclaim responsibility for any injury to people or property resulting from any ideas, methods, instructions or products referred to in the content. |
© 2026 by the authors. Licensee MDPI, Basel, Switzerland. This article is an open access article distributed under the terms and conditions of the Creative Commons Attribution (CC BY) license.