


Abstract
The accuracy of CFD-DEM simulations of particulate systems strongly depends on the proper characterization of particle–particle and particle–wall interaction parameters. In this study, the coefficients of restitution, static friction, and rolling friction for ABS–ABS and ABS–acrylic interactions were experimentally determined for acrylonitrile butadiene styrene (ABS) spheres using free-fall, inclined-plane, and launch-ramp tests, respectively. The obtained parameters were subsequently applied in CFD-DEM simulations of a three-dimensional conical spouted bed operating with different solid loads. In parallel, experimental fluid dynamic tests were conducted to obtain characteristic pressure drop curves and determine the minimum spouting velocity. The experimental results exhibited the typical behavior of spouted beds, including hysteresis between the curves obtained by increasing and decreasing the inlet air velocity and higher minimum spouting velocities at greater solid loads. The CFD-DEM simulations successfully reproduced the main hydrodynamic features of the system, yielding deviations of 0.9%, 6.9%, and 20.5% for the minimum spouting velocities corresponding to solid loads of 400 g, 300 g, and 200 g, respectively. A comparison with the interaction parameters reported in the literature showed that the coefficients obtained through direct measurement provided better agreement between the experimental and simulated results. These findings highlight the importance of accurately characterizing interaction parameters to achieve reliable CFD-DEM simulations of spouted bed systems.
1. Introduction
Spouted beds are widely employed in particulate material processing due to their high heat and mass transfer efficiency, resulting from the intense circulation of solids and the continuous renewal of the gas–solid interface. Consequently, spouted beds have been extensively used in drying operations [1,2,3,4,5], particle coating [6,7], and granulation [8]. Their application has also been extended to thermochemical processes such as pyrolysis [9,10,11], gasification [12,13,14], and combustion [15,16,17].
The complex hydrodynamics of these systems, characterized by intense gas–solid interactions and the coexistence of different flow regimes, has increased the use of computational fluid dynamics (CFD) as an investigation tool. CFD provides detailed information on system behavior at both local and global scales, often inaccessible by conventional experimental techniques [18,19,20].
Gas–solid systems can be modeled using either the Euler–Euler or Euler–Lagrange approaches. In the Euler–Euler framework, both phases are treated as interpenetrating continua and described by mass and momentum conservation equations. In contrast, the Euler–Lagrange approach treats the fluid phase as a continuum and the solid phase as discrete particles, allowing individual particle trajectories, velocities, and interactions to be calculated based on Newton’s second law [6,21,22].
Particle interactions can be described using either hard-sphere or soft-sphere contact models. For dense systems such as spouted beds, the soft-sphere approach provides a more realistic representation of collisions because it accounts for local deformations and contact forces during particle impacts [23,24]. In this context, the discrete element method (DEM) has become one of the most widely used techniques for describing the solid phase in Euler–Lagrange simulations.
The accuracy of CFD-DEM simulations strongly depends on the proper determination of the parameters governing particle–particle and particle–wall mechanical interactions. Among the most important parameters are the coefficients of restitution, static friction, and rolling friction, which describe energy dissipation as well as sliding and rolling mechanisms during particle contacts. Determining these parameters remains a challenge and is commonly performed either through bulk calibration procedures [25,26] or direct measurement techniques [27,28], each presenting specific advantages and limitations [29].
Several experimental methods have been applied for determining these interaction parameters. Batista et al. [30] experimentally determined particle–particle and particle–wall restitution coefficients using free-fall tests. Static friction coefficients were also evaluated using inclined-plane experiments, providing a direct characterization of the contact parameters required for DEM simulations. González-Montellano et al. [31] measured particle–particle restitution coefficients using free-fall tests and particle–wall restitution coefficients using a double-pendulum method, while static friction coefficients were determined through inclined-plane experiments. Ketterhagen et al. [32] measured rolling friction coefficients for different materials using a launch-ramp technique. Brandão et al. [33] found that the particle–wall restitution coefficient was dependent on the thickness and type of material of the flat surface. They used the sled method to measure the static friction coefficient and observed its increase with surface particle roughness. Xiao et al. [34] determined restitution coefficients for ABS spheres using free-fall tests, static friction coefficients using a UMT-3 tribometer, and rolling friction coefficients by a combination of experiments and DEM simulations validated with L-box tests.
The diversity of methodologies and materials reported in the literature often results in considerably different values for the same parameter, limiting the direct application of published data to new systems. Furthermore, several studies have demonstrated that even small variations in interaction parameters can significantly affect the simulation results. Hu et al. [35] reported that these parameters strongly influence fountain height, velocity profiles, and solid-phase kinetic energy in rectangular spouted beds, while Marchelli et al. [36] observed a high sensitivity of particle trajectories to interaction parameters in pseudo-two-dimensional models.
Considering conical spouted beds without internal devices, Batista et al. [30] experimentally determined the physical and interaction properties of sorghum grains and incorporated these parameters into CFD-DEM simulations. The measured properties were essential for ensuring coherence of the CFD-DEM simulations of the spouted bed and for obtaining agreement between the simulated and experimental results. Despite recent advances, studies combining the direct experimental determination of interaction parameters with their application in three-dimensional CFD-DEM simulations of conical spouted beds remain limited. Moreover, comparative analyses between simulations using experimentally determined parameters and those adopted from the literature are still scarce and require further investigation.
The objectives of this work were to perform hydrodynamic experiments in a laboratory-scale spouted bed, determine the restitution, static friction, and rolling friction coefficients for ABS–ABS and ABS–acrylic interactions through direct measurements, apply the obtained parameters in three-dimensional CFD-DEM simulations, and evaluate the predictive capability of the numerical model by comparing simulation results with experimental data.
2. Methodology
2.1. Experimental Setup
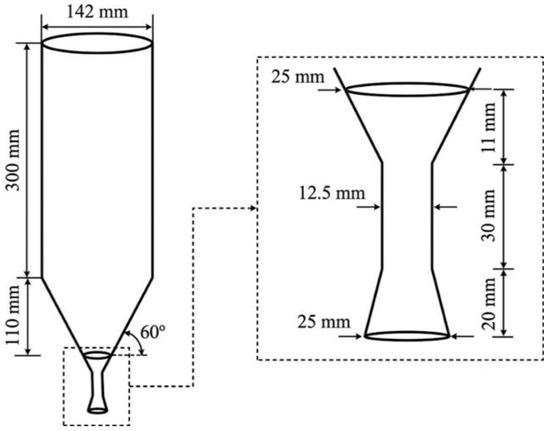
The spouted bed used in this study was constructed from transparent acrylic to allow for the direct visualization of particle motion in the equipment. To improve the inlet flow distribution and promote a more uniform gas flow pattern, a Venturi-type air distributor was inserted prior to the conical base of the equipment [37,38]. The distributor was manufactured by 3D printing using an ABS filament. The dimensions of the spouted bed and air distributor are presented in Figure 1.
Figure 1.
Schematic diagram of the spouted bed.
The experimental unit consisted of a blower for air supply (0.36 HP—Siemens, Munich, Germany), a 1 in nominal diameter PVC pipeline, a main valve and a bypass valve for airflow regulation, a Venturi air distributor, a spouted bed equipped with a particle retention screen at the entrance of the conical base, and a Arduino® Mega 2560 Rev3 microcontroller (Arduino, Turin, Italy) connected to a computer for data acquisition. The monitored variable was sampled at a frequency of 9 Hz. Data acquisition was performed using a custom routine developed in Arduino IDE 1.8.5, which calculated the average of nine consecutive measurements every second and automatically stored the resulting value in a spreadsheet for subsequent analysis.
The air velocity was indirectly determined from the pressure drop across an orifice plate coupled to a pressure sensor (MPX5010DP, Freescale Semiconductor, Austin, TX, USA). The pressure drop in the spouted bed was measured using a pressure sensor installed downstream of the particle retention screen, while thermocouples of type K were employed to monitor the temperature inside the equipment.
2.2. Material Characterization
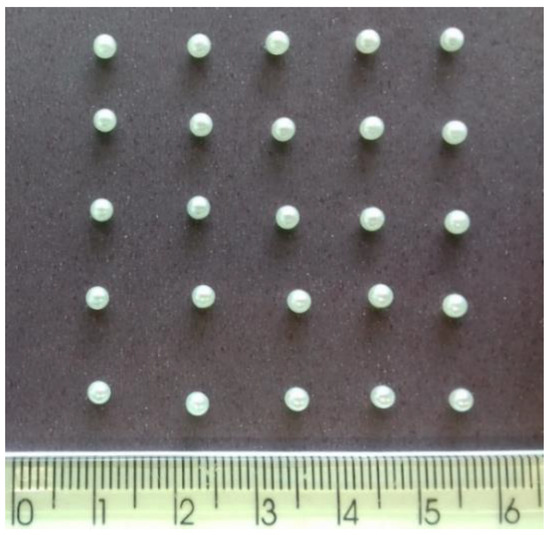
ABS spheres were used as the solid phase due to their well-defined physical properties and geometric uniformity. The particle diameter was determined by image analysis using the Image-Pro Plus 6® software. To ensure statistical representativeness, 75 particles were analyzed and divided into three groups of 25 particles each. The arrangement of the particle groups used in the image analysis is shown in Figure 2.
Figure 2.
Disposition of ABS spheres for image analysis.
The apparent particle density was determined by liquid pycnometry using water as the displacement fluid and a 25 mL pycnometer. All measurements were performed in triplicate. The bulk density was determined using a packing-based method, in which the particles were loaded into a graduated cylinder of known volume [39]. The measurements were also carried out in triplicate. The bed voidage was calculated using Equation (1), where is the bulk density and is the apparent particle density.
2.3. Interaction Parameters
The interaction parameters employed in the CFD-DEM simulations were determined using direct measurement to ensure representative values of the materials used in the experiments. For particle–wall interactions, an acrylic plate measuring 430 × 200 × 26 mm, manufactured from the same material as the spouted bed, was used. For particle–particle interactions, the measurements were performed using a 200 × 15 × 30 mm ABS plate produced by 3D printing.
The coefficients of restitution and rolling friction were determined according to the free-fall methodology proposed by Batista et al. [30]. For the measurement of the rolling friction coefficient, a ramp was constructed following ASTM G194-08 [40].
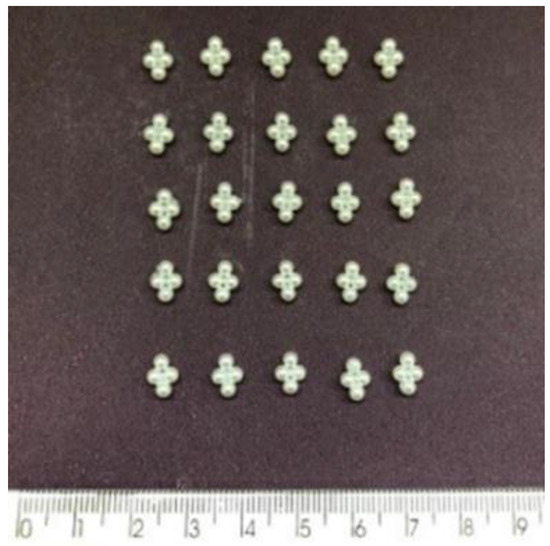
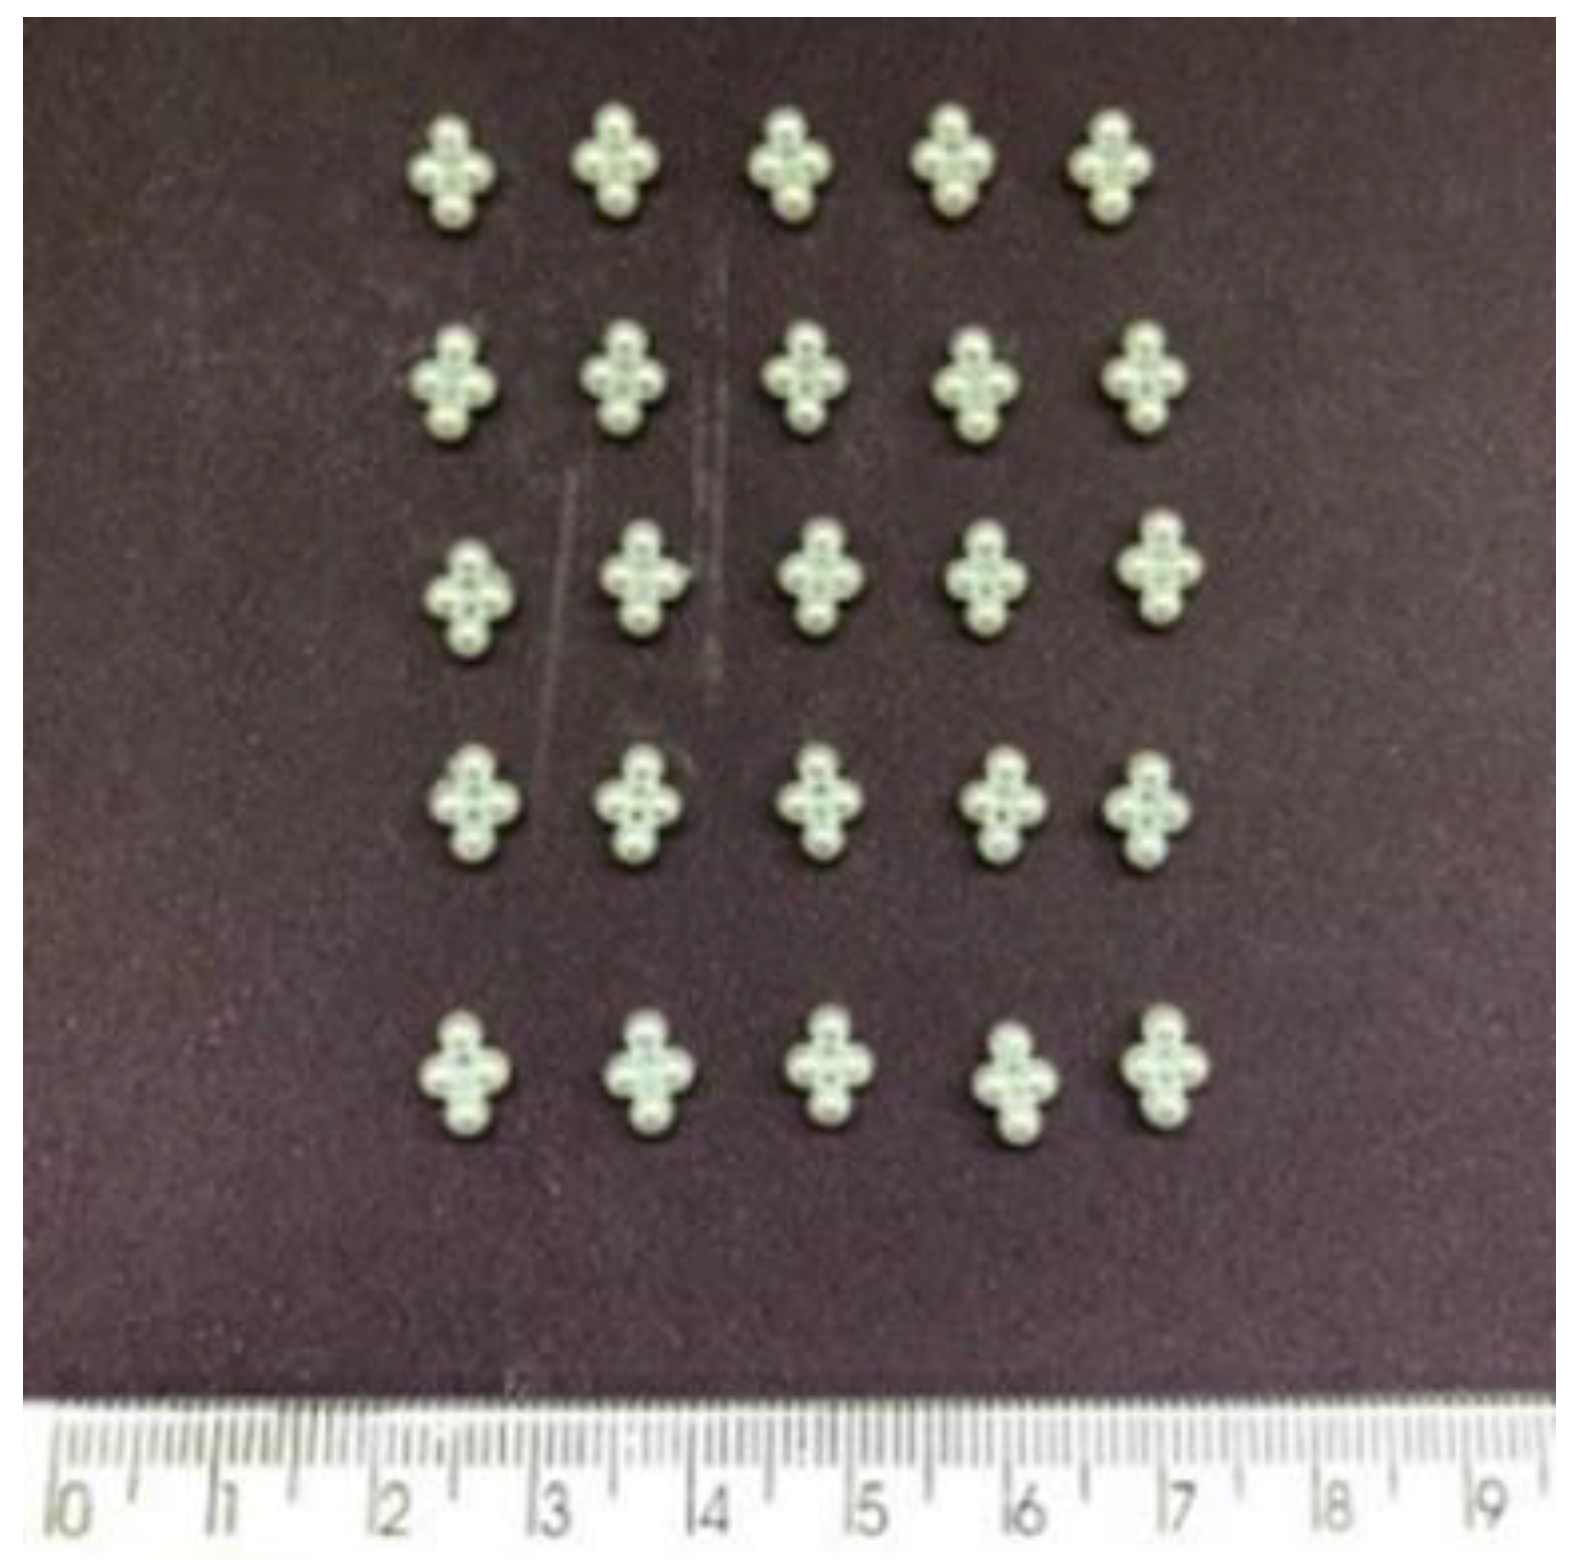
To determine the static friction coefficient, test bodies consisting of four glued spheres were employed to promote sliding rather than rolling motion. This procedure was adopted because individual spheres tend to roll on an inclined surface instead of sliding, which may compromise the accuracy of the measurements [27]. Figure 3 illustrates the particle assemblies used in the experiments.
Figure 3.
Grouping of the ABS spheres for static friction coefficient measurements.
Each reported mean value was calculated from 50 independent measurements, and the corresponding standard deviation was determined from the same dataset.
2.4. Experimental Characteristic Curves
Experimental spouted bed characteristic curves were obtained for three solid loads of ABS spheres: 400, 300, and 200 g, corresponding to static bed heights of 8.5, 7.5, and 6.0 cm, respectively. The solid loads were selected based on the dimensions of the equipment to preserve the characteristic conical spouted-bed configuration. All experiments were performed in triplicate to ensure the reproducibility of the results. The experimental minimum spouting velocities were identified based on visual assessment of the bed behavior.
3. Mathematical Modeling
3.1. Fluid Phase
The continuity and momentum conservation equations for the fluid phase (f) are given by Equations (2) and (3), respectively.
where is the volume fraction of the fluid phase, is the fluid density, is the fluid velocity vector, is the pressure gradient, is the gravitational acceleration vector, and is the viscous stress tensor.
The fluid volume fraction () is defined as the fraction of fluid occupying a computational cell with volume . It is also referred to as the void fraction or porosity and can be calculated using Equation (4):
where is the number of particles contained within a computational cell of volume (), and [0, 1] represents the volumetric fraction of particle i occupying that cell.
The interphase interaction force per unit volume () acting on the particles due to the motion of the fluid phase within each computational cell is given by Equation (5), where represents the fluid–particle interaction force acting on particle i.
The dispersed k–ε turbulence model was adopted to describe the turbulent behavior of the fluid phase. This model is recommended for systems with low concentrations of the secondary phase, such as the spout region, where higher turbulence intensities are typically observed. The Reynolds stress tensor, incorporated into the fluid-phase momentum conservation equations, is given by Equation (6):
where is the turbulent viscosity of the fluid phase, expressed as:
where is an empirical turbulence-model constant with a value of 0.09.
The transport equations for the turbulent kinetic energy and its dissipation rate are given by Equations (8) and (9), respectively:
where and account for the modulation of fluid-phase turbulence by the dispersed phase, affecting the turbulent kinetic energy and its dissipation rate, respectively, while represents the production rate of turbulent kinetic energy due to velocity gradients in the fluid phase.
3.2. Solid Phase
Since the solid phase is treated as a discrete medium, its motion is described by Newton’s equations of motion applied to each particle i of mass and its interactions with other particles or rigid walls j via contact forces. The translational motion is governed by Equation (10), whereas the rotational motion is described by Equation (11).
The term represents the sum of the contact forces acting between particle i and its neighboring particles or wall, is the fluid–particle interaction force, and is the gravitational force acting on particle i. Furthermore, is the particle moment of inertia, is its angular velocity, is the torque generated by tangential contact forces, and is the rolling resistance torque.
The gravitational force acting on particle i is calculated as:
The fluid–particle interaction force, , was assumed to be equal to the steady-state drag force, :
The drag force is given by:
where is the interphase momentum exchange coefficient, calculated according to the Gidaspow et al. [41] drag model:
where is the particle diameter and is the drag coefficient, calculated from Equation (17) as a function of the particle Reynolds number:
where
is the particle Reynolds number.
Several contact models have been proposed in the literature to describe particle collisions in DEM simulations. Among them, the linear spring–dashpot model has been widely adopted due to its balance between computational efficiency and predictive accuracy. Di Renzo and Di Maio [42] demonstrated that this model provides reliable estimates of contact forces in granular flow simulations while maintaining a relatively low computational cost.
The contact force acting on particle 1 (), corresponding to the particle–particle interaction force between particles 1 and 2 (, can be decomposed into normal and tangential components:
The normal contact force, , is calculated as:
where K is the spring stiffness coefficient, is the overlap (deformation) between particles, is the damping coefficient, is the relative velocity between particles 1 and 2, and is the unit vector connecting the particle centers. According to Newton’s third law, the force acting on particle 2 is equal in magnitude and opposite in direction to that acting on particle 1:
For a linear elastic collision, the unit vector (), defined from the center of particle 1 to the center of particle 2, is given by Equation (22), while the particle overlap is calculated from Equation (23):
where and are the position vectors of particles 1 and 2, respectively, and and are their radii.
The damping coefficient and relative velocity are calculated as:
where is the reduced mass, is the coefficient of restitution, and is the collision time. The reduced mass and collision time are obtained from Equations (26) and (27), respectively:
The tangential contact force is calculated according to Coulomb’s friction law:
where is the coefficient of static friction, is the coefficient of rolling friction, and is the normal contact force.
4. Numerical Simulation
4.1. Computational Domain
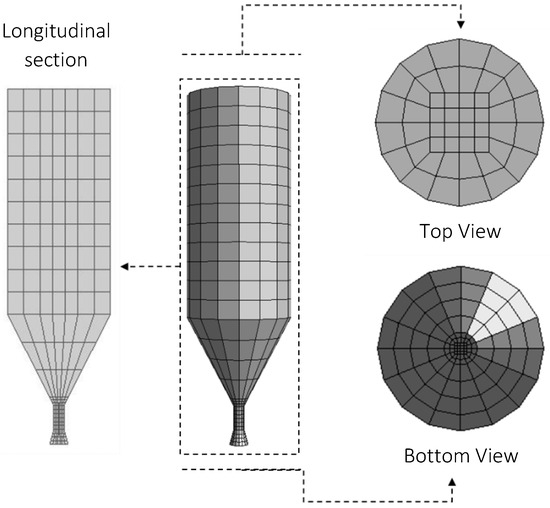
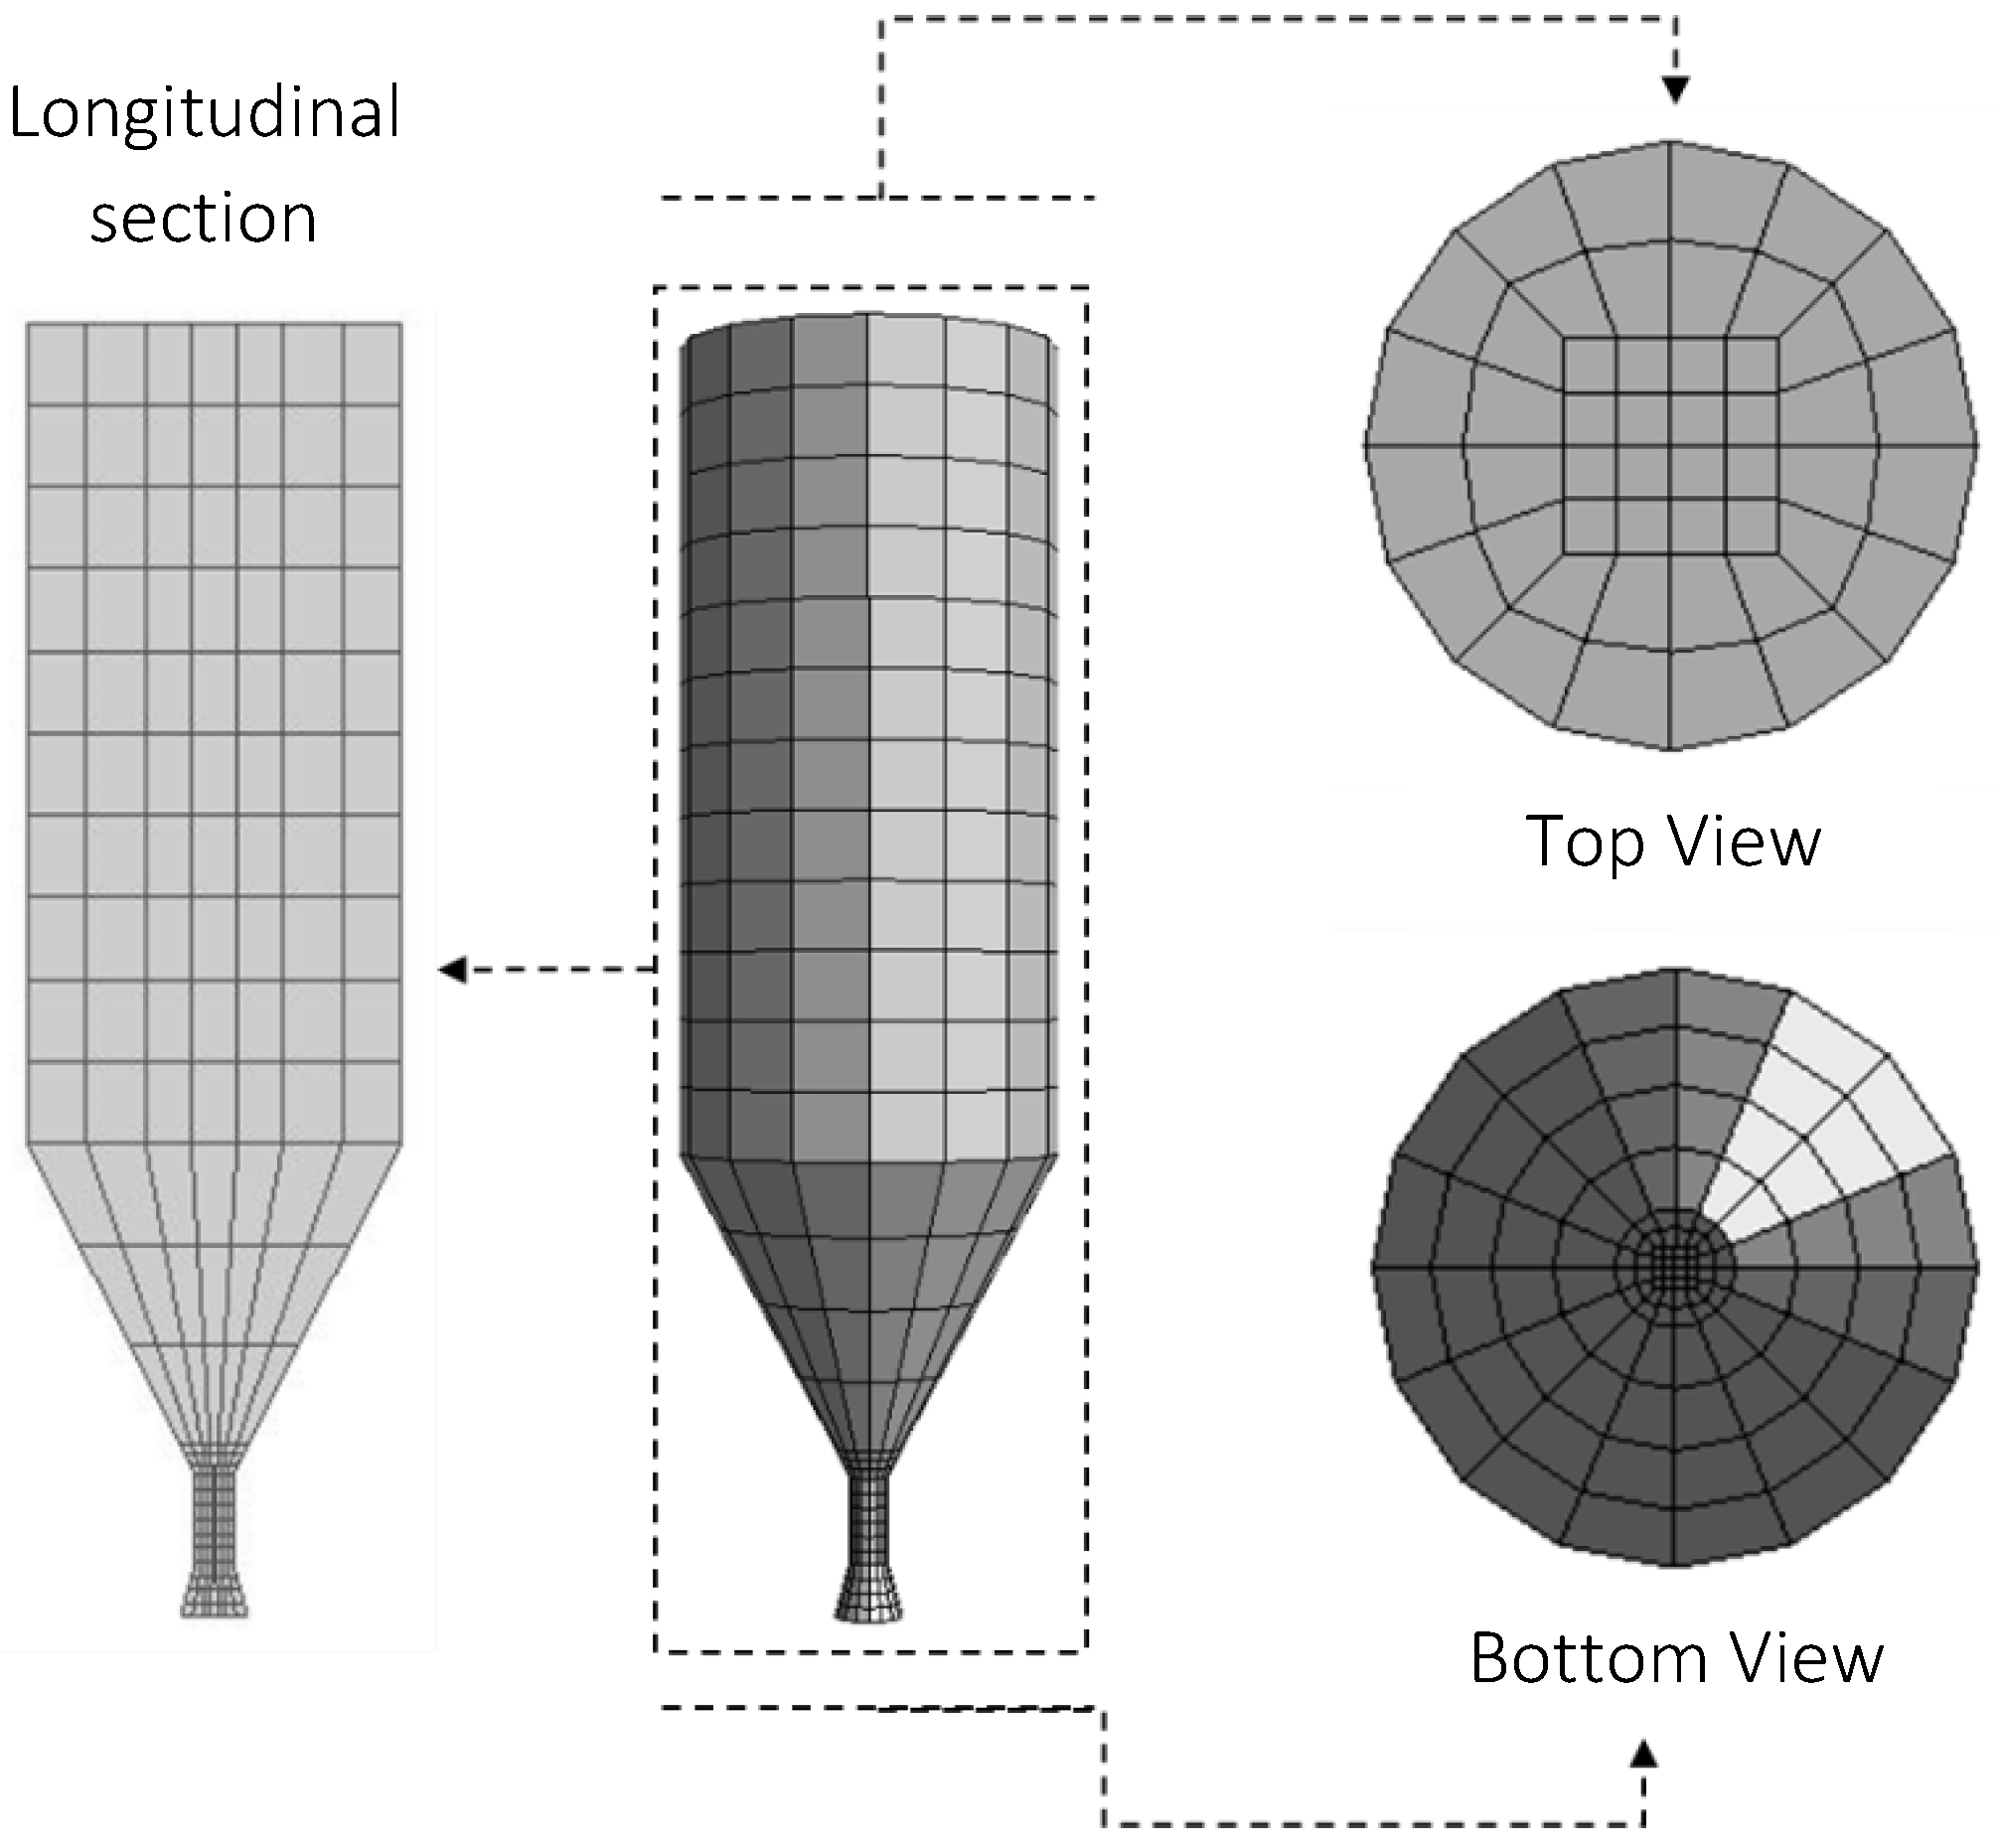
The computational domain consisted of the spouted bed and the Venturi-type air distributor, reproducing the three-dimensional geometry of the experimental unit (Figure 1). The mesh generation strategy was based on Kieckhefen et al. [43], who employed different levels of mesh refinement according to the hydrodynamic characteristics of each region of the spouted bed. In the present study, the mesh was divided into two regions using a block-structured hexahedral mesh. The first region, referred to as the central region, corresponds to the core of the bed where the spout channel develops. The second region, located between the central core and the equipment wall, corresponds to the annular region.
The mesh cell size was defined as a function of the particle diameter (dp). Three meshes with different refinement levels were generated and evaluated using Grid Convergence Index (GCI) analysis to determine the appropriate mesh refinement. The GCI procedure was performed according to the methodology proposed by Elsayed and Lacor [44].
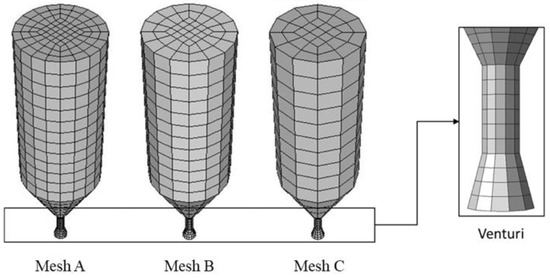
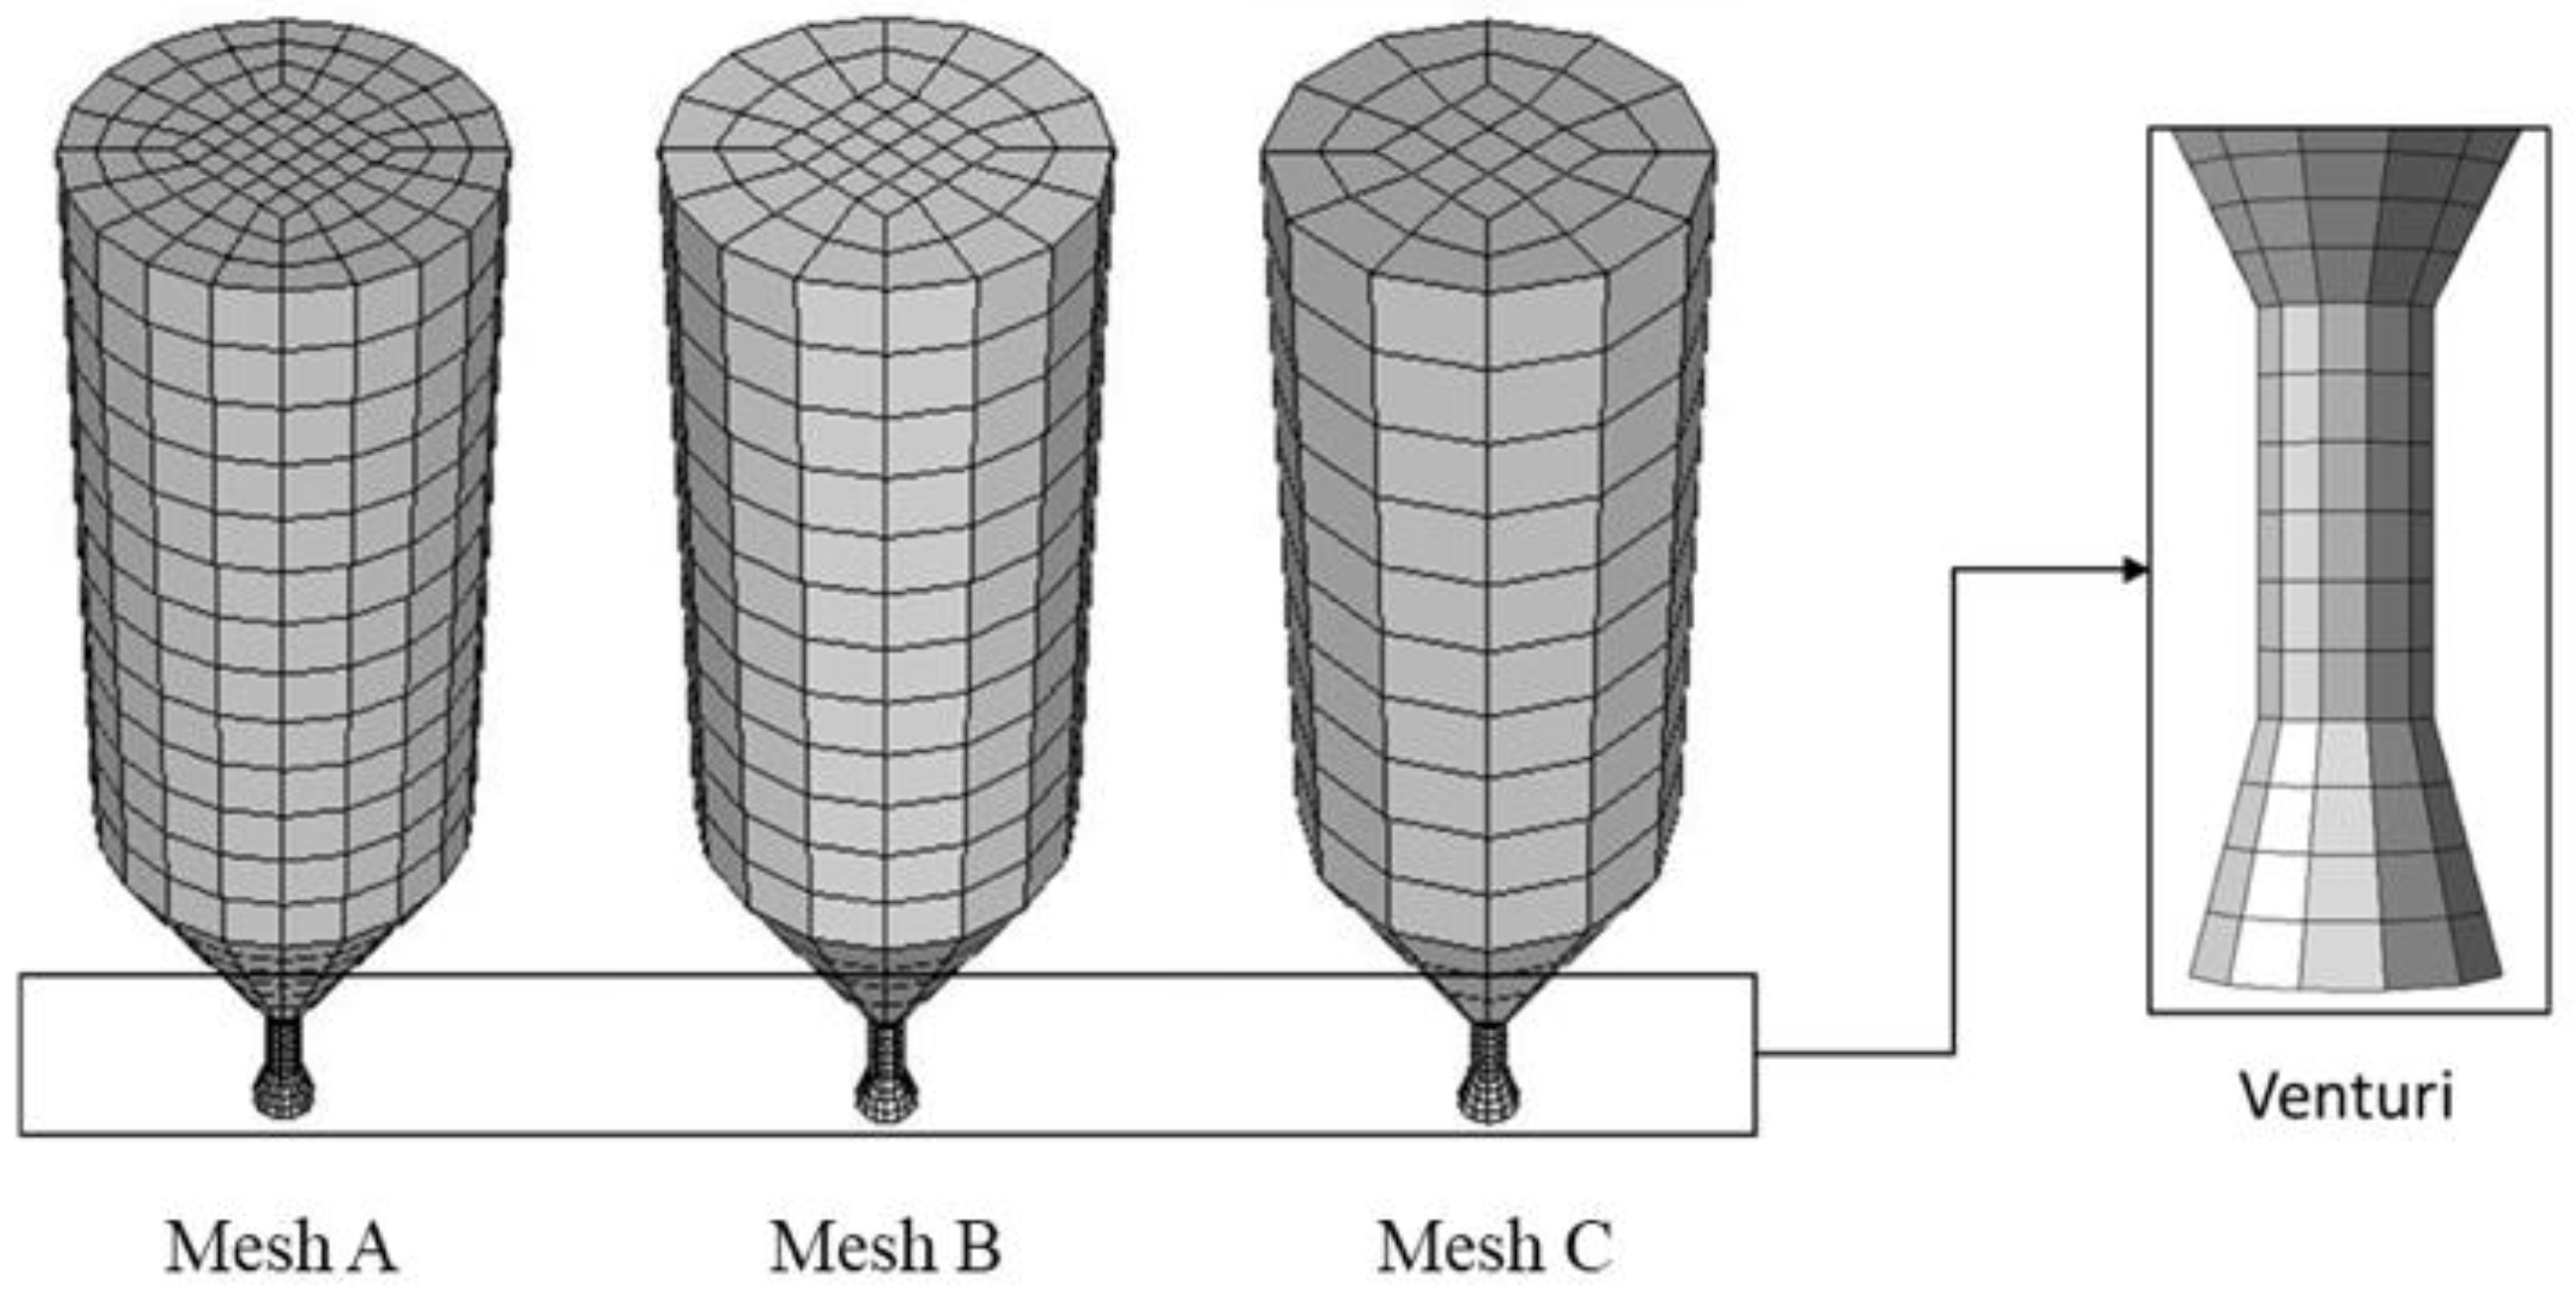
The response variable adopted for the mesh independence analysis was the pressure at the inlet section of the spouted bed. Simulations were carried out under transient conditions for a simulated time of 5 s, using an inlet air velocity of 18 m/s. To isolate the influence of the mesh, the simulations were performed under laminar flow conditions and without the presence of the solid phase. The characteristics of the tested meshes are summarized in Table 1, while their corresponding structures are shown in Figure 4.
Table 1.
Mesh configurations evaluated in the CFD-DEM simulations.
Figure 4.
Computational meshes evaluated in the CFD-DEM simulations.
The three-dimensional computational domain was created using the Design Modeler software, and the computational meshes were generated with the Meshing software, both available in the ANSYS 19.1 package.
4.2. Numerical Procedure
Based on the volume of an individual particle and the material density, the total number of particles corresponding to each solid load was calculated. The solid loads of 400, 300, and 200 g were represented in the computational domain by 29,399, 20,743 and 13,857 particles, respectively. Table 2 summarizes the governing models, constitutive equations, boundary conditions [30], and numerical parameters employed in the CFD-DEM simulations.
Table 2.
Numerical models and simulation parameters adopted in the CFD-DEM simulations.
In order to maintain simulation stability and convergence when using DEM, it is recommended that the time step for the solid phase be lower than the Rayleigh critical time step ∆tr [27]:
In this study, the solid phase time step was about 10% of the estimated Rayleigh critical time step. Furthermore, considering that the integration time step for the fluid phase cannot exceed 100 times the integration time step of the solid phase [23], the fluid-phase time step was set to five times the solid-phase time step.
4.3. Simulated Characteristic Curves
Transient simulations were performed to obtain the spouted bed characteristic hydrodynamic curves and validate the CFD-DEM model. Each simulation was conducted for a total simulated time of 9 s, and the reported results correspond to the average values of the monitored variables during the last 2 s of simulation, ensuring that pseudo-stationary conditions had been reached.
Each point of the simulated characteristic hydrodynamic curve was obtained from an independent simulation performed at a prescribed inlet air velocity. The inlet velocity was varied from the maximum to the minimum air velocity employed in the experimental hydrodynamic curve and imposed at the entrance of the Venturi distributor. For each operating condition, the average pressure drop was obtained by monitoring the inlet section of the spouted bed.
The resulting pressure drop curve was subsequently used to determine the minimum spouting velocity, which served as the primary criterion for model validation through comparison with the experimental results.
5. Results and Discussion
5.1. Material Characterization and Interaction Parameters
The physical properties of the ABS spheres used in the experiments are presented in Table 3. The low standard deviations obtained for particle density, bulk density, and bed voidage indicate a high degree of material uniformity and good reproducibility of the experimental procedures. Such homogeneity is particularly important for CFD-DEM simulations, as it minimizes the influence of particle-to-particle variations on the hydrodynamic behavior of the system.
Table 3.
Physical properties of the ABS spheres.
The interaction parameters experimentally determined for particle–particle (pp) and particle–wall (pw) contacts are presented in Table 4. Each reported mean value was calculated from 50 independent measurements, which exhibited approximately normal distributions.
Table 4.
Experimentally determined interaction parameters.
A larger dispersion was observed for the static friction coefficients, which can be attributed to the sensitivity of the inclined-plane method to small variations in the inclination procedure. Similarly, the particle–wall restitution coefficient exhibited a higher standard deviation than the particle–particle restitution coefficient, possibly due to slight variations in rebound trajectories during the free-fall tests.
Table 4 also compares the interaction parameters obtained in the present work with those reported by Xiao et al. [34]. Although both studies employed ABS particles and acrylic surfaces, significant differences could be observed, particularly for the static and rolling friction coefficients. Xiao et al. [34] used ABS spheres with a diameter of 4.0 mm and a density of 1100 kg m−3, whereas the particles employed in the present work had a diameter of 2.93 mm and a density of 1053 kg m−3. Differences in particle size, surface roughness, manufacturing process, and material properties may contribute to the differences observed between the measurements.
The results demonstrate that interaction parameters reported in the literature are not necessarily transferable to different systems, even when similar materials are employed. This finding reinforces the importance of determining material-specific interaction parameters prior to performing CFD-DEM simulations.
5.2. Mesh Independence Analysis
The results of the mesh independence study, including the pressure-drop predictions, computational times, Grid Convergence Index (GCI), asymptotic convergence ratio (A), extrapolated solution (fexact), and deviations relative to the extrapolated solution, are summarized in Table 5. The fexact represents the simulation response as the mesh spacing approaches zero. The relative deviation is therefore evaluated with respect to this reference value. The reported pressure values correspond to the average pressure drop calculated at the inlet section of the spouted bed during the final 2 s of each simulation.
Table 5.
Results obtained from the mesh independence analysis.
According to the GCI methodology, Mesh A should be selected because it exhibited both the lowest deviation from the extrapolated solution and the lowest numerical uncertainty. However, convergence difficulties were observed during subsequent CFD-DEM simulations performed with this mesh. Due to convergence difficulties commonly encountered in CFD-DEM simulations, Sturm et al. [45] recommended the use of computational cells with dimensions larger than three times the particle diameter. Consequently, Mesh B was adopted for the remainder of the study, as it provided a satisfactory compromise between numerical accuracy, computational stability, and simulation cost. The selected mesh is illustrated in Figure 5.
Figure 5.
Computational mesh adopted for the CFD-DEM simulations. The mesh was refined in the central region of the spouted bed to improve the resolution of the spout channel and gas–solid interactions.
5.3. Characteristic Curves
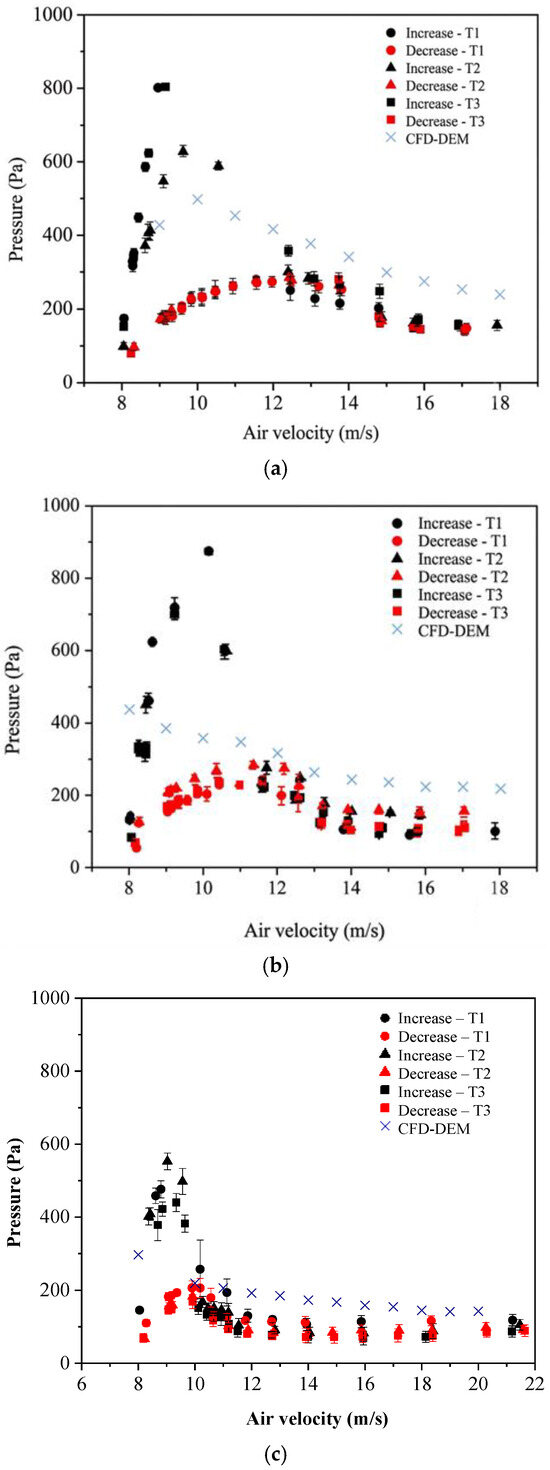
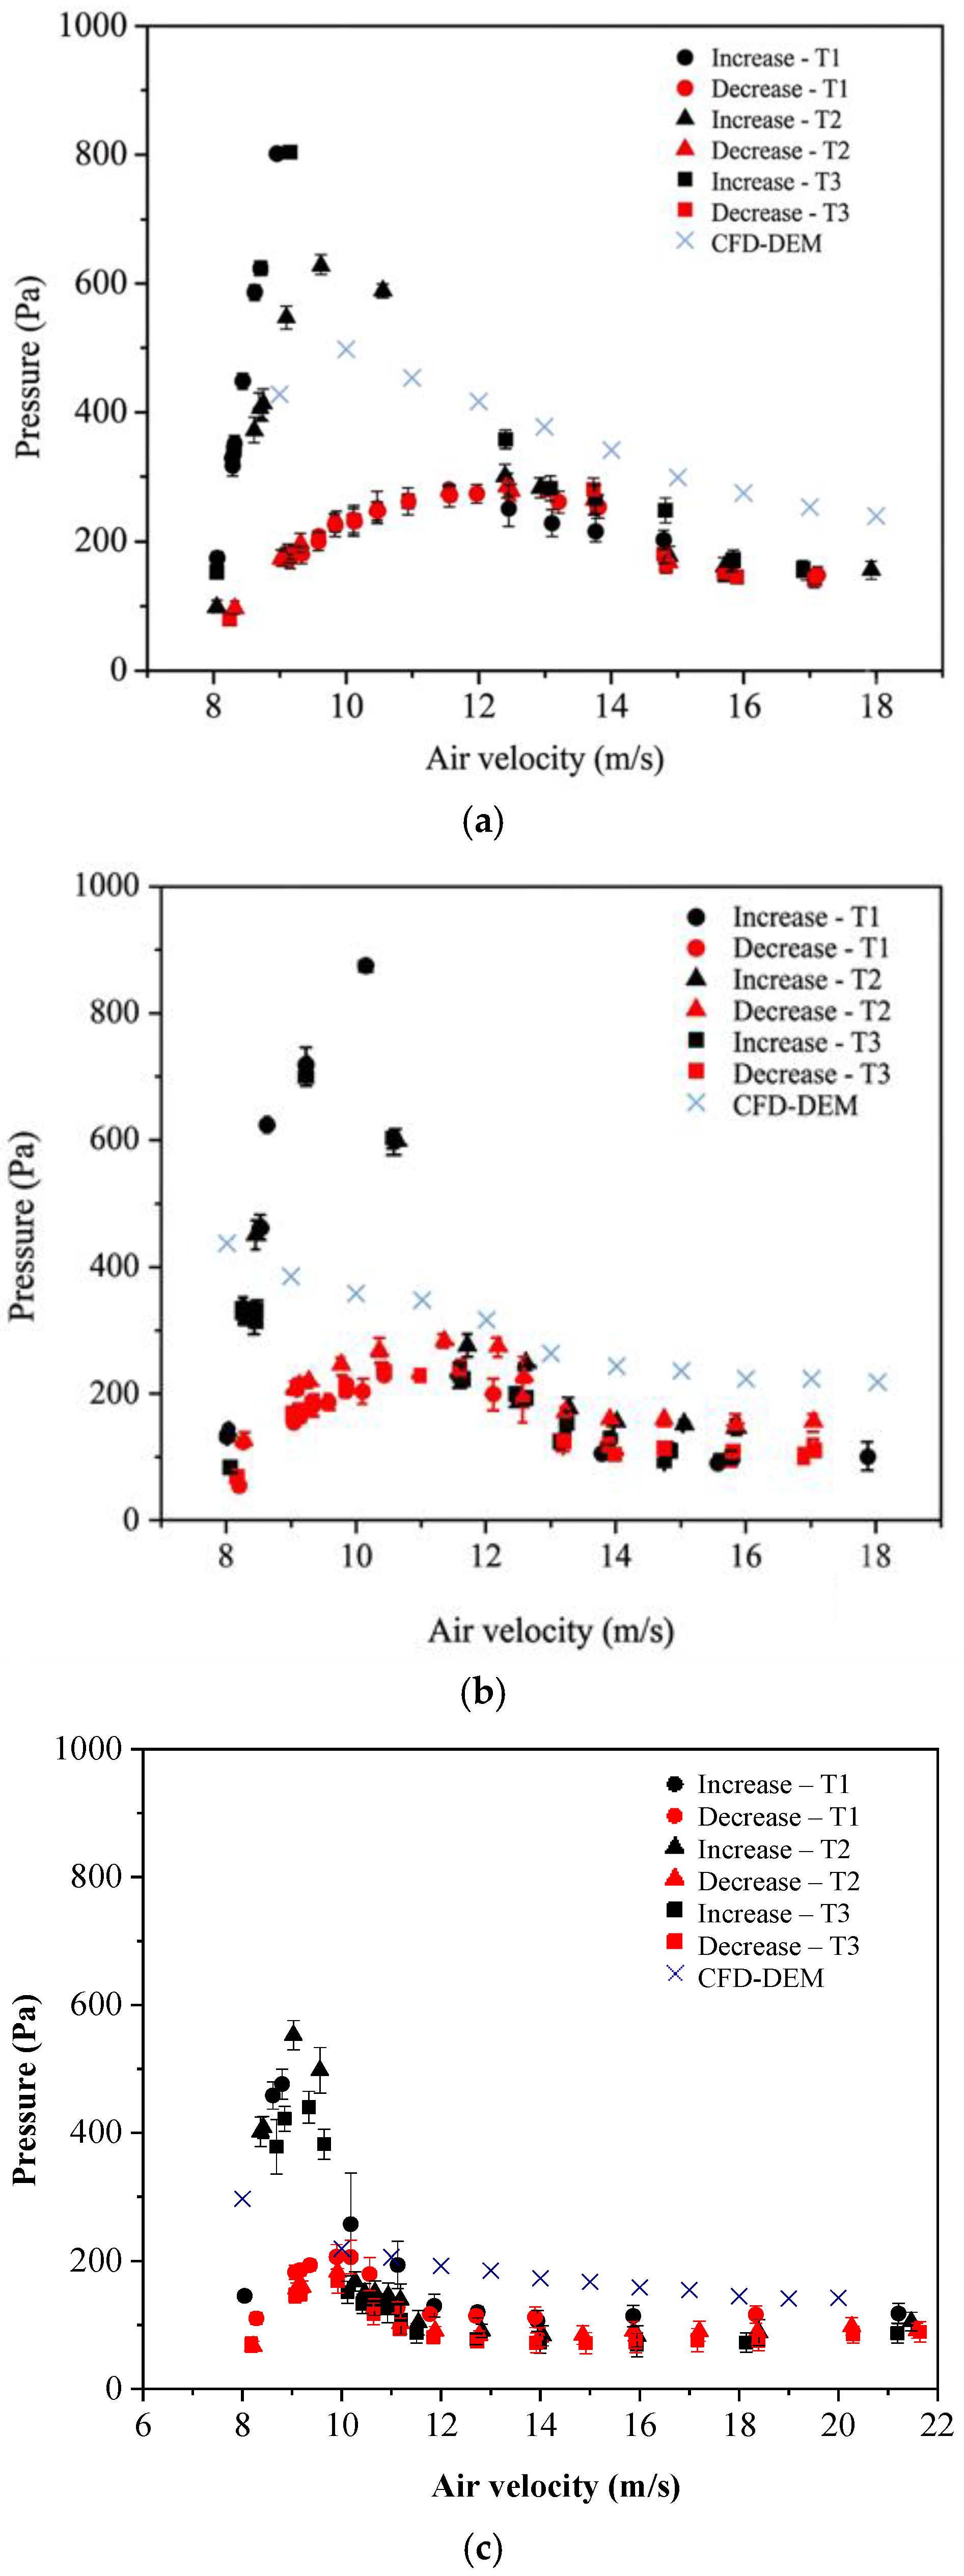
Figure 6 presents the spouted bed characteristic curves obtained experimentally and numerically for solid loads of 400 g (a), 300 g (b), and 200 g (c). The labels T1, T2, and T3 correspond to the three experimental replicates performed for each operating condition. The experimental curves obtained for the 400 g solids load showed excellent reproducibility, whereas some deviations were observed among the curves corresponding to the lower solid loads, which may be attributed to spout instabilities [46]. Each point on the experimental curves represents an average of approximately 50 pressure measurements, while the error bars indicate the corresponding standard deviations. During the experiments, the average air temperature ranged from 30 °C to 33 °C.
Figure 6.
Experimental and simulated spouted bed characteristic curves when increasing and decreasing the air velocity for solid loads of (a) 400 g, (b) 300 g, and (c) 200 g.
The comparison between the experimental and simulated curves allows for the evaluation of the CFD-DEM model’s ability to reproduce the hydrodynamic behavior of the spouted bed under different solid loads. Attention was given to the prediction of the pressure-drop profile and the minimum spouting velocity, which are key parameters for model validation.
For all solid loads investigated, the experimental curves exhibited the characteristic behavior of spouted beds, including the pressure-drop peak associated with spout initiation, a nearly constant pressure drop under stable spouting conditions, and hysteresis between the loading and unloading branches. The simulated curves obtained for the 400 g and 300 g solids loads tended to overpredict the experimental pressure-drop values, with the largest deviations occurring at the lowest and highest gas velocities.
For the 200 g solid load, the CFD-DEM simulation reproduced the overall shape of the experimental characteristic curve with good agreement, indicating that the model was able to capture the main pressure-drop trends across the investigated operating range. However, despite this satisfactory global agreement, the prediction of the minimum spouting velocity for this condition presented the largest deviation among the cases evaluated. This result suggests that reproducing the overall pressure-drop profile does not necessarily imply an accurate prediction of the transition between fixed-bed and spouting regimes, particularly under low solid-load conditions, where the system becomes more sensitive to fluctuations and instabilities.
The experimental minimum spouting velocities were determined by visual inspection of the bed behavior. During the decreasing air velocity stage, the minimum spouting condition was defined as the gas velocity at which the fountain disappeared. The maximum pressure drops corresponded to the highest values measured during the increasing air velocity stage, whereas the stable spouting pressure drops were obtained at the highest operating velocities under fully developed spouting conditions.
Table 6 summarizes the static bed heights, maximum pressure drops, stable spouting pressure drops, and minimum spouting velocities obtained for each solid load. The reported values correspond to the average of the three experimental replicates.
Table 6.
Experimental hydrodynamic parameters.
An increase in maximum pressure drop, stable spouting pressure drop, and minimum spouting velocity was observed with increasing solid load, in agreement with previous studies [47,48]. This behavior is attributed to the higher resistance imposed by the particle bed to the gas flow. As the solid load increases, a greater amount of energy is required to overcome the inertia and frictional resistance of the particle assembly, resulting in higher pressure drops and greater minimum spouting velocities. The decreasing airflow stage of the characteristic curve is highly reproducible, whereas the increasing airflow exhibits greater variability due to its dependence on bed compaction. Consequently, the minimum spouting velocity, determined during the decreasing airflow stage, is more reproducible than the maximum pressure drop, which is measured during the increasing airflow stage. This explains the larger deviations observed for the maximum pressure drop values reported in Table 6.
Because the minimum spouting velocity could not be accurately determined solely from the simulated pressure-drop curves, an additional analysis based on solid volume fraction contours was performed. Contour plots were evaluated on the central vertical plane of the spouted bed geometry for time-averaged results obtained over the final 2 s of each simulation.
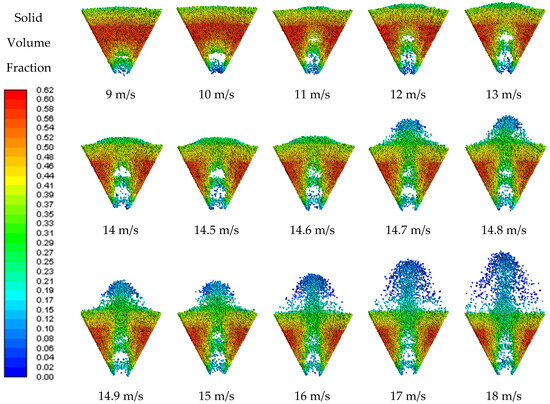
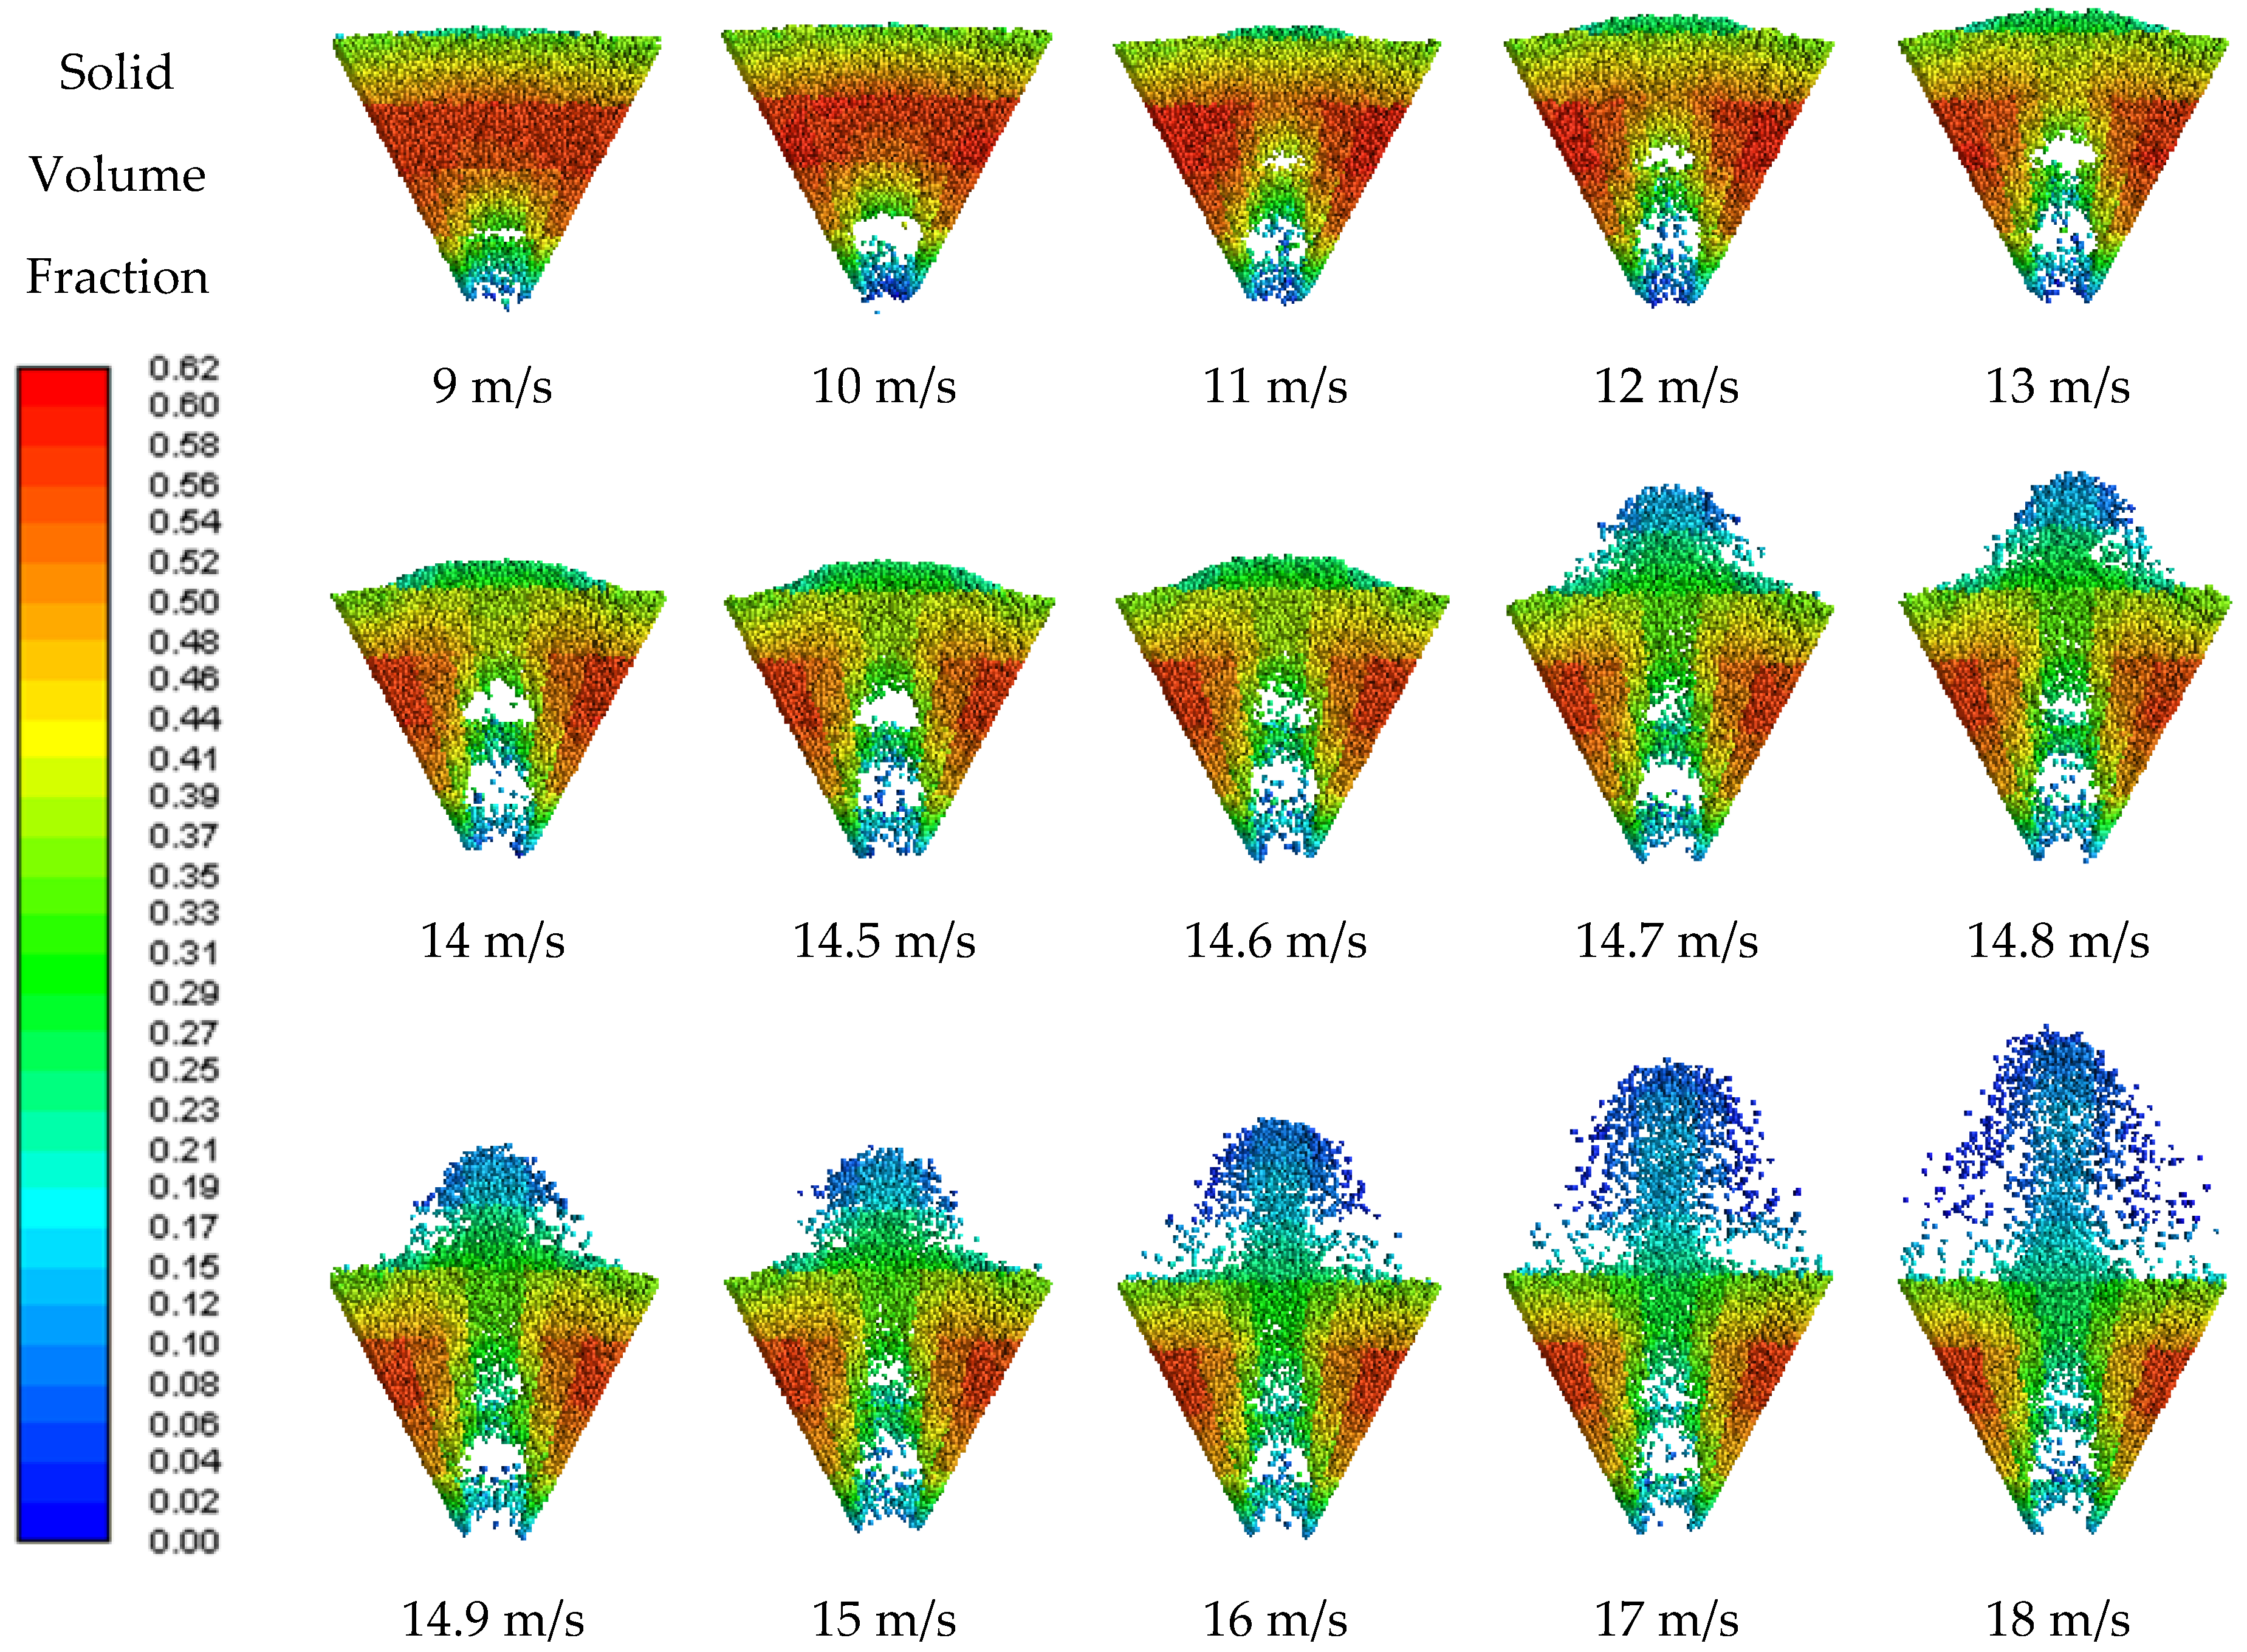
Figure 7 presents the solid volume fraction contours obtained for the 400 g solid load. The results clearly illustrate the transition from the fixed-bed regime to stable spouting conditions as the gas velocity increases. The progressive formation and expansion of the spout channel can be observed, accompanied by a reduction in solid concentration in the central region and an increase in particle circulation through the annular zone.
Figure 7.
Solid volume fraction contours obtained by CFD-DEM for a solid load of 400 g.
At an inlet gas velocity of 9 m·s−1, a small cavity can be observed near the distributor region, indicating the onset of particle entrainment at the base of the bed. As the gas velocity increases, the size of the low solid concentration region progressively expands until the particle bed is penetrated and a stable spout channel is formed at approximately 14.7 m·s−1. For gas velocities between 15 and 18 m·s−1, an increase in fountain height is observed with increasing gas velocity. At these conditions, the characteristic regions of a spouted bed—the annulus, spout channel, and fountain—are clearly identified.
Based on the solid volume fraction contours, the minimum spouting velocity predicted by the CFD-DEM model was determined as 14.7 m·s−1. This value differs by approximately 0.7% from the experimental result of 14.8 m·s−1, indicating excellent agreement between the numerical and experimental analyses.
The contours obtained for the 300 g solid load also show the transition from the fixed-bed regime to stable spouting conditions as the gas velocity increases (Figure 8). The formation of a continuous spout channel was observed at approximately 12.3 m·s−1, which was therefore identified as the minimum spouting velocity predicted by the numerical model.
Figure 8.
Solid volume fraction contours obtained by CFD-DEM for a solid load of 300 g.
Compared with the experimental value of 13.21 m·s−1, the simulated minimum spouting velocity presented a deviation of approximately 6.9%. Despite this difference, the model was able to reproduce the main hydrodynamic features of the system. After the establishment of stable spouting conditions, further increases in gas velocity promoted a progressive increase in fountain height and a reduction in solid concentration within the annular region, indicating enhanced particle circulation and bed expansion.
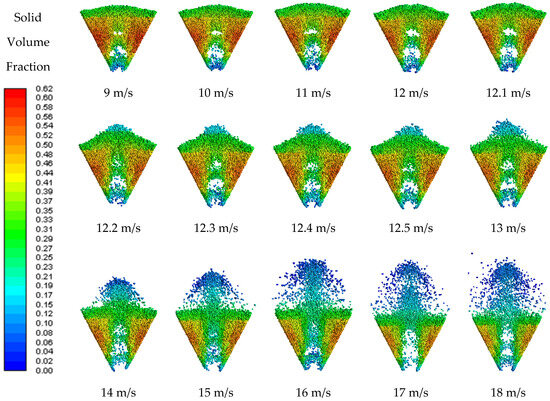
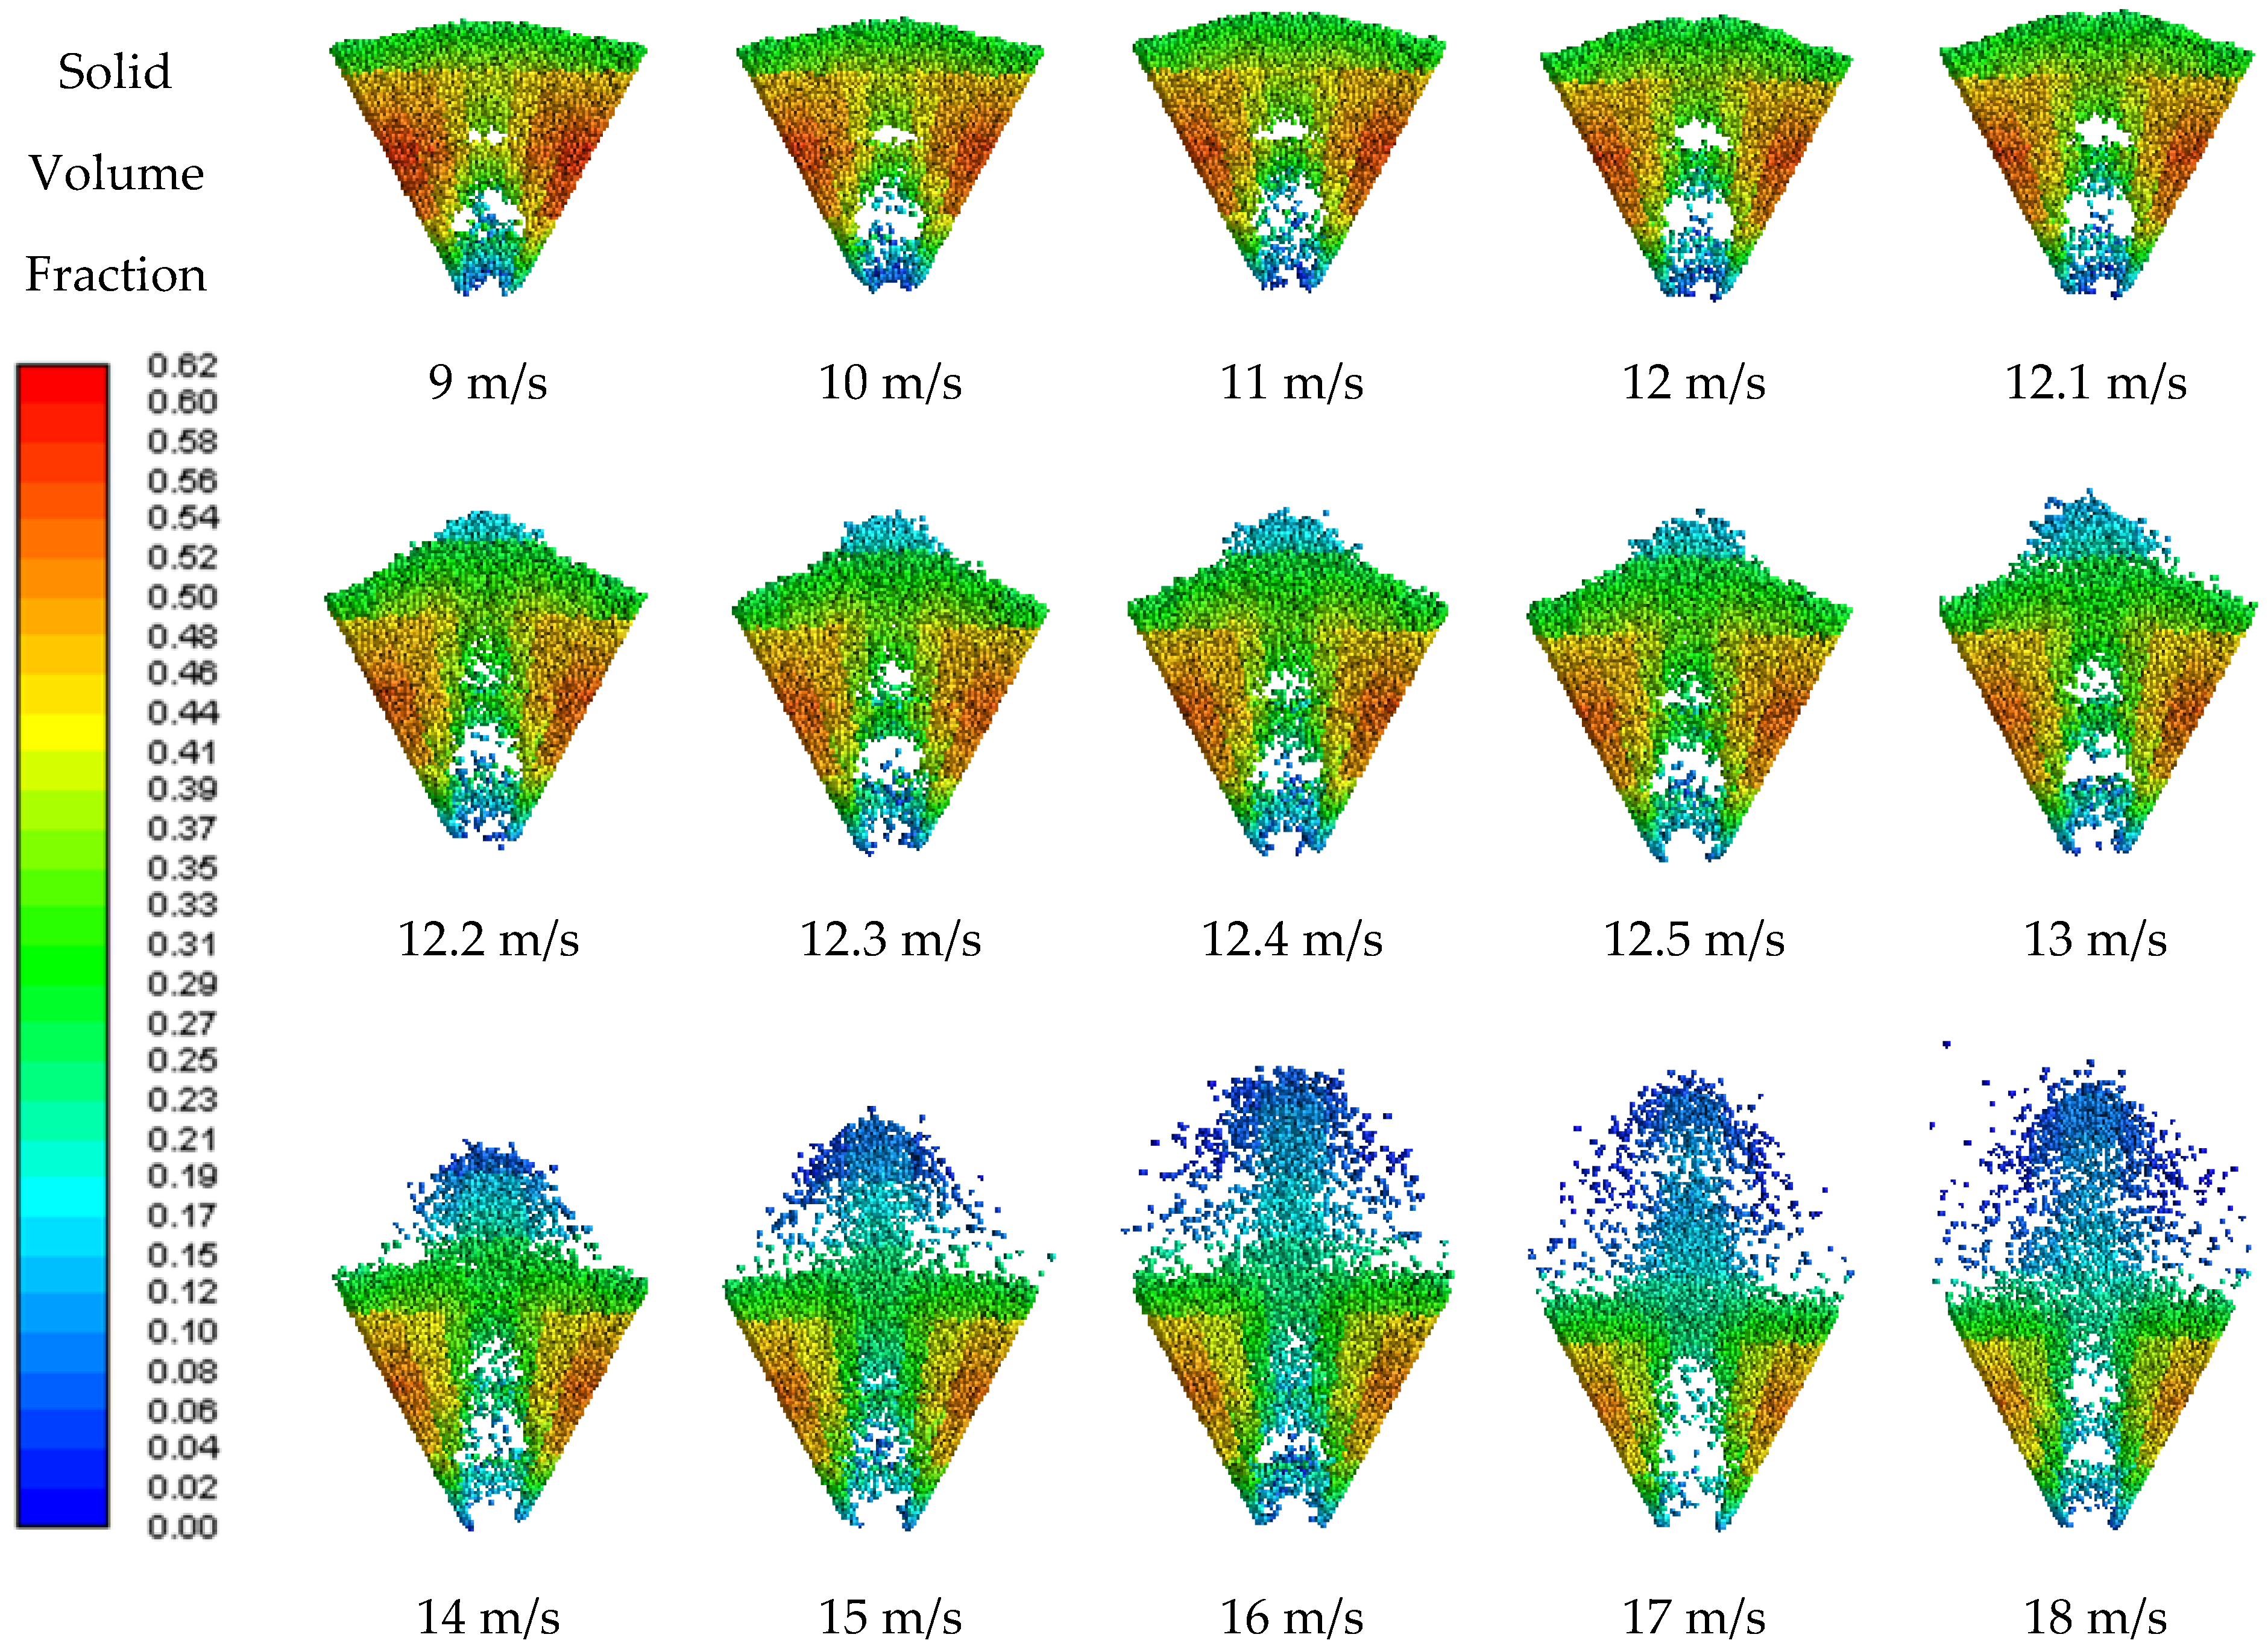
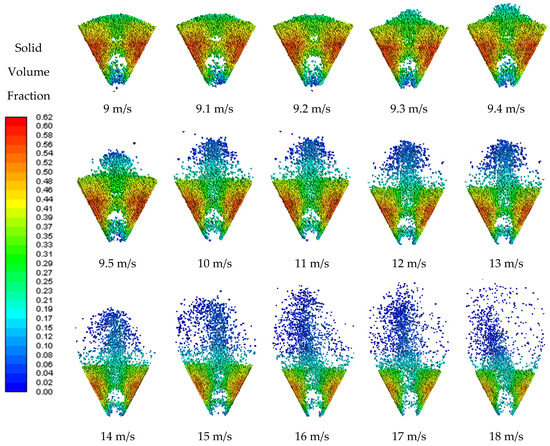
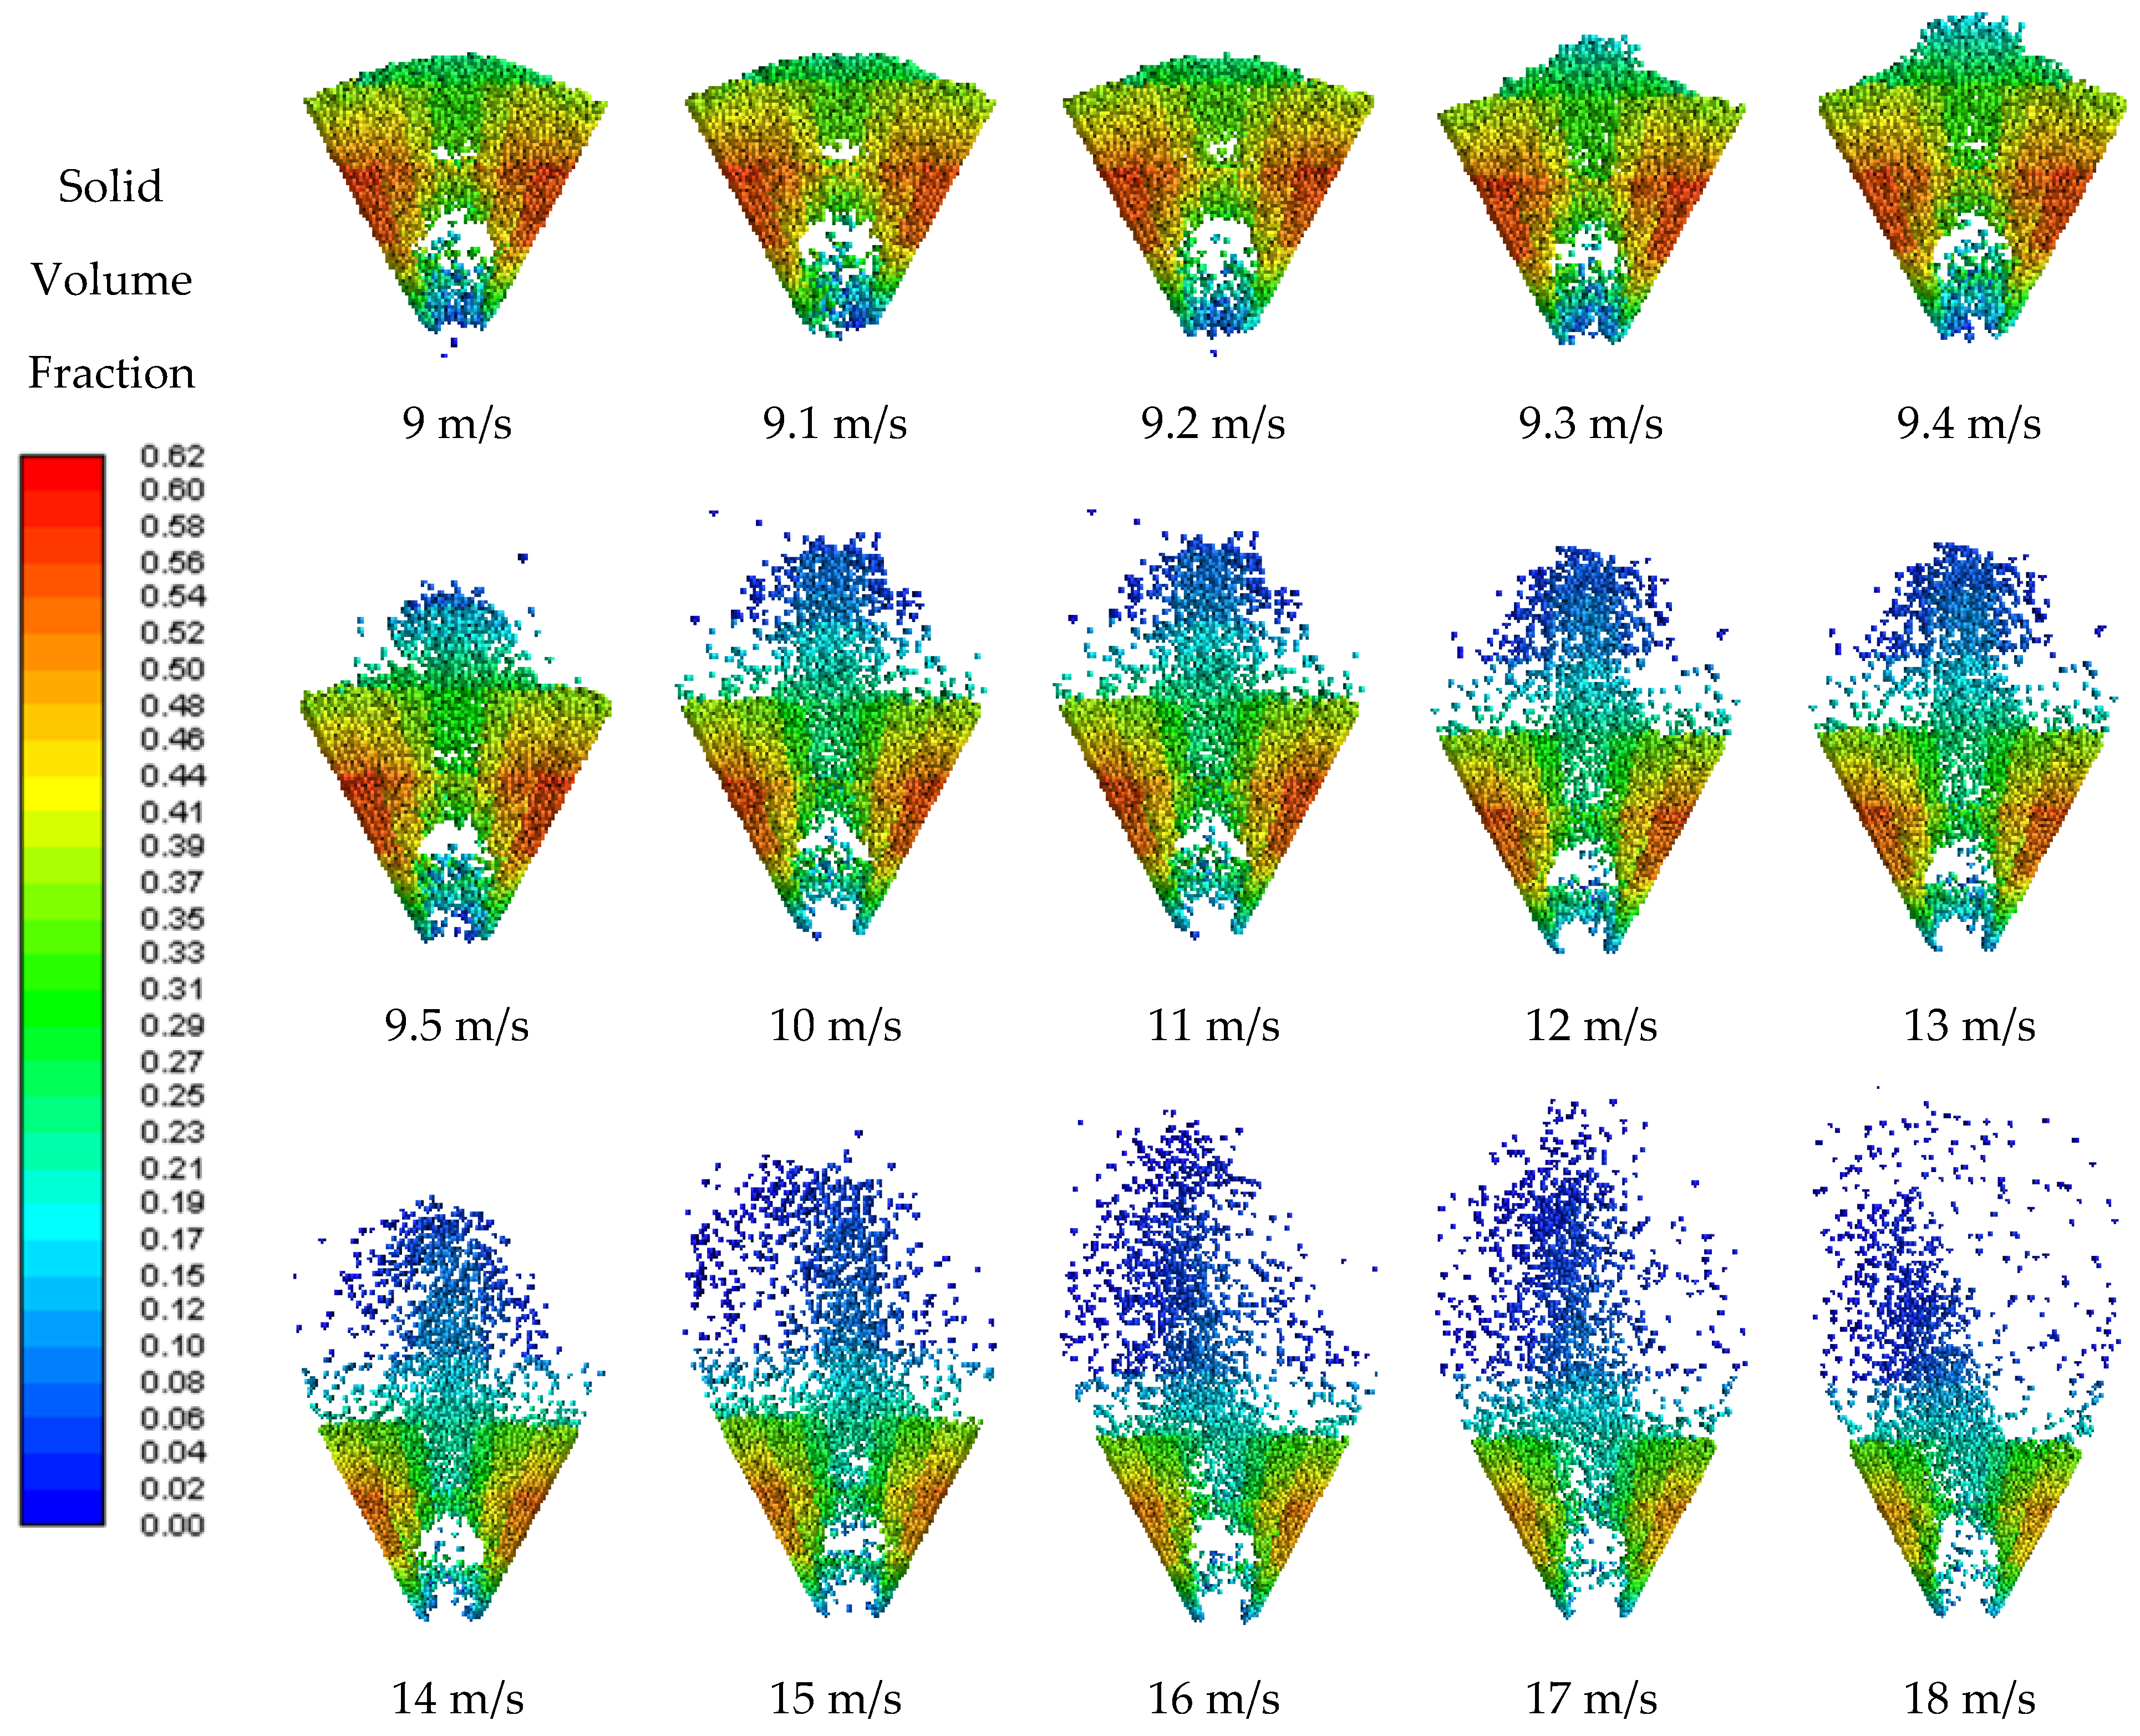
Figure 9 presents the solid volume fraction contours obtained for the 200 g solid load. Similar to the previous cases, the transition from the fixed-bed regime to stable spouting conditions can be observed as the inlet gas velocity increases. Based on the formation of a continuous spout channel, the minimum spouting velocity predicted by the CFD-DEM model was determined as 9.4 m·s−1. This value corresponds to a deviation of approximately 20.5% relative to the experimental minimum spouting velocity of 11.83 m·s−1.
Figure 9.
Solid volume fraction contours obtained by CFD-DEM for a solid load of 200 g.
The contours also reveal a progressive increase in fountain height with increasing gas velocity up to approximately 15 m·s−1. Beyond this condition, the system gradually loses the characteristic flow structure of a spouted bed. This behavior can be attributed to the combination of a low solid load and high gas velocity, which promotes intense particle entrainment and increases the degree of bed expansion. Under these conditions, the gas flow becomes sufficient to suspend most of the particles throughout the bed volume, leading to a fluidization-like behavior rather than the well-defined spout channel and annular region typically observed in conventional spouted beds.
The larger deviation observed for the 200 g solid load suggests that the CFD-DEM model presents lower predictive accuracy under conditions close to the transition between spouting and fluidization regimes. In such cases, small differences in the interaction parameters or drag-force prediction may significantly affect the identification of the minimum spouting condition, resulting in larger deviations between the numerical and experimental results.
In Figure 7, Figure 8 and Figure 9, regions containing solid particles within the spout channel can also be observed, indicating the occurrence of particle pulses. This phenomenon was also observed during the experimental tests, suggesting that the CFD-DEM model was able to adequately reproduce this characteristic feature of the spouted-bed hydrodynamics.
Table 7 summarizes the experimental and simulated minimum spouting velocities, together with their corresponding relative deviations. The results show the expected decrease in minimum spouting velocity with decreasing solid load, consistent with the experimental observations. The relative deviation between the experimental and simulated values increased as the solid load decreased. This behavior may be associated with the greater instability of the bed under low solid loads, which increases the uncertainty in both the experimental determination and numerical prediction of the minimum spouting condition.
Table 7.
Experimental and simulated minimum spouting velocities.
Although deviations were observed between the experimental and simulated characteristic curves, the adopted CFD-DEM model could reproduce the main hydrodynamic features of the spouted bed. In particular, the model successfully captured the dependence of the minimum spouting velocity on solid load, the formation of the spout channel, the fountain development, and the characteristic particle circulation patterns. As previously discussed, the interaction parameters constitute fundamental inputs for DEM-based simulations; therefore, the direct measurement methodology employed in this work provided interaction parameters suitable for accurately representing the behavior of the investigated system.
5.4. Characteristic Curves Using Interaction Parameters from Xiao et al. [34]
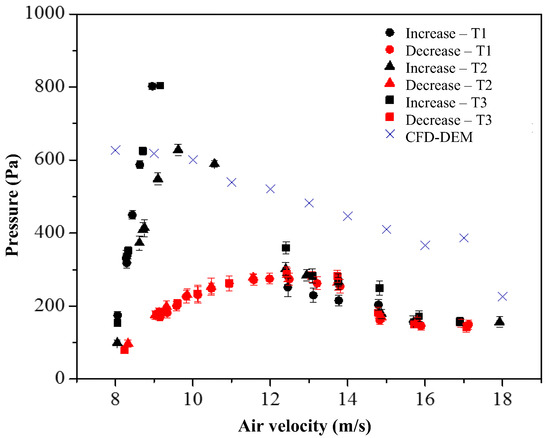
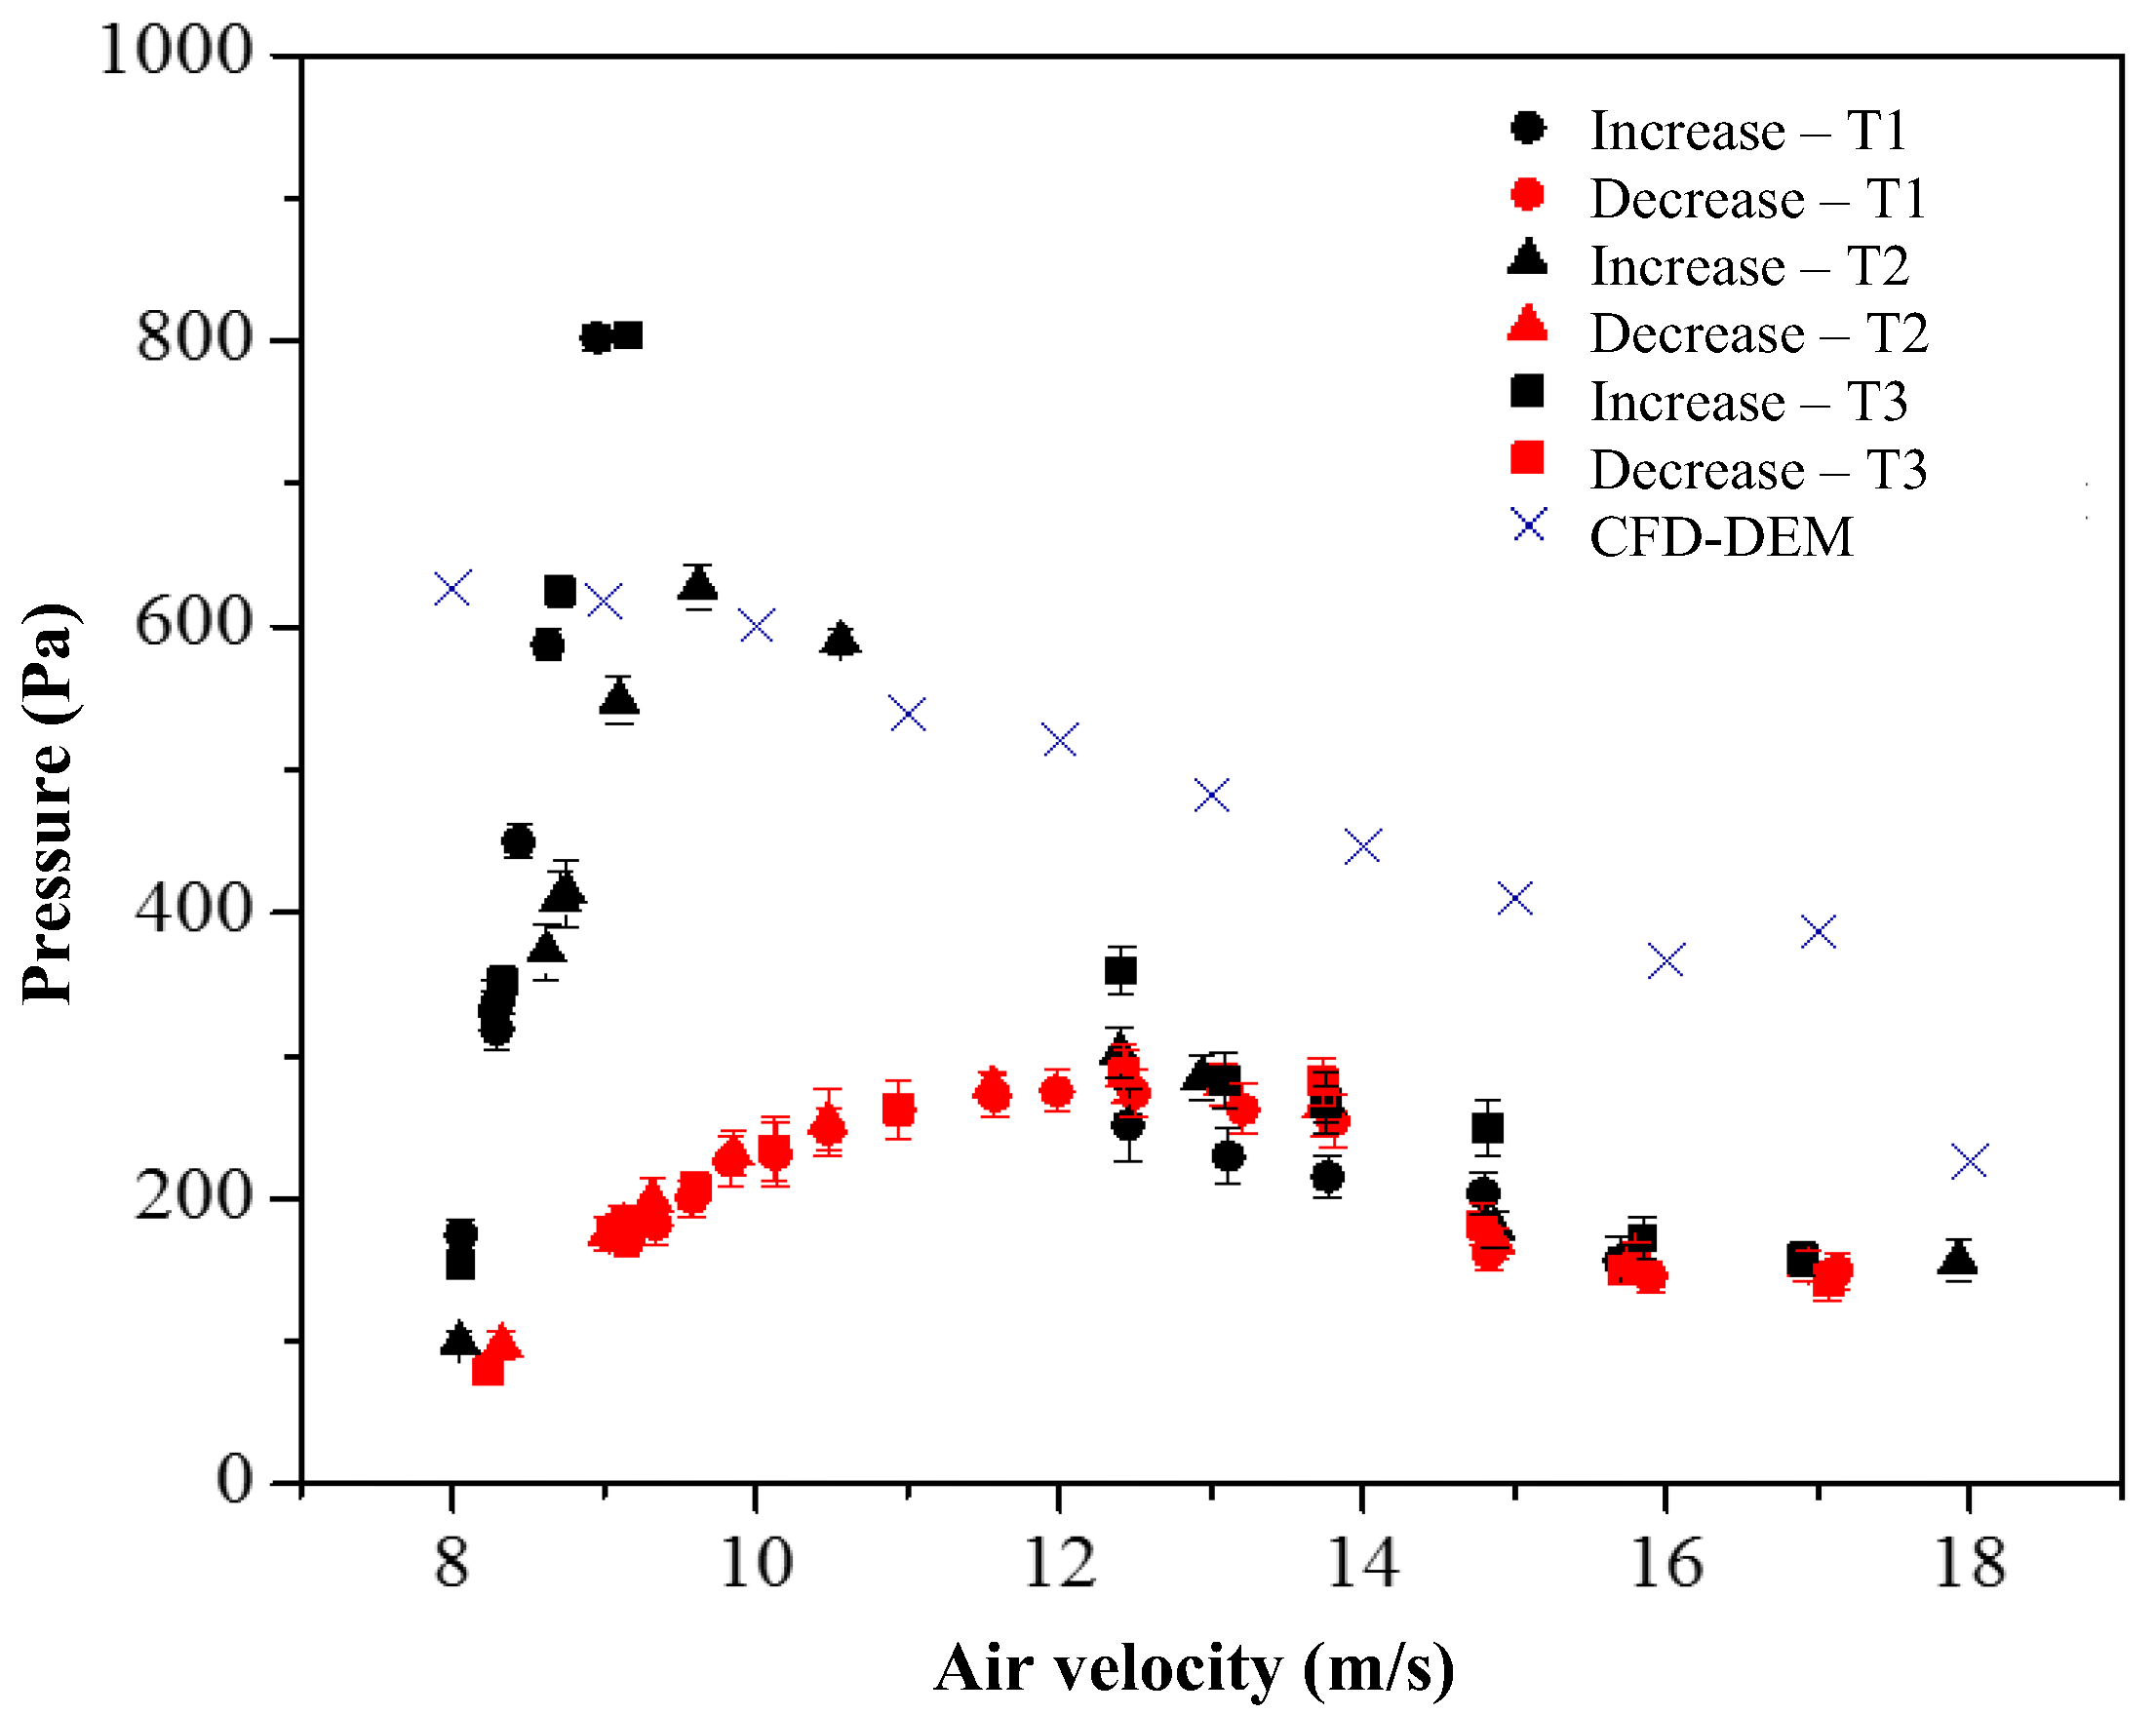
To assess the sensitivity of the CFD-DEM model to the interaction parameters, additional simulations were carried out using the coefficients reported by Xiao et al. [34]. Although the interaction parameters reported by Xiao et al. [34] were also obtained for ABS spheres, the particle diameter used in their study was larger than that employed in this work, and different interaction parameters were obtained. All simulations were performed for a solid load of 400 g. The resulting characteristic hydrodynamic curve is presented in Figure 10, while the corresponding curve obtained using the experimentally determined coefficients is shown in Figure 6a.
Figure 10.
Comparison between experimental and CFD-DEM characteristic curves for the spouted bed containing 400 g of ABS particles using the interaction parameters reported by Xiao et al. [34].
As shown in Figure 10, the characteristic curve predicted using the interaction parameters reported by Xiao et al. [34] differed significantly from the experimental results, not only in terms of pressure-drop magnitude but also with respect to the overall shape of the curve. The simulation was unable to accurately reproduce the characteristic hydrodynamic behavior of the spouted bed, particularly the transition region between the fixed-bed and stable spouting regimes, the maximum pressure-drop peak, and the pressure-drop profile observed under stable spouting conditions. Consequently, the use of literature-based parameters resulted in a less representative description of the system behavior.
In contrast, the simulations performed with the interaction parameters determined experimentally in the present work reproduced the overall shape of the experimental characteristic hydrodynamic curve more satisfactorily (Figure 6a). Although deviations were still observed at the lowest and highest gas velocities, the model was able to capture the characteristic pressure-drop evolution, the transition to stable spouting, and the pressure levels associated with the fully developed spouting regime. This improved agreement indicates that the experimentally determined parameters provide a more realistic representation of particle–particle and particle–wall interactions in the studied system.
Furthermore, the minimum spouting velocity predicted using the experimentally determined coefficients (14.7 m·s−1) was closer to the experimental value (14.83 m·s−1) than that obtained using the coefficients reported by Xiao et al. [34] (15.3 m·s−1). However, the most significant improvement was observed in the overall agreement between the simulated and experimental characteristic curves, demonstrating that the accurate characterization of interaction parameters is essential not only for predicting the minimum spouting velocity, but also for reproducing the global hydrodynamic behavior of spouted beds.
6. Conclusions
The experimental characteristic curves exhibited the typical behavior of spouted beds, including the influence of solid load on the maximum pressure drop, stable spouting pressure drop, and minimum spouting velocity. The experimentally determined minimum spouting velocities were 14.83, 13.21, and 11.83 m·s−1 for solid loads of 400, 300, and 200 g, respectively.
The CFD-DEM simulations reproduced the main hydrodynamic features of the system, including the transition from fixed-bed to stable spouting conditions, the formation of the spout channel, and the development of the fountain region. The relative deviations between the simulated and experimental minimum spouting velocities were 0.9%, 6.9%, and 20.5% for solid loads of 400, 300, and 200 g, respectively. These results indicate that the methodologies employed for determining the physical properties of the particles and the DEM interaction parameters provided representative input data for the numerical model.
The interaction parameters obtained using direct measurement yielded more accurate predictions than those reported by Xiao et al. [34], demonstrating the strong influence of contact parameters on CFD-DEM results. The findings highlight the importance of experimentally determining particle–particle and particle–wall interaction parameters for the reliable simulation of spouted beds and other gas–solid systems. Overall, the proposed methodology proved effective for generating representative DEM input parameters and improving the predictive capability of CFD-DEM simulations.
Author Contributions
L.P.B.: Conceptualization, Methodology, Software, Validation, Formal analysis, Investigation, Data curation, Writing—original draft, Visualization, Writing—review and editing J.N.M.B.: Conceptualization, Methodology, Software, Investigation, Writing—review and editing A.S.e.S.: Validation, Formal analysis, Writing—review and editing, R.B.: Conceptualization, Methodology, Validation, Formal analysis, Resources, Data curation, Writing—review and editing, Supervision, Project administration, Funding acquisition. All authors have read and agreed to the published version of the manuscript.
Funding
This research was funded by Coordenação de Aperfeiçoamento de Pessoal de Nível Superior—Brasil (CAPES)—Finance Code 001, and by Conselho Nacional de Desenvolvimento Científico e Tecnológico—Brasil (CNPq).
Data Availability Statement
Data are contained within the article.
Acknowledgments
During the preparation of this study, the authors used Generative Artificial Intelligence (GenAI) tool, specifically ChatGPT (OpenAI, GPT-5.5) and Gemini (Google, Gemini 3.5) for to assist in language and graphics editing. The authors have reviewed and edited the output and take full responsibility for the content of this publication.
Conflicts of Interest
The authors declare no conflicts of interest.
Nomenclature
| Gravitational force acting on particle i | |
| Particle–fluid interaction force | |
| Particle–particle interaction force | |
| Rolling torque | |
| Torque due to particle collision | |
| Unit vector | |
| Contact force | |
| Friction force | |
| Fluid–particle interaction force | |
| Normal component of the contact force | |
| Tangential component of the contact force | |
| Velocity of particle i | |
| Turbulence model coefficients | |
| Solid particle diameter | |
| Interphase interaction force | |
| Rolling resistance force | |
| Radius of particle i | |
| Collision time | |
| Velocity | |
| Minimum spouting velocity | |
| Computational cell volume | |
| Particle velocity before collision | |
| Particle velocity after collision | |
| Position of particle i | |
| Turbulent viscosity of the fluid phase | |
| Rolling friction coefficient | |
| Static friction coefficient | |
| Influence of the dispersed phase on the continuous phase | |
| Solid volume fraction in the cell | |
| Reynolds stress tensor | |
| Stable spouting pressure drop | |
| Maximum pressure drop | |
| Pressure drop | |
| A | Asymptotic convergence ratio |
| Particle acceleration | |
| CD | Drag coefficient |
| Dg | Venturi throat diameter |
| Di | Venturi inlet diameter |
| Do | Diameter of the cylindrical section of the spouted bed |
| dp | Particle diameter |
| fexact | Extrapolated asymptotic solution |
| g | Gravitational acceleration |
| Spring stiffness coefficient | |
| Particle mass | |
| Re | Reynolds number |
| α | Phase volume fraction |
| Interphase momentum exchange coefficient | |
| Damping coefficient | |
| Deformation | |
| Bed voidage | |
| Inclination angle | |
| Dynamic viscosity | |
| ρ | Density |
| Pressure | |
| Subscript | |
| f | Fluid phase |
| pp | Particle–particle interaction |
| pw | Particle–wall interaction |
| s | Solid phase |
References
- Zhong, Z.; Ku, X.; Lin, J.; Yu, Z. Influence of reactor configuration and operating conditions on heat transfer and drying behavior of wet particles in a spouted bed. Powder Technol. 2025, 461, 121117. [Google Scholar] [CrossRef] [Scilit]
- Brito, R.C.; Pádua, T.F.; Freire, J.T.; Béttega, R. Effect of Mechanical Energy on the Energy Efficiency of Spouted Beds Applied on Drying of Sorghum [Sorghum Bicolor (L) Moench]. Chem. Eng. Process. Process Intensif. 2017, 117, 95–105. [Google Scholar] [CrossRef] [Scilit]
- Souza Nascimento, B.; Freire, F.B.; Freire, J.T. Neuronal and grey modelling of milk drying in spouted bed. Can. J. Chem. Eng. 2013, 91, 1815–1821. [Google Scholar] [CrossRef] [Scilit]
- Mathur, K.B.; Epstein, N. Spouted Beds; Academic Press: New York, NY, USA, 1974. [Google Scholar]
- Mathur, K.B.; Gishler, P.E. A technique for contacting gases with coarse solid particles. AIChE J. 1955, 1, 157–164. [Google Scholar] [CrossRef] [Scilit]
- Pietsch, S.; Kieckhefen, P.; Heinrich, S.; Müller, M.; Schönherr, M.; Kleine Jäger, F. CFD-DEM modelling of circulation frequencies and residence times in a prismatic spouted bed. Chem. Eng. Res. Des. 2018, 132, 1105–1116. [Google Scholar] [CrossRef] [Scilit]
- Wang, G.; Guo, L.; Zhang, F.; Lin, J.; Yang, X. Effect of Temperature on the Fluid Dynamics of Heavy Particles in a Conical Spouted Bed for Nuclear Fuel Coating. Ind. Eng. Chem. Res. 2025, 64, 19237–19244. [Google Scholar] [CrossRef] [Scilit]
- Borini, G.B.; Andrade, T.C.; Freitas, L.A.P. Hot melt granulation of coarse pharmaceutical powders in a spouted bed. Powder Technol. 2009, 189, 520–527. [Google Scholar] [CrossRef] [Scilit]
- Alvarez, J.; Lopez, G.; Amutio, M.; Artetxe, M.; Barbarias, I.; Arregi, A.; Bilbao, J.; Olazar, M. Characterization of the bio-oil obtained by fast pyrolysis of sewage sludge in a conical spouted bed reactor. Fuel Process. Technol. 2016, 149, 169–175. [Google Scholar] [CrossRef] [Scilit]
- Amutio, M.; Lopez, G.; Artetxe, M.; Elordi, G.; Olazar, M.; Bilbao, J. Influence of temperature on biomass pyrolysis in a conical spouted bed reactor. Resour. Conserv. Recycl. 2012, 59, 23–31. [Google Scholar] [CrossRef] [Scilit]
- Arregi, A.; Amutio, M.; Lopez, G.; Artetxe, M.; Alvarez, J.; Bilbao, J.; Olazar, M. Hydrogen-rich gas production by continuous pyrolysis and in-line catalytic reforming of pine wood waste and HDPE mixtures. Energy Convers. Manag. 2017, 136, 192–201. [Google Scholar] [CrossRef] [Scilit]
- Adegoroye, A.; Paterson, N.; Li, X.; Morgan, T.; Herod, A.A.; Dugwell, D.R.; Kandiyoti, R. The characterisation of tars produced during the gasification of sewage sludge in a spouted bed reactor. Fuel 2004, 83, 1949–1960. [Google Scholar] [CrossRef] [Scilit]
- Bove, D.; Moliner, C.; Curti, M.; Baratieri, M.; Bosio, B.; Rovero, G.; Arato, E. Preliminary tests for the thermo-chemical conversion of biomass in a spouted bed pilot plant. Can. J. Chem. Eng. 2019, 97, 59–66. [Google Scholar]
- Chen, C.; Qian, B.; Cui, X.; Vladimirovichb, V.S.; Oboirien, B.; Xiong, Q.; Zhou, Y. Coarse-grained CFD-DEM simulation and enhancement mechanism analysis of spouted fluidized bed biomass gasification reactor: Effect of pulsed gas flow. Appl. Therm. Eng. 2025, 279, 128090. [Google Scholar] [CrossRef] [Scilit]
- Albina, D.O. Emissions from multiple-spouted and spout-fluid fluidized beds using rice husks as fuel. Renew. Energy 2006, 31, 2152–2163. [Google Scholar] [CrossRef] [Scilit]
- Rasul, M.G. Spouted bed combustion of wood charcoal: Performance comparison of three different designs. Fuel 2001, 80, 2189–2191. [Google Scholar] [CrossRef] [Scilit]
- San José, M.J.; Alvarez, S.; García, I.; Peñas, F.J. Conical spouted bed combustor for clean valorization of sludge wastes from paper industry to generate energy. Chem. Eng. Res. Des. 2014, 92, 672–678. [Google Scholar] [CrossRef] [Scilit]
- Béttega, R.; Corrêa, R.G.; Freire, J.T. Three-dimensional numerical simulation of semi-cylindrical and cylindrical spouted bed hydrodynamics. Dry. Technol. 2010, 28, 1266–1276. [Google Scholar] [CrossRef] [Scilit]
- Hosseini, S.H.; Ahmadi, G.; Olazar, M. CFD simulation of cylindrical spouted beds by the kinetic theory of granular flow. Powder Technol. 2013, 246, 303–316. [Google Scholar] [CrossRef] [Scilit]
- Moliner, C.; Marchelli, F.; Bosio, B.; Arato, E. Modelling of spouted and spout-fluid beds: Key for their successful scale up. Energies 2017, 10, 1729. [Google Scholar] [CrossRef] [Scilit]
- Thornton, C. Granular Dynamics, Contact Mechanics and Particle System Simulations: A DEM Study; Springer: Birmingham, UK, 2015. [Google Scholar]
- Zhang, H.; Li, S. DEM Simulation of Wet Granular-Fluid Flows in Spouted Beds: Numerical Studies and Experimental Verifications. Powder Technol. 2017, 318, 337–349. [Google Scholar] [CrossRef] [Scilit]
- Norouzi, H.R.; Zarghami, R.; Sotudeh-Gharebagh, R.; Mostoufi, N. Coupled CFD-DEM Modeling: Formulation, Implementation and Application to Multiphase Flows; John Wiley & Sons: Chichester, UK, 2016. [Google Scholar]
- Zhang, Q.; Cai, W.; Lu, C.; Gidaspow, D.; Lu, H. Modified MFIX Code to Simulate Hydrodynamics of Gas-Solids Bubbling Fluidized Beds: A Model of Coupled Kinetic Theory of Granular Flow and Discrete Element Method. Powder Technol. 2019, 357, 417–427. [Google Scholar] [CrossRef] [Scilit]
- Asaf, Z.; Rubinstein, D.; Shmulevich, I. Determination of discrete element model parameters required for soil tillage. Soil Tillage Res. 2007, 92, 227–242. [Google Scholar] [CrossRef] [Scilit]
- Combarros, M.; Feise, H.J.; Zetzener, H.; Kwade, A. Segregation of particulate solids: Experiments and DEM simulations. Particuology 2014, 12, 25–32. [Google Scholar] [CrossRef] [Scilit]
- Chen, H.; Liu, Y.L.; Zhao, X.Q.; Xiao, Y.G.; Liu, Y. Numerical investigation on angle of repose and force network from granular pile in variable gravitational environments. Powder Technol. 2015, 283, 607–617. [Google Scholar] [CrossRef] [Scilit]
- Hastie, D.B. Experimental measurement of the coefficient of restitution of irregular shaped particles impacting on horizontal surfaces. Chem. Eng. Sci. 2013, 101, 828–836. [Google Scholar] [CrossRef] [Scilit]
- Coetzee, C.J. Review: Calibration of the Discrete Element Method. Powder Technol. 2017, 310, 104–142. [Google Scholar] [CrossRef] [Scilit]
- Batista, J.N.M.; Santos, D.A.; Béttega, R. Determination of the physical and interaction properties of sorghum grains: Application to computational fluid dynamics–discrete element method simulations of the fluid dynamics of a conical spouted bed. Particuology 2021, 54, 91–101. [Google Scholar] [CrossRef] [Scilit]
- González-Montellano, C.; Fuentes, J.M.; Ayuga-Téllez, E.; Ayuga, F. Determination of the mechanical properties of maize grains and olives required for use in DEM simulations. J. Food Eng. 2012, 111, 553–562. [Google Scholar] [CrossRef] [Scilit]
- Ketterhagen, W.R.; Curtis, J.S.; Wassgren, C.R.; Kong, A.; Narayan, P.J.; Hancock, B.C. Granular segregation in discharging cylindrical hoppers: A discrete element and experimental study. Chem. Eng. Sci. 2007, 62, 6423–6439. [Google Scholar] [CrossRef] [Scilit]
- Brandão, R.J.; Calheiros, C.J.P.; Machado, M.V.C.; Lima, R.M.; Duarte, C.R.; Barrozo, M.A.S. A systematic evaluation of DEM input parameters measurement and calibration. Powder Technol. 2024, 448, 120157. [Google Scholar] [CrossRef] [Scilit]
- Xiao, X.; Tan, Y.; Zhang, H.; Deng, R.; Jiang, S. Experimental and DEM studies on the particle mixing performance in rotating drums: Effect of area ratio. Powder Technol. 2017, 314, 182–194. [Google Scholar] [CrossRef] [Scilit]
- Hu, C.; Luo, K.; Wang, S.; Lin, J.; Fan, J. The Effects of Collisional Parameters on the Hydrodynamics and Heat Transfer in Spouted Bed: A CFD DEM Study. Powder Technol. 2019, 353, 132–144. [Google Scholar] [CrossRef] [Scilit]
- Marchelli, F.; Moliner, C.; Bosio, B.; Arato, E. A CFD-DEM sensitivity analysis: The case of a pseudo-2D spouted bed. Powder Technol. 2019, 353, 409–425. [Google Scholar] [CrossRef] [Scilit]
- Batista, J.N.M.; Brito, R.C.; Béttega, R. Influence of Inlet Air Distributor Geometry on the Fluid Dynamics of Conical Spouted Beds: A CFD Study. Chem. Ind. Chem. Eng. Q. 2018, 24, 369–378. [Google Scholar] [CrossRef] [Scilit]
- da Rosa, C.A.; Freire, J.T. Fluid Dynamics Analysis of a Draft-Tube Continuous Spouted Bed with Particles Bottom Feed using CFD. Ind. Eng. Chem. Res. 2009, 48, 7813–7820. [Google Scholar] [CrossRef] [Scilit]
- Sousa, L.M.; Ferreira, M.C. Spent coffee grounds as a renewable source of energy: An analysis of bulk powder flowability. Particuology 2019, 43, 92–100. [Google Scholar] [CrossRef] [Scilit]
- ASTM G194-08; Standard Test Method for Measuring Rolling Friction Characteristics of a Spherical Shape on a Flat Horizontal Plane. ASTM International: West Conshohocken, PA, USA, 2013.
- Gidaspow, D.; Bezburuah, R.; Ding, J. Hydrodynamics of Circulating Fluidized Beds, Kinetic Theory Approach. In Fluidization VII, Proceedings of the Seventh International Conference on Fluidization, New York, NY, USA, 3–8 May 1992; Potter, O.E., Nicklin, D.J., Eds.; Engineering Foundation: New York, NY, USA, 1992; pp. 75–82. [Google Scholar]
- Di Renzo, A.; Di Maio, F.P. Comparison of contact-force models for the simulation of collisions in DEM-based granular flow codes. Chem. Eng. Sci. 2004, 59, 525–541. [Google Scholar] [CrossRef] [Scilit]
- Kieckhefen, P.; Pietsch, S.; Höfert, M.; Schönherr, M.; Heinrich, S.; Jäger, F.K. Influence of Gas Inflow Modelling on CFD-DEM Simulations of Three-Dimensional Prismatic Spouted Beds. Powder Technol. 2018, 329, 167–180. [Google Scholar] [CrossRef] [Scilit]
- Elsayed, K.; Lacor, C. Numerical modeling of the flow field and performance in cyclones of different cone-tip diameters. Comput. Fluids 2011, 51, 48–59. [Google Scholar] [CrossRef] [Scilit]
- Sturm, M.; Wirtz, S.; Scherer, V.; Denecke, J. Coupled DEM-CFD Simulation of Pneumatically Conveyed Granular Media. Chem. Eng. Technol. 2010, 33, 1184–1192. [Google Scholar] [CrossRef] [Scilit]
- Olazar, M.; San Jose, M.J.; Aguayo, A.T.; Arandes, J.M.; Bilbao, J. Design factors of conical spouted beds and jet spouted beds. Ind. Eng. Chem. Res. 1993, 32, 1245–1250. [Google Scholar] [CrossRef] [Scilit]
- Golshan, S.; Yaman, O.; Koksal, M.; Kulah, G.; Zarghami, R.; Mostoufi, N. A new correlation for minimum spouting velocity for conical spouted beds operating with high density particles. Exp. Therm. Fluid. Sci. 2018, 96, 358–370. [Google Scholar] [CrossRef] [Scilit]
- Zhou, J.; Bruns, D.D. Minimum spouting velocity of dense particles in shallow spouted beds. Can. J. Chem. Eng. 2012, 90, 558–564. [Google Scholar]

Disclaimer/Publisher’s Note: The statements, opinions and data contained in all publications are solely those of the individual author(s) and contributor(s) and not of MDPI and/or the editor(s). MDPI and/or the editor(s) disclaim responsibility for any injury to people or property resulting from any ideas, methods, instructions or products referred to in the content. |
© 2026 by the authors. Licensee MDPI, Basel, Switzerland. This article is an open access article distributed under the terms and conditions of the Creative Commons Attribution (CC BY) license.