


Abstract
This study investigated the association between serum hypoxia-inducible factor 1-alpha (HIF-1α) levels and clinical severity in patients with coronavirus disease 2019 (COVID-19). This prospective case–control study included 91 patients with confirmed COVID-19, of whom 51 had severe-critical disease with pneumonia and 40 had mild disease without pneumonia, as well as 39 healthy controls. Vital signs, including body temperature, pulse rate, respiratory rate, oxygen saturation, and blood pressure, were recorded. Biochemical parameters such as complete blood count, D-dimer, ferritin, creatinine, urea, and high-sensitivity cardiac troponin T were analyzed. Serum HIF-1α levels were measured using ELISA. Median HIF-1α levels were 132.9 pg/mL (IQR: 131.7–138.0) in the severe-critical disease group, 137.35 pg/mL (IQR: 131.65–152.75) in the mild disease group, and 136.6 pg/mL (IQR: 132.2–162.2) in controls. Significant differences were observed between groups (p = 0.012). ROC analysis showed a discriminatory performance for HIF-1α, with a sensitivity of 89.01% and specificity of 35.90% at a cut-off value of ≤154 pg/mL for distinguishing mild disease from controls, and a sensitivity of 86.3% and specificity of 42.5% at a cut-off value of ≤141.1 pg/mL for distinguishing severe-critical disease from mild disease. HIF-1α levels decreased with increasing disease severity. HIF-1α levels were found to be associated with disease severity; however, the low AUC values indicate that this parameter has limited discriminative ability for clinical use when used alone.
1. Introduction
Severe acute respiratory syndrome coronavirus SARS-CoV-2, an RNA virus belonging to the same family as Middle East respiratory syndrome coronavirus (MERS-CoV) and SARS-CoV, first emerged in Wuhan, China’s Hubei Province. The virus rapidly spread throughout China, triggering a pneumonia outbreak before expanding globally. Given its high transmission rate, the World Health Organization (WHO) designated the disease as coronavirus disease 2019 (COVID-19) and classified it as a pandemic [1,2].
SARS-CoV-2 is transmitted via inhalation of infected respiratory droplets generated by coughing or sneezing, as well as through contact with oral, nasal, and ocular mucosa. Symptoms typically appear between 2 and 14 days following exposure to the virus, a timeframe referred to as the “window period”. The period of the body’s response to the antigenic attack of the virus ranges from 2 to 14 days, and during this period, viral transmission cannot be effectively controlled [3]. The clinical spectrum of COVID-19 can range from asymptomatic infection or mild influenza-like symptoms to severe pneumonia, respiratory failure, and multiorgan dysfunction. While approximately 80–90% of COVID-19 cases are asymptomatic or present with mild flu-like symptoms, about 10% progress to severe dyspnea accompanied by widespread radiological involvement of the lung parenchyma. The rate of seriously ill COVID-19 patients is around 5%, with these patients at risk for respiratory failure, multiple organ failure, and acute respiratory distress syndrome [1]. In addition, some patients with respiratory failure might develop hypoxia without obvious symptoms of respiratory distress, a condition known as “silent hypoxia”. Hypocapnia due to compensatory hyperventilation may also occur in these patients [4].
Following entry through the upper respiratory tract, SARS-CoV-2 progresses to the lung alveoli, binds to the ACE2 receptor via its S protein to enter cells, and begins to replicate rapidly. The severity of disease in certain patients is associated with decreased peripheral blood lymphocyte counts and increased levels of various cytokines such as IL-6, IL-10, IL-2, and IFN-γ [5]. In these patients, cytokine release syndrome might develop due to the developing cytokine storm, leading to pulmonary tissue damage [6,7].
This pulmonary tissue damage may contribute to tissue hypoxia, a key feature of severe COVID-19. Hypoxia is a physiological stress condition characterized by insufficient oxygen at the cellular level and the inability to meet metabolic demands. Hypoxia-inducible factors (HIF), whose levels are regulated in response to hypoxic stimuli, were first identified during studies on erythropoietin gene expression. HIF-1 senses oxygen levels in peripheral tissues and regulates transcriptional programs, functioning as a key regulator of cellular responses under hypoxic conditions [8]. Due to these molecular changes, oxidative metabolism is replaced by glycolysis, and oxygen consumption decreases, enabling cells to maintain vital functions and adapt to stress [9]. HIF-1, a heterodimeric transcription factor widely present in human and mammalian tissues, consists of two subunits: (i) the HIF-1β subunit and (ii) the oxygen-regulated HIF-1α subunit. Three oxygen-regulated HIF-1α isoforms have been described: HIF-1α, HIF-2α, and HIF-3α [10,11]. Studies have also revealed that hypoxia triggers inflammation and that IL-6 levels, in particular, are elevated [10,11,12].
HIF-1 is involved in sensing cellular oxygen levels and facilitating adaptation to hypoxic conditions by inducing glycolytic enzymes, including hexokinase 2, triosephosphate isomerase, glucose-6-phosphate isomerase, and pyruvate kinase M2 [13]. During hypoxic adaptation, HIF-1 modulates glycolysis and stimulates the production of specific pro-inflammatory cytokines (IL-1β, IL-6, and IL-10) [14]. It also regulates vascular endothelial growth factor (VEGF) transcription and supports tissue oxygenation during hypoxia through the regulation of angiogenesis [13]. SARS-CoV-2, the causative agent of COVID-19, gains entry into cells by binding its spike protein to angiotensin-converting enzyme 2 (ACE2) receptors in the lung alveoli. These mechanisms thus suggest a possible interaction between hypoxia-related pathways, ACE2 regulation, and the clinical severity of COVID-19 [15]. In the hypoxic environment observed during COVID-19, ACE1, a component of the renin–angiotensin–aldosterone system (RAAS), is upregulated by HIF-1α, whereas ACE2 expression is significantly reduced [13]. Under normoxic conditions, the RAAS system and the expression of ACE1 and ACE2 remain balanced; however, in chronic hypoxia, HIF-1α levels increase, leading to increased ACE1 and decreased ACE2 expression [16]. Understanding these underlying mechanisms is key to clarifying the link between hypoxia-related pathways and COVID-19 severity.
Therefore, this study aimed to assess serum HIF-1α levels in COVID-19 patients with and without pneumonia, compare these levels with those of healthy controls, and explore their association with disease severity.
2. Methods
2.1. Study Design
Participants were recruited from patients presenting to the Emergency Department (ED) of Kafkas University Health Research and Application Hospital between June and September 2020. The study population included patients presenting with symptoms of upper respiratory tract infection or pneumonia, as well as those evaluated for other reasons in the ED. COVID-19 diagnosis was established based on thoracic computed tomography findings, and polymerase chain reaction (PCR) testing was performed using oral or nasal swab samples. The study protocol was explained to all participants, and written informed consent was obtained prior to data collection.
Clinical evaluation was performed in accordance with the Clinical Management of COVID-19: living guideline published by the WHO on 27 May 2020. Patients’ vital signs, including body temperature, heart rate (HR), respiratory rate (RR), oxygen saturation (SpO2), systolic blood pressure (SBP), and diastolic blood pressure (DBP), were recorded on presentation to the ED. Based on this guideline, patients were classified into the severe-critical disease group (Group II) and the mild disease group (Group III) [17].
Healthy Control Group
The control group (Group I) included healthy individuals without known chronic disease, who were not taking regular medication, had not experienced any infectious disease during the previous few weeks, presented to the ED with non-infectious complaints, and were discharged with normal test results, as well as hospital staff [18].
Individuals with liver and kidney failure, acute pulmonary embolism, inflammatory disease, pregnancy, chronic obstructive pulmonary disease, malignancy, asthma, or cerebrovascular disease were excluded from the study.
This study analyzed data from 130 participants divided into three groups: 51 patients in the severe-critical disease group, 40 in the mild disease group, and 39 healthy controls.
Severe-Critical Disease Group (Group II)
Patients admitted to the ED with symptoms suggestive of pneumonia and meeting the WHO criteria for severe to critical COVID-19 according to the Clinical Management living guideline published on 27 May 2020 were assigned to this group. Severe disease was characterized by clinical signs of pneumonia, including fever, cough, dyspnea, and tachypnea, together with at least one of the following: respiratory rate greater than 30 breaths/min, severe respiratory distress, or SpO2 below 90% on room air. Unilateral or bilateral opacities on chest imaging, including radiography, CT, or lung ultrasound, were also considered supportive findings [17,19].
Mild Disease Group (Group III)
Patients presenting to the ED with symptoms suggestive of COVID-19 and fulfilling the WHO criteria for mild disease according to the Clinical Management of COVID-19 living guideline published on 27 May 2020 were assigned to this group. Mild COVID-19 was characterized by symptoms such as fatigue, fever, loss of appetite, dyspnea, and myalgia. Nonspecific symptoms, including runny nose (rhinorrhea), headache, sore throat, nausea, vomiting, and diarrhea, could also be present. Loss of taste (ageusia) or smell (anosmia) might precede respiratory symptoms. These patients had no evidence of COVID-19-related pneumonia or hypoxia [17,19].
2.2. Analyses of Laboratory Parameters
2.2.1. Blood Samples
Blood samples were collected by venipuncture after written informed consent was obtained, at the time of the patients’ initial presentation to the ED and before the initiation of any treatment, including corticosteroid therapy or oxygen supplementation. Each participant provided 10 mL of blood: 5 mL as whole blood and 5 mL in gel biochemistry tubes for laboratory analysis. Blood samples were drawn into appropriate collection tubes according to the planned analyses: EDTA-containing tubes for complete blood count analysis, sodium citrate tubes for D-dimer measurement, and serum separator gel tubes with clot activator tubes for routine biochemical analyses and serum collection. Complete blood count parameters were analyzed immediately (details are provided below). The remaining blood samples were centrifuged at 1600× g for 15 min at 4 °C. This process was repeated until the plasma and serum samples became clear. Serum samples were used for routine biochemical testing, and the remaining serum was aliquoted into microcentrifuge tubes (Fıratmed, Ankara, Türkiye) and stored at −80 °C until enzyme-linked immunosorbent assay (ELISA) analysis.
2.2.2. Routine Laboratory Analyses
Routine laboratory evaluation at ED presentation comprised complete blood count parameters, D-dimer, ferritin, high-sensitivity cardiac troponin T (hs-cTnT), urea, creatinine, and C-reactive protein (CRP), aspartate aminotransferase (AST), alanine aminotransferase (ALT), and lactate dehydrogenase (LDH).
The reference ranges for hematological parameters were as follows: white blood cell count, 3.7–10.4 × 10⁹/L; neutrophil count, 1.8–7.8 × 10⁹/L; hemoglobin, 10.8–15.1 g/dL; lymphocyte count, 0.9–3.7 × 10⁹/L; and platelet count, 149–371 × 109/L. The reference ranges for biochemical parameters were as follows: urea, 17–43 mg/dL; creatinine, 0.67–1.17 mg/dL; CRP, 0–0.5 mg/L; D-dimer, <250 ng/mL; ferritin, 20–500 ng/mL for men and 20–200 ng/mL for women; hs-cTnT, 0–14 pg/mL; AST, 0–50 U/L; ALT, 0–50 U/L; and LDH, 135–225 U/L.
2.2.3. ELISA Administration
Serum HIF-1α levels were measured using a Human Hypoxia Inducible Factor-1α ELISA Kit (E-EL-H6066; Elabscience, Houston, TX, USA); detection range: 62.5–4000 pg/mL), following the manufacturer’s protocol.
2.3. Statistical Analysis
The Shapiro–Wilk test was used to assess the normality of data distribution. Because the data were not normally distributed, non-parametric statistical methods were applied. Descriptive statistics were presented as median and minimum–maximum values. Between-group comparisons were performed using the Mann–Whitney U test for two-group comparisons and the Kruskal–Wallis H test for comparisons among three groups. When significant differences were detected, Dunn–Bonferroni post hoc tests were applied. Correlations between variables were assessed using Spearman’s rho correlation coefficient. Categorical variables were presented as frequencies and percentages and compared using Pearson’s chi-square test. Furthermore, as HIF-1α levels exhibited a skewed distribution and the assumption of homogeneity of variance was not met, a Generalized Linear Model (GENLIN) was employed to evaluate intergroup differences while adjusting for age and gender. The model utilized a Gamma distribution with a log-link function. Parameter estimates were evaluated using the Wald test, and results were reported as coefficients (B), standard errors (SE), and exponential coefficients [Exp(B)] with 95% confidence intervals. Multiple comparisons for the group variable were performed using Bonferroni correction and interpreted via estimated marginal means. Receiver operating characteristic (ROC) analysis was performed to evaluate the discriminatory performance of HIF-1α and to determine optimal cut-off values. Youden’s J statistic was used to identify the optimal threshold. Statistical analyses were conducted using MedCalc (v.22.016) and SPSS (v.25). A p-value < 0.05 was considered statistically significant.
2.4. Ethical Approval
The study was conducted in accordance with the Declaration of Helsinki. Ethical approval was obtained from the Ethics Committee of Pamukkale University. Written informed consent was obtained from all participants.
3. Results
130 participants were enrolled in the study: 40 in the mild disease group, 51 in the severe-critical disease group, and 39 healthy controls. Gender distribution was similar across all groups (Table 1, p = 0.188).
Table 1.
Distribution of disease and control groups by gender.
Age differed significantly across the groups, with Group II being older than both Group I and Group III, while Groups I and III showed no significant difference in age (p < 0.001). When it comes to body temperature, Group I had significantly lower body temperature values than both Group II and Group III, whereas temperature readings were similar between Groups II and III (p < 0.001). Heart rate also differed significantly across groups. Patients in Group I had significantly lower heart rates than those in Group II, while no significant difference in heart rate was found between Group III and either Group I or Group II (p = 0.026). A significant difference in oxygen saturation was observed among the groups (p = 0.001). Post hoc analysis indicated that Group II had significantly lower saturation levels than Group III, whereas Group I showed no significant differences from either group. No significant differences were evident in RR or blood pressure parameters (SBP and DBP) among the groups (Table 2).
Table 2.
Clinical and demographic data of the groups.
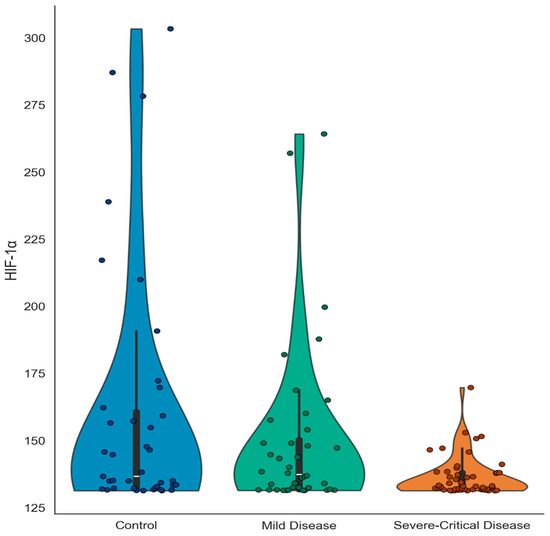
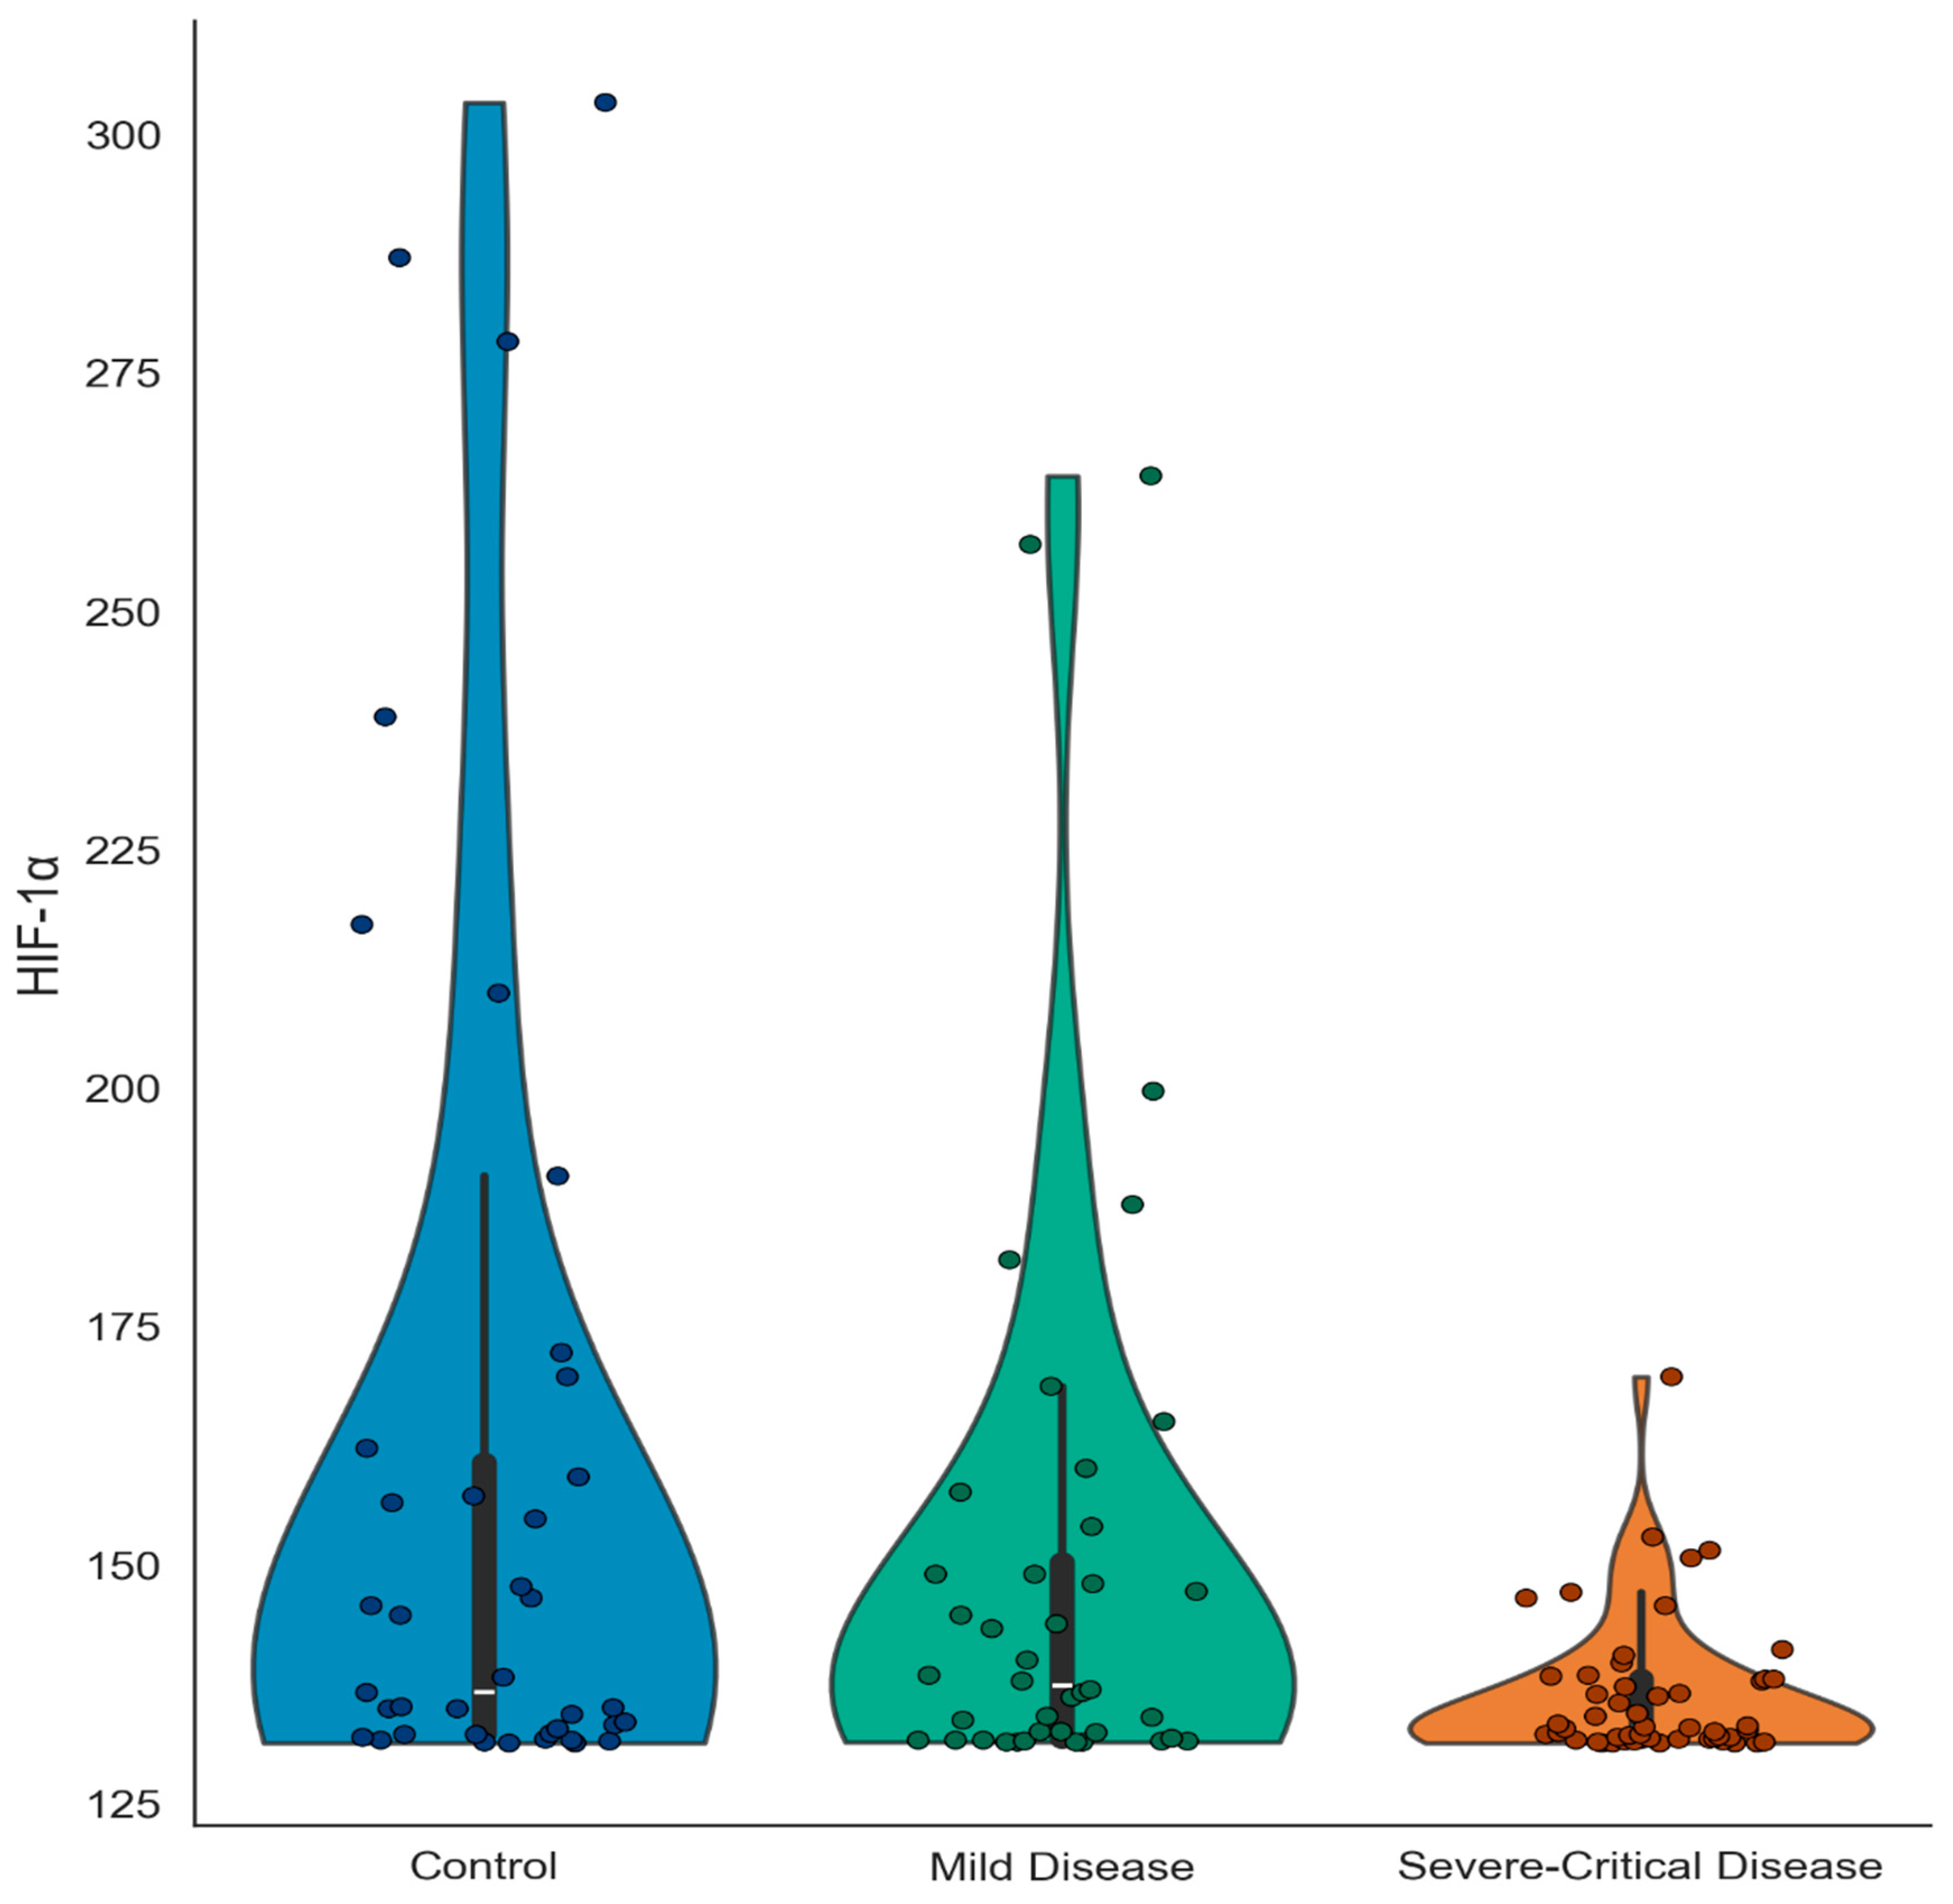
Serum HIF-1α concentrations differed significantly across groups (Table 3 and Figure 1). Median (range) values were as follows: 136.60 pg/mL (131.30–303.40) for the healthy controls, 132.90 pg/mL (131.30–169.70) for the severe-to-critical group, and 137.35 pg/mL (131.40–264.20) for the mild disease group. Significantly reduced HIF-1α levels were observable in Group II compared with Groups I and III (p = 0.012). Subsequent pairwise analysis confirmed higher HIF-1α values in Group I than in Group II (p = 0.016).
Table 3.
Serum HIF-1α levels of the groups.
Figure 1.
Violin plots showing the distribution of serum HIF-1α levels in control, mild, and severe/critical COVID-19 groups.
When comparing laboratory values between the mild disease (Group III) and the severe-critical disease (Group II) groups, significant differences between these two groups were found in eight parameters, including hemoglobin, CRP, ferritin, D-dimer, urea, hs-cTnT, AST, and LDH levels (Table 4).
Table 4.
Laboratory parameters of the clinical severity subgroups.
The correlation between serum HIF-1α levels and clinical and laboratory parameters is presented in Table 5. No significant correlations were detected between HIF-1α levels and other biochemical parameters in any of the study groups.
Table 5.
Correlations between HIF1α levels and laboratory and clinical parameters.
The Generalized Linear Model (Gamma distribution, log-link) was statistically significant overall (LR χ2(4) =19.240, p = 0.001). A significant effect of the group variable on HIF-1α levels was observed (LR χ2(2) =15.657, p < 0.001). In the model adjusted for age and gender, HIF-1α levels were significantly lower in the severe-critical group compared to the control group (B = −0.157, SH = 0.047, Wald χ2(1) = 10.967, p = 0.001, Exp(B) = 0.855, %95 CI [0.779–0.938]). Pairwise comparisons revealed that the severe/critical disease group had significantly lower HIF-1α levels than both the control (p = 0.006) and mild disease (p = 0.023) groups, whereas no significant difference was found between the mild disease and control groups (p = 0.872). Neither gender (p = 0.358) nor age (p = 0.776) contributed significantly to the model (Table 6).
Table 6.
Evaluation of HIF-1α levels using a generalized linear model (Gamma distribution, log-link).
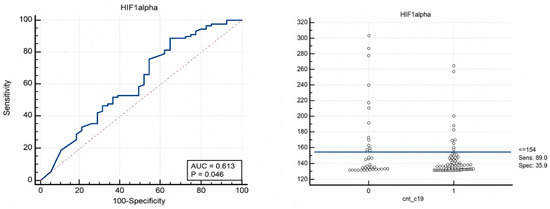
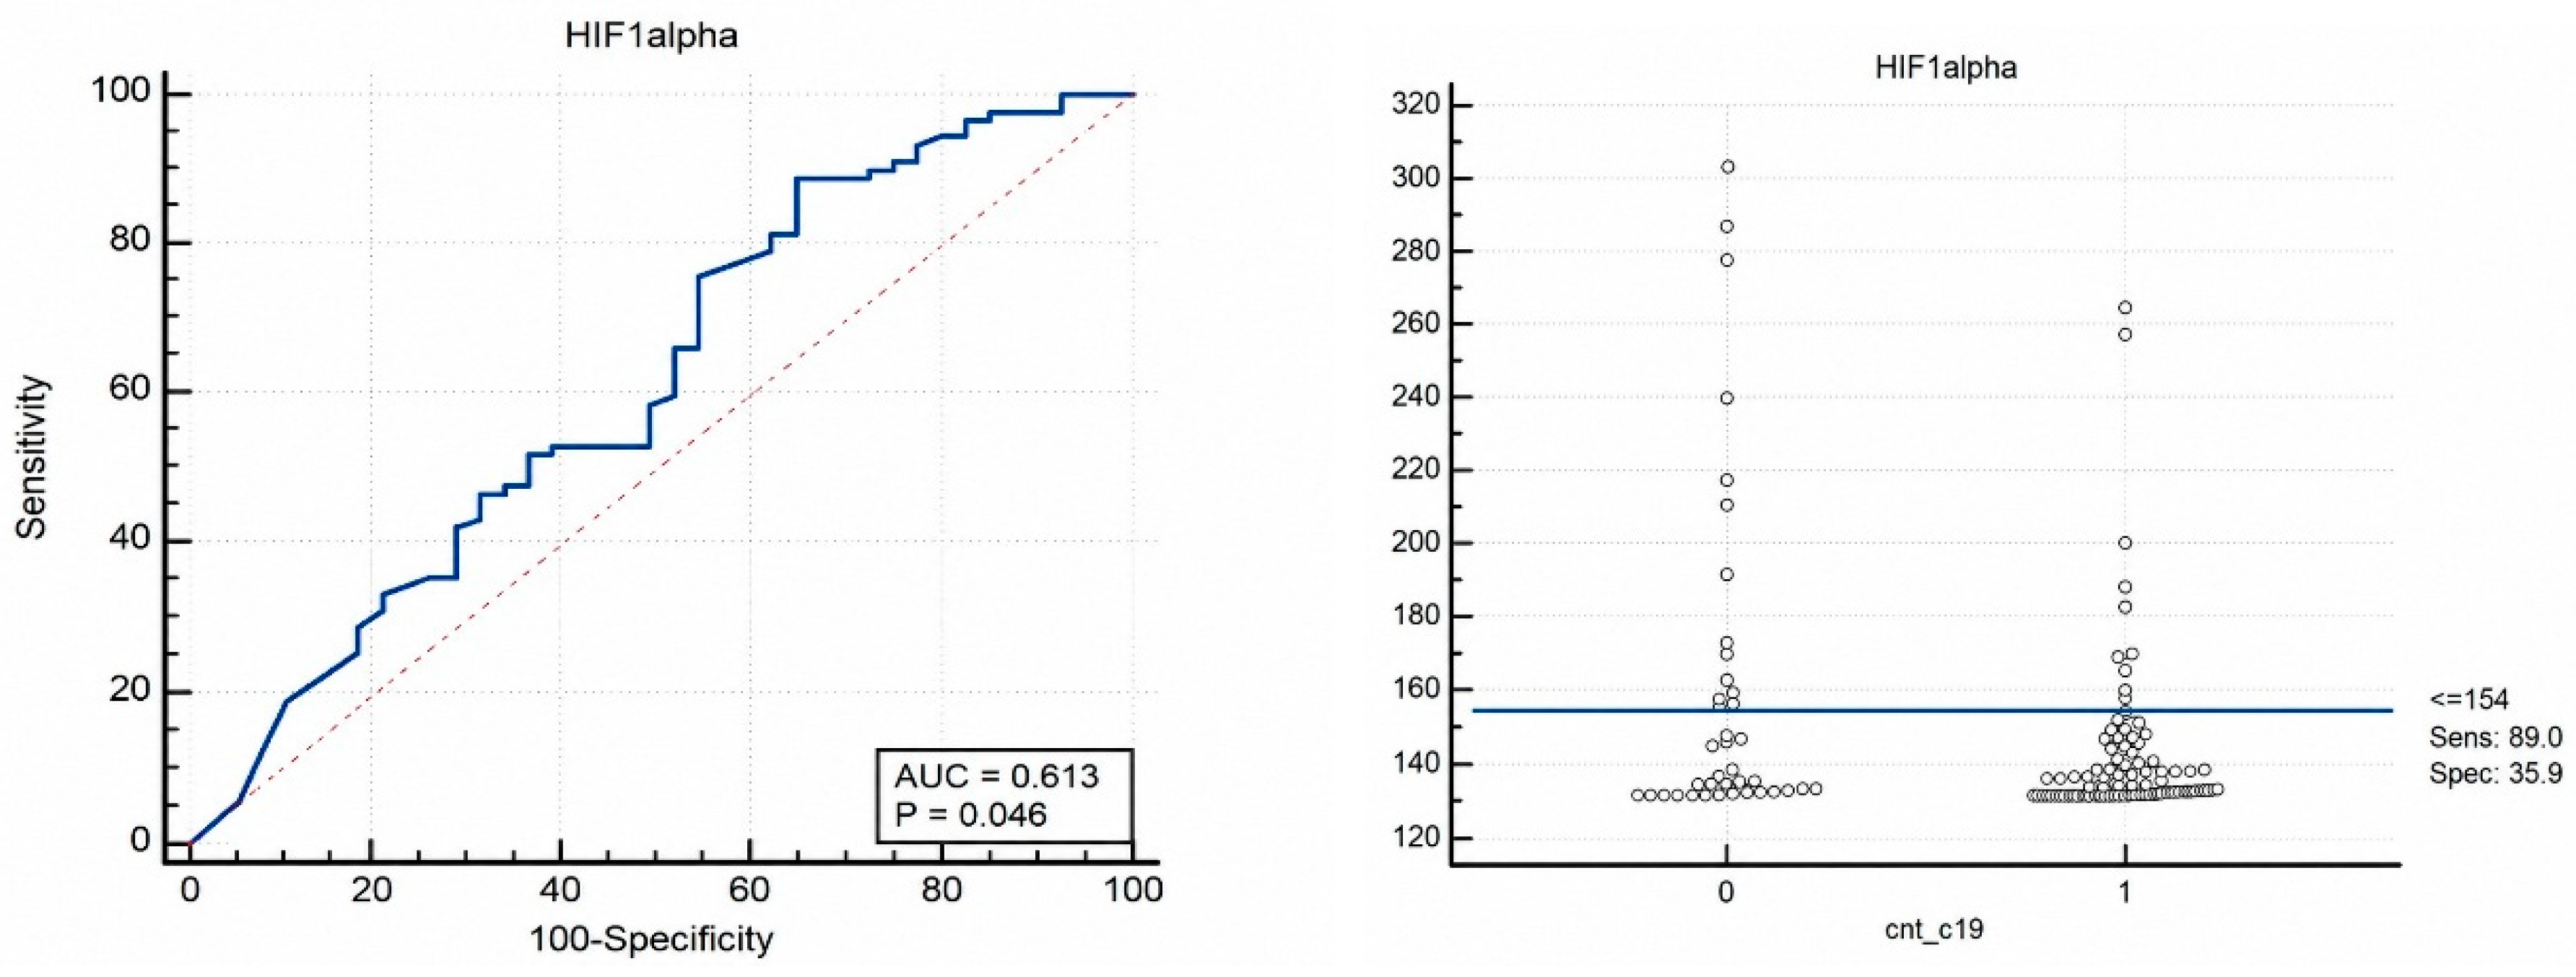
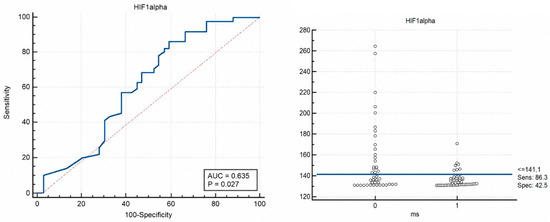
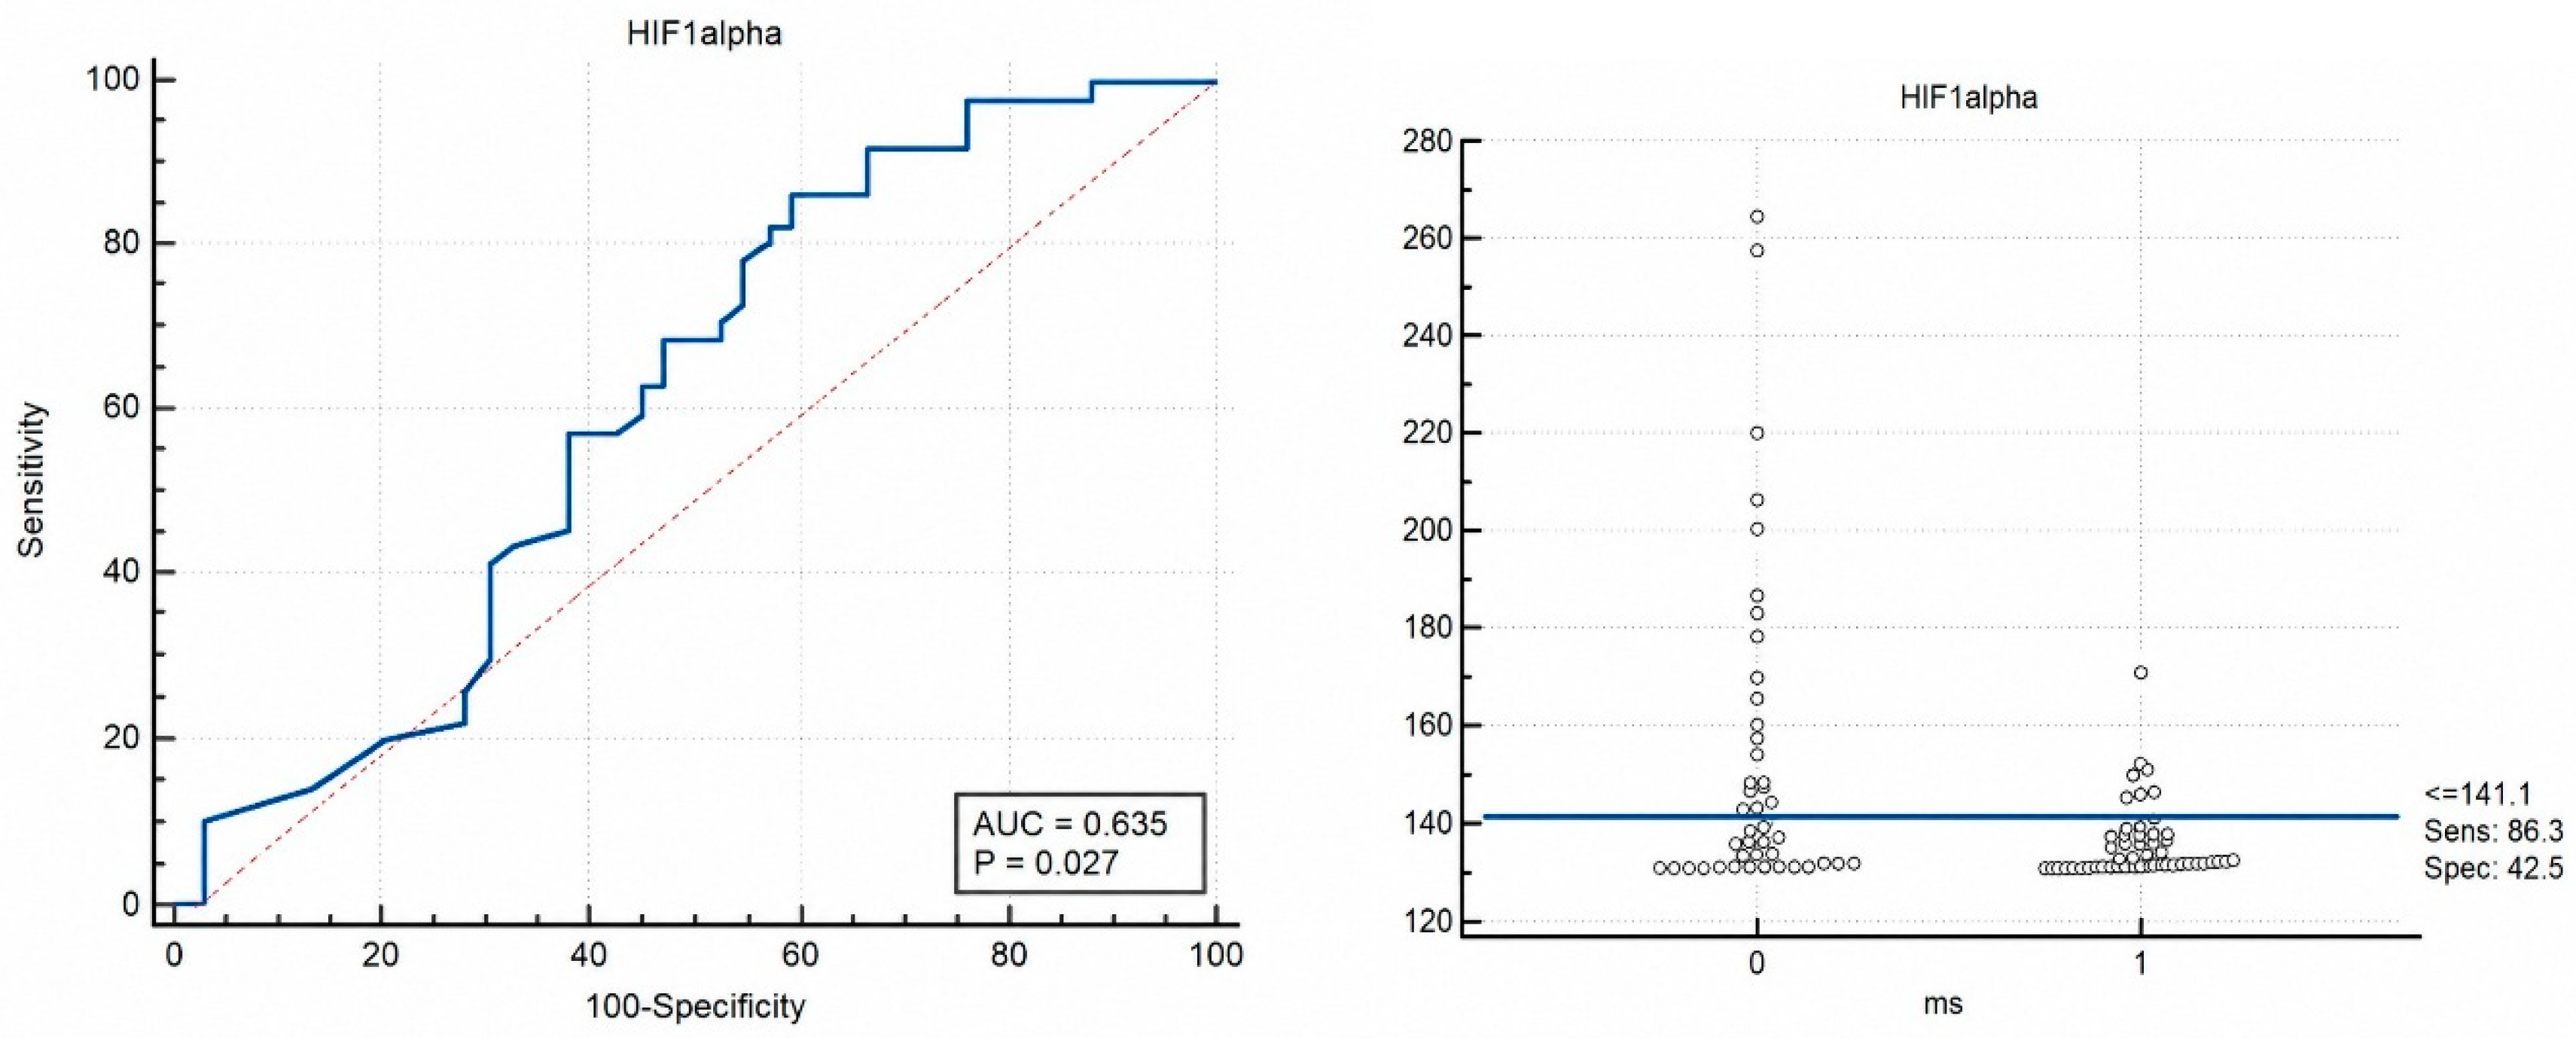
ROC analysis was performed to determine the optimal cut-off value of HIF-1α levels for distinguishing between the control and patient groups. The optimal HIF-1α cutoff value for discriminating between Group I and Group III was ≤154 pg/mL, with a sensitivity of 89.01% and a specificity of 35.90%. The area under the curve (AUC) was 0.61 (p = 0.046; 95% CI: 0.52–0.70). A cutoff value of ≤141.1 pg/mL for HIF-1α distinguished Group II from Group III, with a sensitivity of 86.3% and a specificity of 42.5%. The AUC for this comparison was 0.63 (p = 0.027; 95% CI: 0.52–0.73) (Table 7). The corresponding ROC curves for these comparisons are presented in Figure 2 and Figure 3.
Table 7.
HIF-1α levels in control and disease groups according to ROC analysis.
Figure 2.
ROC curve for Group I (control group) and Group III (mild disease group), demonstrating the diagnostic performance of HIF-1α levels in distinguishing between the two groups (AUC = 0.61).
Figure 3.
ROC curve for Group III (mild disease group) and Group II (severe–critical disease group), demonstrating the diagnostic performance of HIF-1α levels in differentiating disease severity (AUC = 0.63).
4. Discussion
In this study, we evaluated the clinical significance of serum HIF-1α levels in patients with confirmed COVID-19 and their association with disease severity. Serum HIF-1α levels tended to decrease as disease severity increased. Although levels were similar between healthy controls and patients with mild disease, lower values were observed in patients with severe-critical COVID-19. Inflammatory and biochemical markers, including CRP, D-dimer, ferritin, urea, and hs-cTnT, were also higher in severe-critical cases than in mild cases. These findings suggest that circulating HIF-1α levels can reflect the severity of hypoxia-related pathophysiological processes in COVID-19 and provide additional information when evaluated together with inflammatory markers.
The global pandemic of COVID-19 caused by SARS-CoV-2 represents one of the most significant public health crises in recent history. Although most patients experience asymptomatic or mild to moderate disease, severe cases might develop respiratory failure and hypoxia [15,17]. Hypoxia is a key component of COVID-19 pathophysiology and activates hypoxia-related signaling pathways, most notably HIFs, which regulate cellular adaptation to low oxygen levels [20]. HIFs regulate cellular metabolic adaptation under low oxygen conditions by promoting glycolysis, angiogenesis, and inflammatory signaling pathways. Among these factors, HIF-1α has been identified as a key regulator of the cellular response to hypoxia in COVID-19 [20,21].
Epidemiological studies have suggested that populations living at high altitude could have lower susceptibility to SARS-CoV-2 infection and milder clinical responses. This pattern has been linked to physiological and environmental adaptations to chronic hypoxia. Reduced ACE2 expression under chronic hypoxic conditions has also been proposed as a mechanism that might limit viral entry into host cells and reduce the risk of severe COVID-19 [22]. In addition, HIF-1α in COVID-19 appears to have a complex role, potentially supporting protective hypoxic adaptation while also being associated with endothelial injury during disease progression [15,20]. In this context, the altitude at which the present study was conducted should be considered when interpreting the findings, as chronic hypoxia-related adaptation may have influenced circulating HIF-1α levels.
Several lines of evidence indicate that HIF-1α expression HIF-1α expression is increased in severe COVID-19 cases and attributed this increase to the induction of proinflammatory responses during infection [21,23]. Elevated cytosolic and nuclear HIF-1α levels have also been observed in neutrophils from critically ill patients requiring intubation and intensive care support [14]. In contrast, other studies have reported decreased serum HIF-1α levels accompanied by elevated ferritin levels in patients with confirmed COVID-19 compared with controls, with these parameters showing a negative correlation. This pattern points to altered iron metabolism in COVID-19, characterized by high ferritin, low HIF-1α, and reduced hephaestin levels, which might have potential value in risk stratification and treatment approaches [24]. Moreover, higher ferritin levels have been associated with severe disease compared with mild-to-moderate cases, indicating ferritin as a potential marker of disease severity [25]. These apparently conflicting findings can be explained by differences between intracellular/tissue expression and circulating serum levels of HIF-1α.
Although the role of hypoxia in severe COVID-19 is well documented, the clinical interpretation of circulating HIF-1α remains complex. Intracellular HIF-1α primarily functions as an oxygen-sensitive transcription factor that regulates cellular adaptation to hypoxia, angiogenesis, metabolism, and inflammatory signaling pathways [26,27]. In contrast, serum HIF-1α could represent passive release from injured cells, extracellular shedding, or protein turnover rather than direct transcriptional activity. Therefore, circulating serum HIF-1α levels should be interpreted as a systemic marker of hypoxia, inflammation, and cellular damage rather than as a biologically functional mediator itself [26]. In this context, the serum HIF-1α levels measured in the present study can provide information about systemic hypoxia-related processes in COVID-19.
In the present study, HIF-1α levels were similar between healthy controls and patients with mild COVID-19 but tended to be lower in patients with severe-critical disease. Severe-critical cases also showed lower HIF-1α levels and higher ferritin levels than mild cases. However, the difference in HIF-1α levels between mild and severe–critical groups did not reach statistical significance, indicating that the clinical discriminatory value of this biomarker appears to be limited. Several studies have reported increased HIF-1α expression in severe COVID-19 cases [28,29]. However, these studies mainly evaluated intracellular or tissue expression, whereas the present study measured circulating serum HIF-1α levels. This distinction highlights the complex and context-dependent role of HIF-1α in COVID-19 [26]. Differences in study design, patient populations, and timing of sampling can explain these discrepancies to a certain extent. Additionally, the observed decrease in circulating HIF-1α may be related to the biphasic hypoxic response. During the acute phase of hypoxia (2–24 h), HIF-1α and HIF-2α are simultaneously elevated, whereas in the chronic phase (>24 h), HIF-2α becomes predominant as HIF-1α levels decline [30]. This pattern could partly explain the lower circulating HIF-1α levels observed in our study. It is also possible that excessive ACE1 upregulation secondary to reduced ACE2 expression during the early stages of COVID-19 contributes to decreased HIF-1α levels [15,31].
The relatively low AUC values in our findings suggest that the clinical utility of HIF-1α as a standalone biomarker may be limited. However, HIF-1α still seems to reflect underlying hypoxia-related pathophysiological processes in COVID-19 [26]. Given this biological relevance, the combined evaluation of HIF-1α and ferritin could offer additional insight into the interaction between hypoxic signaling and altered iron metabolism in severe COVID-19. Circulating HIF-1α levels might be involved in systemic hypoxic stress and hypoxia-driven cellular responses during severe COVID-19.
COVID-19 is also characterized by alterations in vital signs and routine laboratory parameters. Fever, tachycardia, and increased respiratory rate are commonly observed, particularly in severe cases with pulmonary involvement. In these patients, inflammatory markers such as CRP and procalcitonin are often elevated, while increased D-dimer levels are consistent with hypercoagulability and secondary hyperfibrinolysis. Although leukocyte counts may remain within normal limits, lymphopenia is frequently associated with cytokine storm. Elevated levels of LDH and AST can also indicate tissue injury or liver damage [18].
In severe COVID-19, oxygen homeostasis is disrupted due to tissue hypoxia. Under hypoxic conditions, the conversion of pyruvate to lactate in the glycolytic pathway increases, resulting in elevated LDH production. Apoptosis-related cellular damage can also increase LDH release into the bloodstream. Hypoxia-related signaling pathways involving HIF and NF-κB have also been linked to LDH elevation [32]. In line with these findings, our analysis showed higher AST and LDH levels in patients with severe–critical disease, whereas HIF-1α levels tended to decrease in this group. This pattern could be explained by the combined effects of hypoxia and cytokine storm, which increase tissue damage and oxygen demand in severe COVID-19. HIF-1α has also been investigated in several hypoxia-related diseases other than COVID-19. Increased HIF-1α levels have been reported in conditions such as COPD and acute myocardial infarction, further supporting the involvement of HIF-1α in hypoxia-related pathophysiological processes [33,34].
This study has several limitations. The primary limitation lies in the relatively limited sample size, which restricts the generalizability of the findings. In addition, all participants lived at the same altitude, approximately 1750 m, which prevented assessment of the potential effects of different altitude levels on the findings. Another limitation is that HIF-1α levels were measured only at the time of the patients’ initial presentation to the ED; therefore, changes in HIF-1α levels during disease progression and treatment could not be assessed. Moreover, although the incubation period of COVID-19 is known, the onset of symptoms varies among individuals, which could have influenced the measured HIF-1α levels. Finally, ferritin levels can differ by sex; however, sex-based differences were not analyzed separately in the present study. Future studies with larger sample sizes and longitudinal HIF-1α measurements are needed to clarify its role in COVID-19.
5. Conclusions
In COVID-19, serum HIF-1α levels tended to decrease with increasing disease severity, whereas ferritin, LDH, AST, and D-dimer levels were higher in severe-critical cases. These findings thus support the relevance of HIF-1α to the underlying hypoxia-related mechanisms of severe COVID-19. These results further suggest that hypoxia-related signaling pathways involving HIF-1α might be involved in the pathophysiology of severe COVID-19. Although HIF-1α seems to have adjunctive clinical utility as a disease severity marker, its standalone clinical applicability may be limited due to the relatively low AUC values observed in the ROC analysis.
Author Contributions
Conceptualization, E.K. and E.E.T.; Methodology, H.C. and O.C.; Validation, E.K., D.E., E.E.T. and O.K.; Formal analysis, H.C., R.S. and A.K.; Investigation, H.C. and O.C.; Resources, H.C. and R.S.; Visualization, H.C., R.S., D.E., E.E.T. and O.K.; Supervision, H.C. and R.S.; Project administration, H.C. and R.S.; Writing—original draft preparation, H.C.; Writing—review and editing, H.C., R.S. and A.K.; Funding acquisition, H.C. and R.S. All authors have read and agreed to the published version of the manuscript.
Funding
This research received no external funding.
Institutional Review Board Statement
The study was conducted according to the guidelines of the Declaration of Helsinki and approved by the Ethics Committee of Pamukkale University (approval number: 60116787-020/34125; approval date: 9 June 2020).
Informed Consent Statement
Informed consent was obtained from all subjects involved in the study.
Data Availability Statement
The data that support the findings of this study are available on request from the corresponding author.
Conflicts of Interest
Author Dogan Ercin was employed by the Ford Otosan Golcuk Company. The remaining authors declare that the research was conducted in the absence of any commercial or financial relationships that could be construed as a potential conflict of interest.
References
- Pascarella, G.; Strumia, A.; Piliego, C.; Bruno, F.; Del Buono, R.; Costa, F.; Scarlate, S.; Agro, F.E. COVID-19 diagnosis and management: A comprehensive review. J. Intern. Med. 2020, 288, 192–206. [Google Scholar] [CrossRef] [Scilit]
- Ciotti, M.; Ciccozzi, M.; Terrinoni, A.; Jiang, W.C.; Wang, C.B.; Bernardini, S. The COVID-19 pandemic. Crit. Rev. Clin. Lab. Sci. 2020, 57, 365–388. [Google Scholar] [CrossRef] [Scilit]
- Esakandari, H.; Nabi-Afjadi, M.; Fakkari-Afjadi, J.; Farahmandian, N.; Miresmaeili, S.M.; Bahreini, E. A comprehensive review of COVID-19 characteristics. Biol. Proced. Online 2020, 22, 19. [Google Scholar] [CrossRef] [Scilit]
- Xie, J.; Tong, Z.; Guan, X.; Du, B.; Qiu, H.; Slutsky, A.S. Critical care crisis and some recommendations during the COVID-19 epidemic in China. Intensive Care Med. 2020, 46, 837–840. [Google Scholar] [CrossRef] [Scilit] [PubMed]
- Liu, J.; Li, S.; Liu, J.; Liang, B.; Wang, X.; Wang, H.; Li, W.; Tong, Q.; Yi, J.; Zhao, L.; et al. Longitudinal characteristics of lymphocyte responses and cytokine profiles in the peripheral blood of SARS-CoV-2 infected patients. eBioMedicine 2020, 55, 102763. [Google Scholar] [CrossRef] [Scilit]
- Li, H.; Liu, S.M.; Yu, X.H.; Tang, S.L.; Tang, C.K. Coronavirus disease 2019 (COVID-19): Current status and future perspectives. Int. J. Antimicrob. Agents 2020, 55, 105951. [Google Scholar] [CrossRef] [Scilit]
- Vellas, C.; Delobel, P.; de Souto Barreto, P.; Izopet, J. COVID-19, virology and geroscience: A perspective. J. Nutr. Health Aging 2020, 24, 685–691. [Google Scholar] [CrossRef] [Scilit]
- Biddlestone, J.; Bandarra, D.; Rocha, S. The role of hypoxia in inflammatory disease (review). Int. J. Mol. Med. 2015, 35, 859–869. [Google Scholar] [CrossRef] [Scilit] [PubMed]
- Choudhry, H.; Harris, A.L. Advances in hypoxia-inducible factor biology. Cell Metab. 2018, 27, 281–288. [Google Scholar] [CrossRef] [Scilit] [PubMed]
- Chen, P.S.; Chiu, W.T.; Hsu, P.L.; Lin, S.C.; Peng, I.C.; Wang, C.Y.; Tsai, S.J. Pathophysiological implications of hypoxia in human diseases. J. Biomed. Sci. 2020, 27, 63. [Google Scholar] [CrossRef] [Scilit]
- Zhang, H.X.; Yang, J.J.; Zhang, S.A.; Zhang, S.M.; Wang, J.X.; Xu, Z.Y.; Lin, R.Y. HIF-1α promotes inflammatory response of chronic obstructive pulmonary disease by activating EGFR/PI3K/AKT pathway. Eur. Rev. Med. Pharmacol. Sci. 2018, 22, 6077–6084. [Google Scholar]
- Dzhalilova, D.S.; Diatroptov, M.E.; Tsvetkov, I.S.; Makarova, O.V.; Kuznetsov, S.L. Expression of HIF-1α, NF-κB, and VEGF genes in the liver and blood serum levels of HIF-1α, erythropoietin, VEGF, TGF-β, 8-isoprostane, and corticosterone in Wistar rats with high and low resistance to hypoxia. Bull. Exp. Biol. Med. 2018, 165, 781–785. [Google Scholar] [CrossRef] [Scilit]
- Serebrovska, Z.O.; Chong, E.Y.; Serebrovska, T.V.; Tumanovska, L.V.; Xi, L. Hypoxia, HIF-1α, and COVID-19: From pathogenic factors to potential therapeutic targets. Acta Pharmacol. Sin. 2020, 41, 1539–1546. [Google Scholar] [CrossRef] [Scilit] [PubMed]
- McElvaney, O.J.; McEvoy, N.L.; McElvaney, O.F.; Carroll, T.P.; Murphy, M.P.; Dunlea, D.M.; Ní Choileáin, O.; Clarke, J.; O’Connor, E.; Hogan, G.; et al. Characterization of the inflammatory response to severe COVID-19 illness. Am. J. Respir. Crit. Care Med. 2020, 202, 812–821. [Google Scholar] [CrossRef] [Scilit]
- Afsar, B.; Kanbay, M.; Afsar, R.E. Hypoxia inducible factor-1 protects against COVID-19: A hypothesis. Med. Hypotheses 2020, 143, 109857. [Google Scholar] [CrossRef] [Scilit]
- Zhang, R.; Wu, Y.; Zhao, M.; Liu, C.; Zhou, L.; Shen, S.; Liao, S.; Yang, K.; Li, Q.; Wan, H. Role of HIF-1α in the regulation of ACE and ACE2 expression in hypoxic human pulmonary artery smooth muscle cells. Am. J. Physiol. Lung Cell. Mol. Physiol. 2009, 297, L631–L640. [Google Scholar] [CrossRef] [Scilit] [PubMed]
- World Health Organization. Clinical Management of COVID-19: Interim Guidance, 27 May 2020; World Health Organization: Geneva, Switzerland, 2020. Available online: https://apps.who.int/iris/handle/10665/332196 (accessed on 1 June 2020).
- Mirzaii-Dizgah, I.; Riahi, E. Salivary high-sensitivity cardiac troponin T levels in patients with acute myocardial infarction. Oral Dis. 2013, 19, 180–184. [Google Scholar] [CrossRef] [Scilit] [PubMed]
- Wan, S.; Xiang, Y.; Fang, W.; Zheng, Y.; Li, B.; Hu, Y.; Lang, C.; Huang, D.; Sun, Q.; Xiong, Y.; et al. Clinical features and treatment of COVID-19 patients in northeast Chongqing. J. Med. Virol. 2020, 92, 797–806. [Google Scholar] [CrossRef] [Scilit]
- Marchetti, M. COVID-19-driven endothelial damage: Complement, HIF-1, and ABL2 are potential pathways of damage and targets for cure. Ann. Hematol. 2020, 99, 1701–1707. [Google Scholar] [CrossRef] [Scilit]
- Codo, A.C.; Davanzo, G.G.; de Brito Monteiro, L.; de Souza, G.F.; Muraro, S.P.; Virgilio-da-Silva, J.V.; Prodonoff, J.S.; Carregari, V.C.; de Biagi Junior, C.A.O.; Crunfli, F.; et al. Elevated glucose levels favor SARS-CoV-2 infection and monocyte response through a HIF-1α/glycolysis-dependent axis. Cell Metab. 2020, 32, 437–446. [Google Scholar] [CrossRef] [Scilit]
- Arias-Reyes, C.; Zubieta-DeUrioste, N.; Poma-Machicao, L.; Aliaga-Raduan, F.; Carvajal-Rodriguez, F.; Dutschmann, M.; Schneider-Gasser, E.M.; Zubieta-Calleja, G.; Soliz, J. Does the pathogenesis of SARS-CoV-2 virus decrease at high altitude? Respir. Physiol. Neurobiol. 2020, 277, 103443. [Google Scholar] [CrossRef] [Scilit]
- Tian, M.; Liu, W.; Li, X.; Zhao, P.; Shereen, M.A.; Zhu, C. HIF-1α promotes SARS-CoV-2 infection and aggravates inflammatory responses to COVID-19. Signal Transduct. Target. Ther. 2021, 6, 308. [Google Scholar] [CrossRef] [Scilit]
- Aslan, E.S.; Aydın, H.; Tekin, Y.K.; Keles, S.; White, K.N.; Hekim, N. Association between iron metabolism and SARS-CoV-2 infection, determined by ferritin, hephaestin and hypoxia-induced factor-1 alpha levels in COVID-19 patients. Mol. Biol. Rep. 2023, 50, 2471–2478. [Google Scholar] [CrossRef] [Scilit] [PubMed]
- da Silva, F.P.G.; Matte, R.; Wiedmer, D.B.; da Silva, A.P.G.; Menin, R.M.; Barbosa, F.B.; Meneguzzi, T.A.M.; Pereira, S.B.; Fausto, A.T.; Klug, L. HIF-1α Pathway in COVID-19: A Scoping Review of Its Modulation and Related Treatments. Int. J. Mol. Sci. 2025, 26, 4202. [Google Scholar] [CrossRef] [Scilit] [PubMed]
- Semenza, G.L. Hypoxia-inducible factors in physiology and medicine. Cell 2012, 148, 399–408. [Google Scholar] [CrossRef] [Scilit] [PubMed]
- McGettrick, A.F.; O’Neill, L.A.J. The role of HIF in immunity and inflammation. Cell Metab. 2020, 32, 524–536. [Google Scholar] [CrossRef] [Scilit]
- Alfaro, E.; Díaz-García, E.; García-Tovar, S.; Zamarrón, E.; Mangas, A.; Galera, R.; López-Collazo, E.; García-Rio, F.; Cubillos-Zapata, C. Upregulated Proteasome Subunits in COVID-19 Patients: A Link with Hypoxemia, Lymphopenia and Inflammation. Biomolecules 2022, 12, 442. [Google Scholar] [CrossRef] [Scilit]
- Kaushal, K.; Kaur, H.; Sarma, P.; Bhattacharyya, A.; Sharma, D.J.; Prajapat, M.; Pathak, M.; Kothari, A.; Kumar, S.; Rana, S.; et al. Serum ferritin as a predictive biomarker in COVID-19: A systematic review, meta-analysis and meta-regression analysis. J. Crit. Care 2022, 67, 172–181. [Google Scholar] [CrossRef] [Scilit]
- Koh, M.Y.; Powis, G. Passing the baton: The HIF switch. Trends Biochem. Sci. 2012, 37, 364–372. [Google Scholar] [CrossRef] [Scilit]
- Wang, Y.; Shen, M.; Li, Y.; Shao, J.; Zhang, F.; Guo, M.; Zhang, Z.; Zheng, S. COVID-19-associated liver injury: Adding fuel to the flame. Cell Biochem. Funct. 2023, 41, 1076–1092. [Google Scholar] [CrossRef] [Scilit]
- Yan, H.; Liang, X.; Du, J.; He, Z.; Wang, Y.; Lyu, M.; Yue, L.; Zhang, F.; Xue, Z.; Xu, L.; et al. Proteomic and metabolomic investigation of serum lactate dehydrogenase elevation in COVID-19 patients. Proteomics 2021, 21, 2100002. [Google Scholar] [CrossRef] [Scilit] [PubMed]
- Rong, B.; Liu, Y.; Li, M.; Fu, T.; Gao, W.; Liu, H. Correlation of serum levels of HIF-1α and IL-19 with the disease progression of COPD: A retrospective study. Int. J. Chronic Obstruct. Pulmon. Dis. 2018, 13, 3791–3803. [Google Scholar] [CrossRef] [Scilit] [PubMed]
- Yu, Q.; Li, L.; Zhao, N. Three-dimensional echocardiography in the diagnosis of myocardial infarction and its correlation with the expressions of serum HIF-1α, HO-1 and VEGF. Eur. Rev. Med. Pharmacol. Sci. 2018, 22, 2751–2756. [Google Scholar] [CrossRef] [PubMed]

Disclaimer/Publisher’s Note: The statements, opinions and data contained in all publications are solely those of the individual author(s) and contributor(s) and not of MDPI and/or the editor(s). MDPI and/or the editor(s) disclaim responsibility for any injury to people or property resulting from any ideas, methods, instructions or products referred to in the content. |
© 2026 by the authors. Licensee MDPI, Basel, Switzerland. This article is an open access article distributed under the terms and conditions of the Creative Commons Attribution (CC BY) license.