


Abstract
This study examines two plausible pandemic scenarios, vaccine unavailability and delayed vaccination, using deterministic compartmental models calibrated to the COVID-19 pandemic in Puerto Rico. An SEIsIaHRD model for the pre-vaccination phase and an SVEIsIaHRD model (susceptible, vaccinated, exposed, symptomatic and asymptomatic infectious, hospitalized, recovered and cumulative deaths) for the vaccination phase. Each infected compartment has a single exit rate partitioned by outcome fractions, separating mean sojourn times from clinical outcome proportions. Parameters were calibrated against Puerto Rico dashboard data at two checkpoints: the first day of vaccination (15 December 2020) and the official end of the pandemic (11 May 2023). Local stability was established by Jacobian analysis, and an alternative procedure gave the basic (Ro) and vaccinated (Rv) reproduction numbers without the standard next-generation matrix method. Simulations forecast that approximately 96% of the population would be vaccinated, a cumulative 3,146,734 individuals differing from the reported figure by 0.32%, and reproduced the reported daily incidence at the pre-vaccination checkpoint to within 10.3%. A vaccine with 87% effectiveness reduced cumulative deaths from 45,124 to 5608, and long rollout delays nullify most of the benefit. With vaccination, Rv = 0.16, the disease dies out; without it, Ro = 1.22, and it becomes endemic.
1. Introduction
The coronavirus disease 2019 (COVID-19) pandemic, caused by severe acute respiratory syndrome coronavirus 2 (SARS-CoV-2), represented one of the most significant public health challenges in recent history. On 5 May 2023, the World Health Organization (WHO) declared the end of the COVID-19 Public Health Emergency of International Concern. This milestone was achieved through the coordinated efforts of international organizations, governments, academic institutions and healthcare systems worldwide. In particular, the rapid development and deployment of COVID-19 vaccines were made possible by advances in messenger RNA (mRNA) technology [1]. Despite the success of vaccination campaigns, future pandemics or resurgences of infectious diseases may occur when vaccines are not immediately available, or their distribution is delayed. Logistical challenges, including transportation disruptions, natural disasters, supply chain limitations and shortages of healthcare personnel, may prolong outbreaks and increase the numbers of infections, hospitalizations and deaths.
In Puerto Rico, the first confirmed cases of COVID-19 were reported in March 2020, prompting the implementation of several public health interventions, including mobility restrictions, testing programs, isolation measures and, subsequently, a large-scale vaccination campaign that began on 15 December 2020. The progression of the pandemic was characterized by multiple waves of infection associated with changes in social behavior, relaxation of mitigation measures, vaccine availability and the emergence of new viral variants.
Although Puerto Rico has a relatively small population (approximately 3.28 million inhabitants in 2020 [2]), it experienced substantial COVID-19-related morbidity and mortality, with heterogeneous impacts across age groups and communities. During the Omicron wave, Puerto Rico reached one of the highest reported incidences of COVID-19 worldwide in terms of daily confirmed cases per million inhabitants [3,4]. The availability of epidemiological information through public health dashboards provided valuable data for assessing disease transmission dynamics and evaluating mitigation strategies. However, an important limitation of reported COVID-19 databases is the underestimation of the true number of symptomatic infectious individuals. Limited testing capacity, changes in testing policies and underreporting can substantially affect the accuracy of case counts. Moreover, many epidemiological variables are not directly observable, among them susceptible individuals, exposed individuals in the latent period, asymptomatic infectious individuals and recovered individuals. Consequently, the numbers of vaccinated, hospitalized and deceased individuals are considered in this study to be among the most reliable quantities reported in public health dashboards.
Compartmental models provide a mathematical framework for studying the transmission dynamics of infectious diseases. One of the simplest and most widely used models is the SIR model, which consists of three compartments: susceptible (S), infectious (I) and recovered (R). The SIR framework is appropriate when infected individuals become infectious shortly after infection, and only aggregate infection and recovery data are available. When a latent period significantly influences transmission dynamics, an exposed compartment (E) can be incorporated, leading to the SEIR model, which is commonly employed to describe the spread of infectious diseases at the population level. Vaccination can be added through an additional vaccinated compartment (V), resulting in SVEIR-type models.
Compartmental models have been used extensively to describe the COVID-19 pandemic and to evaluate intervention strategies aimed at mitigating SARS-CoV-2 transmission [5,6,7,8,9,10,11,12,13,14,15]. In the case of Puerto Rico, however, only a limited number of compartmental model studies have been reported. Aponte Caraballo and Mercado Cabrera [16] developed a six-compartment model to investigate the effects of mitigation strategies on COVID-19 transmission in Puerto Rico. In addition, Cruz-Aponte and Caraballo-Cueto [17] examined the epidemiological and economic consequences associated with different mitigation measures.
Although compartmental models with six or more compartments generally provide a more realistic representation of disease dynamics, they also introduce additional mathematical complexity and parameter uncertainty [18,19,20,21,22]. Consequently, highly detailed compartmental models remain relatively scarce in the literature. In a previous study, we developed a seven-compartment model, SVEIsIaRD, to investigate the impact of vaccination during the COVID-19 pandemic in New York [23]. Recently, Shams Eddin et al. [24] compared simple and complex compartmental models for predicting COVID-19 progression and highlighted the trade-off between model realism and parameter identifiability.
The complexity of COVID-19 transmission motivates the development of more detailed frameworks that explicitly incorporate vaccination, symptomatic infections (Is), asymptomatic infections (Ia), hospitalization (H) and disease-induced mortality (D). Such models can provide a more realistic representation of pandemic evolution and help quantify the relative contributions of different epidemiological processes. In the present work, we extend the SVEIsIaRD framework [23] by introducing a hospitalized compartment (H), resulting in the eight-compartment model SVEIsIaHRD. To the best of our knowledge, this is the first eight-compartment model specifically developed to reproduce the dynamics of the COVID-19 pandemic in Puerto Rico.
Using mathematical and computational modeling, we investigate two plausible scenarios that could have occurred during the COVID-19 pandemic in Puerto Rico: (i) the absence of vaccination and (ii) delayed vaccine deployment. The first scenario is represented by the SEIsIaHRD model, whereas the second is described by the SVEIsIaHRD model, which incorporates vaccination, vaccine effectiveness and vaccine failure. Both models are calibrated using COVID-19 epidemiological data from Puerto Rico evaluated at two key checkpoints of the pandemic: the initiation of vaccination (15 December 2020) and the official end of the pandemic in Puerto Rico (11 May 2023) [25,26]. The World Health Organization ended the Public Health Emergency of International Concern on 5 May 2023, whereas the public health emergency applicable to Puerto Rico remained in force until 11 May 2023. Because this study concerns Puerto Rico specifically, the later date is adopted throughout, giving a simulation period of 1154 days from the first reported cases on 13 March 2020.
The SVEIsIaHRD model incorporates several epidemiologically relevant features, including vaccination and vaccine failure, separate symptomatic and asymptomatic infectious compartments, an explicit hospitalization compartment, COVID-19-related mortality and distinct recovery pathways. Although the model can reproduce the general trends observed in reported vaccination, hospitalization and mortality data, discrepancies between simulations and surveillance data are expected, because reported values are influenced by reporting delays, testing availability, healthcare-system capacity and changes in viral transmissibility associated with emerging variants. Neither simulations nor data posted in dashboards can reproduce exactly the evolution of a pandemic. Three vaccines were deployed in Puerto Rico during the pandemic: mRNA-1273 (Moderna), BNT162b2 (Pfizer–BioNTech) and Ad26.COV2.S (Johnson & Johnson); their effectiveness against infection, hospitalization and death has been reported by Robles-Fontán et al. [27].
Accordingly, the objectives of this study are: (i) to develop an eight-compartment SVEIsIaHRD model of the COVID-19 pandemic in Puerto Rico and to use it to investigate two epidemiologically plausible scenarios, vaccine unavailability and delayed vaccine deployment, evaluating how vaccination timing and effectiveness affect transmission dynamics; (ii) to present an alternative analytical procedure for deriving the basic and vaccinated reproduction numbers in compartmental models with two forces of infection, and to set out explicitly how compartmental model outputs should be matched to the corresponding public health dashboard fields; (iii) to perform the corresponding equilibrium, stability and sensitivity analyses of the SEIsIaHRD and SVEIsIaHRD models; and (iv) to illustrate these results through two- and three-dimensional graphical representations of compartment dynamics and of the parameter regions associated with disease extinction and endemic persistence.
Compartmental models of this kind are not the only formalism available for COVID-19 dynamics. Fractional-order and fractal-fractional formulations, which replace the integer-order derivative by an operator with memory, have been used to capture non-local effects in epidemic transmission [28], and delay-differential formulations have been used to represent awareness programs and vaccination lags explicitly [29,30]. These approaches can reproduce observed trajectories with fewer compartments, at the cost of parameters whose epidemiological interpretation is less direct. The present study deliberately retains an integer-order formulation, because each rate and each outcome fraction in Table 1 is intended to be read off from, and checked against, reported clinical and surveillance quantities for Puerto Rico.
The remainder of this paper is organized as follows. Section 2 presents the mathematical formulation of the SVEIsIaHRD model, including the system of nonlinear ordinary differential equations, the biological meaning of each equation and its parameters, the data sources used for calibration and the computational implementation. Section 3 derives the disease-free and endemic equilibrium points and analyzes their stability. Although the basic reproduction number is traditionally calculated using the next-generation matrix (NGM) approach [31,32], an alternative procedure based on stability analysis and algebraic methods is proposed that avoids the complexity associated with matrix calculations. Section 4 reports the numerical results, including model validation against reported epidemiological data, sensitivity analysis and the numerical simulations of all model compartments. Section 5 discusses the principal findings, compares the results obtained from the SVEIsIaHRD and SEIsIaHRD models, evaluates the proposed reproduction-number methodology and outlines the limitations of this study. Section 6 presents the conclusions.
2. Materials and Methods
2.1. Model Structure and Assumptions
The structure of the proposed SVEIsIaHRD compartmental model is illustrated in Figure 1. The model incorporates several epidemiologically relevant features, including vaccine effectiveness, the distinction between symptomatic and asymptomatic infectious individuals, and explicit hospitalization, recovery and COVID-19 mortality compartments.
Figure 1.
The SVEIsIaHRD compartmental model. The flowchart shows the compartments as rectangular boxes, with arrows denoting the flow of population among compartments. In Table 1, we listed the meaning of the parameters.
The total population is divided into eight epidemiological compartments: susceptible (S), vaccinated (V), exposed (E), symptomatic infectious (Is), asymptomatic infectious (Ia), hospitalized (H), recovered (R) and cumulative COVID-19 deaths (D), so that
All compartments are normalized by the total population, and for simplicity the normalized variables retain the same notation as the original compartments:
Here, is the recruitment rate. The case represents a no-recruitment scenario (border control), in which a jurisdiction enforces cross-border and travel restrictions to reduce the spread of infectious disease.
The model assumes a constant total population size during the study period; that is, natural deaths are balanced by the recruitment of susceptible individuals through births and immigration.
To evaluate the impact of vaccination on the COVID-19 pandemic in Puerto Rico, two modeling scenarios were considered. In the first scenario, a no-vaccination framework was implemented using the SEIsIaHRD model, obtained by removing the vaccinated compartment from the full SVEIsIaHRD system. In the second scenario, the pandemic was divided into two periods:
- Pre-vaccination period: from 13 March 2020 to 15 December 2020, modeled using the SEIsIaHRD system.
- Vaccination period: from 15 December 2020 to 11 May 2023, modeled using the SVEIsIaHRD system.
2.2. Model Equations
The temporal dynamics of the epidemic are governed by the system of coupled nonlinear ordinary differential equations given in Equations (1)–(8), together with the auxiliary expressions in Equations (9)–(12).
Equation (1) describes the change in the number of susceptible individuals. The susceptible population increases through recruitment (births and immigration) and decreases when individuals become infected after contact with infectious persons or when they receive vaccination. Natural mortality also reduces this compartment.
Equation (2) represents the dynamics of vaccinated individuals. The vaccinated population increases through vaccination of susceptible individuals and decreases when vaccinated individuals experience breakthrough infections, governed by the vaccine failure parameter , or through natural mortality.
Equation (3) describes individuals who have been infected but are not yet infectious. The exposed compartment increases due to new infections among susceptible and vaccinated individuals and decreases when exposed individuals progress to either the symptomatic or the asymptomatic infectious stage, or die of natural causes.
Equation (4) tracks infectious individuals who develop symptoms. The compartment increases when a fraction of exposed individuals becomes symptomatic and decreases through recovery, hospitalization, disease-induced death and natural mortality.
Equation (5) describes infected individuals requiring hospital care. The hospitalized population increases through the admission of symptomatic infectious individuals and decreases through recovery, COVID-19-related death or natural mortality.
Equation (6) represents infected individuals who do not develop symptoms but can still transmit the virus. The compartment increases when exposed individuals become asymptomatic and decreases through recovery or natural mortality.
Equation (7) represents individuals who have recovered from infection and acquired immunity. Recovery may occur from the symptomatic, asymptomatic or hospitalized states. The recovered compartment decreases through natural mortality.
Equation (8) accumulates deaths caused by COVID-19. The compartment increases through disease-induced mortality among symptomatic infectious and hospitalized individuals. Because D is cumulative, individuals do not leave this compartment.
The auxiliary quantities to denote the total outbound rates from the exposed, symptomatic infectious, asymptomatic infectious and hospitalized compartments, respectively:
Summing Equations (1)–(8) yields , so that whenever . Consequently, the solutions of Equations (1)–(8) remain in the positively invariant subset of given by
Thus all biologically feasible solutions remain within , and all state variables are non-negative and bounded for all future times.
Positivity and invariance. Because Equations (1)–(8) describe population counts, trajectories starting in the non-negative orthant must remain there. On each boundary face the corresponding derivative is non-negative: dS/dt = Λ > 0 when S = 0; dV/dt = ω1S ≥ 0 when V = 0; dE/dt = β(S + θ1V)(Is + Ia) ≥ 0 when E = 0; dIs/dt = εkE ≥ 0 when Is = 0; dIa/dt = ε(1 − k)E ≥ 0 when Ia = 0; dH/dt = (1 − k1 − k6)σsIs ≥ 0 when H = 0; dR/dt = α2Ia + k1σsIs + (1 − k7)σHH ≥ 0 when R = 0; and dD/dt ≥ 0 throughout. The vector field therefore points into the orthant on every face, so ℝ+8 is positively invariant, provided the outcome fractions satisfy 0 ≤ k ≤ 1, k1 + k6 ≤ 1 and 0 ≤ k7 ≤ 1. These inequalities hold for the values of Table 1, where k1 + k6 = 0.849 and k7 = 0.325. Combined with the bound N ≤ Λ/γ1 obtained above, every solution that starts in Ω remains in Ω for all t ≥ 0, so the model is well posed.
The same conditions guarantee positivity of the equilibrium coordinates. Because all Ti are strictly positive and 0 < k < 1, the denominator of Equation (13) is positive for every Isp ≥ 0, so Sp > 0; Equations (14)–(18) are then positive multiples of Isp. A biologically admissible endemic equilibrium therefore exists precisely when Equation (19) admits a positive root, which by Equations (27) and (28) requires Rv > 1.
In many COVID-19 compartmental models, the force of infection, , includes contributions from both symptomatic and asymptomatic infectious individuals, with asymptomatic transmission weighted by a relative infectiousness factor () that typically ranges from 0.4 to 0.6 [33]. In the present study, we set , because this choice reproduced the cumulative number of COVID-19 deaths reported in Puerto Rico throughout the pandemic.
Table 1.
Parameters of the SVEIsIaHRD compartmental model shown in Figure 1.
For the SEIsIaHRD compartmental model, the corresponding deterministic equations are obtained from the SVEIsIaHRD system by eliminating the vaccinated compartment and setting in Equations (1) and (3).
2.3. Model Parameters and Data Sources
Table 1 summarizes the parameters employed in the proposed model. Several parameters were obtained directly from the literature (, , , ), whereas others were calculated from reported data (, ). The exit rates and and the outcome fractions , and were obtained from the reported sojourn times and clinical outcome data, and verified against the epidemiological data reported by the Puerto Rico COVID-19 dashboards (Table 2). Because each infected compartment has a single disease-related exit rate ( for and for ), the parameters , and are genuine fractions of the corresponding outflow: , and partition the exit from into direct recovery, disease-induced death and hospitalization, while and partition the exit from into death and recovery.
Table 2.
Compartment populations of the SEIsIaHRD and SVEIsIaHRD models during the COVID-19 pandemic in Puerto Rico under different epidemiological scenarios. Vc denotes the cumulative number of individuals ever vaccinated, obtained from the vaccination integral of Section 2.6.
The transmission coefficient () was calibrated to reproduce the observed epidemic dynamics. Although values between 0.20 day−1 and 0.70 day−1 have been reported previously [16], a value of 0.105 day−1 provided the best agreement with the reported Puerto Rico data.
The vaccination rate () was calculated from the data reported by Robles-Fontan et al. [27]. Between 15 December 2020 and 15 October 2021, approximately 2,276,966 individuals completed the vaccination schedule over a period of 304 days, yielding an average vaccination rate of 0.005 day−1.
The vaccine failure parameter () was obtained from the vaccine effectiveness data reported in Table 1 of Robles-Fontan et al. [27], giving a weighted average value of 0.13, which corresponds to an average vaccine effectiveness of 87%.
An average incubation period of 5.2 days is the standard epidemiological value [16], so that the incubation rate is day−1.
The exit rates and and the outcome fractions , and were obtained from reported clinical sojourn times and outcome data for COVID-19 [16,35,36,37]. The two exit rates correspond to a mean sojourn time of days in the symptomatic infectious compartment and days in the hospitalized compartment, consistent with reported intervals of about 10 to 11 days from symptom onset to recovery and about 25 days to hospital discharge [16,36]. Because the two exit rates are tightly constrained by these reported sojourn times, the free parameters of the model are effectively restricted to the three outcome fractions, which substantially limits the identifiability and overparameterization concerns that arise in high-dimensional compartmental models.
It is worth noting that implies that approximately one third of hospitalized patients die. This relatively high value reflects the severity profile of hospitalized COVID-19 patients in Puerto Rico during the study period [37].
Epidemiological data on vaccinated, hospitalized, symptomatic and deceased individuals were obtained from publicly available COVID-19 dashboards for Puerto Rico [3,38]. No individual-level data were used.
Calibration. Eleven of the thirteen quantities in Table 1 were fixed independently of the Puerto Rico time series, either from the literature (γ1, ε, k, α2, Λ) or from reported clinical and vaccination data (ω1, θ1, σs, σH, k1, k6, k7). Only the transmission coefficient β was treated as a free parameter, so the calibration is a one-dimensional search rather than a multi-parameter fit. Starting from the range of 0.20–0.70 day−1 reported previously [16], β was varied downward and Equations (1)–(8) were re-solved at each value, retaining the value that reproduced the four independently reported quantities of Table 3: daily incidence and cumulative deaths on 15 December 2020, and cumulative vaccinations and cumulative deaths on 11 May 2023.
Table 3.
Validation of the model against reported dashboard data [3,38]. Each reported field is compared against the model quantity of the same kind, as described in Section 2.6. Percentage differences are expressed relative to the reported value.
The retained value, β = 0.105 day−1, is tightly constrained. Because the epidemic grows exponentially at a rate that depends on β, the model outputs are extremely steep functions of it: holding every other parameter fixed, β = 0.100 day−1 gives 281 new cases per day and 920 cumulative deaths at the first checkpoint and 2464 deaths at the second, whereas β = 0.110 day−1 gives 1470 cases per day, 2920 deaths and 12,148 deaths, respectively. A change of less than 5% in β therefore moves the simulated mortality by a factor of about five, and only values within roughly 2% of 0.105 day−1 reproduce the reported figures of 733 cases per day, 1465 deaths and 5938 deaths. In this sense, the calibration is effectively unique: no alternative value in the plausible range reproduces both checkpoints simultaneously. This steepness is also why the value obtained is below the previously reported range, since that range was estimated over the initial exponential phase rather than over the whole pandemic.
2.4. Sensitivity Analysis Method
Sensitivity analysis is a standard tool for quantifying the relative importance of model parameters in compartmental epidemic systems. In this study, we perform a local sensitivity analysis using the normalized forward sensitivity index [39,40]. For a given parameter , the normalized forward sensitivity index of the vaccinated reproduction number is defined as . This quantity measures the relative change in induced by a relative change in the parameter , thereby identifying the parameters that most strongly influence disease transmission dynamics. Sensitivity analysis results for the Puerto Rico pandemic are given in Section 4.2.
2.5. Computational Implementation
The mathematical models were implemented in Wolfram Mathematica version 14.1 [41]. Numerical solutions of the systems of differential equations were obtained with purpose-written Mathematica code using built-in ordinary differential equation solvers with adaptive step size and stiffness switching. The computational framework generated compartment trajectories throughout the pandemic periods and allowed visualization of the epidemic dynamics through two-dimensional graphs (Figure 3, Figure 4, Figure 5 and Figure 6). In addition, three-dimensional representations were produced to show the regions in which the disease dies out or becomes endemic (Figure 7 and Figure 8). All sensitivity indices were computed and visualized using the same software.
All compartments are expressed as fractions of the 2020 population of Puerto Rico (N = 3.28 × 10⁶), and every numerical calculation reported here uses the same initial conditions, specified at day zero of the simulation, 13 March 2020, the date of the first reported cases: S(0) = 0.99989, V(0) = 0, E(0) = 8 × 10⁻⁵, Is(0) = 1 × 10⁻⁵, Ia(0) = 2 × 10⁻⁵, H(0) = 0, R(0) = 0 and D(0) = 0. These initial values sum to unity, as required by the normalization.
The rationale is as follows. V(0) = 0 and D(0) = 0 are exact, since no vaccine existed and no COVID-19 death had been recorded on that date; H(0) = 0 and R(0) = 0 follow from the absence of reported hospitalizations and recoveries. The three seed values correspond to about 33 symptomatic, 66 asymptomatic and 262 exposed individuals in a population of 3.28 million, which is consistent with a handful of confirmed cases together with the undetected infections that necessarily precede them, given an incubation period of 5.2 days and the asymptomatic fraction 1 − k = 0.40 used in the model. The exact seed cannot be known for any epidemic, and it is not identifiable from later data; what it controls here is the time origin of the outbreak rather than its shape or its final size, because the trajectory rapidly approaches the exponential growth mode set by β and the remaining parameters. Multiplying the three seed values by a common factor shifts the simulated curves along the time axis without altering the peak height, the reproduction numbers or the cumulative totals, and β was calibrated against the two checkpoints with this seed held fixed.
2.6. Comparison of Model Outputs with Surveillance Data
Compartmental model outputs and public health dashboard fields are not always the same kind of quantity, and a direct numerical comparison is meaningful only when both refer to the same measure. The state variables of Equations (1)–(8) are stocks: they count how many individuals occupy a given epidemiological state at a given instant. Dashboard fields, by contrast, may be either stocks (for example, the hospital census, or a cumulative death or vaccination total) or flows (for example, the number of new confirmed cases reported per day). Comparing a stock against a flow is dimensionally inconsistent, since the two differ by a characteristic residence time.
Two consequences are relevant to the present study.
First, the symptomatic infectious compartment is a prevalence, whereas reported case counts are an incidence. The model quantity corresponding to newly reported cases is the rate at which exposed individuals become infectious. Because confirmed case counts include both symptomatic and detected asymptomatic infections, the appropriate comparator is the total incidence
with giving the symptomatic component alone. Comparing directly against a daily case count would overstate the model by approximately the mean sojourn time days.
Second, the vaccinated compartment is not the cumulative number of individuals ever vaccinated. By Equation (2), is depleted continuously by breakthrough infection and by natural mortality, so it represents those currently vaccinated and still uninfected. Public health dashboards report the cumulative number of persons who have received at least one dose, from which no individual is subtracted upon subsequent infection or death. The corresponding model quantity is therefore the time integral of the vaccination flow,
which was obtained by integrating the auxiliary equation alongside Equations (1)–(8).
The remaining comparisons require no conversion. The hospitalized compartment and the reported hospital census are both stocks, and the cumulative death compartment and the reported cumulative death total are both cumulative stocks, so these quantities are compared directly. In Table 2 and Table 3, we summarize the comparisons between simulations and data from dashboards in the case of the Puerto Rico COVID-19 pandemic.
3. Equilibria, Stability and Reproduction Numbers
3.1. An Alternative Derivation of the Vaccinated Reproduction Number
The basic reproduction number () is a fundamental threshold quantity in epidemiology. If , the disease can invade and persist in the population, whereas if , the disease-free equilibrium is locally asymptotically stable, and the infection dies out over time. For compartmental epidemic models, is typically derived using the next-generation matrix (NGM) method [31,32], which relies on the calculation of the spectral radius of the associated transmission matrix.
In this section, we introduce an alternative analytical approach to compute the vaccinated reproduction number . The method is based on the characterization of the equilibrium points and on direct algebraic manipulation of the governing system, thereby avoiding the spectral analysis required by the NGM framework. In particular, the proposed approach exploits the structure of the infection subsystem and the steady-state conditions to obtain an explicit expression for .
The endemic equilibrium points of the SVEIsIaHRD model were obtained by setting Equations (1)–(7) equal to zero. The resulting algebraic system is solved sequentially for S, Ia, E, V, H and R as functions of , giving the equilibrium point :
Substituting Equations (13)–(16) into Equation (3), previously set to zero, yields
The trivial solution of Equation (19) corresponds to the disease-free equilibrium, whereas its non-trivial roots give the endemic equilibria. The coefficients of the quadratic factor are
The solutions of the quadratic factor of Equation (19) can be written as
where , with
Defining , Equation (22) can be rewritten as
From Equation (20), . To determine the signs of the roots of Equation (19) without solving it explicitly, we evaluate the product and the sum of the roots, denoted Test 1 and Test 2 . After some algebra,
If , Equation (27) implies Test 1 , so the quadratic factor of Equation (19) has one positive and one negative root and, from Equation (23), the disease settles into an endemic state. If instead , then Test 1 and Test 2 , so both roots are negative and no biologically feasible endemic equilibrium exists; the disease dies out. These results justify defining as the vaccinated reproduction number. For the SVEIsIaHRD compartmental model we therefore obtain
The validity of Equation (29) was verified using the standard next-generation matrix method [23,31,32], and both results agree. Setting and in Equation (29) gives the basic reproduction number () for the SEIsIaHRD compartmental model:
This procedure for deriving the basic and vaccinated reproduction numbers applies to the class of compartmental epidemic models in which the transmission process is governed by two distinct forces of infection, typically associated with different infectious classes. Under this formulation, the alternative approach avoids the construction of the next-generation matrix [31,32] and the associated spectral radius calculation, while remaining consistent with the underlying stability properties of the model.
3.2. SVEIsIaHRD: Endemic Equilibrium Points
To investigate the local stability of the equilibrium points, the Jacobian matrix of the SVEIsIaHRD system was constructed and evaluated at equilibrium. Because D is a cumulative compartment that does not feed back into the remaining equations, the analysis is carried out on the seven-dimensional subsystem . The resulting Jacobian matrix (J) is given in Equation (31).
If all eigenvalues of the Jacobian matrix have negative real parts, the equilibrium is locally asymptotically stable; conversely, if at least one eigenvalue has a positive real part, the equilibrium is unstable. For the parameter set of Table 1, both roots of the quadratic factor of Equation (19) are negative, so this endemic equilibrium does not exist in an epidemiological sense: there is no steady state in which the disease persists in the vaccinated population.
3.3. SVEIsIaHRD: Vaccinated Disease-Free Equilibrium
Setting in Equations (1)–(7) gives
so that the vaccinated disease-free equilibrium point is . Evaluating Equation (31) at this point gives the Jacobian shown in Equation (34).
The characteristic equation of Equation (34) can be written as
where
with
All coefficients of Equation (36) are positive provided b1 > 0 and 0 < Rv < 1, so by Descartes’ rule of signs P3 (λ) has no positive real root. This alone is not sufficient, however, since the absence of positive real roots does not exclude a complex conjugate pair with positive real part. We therefore apply the Routh–Hurwitz criterion, which for a cubic b3λ3 + b2λ2 + b1λ + b0 with b3 > 0 is necessary and sufficient for all roots to have negative real parts:
(i) b2 > 0, (ii) b0 > 0 and (iii) b2b1 > b3b0, with b0 = 1 − Rv.
Condition (i) holds identically by Equation (38). Condition (ii) is equivalent to Rv < 1. Condition (iii) then requires (T1 + T2 + T3)(T1T2 + T1T3 + T2T3 − βε(S** + θ1V**)) > T1T2T3(1 − Rv). It is worth noting that Rv < 1 already implies b1 > 0. Indeed, Rv < 1 gives βε(S** + θ1V**) < T1T2T3/((1 − k)T2 + kT3), and because (1 − k)T2 + kT3 ≥ min(T2, T3), the right-hand side is at most T1max(T2, T3), which is smaller than T1T2 + T1T3 + T2T3. Hence conditions (i) and (ii) alone secure the positivity of every coefficient, and only condition (iii) has to be checked separately.
For the parameter set of Table 1, Rv = 0.164, so b0 = 0.836 > 0, and evaluating the coefficients gives b1 = 27.4, b2b1 − b3b0 = 6.7 × 10³ > 0. All three Routh–Hurwitz conditions are therefore satisfied, and the three roots of P3(λ) have negative real parts. The remaining four eigenvalues follow directly from Equation (35) and are −γ1 (twice), −T4 and −(γ1 + ω1), all of which are negative. Consequently, the vaccinated disease-free equilibrium is locally asymptotically stable, and the disease is expected to die out rather than trigger sustained transmission. This conclusion agrees with the general result that the disease-free equilibrium of a compartmental model is locally asymptotically stable when the reproduction number computed by the next-generation matrix is below unity [31,32], which provides an independent check on the algebraic derivation of Section 3.1.
3.4. SEIsIaHRD: Endemic Equilibrium
To find the endemic equilibrium points of the SEIsIaHRD compartmental model, we set and in Equations (1)–(8), so that the governing system becomes
If vaccines are not available, Equation (19) reduces to a linear equation together with the trivial solution corresponding to the disease-free state:
where
Solving the non-trivial part of Equation (47) gives
with as defined in Equation (30). From Equation (50), the disease becomes endemic if . Moreover, when , , so that the symptomatic infectious population saturates rather than growing without bound as increases. This is a consequence of the finite recruitment rate (), which limits the pool of new susceptible individuals available to sustain further transmission.
The remaining endemic equilibrium points are
The Jacobian evaluated at the endemic equilibrium points () of the SEIsIaHRD compartmental model is
A closed-form symbolic expression for the eigenvalues of Equation (56) is intractable given the complexity of the endemic equilibrium values, so the stability of this equilibrium is assessed numerically in Section 4.1.
3.5. SEIsIaHRD: Non-Vaccinated Disease-Free Equilibrium
Setting in Equation (56) gives the Jacobian shown in Equation (57),
where . The characteristic equation of can be written as
where
with
Section 3.4 and the present subsection describe the SEIsIaHRD model, which is the θ1 = ω1 = 0 special case of the full system, so the stability argument of Section 3.3 applies unchanged with Rv replaced by R0 and S** + θ1V** replaced by S*** = Λ/γ1. Here, however, R0 = 1.22 > 1, so the constant term of Equation (59) is negative while the leading coefficients are positive. Routh–Hurwitz condition (ii) therefore fails, and P3(λ) has exactly one sign change: by Descartes’ rule of signs, it has one positive real root. The non-vaccinated disease-free equilibrium is consequently unstable, and the endemic equilibrium of Equations (50)–(55) is the attracting state. Evaluating Equation (56) at that equilibrium with the parameters of Table 1 gives eigenvalues whose real parts are all negative, confirming that the endemic equilibrium is locally asymptotically stable when no vaccine is available.
4. Results
4.1. Reproduction Numbers and Stability
Using the parameter values listed in Table 1, Equation (29) gives a vaccinated reproduction number of for the SVEIsIaHRD model, well below the epidemic threshold. Correspondingly, Equation (30) gives a basic reproduction number of for the SEIsIaHRD model, above the threshold. In the vaccinated system, the only equilibrium lying in the biologically feasible region is the disease-free equilibrium, which by the argument of Section 3.3 is locally asymptotically stable. In the non-vaccinated system, the disease-free equilibrium is unstable (Section 3.5).
Numerical evaluation of the Jacobian in Equation (56) at the endemic equilibrium of the SEIsIaHRD model yielded four negative real eigenvalues (, , and ) and a pair of complex conjugate eigenvalues (). All eigenvalues have negative real parts, so in the absence of vaccination the endemic equilibrium is locally asymptotically stable.
4.2. Sensitivity Analysis Results
The normalized forward sensitivity indices of with respect to each model parameter are presented in Figure 2. The indices for the recruitment rate and the transmission coefficient are both , indicating that scales in direct proportion to each: a 1% increase in either produces a 1% increase in . The vaccine failure parameter follows closely at , so that vaccine effectiveness is nearly as influential as transmission itself. The negative indices identify the parameters whose increase suppresses transmission: the natural death rate (), the total disease-related exit rate from the symptomatic infectious compartment (), the asymptomatic recovery rate () and the fraction of exposed individuals who become symptomatic (). The index for has a direct epidemiological reading: shortening the mean symptomatic infectious period, whether through earlier isolation, faster case detection or more rapid clinical resolution, reduces roughly in proportion. Because a single exit rate governs the whole of that period, this sensitivity is captured by one index rather than being distributed across several partially redundant parameters.
Figure 2.
Normalized forward sensitivity indices of the vaccinated reproduction number with respect to each model parameter, ordered from the most positive to the most negative. Positive indices (blue) identify parameters whose increase raises and therefore promotes transmission; negative indices (red) identify parameters whose increase lowers . An index of denotes exact proportionality between a relative change in the parameter and the resulting relative change in . The hospitalized exit rate does not appear because the hospitalized compartment does not contribute to the force of infection.
The incubation rate has an index of , reflecting the fact that appears in only through the ratio , which is indistinguishable from unity because . The latent period therefore affects the timing of the epidemic but not its threshold behavior. The vaccine coverage rate carries a small negative index (); this does not indicate that vaccination is unimportant, but rather that at the coverage already achieved the marginal effect of a further proportional increase in on is modest, since is already well below the epidemic threshold. Note that does not appear in Figure 2, because the hospitalized compartment does not contribute to the force of infection and therefore does not enter Equation (29). Interventions aimed at reducing the parameters with positive indices, and at increasing those with large negative indices, are expected to be the most effective strategies for controlling the spread of COVID-19.
4.3. Compartment Dynamics
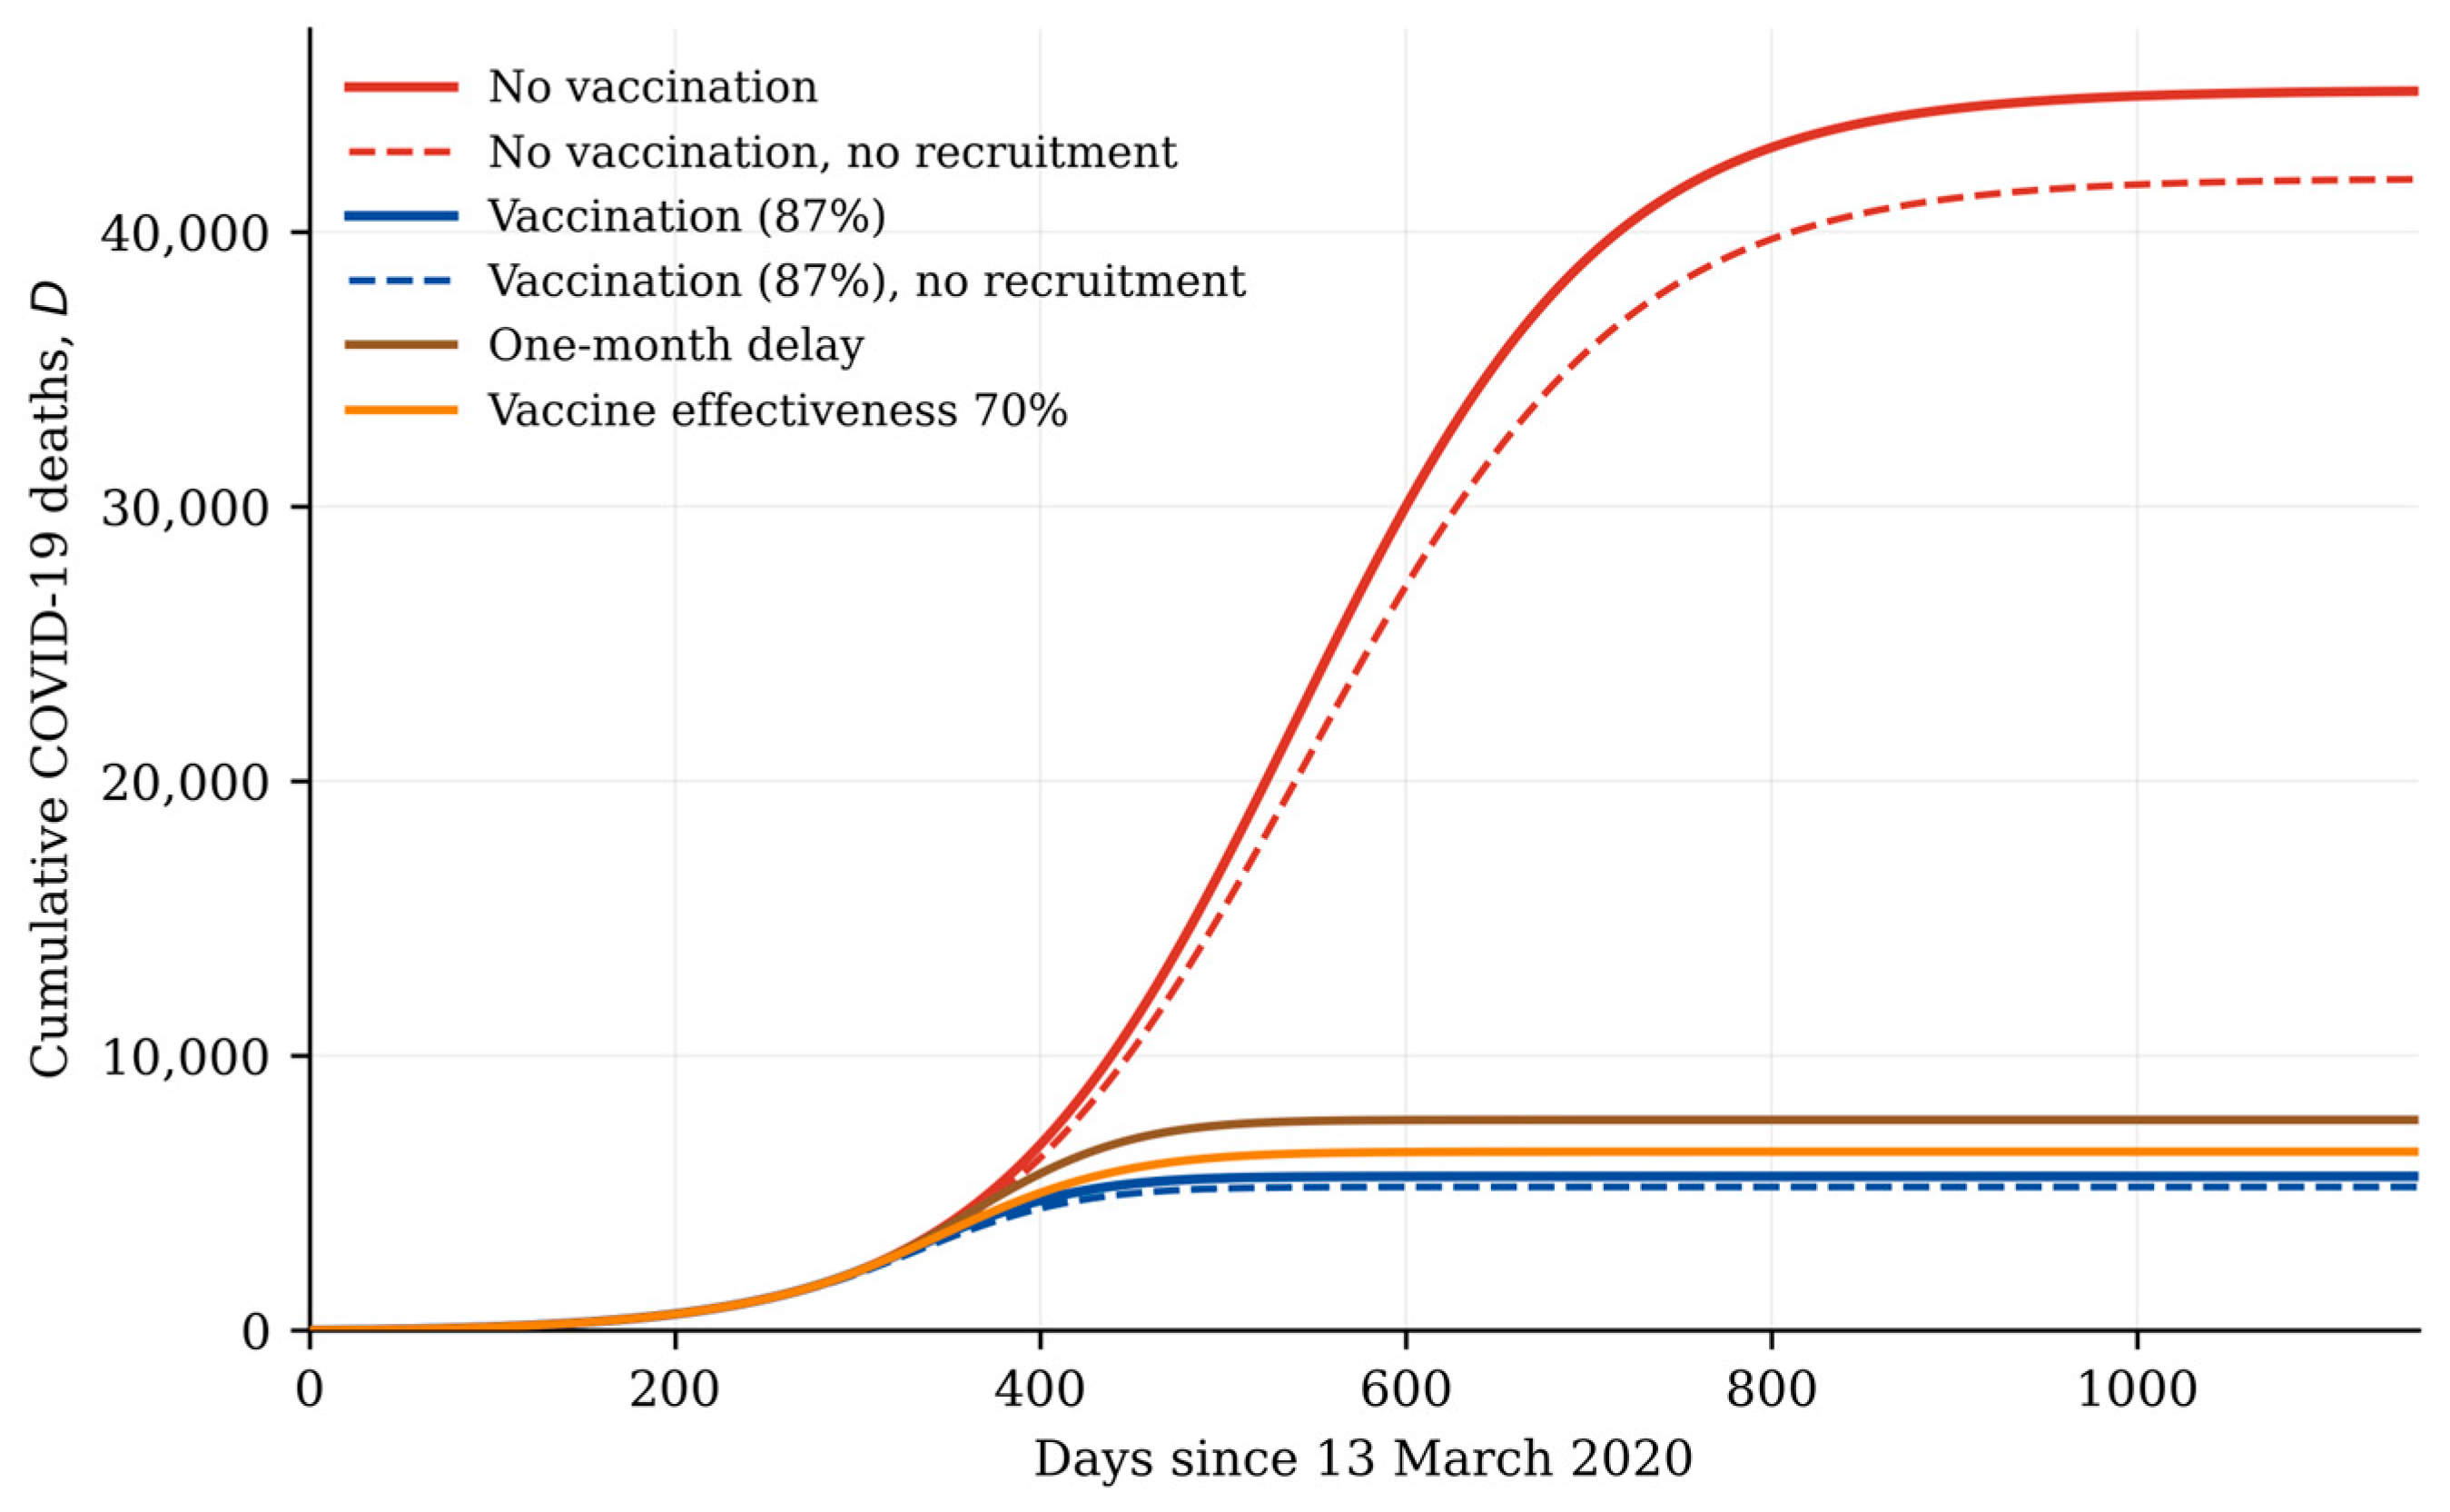
Equations (1)–(8) were solved numerically as described in Section 2.5, which also allowed the time evolution of all epidemiological compartments to be computed and visualized. For reasons of space, and because they are the most relevant to this study, we present only the graphical representations of the susceptible and vaccinated compartments (Figure 3), the symptomatic infectious compartment (Figure 4), the hospitalized compartment (Figure 5) and the COVID-19 death compartment (Figure 6). To obtain the actual compartment populations in Figure 3, Figure 4, Figure 5 and Figure 6, the vertical-axis values should be multiplied by , the population of Puerto Rico in 2020.
Figure 3.
Decrease in the susceptible population (red, brown and blue curves), indicating a reduction in the number of individuals at risk of infection and therefore a mitigation of the overall impact of the pandemic. The red curve shows the no-vaccination scenario, the brown curve a one-month vaccination delay, and the blue curve the susceptible population under vaccination with 87% effectiveness. The green curve shows the vaccinated population.
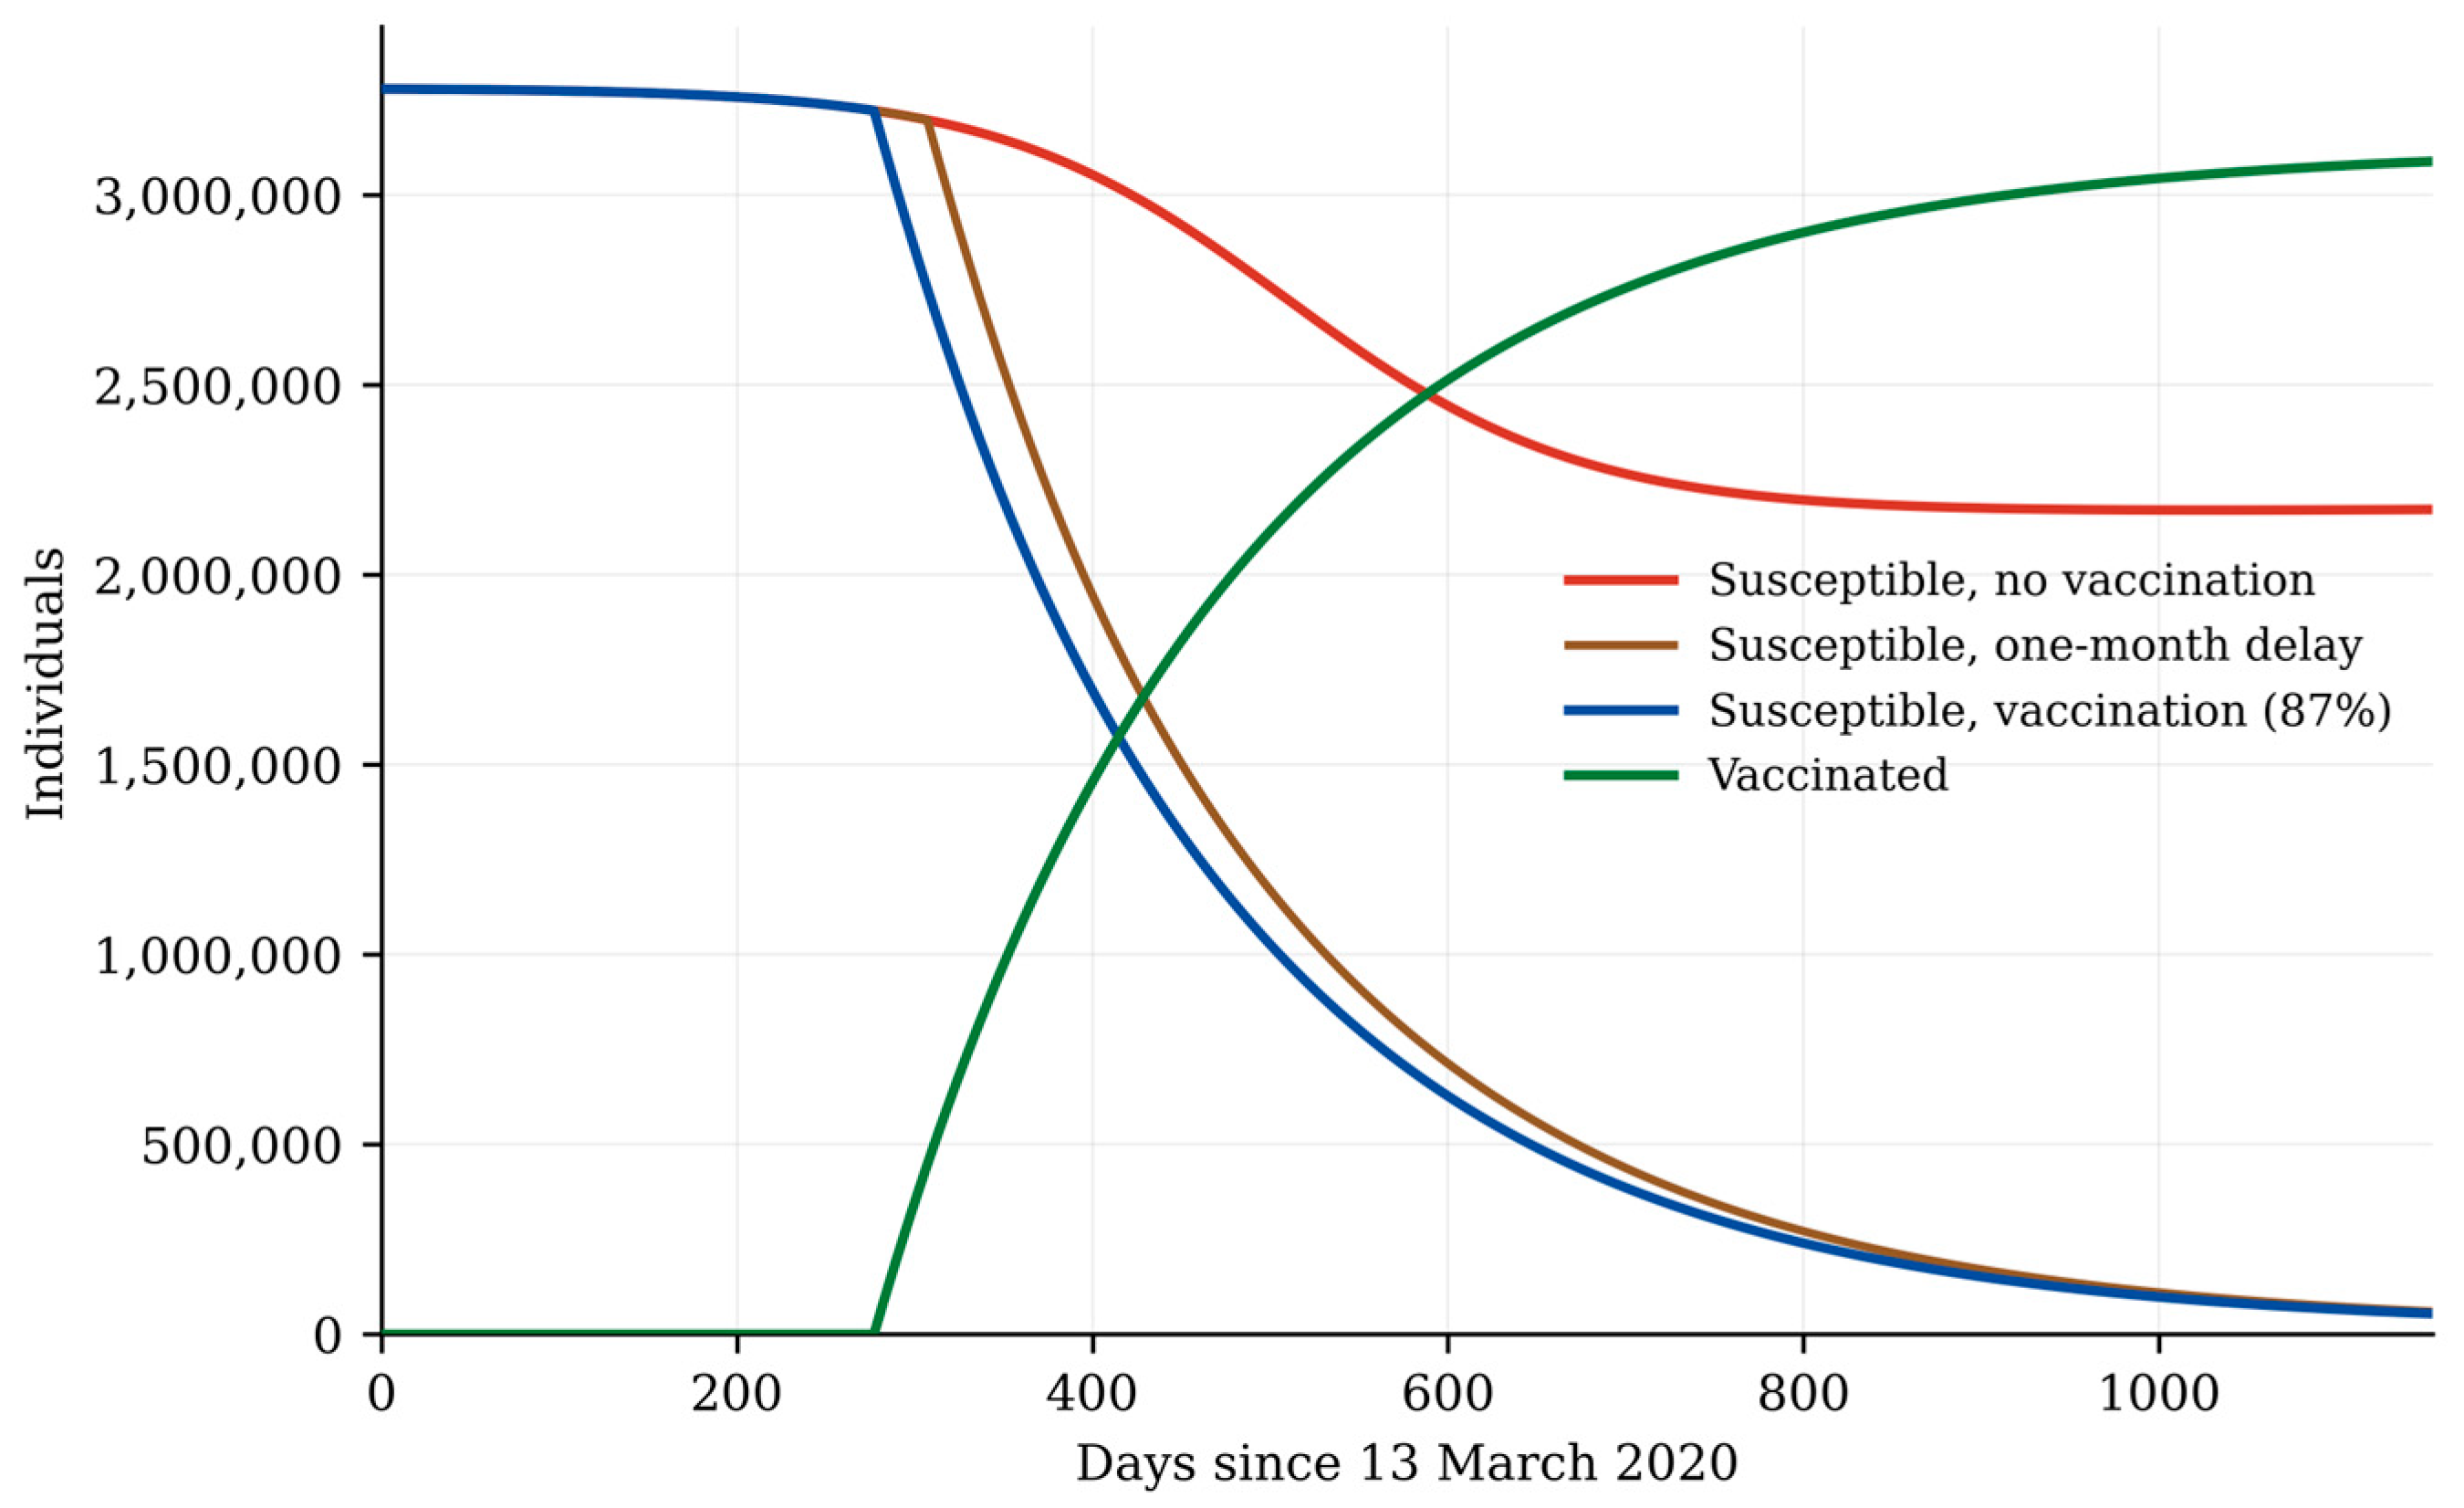
Figure 4.
Evolution of the symptomatic infectious population (Is) over time (multiply vertical-axis values by to obtain absolute case counts). The solid red curve shows the no-vaccination scenario and the solid blue curve the actual Puerto Rico vaccination scenario (87% effectiveness); both rise early in the pandemic and then decline as susceptible individuals are depleted or vaccinated. The dashed red and dashed blue curves show the corresponding no-recruitment (border-control) variants, illustrating that restricting population inflow further reduces the symptomatic caseload in both the unvaccinated and the vaccinated case. The purple curve shows the effect of a one-month vaccination delay and the orange curve the effect of reduced vaccine effectiveness (70% instead of 87%); both produce a modest increase in symptomatic infections relative to the solid blue curve.
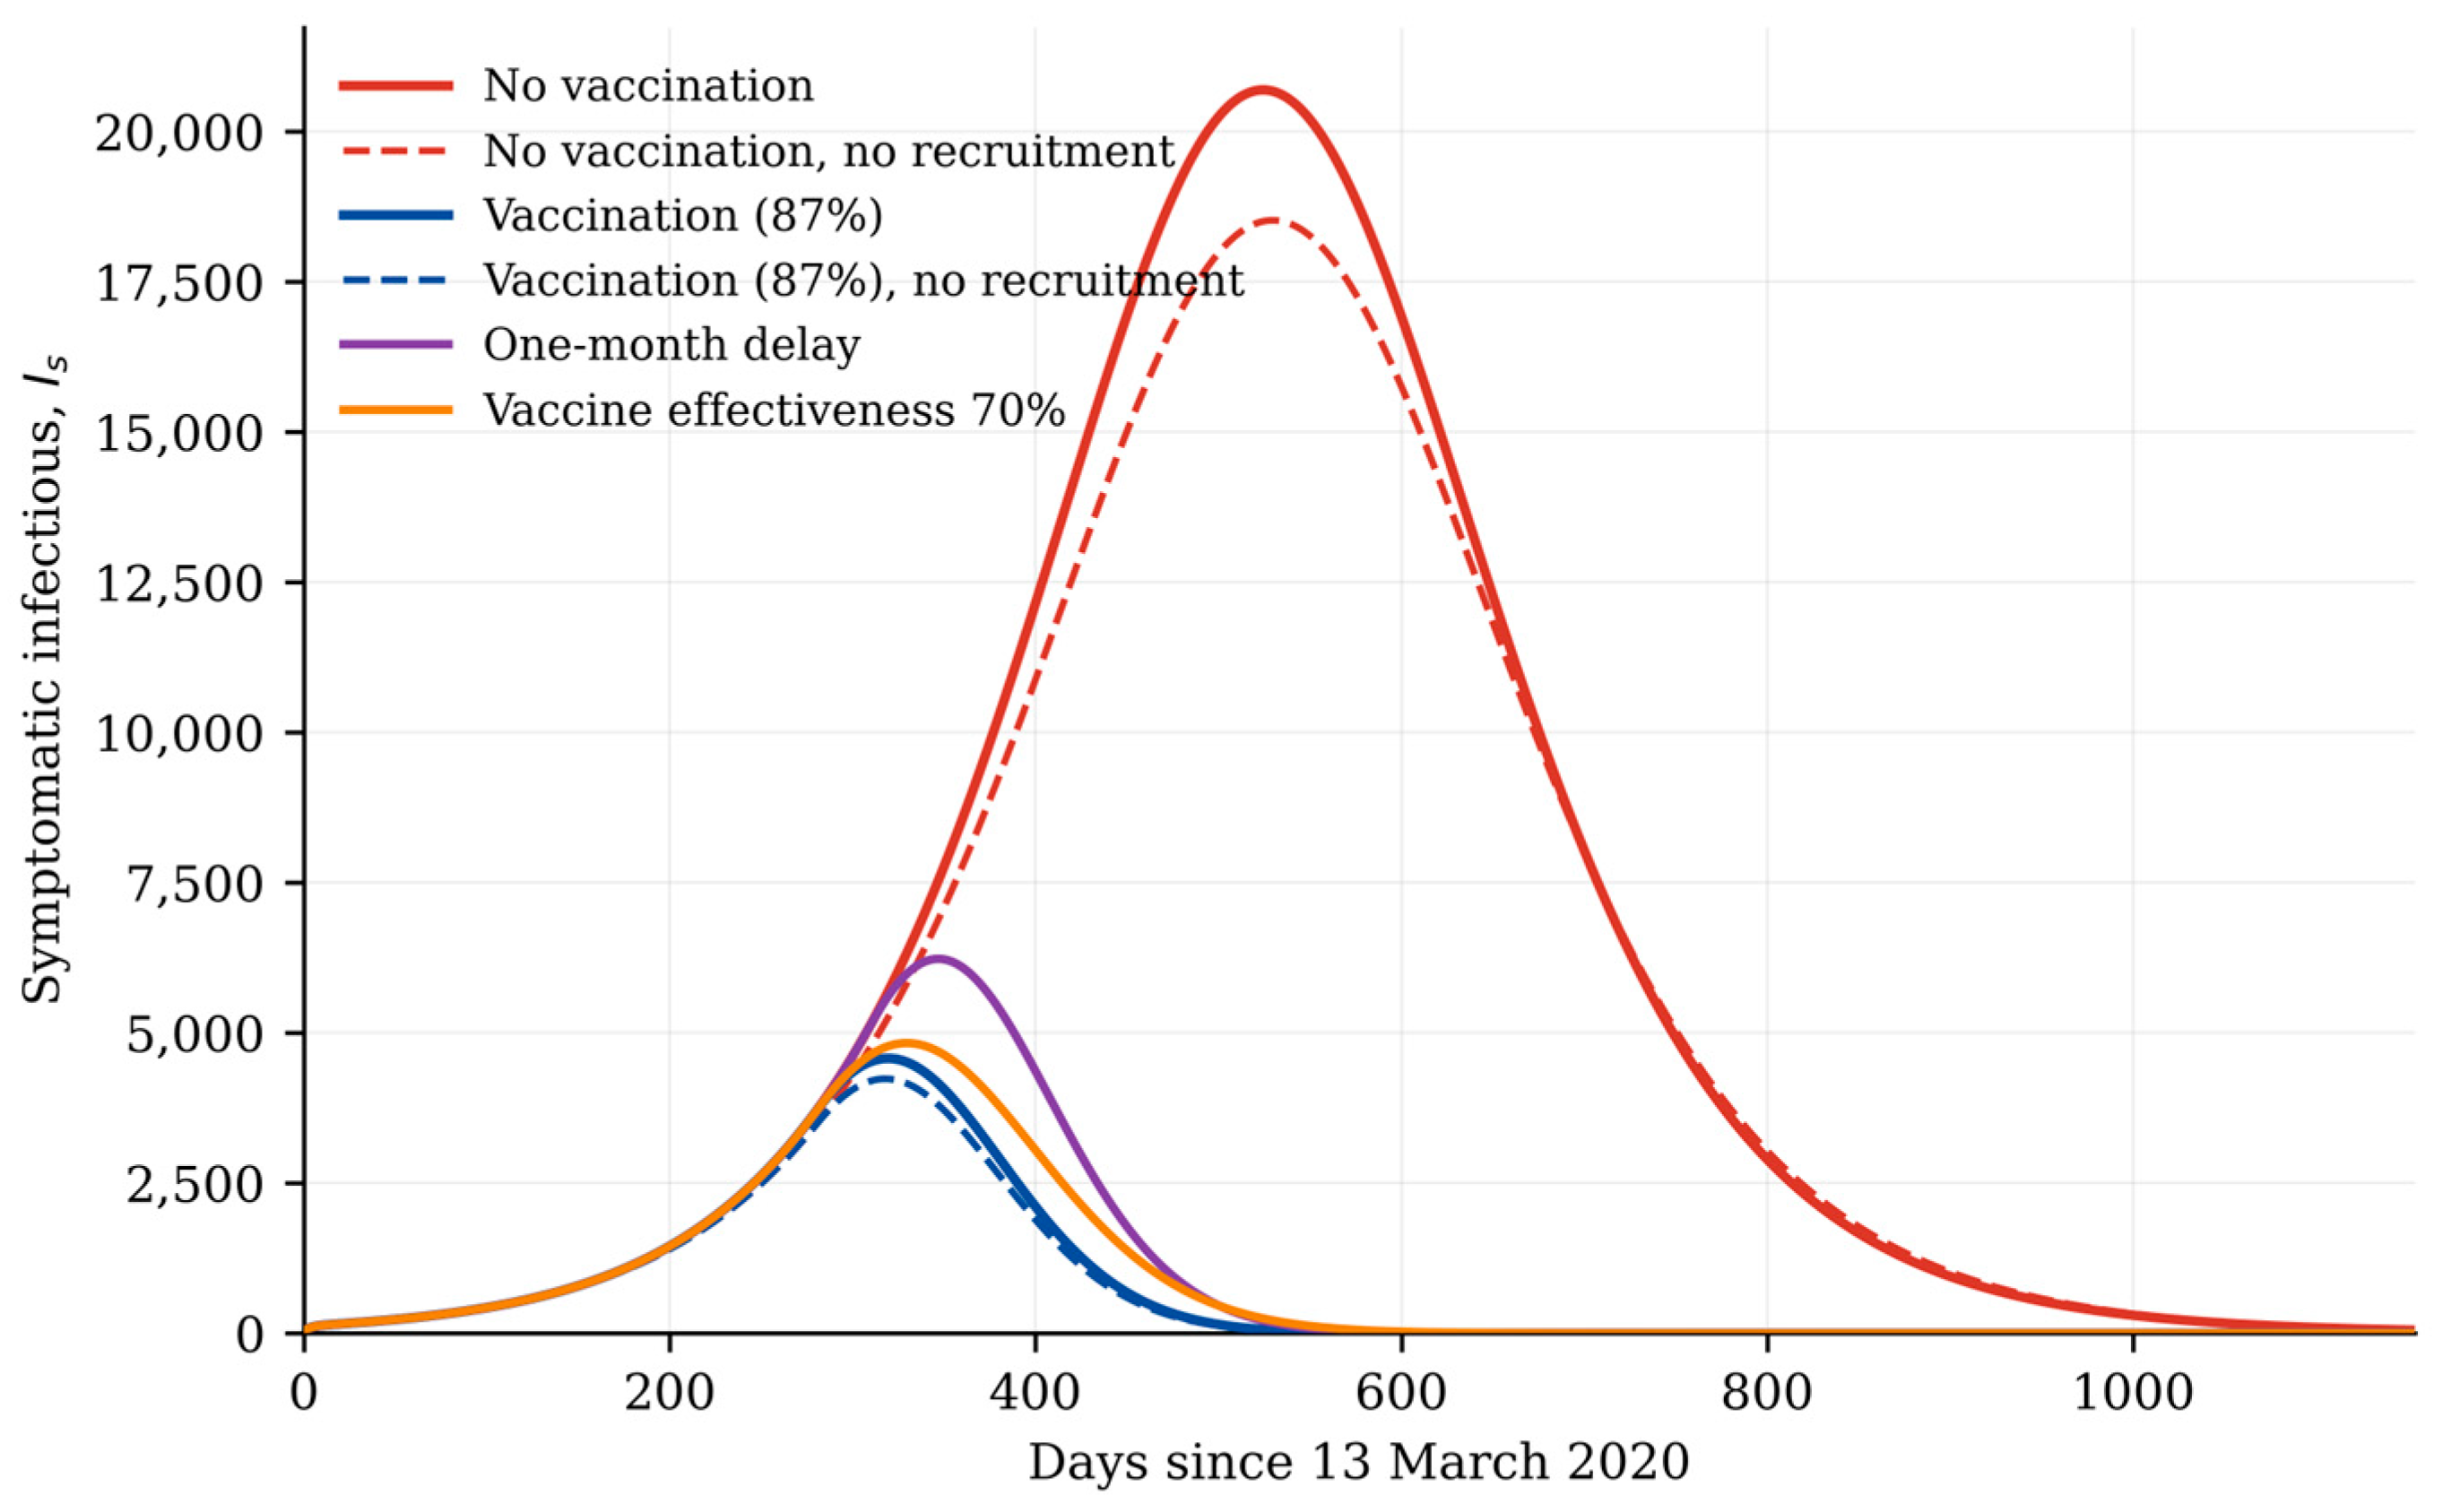
Figure 5.
Evolution of the hospitalized population (H) over time (multiply vertical-axis values by to obtain absolute counts). As in Figure 4, the solid red and solid blue curves show the no-vaccination and the actual Puerto Rico vaccination (87% effectiveness) scenarios, respectively, and the dashed curves show their no-recruitment (border-control) variants. Because hospitalization is driven directly by the symptomatic infectious population (Equation (5)), the hospitalized curves follow the same qualitative pattern as in Figure 4 but at the smaller scale set by the hospitalized fraction . The purple curve (one-month vaccination delay) and the orange curve (70% vaccine effectiveness) again show modestly higher hospitalizations relative to the solid blue curve, indicating that delayed or less effective vaccination would have increased peak hospital demand in Puerto Rico.
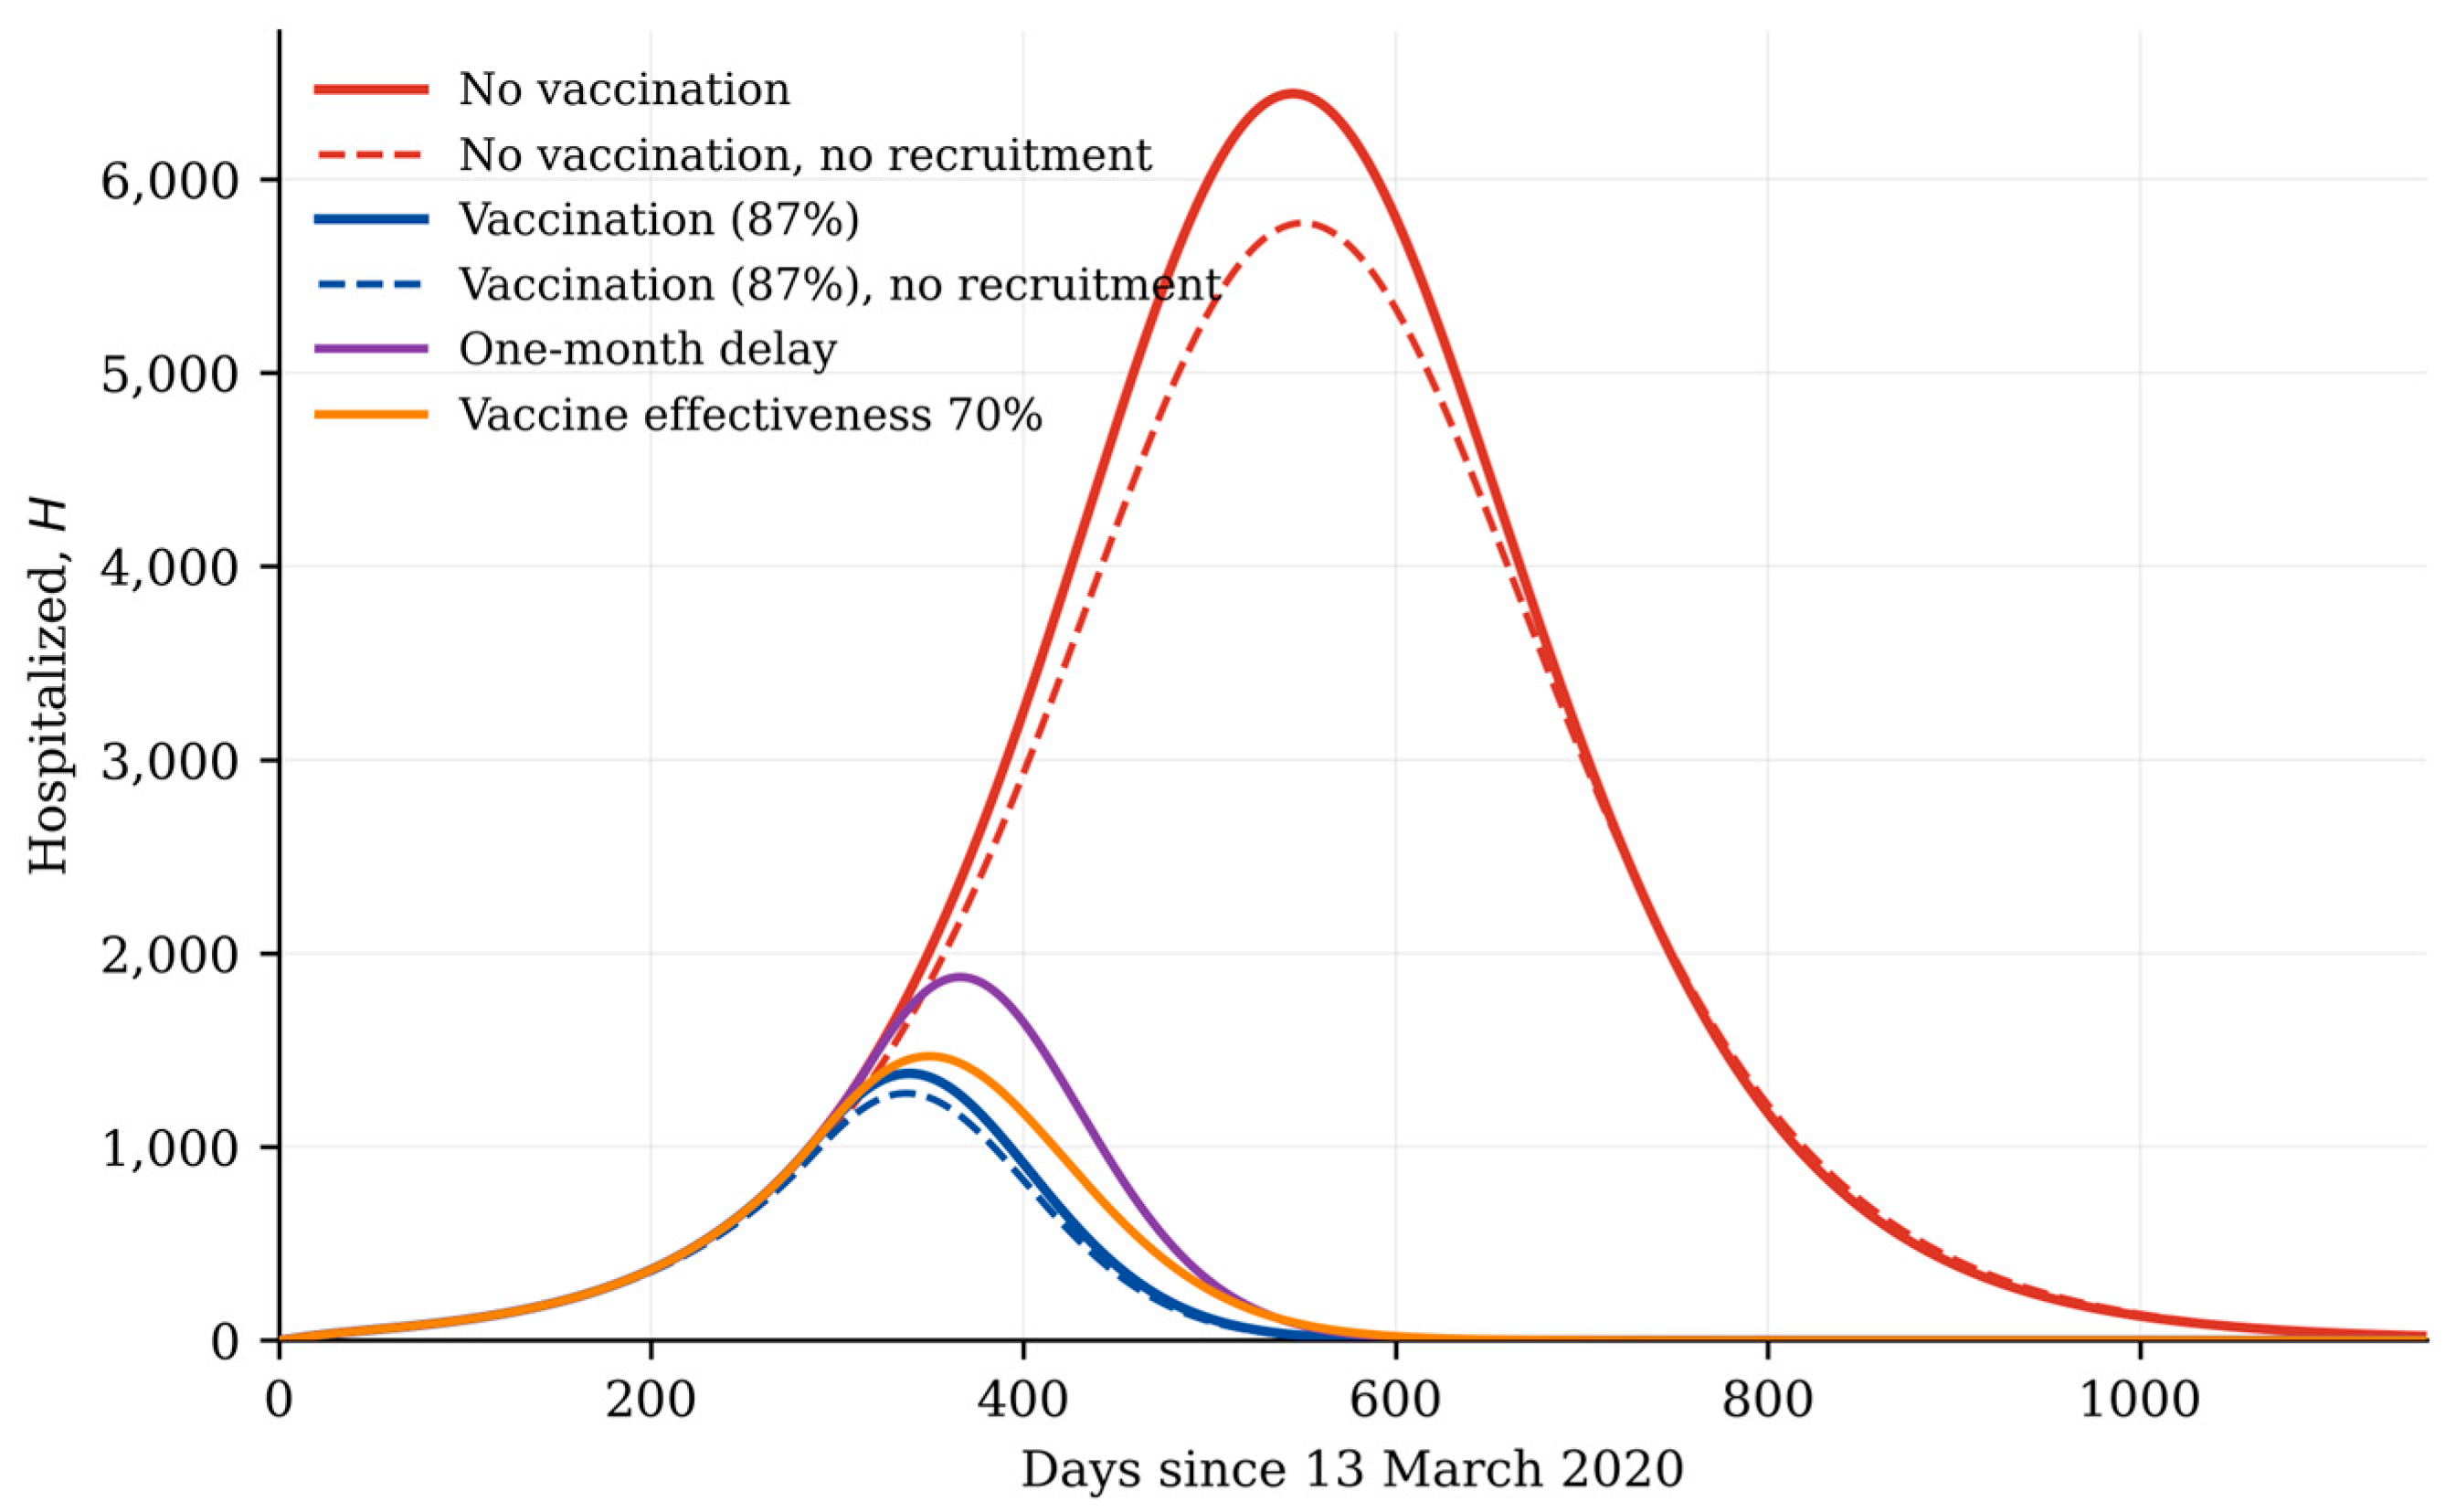
Figure 6.
Evolution of the cumulative number of deaths due to COVID-19 under different epidemiological scenarios. The solid red curve represents the scenario without vaccination and the solid blue curve represents vaccination with 87% effectiveness. A one-month delay in the vaccination rollout (brown curve) leads to an increase in the total number of deaths, and the orange curve represents the cumulative deaths when vaccine effectiveness is reduced from 87% to 70%. The red dashed curve illustrates the impact of no recruitment in the absence of vaccination, whereas the blue dashed curve shows the effect of no recruitment combined with vaccination.
The shape of the curves in Figure 4 deserves comment, because it may appear to conflict with the stability results of Section 3. Local asymptotic stability describes the system near an equilibrium in the limit of large time; it does not preclude a transient rise. At t = 0, almost the entire population is susceptible, so the effective reproduction number exceeds unity even in the vaccinated scenario, in which vaccination does not begin until day 277. The symptomatic infectious population therefore grows until susceptible depletion and vaccination together drive the effective reproduction number below one, after which it declines. The single peak present in every curve, at day 319 with a maximum of 4575 symptomatic individuals under vaccination and at day 524 with 20,688 individuals without vaccination, is transient and is not in contradiction with the asymptotic result.
Two further points follow. Under vaccination, Rv = 0.16 < 1, the trajectory converges to the disease-free equilibrium, and Is decays to values indistinguishable from zero on a linear scale: at day 1154 the model gives Is = 1.7 × 10⁻¹³ in normalized units. The model is deterministic and Is(t) remains strictly positive at every finite time; it never attains zero, and the apparent zero level in Figure 4 is a consequence of the linear vertical scale rather than of extinction. Without vaccination, R0 = 1.22 > 1 and the endemic equilibrium of Equations (50)–(55) is stable, but the endemic level is small: Is* = 2.79 × 10⁻⁵, that is approximately 92 symptomatic individuals in a population of 3.28 million, with E* ≈ 80. At day 1154, the simulated value is 51 individuals and is still approaching that level from below. Because relaxation towards the endemic state occurs on the demographic timescale 1/γ1 ≈ 4 × 10⁴ days, the approach cannot be seen within a 1154-day window, and against a peak of 20,688 individuals an endemic plateau of 92 is visually indistinguishable from the axis. The corresponding residual incidence of εE = 7.5 new cases per day is reported in Section 4.5.
4.4. Threshold Surfaces
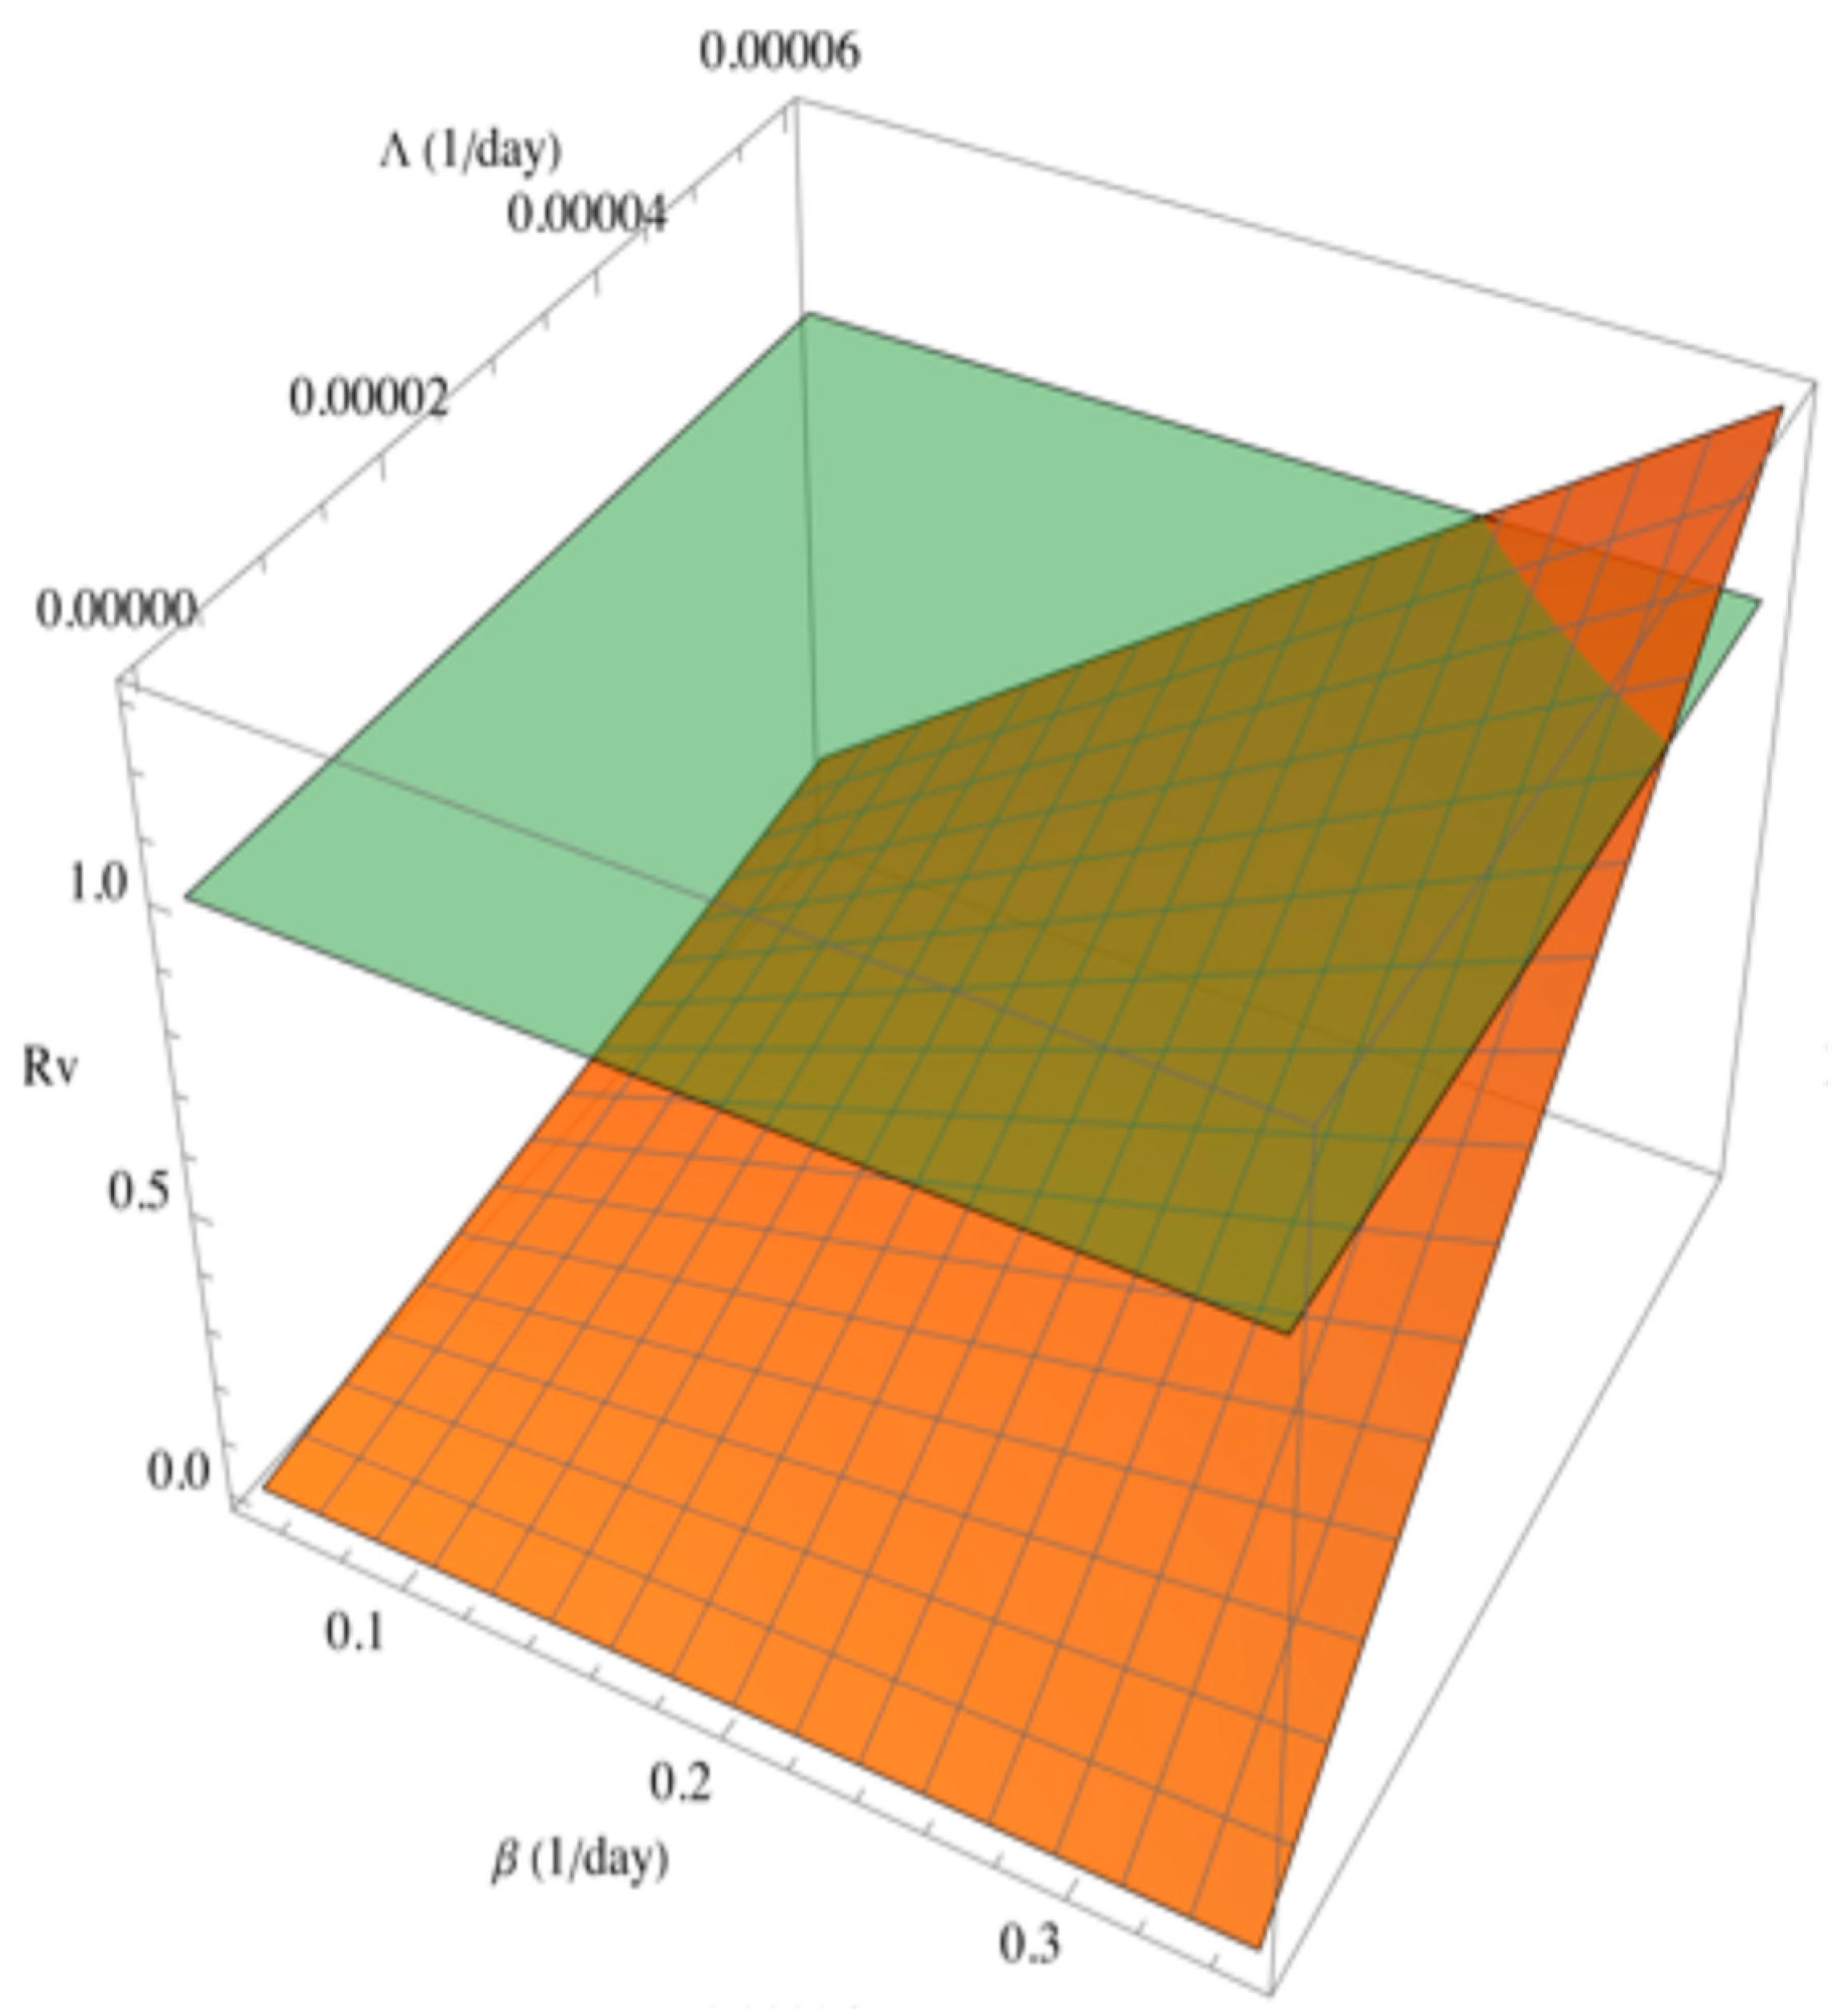
Figure 7 shows as a function of the transmission coefficient () and the vaccine failure rate (). The plane at divides the surface into a region where the disease spreads (, above the plane) and a region where it dies out (, below the plane), illustrating that even a highly effective vaccine (low ) cannot guarantee elimination if transmission is sufficiently high. Figure 8 shows as a function of and the recruitment rate (). The plane again marks the threshold, and the surface illustrates that higher recruitment, corresponding to a less restrictive border policy, shifts the disease-elimination boundary toward lower transmission coefficients; under high recruitment, even modest transmission can sustain the epidemic.
Figure 7.
Three-dimensional plot of the vaccinated reproduction number (blue surface) for different values of the transmission coefficient and the vaccine failure rate. The plane at (green) divides the surface into two regions: where (above the plane), the disease spreads in the population, and where (below the plane), the disease dies out.
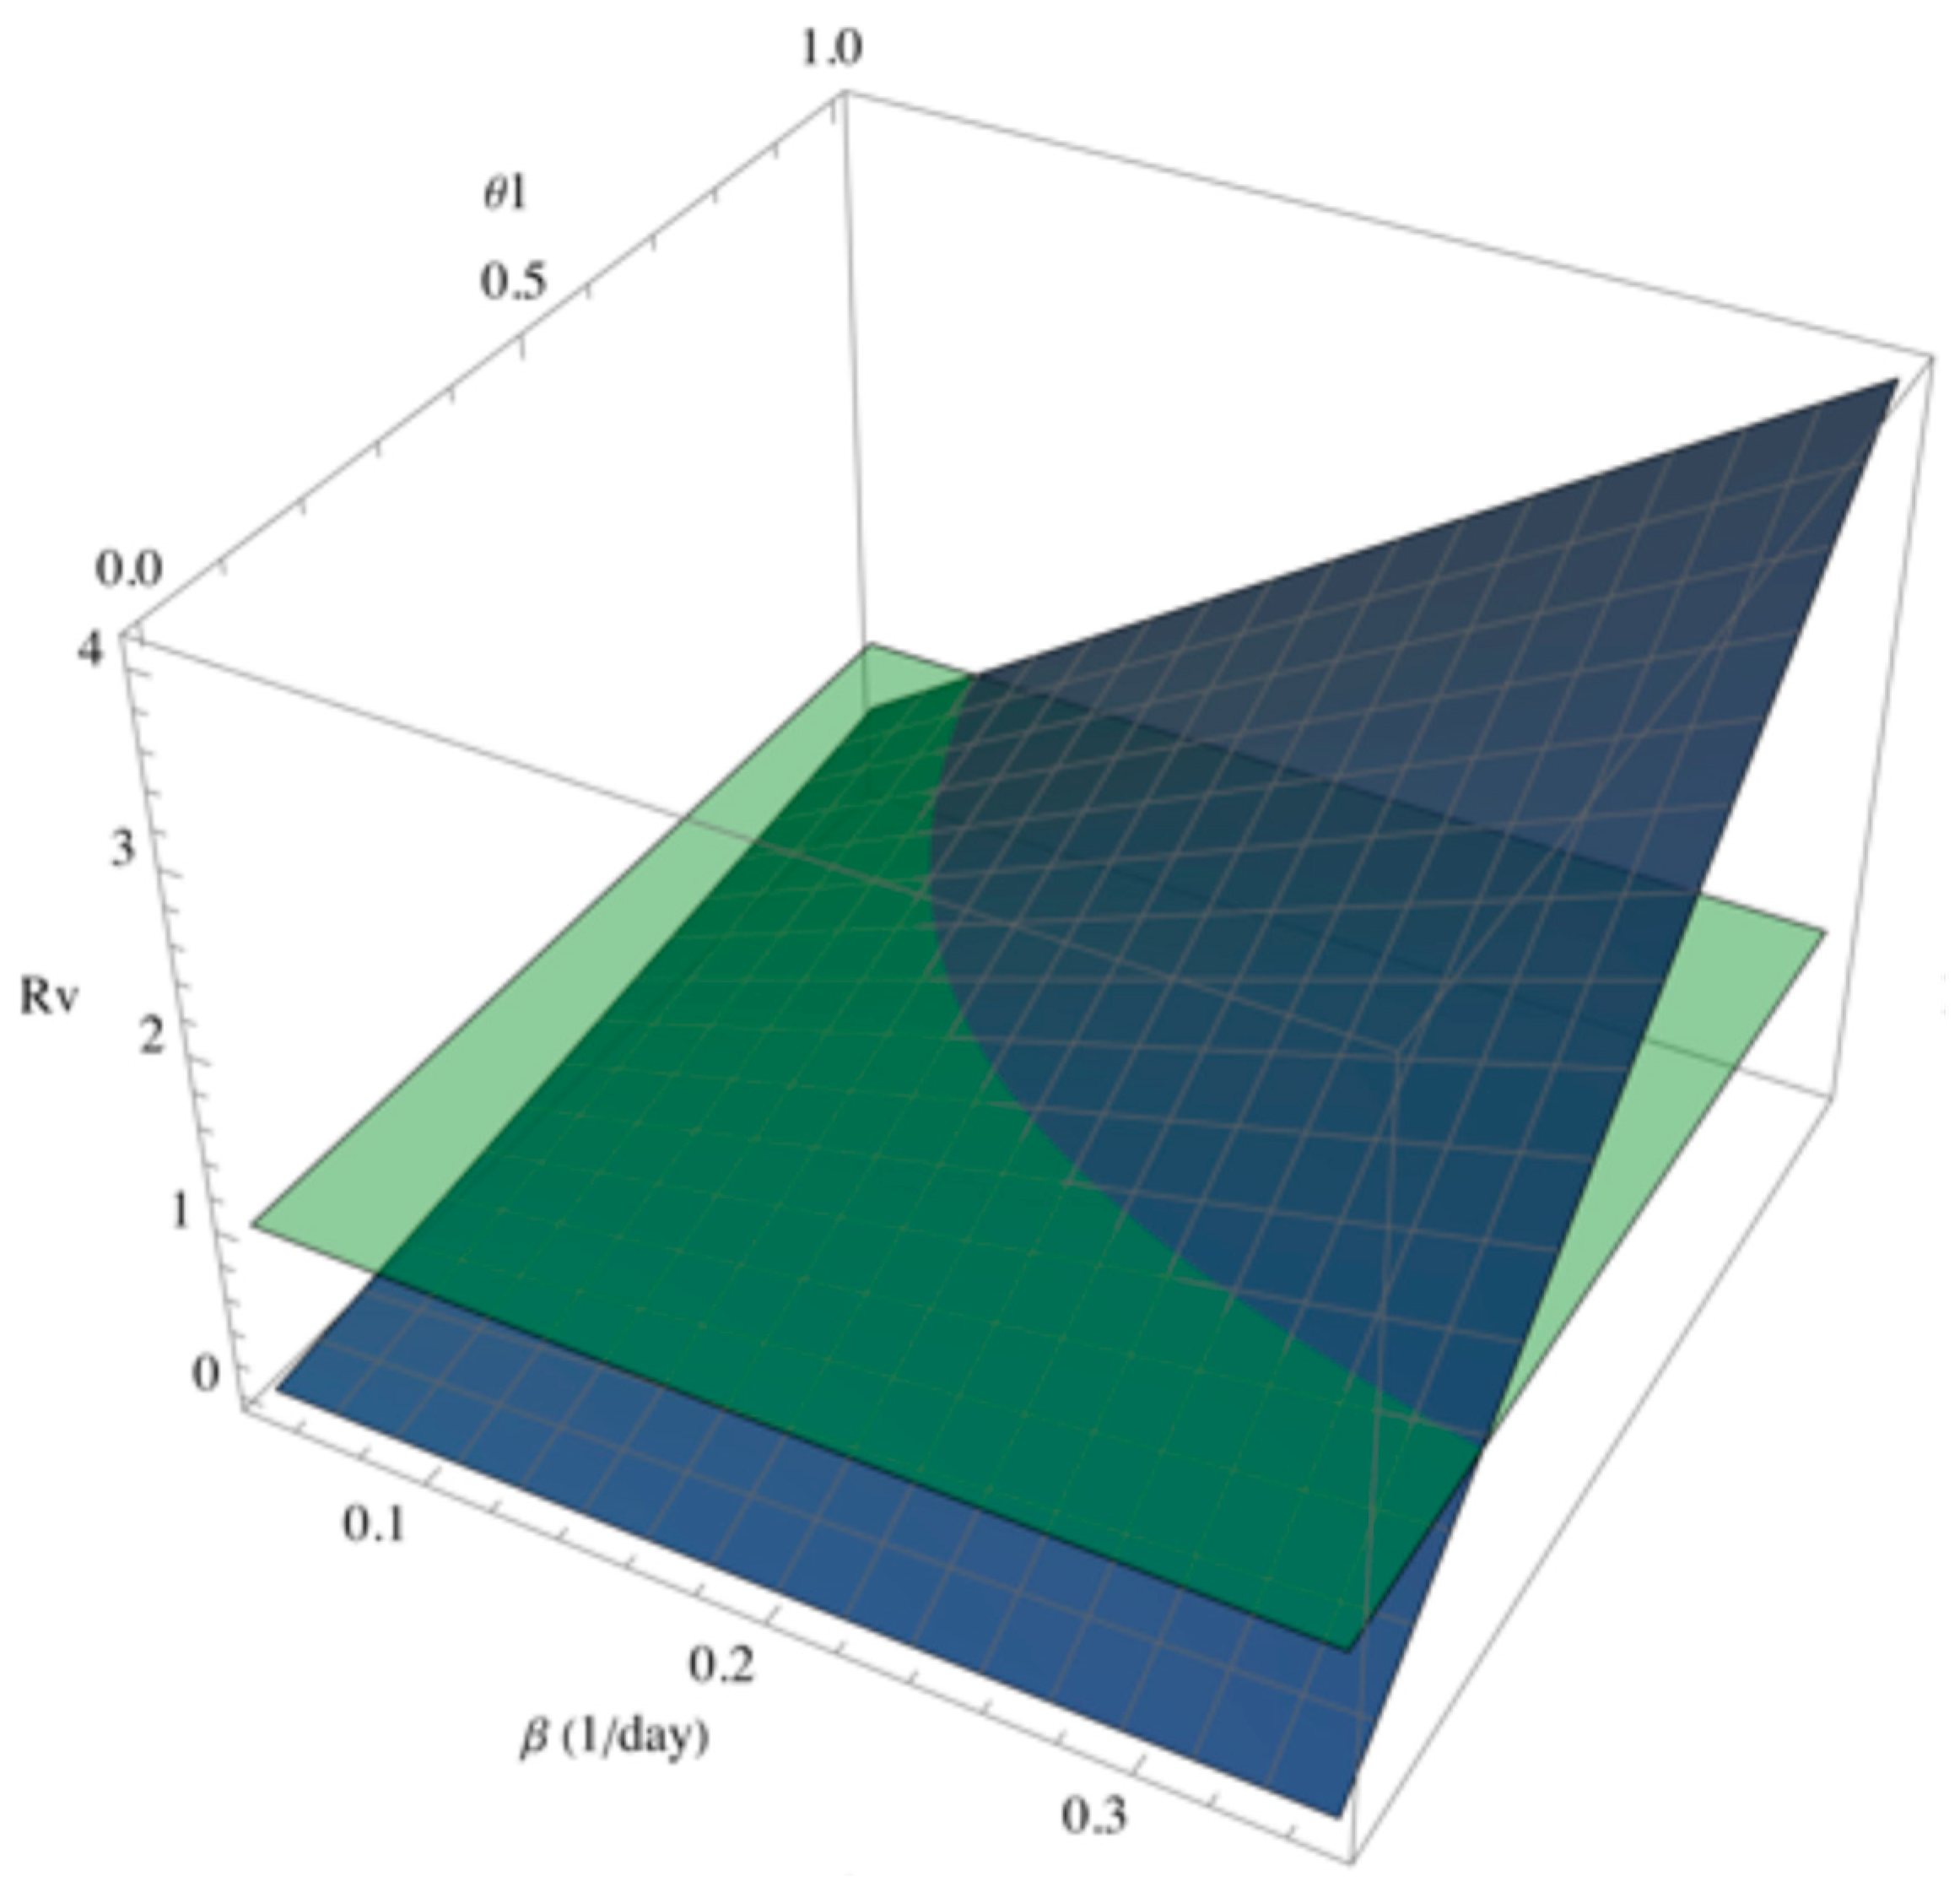
Figure 8.
Three-dimensional plot of the vaccinated reproduction number (orange surface) for different values of the transmission coefficient and the recruitment rate. The plane at (green) separates the parameter space into two regions: where the surface lies below the plane, the disease dies out, and where it lies above the plane, the disease continues to spread.
4.5. Model Validation and Comparison of Scenarios
Table 2 reports the compartment populations obtained under each epidemiological scenario, and Table 3 compares the modeling results with the data reported by official dashboards [3,38] at the two calibration checkpoints. Following Section 2.6, the comparison is made between quantities of the same kind: the incidence against reported daily cases, the cumulative vaccination integral against the reported number vaccinated with at least one dose, and the compartments and directly against the reported hospital census and cumulative deaths.
At the pre-vaccination checkpoint (15 December 2020), the model gives a total incidence of new infectious cases per day, against 733 confirmed cases per day reported in the dashboards, a difference of 10.3%. The symptomatic component alone is per day. As an internal consistency check, the outflow from the symptomatic compartment, per day, agrees with to within 10%; the residual difference reflects the fact that was still rising on that date, so that the compartment was not at quasi-steady state. For the hospitalized compartment, the model gives 911 against a reported census of 683, and the simulated cumulative deaths (1627) differ from the dashboard value (1465) by 11.1%.
At the end of the pandemic (11 May 2023), the cumulative number of individuals ever vaccinated obtained from the vaccination integral is , which differs from the reported number vaccinated with at least one dose () by 0.32%. This corresponds to approximately 96% of the 2020 population of Puerto Rico. For comparison, the vaccinated compartment itself at the same date is , which differs from the reported figure by 1.52%; the difference of about 57,800 individuals, or 1.8% of , corresponds to those who left through breakthrough infection or natural mortality and illustrates why the cumulative integral rather than the compartment is the appropriate comparator. The simulated cumulative deaths (5608) differ from the dashboard-reported value (5938) by 5.6%.
The agreement is therefore close for the three quantities that are both well reported and dimensionally matched: cumulative vaccinations (0.32%), cumulative deaths (5.6% and 11.0% at the two checkpoints) and daily incidence at the pre-vaccination checkpoint (10.3%). The largest remaining discrepancy at the first checkpoint is the hospital census, where the model exceeds the reported value by 33.0% of the reported figure. Two mechanisms plausibly contribute: the model does not represent healthcare-capacity constraints, and hospitalization coding practices varied over the study period.
One discrepancy requires explicit comment. At the second checkpoint under vaccination, the model predicts effectively zero incidence, whereas the dashboards still reported approximately 340 cases per day. This is a direct consequence of , which drives the system to the disease-free equilibrium, combined with the absence of waning immunity, reinfection and variant turnover from the model formulation. In reality, SARS-CoV-2 continued to circulate at low levels through 2023, sustained by precisely those mechanisms. The model should therefore be understood as describing the trajectory of the original epidemic wave under a fixed immunity assumption, and not as a forecast of endemic circulation after the main wave had passed. The corresponding no-vaccination scenario retains a small residual incidence of cases per day at the same date, consistent with and with the endemic equilibrium being stable in that case.
Turning to the comparison of scenarios, at the end of the pandemic a vaccine with 87% effectiveness reduces the number of COVID-19 deaths to 5608, compared with 45,124 when no vaccination is available. Reducing vaccine effectiveness from 87% to 70% increases the number of deaths to 6507, and delaying vaccination by one month (that is, beginning after 15 December 2020) increases deaths to 7666. Combining vaccination at 87% effectiveness with border control (no recruitment) further reduces deaths to 5225. In the absence of a vaccine, border control alone reduces deaths from 45,124 to 41,913, which can be confirmed by comparing the two no-vaccination rows of Table 2. Table 2 is also useful because it allows the compartment populations to be estimated under a scenario of vaccine unavailability, and Table 3 collects the validation comparisons discussed above.
Overall, the simulations demonstrate the critical role of vaccination in shaping epidemic trajectories. In the absence of vaccines, the COVID-19 pandemic in Puerto Rico would have resulted in approximately 45,124 deaths, with stable endemic dynamics. Timely vaccination reduced mortality, aligning closely with the observed data, whereas a long delay would have canceled most of that benefit. Keeping the island isolated from visitors (no recruitment) lowers infections and deaths and alters the overall course of the pandemic.
4.6. Cost of a Delayed Vaccine Rollout
The comparison above fixes the delay at one month. Because the start date of a vaccination campaign is the variable most directly under the control of public health authorities, and because one of the two questions motivating this study is how much of the benefit of vaccination survives a delay, the vaccination start date was varied systematically while all other parameters were held at the values of Table 1. Figure 9 shows the resulting cumulative deaths on 11 May 2023 as a function of the delay.
Figure 9.
Cumulative COVID-19 deaths on 11 May 2023 as a function of the delay in the start of vaccination, with all other parameters held at the values of Table 1. The dotted line marks timely rollout on 15 December 2020 (5608 deaths) and the dashed line the no-vaccination scenario (45,124 deaths). Markers indicate the delays at which 25%, 50% and 90% of the benefit of vaccination is lost.
Timely rollout on 15 December 2020 yields 5608 deaths, and the absence of vaccination yields 45,124, so the benefit attributable to vaccination is 39,516 deaths averted. The curve of Figure 9 is sigmoidal: it rises slowly at first, steepens between approximately two and eight months, and saturates at the no-vaccination level beyond about eighteen months. Quantitatively, 25% of the benefit is lost at a delay of 108 days, 50% at 185 days and 90% at 366 days, and the marginal cost of the first week of delay is about 62 additional deaths per day.
Two observations follow. First, the threshold is one of burden rather than of persistence. The vaccinated reproduction number of Equation (29) depends on ω1 and θ1, but not on the date at which vaccination begins, so Rv = 0.16 < 1 for every delay considered and the epidemic is eventually eliminated in all cases. What the delay determines is how much of the susceptible population is consumed by infection before elimination is achieved, and therefore the accumulated mortality, rather than the qualitative long-term outcome.
Second, delay dominates effectiveness over the relevant range. Reducing vaccine effectiveness from 87% to 70% raises deaths from 5608 to 6507, and a further reduction to 50% raises them only to 8552, whereas a delay of 60 days already yields 10,250 deaths. No reduction in effectiveness within the plausible range reproduces the mortality cost of a delay longer than about two months. For a jurisdiction choosing between waiting for a more effective vaccine and deploying a less effective one immediately, these simulations favor immediate deployment.
5. Discussion
In this study, we developed and analyzed two compartmental epidemiological models, SEIsIaHRD and SVEIsIaHRD, to investigate the COVID-19 pandemic in Puerto Rico under scenarios in which vaccination is unavailable or introduced after a substantial delay. The COVID-19 pandemic exposed marked inequalities in vaccine access between high- and low-income regions, with some countries experiencing prolonged delays in vaccine procurement and distribution, whereas others rejected vaccination campaigns for political or social reasons. Similar situations may arise during future pandemics or during the resurgence of previously controlled infectious diseases. Two fundamental questions therefore motivated this work: how does a pandemic evolve in the absence of vaccination, and can delayed vaccination still effectively control disease transmission? In addition, we examined the effects of vaccine effectiveness and of border-control (no-recruitment) measures, and introduced an alternative analytical procedure for deriving the vaccinated reproduction number.
Application of the two models to the Puerto Rico COVID-19 epidemic demonstrated the substantial impact of vaccination on disease dynamics. In the absence of vaccination, the estimated basic reproduction number was , indicating sustained transmission and epidemic growth. This value is lower than the estimate reported for SARS-CoV-2 () during the early phase of the pandemic in Puerto Rico [42], a difference plausibly attributable to the fact that the present estimate is calibrated over the whole pandemic period rather than over the initial exponential phase. In contrast, the implementation of vaccination reduced the reproduction number to , well below the epidemic threshold, resulting in the eventual elimination of disease transmission. These findings highlight the role of vaccination in reducing viral spread and preventing severe clinical outcomes.
Stability analyses provided additional insight into the long-term behavior of the epidemic system. For the non-vaccination scenario, the disease-free equilibrium was unstable, confirming that infection invasion is unavoidable when susceptible individuals are continuously exposed to infectious contacts, and the endemic equilibrium was locally asymptotically stable, emphasizing the importance of intervention measures capable of driving the system toward disease elimination. For the vaccinated scenario, the only equilibrium that exists in the feasible region is the disease-free one, which is locally stable.
Sensitivity analysis identified the parameters exerting the greatest influence on the vaccinated reproduction number. Increases in the transmission coefficient, the recruitment rate and the vaccine failure rate were associated with higher values of , thereby enhancing transmission potential and worsening epidemic outcomes. Conversely, increases in recovery rates and natural mortality reduced , contributing to epidemic control. These findings are consistent with epidemiological theory and suggest that interventions aimed at reducing transmission and improving vaccine performance may produce the greatest reductions in disease burden.
A methodological point emerged during model validation that has wider relevance for compartmental studies calibrated against dashboard data. Model state variables and surveillance fields are not automatically comparable: the former are stocks, whereas reported case counts are flows. Comparing the symptomatic infectious compartment directly against a daily case count inflates the model by roughly the mean sojourn time, about ten days in the present formulation, and can create the appearance of substantial underreporting where none is demonstrated. When the comparison is made on a like-for-like basis, using the incidence , the model reproduces the reported case counts at the pre-vaccination checkpoint to within 10.3%. The same consideration applies to vaccination: the vaccinated compartment is depleted by breakthrough infection and natural mortality, whereas dashboards report a cumulative total from which nobody is removed. Using the vaccination integral rather than the compartment improves the agreement with the reported figure from 1.52% to 0.32%, a difference of about 57,800 individuals. Because these corrections are of the same magnitude as the discrepancies commonly attributed to reporting artifacts, we suggest that the correspondence between model quantities and surveillance fields should be stated explicitly in compartmental modeling studies.
The simulations further demonstrated the importance of timely vaccine deployment. Early vaccination markedly reduced the number of infections, hospitalizations and deaths throughout the epidemic period. However, delaying vaccine implementation substantially diminished these benefits and produced epidemic trajectories approaching those observed in the absence of vaccination. In the present simulations, a one-month delay increased cumulative deaths by 37% relative to timely rollout at the same effectiveness, whereas a reduction in effectiveness from 87% to 70% increased them by 17%, suggesting that vaccination timing may matter at least as much as vaccine effectiveness in determining overall public health impact. This observation underscores the importance of rapid vaccine development, distribution and administration during emerging infectious disease outbreaks.
An additional finding of this study concerns the role of border-control measures (no recruitment). Simulations indicated that restricting population recruitment into the system produced substantial epidemiological benefits. Border control reduced simulated deaths to 5225, marginally below the 5608 deaths obtained under 87, effective vaccination with normal recruitment, but this holds only under the specific, simplified assumption of complete suspension of population recruitment with no other change. In practice, the two measures are complementary, with border control most relevant as a temporary bridge before vaccines become available rather than as a long-term substitute for vaccination. Although border restrictions may have important economic, political and social consequences, the present results suggest that such measures can significantly reduce transmission opportunities during the early stages of a pandemic, particularly when vaccines are unavailable or delayed.
From a methodological perspective, this work introduces an alternative algebraic procedure for obtaining an analytical expression for the vaccinated reproduction number. Unlike the next-generation matrix approach [31,32], which requires extensive matrix manipulation and familiarity with linear algebra, the proposed method provides a more direct derivation while yielding equivalent epidemiological information; the two approaches were verified to agree for the present model. To the best of our knowledge, this approach has not previously been reported for compartmental epidemic models with two forces of infection. It may therefore provide a useful analytical and educational tool for students, researchers and public health professionals seeking to evaluate disease transmission dynamics without relying on more mathematically intensive techniques.
To facilitate comparison among intervention scenarios, we also employed two- and three-dimensional visualizations of the compartment trajectories. The cumulative mortality analysis demonstrated that reductions in vaccine effectiveness from 87% to 70%, combined with delays in vaccine implementation, substantially increased COVID-19-related deaths, whereas border-control measures consistently reduced mortality in both vaccinated and unvaccinated populations. The three-dimensional representations enabled visualization of the parameter regions associated with disease persistence or elimination, providing additional insight into the conditions required for epidemic control.
Taken together, Figure 3, Figure 4, Figure 5, Figure 6, Figure 7, Figure 8 and Figure 9 trace a single mechanism through the compartments. Figure 3 shows the susceptible pool being removed either by vaccination or by infection, and the no-vaccination curve declines least precisely because vaccination is the faster of the two routes; the larger residual susceptible population it leaves is what sustains the subsequent transmission. Figure 4 and Figure 5 show the consequence in the infectious and hospitalized compartments, with hospitalization following the symptomatic curve scaled by 1 − k1 − k6, and Figure 6 accumulates it into mortality. Figure 7 and Figure 8 locate the parameter combinations that separate elimination from persistence, and Figure 9 converts the delay axis into deaths. The epidemiological reading is consistent across all of them: what determines the outcome is the speed with which susceptible individuals are removed from circulation relative to the speed at which the infection reaches them.
Limitations
Several limitations should be considered when interpreting these results. First, the proposed SVEIsIaHRD model assumes homogeneous mixing within the population, whereas real-world contact patterns are heterogeneous and influenced by demographic, social and geographic factors. Second, epidemiological parameters were assumed to remain constant throughout the simulation period, despite changes in human behavior, public health interventions, viral evolution and healthcare capacity. Third, uncertainty in parameter estimation may affect model accuracy and predictive performance; only a local sensitivity analysis was performed, and a global sensitivity analysis is left for future work. Fourth, the vaccination component was simplified and did not explicitly incorporate waning immunity, booster doses, vaccine hesitancy or reinfection dynamics. Fifth, the model does not include age structure: the population is treated as homogeneous with respect to age, whereas COVID-19 transmission, severity, hospitalization and mortality risk are known to vary substantially by age group. Sixth, calibration against only two checkpoints, rather than against a continuous time series, assumes that those checkpoints are representative of the system dynamics. The model also does not account for healthcare-system burden, which may influence hospitalization and mortality rates during periods of high disease incidence. Seventh, the exit rate and the outcome fractions and combine a Puerto Rico hospital-admission rate [16] with a recovery rate and a symptomatic mortality rate reported for other populations [35,36], because neither has been published for Puerto Rico specifically; the hospitalized quantities and are free of this limitation, being taken entirely from Puerto Rico data [16,37]. Eighth, the vaccination rate was derived from the number of individuals who completed the vaccination schedule, whereas the cumulative vaccination total was validated against the reported number who received at least one dose; these two populations are not identical, and because the cumulative vaccination integral scales nearly linearly with , the close agreement obtained depends in part on this choice. Ninth, the model does not reproduce the low-level circulation of SARS-CoV-2 observed after the main epidemic wave: under vaccination it converges to the disease-free equilibrium and predicts effectively zero incidence at the second checkpoint, whereas approximately 340 cases per day were still being reported. This reflects the absence of waning immunity, reinfection and variant turnover from the formulation, and means that the model describes the trajectory of the original wave rather than subsequent endemic circulation. Finally, the relatively large number of compartments increases mathematical complexity and may limit practical implementation in settings with limited epidemiological data.
6. Conclusions
An eight-compartment SVEIsIaHRD model and its seven-compartment counterpart SEIsIaHRD were developed and calibrated against COVID-19 surveillance data for Puerto Rico at two checkpoints, the start of vaccination on 15 December 2020 and the official end of the pandemic in Puerto Rico on 11 May 2023. The main conclusions are as follows.
- Vaccination with 87% effectiveness reduced the reproduction number from to , changing the qualitative outcome of the epidemic from endemic persistence to disease elimination, and reduced simulated cumulative deaths from 45,124 to 5608.
- A sufficiently long delay in vaccine rollout approaches the no-vaccination outcome and largely nullifies the benefit of vaccination; in these simulations, a one-month delay increased deaths more than a reduction in effectiveness from 87% to 70%.
- Border-control (no-recruitment) measures reduced infections and deaths in both vaccinated and unvaccinated scenarios and are best interpreted as a temporary bridge before vaccines become available rather than as a substitute for vaccination.
- Assigning a single disease-related exit rate to each infected compartment, partitioned by outcome fractions, separates the mean sojourn time from the clinical outcome proportions. The mean symptomatic duration is days and the mean hospital stay is days, while , and are directly interpretable as outcome proportions.
- An alternative algebraic procedure was derived for obtaining the basic and vaccinated reproduction numbers in compartmental models with two forces of infection; it reproduces the next-generation matrix result for the present model while avoiding spectral radius calculations.
- Matching model outputs to surveillance fields on a like-for-like basis materially changes the assessment of model performance. Using the incidence rather than the prevalence , and the vaccination integral rather than the compartment , the model reproduces reported daily cases to within 10.3% and the cumulative number vaccinated, 3,146,734 individuals or approximately 96% of the population, to within 0.32%.
- The cost of delay was quantified explicitly. Of the 39,516 deaths averted by timely vaccination, 25% are lost at a delay of 108 days, 50% at 185 days and 90% at 366 days, at a marginal cost of about 62 deaths for each day of delay in the first week. Because Rv does not depend on the start date, this is a threshold in accumulated burden rather than in long-term persistence, and over the plausible range no loss of vaccine effectiveness is as costly as a delay of more than about two months.
- Local asymptotic stability of the vaccinated disease-free equilibrium was established by the Routh–Hurwitz criterion rather than by a sign-counting argument alone. The explicit conditions are Rv < 1 together with b2b1 > b3(1 − Rv), both of which are satisfied for the calibrated parameter set.
The analytical framework and the findings presented here may be adapted to other regions and to future outbreaks in order to support evidence-based public health decision-making. Future work should incorporate time-varying parameters, distinct transmission rates for symptomatic and asymptomatic individuals, age structure and waning immunity, allowing recovered individuals to re-enter the susceptible compartment, in order to improve model realism and predictive capability.
Funding
This research was partially supported by the University of Puerto Rico at Humacao. The APC was funded by the University of Puerto Rico-Humacao.
Institutional Review Board Statement
Ethical review and approval were waived for this study because it did not involve human participants, human material or identifiable personal data. The study is based exclusively on aggregated, publicly available epidemiological data.
Informed Consent Statement
Not applicable.
Data Availability Statement
The data presented in this study are aggregated and publicly available from the sources cited in the manuscript [3,38]. The Wolfram Mathematica code used to generate the results, including the auxiliary equation used to compute the cumulative vaccination integral, is available from the author upon reasonable request.
Acknowledgments
The author thanks Lusmeralis Almodóvar-Abreu for her collaboration on an early version of this research. During the preparation of this manuscript, the author used ChatGPT (GPT-5, OpenAI), Claude (Sonnet 5, Anthropic) and LanguageTool (version 8.21.1) for the purposes of proofreading the text, correcting grammar, improving language and assisting with reference management. The author has reviewed and edited the output and takes full responsibility for the content of this publication.
Conflicts of Interest
The author declares no conflicts of interest.
References
- BOC Sciences. RNA Products and Services. Available online: https://rna.bocsci.com/services/mrna-vaccines.html (accessed on 7 July 2025).
- United States Census Bureau. Puerto Rico: 2020 Census. Available online: https://www.census.gov/library/stories/state-by-state/puerto-rico.html (accessed on 7 July 2025).
- Our World in Data. COVID-19 Pandemic. Available online: https://ourworldindata.org/coronavirus (accessed on 18 January 2026).
- Johns Hopkins Coronavirus Resource Center. Puerto Rico—COVID-19 Overview. Available online: https://coronavirus.jhu.edu/region/us/puerto-rico (accessed on 18 January 2026).
- Hethcote, H.W. The mathematics of infectious diseases. SIAM Rev. 2000, 42, 599–653. [Google Scholar] [CrossRef] [Scilit]
- Brauer, F.; Castillo-Chavez, C. Mathematical Models in Population Biology and Epidemiology, 2nd ed.; Springer: New York, NY, USA, 2012; pp. 345–457. [Google Scholar]
- Keeling, M.J.; Rohani, P. Modeling Infectious Diseases in Humans and Animals; Princeton University Press: Princeton, NJ, USA, 2008; pp. 15–52. [Google Scholar]
- Li, M.Y.; Muldowney, J.S. Global stability for the SEIR model in epidemiology. Math. Biosci. 1995, 125, 155–164. [Google Scholar] [CrossRef] [Scilit] [PubMed]
- Acuña-Zegarra, M.A.; Díaz-Infante, S.; Baca-Carrasco, D.; Olmos-Liceaga, D. COVID-19 optimal vaccination policies: A modeling study on efficacy, natural and vaccine-induced immunity responses. Math. Biosci. 2021, 337, 108614. [Google Scholar] [CrossRef] [Scilit] [PubMed]
- Marques, J.A.L.; Gois, F.N.B.; Xavier-Neto, J.; Fong, S.J. Epidemiology compartmental models—SIR, SEIR, and SEIR with intervention. In Predictive Models for Decision Support in the COVID-19 Crisis; Springer: Cham, Switzerland, 2021. [Google Scholar] [CrossRef] [Scilit]
- Bowong, S.; Tewa, J.J. Mathematical analysis of a tuberculosis model with differential infectivity. Commun. Nonlinear Sci. Numer. Simul. 2009, 14, 4010–4021. [Google Scholar] [CrossRef] [Scilit]
- Saikia, D.; Bora, K.; Bora, M.P. COVID-19 outbreak in India: An SEIR model-based analysis. Nonlinear Dyn. 2021, 104, 4727–4751. [Google Scholar] [CrossRef] [Scilit] [PubMed]
- Li, R.; Pei, S.; Chen, B.; Song, Y.; Zhang, T.; Yang, W.; Shaman, J. Substantial undocumented infection facilitates the rapid dissemination of SARS-CoV-2. Science 2020, 368, 489–493. [Google Scholar] [CrossRef] [Scilit] [PubMed]
- Kucharski, A.J.; Russell, T.W.; Diamond, C.; Liu, Y.; Edmunds, J.; Funk, S.; Eggo, R.M.; Sun, F.; Jit, M.; Munday, J.D.; et al. Early dynamics of transmission and control of COVID-19: A mathematical modelling study. Lancet Infect. Dis. 2020, 20, 553–558. [Google Scholar] [CrossRef] [Scilit] [PubMed]
- Diagne, M.L.; Rwezaura, H.; Tchoumi, S.Y.; Tchuenche, J.M. A mathematical model of COVID-19 with vaccination and treatment. Comput. Math. Methods Med. 2021, 2021, 1250129. [Google Scholar] [CrossRef] [Scilit] [PubMed]
- Aponte Caraballo, F.M.; Mercado Cabrera, A.B. Association between mitigation strategies on the COVID-19 pandemic in Puerto Rico using an epidemiological mathematical model. Rev. Genios 2021, 7, 1–12. [Google Scholar] [CrossRef] [Scilit]
- Cruz-Aponte, M.; Caraballo-Cueto, J. Balancing fiscal and mortality impact of COVID-19 mitigation measurements. Lett. Biomath. 2021, 8, 255–266. [Google Scholar] [CrossRef] [Scilit]
- Giordano, G.; Blanchini, F.; Bruno, R.; Colaneri, P.; Di Filippo, A.; Di Matteo, A.; Colaneri, M. Modelling the COVID-19 epidemic and implementation of population-wide interventions in Italy. Nat. Med. 2020, 26, 855–860. [Google Scholar] [CrossRef] [Scilit] [PubMed]
- Shim, E. A mathematical model of COVID-19 transmission in the United States incorporating vaccination and behavioral change. Sci. Rep. 2021, 11, 16771. [Google Scholar] [CrossRef] [Scilit] [PubMed]
- Leontitsis, A.; Senok, A.; Alsheikh-Ali, A.; Al Nasser, Y.; Loney, T.; Alshamsi, A. SEAHIR: A specialized compartmental model for COVID-19. Int. J. Environ. Res. Public Health 2021, 18, 2667. [Google Scholar] [CrossRef] [Scilit] [PubMed]
- Dashtbali, M.; Mirzaie, M. A compartmental model that predicts the effect of social distancing and vaccination on controlling COVID-19. Sci. Rep. 2021, 11, 11596. [Google Scholar] [CrossRef] [Scilit] [PubMed]
- Nasir, J.A.; Hussain, T.; Atangana, A. A novel COVID-19 optimal control model with seven compartments. SN Appl. Sci. 2020, 2, 1342. [Google Scholar]
- Esteban, E.P.; Almodóvar-Abreu, L. Assessing the impact of vaccination in a COVID-19 compartmental model. Inform. Med. Unlocked 2021, 27, 100795. [Google Scholar] [CrossRef] [Scilit] [PubMed]
- Shams Eddin, M.; El Hajj, H.; Zayyat, R.; Lee, G. Systematic comparison of different compartmental models for predicting COVID-19 progression. Epidemiologia 2025, 6, 33. [Google Scholar] [CrossRef] [Scilit] [PubMed]
- Miami Herald. Available online: https://www.miamiherald.com/news/coronavirus/article247854635.html (accessed on 12 March 2025).
- Torner, N. The end of the COVID-19 public health emergency of international concern (PHEIC): And now what? Vacunas 2023, 24, 164–165. [Google Scholar] [CrossRef] [Scilit]
- Robles-Fontán, M.M.; Nieves, E.G.; Cardona-Gerena, I.; Irizarry, R.A. Effectiveness estimates of three COVID-19 vaccines based on observational data from Puerto Rico. Lancet Reg. Health Am. 2022, 9, 100212. [Google Scholar] [CrossRef] [Scilit] [PubMed]
- Jamil, S.; Naik, P.A.; Farman, M.; Saleem, M.U. Stability and complex dynamical analysis of COVID-19 epidemic model with non-singular kernel of Mittag-Leffler law. J. Appl. Math. Comput. 2024, 70, 3441. [Google Scholar] [CrossRef] [Scilit]
- Yaseen, R.M.; Mohsen, A.A.; Al-Husseiny, H.F.; Hattaf, K. Stability and Hopf bifurcation of an epidemiological model with effect of delay the awareness programs and vaccination: Analysis and simulation. Commun. Math. Biol. Neurosci. 2023, 2023, 32. [Google Scholar] [CrossRef] [Scilit]
- Hattaf, K.; Mohsen, A. Dynamics of a generalized fractional epidemic model of COVID-19 with carrier effect. Adv. Syst. Sci. Appl. 2022, 22, 1000–1012. [Google Scholar] [CrossRef]
- Diekmann, O.; Heesterbeek, J.A.P.; Roberts, M.G. The construction of next-generation matrices for compartmental epidemic models. J. R. Soc. Interface 2010, 7, 873–885. [Google Scholar] [CrossRef] [Scilit] [PubMed]
- Diekmann, O.; Heesterbeek, J.A.P.; Metz, J.A.J. On the definition and the computation of the basic reproduction ratio R0 in models for infectious diseases in heterogeneous populations. J. Math. Biol. 1990, 28, 365–382. [Google Scholar] [CrossRef] [Scilit] [PubMed]
- McEvoy, D.; McAloon, C.; Collins, A.; Hunt, K.; Butler, F.; Byrne, A.; Casey-Bryars, M.; Barber, A.; Griffin, J.; Lane, E.A.; et al. Relative infectiousness of asymptomatic SARS-CoV-2 infected persons compared with symptomatic individuals: A rapid scoping review. BMJ Open 2021, 11, e042354. [Google Scholar] [CrossRef] [Scilit] [PubMed]
- Macrotrends. Puerto Rico Death Rate 1950–2025. Available online: https://www.macrotrends.net/global-metrics/countries/pri/puerto-rico/death-rate (accessed on 12 March 2025).
- Garba, S.M.; Lubuma, J.M.; Tsanou, B. Modeling the transmission dynamics of the COVID-19 pandemic in South Africa. Math. Biosci. 2020, 328, 108441. [Google Scholar] [CrossRef] [Scilit] [PubMed]
- Drain, P.K.; Dalmat, R.R.; Hao, L.; Bemer, M.J.; Budiawan, E.; Morton, J.F.; Ireton, R.C.; Hsiang, T.-Y.; Marfatia, Z.; Prabhu, R.; et al. Duration of viral infectiousness and correlation with symptoms and diagnostic testing in non-hospitalized adults during acute SARS-CoV-2 infection: A longitudinal cohort study. J. Clin. Virol. 2023, 161, 105420. [Google Scholar] [CrossRef] [Scilit] [PubMed]
- Volkman, H.R.; Pérez-Padilla, J.; Wong, J.M.; Sánchez-González, L.; Acevedo-Molina, L.; Lugo-Menéndez, M.; García, C.A.O.; Adams, L.E.; Frasqueri-Quintana, V.M.; Rodriguez-Gonzalez, R.; et al. Characteristics and clinical outcomes of patients hospitalized with laboratory-confirmed COVID-19—Puerto Rico, March–August 2020. PLoS ONE 2021, 16, e0260599. [Google Scholar] [CrossRef] [Scilit] [PubMed]
- Democrat and Chronicle. COVID-19 Vaccine Tracker: Puerto Rico. Available online: https://data.democratandchronicle.com/covid-19-vaccine-tracker/puerto-rico/72/ (accessed on 16 July 2026).
- Chitnis, N.; Hyman, J.M.; Cushing, J.M. Determining important parameters in the spread of malaria through sensitivity analysis of a mathematical model. Bull. Math. Biol. 2008, 70, 1272–1296. [Google Scholar] [CrossRef] [Scilit] [PubMed]
- Rosa, S.; Torres, D.F.M. Parameter estimation, sensitivity analysis and optimal control of a periodic epidemic model with application to HRSV in Florida. Stat. Optim. Inf. Comput. 2018, 6, 139–149. [Google Scholar] [CrossRef] [Scilit]
- Wolfram Research, Inc. Mathematica, Version 14.1; Wolfram Research, Inc.: Champaign, IL, USA, 2024. [Google Scholar]
- Valencia, M.; Becerra, J.E.; Reyes, J.C.; Castro, K.G. Assessment of early mitigation measures against COVID-19 in Puerto Rico: March 15–May 15, 2020. PLoS ONE 2020, 15, e0240013. [Google Scholar] [CrossRef] [Scilit] [PubMed]
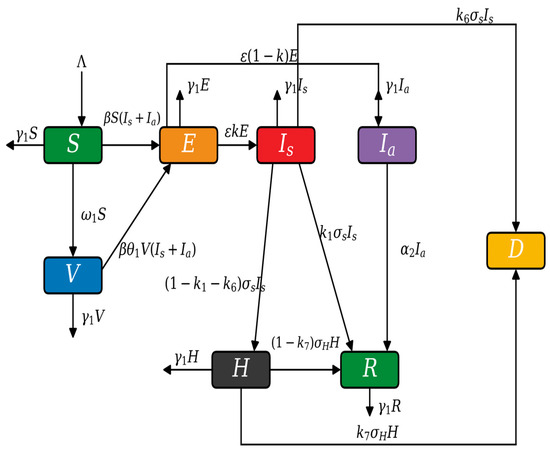
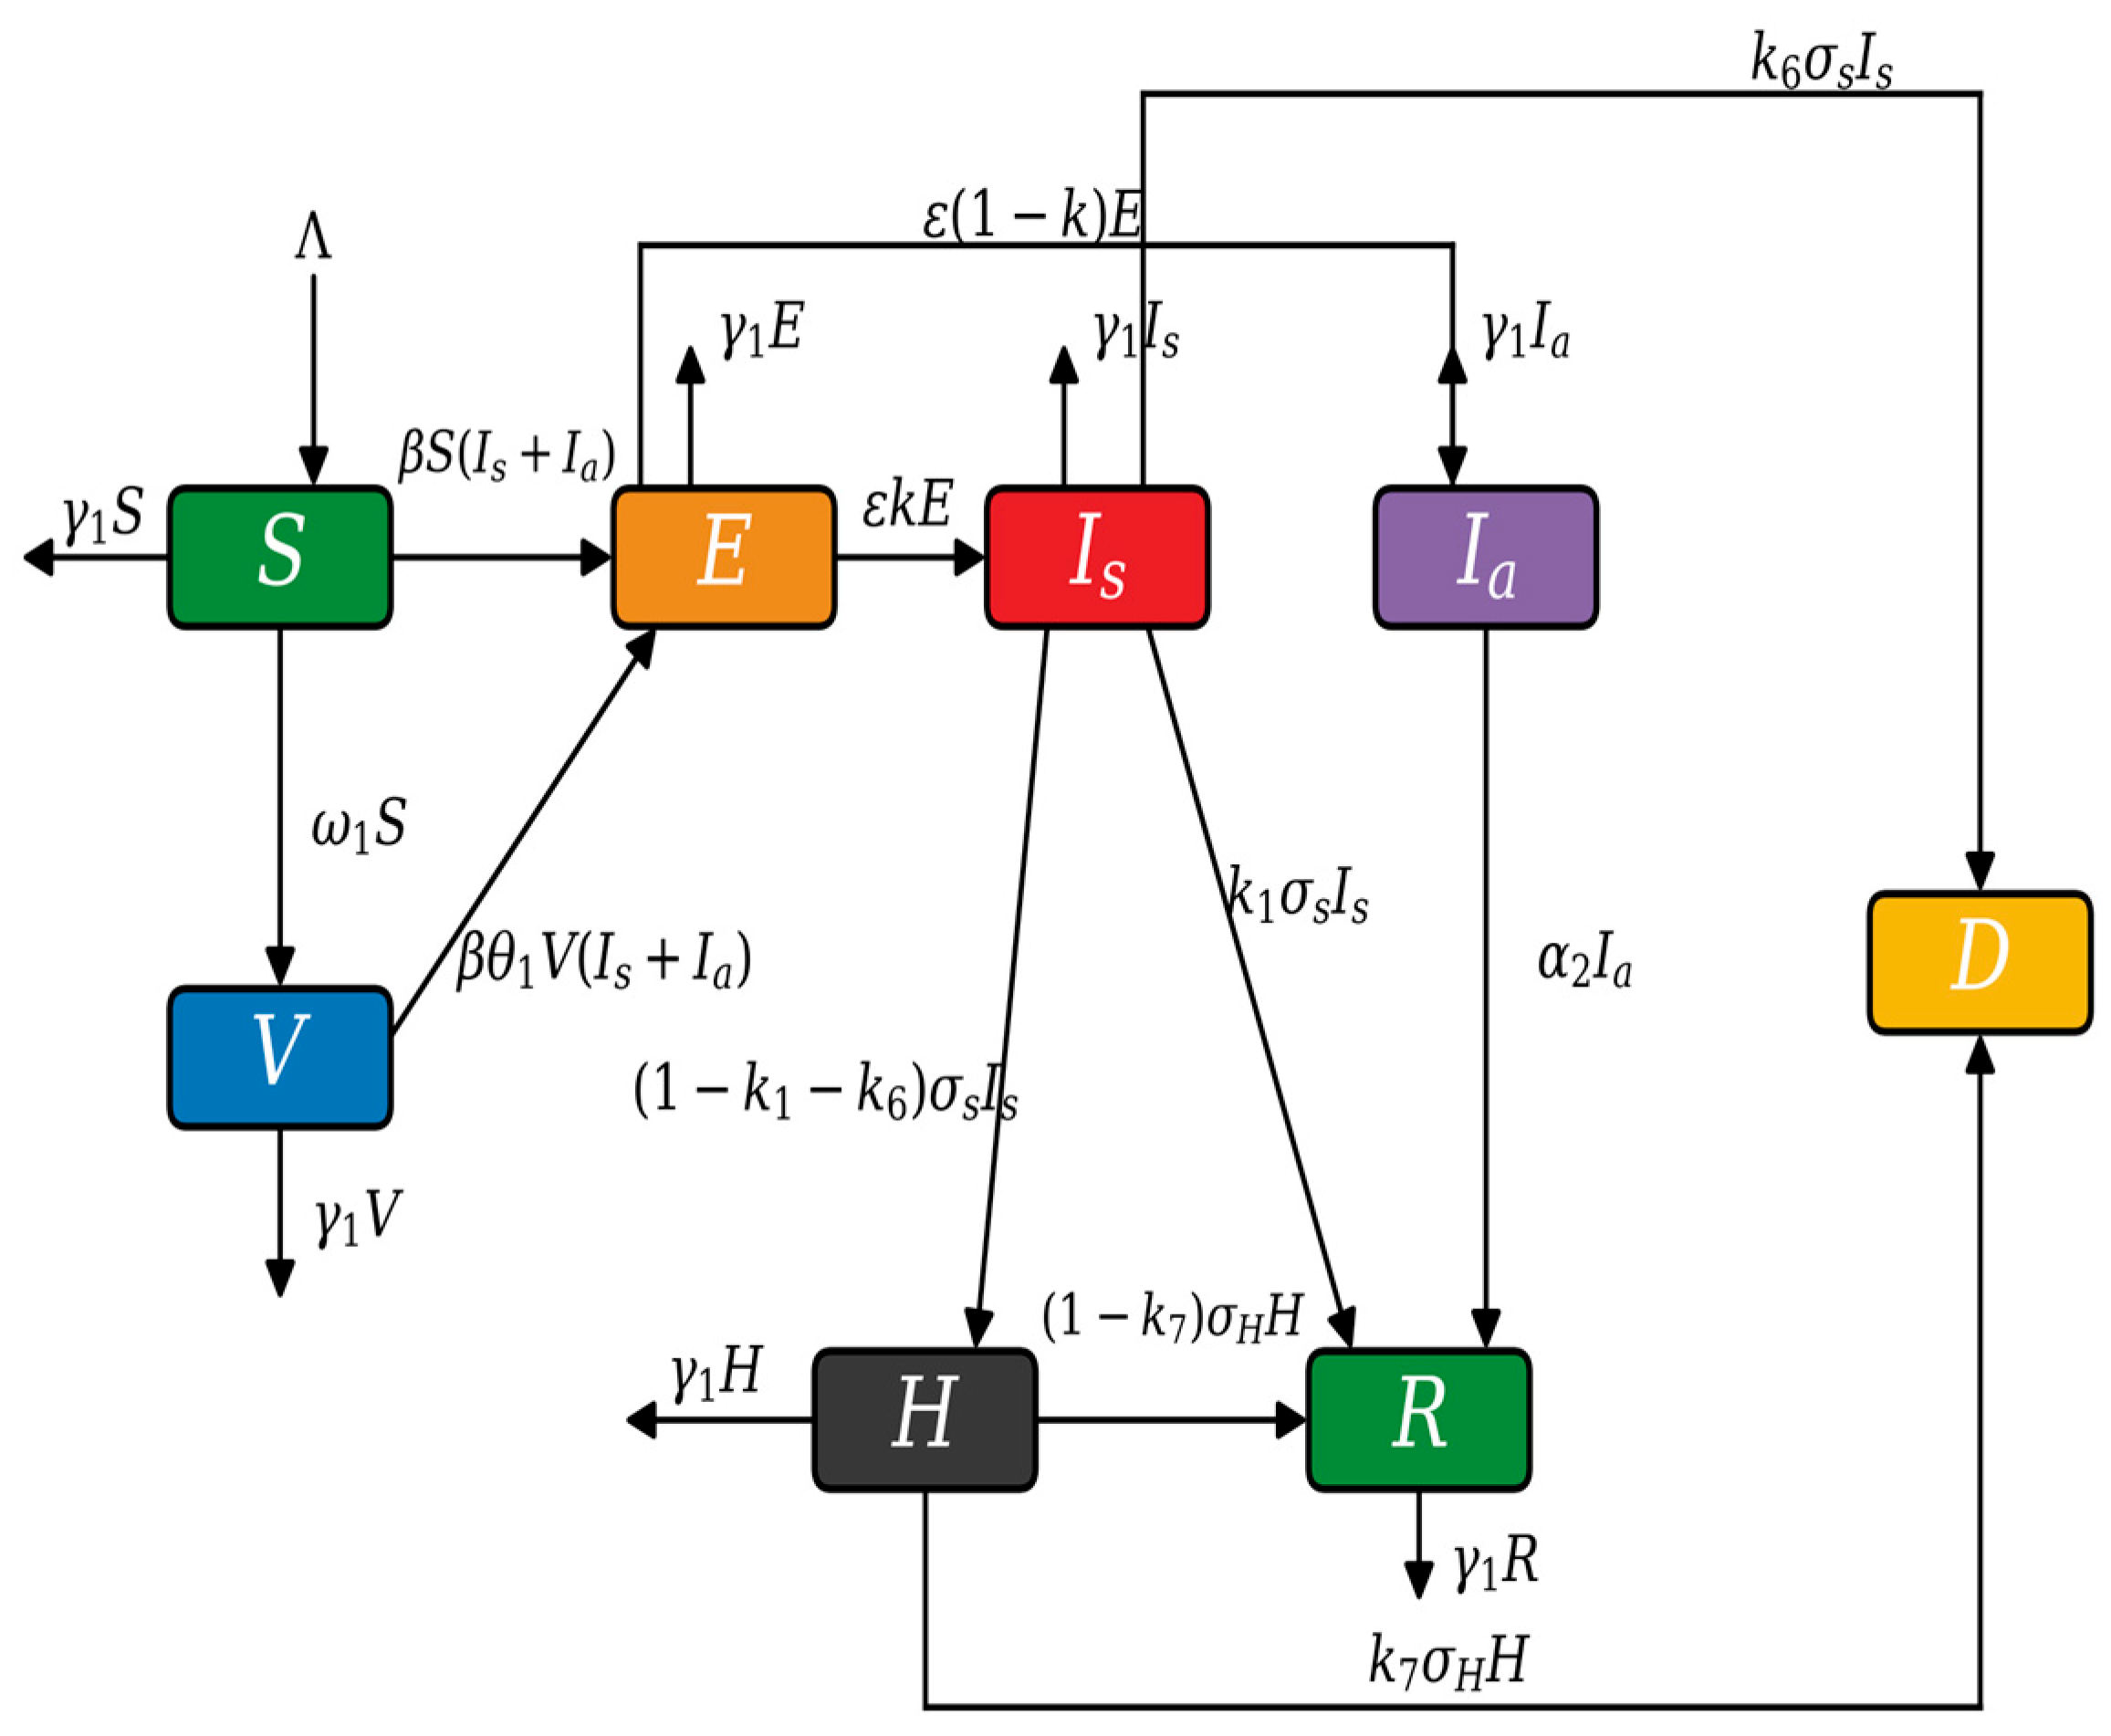
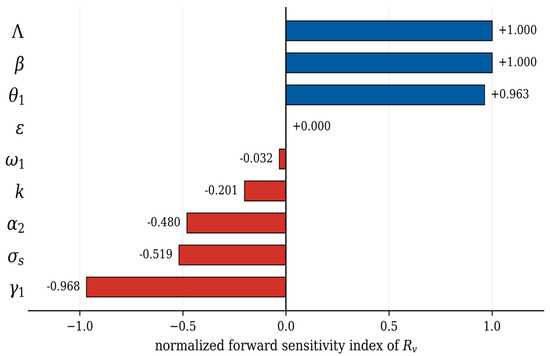
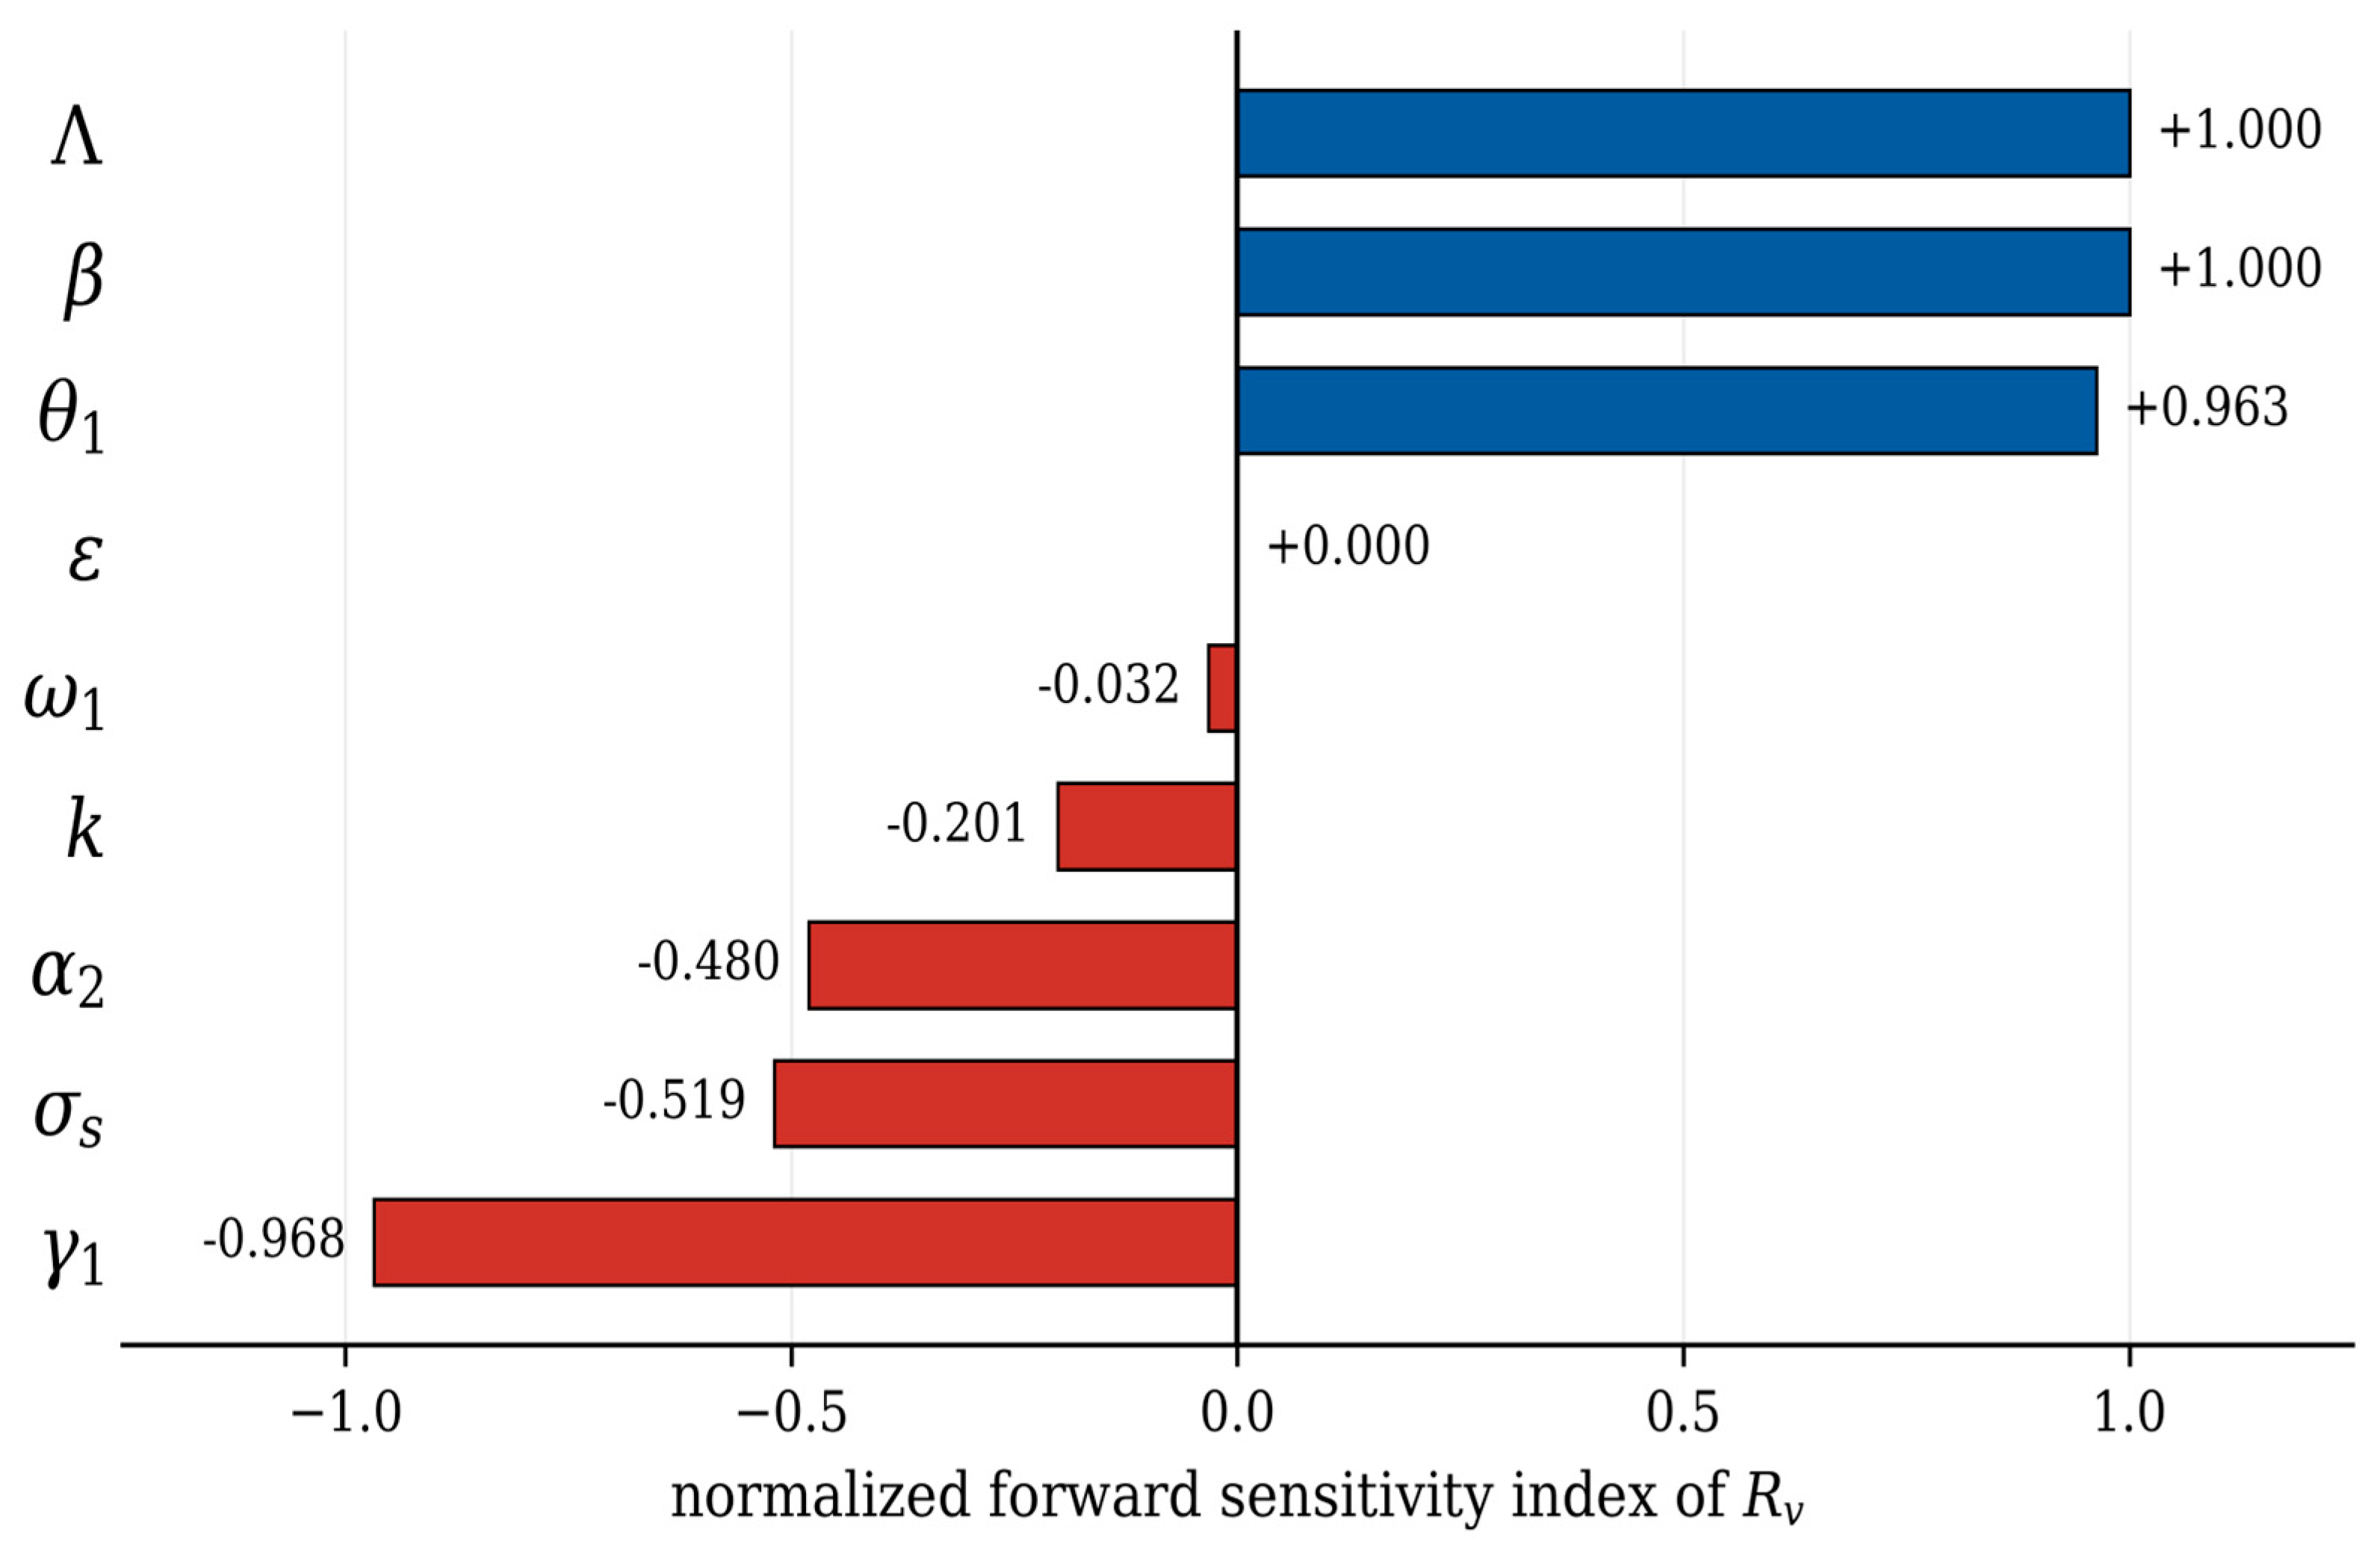
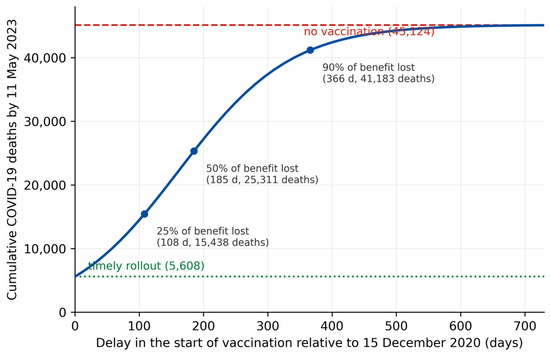
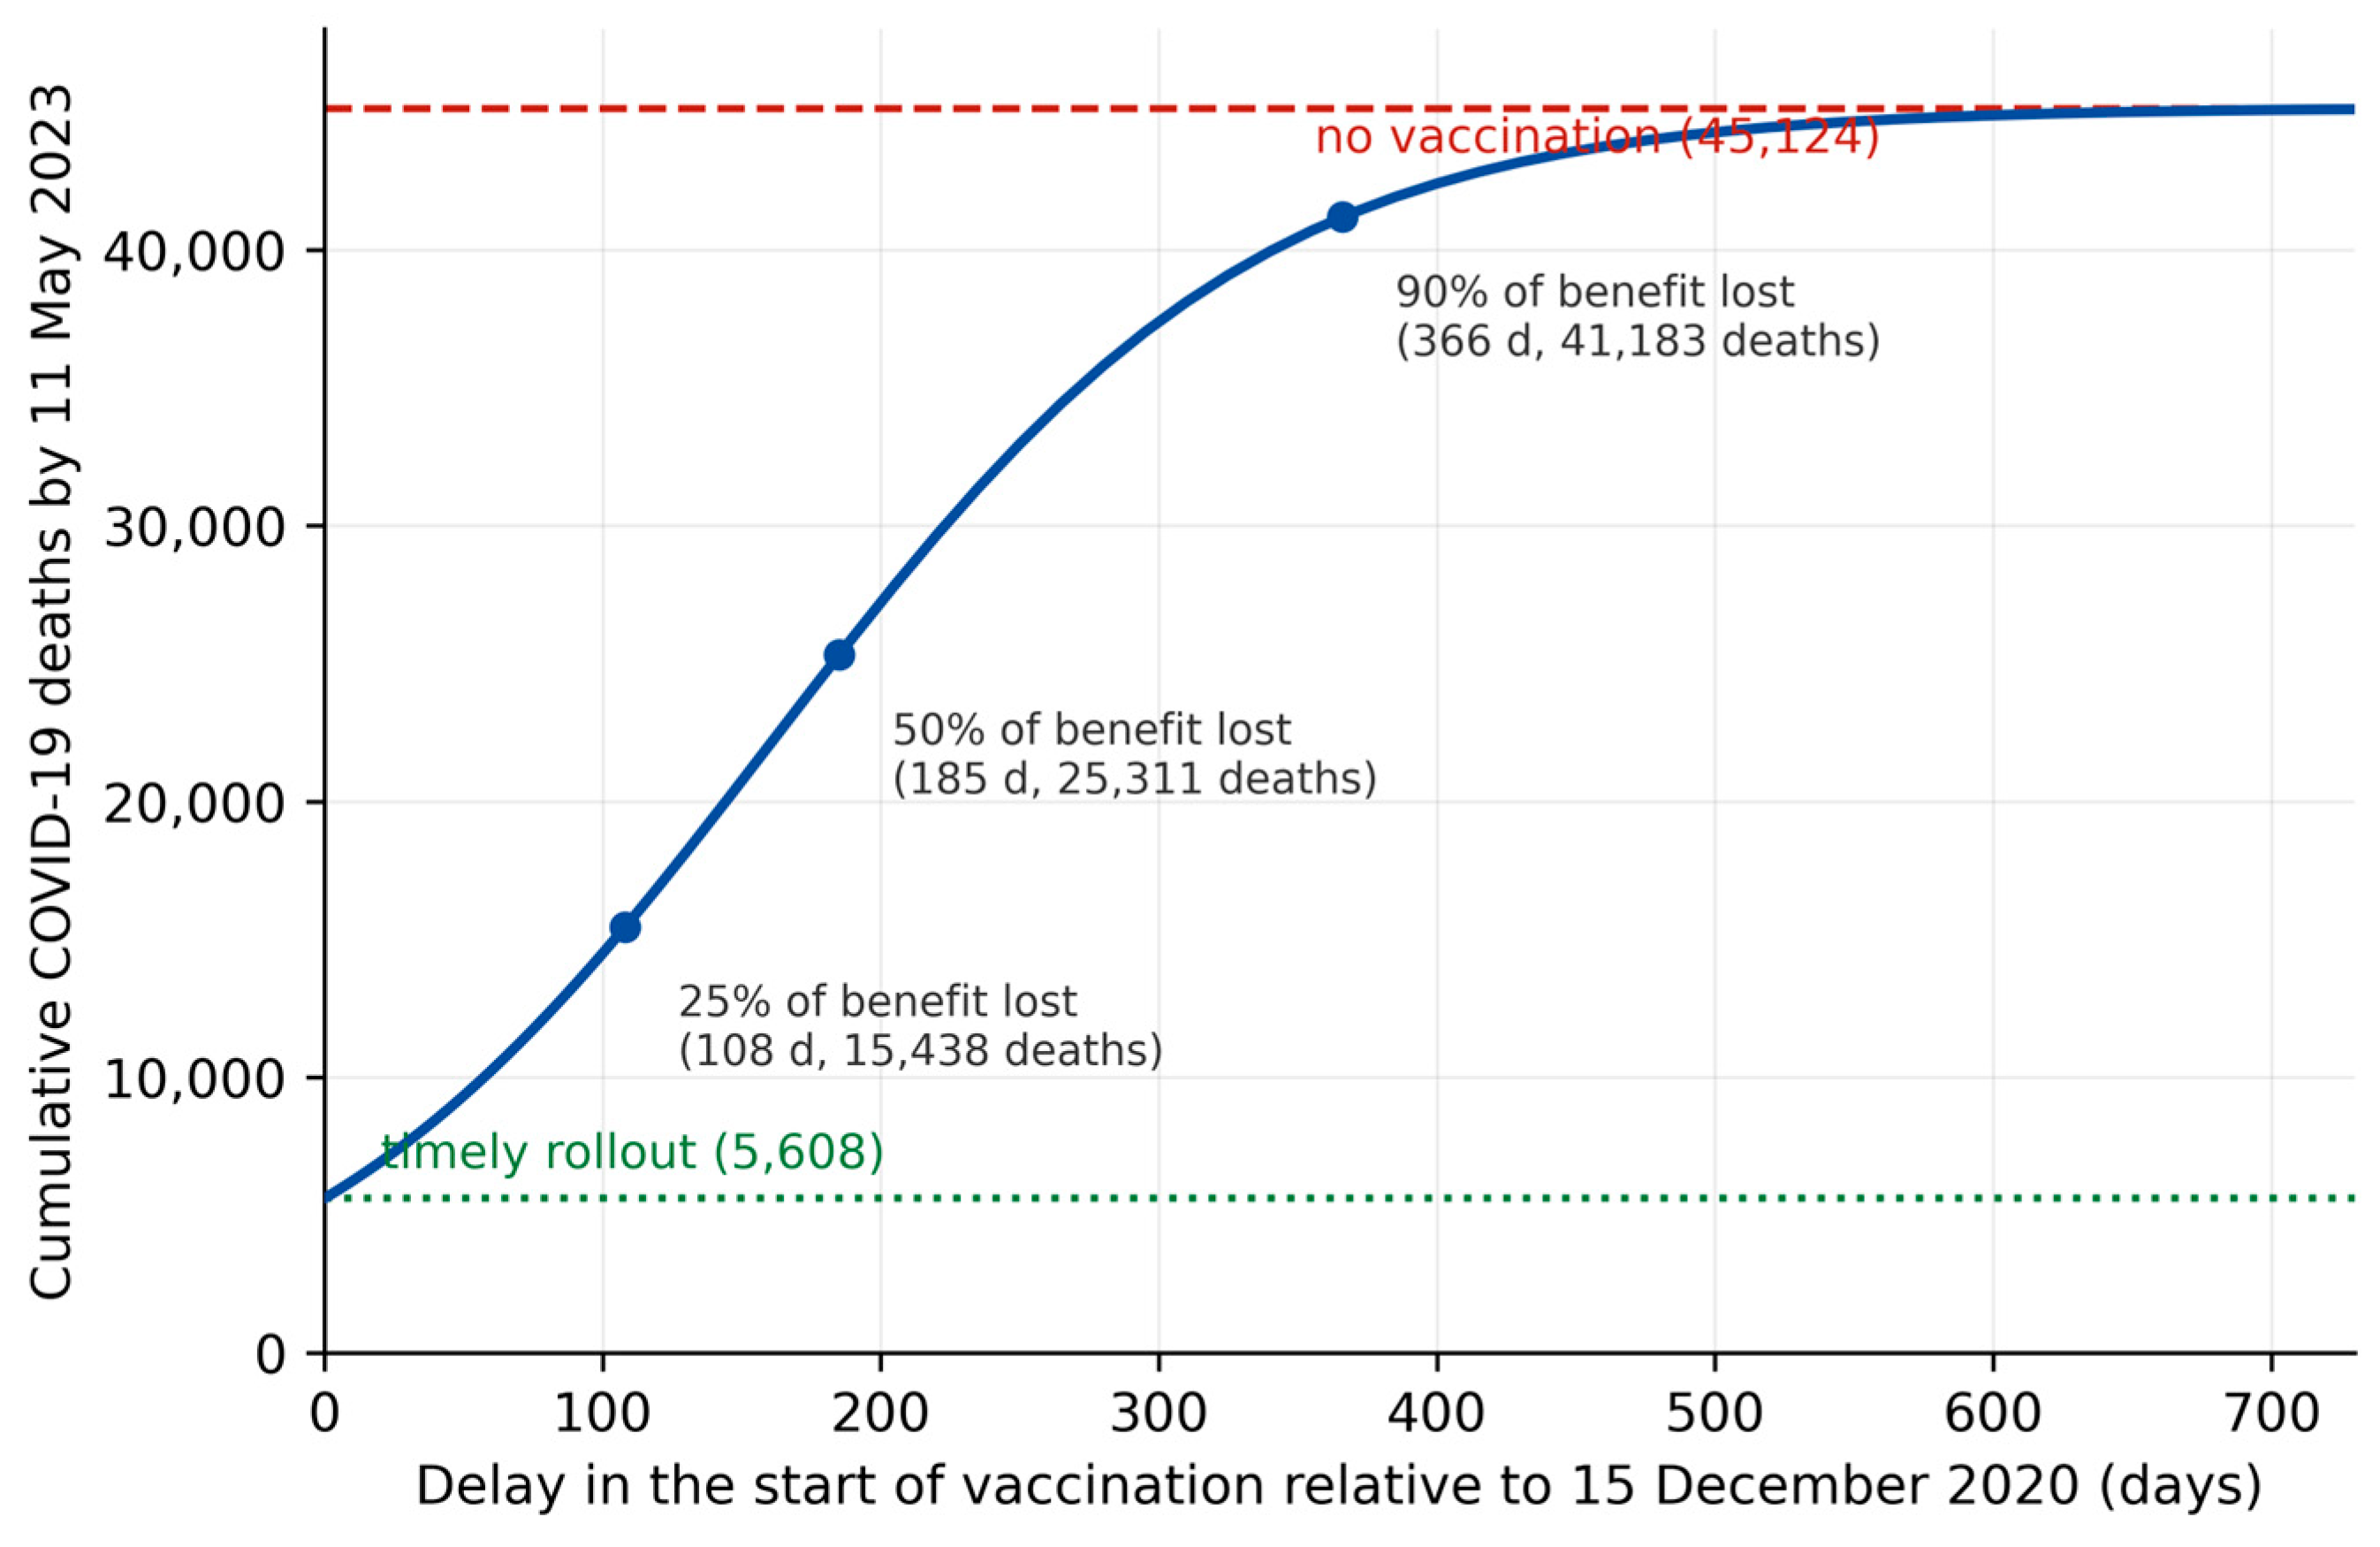

Disclaimer/Publisher’s Note: The statements, opinions and data contained in all publications are solely those of the individual author(s) and contributor(s) and not of MDPI and/or the editor(s). MDPI and/or the editor(s) disclaim responsibility for any injury to people or property resulting from any ideas, methods, instructions or products referred to in the content. |
© 2026 by the author. Licensee MDPI, Basel, Switzerland. This article is an open access article distributed under the terms and conditions of the Creative Commons Attribution (CC BY) license.