


Abstract
Over two years, a randomized complete block field trial tested deficit irrigation [I: 70% ETc; NI] and ammonium nitrate [N0, N60, N120; 0, 60, 120 kg N ha−1] application in two northern Greece winegrape vineyards of cv. ‘Xinomavro’ (XM) and cv. ‘Cabernet Sauvignon’ (CS). Leaf-blade δ15N was measured at berry set, bunch closure, veraison, and technological maturity; berry-juice (must) δ15N at technological maturity and dormant cane δ15N in winter were also determined. In the first year, δ15N was additionally measured in petioles, unripe berries, trunks, and roots, along with arbuscular mycorrhizal fungal (AMF) colonization of fine roots. Fertilization increased δ15N in leaf blades and canes, whereas berry-juice δ15N responded weakly and inconsistently. Irrigation marginally lowered cane δ15N; cane δ15N varied between years, and berry-juice δ15N showed the highest variability across treatments. At berry set, intravine discrimination was evident: young berries and leaf blades were enriched, while fine roots and woody tissues were depleted. Root δ15N responses differed between cultivars and depended on AMF colonization in XM. Leaf and cane δ15N were positively related to vine N status, yield, and pruning weight but negatively to agronomic N-use efficiency indices. These findings indicate that δ15N serves as an integrative proxy of N cycling processes and fertilizer-use efficiency in vineyards, with potential implications for the assessment and optimization of sustainable vineyard management practices in the context of climate change.
1. Introduction
Chemical elements—C, N, O, S, and H—occur as multiple stable (non-radioactive) isotopes. N (N) has two stable isotopes in nature: the lighter and far more common 14N (99.6337%) and the heavier 15N (0.3663%) [1]. A sample’s N isotope composition is reported as its δ15N value, using the delta (δ) notation in parts per thousand (‰), which measures the relative deviation of a sample’s 15N/14N ratio from an international standard—atmospheric N2 gas [2].
Isotope effects—the change in a reaction rate or equilibrium constant between reactions that differ only in the isotopic composition of one or more otherwise chemically identical components [3]—accompany many fractionating physical, chemical, and biological processes, leading to isotope discrimination against the heavier isotopes; as a result, process-driven shifts in isotope composition can reveal underlying mechanisms, making natural-abundance stable-isotope analysis a powerful tool for studying plant–environment interactions [4].
Plant tissue δ15N reflects both the isotopic composition of N sources and fractionations during soil and plant N transformations, making it an integrative proxy of N cycling, although its interpretation is often non-unique [5,6]. In terrestrial ecosystems, plant and soil δ15N are shaped primarily by the isotope signatures of external N inputs [6,7,8], fractionating soil N processes that often enrich δ15N in N-rich, ‘open’ systems [4,6,9,10], and plant uptake and internal processing, including mycorrhizal effects that can lower foliar δ15N in N-poor, strongly mycorrhizal systems [1,6,7,9,11], while climate, hydrology, and land use further modulate these patterns [6,8,12,13].
Climate change is strengthening constraints on viticulture by altering temperature and water regimes that control grapevine growth, yield, and berry composition [14]. Improving the efficiency of primary inputs—water and N—has therefore become significant to sustainable vineyard management.
N modulates vine vigor, canopy development, and photosynthetic capacity [15] and influences yield and must composition [16] and ultimately wine composition [17]. However, grapevine responses to N fertilization vary [18,19] because outcomes depend on fertilizer rate [20], timing of application and rootstock [18,21], or grapevine variety [19]. Although water and N responses are closely coupled in multiple ways [15,22,23], many field studies still address water or N alone, limiting inference about their combined effects on vine performance and N cycling.
In grapevine research, δ13C of berry sugars (purified or not) at maturity is a widely used, season-integrated proxy of vine water status and is well studied [24]. In contrast to δ13C, N natural-abundance δ15N in grapevines remains comparatively little explored, despite long-standing use of enriched 15N tracers and extensive studies in terrestrial ecology [24,25].
Early work showed that vine δ15N can vary widely with vineyard floor management (e.g., clover versus grass covers), associated differences in soil N cycling intensity, and spatial contrasts in N sources [26,27]. Subsequent studies demonstrated consistent δ15N differences among terroirs, strong enrichment under organic compared with inorganic fertilization, and stable, topography-linked spatial structure of δ15N within vineyards [25,28]. Water deficit has been shown to lower leaf total N and δ15N, through restricted uptake of soil N and increased reliance on 15N-depleted internal reserves, while δ13C (when not confounded by exogenous C inputs) and δ15N together provide sensitive indicators of water–N interactions in grapevines [29]. Detailed intra-leaf and within-canopy sampling revealed substantial heterogeneity in δ13C, δ15N, and N among leaf positions and along shoots, emphasizing the need for standardized leaf sampling protocols [30]. At the wine level, δ15N in must and wine—particularly in wine proline and in wine solid residues—closely reflects soil and vine N isotope signatures, and wine C/N and δ15N respond systematically to water deficit and to competition from cover crops, thereby recording the combined effects of water status and N supply pathways [31,32,33].
Despite substantial progress over the past decade, factorial experiments that concurrently manipulate irrigation and N fertilization—thereby reflecting commonly adopted vineyard management—remain limited. Moreover, there are no studies that track δ15N across vine organs and phenological stages under factorial manipulation of water and N, constraining interpretation of how management practices modulate N-isotope fractionation and internal isotope partitioning. A further knowledge gap concerns the contribution of mycorrhizal symbioses to grapevine N isotope composition under field conditions at natural abundance levels. AMF substantially enhance grapevine P uptake, can contribute to N uptake, can improve drought tolerance under some conditions, and mediate N transfer from cover crops via extraradical hyphae [34,35,36]. While N natural-abundance studies in other plant species indicate that mycorrhizal symbiosis—especially ectomycorrhizal and ericoid—is associated with systematic shifts in plant δ15N [1,37], this specific δ15N effect has not yet been investigated in grapevine.
This study aims to address these gaps by quantifying δ15N responses in leaf blades, dormant canes, and berry juice under contrasting irrigation and N fertilization regimes in two cultivars (‘Xinomavro’ and ‘Cabernet Sauvignon’). We hypothesized that (i) irrigation deficits would shift tissue δ15N by altering soil N cycling; (ii) higher N inputs would increase tissue δ15N, reflecting the isotopic composition of the fertilizer and fertilization-induced changes in soil N loss pathways; and (iii) δ15N responses would vary among organs and across phenological stages due to seasonal changes in N allocation, sink strength, and symbiotic interactions with arbuscular mycorrhizal fungi. By examining these relationships, we evaluate δ15N as a proxy indicator of vineyard N dynamics. To achieve these objectives, we conducted a replicated field experiment over two consecutive growing seasons.
2. Materials and Methods
2.1. Experimental Vineyard and Trial Design
The experiment was conducted for two consecutive growing seasons in two commercial vineyards (18 years old) located in the Goumenissa region of northern Greece (40°52′ N, 22°29′ S). The vineyards were planted with the red winegrape Vitis vinifera L. cultivars ‘Cabernet Sauvignon’ (CS) and ‘Xinomavro’ (XM), both grafted onto 1103 Paulsen rootstock. Vineyards had identical planting configuration, with 2.2 m between rows and 1.3 m between vines within rows and rows oriented north–south. Vines were spur-pruned to 12 buds per vine and trained to a bilateral Royat system supported by three fixed trellis wires. ‘Cabernet Sauvignon’ (widely cultivated, well-characterized cultivar) and ‘Xinomavro’ (indigenous and widely cultivated to PDO regions in northern Greece, with contrasting vigor and phenology) were chosen to represent distinct genetic backgrounds and management contexts common in the region.
Soils differed between vineyards, being clay loam in the CS site and sandy clay loam in the XM site; effective rooting depth averaged 60–90 cm in both vineyards. Climatic conditions were broadly comparable between seasons over the April–September period.
Within each vineyard, three blocks were delineated. Each block comprised a 2 × 3 grid of six plots, with six vines per plot. Plots were separated by four guard vines along the row and buffered by adjacent guard rows on both sides. Treatments consisted of two irrigation regimes—irrigated (I), supplying 70% of crop evapotranspiration (ETc), and non-irrigated (NI)—combined with three ammonium nitrate application rates: 0 (N0), 60 (N60), and 120 (N120) kg N ha−1. The N60 rate approximates the commonly applied rate within the regional recommendations for mature, moderately yielding vineyards, whereas the N120 rate represents the upper bound of these recommendations and was included to test response limits. Treatment combinations were randomly assigned within each block, following a randomized complete block design (2 irrigation levels × 3 ammonium nitrate rates × 3 blocks), resulting in 18 plots per vineyard. Plot means were used for statistical analyses.
Drip irrigation commenced at berry set (E–L 27, modified Eichhorn–Lorenz system) in both years and was applied weekly, based on potential evapotranspiration estimates derived from an automated weather station located in the XM vineyard. Ammonium nitrate (34–0–0) was surface-applied at budburst in both seasons.
2.2. N Isotope Composition, N Content, and Arbuscular Mycorrhizal Fungal Colonization
N stable isotope composition (δ15N) and total N concentration (N%) were determined in the bulk dry matter of leaf blades collected at four phenological stages within each growing season: berry set (BS), bunch closure (BC), veraison (VE), and maturity (MT) according to the modified Eichhorn–Lorenz system. Leaf samples were oven-dried at 65 °C and milled to a fine powder using a rotary mill fitted with a 0.20 mm mesh. Subsamples (2.8 ± 0.1 mg) were weighed into tin capsules (SC0009; 8 × 3 mm; SerCon Ltd., Gateway, Crewe, UK) and analyzed using an automated combustion elemental analyzer coupled to a continuous-flow isotope ratio mass spectrometer (IRMS; PDZ Europa, Cheshire, UK). Given the intra-leaf and intra-canopy variability documented by Spangenberg et al. [30], leaf sampling was standardized to basal node positions on the shoot.
For N% and δ15N analysis of canes, twelve canes per plot were randomly collected during dormancy. A segment from the mid-portion of each cane—comprising a latent bud and the internode immediately below the bud—was excised and processed for δ15N following the same drying, grinding, and analytical protocol applied to leaf blades.
At technological maturity (late September in both years for both cultivars), all clusters from each plot were harvested and transported to the laboratory. A composite subsample of 200 berries, randomly selected from all positions within each cluster, was hand-pressed to obtain must. Following immediate clarification of the must (0.2 NTU), a 5 µL aliquot of bulk must was directly injected into the IRMS for δ15N determination.
To further investigate within-vine isotope composition, samples were collected at the BS stage from leaf blades and the corresponding petioles, as well as from fine roots, young green berries, and trunk wood cores. For trunk wood, the outer 2.5 cm of wood was sampled after bark removal using a 5 mm diameter borer inserted at mid-trunk height. Cores were obtained from each of the four central vines per plot. Fine roots were collected from the same four central vines by excavating on both sides of the planting row to a depth of up to 30 cm. Root material was subdivided: one subsample was washed to remove adhering soil particles and then dried following the same procedure used for leaves prior to isotope analysis, whereas a second subsample was placed immediately into sealed bags and transported to the laboratory for assessment of arbuscular mycorrhizal fungal colonization, following the method described by Karagiannidis et al. [38].
In all cases, results were referenced to atmospheric molecular N, which is the reference standard for stable N isotope ratios and, by convention, is assigned a δ15N value of 0‰. Sample δ15N was calculated according to Equation (1) [4]. Analytical precision, incorporating both instrument variability and sample preparation error, was 0.16‰ (SD; n = 6) for N isotope composition. Fertilizer δ15N values were −2.07‰ and −2.27‰ in the first and second year, respectively.
where Rsample and Rstandard are the isotope ratios R of the sample and standard, respectively.
At dormancy, cane N content (per unit row length) was computed as total N concentration × cane dry biomass; cane dry biomass was obtained from cane fresh mass adjusted for mass loss during oven-drying (cane fresh mass × (fraction remaining after drying)). Berry juice N content at harvest was calculated as the product of total N concentration in the juice and berry juice volume per unit length of planting row [22,39].
During the winter of the first experimental year, soil was sampled at upslope and downslope positions in each vineyard, and two composite samples were prepared per vineyard. Samples were collected from two depth intervals (0–30 cm and 30–60 cm) and analyzed for N isotope composition following the method described by Stamatiadis et al. [27].
2.3. Grapevine Biomass Production and Agronomic Use Efficiency for Water and N
Measurement of grape and cane biomass have been reported previously in Taskos et al. [40]. To evaluate grapevine performance beyond annual biomass production components (canes and fruit), we computed simple agronomic indices of water- and fertilizer-use efficiency for each production component. Water-use efficiency for cane production (WUEw) and grape production (WUEg) was calculated as the ratio of the fresh biomass of the respective component to the total seasonal water input (irrigation applied + rainfall) [41,42]. Values were determined for each growing season and expressed as g·L−1 ·m−1 length of planting row.
While the definition of NUE is inherently complex and its meaning context-dependent [43], simple expressions of it, like Partial Factor Productivity (mass of harvested fresh product per mass unit of nutrient applied; PFP) and Partial Nutrient Balance (total nutrient mass recovered in each biomass component—the N content—per unit mass of nutrient applied; PNB), can be useful in the assessment of fertilizer use efficiency in agronomic terms [44,45]. These indices were quantified for each biomass component using the difference method [22,46]. Within each irrigation level and replication block, the N0 fertilizer treatment served as the control against which fertilized treatments were compared. Unfortunately, it was not possible to estimate these indices for leaf biomass under our experimental design. This represents a limitation of our study that should be considered in future research.
2.4. Statistical Analysis
In both experimental vineyards, treatment effects on vine attributes were assessed using a randomized complete block design with three replicated blocks and repeated measurements over two consecutive years (2009–2010). The experimental factors comprised two irrigation regimes and three N fertilization rates. Fixed and random effects were quantified using linear mixed-effects modeling, with covariance parameters estimated by restricted maximum likelihood (REML). The Kenward–Roger degrees of freedom approximation was specified. For leaf variables sampled repeatedly within a growing season, sampling growth stage was included as an additional factor with repeated measurements in the mixed model to account for within-season temporal variation.
Vineyard, year, irrigation, fertilization, and growth stage were specified as fixed effects, whereas block was treated as a random effect. Because each vineyard was planted with a different cultivar, the vineyard term represents a composite effect that combines varietal differences with site-specific conditions (e.g., soil characteristics). This limitation prevents us from conclusively disentangling varietal and environmental effects. Treatment mean separation among fixed-effect levels was performed using the Tukey–Krammer adjustment at p < 0.05. Statistical analysis was performed using the SAS software version 9.4 developed by SAS Institute (Cary, NC, USA). Graphical outputs were generated either in R software (version 4.5.2) made by the R Core Team 2025 (Vienna, Austria) or in SAS.
3. Results
3.1. Weather Conditions
Both years (2009–2010) had similar seasonal profiles (April to September) for mean air temperature and cumulative heat summation (Figure S1B,C). However, they differed in the monthly precipitation patterns, despite the similar total amount of rain (226 mm for 2009 and 207 mm for 2010, as the vineyards received more than twice as much rain during the final stages of grape maturation in September of the second year (Figure S1A). The first year had a more even precipitation distribution across the growth season. These temperature and precipitation profiles were typical of the regional climate.
3.2. Soil Properties
3.3. AMF Root Colonization
AMF colonization was observed in vine roots from both vineyards (Figure S4); however, mean colonization did not differ significantly between vineyards (62.61% and 64.83% for CS and XM, respectively; F = 1.28, p = 0.2685). Neither irrigation nor fertilization significantly affected colonization (all p ≥ 0.40). Increasing AMF colonization was associated with lower fine-root δ15N in XM (Figure 1A), whereas CS roots remained stable despite similar mean colonization levels).
Figure 1.
Association of AMF root colonization with root δ15N (A): R2 = 0.44; p = 0.0095; y = 4.0958 − 0.0731x and discrimination between fine roots and petioles Δpetiole-root (‰) (B): R2 = 0.44; p = 0.0038; y = −13.2475 + 0.1592x at berry set in the Xinomavro vineyard (Year 1).
3.4. Grapevine Performance
Variations in both reproductive and vegetative growth of grapevines were observed in response to fertilization and irrigation treatments, as well as between the two vineyards and across different years (Table 1). The F-values derived from Type 3 tests of fixed effects are provided in Table S2.
Table 1.
Effects of year, irrigation, and N fertilization on vine biomass, agronomic water-use efficiency, and N-use-efficiency indicators in the two vineyards.
Vines that received fertilization, particularly those treated with a higher N rate, demonstrated increased productivity in terms of grape yield and dormant wood weight. Although higher grape yields and cane mass were observed in the irrigated XM vines, no significant effects of irrigation were observed in the CS vineyard. However, water use efficiency for grapes and dormant canes production was consistently lower under irrigation across both vineyards. This effect was particularly pronounced in the CS vineyard, where non-irrigated vines exhibited a 2.5-fold higher WUEg compared to a 1.9-fold difference in the XM vineyard. In the opposite direction, increasing N rate resulted in higher WUEg and WUEw compared to N60 and N0 vines, regardless of vineyard.
Within fertilized treatments of both vineyards, the N60 rate resulted in higher PFP and PNB for both grape and wood production compared to the N120 rate. A positive effect of irrigation was evident in the higher PFP(g,w) and PNBw of XM vines, whereas PFP and PNB were unaffected by irrigation in the CS vineyard.
Year-to-year variations in grapevine productivity, WUE, and N use efficiency indicators were inconsistent between the two vineyards, apart from higher PNBw observed in the first year.
3.5. Leaf N Concentration and δ15N
Ammonium nitrate application significantly increased total leaf N and δ15N values in both vineyards (Table 2). While both N60 and N120 treatments elevated total leaf N in CS vines, only N120 demonstrated this effect in XM vines (Table 2). All three fertilization treatments resulted in significantly distinct leaf δ15N values, with average differences of 0.55‰ and 0.43‰ observed in CS and XM vineyards, respectively (Table 2).
Table 2.
Main effects on total N (N) concentration, N content (Nc), and N isotope natural abundance (δ15N) in leaf blades, must, and canes.
Irrigation did not impact leaf δ15N in the XM vineyard but led to a decrease in the CS vineyard (Table 2). However, this irrigation effect was significant in CS only during the first year of this study, indicating an interaction between year and irrigation (F = 8.24; p = 0.0066). No significant irrigation effects on leaf N content were observed.
Leaf δ15N was higher at the BS stage and subsequently decreased until bunch closure, remaining relatively stable thereafter until maturity (Table 2). This trend was more pronounced in the fertilized treatments within the CS vineyard (Figure 2). Total leaf N decreased by 42% from BS to maturity in CS and by 35% from BS to BC in XM (Table 2). Despite similar total leaf N values between vineyards, CS leaf blades exhibited a 0.66‰ enrichment in 15N compared to XM (Table 2).
Figure 2.
Effects of N fertilization on N isotope composition (δ15N; (A,B)) and total leaf N (C,D) by vineyard and growth stage. Within each vineyard and N level, different letters indicate significant differences among growth stages at p < 0.05. Vertical bars represent standard errors. N fertilization: Ν0, unfertilized; N60, 60 kg N∙ha−1; N120, 120 kg N∙ha−1. Growth stage: BS, berry set; BC, bunch closure; VE, veraison; MT, maturity.
While no interannual variation in leaf δ15N was observed, total leaf N was higher in CS during the first year (Table 2).
3.6. N Content and δ15N in Berry Juice and Canes
The variation of juice δ15N was the result of the fertilization treatments, whereas that of cane δ15N was the outcome of strong year and fertilization effects and to a lesser extent of irrigation (Table S2).
As for leaf blades, the fertilized treatments in both vineyards had distinct higher δ15N values in their canes, whereas cane total N concentration and cane content of total N differed only in the CS N120 vines (Table 2). δ15N in berry juice was apparently higher in the N120 treatment of CS compared to N0 (Table 2), but this effect was not consistent in both years, owing to a significant interaction between fertilizer rate and growth season (F = 6.44, df = 38, p = 0.0039). N isotope natural abundance in the juice of XM berries responded inconsistently to the fertilization treatments despite the concentrations and contents of total N being higher in the N120 treatment of this vineyard (Table 2). A small depletion effect was observed in cane δ15N of the irrigated vines of both vineyards, whereas juice δ15N did not differ between the irrigation treatments (Table 2). Cane δ15N values were higher in the first year (Table 2) of this study. Overall, the effect of year led to a range in cane δ15N values that was comparable to the range between the means of N0 and N120 vines (Table 2).
3.7. Within Vine Variation of δ15N
When the δ15N values of all treatments were considered, berry juice exhibited the greatest variability in δ15N values compared to leaves and canes (Figure 3). This pattern of δ15N variation among leaves, berry juice, and canes remained largely unaffected by fertilization treatments, apart from elevated berry juice δ15N in the N60 XM vines during the second year (Figure S5). Despite the differences in δ15N variation, the three vine components did not differ significantly in their mean δ15N values (Figure 3).
Figure 3.
Variation in N isotope natural abundance (δ15N) among canes, leaves, and berry must across two vineyards over two growing seasons. For leaves, mean values across the four growth stages (BS, BC, VE, and MT) were calculated using data from both years. Within each vineyard, mean δ15N values did not differ significantly among tissues at p < 0.05. Vertical bars represent standard errors. Circle symbols correspond to extreme values.
However, the N isotope natural abundance data collected at berry setting in the first year of the experiment in leaf blades, petioles, green berries, root, and trunk indicate significant discrimination between these vine components (Figure 4A). For a more comprehensive analysis, these data were compared to δ15N of juice and canes for the same year. Young green berries and leaf blades were the most enriched vine organs in both vineyards, whereas the roots of CS vines and the trunk along with the petioles of XM vines were the most depleted organs (Figure 4A). These vine organ effects resulted in a maximum discrimination of 3.94‰ (SE = 0.51, p < 0.0001) between green berries and roots in the CS vines and 6.04‰ (SE = 0.52, p < 0.0001) between berries and the trunk in the XM vines. The higher δ15N values in green berries and leaf blades corresponded to higher concentrations of total N in these organs in both vineyards (Figure 4B).
Figure 4.
Organ-specific differences in N isotopic composition (δ15N) (A) and total N (N) concentration (B) during the first year. Measurements were taken at berry set (young berries, leaf blades, petioles, fine roots, and trunk), at harvest (must/juice), and at dormancy (canes). Organs sharing the same letter are not significantly different at p < 0.05.
The association between total root N and root δ15N differed markedly between the two vineyards (Figure 5). In CS, root δ15N increased significantly with rising total root N, following a quadratic trend. At low N concentrations (~0.2–0.3%), δ15N values were strongly negative (approximately −4.00‰), whereas at higher concentrations (~0.6%) they approached 0‰. Conversely, XM exhibited no significant relationship between root δ15N and total root N, with δ15N values remaining slightly depleted on average (−0.69‰).
Figure 5.
Relationship between total N (N) concentration and N isotopic composition (δ15N) in fine roots at berry set during the first experimental year. Cabernet Sauvignon: R2 = 0.81, p < 0.0001, y = −9.3635 + 27.0905·x − 20.5910·x2; Xinomavro: R2 = 0.13, p = 0.1595.
In XM, discrimination against the 15N isotope among petioles and root was significantly influenced by the extent of AMF root colonization (Figure 1). No comparable pattern was detected in CS.
Leaf δ15N and cane δ15N exhibited a positive correlation with total N concentration in leaves across both vineyards and years (Figure 6). The slopes of the regression lines did not differ significantly (p < 0.05) between vineyards or between the two years (Figure 6). Significant differences were observed only in the intercepts between vineyards and between years for the CS vineyard (Figure 6).
Figure 6.
Relationships between total N (N) concentration and N isotopic composition (δ15N) in leaf blades (A) and canes (B) in two vineyards, shown separately for each experimental year. Leaf data represent seasonal means across four growth stages within each year. All relationships were significant (p < 0.05). Circle and cross symbols correspond to CS and XM, respectively.
In addition to their positive correlations with total leaf N concentrations, leaf and cane δ15N were also positively correlated (Figure 7). Within each year, regression coefficients for both vineyards did not differ significantly (p = 0.05). Over the years, regression slopes were similar and only the intercepts differed significantly, being higher in the first year (Figure 7).
Figure 7.
Relationship between N isotopic composition (δ15N) in leaf blades and canes in two vineyards, shown separately for each experimental year. Leaf values are seasonal means across four growth stages within each year. All relationships were significant (p < 0.05). In Year 1, R2 = 0.71 for Cabernet Sauvignon and R2 = 0.45 for Xinomavro; in Year 2, R2 = 0.47 for Cabernet Sauvignon and R2 = 0.41 for Xinomavro. Circle and cross symbols correspond to CS and XM, respectively.
4. Discussion
4.1. Grapevine Yield and Growth Performance
The stimulation of grapevine yield and vegetative growth across both vineyard sites resulted in substantial yield gains for the N120 vines relative to the unfertilized control—approximately 59% in CS and 30% in XM (Table 1). These responses show that vines in both sites were N-responsive under the prevailing conditions, consistent with previous work on N effects in grapevine [22,47]. Since NUE and N availability each modulate vine N status [48], the resultant growth and yield responses are best explained by their combined effect.
However, the efficiency of this production gain declined with increasing N supply. While the N120 treatment maximized gross yield, it resulted in significantly lower PFP and PNB values compared to the moderate N60 rate (Table 1), consistent with findings from 15N-labeled fertilizer studies [22]. This decline indicates a saturation-type response where N uptake and assimilation capacities plateau despite increasing soil N availability [49]. Consequently, a substantial portion of the applied fertilizer in the N120 treatment was not converted into harvestable biomass. This unutilized fraction represents a decreased NUE, implying a heightened risk of environmental losses through leaching or volatilization [22,49]. However, because N losses were not directly measured, the fate of the unrecovered fertilizer N cannot be quantified in this study.
4.2. Leaf N Isotope Composition
4.2.1. N Availability and Isotopic Enrichment
Increasing ammonium nitrate rate induced a clear, approximately linear increase in leaf δ15N in both vineyards (Table 2; Figure 2), whereas the response of foliar N concentration to fertilization was weaker, particularly in XM where only N120 significantly increased leaf N relative to N0 (Table 2). This enrichment occurred even though the fertilizer itself was 15N-depleted (−2.07‰ and −2.27‰ in the first and second year, respectively) and because of the typically lower δ15N values of ammonium nitrate relative to bulk soil N [8,50,51]. Given that grapevine responses to N fertilization depend on fertilizer rate [20], timing of application [18,21], or grapevine variety [19], the contrasting leaf N responses to the low fertilizer rate likely reflect differences in cultivar sensitivity and/or soil-related effects on N availability.
The observed shift in leaf δ15N indicates that the fertilization regime altered the N cycle within the vineyard ecosystems, likely enhancing fractionating loss pathways (e.g., nitrification, denitrification, NH3 volatilization) that preferentially remove 14N and enrich the residual plant-available N pool [6,52,53]. Specifically, elevated leaf δ15N values are indicative of a more ‘open’ N cycle where high availability drives these fractionating loss pathways [6,8]. Although, we did not measure these processes directly, this interpretation is based on the direction of the isotopic shift and is consistent with patterns described in N-saturated forest ecosystems [54] and other fertilized systems [55,56,57,58,59,60,61]. Consequently, the positive correlation between leaf δ15N and total N (Figure 6A), coupled with the reduced fertilizer use efficiency at higher rates (Table 1), supports the interpretation that the δ15N increase reflects both enhanced N availability and significant environmental N losses [56]. These findings validate the use of leaf δ15N as a potential indicator of the intensity of N cycling under vineyard conditions [54].
4.2.2. Limited Effect of Irrigation on Leaf δ15N
In contrast to the clear fertilization effect, irrigation elicited no consistent response in the δ15N of leaf blades, apart from a marginal decrease in the CS vineyard during Year 1 (Table 2; Interaction Year × Irrigation: F = 8.24, p = 0.0066). This contradicts findings by Spangenberg et al. [29], who reported lower whole leaf (blade + petiole) δ15N under water deficit conditions in ‘Chasselas’ vines. The discrepancy likely stems from the lack of irrigation effects on the N status of the vines (Table 2). Under such conditions, the stress-induced mechanisms proposed to lower whole-leaf δ15N—such as the export of 14N-enriched proline or reduced water-extractable soil N—were likely not activated [29]. However, the lack of irrigation effect in our study aligns with other investigations reporting no significant water-driven isotopic shift [62,63,64], confirming that without some form of N-limitation, water status is not a primary driver of leaf δ15N in these vineyards. Thus, our results indicate that the link between water availability and leaf δ15N in grapevines is not universal but context-dependent [6,25,30]. Leaf δ15N can reflect intraleaf N allocation, potentially explaining declines in δ15N along water availability gradients, particularly in plants with low leaf N [65]. While such patterns are evident at global scales [66], local-scale responses are complicated by N metabolism and cycling [5].
4.2.3. Temporal Dynamics and Physiological Age
Leaf δ15N exhibited a distinct biphasic temporal pattern across both vineyards: values declined during Phase 1 (BS to BC) and remained comparatively stable during Phase 2 (BC to MT) (Table 2; Figure 2). Notably, this isotopic trajectory occurred against a background of continuously decreasing total leaf N concentration (Figure 2). These dynamics likely arise from physiological age-dependent changes in leaf N concentration and absolute N content. As demonstrated by Wermelinger and Koblet [67] and Williams [68], leaf N expressed as absolute content follows a simple saturation-type curve—accumulation followed by stability and a distinct N export at leaf senescence—which closely mirrors the δ15N stability we observed in Phase 2. Conversely, N concentration declines continuously with increasing physiological leaf age due to developmental biomass dilution [67]. Therefore, the early-season decline in δ15N likely reflects the shift from remobilized storage N to newly absorbed soil N during rapid leaf development [69], while the mid-season stability reflects the persistence of mature leaf N pools and retention of the early-season isotopic signal [27]. These points highlight that accurate interpretation of δ15N during leaf development requires coupling concentration-based data with N content estimates, because δ15N values are most useful when the physiological mechanisms and fluxes shaping the isotopic signal are well constrained [70,71]. Additional research is needed to evaluate these interpretations.
The discrepancy between our isotopic observations and the seasonal leaf enrichment reported by Spangenberg et al. [29] underscores the complexity of intraplant N cycling. While both studies documented a consistent seasonal decline in leaf N concentration (Table 2; Figure 1), Spangenberg et al. [29] observed that mid-shoot leaf δ15N increased from flowering to harvest, particularly under well-watered conditions. Such organ-level δ15N shifts likely reflect intraplant δ15N heterogeneity driven by organ-specific N losses, assimilation pathways, and N remobilization/reallocation, processes that often discriminate against 15N [72,73]. Consistently, Spangenberg et al. [30] reported apical leaves 15N-enriched vs. basal leaves (mid-shoot intermediate), implicating N remobilization and reallocation in the observed isotope patterns. Consistent with these explanations, leaf δ15N trajectories were unaffected by fertilization within vineyards, as indicated by the non-significant Vineyard × N × Stage interaction (F = 0.86, df = 57 p = 0.5315), indicating that internal vine regulation dominated over treatment-specific external drivers.
4.2.4. Vineyard Differences
Although substantial genotypic variation in whole-plant and foliar δ15N has been reported [73], the across-season and across-treatment 15N depletion of XM leaves relative to those from the CS vineyard (Table 2) cannot be conclusively attributed to genotype, because our experimental design confounds cultivar identity with site-specific edaphic factors and their interactions. For example, the XM depletion may reflect differences in effective rooting depth or exploitation of the soil N profile [54], or, alternatively, cultivar-specific differences in N uptake and assimilation kinetics.
4.3. Cane N Isotope Composition
4.3.1. Fertilizer Effects and Leaf-to-Cane Connectivity
Cane δ15N increased with N rate in both vineyards (Table 2) and was positively correlated with leaf δ15N (Figure 7), indicating parallel responses of these organs and implying that that the physiological processes regulating N uptake and assimilation at the vineyard scale exert a unifying influence on the isotopic signature of both leaf and cane tissues. Given that approximately 40% of the spring-applied N retained in leaves is retranslocated to shoots and permanent structures at the end of the season [74], it is likely that cane δ15N partly reflects the isotopic composition of N remobilized from leaves. Our data thus support the idea that dormant cane δ15N integrates the annual fertilizer effects and overall N cycling in the vineyard. Because we did not directly quantify N dynamics between leaves and shoot stems, further investigation is warranted.
While attributing woody tissue enrichment to a single mechanism requires caution [75], the consistency of this response across both years and vineyards indicates that cane δ15N could serve as a robust integrator of annual N cycling [76]. Furthermore, because grapevine N partitioning is predominantly genetically determined [77], the proposed mechanism should persist despite environmental/management influences on shoot N partitioning and complex developmental dynamics [77,78]. This supports the consistency of leaf–cane δ15N association (Figure 7).
4.3.2. Fertilizer Application Mode Considerations
In our study, soil-applied ammonium nitrate produced clear shifts in cane δ15N (Table 2), whereas previous work with 15N-labeled and unlabeled foliar urea found no change in wood δ15N (trunk + canes) at harvest [39]. Beyond differences in tissue sampling and cultivars, this contrast indicates that soil fertilization, by altering the bulk plant-available N pool, is more likely to leave a detectable isotopic signature in perennial organs than foliar N. This conclusion remains tentative, since the two studies differ in many aspects.
4.3.3. Irrigation Effects and Interannual Variability
Although irrigation slightly lowered cane δ15N in both vineyards (Table 2), the effect was opposite in direction and small in magnitude relative to fertilization (Table 2) and only slightly larger than analytical precision (0.16‰). The lack of significant interaction between fertilization and irrigation treatments (Table S2) indicates that, under these conditions, irrigation and fertilization had approximately additive (i.e., statistically non-interactive) effects of these factors on cane isotope composition (Table S2). Comparable cane and leaf total N concentrations, together with similar cane N content across irrigation treatments (Table 2), indicate that water supply did not markedly alter N availability or N uptake. The modest irrigation effect observed here may also reflect the irrigation regime itself, as vines were not fully irrigated and differences in vine water status were not large [23]. Given the soil properties at both sites (Table S1) and the deficit-irrigation regime (≈70% of ETc), substantial leaching of fertilizer-derived or mineralized N beyond the root zone in irrigated treatments was likely minimal. Instead, moderate water availability may have enhanced soil N mineralization [79] and—under limited leaching—shifted the isotopic composition of plant-available N toward depletion by reducing isotope-fractionating effluxes. Consequently, deficit irrigation could promote a functionally more ‘closed’ N cycle [80], partially offsetting fertilization-induced ‘openness’. This hypothesis may explain the opposing fertilization and irrigation effects but must be tested with targeted research given the potential for continued gaseous N losses, which indicate pathway redistribution rather than true cycle sealing [81].
Year-to-year differences in cane δ15N were substantial and comparable in magnitude to the difference between N0 and N120 treatments (Table S2 and Table 2). Because short pruning removed most of the current-year wood, this variability does not reflect carry-over effects. Instead, it likely captures interannual fluctuations in soil N cycling—specifically spring mineralization and weather-driven leaching—which modify the baseline δ15N of plant-available N [25,27]. Although these soil processes were not directly measured and this interpretation remains hypothetical, it is consistent with the absence of carry-over effects of older wood isotope composition and with the pronounced within-year sensitivity of cane δ15N to fertilization. These results highlight that while cane δ15N is a powerful recorder of fertilization rate, it is simultaneously modulated by site-specific environmental controls on the local N cycle [76].
4.4. Berry Juice N Isotope Composition
In contrast to the clear linear enrichment observed in leaves and canes, the effect of fertilization on berry juice δ15N was neither strong nor consistent (Table 2), although a general tendency toward enrichment was detectable with fertilizer addition. This attenuated response occurred despite the significantly higher N content and concentration measured in the vines’ berry juice of the N120 treatment (Table 2). The decoupling of N status (high availability) from the isotopic signature (weak enrichment) indicates that juice δ15N is not a direct tracker of external N availability in the same manner as vegetative tissues. Given that grapevine berries function as a major, convergent sink of N imported from a diverse array of sources (leaves, shoots, permanent wood, and roots) throughout their development [39,77,78,82]—with 30–47% of fertilizer-derived N recoverable in clusters [71,83]—mixing among these sources—some of which are partially decoupled from current-year fertilizer inputs—can dilute treatment-induced isotopic differences. Thus, the fertilization signal likely reflects the dominance of internal N-cycling processes, which typically favor the translocation of 15N-depleted compounds relative to their source pools [73].
Our findings align with other studies indicating that reproductive tissues are less sensitive indicators of N source than vegetative organs, with berry seeds being a notable exception. For instance, Santesteban et al. [25] found that whole-berry δ15N is less responsive to variation in N source than seeds or petioles, likely because the pulp and skin—which contain about 80% of the grape’s total N [17]—are subject to these mixing effects. Similarly, Santesteban et al. [28] reported only a weak positive correlation between yeast assimilable N and δ15N, arguing that berry enrichment is often driven more by the δ15N of the source pool (e.g., soil organic N) than by fertilization intensity itself. This lack of sensitivity was also observed by Verdenal et al. [39], where the δ15N of grape pomace and clarified must in ‘Chasselas’ did not respond to foliar urea application within a single season.
Ultimately, juice δ15N appears to integrate the combined and potentially conflicting effects of internal N cycling, fertilizer inputs, and organ-level fractionation. This hypothesis is consistent with the high experimental variability observed across fertilization treatment (Figure S5), which likely accounts for the absence of significant between-year differences in our dataset (Table 2). Accordingly, under the conditions of this study, bulk berry-juice δ15N is not a sensitive indicator of fertilizer rate or vine N status.
4.5. Intravine Variation of δ15N
4.5.1. Organ-Level Isotope Patterns at Berry Set
Contrary to the expectation of significant intraplant variation often driven by organ-specific N loss or assimilation patterns [7,73] or phenological development [84], our analysis of seasonal mean δ15N values revealed a high degree of uniformity in the isotopic composition across leaves, berry juice, and canes (Figure 3). This absence of organ-level discrimination at the seasonal scale was consistent across all fertilization treatments (Figure S5) and aligns with findings in ‘Chasselas’ vines, where Verdenal et al. [39] similarly reported no significant discrimination among vine organs. However, this uniformity stands in contrast to other grapevine studies that have documented distinct fractionation gradients, such as trends toward enrichment in reproductive organs observed in ‘Tempranillo’ [25], ‘Pinot Noir’ [31], and Lambrusco varietals [85]. However, the more detailed sampling at berry set in Year 1 revealed pronounced organ-specific δ15N differences in both vineyards (Figure 4), underscoring the influence of phenological progression on N isotopic dynamics. Young green berries were the most 15N-enriched organs and had the highest N concentrations (Figure 4), indicating that early in the season they acted as strong sinks for N. The trajectory of early enrichment and subsequent depletion in berry-juice δ15N indicates dynamic intravine N reallocation where, as previously discussed, the heavy isotope content was diluted by subsequent influxes as the berries ripened.
Although CS and XM vines at BS shared a common pattern of sink-tissue enrichment (berries), they exhibited divergent patterns regarding the site of maximum isotopic depletion (Figure 4A). In CS vines, the maximum depletion occurred in fine roots and the significant enrichment of leaves relative to roots (Δleaf-root = 2.51‰; Figure 4A) supports the nitrate reduction model, where leaves assimilate nitrate from an already enriched pool exported from the roots [6,73,86]. The absence of a statistically significant difference in petiole δ15N relative to leaf blades (Figure 4A) further supports this root-to-shoot enrichment gradient. Conversely, XM vines displayed maximum depletion in the trunk and petioles, with leaf blades significantly enriched relative to the trunk (Δleaf-trunk = 4.13‰; Figure 4A). The significantly lower δ15N values in the perennial tissues (trunk) of XM compared to CS indicate a differential contribution of woody organs to internal N cycling. As wood integrates signals of plant N retention and plant–soil N partitioning over time [76], the stable, depleted signature in XM trunks implies a conservative N storage strategy that renders δ15N in N sinks at the BS stage less sensitive to the short-term root-to-shoot N flux observed in CS. Collectively, these diverging patterns of maximum discrimination sites indicate vineyard-specific differences in N uptake and internal cycling.
To elucidate the mechanism behind these isotopic patterns, we analyzed the response of fine root δ15N to increasing N fertilization rates.
4.5.2. Root δ15N Responses to N Supply
Fine roots were 15N-depleted in both vineyards but responded differently to N fertilization (Figure 8A). In CS, fine root δ15N increased markedly with N rate (Figure 8) and showed a non-linear relationship with total root N concentration (Figure 5). This isotopic shift is consistent with models where high N availability leads to the progressive accumulation of heavy isotopes in plant-available soil N pools [54,87]. This pattern appears to distinguish CS from systems in which root δ15N depletion has been attributed to within-plant shifts in the locus of nitrate assimilation (leaves vs. roots) [88]. This is unexpected given that grapevines generally exhibit higher nitrate-assimilation capacity in leaves than in roots, a tendency that may strengthen under high N availability. Because rootstocks also vary in organ-level nitrate-assimilation strategies across N gradients, targeted work is needed to resolve how rootstock, N supply, and nitrate assimilation site jointly shape root δ15N patterns.
Figure 8.
Effects of N fertilization on root N isotopic composition (δ15N) (A) and total N (N) concentration (B) in the two vineyards at berry set. Different letters indicate significant differences at p < 0.05.
The saturation-type relationship between root total N and δ15N (Figure 5) in CS indicates stronger isotopic discrimination under low N (N0, N60), whereas at higher total N, root δ15N approached a plateau near −0.79‰, consistent with minimal discrimination. This likely indicates that N availability exceeded the vine’s demand and that the rapid influx of N substrate overwhelmed the roots’ capacity for assimilation [86]. Consequently, the roots should normally assimilate a fraction of the entire inorganic N pool, maximizing the expression of enzymatic discrimination against 15N. But the minimal isotope discrimination indicates that root isotopic composition was more likely driven by increased uptake of 15N-enriched soil N and/or a shift in the balance of N loss to the shoots. Because we did not directly measure N fluxes, targeted studies are required to confirm this mechanism.
In contrast with CS, root δ15N in XM remained moderately depleted (mean −0.69‰) and did not vary significantly with total root N (Figure 5) and fertilizer rate (Figure 8). This relative stability across N rates indicates that XM root δ15N at berry set was less sensitive to changes in N supply than in CS. Whether this reflects different soil N dynamics, root uptake strategies, or cultivar traits cannot be distinguished with the current data.
4.5.3. Influence of AMF Colonization
The depletion of fine-root δ15N in XM (Figure 1A) contrasts with the root enrichment found in AMF-colonized and N-deficient gray alder plants [89], as well as with the broader pattern reported across various ecological contexts [90]. Although fungal metabolism normally enriches root tissues via fractionation-capable gradients [91] and the transfer of substantial N amounts along the soil–mycelium–root continuum [92], the XM pattern shows that the ammonium transfer mechanism [91] does not guarantee root enrichment; rather, it likely indicates that roots rapidly exported 15N-enriched inorganic N to the shoots, effectively diluting the root N pool [1,70,86]. While theoretically sound, these interpretations require experimental validation in future studies.
The invariant root δ15N signals observed in CS vines despite AMF colonization are consistent with a relatively small net contribution of mycorrhizal N to the root N pool with increasing plant N status, as reported in cucumber [93] and grapevine [94]. Isotopic models for ectomycorrhizal systems [1,95] and AM culture work [89] similarly show that significant mycorrhizal isotope effects arise mainly under N-limited conditions. Since N supply suppresses fungal-mediated N flux, the significant fertilizer effect on both root total N and δ15N (Figure 8), along with their relationship (Figure 5) in CS, reinforces this explanation. Thus, unchanged root δ15N in CS vines can be interpreted as indicating that the AMF-originated N flux was likely subordinate to direct root uptake, although this conclusion remains inferential without 15N tracer data for N partitioning in the CS symbiotic system itself.
Taken together, these contrasting vineyard-level patterns of root δ15N responses im-ply that the effect of AMF abundance on root δ15N depended on N availability and differed between vineyards. Consistent with this hypothesis, the vineyard × N fertilization × AMF interaction was significant (F = 4.20, p = 0.034), indicating that the AMF–δ15N association varied across both vineyard and N level. To interpret the interaction, we estimated N-specific simple slopes of root δ15N versus centered AMF abundance (AMF_c) within each vineyard × N combination (Figure 9A). The AMF–root δ15N relationship was strongest—and consistently negative—in unfertilized XM vines, whereas slopes were weak or indistinguishable from zero in the other vineyard–N combinations. Accordingly, the negative vineyard-wide AMF effect in XM (Figure 1A) reflects an average of divergent N-specific responses and is driven primarily by the unfertilized treatment. In contrast, CS showed small slopes that sometimes differed in direction across N levels (Figure 9A), yielding little net AMF effect at the vineyard scale.
Figure 9.
Simple slopes of root δ15N with respect to centered AMF colonization (AMF_c) for each vineyard × fertilization combination, extracted from the mixed model (A), and mixed-model-predicted contrasts in root δ15N between vineyards (XM−CS) across the AMF gradient at each N level (B). *, **, *** denote significance at p = 0.05, p = 0.01 and p = 0.001, respectively.
To further quantify vineyard differences, we derived the predicted contrast in root δ15N between vineyards (XM−CS) across the AMF gradient for each N level (Figure 9B). Under N0, the XM–CS contrast declined with increasing AMF: XM was more δ15N-enriched than CS at low AMF, but this difference diminished and became negative at higher AMF. Under N60, the contrast remained positive across AMF but was small and provided little evidence for a consistent vineyard difference at any AMF quartile. Collectively, Figure 9 indicates that vineyard differences in root δ15N were dependent on N supply and AMF colonization—most evident under low to intermediate N and modulated by AMF—yet largely attenuated under high N.
These patterns indicate that both N availability and AMF contributed to between-vineyard variation in belowground N dynamics, as reflected in fine-root δ15N. In CS, fertilization largely dominated root δ15N responses, whereas in XM, AMF effects emerged primarily under low N rate. Although this AMF effect in XM was mostly confined to low N, increasing colonization intensity was associated with reduced root–petiole δ15N discrimination (Figure 1B). Together, these results indicate that AMF symbiosis should be considered when interpreting intravine δ15N variation, particularly in vineyards with low N supply. More broadly, interactions between within-plant metabolism and N translocation and mycorrhizal effects may complicate the use of plant δ15N as a straightforward indicator of external N sources [9].
4.6. Relationship of Vine δ15N with Grapevine Productivity and Agronomic FUE
The positive associations of leaf and cane δ15N values with grape yield and pruning weight in both vineyards, except during the first year in XM (Table 3), contrast with the findings of Stamatiadis et al. [27] indicating that δ15N covaried with vine productivity largely through its link to plant N status (Figure 6). Consistent with this interpretation, the relationships weakened when we computed partial correlations by controlling for N-status indicators (leaf total N and cane N). Several studies link natural-abundance δ15N to plant productivity, but the direction of association varies across systems and tissues. For instance, [96] observed a negative relationship between root δ15N and total dry biomass in wild barley, whereas [56] found a significant positive correlation between foliar δ15N and diameter growth in white spruce. Similarly, Ariz et al. [97] documented positive relationships between leaf δ15N and plant biomass in alfalfa.
Table 3.
Pearson correlation coefficients between N isotope natural abundance (δ15N) and indicators of biomass production and fertilizer-use efficiency after accounting for N content (grapes and canes) or N concentration (leaves). Only significant coefficients at p < 0.05 are shown.
In contrast to biomass metrics, leaf δ15N was negatively associated with fertilizer use efficiency indicators (Table 3). These relationships weakened after N-status variables were included in the regression models, but the overall pattern remained, indicating that δ15N captures FUE-related variation beyond N status alone. A similar pattern was observed for cane δ15N (Table 3). Consistent with these results, lower FUE for cane production (PNBw and PNBw) coincided with greater 15N enrichment in leaves and canes (Table 2 and Table 3). Although the use of δ15N to estimate FUE can be practically constrained because it requires a measurable δ15N difference between fertilizer and plant-available soil N—and because fractionation during soil transformations and plant uptake can obscure that signal even when the contrast is large [46]—our findings indicate that leaf and cane δ15N can nonetheless provide useful insight into this component of grapevine performance.
4.7. Vineyard Management and Environmental Implications
Our findings highlight a clear management trade-off between maximizing yield and maintaining agronomic N use efficiency. Although the high rate N120 treatment substantially increased yield without compromising grape quality [23], its markedly lower PFP and PNB values underscore the environmental cost of pushing N inputs beyond the point of diminishing returns—an outcome consistent with meta analyses demonstrating that excessive N disrupts vineyard N cycling and reduces overall sustainability [49,98]. While our efficiency PFP and PNB estimates were limited to grapes and pruned canes, these components represent the primary economic and management outputs in grape production and thus serve as robust indicators of agronomic performance [44,45].
N fertilization also interacted strongly with water supply to modulate agronomic WUE. The N120 treatment increased WUEg only in non-irrigated vines (Interaction F = 12.15, p = 0.0040), indicating a synergistic response whereby adequate N improved crop performance and resource use efficiency under water deficit conditions [6,99,100]—likely by helping vines maintain photosynthetic capacity despite stomatal limitations imposed by water deficit [23]. In contrast, irrigated vines showed no significant variation in WUEg across N treatments, and its overall effect on agronomic traits was weaker than that of fertilization, possibly because irrigation differences emerged only after most vegetative growth had ceased [23]. Vineyard-specific responses further emerged: CS exhibited larger shifts in WUEg across water treatments, whereas XM showed more consistent irrigation responses, reflecting potential cultivar–soil interactions that cannot be fully resolved with the present design.
From a management perspective, these results indicate that optimizing both nutrient efficiency and WUE requires coordinated control of N and water inputs [101]. Moderate fertilization (N60) maximized nutrient efficiency (PFP, PNB), whereas higher fertilization (N120) boosted WUE only under water deficit but simultaneously reduced nutrient retention. Achieving joint optimization therefore necessitates integrating fertilization strategies with crop regulation and precise irrigation scheduling [71,82].
Benchmarking our findings against broader reference values reinforces these implications. Typical N rates required for sustainable yields (~12 t ha−1) range around 50 kg N ha−1 yr−1 (NUE ≈ 0.24 t kg−1 N) [49]. Consistent with this, CS vines at N60 showed high fertilizer-use efficiency (214.1 g g−1 N) at ~12.5 t ha−1 (Table 1), whereas XM vines under the same N treatment achieved far lower FUE (141.4 g g−1 N) and yield (0.87 t ha−1; Table 1), illustrating strong vineyard-specific constraints. These results further show that δ15N of leaves and canes can help interpret productivity–efficiency trade-offs, but only when evaluated in the context of N supply, vine nutritional status, and soil–plant N dynamics within each vineyard.
Finally, gaseous N losses drive broad ecosystem patterns in natural-abundance δ15N [6] and vineyard N and irrigation practices may indirectly influence greenhouse-gas emissions and overall environmental impact [101]. The negative relationship between δ15N and fertilizer-use efficiency in our study (Table 3) is consistent with (though not proof of) increased gaseous N losses at low FUE. Future work should therefore test whether spatial patterns of δ15N in vineyards can serve as sensitive indicators of management-driven variation in actual gaseous N losses, offering a potential tool for assessing environmental sustainability at vineyard or regional scales.
5. Conclusions and Future Research Perspectives
5.1. Conclusions
This study demonstrates that natural-abundance δ15N in leaf blades—and especially in dormant canes—responds sensitively to N fertilization and is strongly associated with vine N status and agronomic N-use efficiency in field-grown grapevines. Increasing ammonium nitrate inputs elevated δ15N in leaves and canes despite the fertilizer being 15N-depleted, with isotopic shifts positively related to leaf N concentration, yield, and pruning weight, and negatively related to partial factor productivity and partial nutrient balance. These relationships indicate that leaf and cane δ15N capture the intensity of vineyard N cycling and can signal when N supply exceeds vine uptake. Dormant canes also tracked fertilizer rate and strong year effects, consistent with their interpretation as annual integrators of current-season N uptake and internal N remobilization, whereas berry-juice δ15N showed weak, variable responses and did not reliably indicate N status.
Water supply had comparatively limited effects: irrigation at 70% ETc produced only small decreases in cane δ15N and had no consistent impact on leaf or juice δ15N or vine N status, indicating that water availability was not a primary driver of δ15N variation under these conditions. Organ-specific sampling revealed strong discrimination among tissues, with green berries and leaves the most 15N-enriched and fine roots and woody tissues the most depleted. Root δ15N responses further differed between cultivars: ‘Cabernet Sauvignon’ showed increasing fine-root δ15N with higher N supply, whereas ‘Xinomavro’ maintained relatively depleted and stable root δ15N. Arbuscular mycorrhizal colonization was similar across treatments but was linked to root δ15N only in ‘Xinomavro’, where higher colonization corresponded to more negative values, highlighting cultivar- and site-specific interactions involving soil properties, and mycorrhizal functioning.
From a management standpoint, increasing N supply substantially increased yield and vegetative growth but reduced agronomic N-use efficiency, particularly at the highest N rate. Water-use efficiency for grapes was highest in non-irrigated vines and improved with increasing N under water deficit, indicating interactive effects between N availability and water limitation. Leaf and cane δ15N increased along the gradient of decreasing N-use efficiency, showing promise as integrative indicators to position vineyards along the trade-off between maximizing production and avoiding excessive N inputs, although direct N loss pathways were not measured. Overall, mid-season leaves are well suited for diagnosing current-year N status and N cycling, dormant canes are valuable for annual monitoring of vineyard N dynamics, and berry-juice δ15N is not recommended for routine diagnostic use. The findings emphasize that organ choice, sampling timing, and vineyard context are critical for effective δ15N-based assessment of N cycling in viticulture.
5.2. Future Research Recommendations
Future work on δ15N in grapevine should first aim to directly link isotopic patterns to N fluxes. The interpretation that enriched leaf and cane δ15N at higher N supply reflects greater openness of the N cycle and enhanced loss processes is based on conceptual expectations rather than measured losses. Experiments that pair natural-abundance δ15N in standardized organs—such mid-season basal leaves the season and dormant canes—with direct measurements of nitrate leaching and gaseous N emissions across controlled fertilizer and irrigation treatments are needed to evaluate whether δ15N can function as an operational indicator of management-driven variation in N losses.
A second priority is to separate cultivar and site influences by growing multiple cultivars and rootstocks on common soils under replicated N and water treatments. Such experiments should investigate the influence of roots and leaves in nitrate assimilation, the allocation of N to perennial and annual tissues, and how these processes imprint δ15N in leaves, canes, and roots. Relatedly, the association between arbuscular mycorrhizal colonization and root δ15N in ‘Xinomavro’ at low N supply indicates a potential mycorrhizal contribution to isotopic variation, but its magnitude remains unclear. Manipulating AMF colonization across N gradients, ideally combined with enriched 15N tracers, would help quantify the contributions of fungal versus root uptake pathways.
A third area for development concerns temporal and biochemical resolution. Strong organ-level contrasts at berry set and the seasonal convergence of δ15N among leaves, canes, and juice highlight the need for longitudinal sampling of multiple tissues across phenological stages, together with measurements of N on both a content and a concentration basis. Because bulk berry-juice δ15N responded weakly and inconsistently to fertilization, compound-specific δ15N analyses in amino acids may offer greater diagnostic value when combined with leaf and cane δ15N. Finally, integrating δ15N with other isotopic and agronomic indicators—including δ13C, yield, pruning weight, and N-use efficiency metrics—through long-term monitoring could support the development of context-specific benchmarks for identifying low, adequate, and excessive N supply in viticulture.
Supplementary Materials
The following supporting information can be downloaded at: https://www.mdpi.com/article/10.3390/crops6020044/s1, Figure S1: Monthly precipitation, cumulative heat summation, and mean temperature recorded during the two years of experimentation at the study site; Figure S2: Representative soil profiles of the two vineyards; Figure S3: Soil δ15N; Figure S4: Variation in the AMF root colonization intensity at the berry-setting stage across the two vineyards. Vineyard means did no differ at p < 0.05; Figure S5: Effects of nitrogen fertilization (N0, unfertilized; N1, 60 kg N ha−1; N2, 120 kg N ha−1) on nitrogen isotope composition (dN, δ15N ‰), by vineyard (V1, CS; V2, XM), year (P2, Year 1; P3, Year 2), and vine part (C, canes; L, leaves; M, berry must); Table S1: Soil properties by vineyard, pit, and horizon; Table S2: F-values for main effects (V: vineyard; Y: year; I: irrigation; N: ammonium nitrate fertilizer) and interactions for δ15N, N concentration, and C/N ratio in leaf blades, berry juice at harvest, and dormant canes across two vineyards (two years). Leaf-blade values are seasonal means of four phenological sampling dates per year: berry set, bunch closure, veraison, and maturity.
Author Contributions
Conceptualization, D.T.; methodology, D.T.; software, S.T.; validation, D.T., G.D., and S.K.; formal analysis, D.T. and S.K.; investigation, D.T., S.K., and N.N.; resources, D.T.; data curation, D.T. and S.K.; writing—original draft preparation, D.T.; writing—review and editing, D.T., S.K. and N.N.; visualization, D.T.; All authors have read and agreed to the published version of the manuscript.
Funding
This research received no external funding.
Data Availability Statement
The raw data supporting the conclusions of this article will be made available by the authors on rational request.
Acknowledgments
We would like to thank Boutari S.A. company for providing access to the vineyard and facilitating the field operations of this study.
Conflicts of Interest
The authors declare no conflicts of interest.
References
- Hobbie, E.A.; Högberg, P. Nitrogen isotopes link mycorrhizal fungi and plants to nitrogen dynamics. New Phytol. 2012, 196, 367–382. [Google Scholar] [CrossRef] [Scilit]
- Heaton, T. Isotopic studies of nitrogen pollution in the hydrosphere and atmosphere: A review. Chem. Geol. Isot. Geosci. Sect. 1986, 59, 87–102. [Google Scholar] [CrossRef]
- Werner, R.A.; Cormier, M.-A. Isotopes—Terminology, Definitions and Properties. In Stable Isotopes in Tree Rings; Siegwolf, R.T.W., Brooks, J.R., Roden, J., Saurer, M., Eds.; Springer International Publishing: Cham, Switzerland, 2022; pp. 253–289. ISBN 978-3-030-92697-7. [Google Scholar]
- Dawson, T.E.; Mambelli, S.; Plamboeck, A.H.; Templer, P.H.; Tu, K.P. Stable Isotopes in Plant Ecology. Annu. Rev. Ecol. Syst. 2002, 33, 507–559. [Google Scholar] [CrossRef] [Scilit]
- Robinson, D. δ15N as an integrator of the nitrogen cycle. Trends Ecol. Evol. 2001, 16, 153–162. [Google Scholar] [CrossRef] [Scilit]
- Craine, J.M.; Brookshire, E.N.J.; Cramer, M.D.; Hasselquist, N.J.; Koba, K.; Marin-Spiotta, E.; Wang, L. Ecological interpretations of nitrogen isotope ratios of terrestrial plants and soils. Plant Soil 2015, 396, 1–26. [Google Scholar] [CrossRef] [Scilit]
- Handley, L.L.; Raven, J.A. The use of natural abundance of nitrogen isotopes in plant physiology and ecology. Plant Cell Environ. 1992, 15, 965–985. [Google Scholar] [CrossRef] [Scilit]
- Makarov, M.I. The nitrogen isotopic composition in soils and plants: Its use in environmental studies (A Review). Eurasian Soil Sci. 2009, 42, 1335–1347. [Google Scholar] [CrossRef] [Scilit]
- Högberg, P. Tansley Review No. 95. 15N natural abundance in soil-plant systems. New Phytol. 1997, 137, 179–203. [Google Scholar] [CrossRef] [Scilit] [PubMed]
- Billy, C.; Billen, G.; Sebilo, M.; Birgand, F.; Tournebize, J. Nitrogen isotopic composition of leached nitrate and soil organic matter as an indicator of denitrification in a sloping drained agricultural plot and adjacent uncultivated riparian buffer strips. Soil Biol. Biochem. 2010, 42, 108–117. [Google Scholar] [CrossRef] [Scilit]
- Evans, R.D.; Bloom, A.J.; Sukrapanna, S.S.; Ehleringer, J.R. Nitrogen isotope composition of tomato (Lycopersicon esculentum Mill. cv. T-5) grown under ammonium or nitrate nutrition. Plant Cell Environ. 1996, 19, 1317–1323. [Google Scholar] [CrossRef] [Scilit]
- Handley, L.L.; Austin, A.T.; Stewart, G.R.; Robinson, D.; Scrimgeour, C.M.; Raven, J.A.; Heaton, T.H.E.; Schmidt, S. The 15N natural abundance (δ15N) of ecosystem samples reflects measures of water availability. Aust. J. Plant Physiol. 1999, 26, 185–199. [Google Scholar] [CrossRef] [Scilit]
- Amundson, R.; Austin, A.T.; Schuur, E.A.G.; Yoo, K.; Matzek, V.; Kendall, C.; Uebersax, A.; Brenner, D.; Baisden, W.T. Global patterns of the isotopic composition of soil and plant nitrogen. Glob. Biogeochem. Cycles 2003, 17, 1031. [Google Scholar] [CrossRef] [Scilit]
- Mirás-Avalos, J.; Araujo, E. Optimization of Vineyard Water Management: Challenges, Strategies, and Perspectives. Water 2021, 13, 746. [Google Scholar] [CrossRef] [Scilit]
- Keller, M. Deficit Irrigation and Vine Mineral Nutrition. Am. J. Enol. Vitic. 2005, 56, 267–283. [Google Scholar] [CrossRef] [Scilit]
- Verdenal, T.; Dienes-Nagy, Á.; Spangenberg, J.E.; Zufferey, V.; Spring, J.-L.; Viret, O.; Marin-Carbonne, J.; van Leeuwen, C. Understanding and managing nitrogen nutrition in grapevine: A review. OENO One 2021, 55, 1–43. [Google Scholar] [CrossRef] [Scilit]
- Bell, S.-J.; Henschke, P.A. Implications of nitrogen nutrition for grapes, fermentation and wine. Aust. J. Grape Wine Res. 2005, 11, 242–295. [Google Scholar] [CrossRef] [Scilit]
- Neilsen, G.H.; Neilsen, D.; Bowen, P.; Bogdanoff, C.; Usher, K. Effect of Timing, Rate, and Form of N Fertilization on Nutrition, Vigor, Yield, and Berry Yeast-Assimilable N of Grape. Am. J. Enol. Vitic. 2010, 61, 327–336. [Google Scholar] [CrossRef] [Scilit]
- Christensen, L.P.; Bianchi, M.L.; Peacock, W.L.; Hirschfelt, D.J. Effect of Nitrogen Fertilizer Timing and Rate on Inorganic Nitrogen Status, Fruit Composition, and Yield of Grapevines. Am. J. Enol. Vitic. 1994, 45, 377–387. [Google Scholar] [CrossRef] [Scilit]
- Bell, S.-J.; Robson, A. Effect of Nitrogen Fertilization on Growth, Canopy Density, and Yield of Vitis vinifera L. cv. Cabernet Sauvignon. Am. J. Enol. Vitic. 1999, 50, 351–358. [Google Scholar] [CrossRef] [Scilit]
- Holzapfel, B.P.; Treeby, M.T. Effects of timing and rate of N supply on leaf nitrogen status, grape yield and juice composition from Shiraz grapevines grafted to one of three different rootstocks. Aust. J. Grape Wine Res. 2007, 13, 14–22. [Google Scholar] [CrossRef] [Scilit]
- Iandolino, A.B.; Williams, L.E. Recovery of 15 N Labeled Fertilizer by Vitis vinifera L. cv. Cabernet Sauvignon: Effects of N Fertilizer Rates and Applied Water Amounts. Am. J. Enol. Vitic. 2014, 65, 189–196. [Google Scholar] [CrossRef] [Scilit]
- Taskos, D.; Zioziou, E.; Nikolaou, N.; Doupis, G.; Koundouras, S. Carbon isotope natural abundance (δ13C) in grapevine organs is modulated by both water and nitrogen supply. OENO One 2020, 54, 1183–1199. [Google Scholar] [CrossRef] [Scilit]
- Santesteban, L.G.; Miranda, C.; Barbarin, I.; Royo, J.B. Application of the measurement of the natural abundance of stable isotopes in viticulture: A review. Aust. J. Grape Wine Res. 2015, 21, 157–167. [Google Scholar] [CrossRef] [Scilit]
- Santesteban, L.G.; Loidi, M.; Urretavizcaya, I.; Galar, M.; Crespo-Martínez, S.; Royo, J.B.; Miranda, C. Nitrogen isotope ratio (δ15N): A nearly unexplored indicator that provides useful information in viticulture. OENO One 2024, 58, 1–12. [Google Scholar] [CrossRef] [Scilit]
- King, A.P.; Berry, A.M. Vineyard δ15N, nitrogen and water status in perennial clover and bunch grass cover crop systems of California’s central valley. Agric. Ecosyst. Environ. 2005, 109, 262–272. [Google Scholar] [CrossRef] [Scilit]
- Stamatiadis, S.; Christofides, C.; Tsadila, E.; Taskos, D.; Tsadilas, C.; Schepers, J.S. Relationship of Leaf Stable Isotopes (δ13C and δ15N) to Biomass Production in Two Fertilized Merlot Vineyards. Am. J. Enol. Vitic. 2007, 58, 67–74. [Google Scholar] [CrossRef] [Scilit]
- Santesteban, L.G.; Miranda, C.; Barbarin, I.; Royo, J.B. Berry Carbon (δ13C) and Nitrogen (δ15N) isotopic ratio reflects within farm terroir differences. In Proceedings of the Xth Terroir Congress, Tokaj-Eger, Hungary, 7–10 July 2014; pp. 68–73. [Google Scholar]
- Spangenberg, J.E.; Schweizer, M.; Zufferey, V. Shifts in carbon and nitrogen stable isotope composition and epicuticular lipids in leaves reflect early water-stress in vineyards. Sci. Total Environ. 2020, 739, 140343. [Google Scholar] [CrossRef] [Scilit]
- Spangenberg, J.E.; Schweizer, M.; Zufferey, V. Carbon and nitrogen stable isotope variations in leaves of two grapevine cultivars (Chasselas and Pinot noir): Implications for ecophysiological studies. Plant Physiol. Biochem. 2021, 163, 45–54. [Google Scholar] [CrossRef] [Scilit]
- Paolini, M.; Ziller, L.; Bertoldi, D.; Bontempo, L.; Larcher, R.; Nicolini, G.; Camin, F. δ15N from soil to wine in bulk samples and proline. J. Mass Spectrom. 2016, 51, 668–674. [Google Scholar] [CrossRef] [Scilit] [PubMed]
- Spangenberg, J.E.; Zufferey, V. Changes in soil water availability in vineyards can be traced by the carbon and nitrogen isotope composition of dried wines. Sci. Total Environ. 2018, 635, 178–187. [Google Scholar] [CrossRef] [Scilit]
- Spangenberg, J.E.; Zufferey, V. Soil management affects carbon and nitrogen concentrations and stable isotope ratios in vine products. Sci. Total Environ. 2023, 873, 162410. [Google Scholar] [CrossRef] [Scilit]
- Cheng, X.; Baumgartner, K. Effects of mycorrhizal roots and extraradical hyphae on 15N uptake from vineyard cover crop litter and the soil microbial community. Soil Biol. Biochem. 2006, 38, 2665–2675. [Google Scholar] [CrossRef] [Scilit]
- Cheng, X.; Baumgartner, K. Arbuscular mycorrhizal fungi-mediated nitrogen transfer from vineyard cover crops to grapevines. Biol. Fertil. Soils 2004, 40, 406–412. [Google Scholar] [CrossRef] [Scilit]
- Trouvelot, S.; Bonneau, L.; Redecker, D.; van Tuinen, D.; Adrian, M.; Wipf, D. Arbuscular mycorrhiza symbiosis in viticulture: A review. Agron. Sustain. Dev. 2015, 35, 1449–1467. [Google Scholar] [CrossRef] [Scilit]
- He, X.; Xu, M.; Qiu, G.Y.; Zhou, J. Use of 15N stable isotope to quantify nitrogen transfer between mycorrhizal plants. J. Plant Ecol. 2009, 2, 107–118. [Google Scholar] [CrossRef] [Scilit]
- Karagiannidis, N.; Nikolaou, N.; Ipsilantis, I.; Zioziou, E. Effects of different N fertilizers on the activity of Glomus mosseae and on grapevine nutrition and berry composition. Mycorrhiza 2007, 18, 43–50. [Google Scholar] [CrossRef] [Scilit]
- Verdenal, T.; Spangenberg, J.E.; Zufferey, V.; Lorenzini, F.; Spring, J.-L.; Viret, O. Effect of fertilisation timing on the partitioning of foliar-applied nitrogen in Vitis vinifera cv. Chasselas: A 15N labelling approach. Aust. J. Grape Wine Res. 2015, 21, 110–117. [Google Scholar] [CrossRef] [Scilit]
- Taskos, D.G.; Koundouras, S.; Stamatiadis, S.; Zioziou, E.; Nikolaou, N.; Karakioulakis, K.; Theodorou, N. Using active canopy sensors and chlorophyll meters to estimate grapevine nitrogen status and productivity. Precis. Agric. 2015, 16, 77–98. [Google Scholar] [CrossRef] [Scilit]
- van Halsema, G.E.; Vincent, L. Efficiency and productivity terms for water management: A matter of contextual relativism versus general absolutism. Agric. Water Manag. 2012, 108, 9–15. [Google Scholar] [CrossRef] [Scilit]
- Romero, P.; Botía, P.; Navarro, J.M. Selecting rootstocks to improve vine performance and vineyard sustainability in deficit irrigated Monastrell grapevines under semiarid conditions. Agric. Water Manag. 2018, 209, 73–93. [Google Scholar] [CrossRef] [Scilit]
- Xu, G.; Fan, X.; Miller, A.J. Plant nitrogen assimilation and use efficiency. Annu. Rev. Plant Biol. 2012, 63, 153–182. [Google Scholar] [CrossRef] [Scilit] [PubMed]
- Fixen, P.; Brentrup, F.; Bruulsema, T.; Garcia, F.; Norton, R.; Zingore, S. Nutrient/fertilizer use efficiency: Measurement, current situation and trends. In Managing Water and Fertilizer for Sustainable Agricultural Intensification; Drechsel, P., Heffer, P., Magen, H., Mikkelsen, R., Wichelns, D., Eds.; International Fertilizer Industry Association (IFA): Paris, France; International Water Management Institute (IWMI): Paris, France; International Plant Nutrition Institute (IPNI): Paris, France; International Potash Institute (IPI): Paris, France, 2015; pp. 8–38. ISBN 979-10-92366-02-0. [Google Scholar]
- Dobermann, A. Nutrient Use Efficiency–Measurement and Management; IFA: Paris, France, 2007. [Google Scholar]
- Chalk, P.M. Can N fertilizer use efficiency be estimated using 15N natural abundance? Soil Biol. Biochem. 2018, 126, 191–193. [Google Scholar] [CrossRef] [Scilit]
- Stefanello, L.O.; Schwalbert, R.; Schwalbert, R.A.; de Conti, L.; Kulmann, M.S.D.S.; Garlet, L.P.; Silveira, M.L.R.; Sautter, C.K.; de Melo, G.W.B.; Rozane, D.E.; et al. Nitrogen supply method affects growth, yield and must composition of young grape vines (Vitis vinifera L. cv Alicante Bouschet) in southern Brazil. Sci. Hortic. 2020, 261, 108910. [Google Scholar] [CrossRef] [Scilit]
- Verdenal, T.; Spangenberg, J.E.; Zufferey, V.; Dienes-Nagy, Á.; Viret, O.; van Leeuwen, C.; Spring, J.-L. Impact of crop load on nitrogen uptake and reserve mobilisation in Vitis vinifera. Funct. Plant Biol. 2020, 47, 744–756. [Google Scholar] [CrossRef] [Scilit] [PubMed]
- Visconti, F.; Intrigliolo, D.S.; Mirás-Avalos, J.M. Effects of the Annual Nitrogen Fertilization Rate on Vine Performance and Grape Quality for Winemaking: Insights from a Meta-Analysis. Aust. J. Grape Wine Res. 2023, 2023, 7989254. [Google Scholar] [CrossRef] [Scilit]
- Bateman, A.S.; Kelly, S.D. Fertilizer nitrogen isotope signatures. Isot. Environ. Health Stud. 2007, 43, 237–247. [Google Scholar] [CrossRef] [Scilit]
- Michener, R.; Lajtha, K. Stable Isotopes in Ecology and Environmental Science, 2nd ed.; Blackwell Publishing Ltd.: Oxford, UK, 2007; ISBN 9780470691854. [Google Scholar]
- Yan, T.; Fang, Y.; Wang, J.; Song, H.; Zhong, T.; Wang, P. Effects of long-term nitrogen addition on the shift of nitrogen cycle from open to closed along an age gradient of larch plantations in North China. Soil Biol. Biochem. 2024, 191, 109295. [Google Scholar] [CrossRef] [Scilit]
- Mason, R.E.; Craine, J.M.; Lany, N.K.; Jonard, M.; Ollinger, S.V.; Groffman, P.M.; Fulweiler, R.W.; Angerer, J.; Read, Q.D.; Reich, P.B.; et al. Evidence, causes, and consequences of declining nitrogen availability in terrestrial ecosystems. Science 2022, 376, eabh3767. [Google Scholar] [CrossRef] [Scilit]
- Pardo, L.H.; Templer, P.H.; Goodale, C.L.; Duke, S.; Groffman, P.M.; Adams, M.B.; Boeckx, P.; Boggs, J.; Campbell, J.; Colman, B.; et al. Regional Assessment of N Saturation using Foliar and Root δ15N. Biogeochemistry 2006, 80, 143–171. [Google Scholar] [CrossRef] [Scilit]
- Choi, W.-J.; Chang, S.X.; Ro, H.-M. Seasonal Changes of Shoot Nitrogen Concentrations and 15N/14N Ratios in Common Reed in a Constructed Wetland. Commun. Soil Sci. Plant Anal. 2005, 36, 2719–2731. [Google Scholar] [CrossRef] [Scilit]
- Matsushima, M.; Choi, W.-J.; Chang, S.X. White spruce foliar δ13C and δ15N indicate changed soil N availability by understory removal and N fertilization in a 13-year-old boreal plantation. Plant Soil 2012, 361, 375–384. [Google Scholar] [CrossRef] [Scilit]
- Högberg, P. Forests losing large quantities of nitrogen have elevated 15N:14N ratios. Oecologia 1990, 84, 229–231. [Google Scholar] [CrossRef] [Scilit] [PubMed]
- Högberg, P. Development of 15N enrichment in a nitrogen-fertilized forest soil-plant system. Soil Biol. Biochem. 1991, 23, 335–338. [Google Scholar] [CrossRef] [Scilit]
- Johannisson, C.; Högberg, P. 15N abundance of soils and plants along an experimentally induced forest nitrogen supply gradient. Oecologia 1994, 97, 322–325. [Google Scholar] [CrossRef] [Scilit] [PubMed]
- Näsholm, T. Removal of nitrogen during needle senescence in Scots pine (Pinus sylvestris L.). Oecologia 1994, 99, 290–296. [Google Scholar] [CrossRef] [Scilit]
- Liu, G.; Wang, Q.; Chen, J.; Yan, G.; Wang, H.; Xing, Y. Natural δ13C and δ15N Abundance of Plants and Soils Under Long-term N Addition in a Temperate Secondary Forest. J. Soil Sci. Plant Nutr. 2024, 24, 3491–3503. [Google Scholar] [CrossRef] [Scilit]
- Pascual, M.; Lordan, J.; Villar, J.M.; Fonseca, F.; Rufat, J. Stable carbon and nitrogen isotope ratios as indicators of water status and nitrogen effects on peach trees. Sci. Hortic. 2013, 157, 99–107. [Google Scholar] [CrossRef] [Scilit]
- Choi, W.-J.; Chang, S.X.; Allen, H.L.; Kelting, D.L.; Ro, H.-M. Irrigation and fertilization effects on foliar and soil carbon and nitrogen isotope ratios in a loblolly pine stand. For. Ecol. Manag. 2005, 213, 90–101. [Google Scholar] [CrossRef] [Scilit]
- Mateus, N.S.; Florentino, A.L.; Oliveira, J.B.; Santos, E.F.; Gaziola, S.A.; Rossi, M.L.; Linhares, F.S.; Bendassolli, J.A.; Azevedo, R.A.; Lavres, J. Leaf 13C and 15N composition shedding light on easing drought stress through partial K substitution by Na in eucalyptus species. Sci. Rep. 2021, 11, 20158. [Google Scholar] [CrossRef] [Scilit]
- Stock, W.D.; Evans, J.R. Effects of water availability, nitrogen supply and atmospheric CO2 concentrations on plant nitrogen natural abundance values. Funct. Plant Biol. 2006, 33, 219–227. [Google Scholar] [CrossRef] [Scilit]
- Craine, J.M.; Elmore, A.J.; Aidar, M.P.M.; Bustamante, M.; Dawson, T.E.; Hobbie, E.A.; Kahmen, A.; Mack, M.C.; McLauchlan, K.K.; Michelsen, A.; et al. Global patterns of foliar nitrogen isotopes and their relationships with climate, mycorrhizal fungi, foliar nutrient concentrations, and nitrogen availability. New Phytol. 2009, 183, 980–992. [Google Scholar] [CrossRef] [Scilit] [PubMed]
- Wermelinger, B.; Koblet, W. Seasonal growth and nitrogen distribution in grapevine leaves, shoots and grapes. Vitis 1990, 29, 15. [Google Scholar] [CrossRef]
- Williams, L.E. Growth of ‘Thompson Seedless’ Grapevines: II. Nitrogen Distribution. J. Am. Soc. Hortic. Sci. 1987, 112, 330–333. [Google Scholar] [CrossRef] [Scilit]
- Kolb, K.J.; Evans, R.D. Implications of leaf nitrogen recycling on the nitrogen isotope composition of deciduous plant tissues. New Phytol. 2002, 156, 57–64. [Google Scholar] [CrossRef] [Scilit]
- Robinson, D.; Handley, L.L.; Scrimgeour, C.M. A theory for 15N/14N fractionation in nitrate-grown vascular plants. Planta 1998, 205, 397–406. [Google Scholar] [CrossRef] [Scilit]
- Williams, L.E. Vine nitrogen requirements—Utilization of N sources from soils, fertilizers, and reserves. In Proceedings of the International Symposium on Nitrogen in Grapes and Wine, Seattle, WA, USA, 18–19 June 1991; Rantz, J.M., Ed.; American Society for Enology and Viticulture: Davis, CA, USA, 1991; pp. 62–66. ISBN 0963071106. [Google Scholar]
- Keskitalo, J.; Bergquist, G.; Gardeström, P.; Jansson, S. A cellular timetable of autumn senescence. Plant Physiol. 2005, 139, 1635–1648. [Google Scholar] [CrossRef] [Scilit]
- Evans, R. Physiological mechanisms influencing plant nitrogen isotope composition. Trends Plant Sci. 2001, 6, 121–126. [Google Scholar] [CrossRef] [Scilit]
- Conradie, W.J. Distribution and Translocation of Nitrogen Absorbed During Late Spring by Two-Year-Old Grapevines Grown in Sand Culture. Am. J. Enol. Vitic. 1990, 41, 241–250. [Google Scholar] [CrossRef] [Scilit]
- Balster, N.J.; Marshall, J.D.; Clayton, M. Coupling tree-ring δ13C and δ15N to test the effect of fertilization on mature Douglas-fir (Pseudotsuga menziesii var. glauca) stands across the Interior northwest, USA. Tree Physiol. 2009, 29, 1491–1501. [Google Scholar] [CrossRef] [Scilit]
- Gerhart, L.M.; McLauchlan, K.K. Reconstructing terrestrial nutrient cycling using stable nitrogen isotopes in wood. Biogeochemistry 2014, 120, 1–21. [Google Scholar] [CrossRef] [Scilit]
- Conradie, W.J. Translocation and storage of nitrogen by grapevines as affected by time of application. In Proceedings of the Proceedings of the International Symposium on Nitrogen in Grapes and Wine, Seattle, WA, USA, 18–19 June 1991; pp. 32–42. [Google Scholar]
- Wermelinger, B. Nitrogen dynamics in grapevine: Physiology and modeling. In Proceedings of the International Symposium on Nitrogen in Grapes and Wine, Seattle, WA, USA, 18–19 June 1991; Rantz, J.M., Ed.; American Society for Enology and Viticulture: Davis, CA, USA, 1991; pp. 23–31. ISBN 0963071106. [Google Scholar]
- Raath, P.J.; Saayman, D. Nitrogen Mineralisation in Vineyard Soils of the Western Cape as Affected by Soil Management Practices. S. Afr. J. Enol. Vitic. 2017, 16, 7–13. [Google Scholar] [CrossRef] [Scilit]
- Wu, F.; Tang, Q.; Cui, J.; Tian, L.; Guo, R.; Wang, L.; Lin, T. Deficit Irrigation and High Planting Density Improve Nitrogen Uptake and Use Efficiency of Cotton in Drip Irrigation. Agronomy 2024, 14, 1876. [Google Scholar] [CrossRef] [Scilit]
- Sun, Y.; Chen, S.; Feng, P.; Chen, Q.; Hu, K. Assessing the Fates of Water and Nitrogen on an Open-Field Intensive Vegetable System under an Expert-N System with EU-Rotate_N Model in North China Plain. Plants 2024, 13, 2150. [Google Scholar] [CrossRef] [Scilit]
- Verdenal, T.; Spangenberg, J.E.; Dienes-Nagy, Á.; Zufferey, V.; Spring, J.-L.; Viret, O.; van Leeuwen, C. Nitrogen dynamics and fertilisation use efficiency: Carry-over effect of crop limitation. Aust. J. Grape Wine Res. 2022, 28, 358–373. [Google Scholar] [CrossRef] [Scilit]
- Williams, L.E. Recovery of 15N-labeled Fertilizer by Thompson Seedless Grapevines: Effects of N Fertilizer Type and Irrigation Method. Am. J. Enol. Vitic. 2015, 66, 509–517. [Google Scholar] [CrossRef] [Scilit]
- Ariz, I.; Cruz, C.; Moran, J.F.; González-Moro, M.B.; García-Olaverri, C.; González-Murua, C.; Martins-Loução, M.A.; Aparicio-Tejo, P.M. Depletion of the heaviest stable N isotope is associated with NH4+/NH3 toxicity in NH4+-fed plants. BMC Plant Biol. 2011, 11, 83. [Google Scholar] [CrossRef] [Scilit]
- Durante, C.; Bertacchini, L.; Bontempo, L.; Camin, F.; Manzini, D.; Lambertini, P.; Marchetti, A.; Paolini, M. From soil to grape and wine: Variation of light and heavy elements isotope ratios. Food Chem. 2016, 210, 648–659. [Google Scholar] [CrossRef] [Scilit]
- Kalcsits, L.A.; Buschhaus, H.A.; Guy, R.D. Nitrogen isotope discrimination as an integrated measure of nitrogen fluxes, assimilation and allocation in plants. Physiol. Plant. 2014, 151, 293–304. [Google Scholar] [CrossRef] [Scilit]
- Templer, P.H.; Arthur, M.A.; Lovett, G.M.; Weathers, K.C. Plant and soil natural abundance δ15N: Indicators of relative rates of nitrogen cycling in temperate forest ecosystems. Oecologia 2007, 153, 399–406. [Google Scholar] [CrossRef] [Scilit] [PubMed]
- Yan, G.; Han, S.; Zhou, M.; Sun, W.; Huang, B.; Wang, H.; Xing, Y.; Wang, Q. Variations in the natural 13C and 15N abundance of plants and soils under long-term N addition and precipitation reduction: Interpretation of C and N dynamics. For. Ecosyst. 2020, 7, 49. [Google Scholar] [CrossRef] [Scilit]
- Schweiger, P.F. Nitrogen isotope fractionation during N uptake via arbuscular mycorrhizal and ectomycorrhizal fungi into grey alder. J. Plant Physiol. 2016, 205, 84–92. [Google Scholar] [CrossRef] [Scilit]
- Makarov, M.I. The Role of Mycorrhiza in Transformation of Nitrogen Compounds in Soil and Nitrogen Nutrition of Plants: A Review. Eurasian Soil Sci. 2019, 52, 193–205. [Google Scholar] [CrossRef] [Scilit]
- Govindarajulu, M.; Pfeffer, P.E.; Jin, H.; Abubaker, J.; Douds, D.D.; Allen, J.W.; Bücking, H.; Lammers, P.J.; Shachar-Hill, Y. Nitrogen transfer in the arbuscular mycorrhizal symbiosis. Nature 2005, 435, 819–823. [Google Scholar] [CrossRef] [Scilit]
- Tian, C.; Kasiborski, B.; Koul, R.; Lammers, P.J.; Bücking, H.; Shachar-Hill, Y. Regulation of the nitrogen transfer pathway in the arbuscular mycorrhizal symbiosis: Gene characterization and the coordination of expression with nitrogen flux. Plant Physiol. 2010, 153, 1175–1187. [Google Scholar] [CrossRef] [Scilit] [PubMed]
- Johansen, A.; Jakobsen, I.; Jensen, E.S. Hyphal N transport by a vesicular-arbuscular mycorrhizal fungus associated with cucumber grown at three nitrogen levels. Plant Soil 1994, 160, 1–9. [Google Scholar] [CrossRef] [Scilit]
- Cheng, X.; Euliss, A.; Baumgartner, K. Nitrogen capture by grapevine roots and arbuscular mycorrhizal fungi from legume cover-crop residues under low rates of mineral fertilization. Biol. Fertil. Soils 2008, 44, 965–973. [Google Scholar] [CrossRef] [Scilit]
- Hobbie, E.A.; Colpaert, J.V. Nitrogen availability and colonization by mycorrhizal fungi correlate with nitrogen isotope patterns in plants. New Phytol. 2003, 157, 115–126. [Google Scholar] [CrossRef] [Scilit]
- Robinson, D.; Handley, L.L.; Scrimgeour, C.M.; Gordon, D.C.; Forster, B.P.; Ellis, R.P. Using stable isotope natural abundances (δ15N and δ13C) to integrate the stress responses of wild barley (Hordeum spontaneum C. Koch.) genotypes. J. Exp. Bot. 2000, 51, 41–50. [Google Scholar] [CrossRef] [Scilit] [PubMed]
- Ariz, I.; Cruz, C.; Neves, T.; Irigoyen, J.J.; Garcia-Olaverri, C.; Nogués, S.; Aparicio-Tejo, P.M.; Aranjuelo, I. Leaf δ15N as a physiological indicator of the responsiveness of N2-fixing alfalfa plants to elevated CO2, temperature and low water availability. Front. Plant Sci. 2015, 6, 574. [Google Scholar] [CrossRef] [Scilit]
- Mirzaee, S.; Nafchi, A.M. Advancing Global Nitrogen Use Efficiency for Environmental Sustainability. Land Degrad. Dev. 2025, 36, 4005–4016. [Google Scholar] [CrossRef] [Scilit]
- Aulakh, M.S.; Malhi, S.S. Interactions of Nitrogen with Other Nutrients and Water: Effect on Crop Yield and Quality, Nutrient Use Efficiency, Carbon Sequestration, and Environmental Pollution. In Advances in Agronomy; Elsevier: Amsterdam, The Netherlands, 2005; pp. 341–409. ISBN 9780120007844. [Google Scholar]
- Drechsel, P.; Heffer, P.; Magen, H.; Mikkelsen, R.; Wichelns, D. (Eds.) Managing Water and Fertilizer for Sustainable Agricultural Intensification; International Fertilizer Industry Association (IFA): Paris, France; International Water Management Institute (IWMI): Paris, France; International Plant Nutrition Institute (IPNI): Paris, France; International Potash Institute (IPI): Paris, France, 2015; ISBN 979-10-92366-02-0. [Google Scholar]
- Peng, X.; Chen, D.; Zhen, J.; Wang, Y.; Hu, X. Greenhouse gas emissions and drivers of the global warming potential of vineyards under different irrigation and fertilizer management practices. Sci. Total Environ. 2024, 950, 175447. [Google Scholar] [CrossRef] [Scilit] [PubMed]
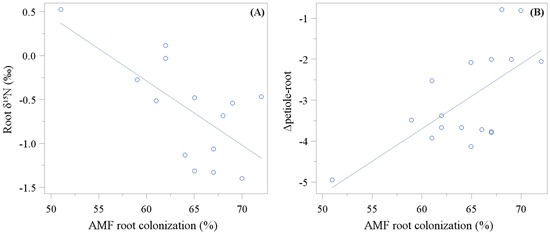
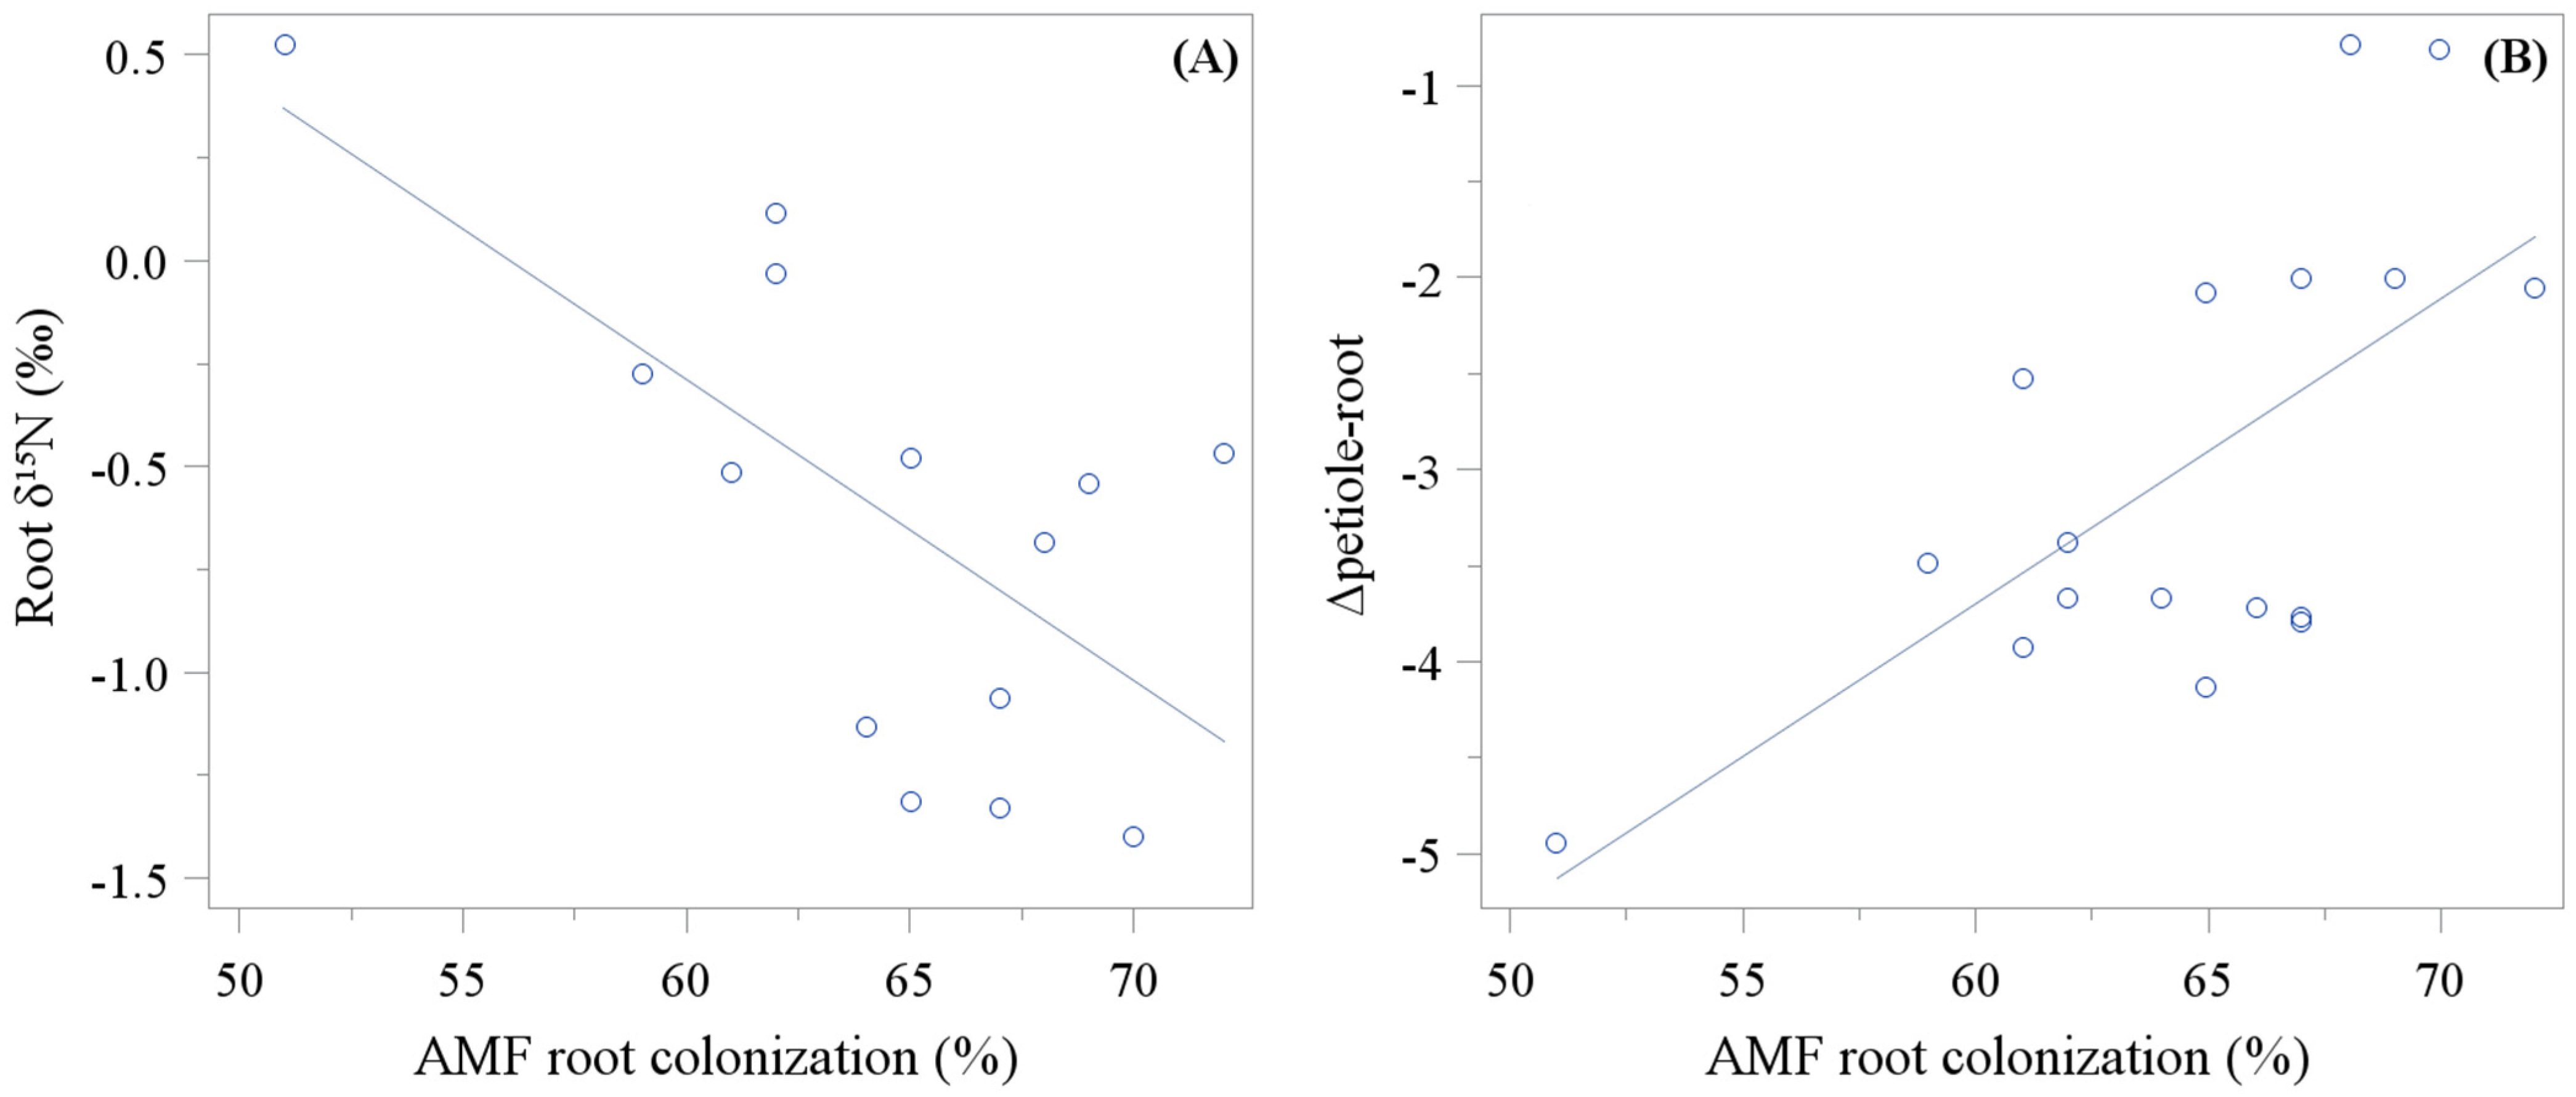
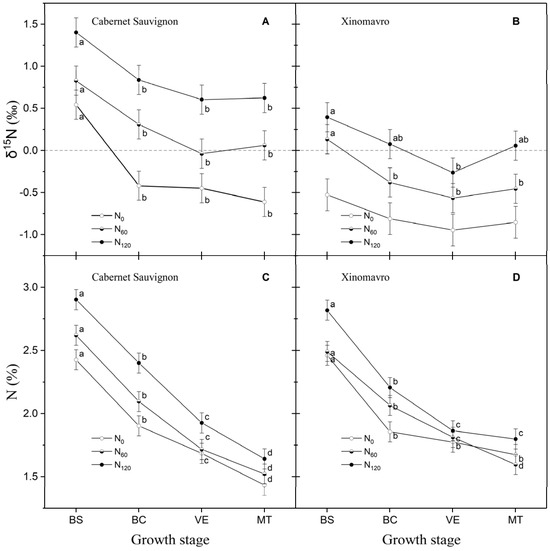
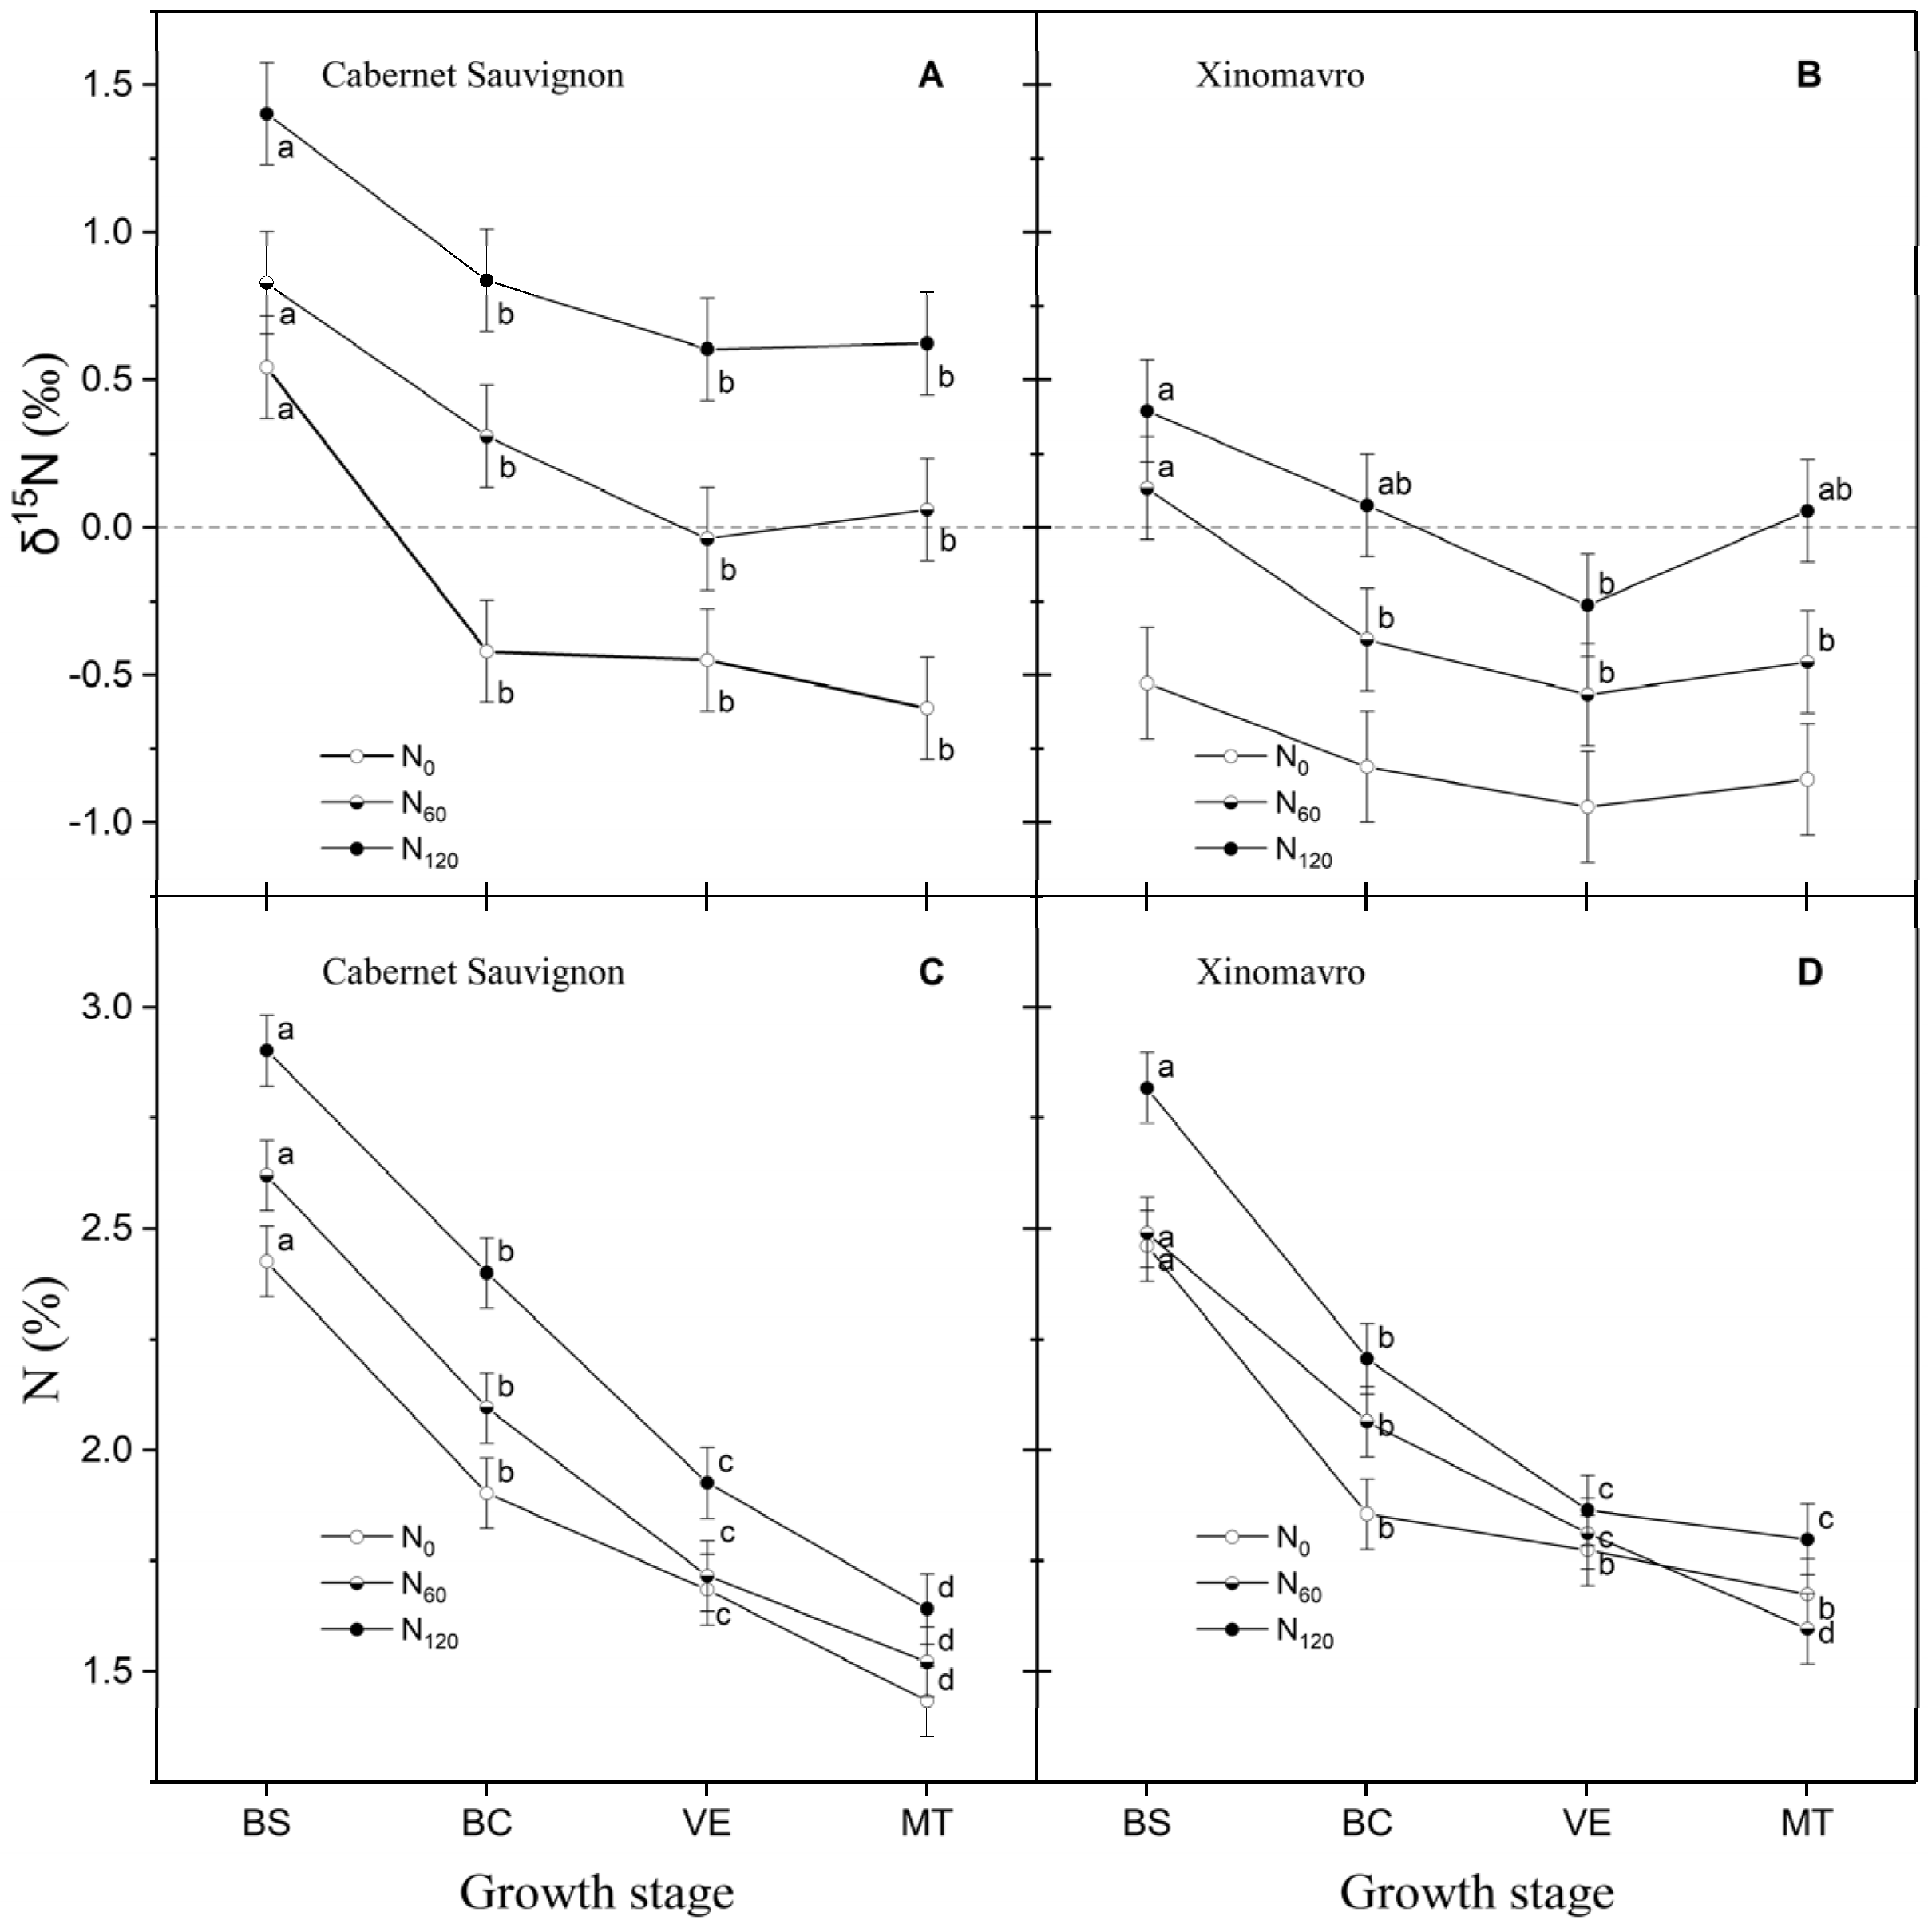
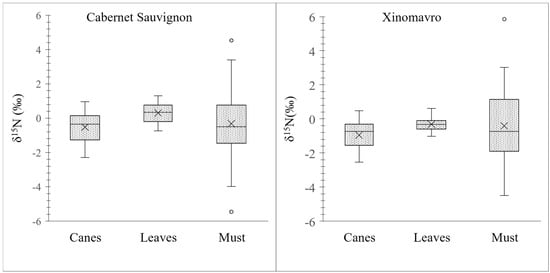
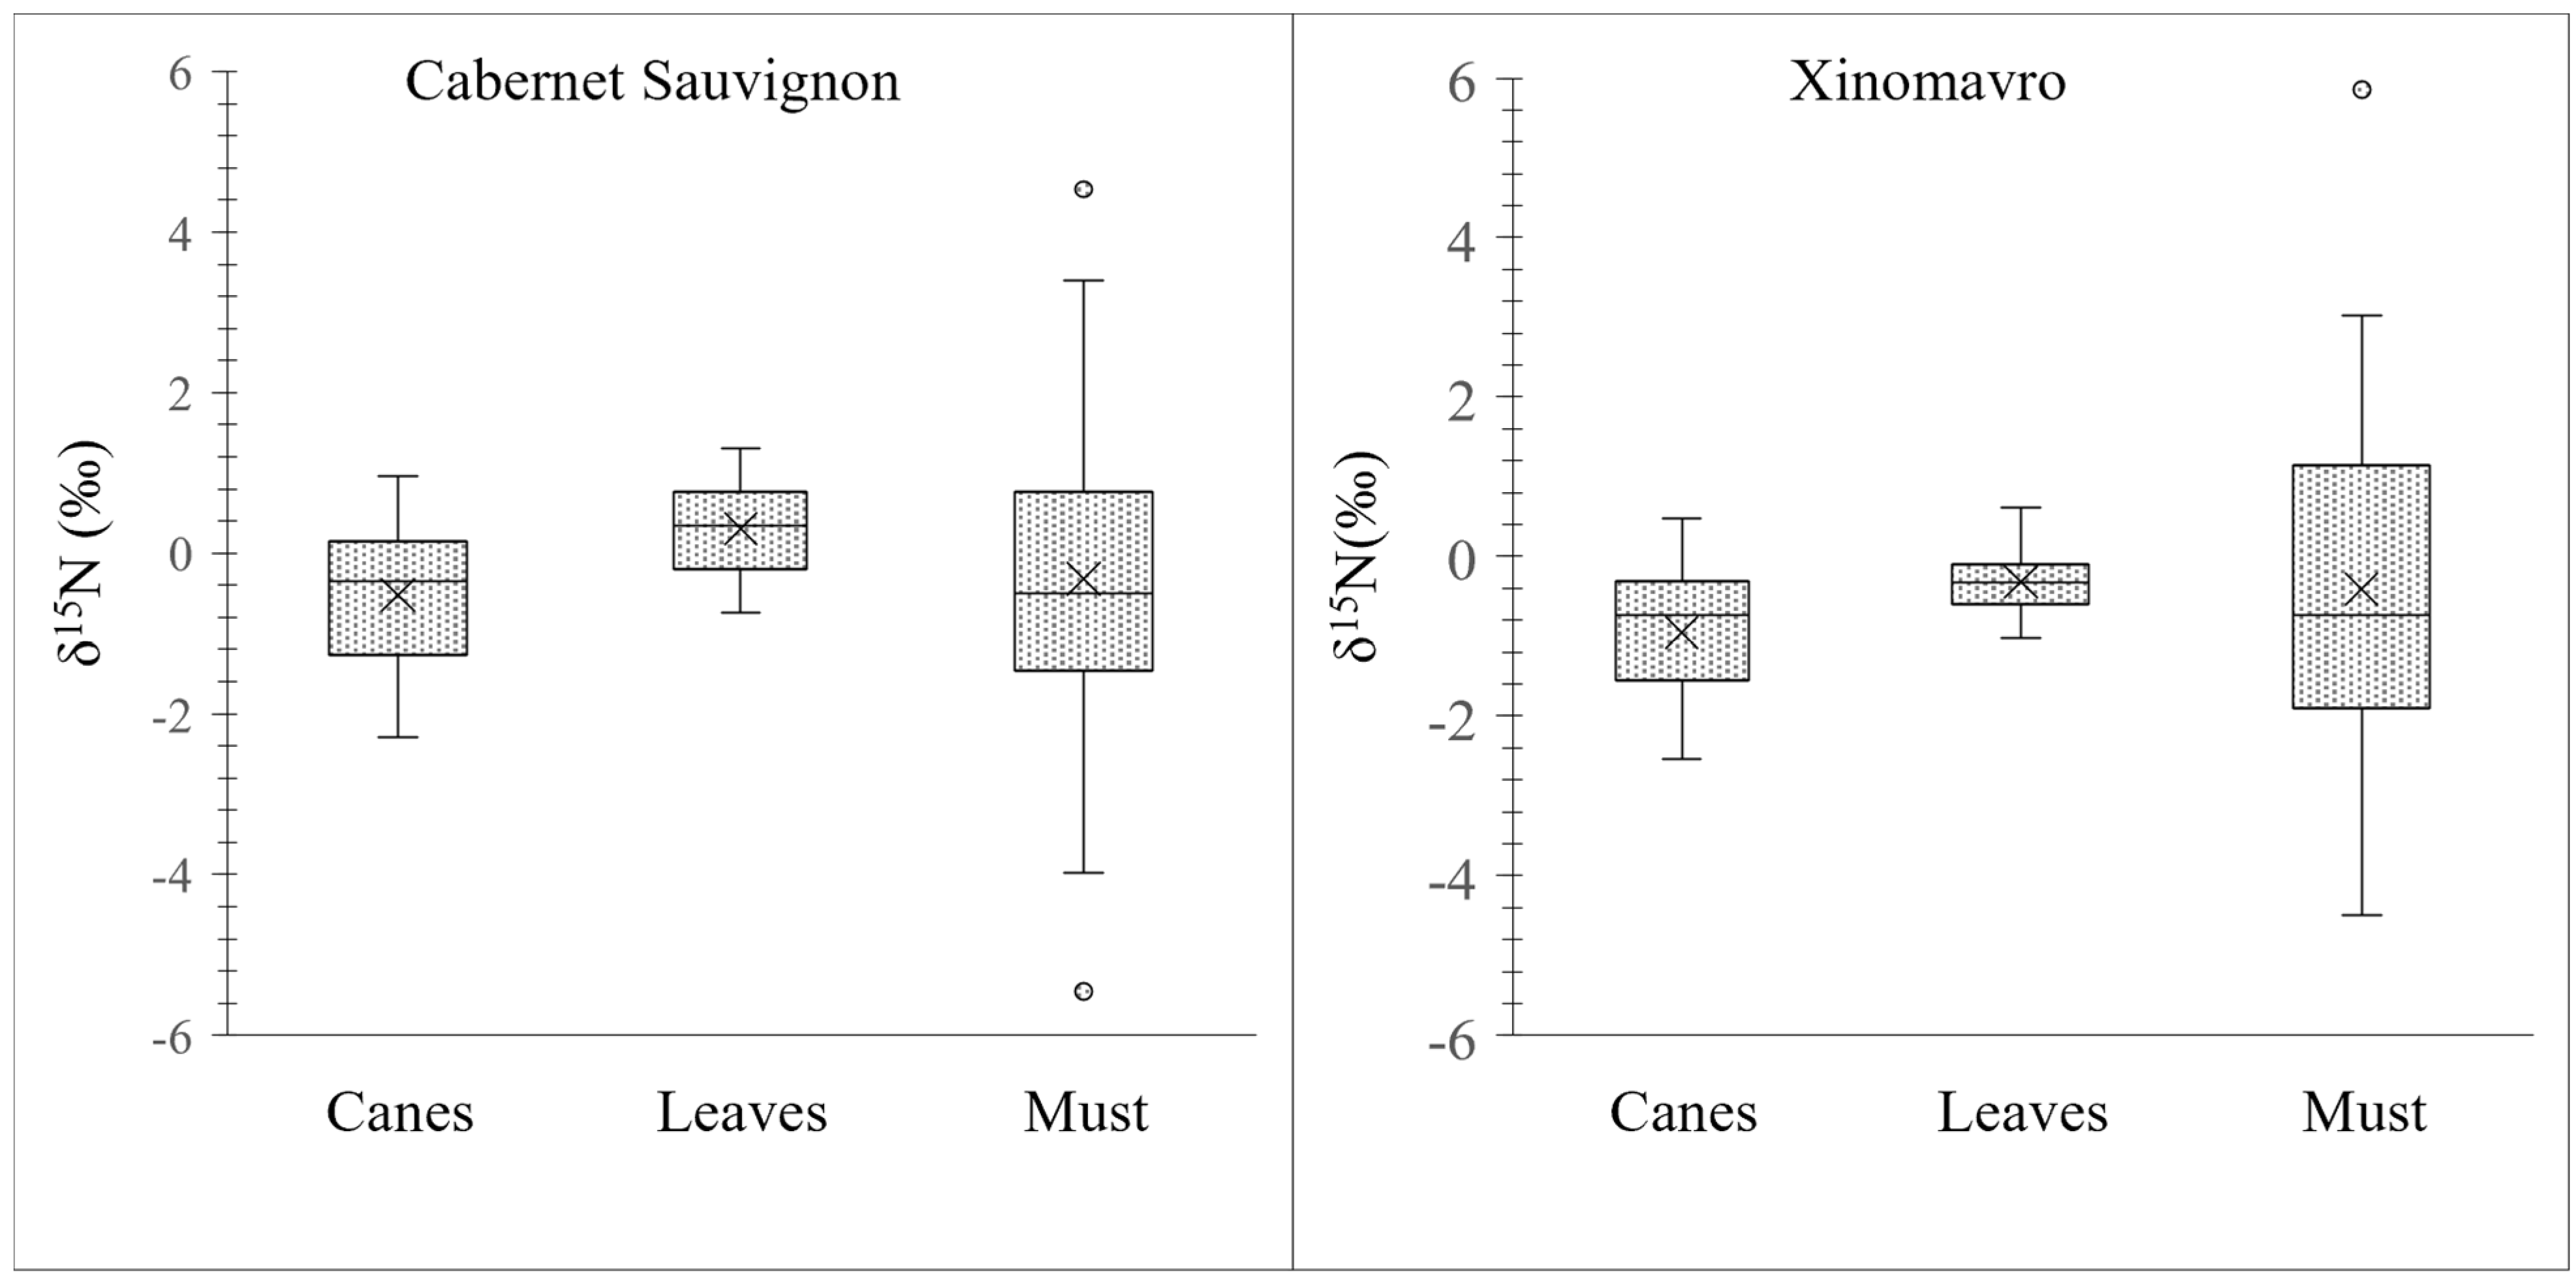
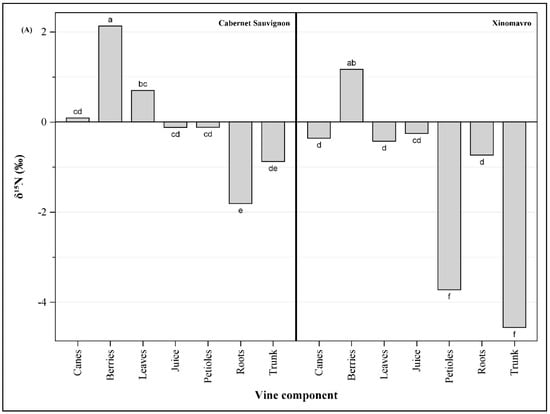
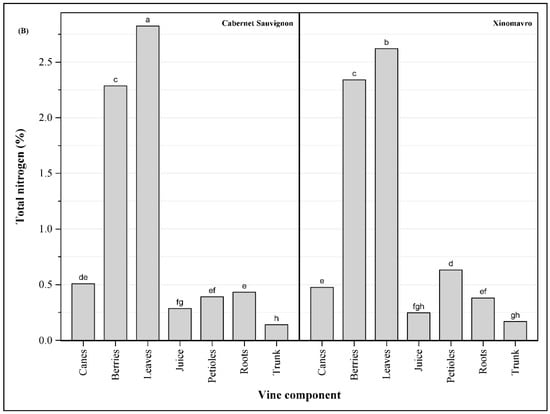
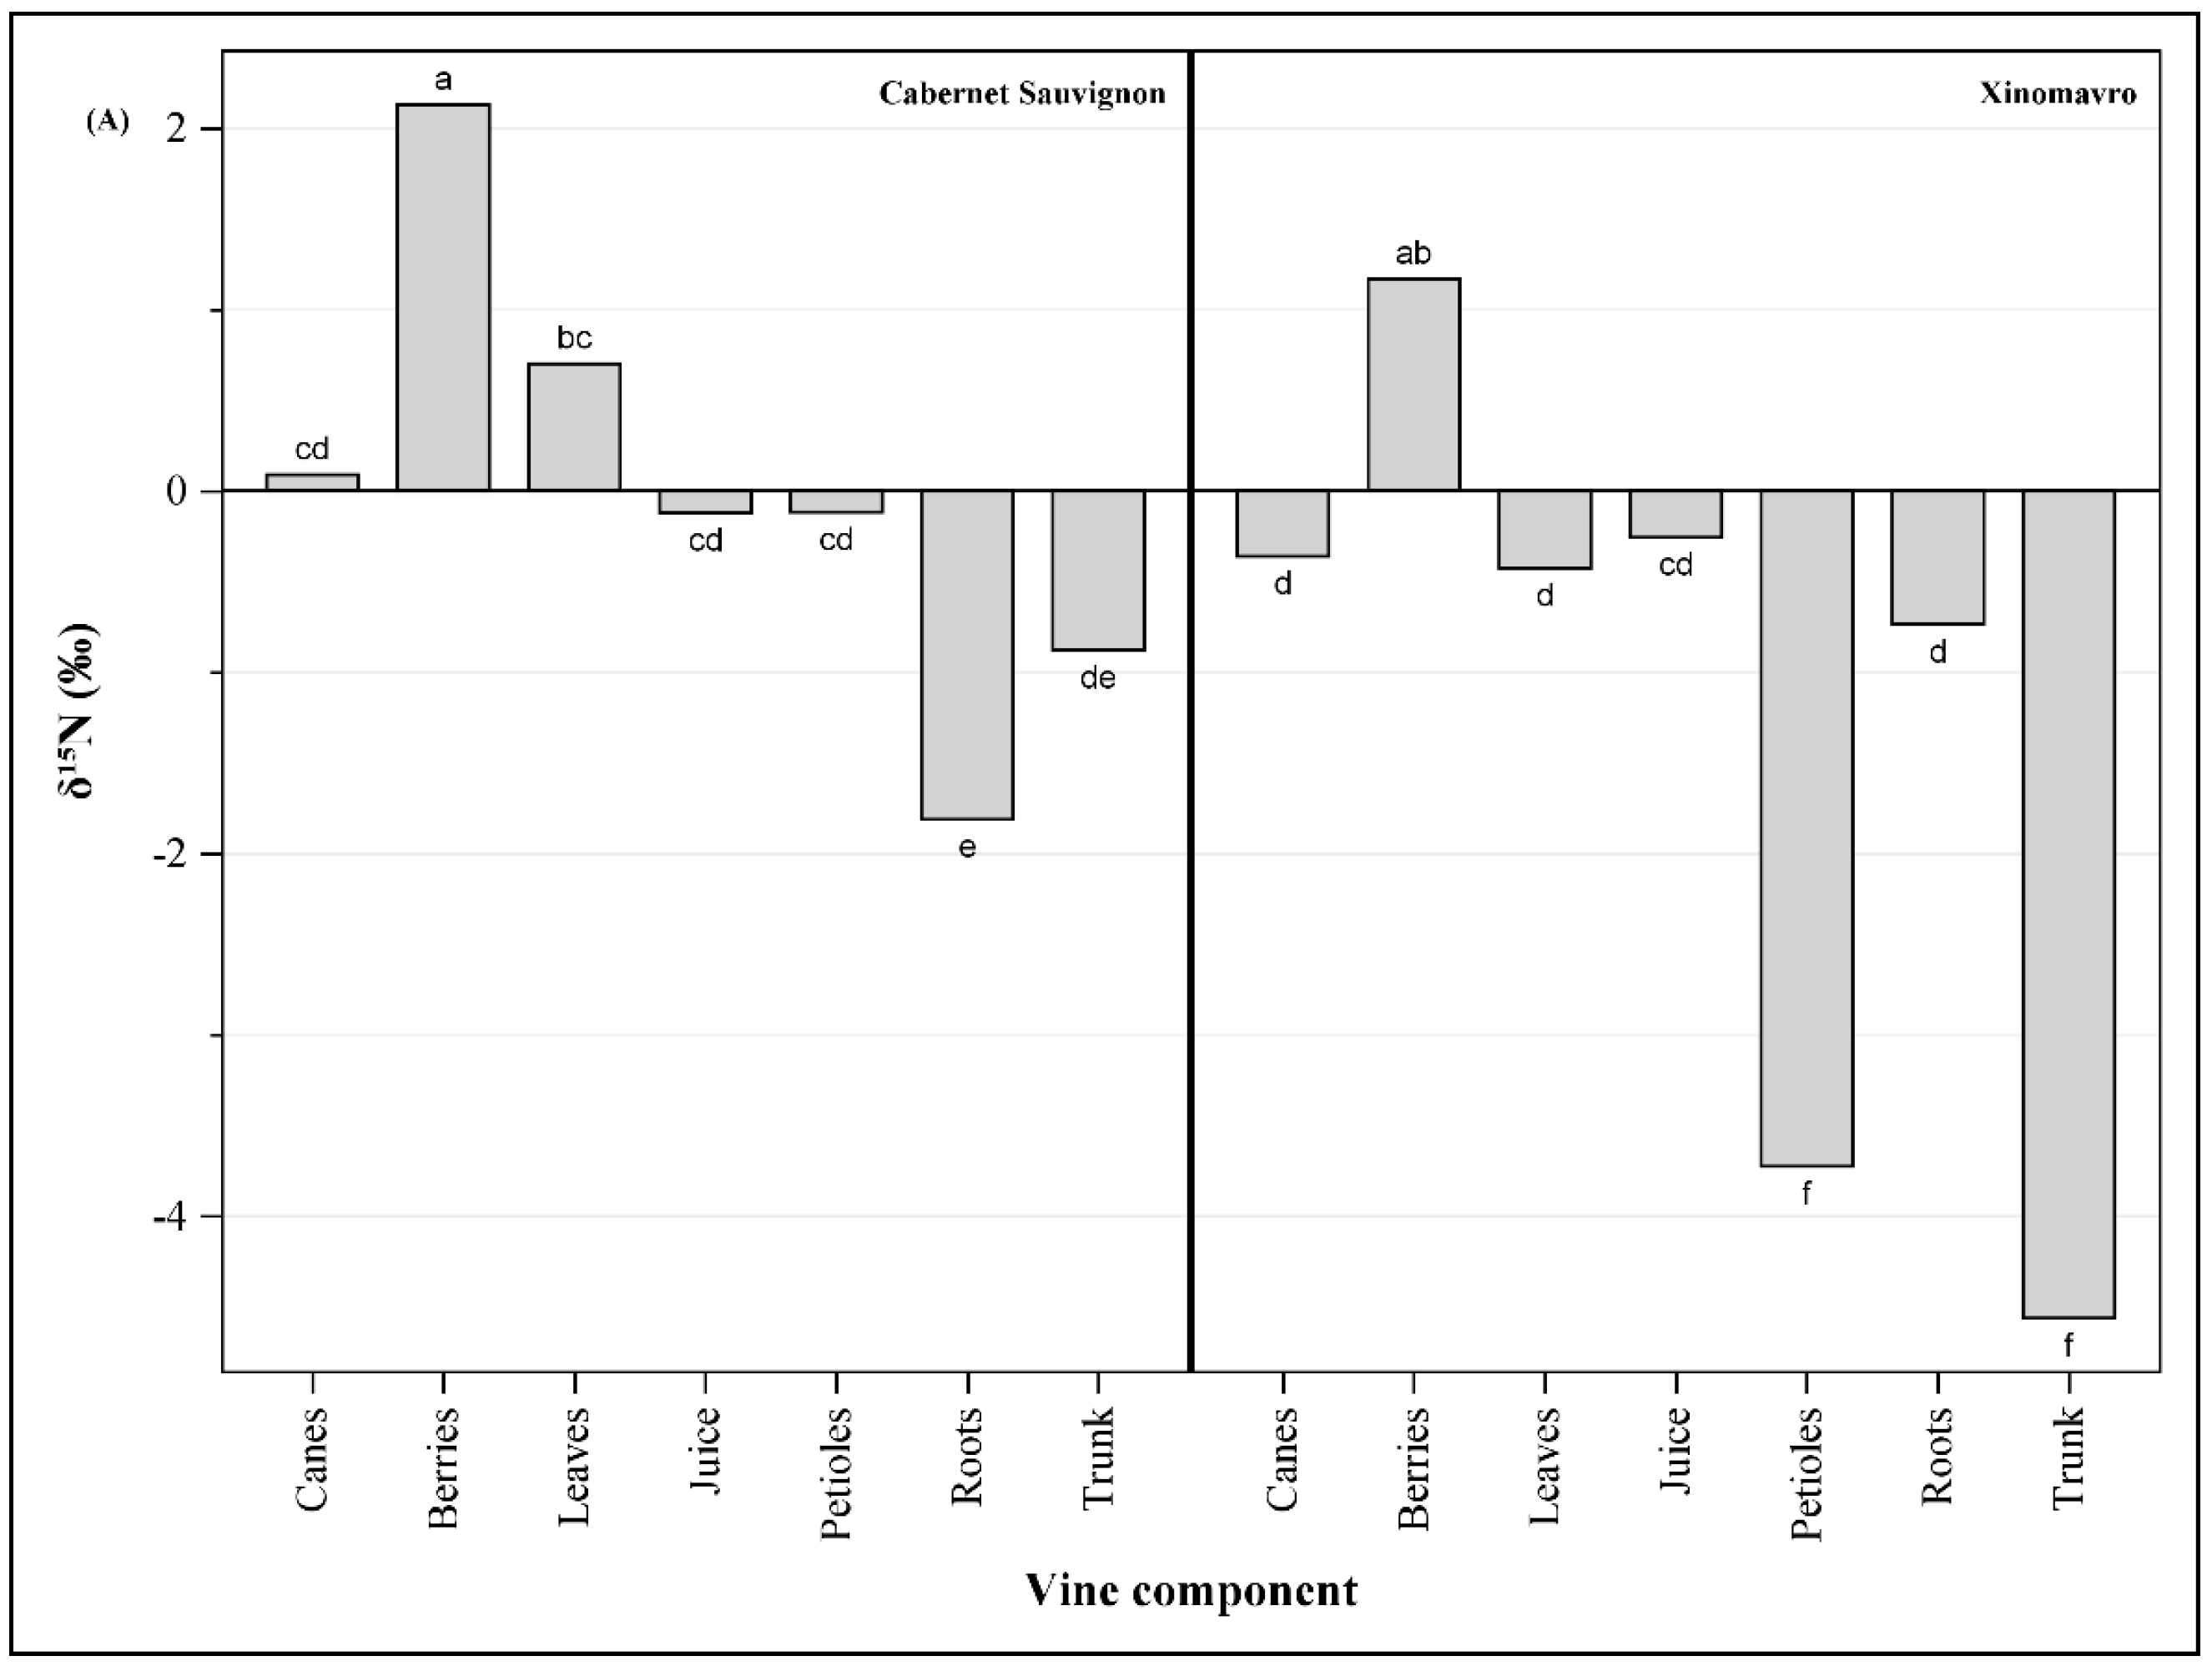
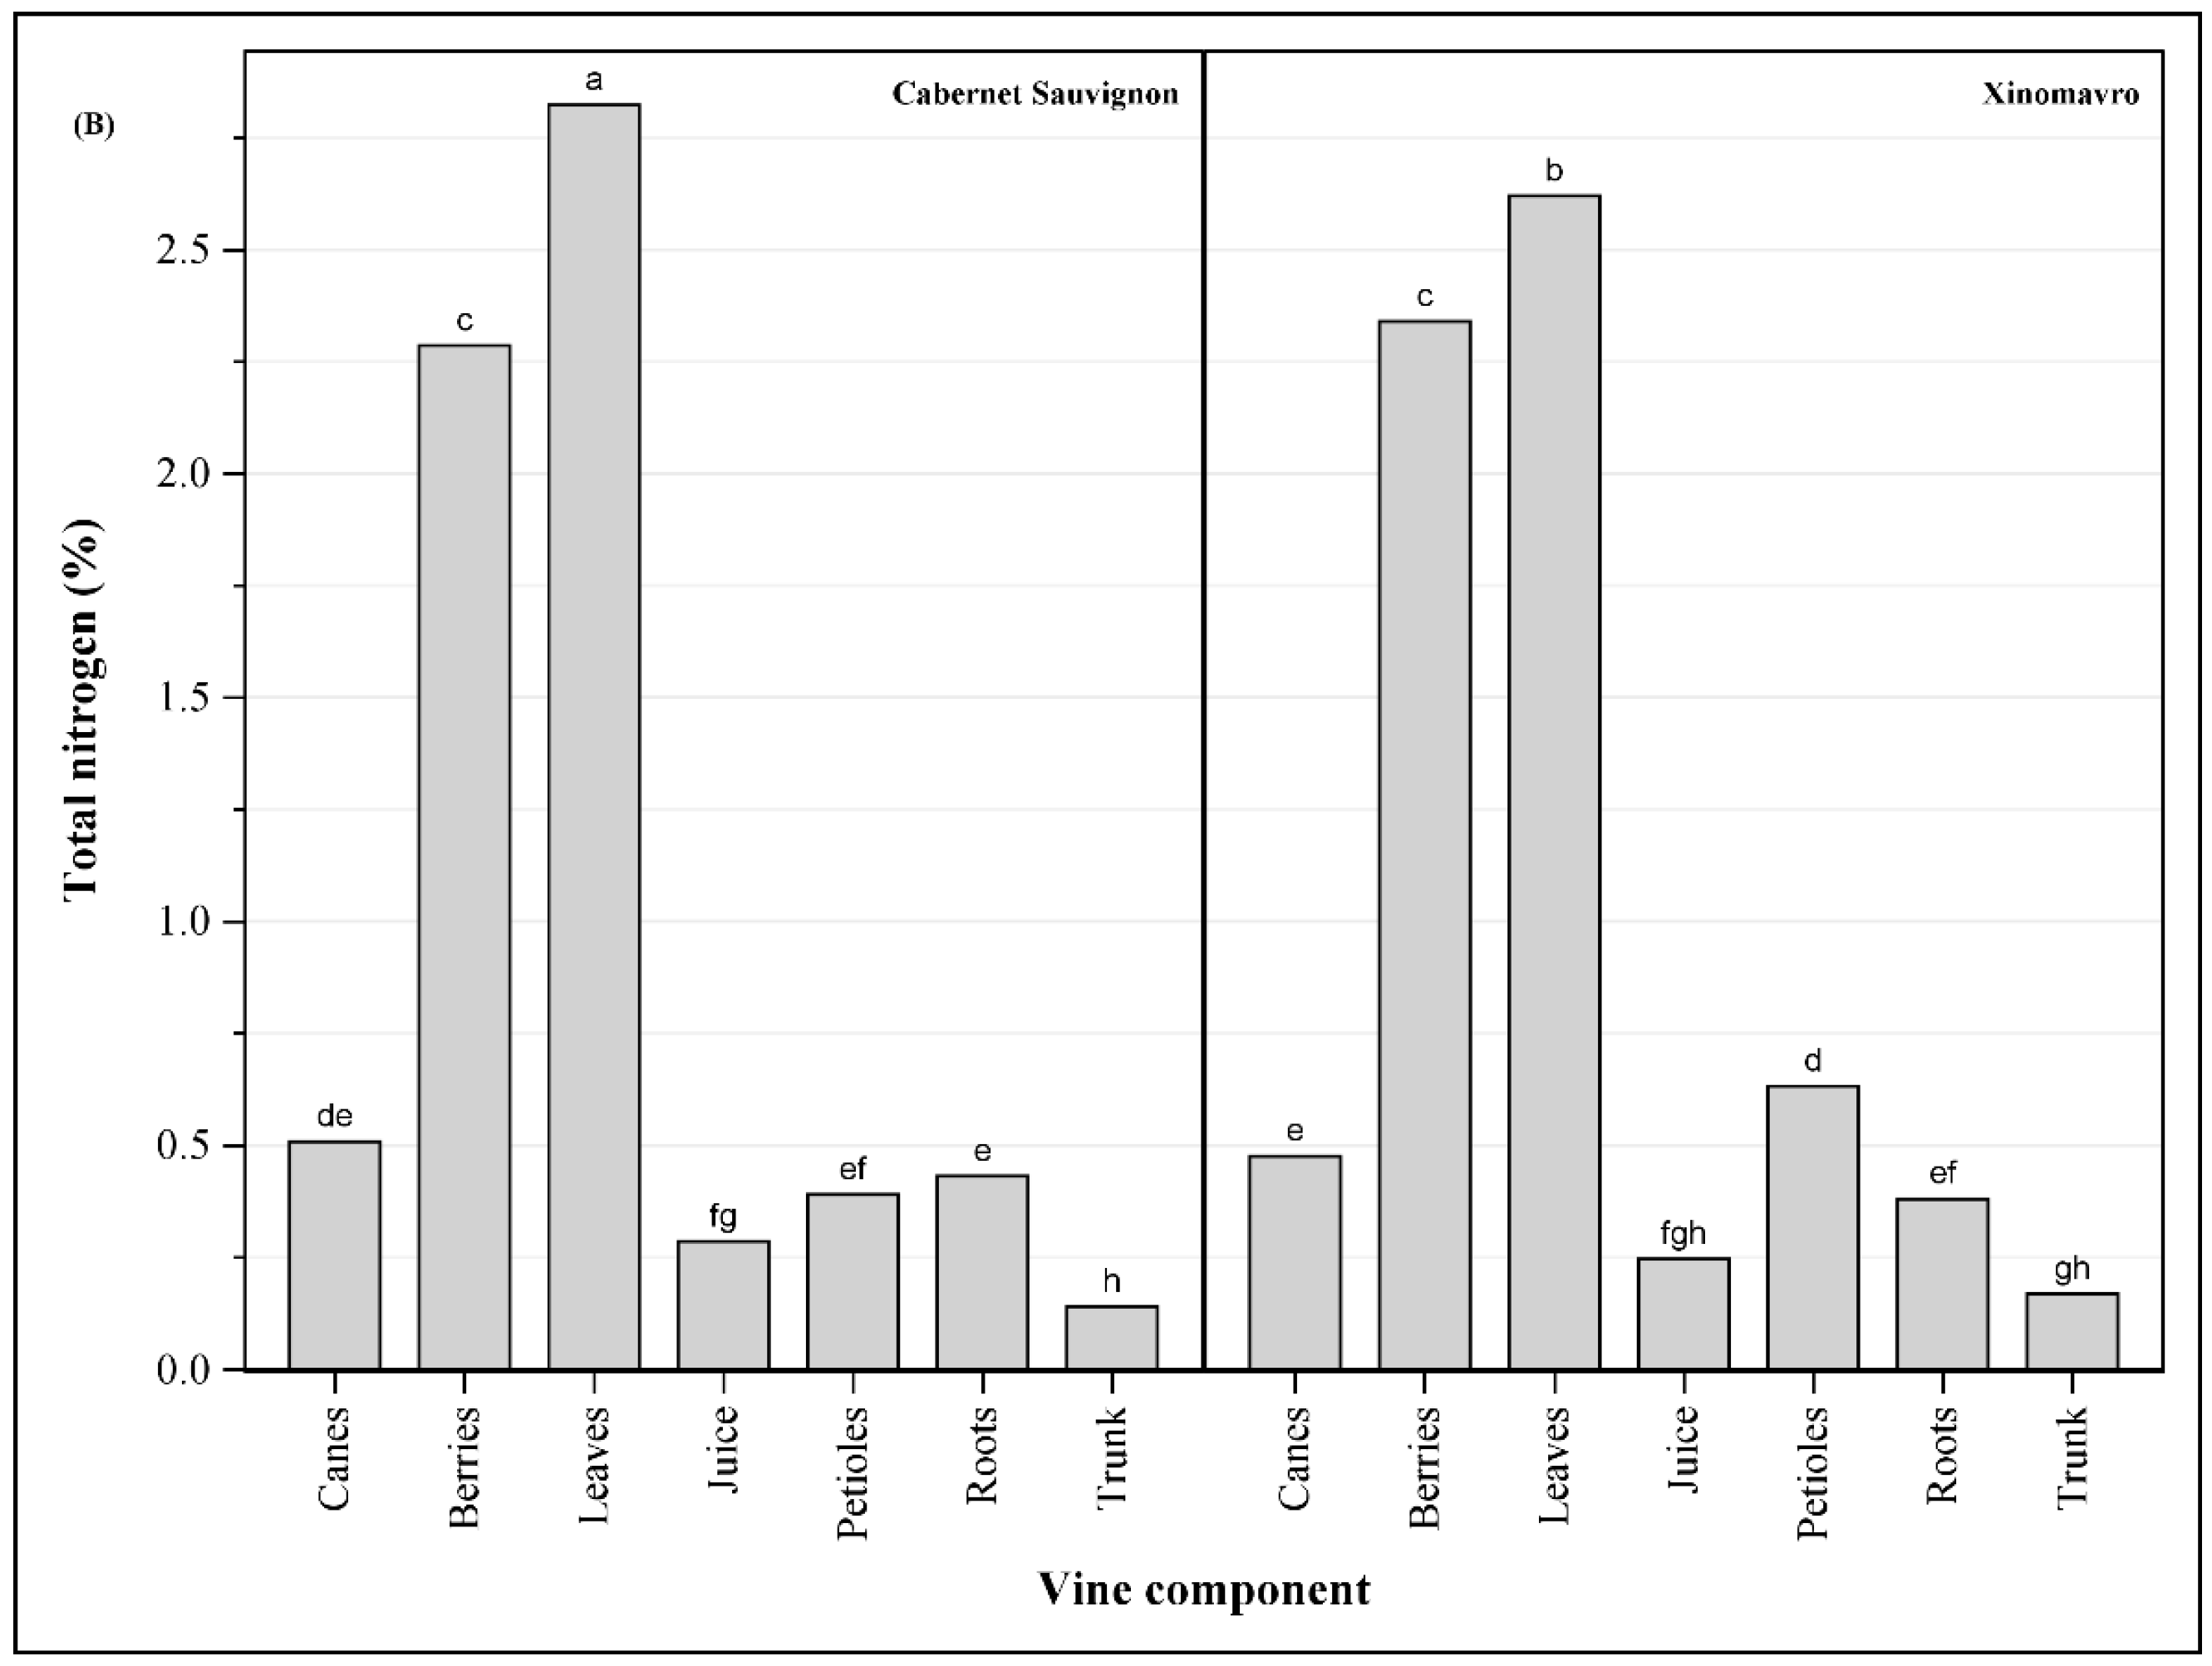
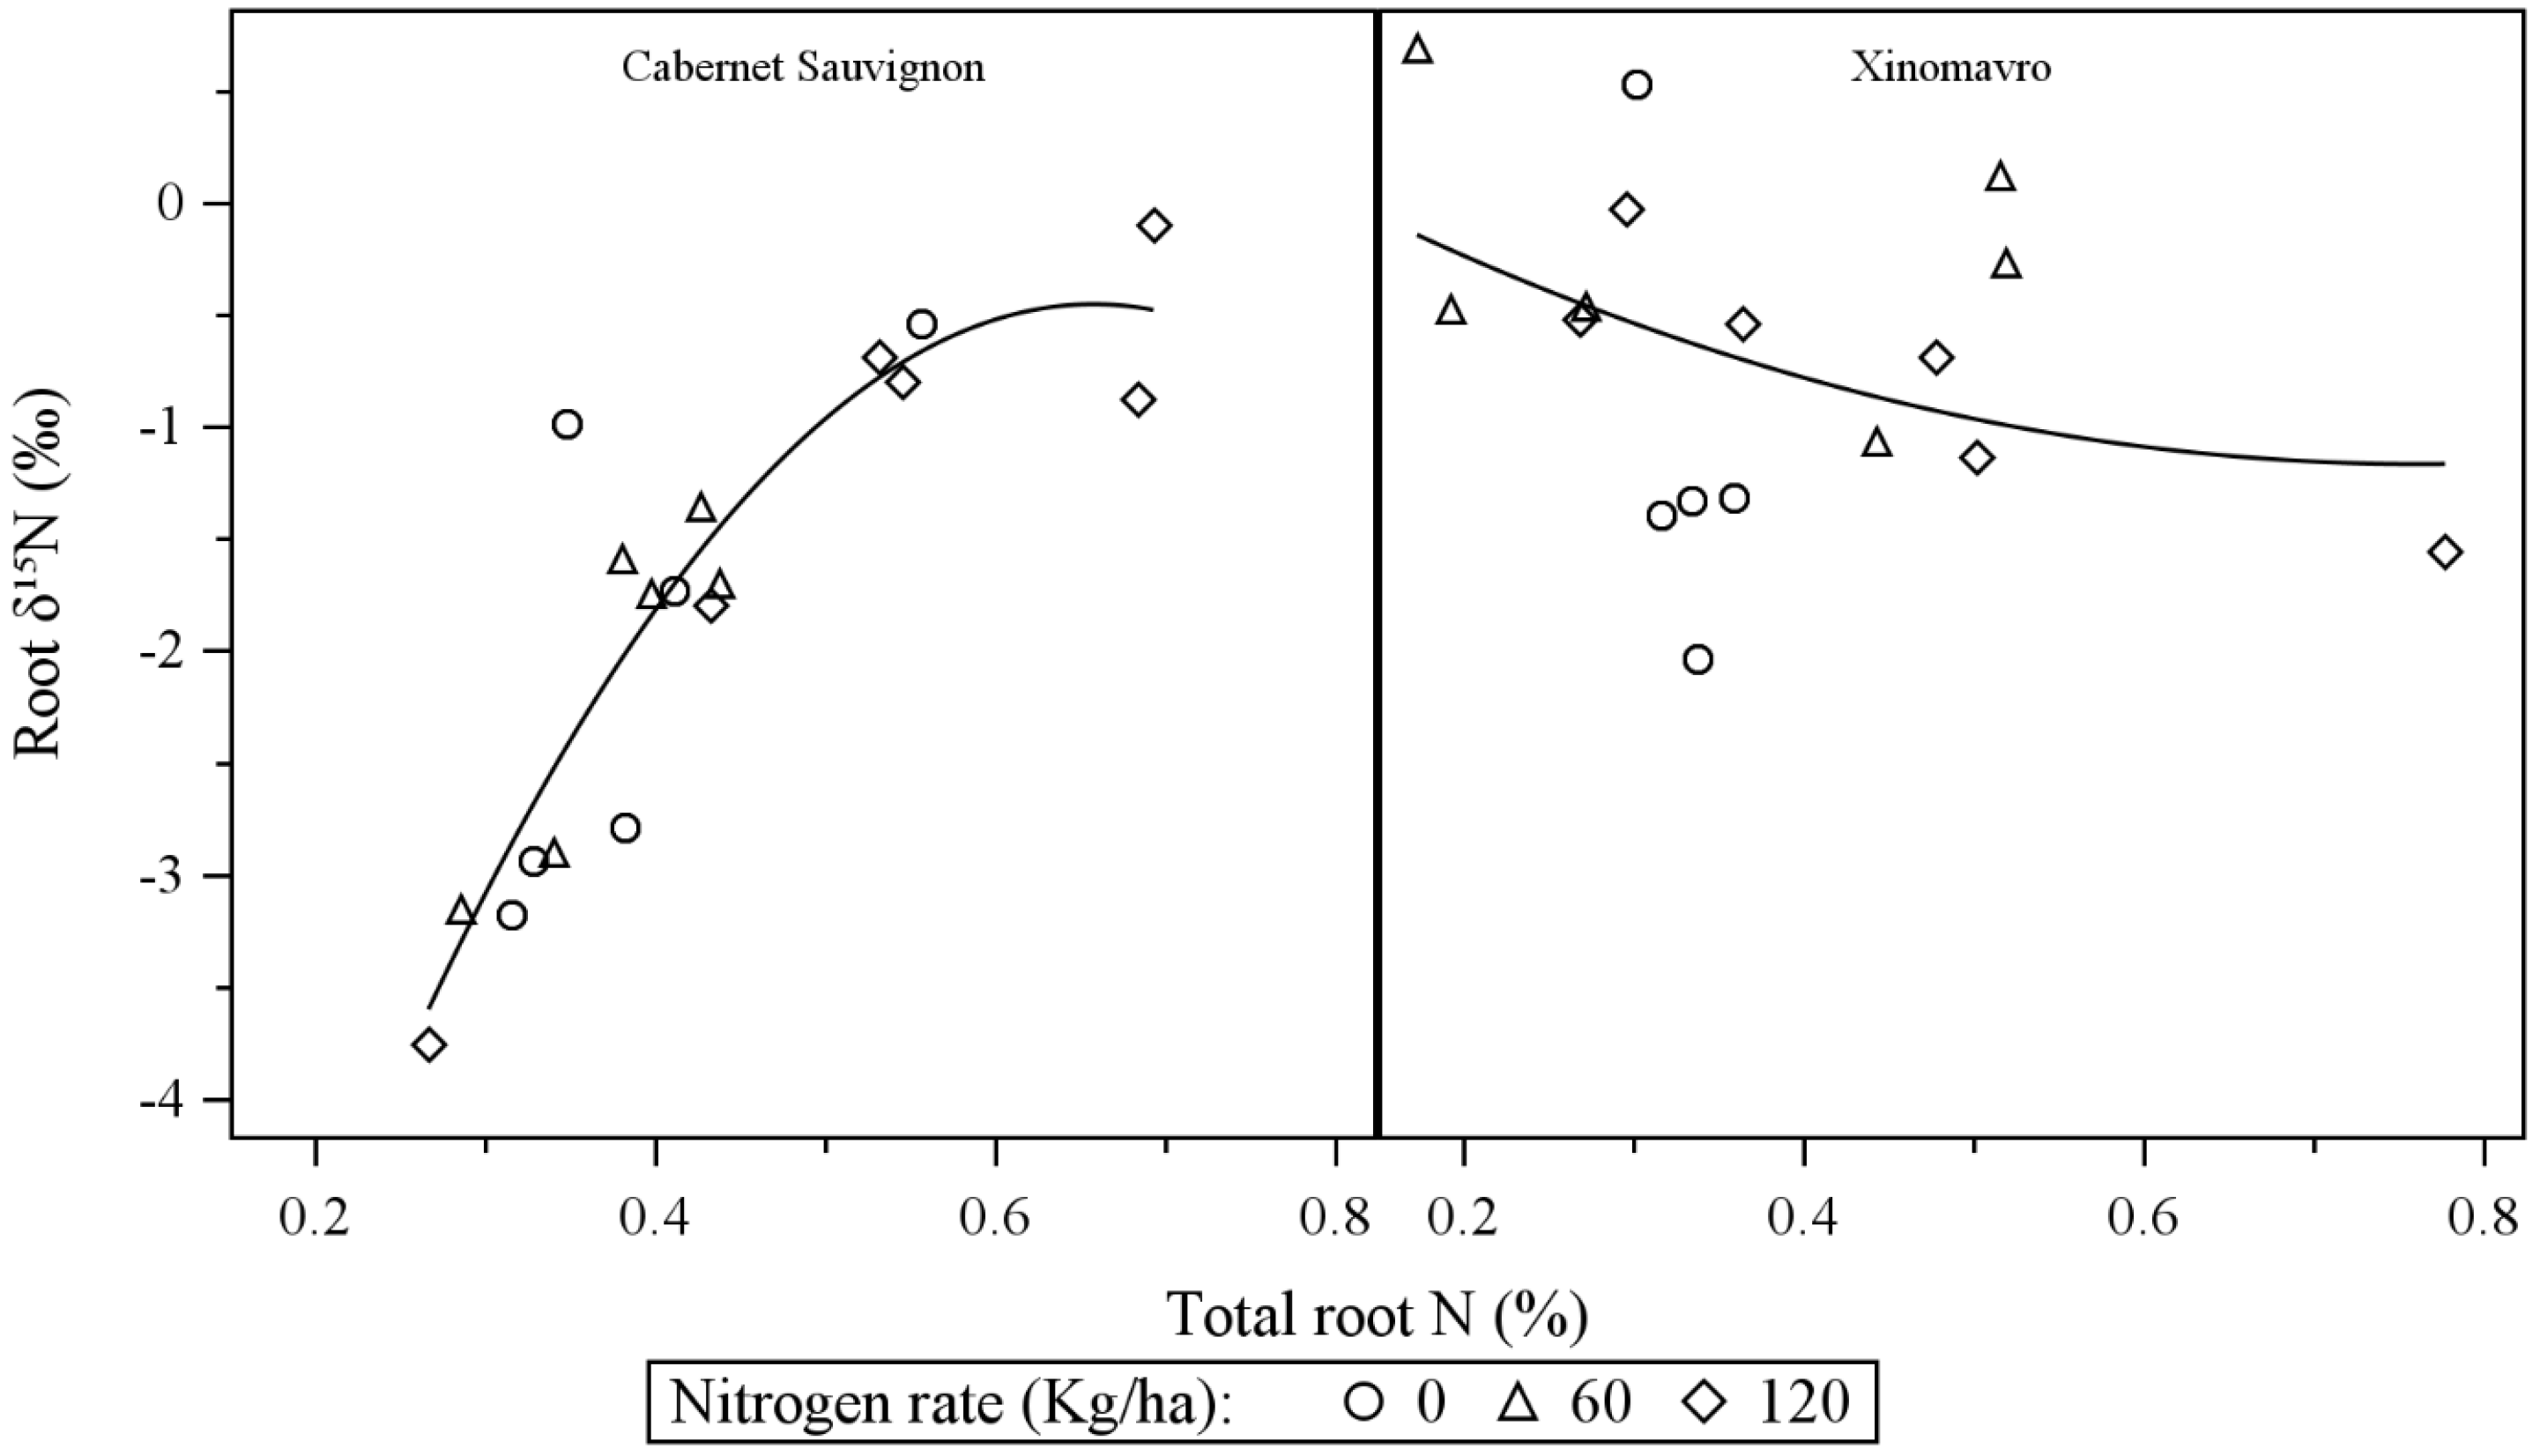
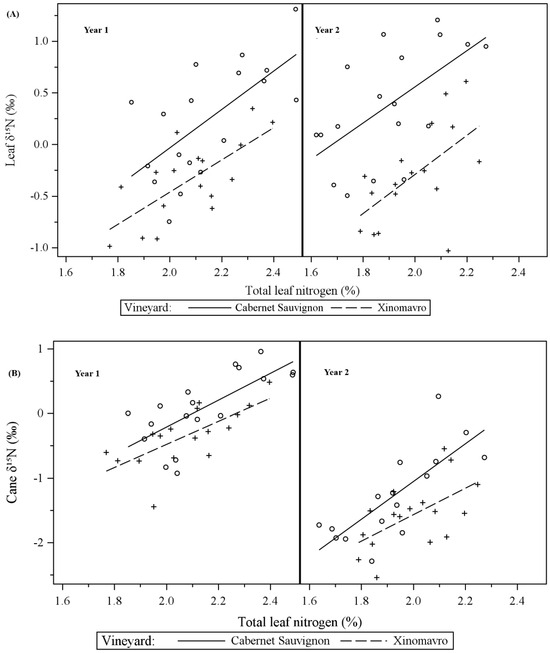
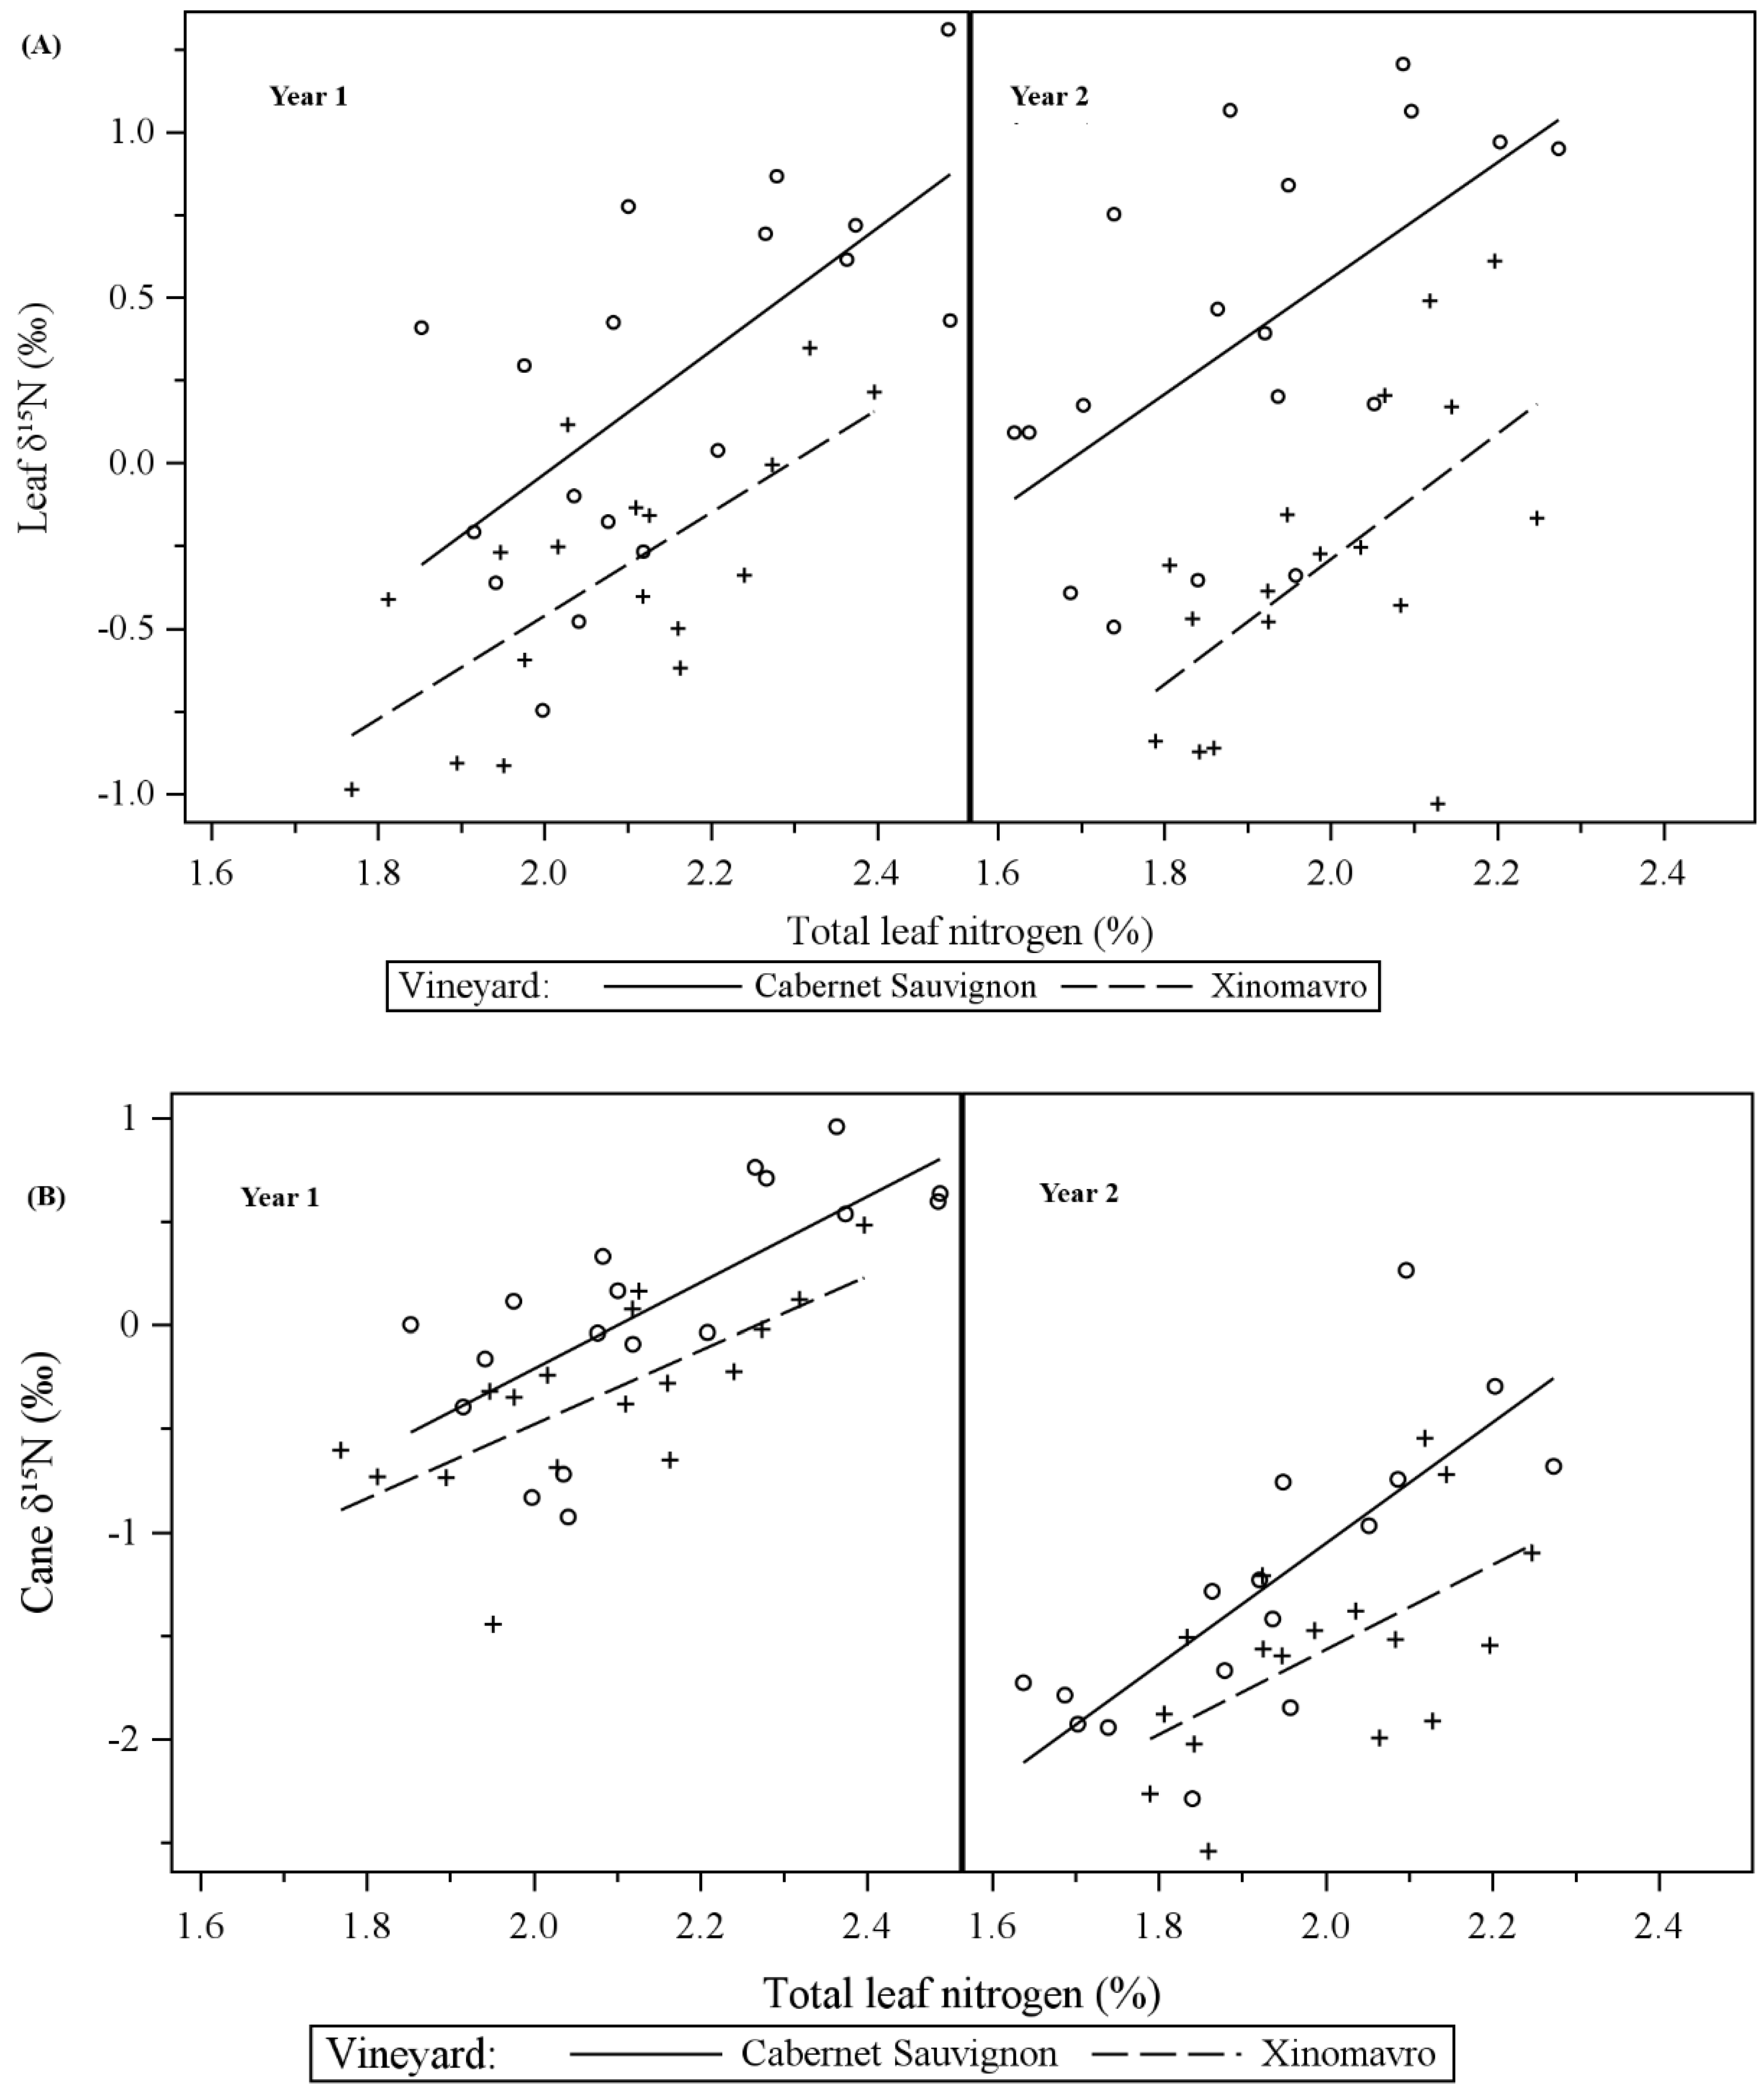
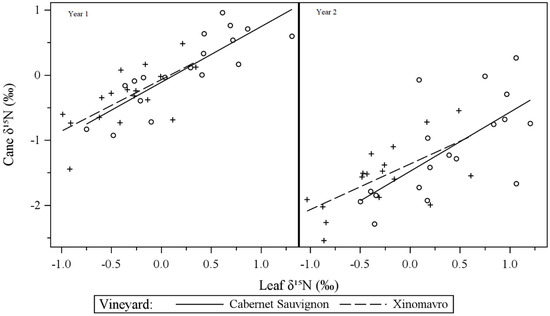
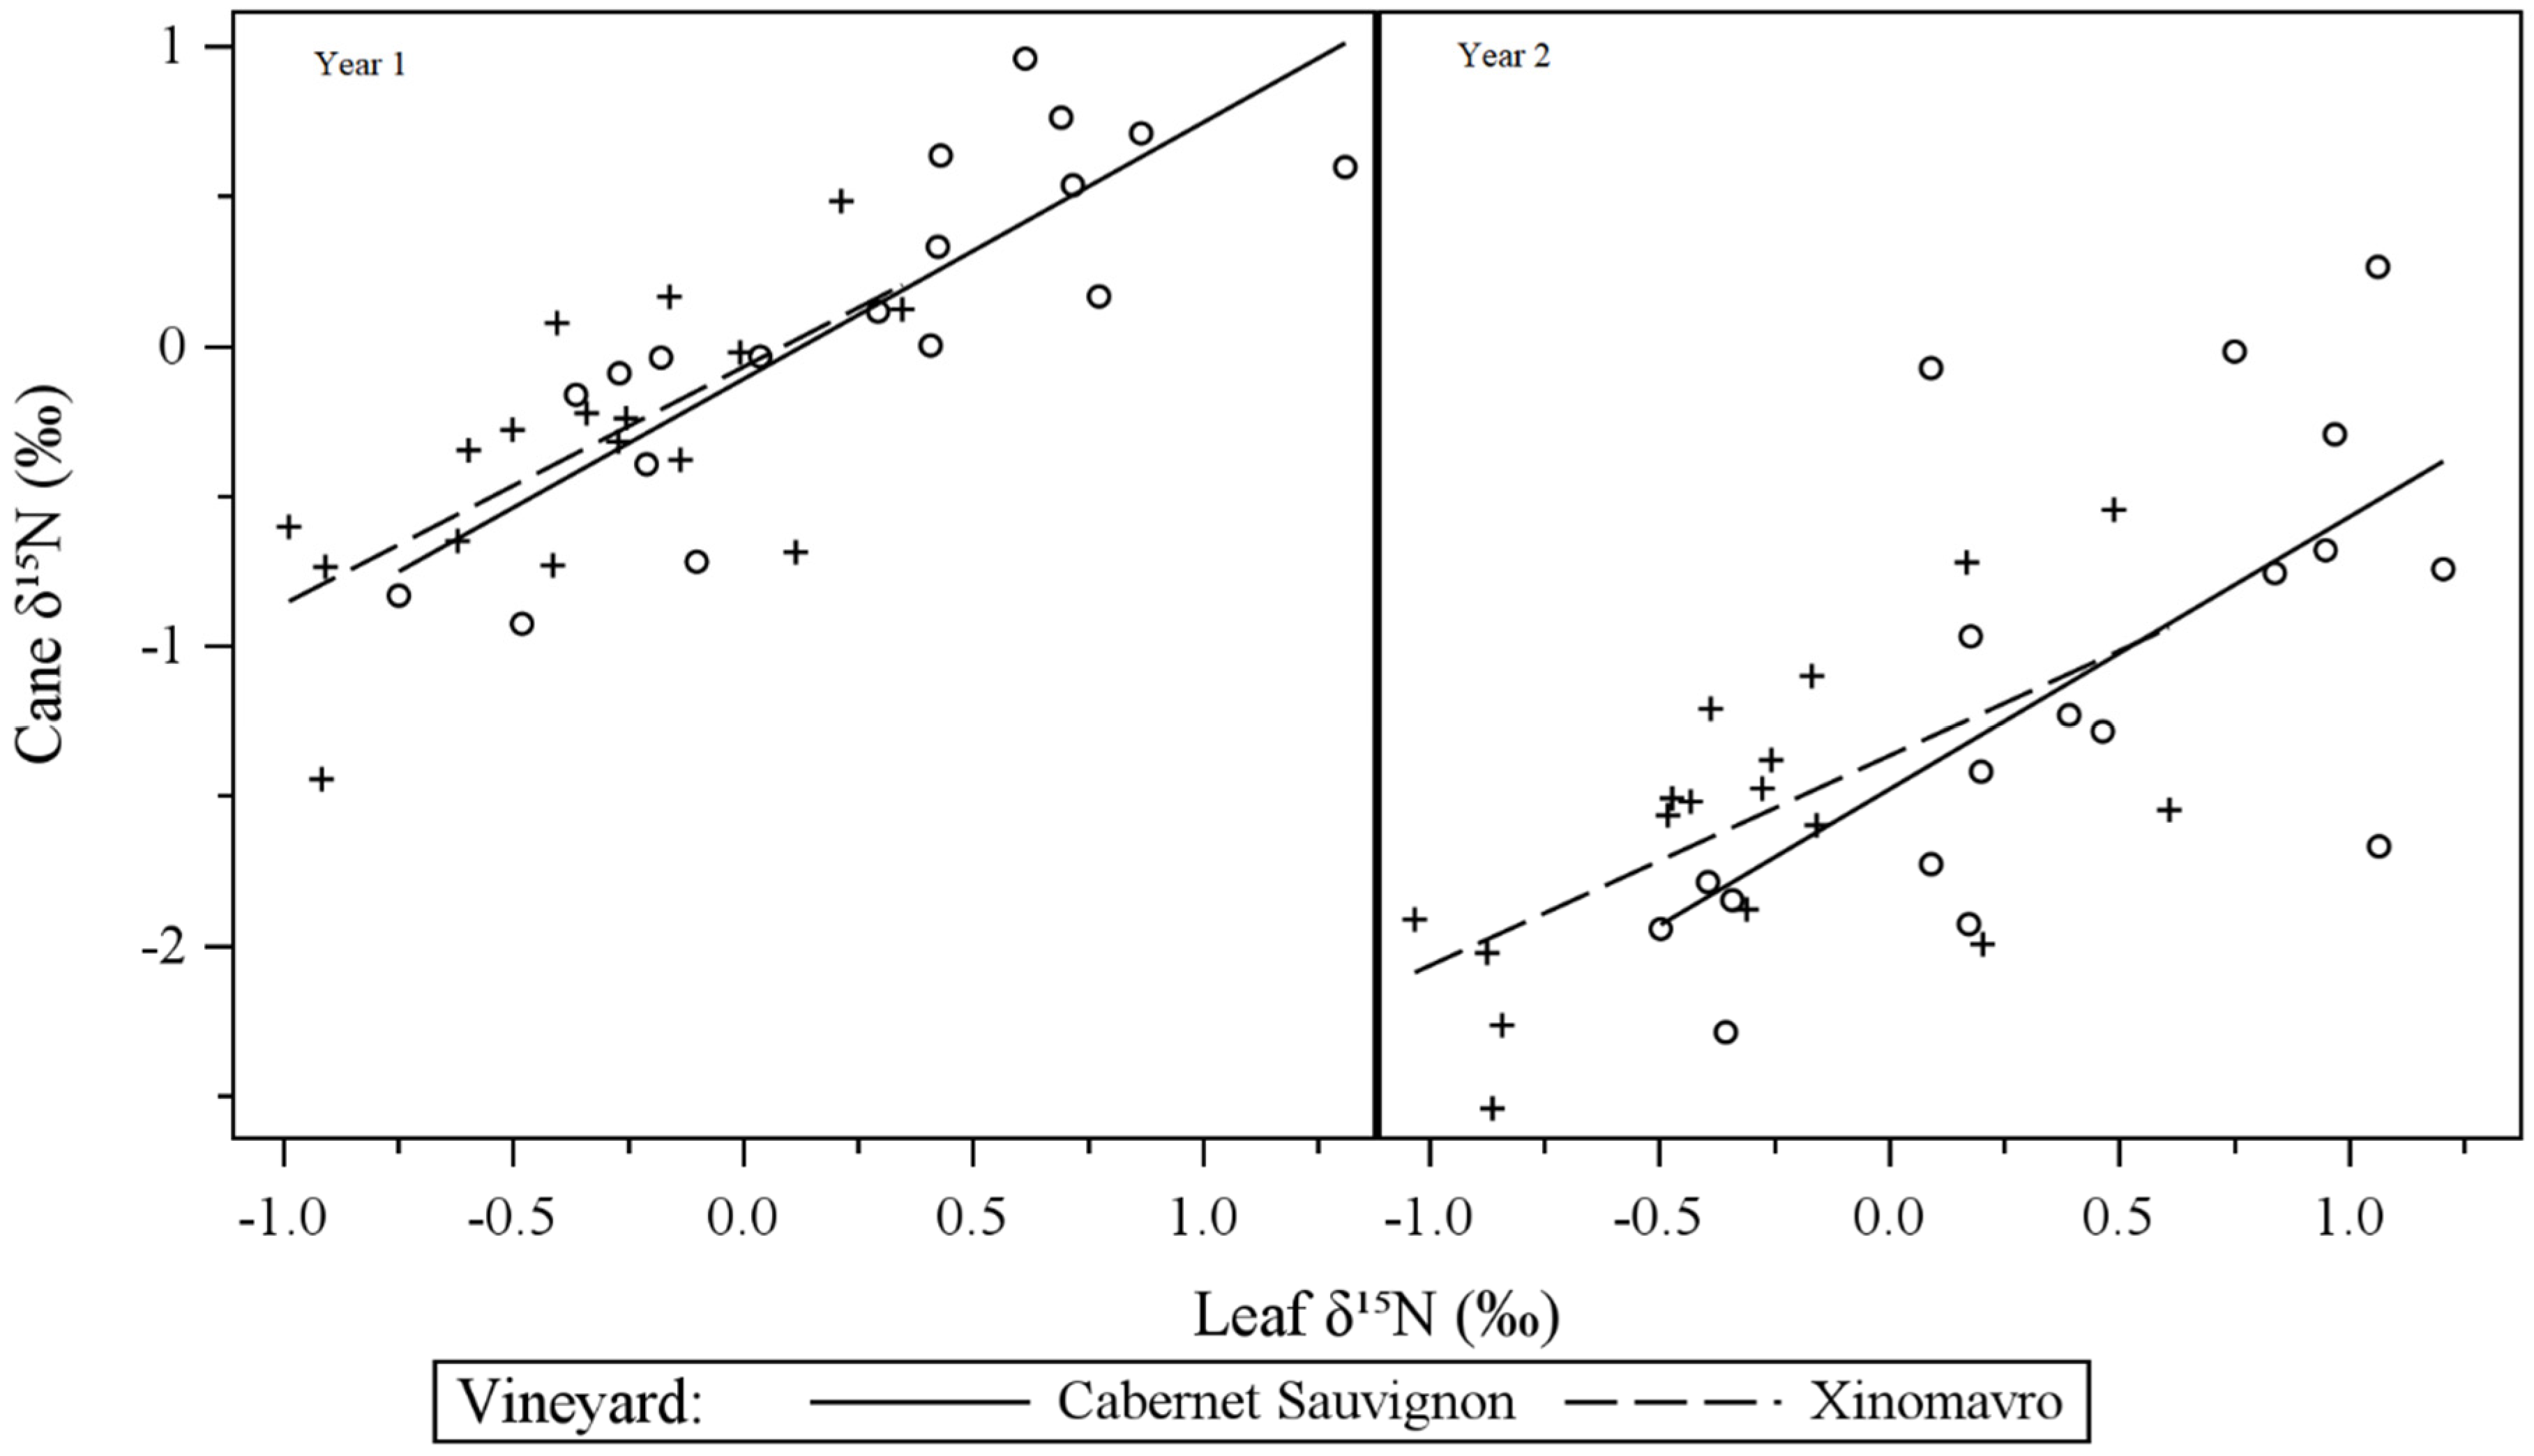
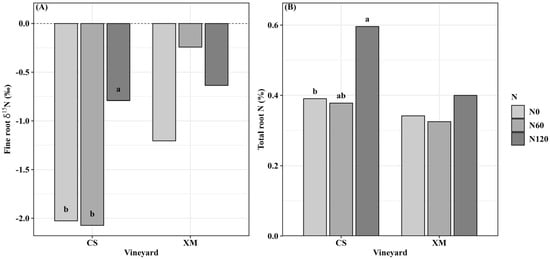
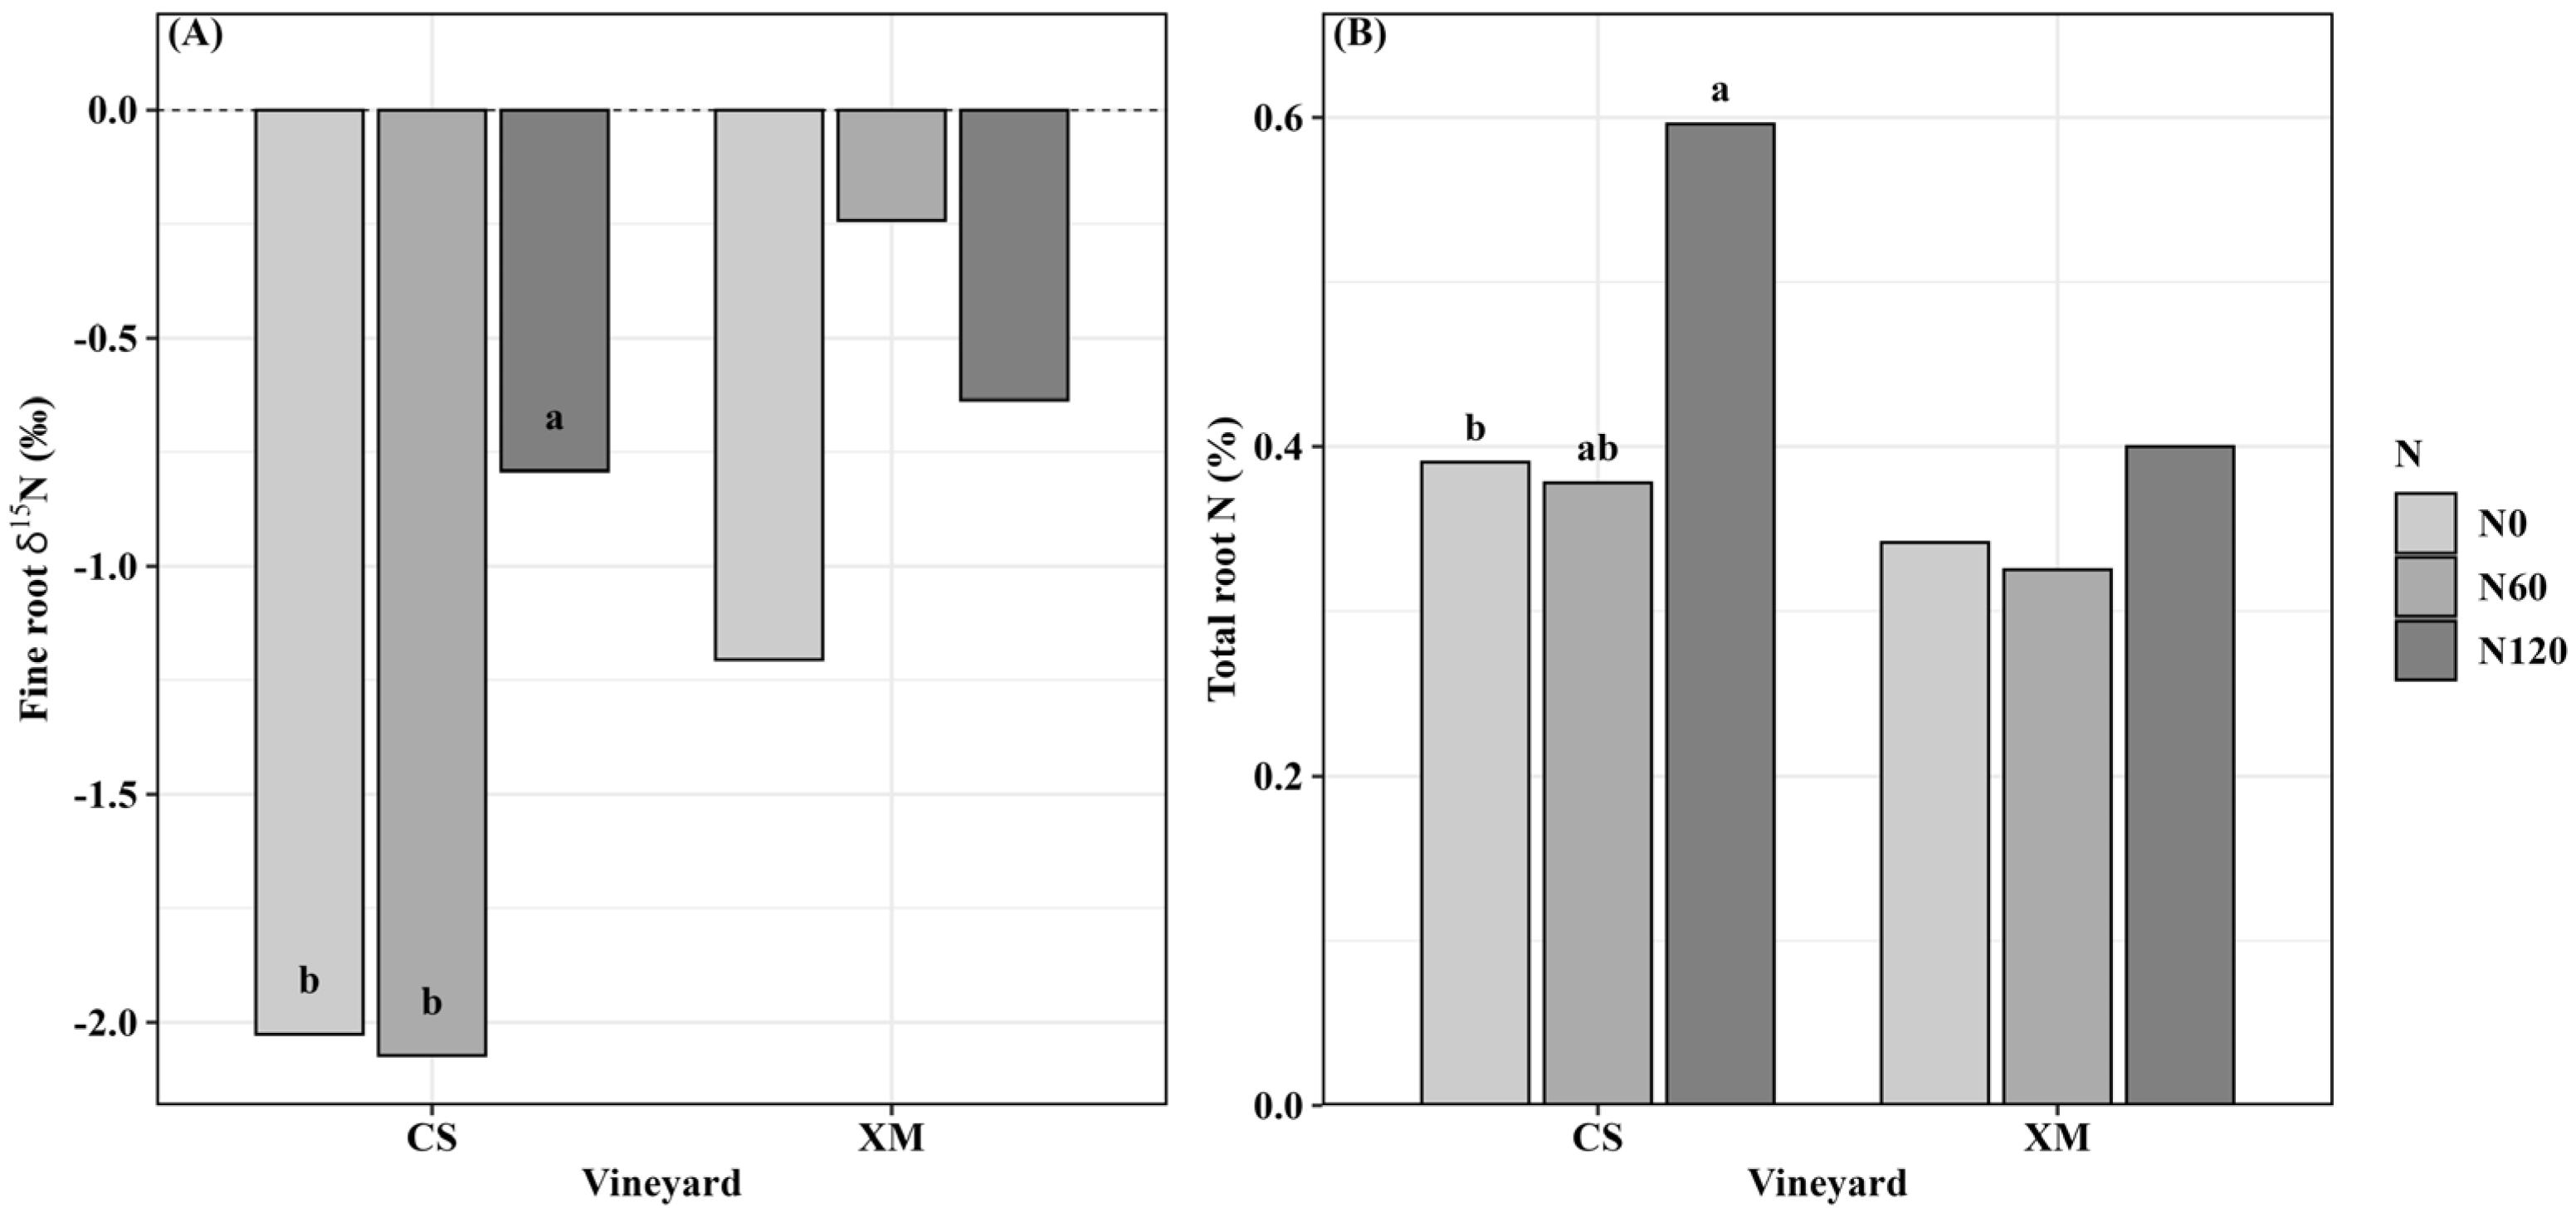
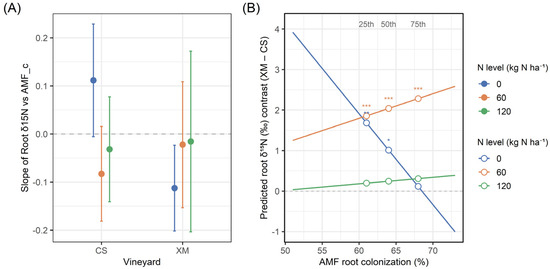
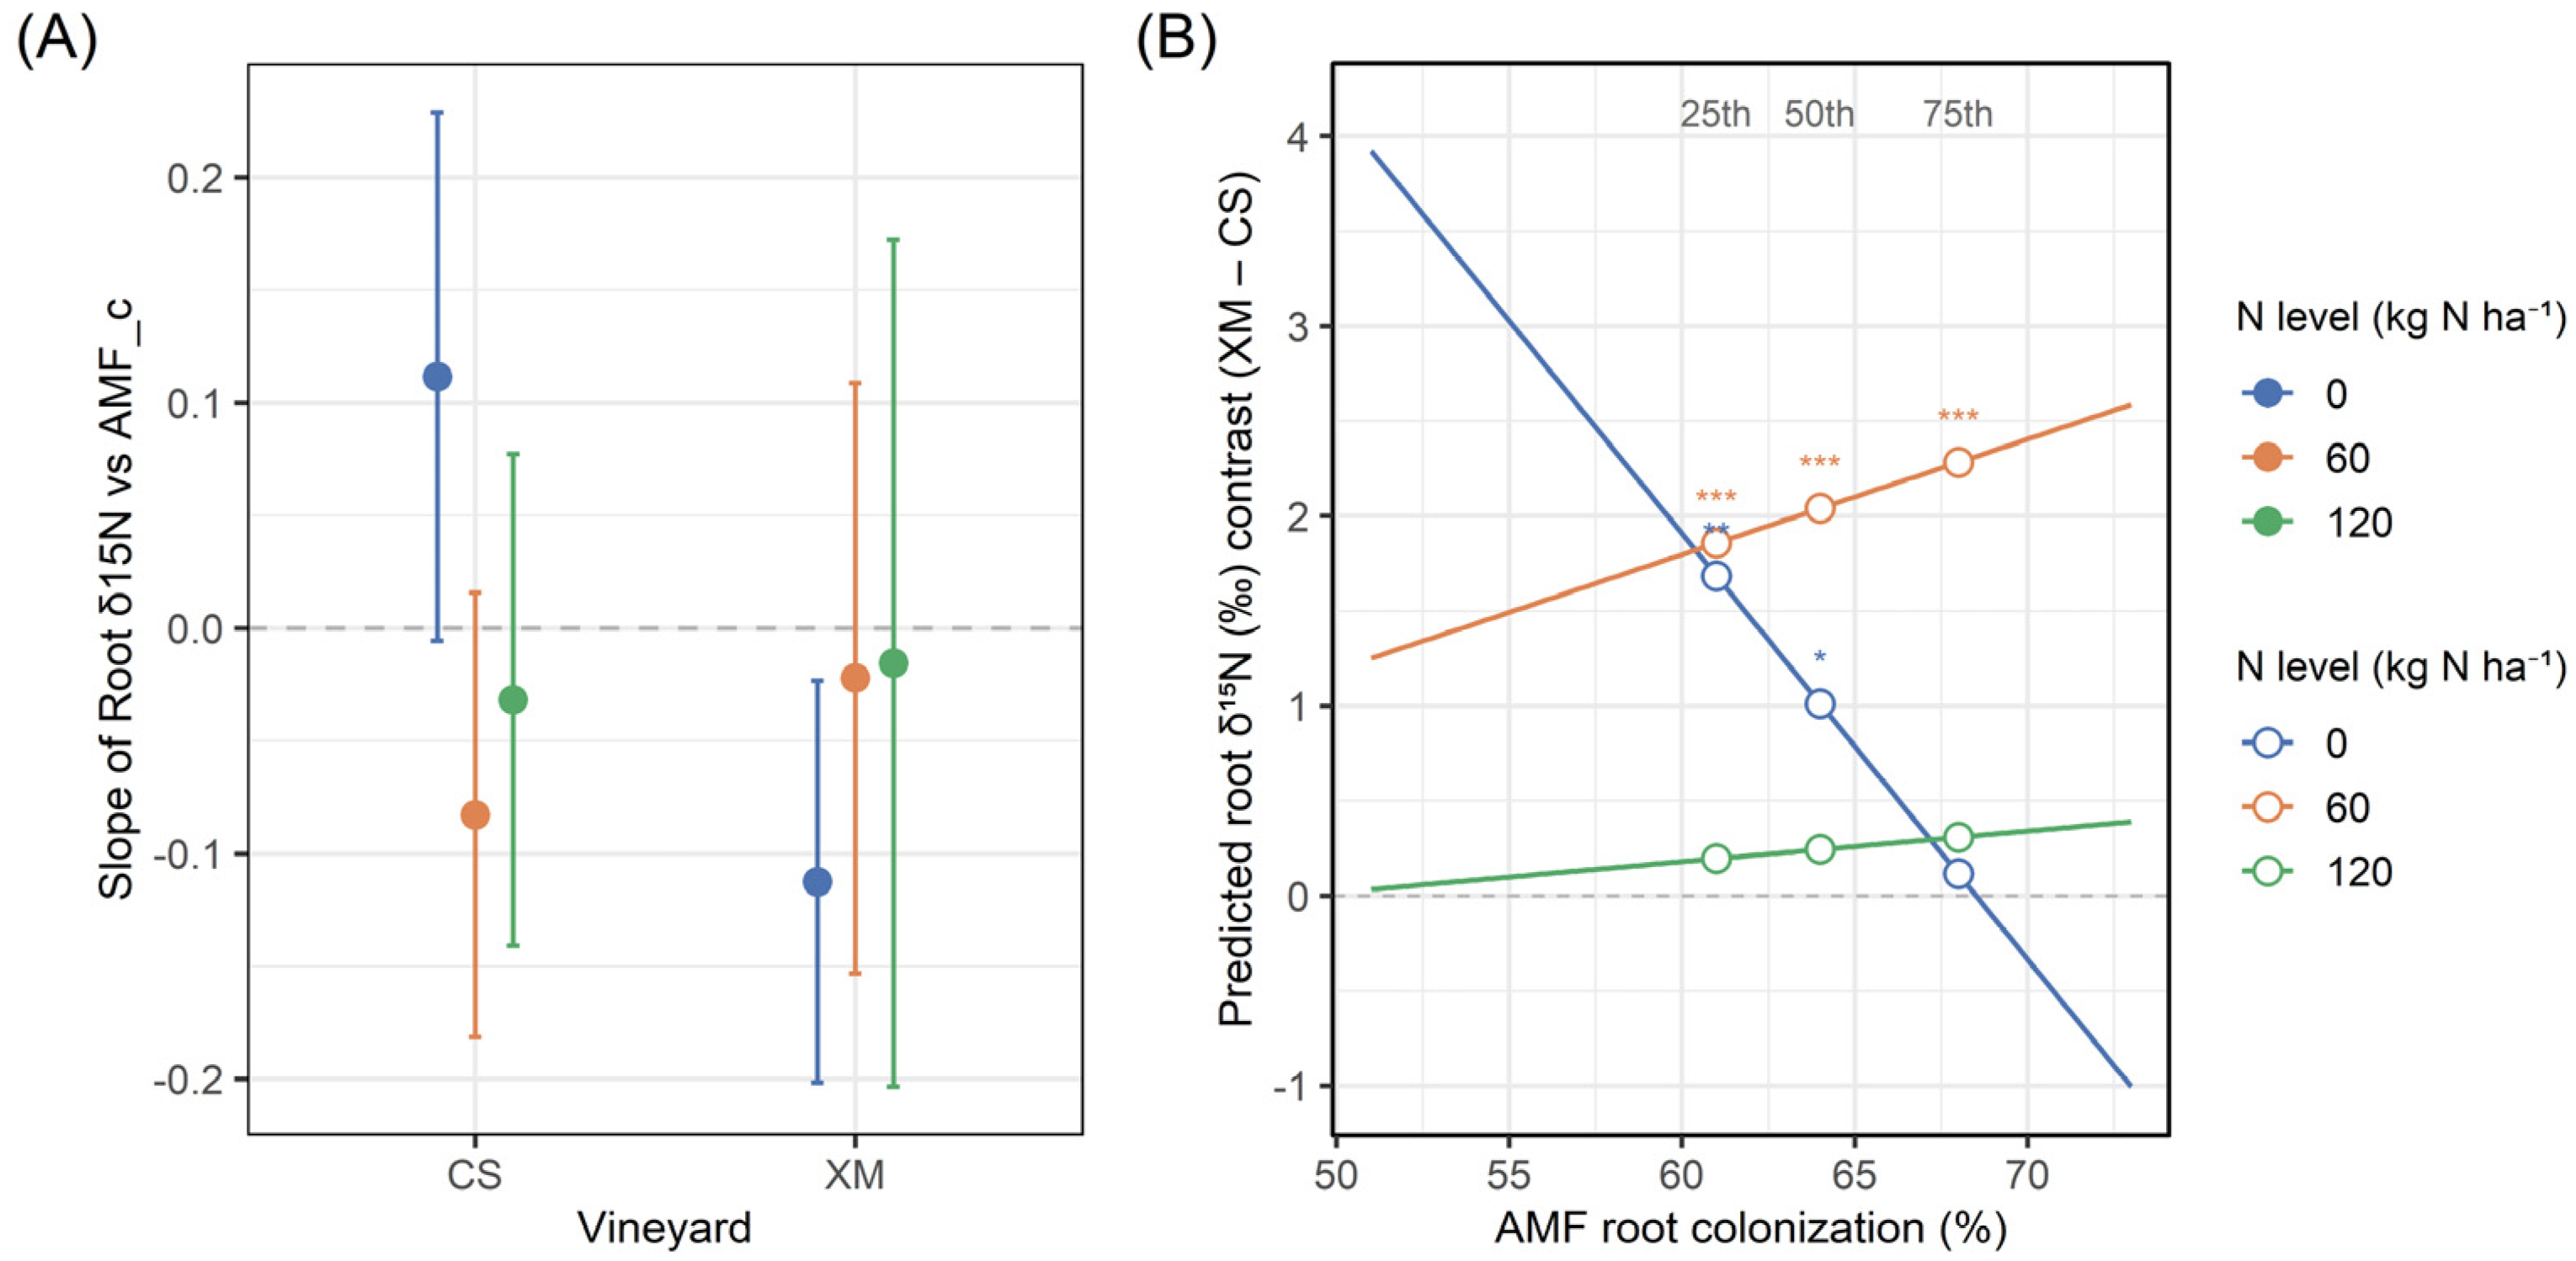

Disclaimer/Publisher’s Note: The statements, opinions and data contained in all publications are solely those of the individual author(s) and contributor(s) and not of MDPI and/or the editor(s). MDPI and/or the editor(s) disclaim responsibility for any injury to people or property resulting from any ideas, methods, instructions or products referred to in the content. |
© 2026 by the authors. Licensee MDPI, Basel, Switzerland. This article is an open access article distributed under the terms and conditions of the Creative Commons Attribution (CC BY) license.