


Abstract
This study examines air passenger transport development across twelve Central, Eastern and South-Eastern European countries over 2010–2024, focusing on the relationship between passenger traffic and economic, tourism, migration-related and airport connectivity indicators. The analysis combines GDP and GDP per capita with aviation and structural indicators, using publicly available data from international statistical and sectoral sources. A comparative analytical framework combines longitudinal analysis with cross-country benchmarking based on common indicators, while considering COVID-19 disruption and subsequent recovery trajectories. The findings indicate that GDP and GDP per capita are associated with passenger transport performance, but do not fully explain differences across national aviation markets. The comparative assessment identifies distinct air passenger transport development patterns associated with combinations of tourism intensity, migration-related mobility, economic scale and airport connectivity. Tourism-associated patterns are evident in countries with strong international tourism demand, while migration-associated patterns are more prominent in countries with substantial labour mobility and diaspora links. Economy-associated patterns are more evident in larger national markets, whereas connectivity-associated characteristics contribute to distinct development trajectories in smaller aviation markets. The study provides an exploratory comparative perspective on heterogeneous air passenger transport development and highlights the value of country-level benchmarking for interpreting differences in national aviation trajectories.
1. Introduction
Air transport has become an important component of economic integration, tourism, labour mobility and regional competitiveness. Across Central, Eastern and South-Eastern Europe, the liberalization of the aviation market, the expansion of low-cost carriers (LCCs) and the progressive integration into the European transport network have reshaped passenger mobility over the last two decades. According to Jankiewicz and Huderek-Glapska [1], market liberalization fostered differentiated growth trajectories across the region, with economic structures and regional mobility patterns shaping aviation demand. At the same time, countries have followed different economic trajectories and have experienced diverse patterns of tourism development, labour migration and airport investment, resulting in substantial differences in air passenger transport performance.
The economic importance of aviation extends far beyond the transport sector itself. According to the Air Transport Action Group (ATAG), air transport supported approximately 15 million jobs and contributed around USD 1.2 trillion to European GDP in 2023 [2]. Beyond its direct contribution, aviation generates indirect, induced and tourism-related economic effects, highlighting the strategic role of air transport in employment and regional development. These broader effects are particularly relevant for Central and Eastern Europe, where aviation market liberalization coincided with economic convergence towards Western European income levels and substantial changes in mobility patterns.
A widely accepted assumption in aviation economics is that economic growth is closely associated with the expansion of air transport demand. Empirical evidence, however, indicates that the magnitude of this relationship varies across countries and economic contexts. Danesi and Walawender [3] examined air passenger demand and GDP elasticity in selected European Union countries and identified differences in passenger traffic trends and GDP elasticity across the analysed markets. This suggests that economic growth alone may not provide a sufficient explanation for differences in air transport demand. Zhang and Graham [4] confirmed a strong positive association between GDP per capita and air transport demand while emphasizing the moderating role of infrastructure quality and market openness. Kaya and Aydın [5] further showed that the relationship between air transport and economic growth varies across countries and geographic contexts. Zaharia et al. [6] highlighted the importance of airport modernization and airport connectivity in supporting regional aviation development, whereas Button and Taylor [7] emphasized the broader contribution of air transport to trade, tourism and economic development. According to IATA [8], the continued expansion of low-cost carriers has further reshaped airport competition, accessibility and passenger demand across the region.
Recent research has also explored several specific dimensions of air transport development in Central and Eastern Europe. Previous studies have examined airport accessibility and flight seasonality [9], transport accessibility for business travel [10], airport connectivity through regional case studies [11] and the propensity to fly using selected socioeconomic characteristics such as GDP, tourism, geography, demographic structure and education [12]. Together, these studies suggest that passenger air transport development is associated with a combination of economic, tourism-related, migration-related and infrastructural factors, rather than with economic performance alone. However, the relative importance and manifestation of these factors may differ substantially across national aviation markets.
Nevertheless, an important research gap remains. Most of the mentioned previous studies investigate individual determinants, such as economic growth, tourism, airport connectivity and accessibility, or focus on specific countries, airports or transport functions. Comparative studies examining these dimensions jointly at country level across a broader set of Central and Eastern and South-Eastern European markets remain relatively limited. Consequently, it remains insufficiently understood why national aviation markets with different combinations of economic, tourism-related, migration-related and connectivity characteristics exhibit distinct patterns of air passenger transport development. This suggests the need for a comparative analytical framework that considers passenger traffic alongside multiple economic and structural indicators and identifies recurring national development patterns without assuming that any single determinant provides a sufficient explanation. Such a perspective is particularly relevant in a region where countries with different economic scales, tourism profiles, migration patterns and airport structures have undergone substantial changes in passenger traffic over the same period.
This study addresses the following research question: why do countries with different economic and structural characteristics exhibit different patterns of air passenger transport development and how can these patterns be interpreted through comparative analysis of economic, tourism, migration and connectivity indicators?
To address this research question, the study applies a comparative analytical framework to twelve selected countries over the period 2010–2024. The analysis combines longitudinal assessment of passenger traffic and economic indicators with cross-country comparison of tourism, migration and airport connectivity characteristics. Rather than estimating the simultaneous causal effects of these determinants, the study uses their comparative relationships to identify and interpret recurring patterns of national air passenger transport development.
The study makes three main contributions. First, it brings together multiple economic and structural dimensions of air passenger transport development within a common comparative analytical framework, allowing their relationships with passenger traffic to be interpreted jointly at country level. Second, it provides a long-term comparative assessment covering twelve selected European countries over a fifteen-year period, based on comparable data compiled from ACI Europe, Eurostat, the World Bank and ATAG. Third, it proposes an exploratory typology of air transport development patterns (tourism-associated, migration-associated, economy-associated and connectivity-associated), providing a structured interpretation of the diverse trajectories observed across the analysed countries.
Benchmarking provides a useful framework for comparing performance and identifying differences across national aviation markets. While benchmarking studies have frequently been applied at airport level, particularly from operational and managerial perspectives [13], this study adopts a broader country-level perspective by comparing passenger traffic with common economic and structural indicators. The cross-country comparison is complemented by longitudinal analysis of changes within individual countries over the 2010–2024 period.
The analysis considers macroeconomic indicators (GDP and GDP per capita), tourism indicators, passenger-to-population ratios, airport infrastructure characteristics and operational aviation indicators, including passenger traffic, aircraft movements and airport connectivity.
The empirical analysis is based on data from ACI Europe Airport Traffic Reports (2010–2024) [14], ATAG [2], the World Bank [15], Eurostat [16] and previous studies conducted by the authors [6,17,18,19].
Detailed definitions of the indicators, data sources and analytical procedures are presented in the next section. The comparative framework provides a broader basis for interpreting differences in air passenger transport development across the selected countries and offers evidence that may support transport policy, airport strategic planning and future research on regional aviation development.
2. Materials and Methods
2.1. Scope and Sample
This study examines air passenger transport development in a selected group of twelve countries from Central, Eastern and South-Eastern Europe over the period 2010–2024: Bulgaria, Croatia, the Czechia, Estonia, Greece, Hungary, Latvia, Lithuania, Poland, Moldova, Romania and Serbia.
The selection was primarily guided by the availability and comparability of country-level aviation, economic, tourism, migration and airport connectivity data required for the comparative analysis. The sample was not designed to be statistically representative of all countries geographically associated with Central and Eastern Europe, and the findings should therefore not be generalized to the entire region without qualification. Rather, the selected countries provide heterogeneous cases that allow the identification and interpretation of different air passenger transport development trajectories.
Greece is included as a comparative case because of its relevance to the regional aviation market and its substantially different tourism and economic characteristics. Although Greece is more commonly geographically associated with Southern Europe, its inclusion provides a useful contrast within the comparative European sample and allows the role of tourism and other structural characteristics to be examined alongside the predominantly Central and Eastern European cases.
The analysis covers the period 2010–2024, allowing the identification of long-term structural trends, including the disruption caused by the COVID-19 pandemic (2020–2021) and the subsequent recovery phase. This timeframe captures important changes associated with aviation market liberalization, the expansion of low-cost carriers, increasing labour mobility and the post-pandemic recovery of the aviation sector.
The primary unit of analysis is the country-year observation. Although selected airports are used to illustrate specific national characteristics and development patterns, the comparative analysis is conducted at country level. Aviation indicators, including passenger traffic and aircraft movements, are aggregated at national level where airport-level data are used, while economic, tourism, migration and connectivity indicators are organized at country level to support cross-country comparison.
The selected countries differ substantially in economic scale, population, income level, tourism specialization, migration intensity and airport-network structure. This heterogeneity is central to the research design, as the objective is not to establish a single regional model of air passenger transport development, but to compare different national trajectories and examine how passenger traffic relates to different combinations of economic and structural characteristics.
2.2. Data Sources
The analysis is based on publicly available secondary data obtained from internationally recognized statistical and aviation-sector sources. The main data sources include the Airport Council International Europe (ACI Europe) Airport Traffic Reports [14], the World Bank World Development Indicators [15], Eurostat [16], the International Air Transport Association (IATA) [8] and the Air Transport Action Group (ATAG) [2]. Previous studies by the authors are used only as complementary sources for specific airport and connectivity-related information [6,17,18,19].
Aviation data include annual passenger traffic and aircraft movements at airport level. Where necessary, airport-level observations were aggregated to obtain country-level annual passenger traffic and aircraft movement values. The country-level aviation indicators were subsequently compared with economic, tourism, migration and connectivity indicators.
Macroeconomic data include total GDP, GDP per capita and population. GDP values are expressed in current U.S. dollars, while GDP per capita is expressed in current U.S. dollars per capita, consistently with the World Bank data used in the analysis [15].
Tourism indicators include tourist arrivals and nights spent at accommodation establishments and were obtained primarily from Eurostat [16]. Migration-related data were also obtained from Eurostat and refer to the available country-level migration series. The migration indicator is used as a proxy for the demographic and mobility context associated with labour migration and diaspora-related travel.
Airport connectivity data were obtained from ACI Europe reports [14]. The analysis uses the connectivity indicators reported by ACI Europe, including direct, indirect, total and hub connectivity measures where available. These indicators were not independently calculated by the authors but incorporated into the comparative country-level analysis as reported by the source.
The different indicators do not have identical temporal coverage. While the main aviation and economic series cover the 2010–2024 study period, some structural indicators, particularly migration and airport connectivity, may be available only for a shorter period. The analysis therefore considers the available period for each indicator and distinguishes the longitudinal analysis of the full study period from indicator-specific comparisons.
All data were organized at country-year level where comparable country-level observations were available. Airport-level data were retained for the identification of relevant national airport structures and subsequently aggregated for country-level comparisons. The use of publicly available institutional sources and the explicit distinction between reported and derived indicators supports transparency and reproducibility of the comparative analysis.
2.3. Variables and Indicators
The selection of variables was guided by the research question and by previous studies identifying economic development, tourism, migration and airport connectivity as relevant factors associated with air passenger transport demand.
The analytical framework combines economic, aviation and structural indicators to examine differences in national air passenger transport development beyond economic performance alone.
Economic indicators include total GDP, GDP per capita and population. GDP is used as an indicator of overall economic scale, while GDP per capita provides a measure of average economic capacity and purchasing power. Population is used to contextualize passenger traffic through the passenger-to-population ratio.
Aviation performance indicators include total annual passenger traffic, passenger traffic growth, aircraft movements and the passenger-to-population ratio. Passenger traffic represents the main outcome indicator of national air passenger transport performance. Aircraft movements provide an additional measure of aviation activity, while the passenger-to-population ratio allows comparisons between countries of substantially different population sizes.
For the long-term comparison between 2010 and 2024, the percentage change for each indicator was calculated as follows:
where and represent the values of the respective indicator in 2010 and 2024, respectively.
Tourism indicators include tourist arrivals and nights spent at accommodation establishments. These indicators are used to capture the intensity of tourism activity and its potential association with passenger air transport demand.
Migration-related indicators are used to capture the demographic and mobility context associated with international migration and diaspora-related travel. The migration indicator is based on country-level data available from Eurostat and is interpreted as a contextual indicator rather than as a direct measure of air travel generated by migration.
Airport connectivity data were obtained from ACI Europe Airport Industry Connectivity Reports. The reported connectivity indicator is based on the proprietary NetScan model developed by SEO Amsterdam Economics and combines direct and indirect connectivity. The published values [14] were used directly in the analysis.
Taken together, these indicators allow the study to compare countries with different economic, tourism, migration and airport-network characteristics and to identify differences in their air passenger transport development trajectories. The indicators are therefore used primarily for comparative and exploratory interpretation rather than as individually estimated causal determinants.
2.4. Analytical Approach
Given the exploratory nature of the research question and the objective of comparing heterogeneous national contexts, the study adopts a comparative analytical framework. The framework combines longitudinal analysis of country-level indicators with cross-country comparison of economic, aviation and structural characteristics.
The analysis includes four main components:
- (1)
- Longitudinal comparison of economic and aviation indicators over the 2010–2024 period;
- (2)
- Growth analysis, including changes in passenger traffic between 2010 and 2024 and annual variations where relevant;
- (3)
- Cross-sectional correlation analysis between passenger traffic and GDP, and between passenger traffic and GDP per capita, using the 2024 country-level observations;
- (4)
- Comparative interpretation of national development patterns, considering differences in tourism intensity, migration-related mobility, economic scale and airport connectivity.
The correlation analysis is exploratory and is used to assess the strength and direction of the association between passenger traffic and economic indicators. It does not establish causality. The correlation coefficients are calculated using the country-level observations available for 2024. The statistical significance and sensitivity of these relationships are considered in the interpretation of the results.
The comparative analysis is complemented by selected airport-level observations used to provide contextual explanations for national patterns, particularly where airport structure, tourism orientation or connectivity characteristics contribute to differences in passenger traffic.
Based on the combined evidence, countries are interpreted through an exploratory framework reflecting four broad development patterns: tourism-associated, migration-associated, economy-associated and connectivity-associated. These categories are not intended as mutually exclusive or formally statistically estimated groups. Rather, they provide an analytical way of organizing and interpreting recurring patterns observed across the economic, tourism, migration, aviation and connectivity indicators.
The COVID-19 pandemic is considered as a major external disruption to air passenger transport during 2020–2021. The analysis compares the pre-pandemic situation with the subsequent recovery period in order to identify differences in the trajectories of the selected countries. The term resilience is therefore used in relation to the observed ability of passenger traffic to recover following the pandemic shock, rather than as a formally estimated resilience index.
Overall, the analytical approach is comparative and exploratory. It is designed to identify and interpret differences in national air passenger transport trajectories rather than to estimate causal effects of individual determinants. The findings are consequently presented as associations and comparative patterns, with the proposed development categories serving as an interpretative framework rather than as a formally validated statistical typology.
Microsoft Excel for Microsoft 365 (Version 2608) was used for data analysis, calculations and graphical representations.
3. Results
3.1. Economic and Structural Context
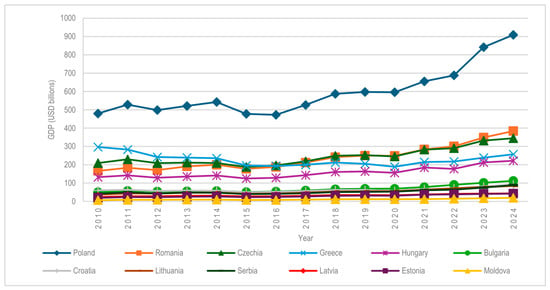
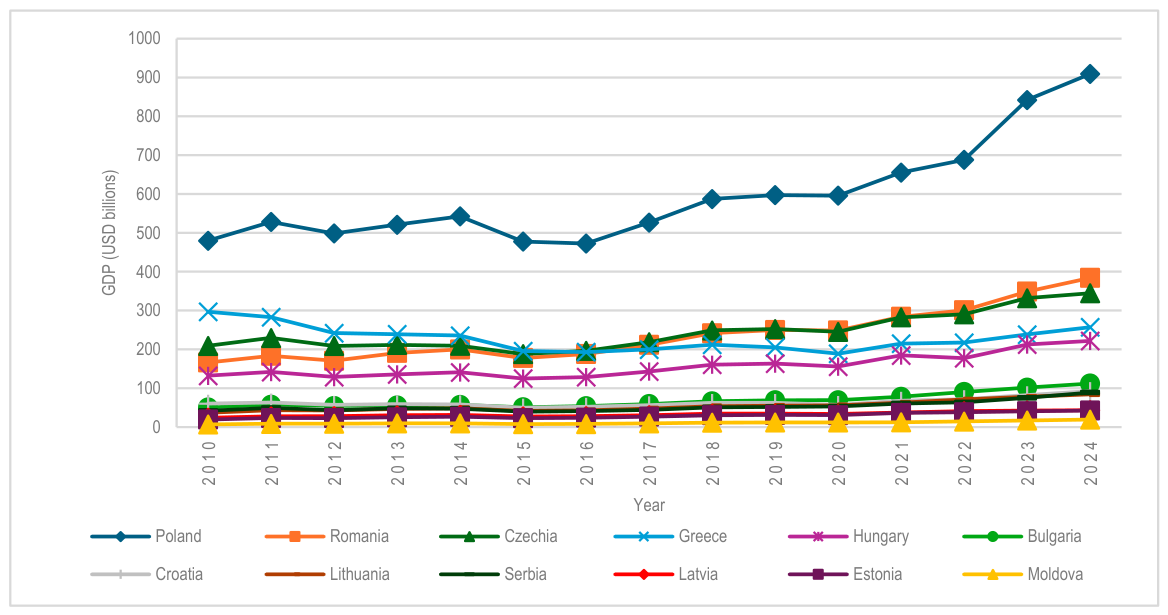
GDP evolution between 2010 and 2024 shows an overall upward trend across most of the analysed countries, although the magnitude of change differs substantially between countries (Figure 1). GDP increased in eleven of the twelve countries, with the largest percentage increases recorded in Moldova (+181.7%), Romania (+130.9%), Lithuania (+127.2%) and Bulgaria (+121.4%). Greece was the only country to record a decline over the period (−13.4%).
Figure 1.
GDP evolution between 2010 and 2024 in the 12 countries analyzed (USD billions). Source: Authors’ own elaboration based on [15].
In terms of absolute economic size, Poland recorded the highest GDP in 2024, exceeding USD 900 billion, followed by Romania and Czechia, with GDP values in the USD 300–400 billion range. Moldova recorded the lowest absolute GDP among the analysed countries.
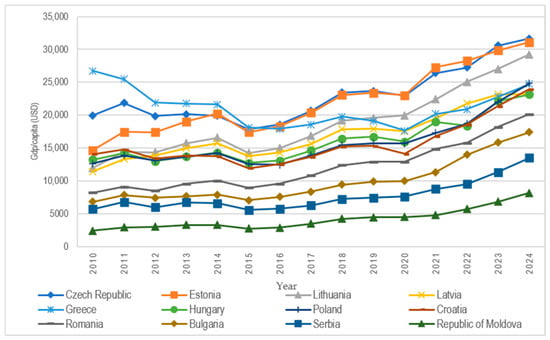
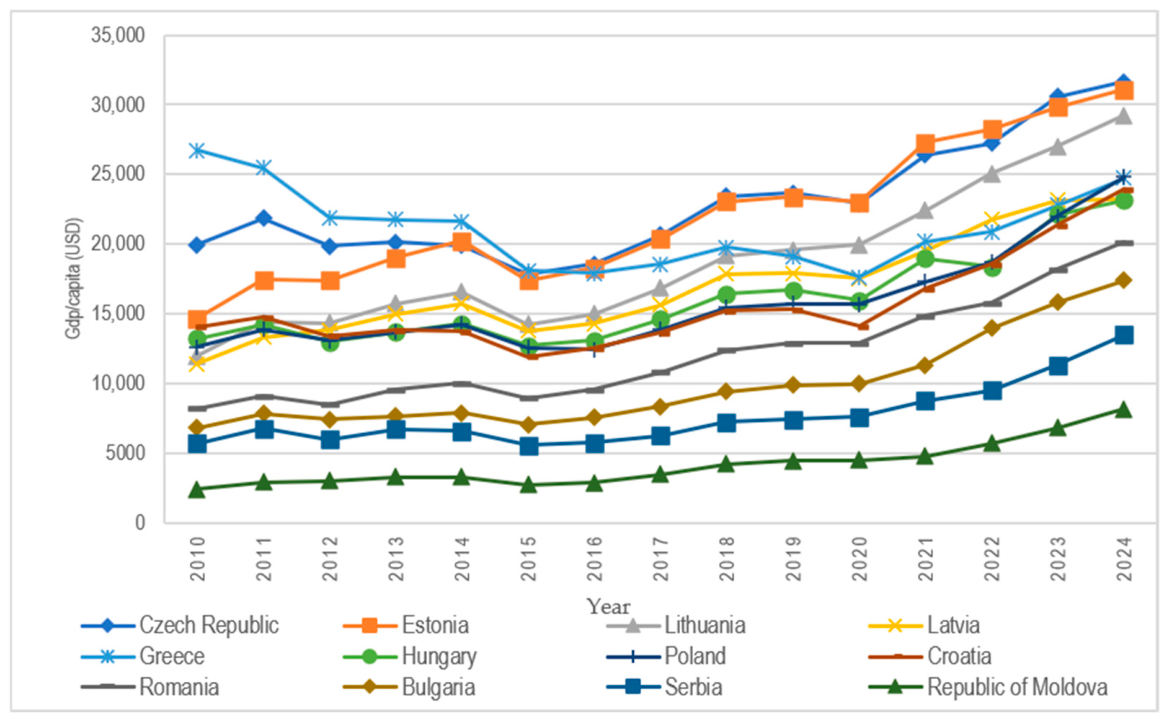
GDP per capita shows a different distribution from total GDP (Figure 2). In 2024, Czechia recorded the highest GDP per capita, followed by Estonia, Lithuania, Greece and Poland. Hungary, Latvia and Romania occupied intermediate positions while Bulgaria, Serbia and Moldova recorded lower values. The distribution illustrates the differences between the overall economic size of the countries and their GDP per capita.
Figure 2.
Evolution of GDP per capita between 2010 and 2024 in the analysed countries (USD). Source: Authors’ own elaboration based on [15].
Between 2010 and 2024, GDP per capita increased in most of the analysed countries, although the magnitude of the increase varied. Czechia, Estonia and Lithuania remain among the countries with the highest GDP per capita, whereas Moldova remains at the lower end of the distribution. Romania shows a substantial increase in GDP per capita over the study period, while Greece records a less favorable development compared with most of the other countries.
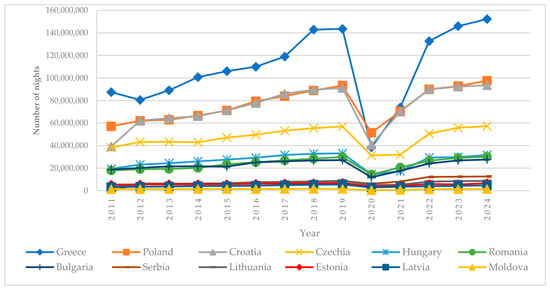
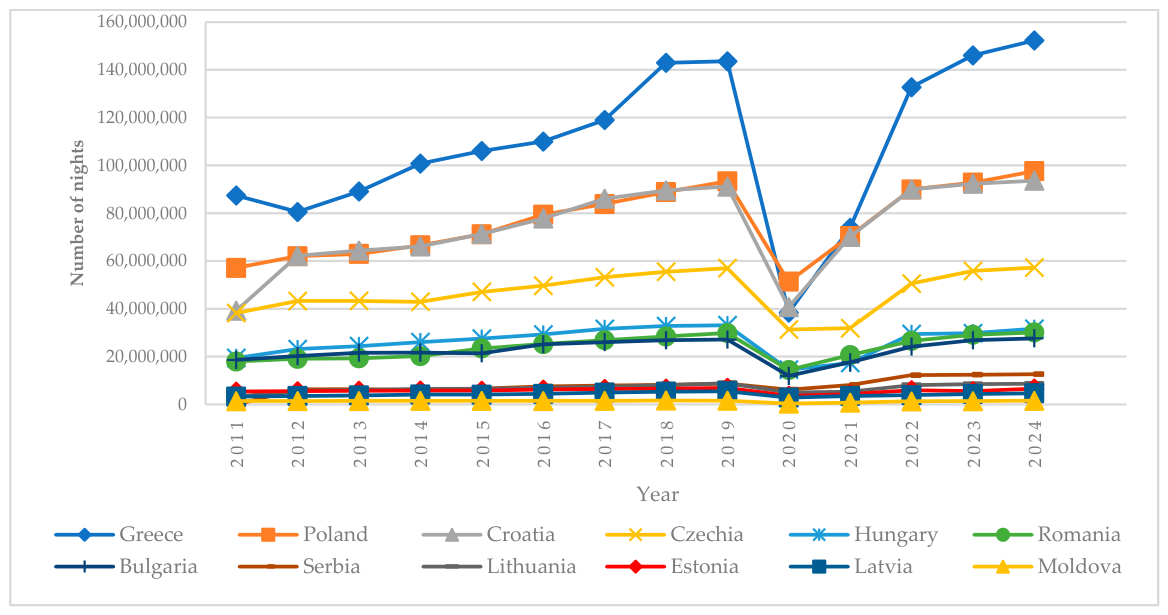
The tourism indicators also show substantial variation across the analysed countries. In terms of nights spent at tourist accommodation establishments, Greece recorded the highest value, followed by Poland and Croatia (Figure 3). Greece also recorded more than 30 million tourist arrivals annually in the most recent observation year, while tourism activity was substantially lower in the Baltic countries, Serbia and Moldova.
Figure 3.
Nights spent at tourist accommodation establishments in the analysed countries. Source: Authors’ own elaboration based on [16].
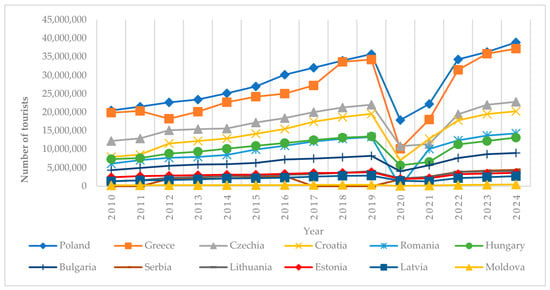
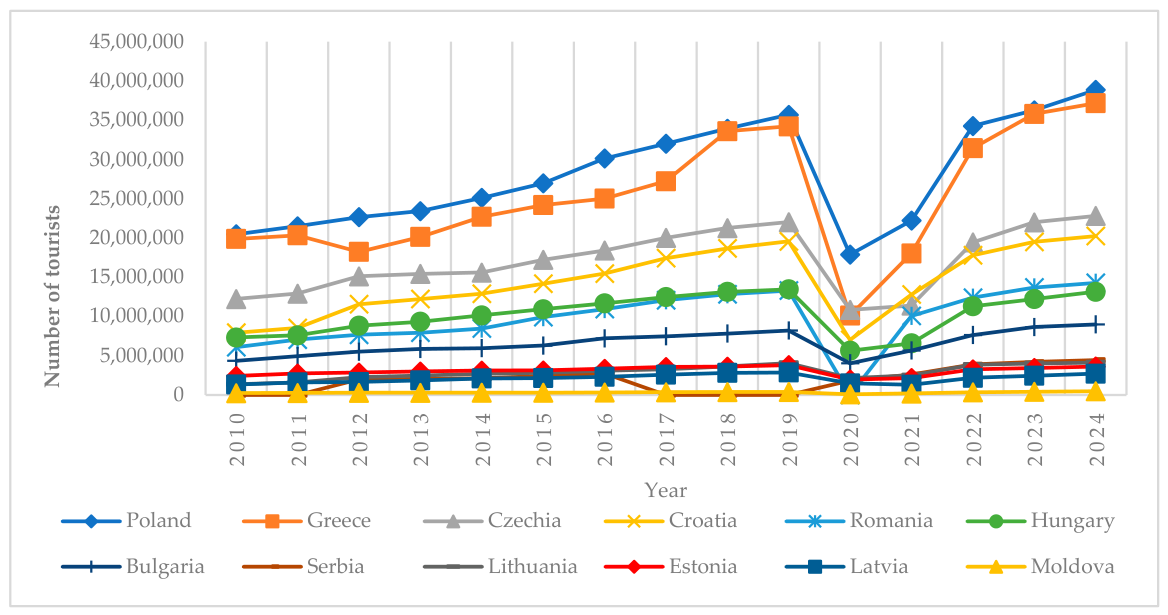
Figure 4 presents tourist arrivals at accommodation establishments across the analysed countries. Poland records the highest number of arrivals, followed by Greece, Czechia and Croatia. Romania and Hungary occupied intermediate positions, while Latvia and Estonia recorded lower levels of tourist arrivals, with Moldova ranking last. The different positions of countries in the rankings based on arrivals and nights spent indicate differences in the scale and duration of tourist stays.
Figure 4.
Arrivals at tourist accommodation establishments. Source: Authors’ own elaboration based on [16].
The passenger-to-population ratio provides an additional indicator of differences in air mobility. In 2024, Greece recorded the highest passenger-to-population ratio among the analysed countries, reaching 7.66, almost twice the value recorded by Latvia, which ranked second with 3.80. Croatia recorded 3.28, while the remaining countries recorded lower values.
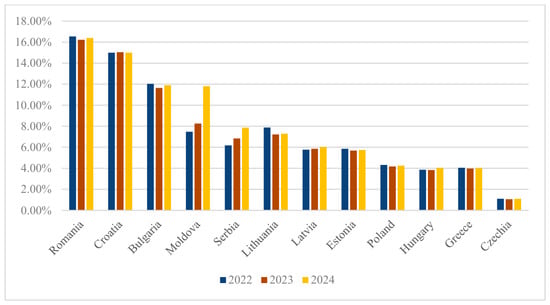
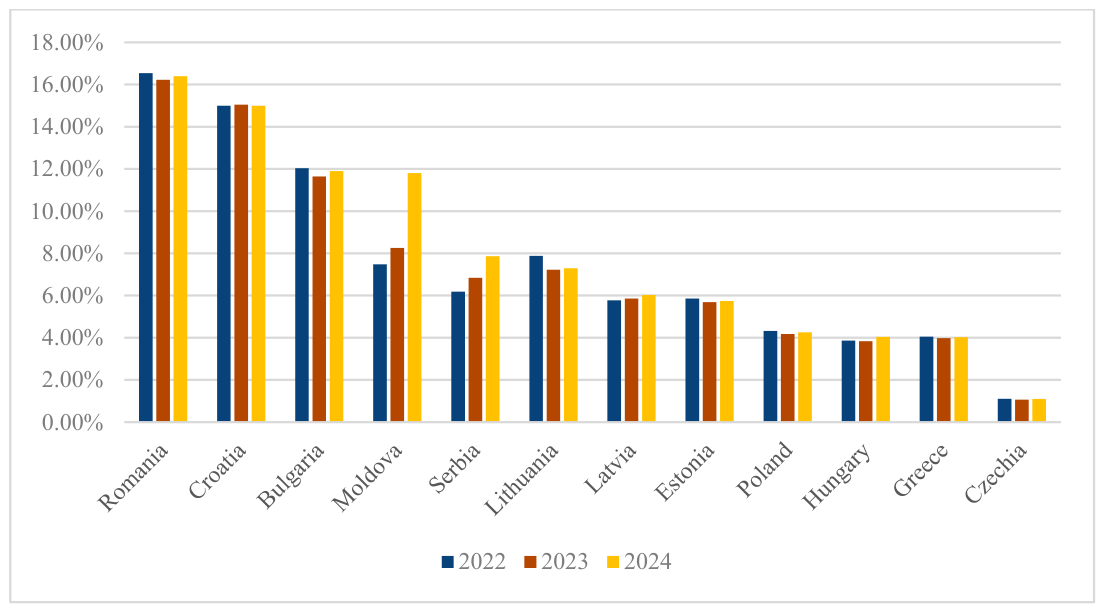
Diaspora-related indicators also differ considerably across the analysed countries (Figure 5). Romania recorded the highest diaspora share relative to population, followed by Croatia, Bulgaria and Moldova, whereas Czechia recorded the lowest level. In Moldova, the indicator increased by 3.62 percentage points over the analysed period. These values describe differences in the migration-related demographic context of the analysed countries and are subsequently considered alongside passenger traffic.
Figure 5.
Diaspora-related indicator in the analysed countries. Source: Authors’ own elaboration based on [16].
Overall, the economic, tourism and migration-related indicators demonstrate substantial heterogeneity among the countries included in the comparative analysis. This variation provides the empirical context for examining differences in passenger air transport performance in the following sections.
3.2. Air Passenger Transport Development
The comparative analysis covers 117 airports across the twelve countries, although the distribution of airport infrastructure varies substantially between national markets. Moldova has a single operational airport, whereas Greece has the largest number of airports in the analysed group. The remaining countries have different combinations of capital-city and regional airports, resulting in substantially different national airport network structures.
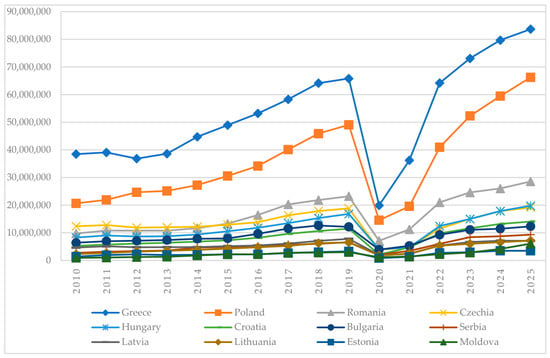
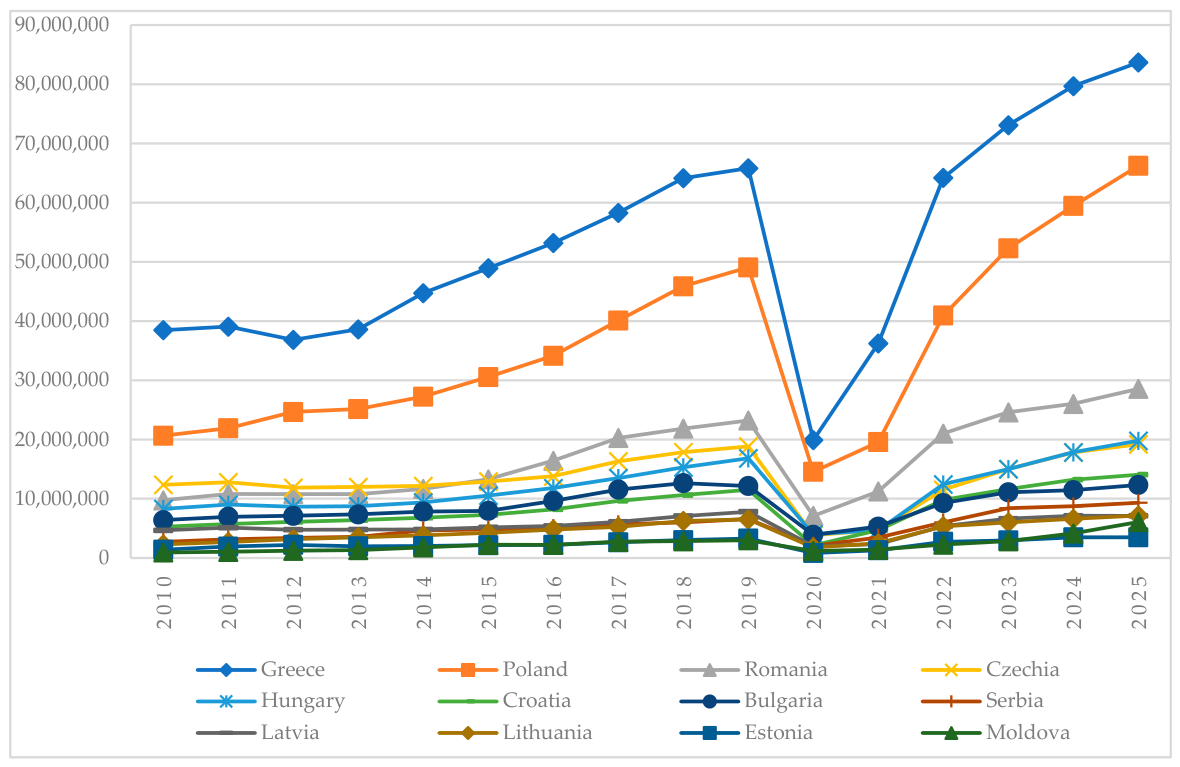
Passenger traffic increased substantially between 2010 and 2024 across the analysed countries, despite the sharp disruption observed during the COVID-19 pandemic in 2020–2021 (Figure 6).
Figure 6.
Passenger traffic trends between 2010 and 2024 in the countries studied. Source: Authors’ own elaboration based on [14,16].
The magnitude of passenger traffic and the subsequent recovery differed between countries. Greece recorded the highest passenger traffic in 2024, with approximately 79.7 million passengers, followed by Poland with approximately 59.5 million. Romania recorded approximately 26.0 million passengers, while Hungary and Czechia recorded approximately 17.8 million each. Croatia and Bulgaria recorded approximately 13.2 and 11.4 million passengers, respectively, while Serbia, Latvia, Lithuania, Estonia and Moldova recorded lower absolute passenger volumes. The 2024 country-level values are summarised in Table 1.
Table 1.
Dynamics of GDP and passenger traffic between 2010 and 2024.
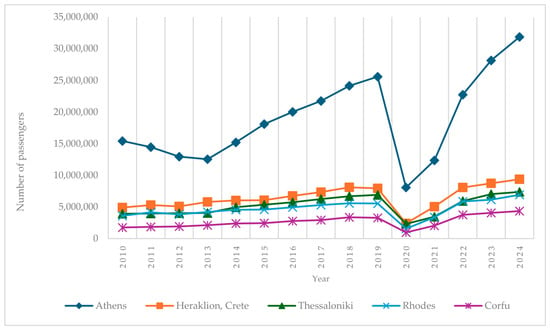
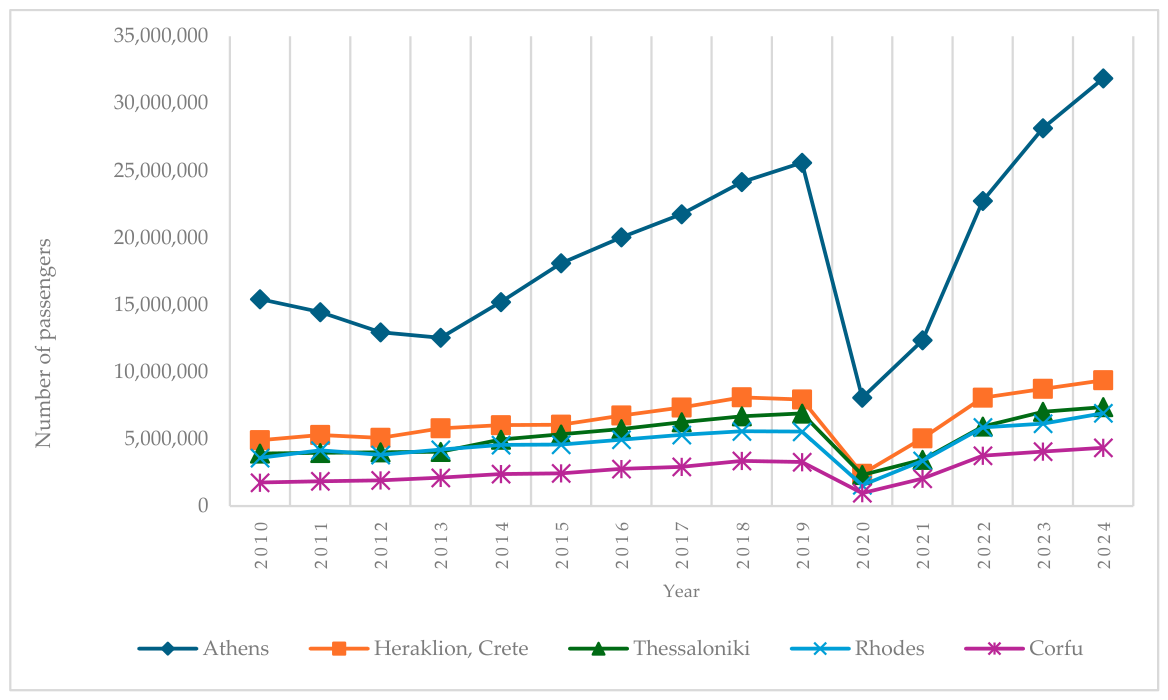
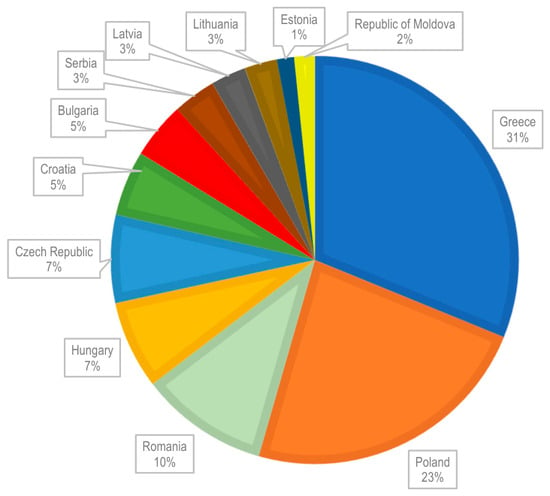
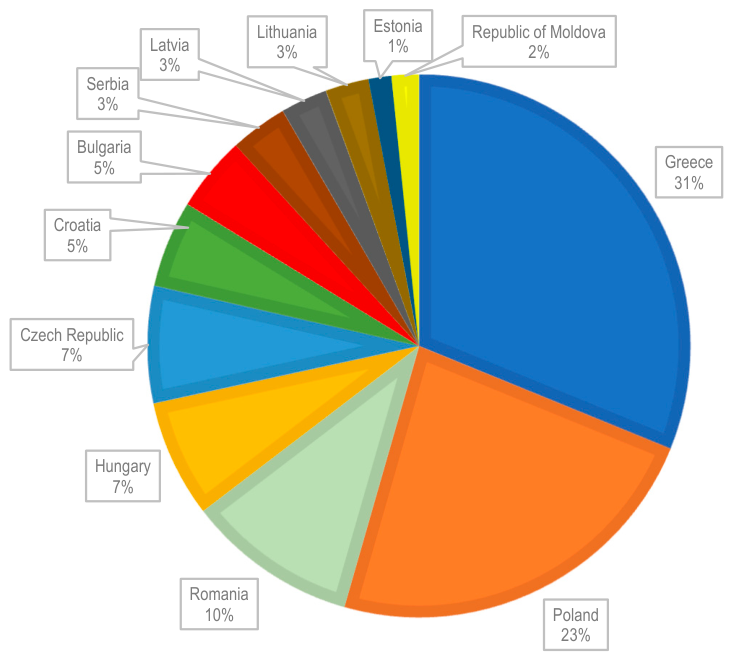
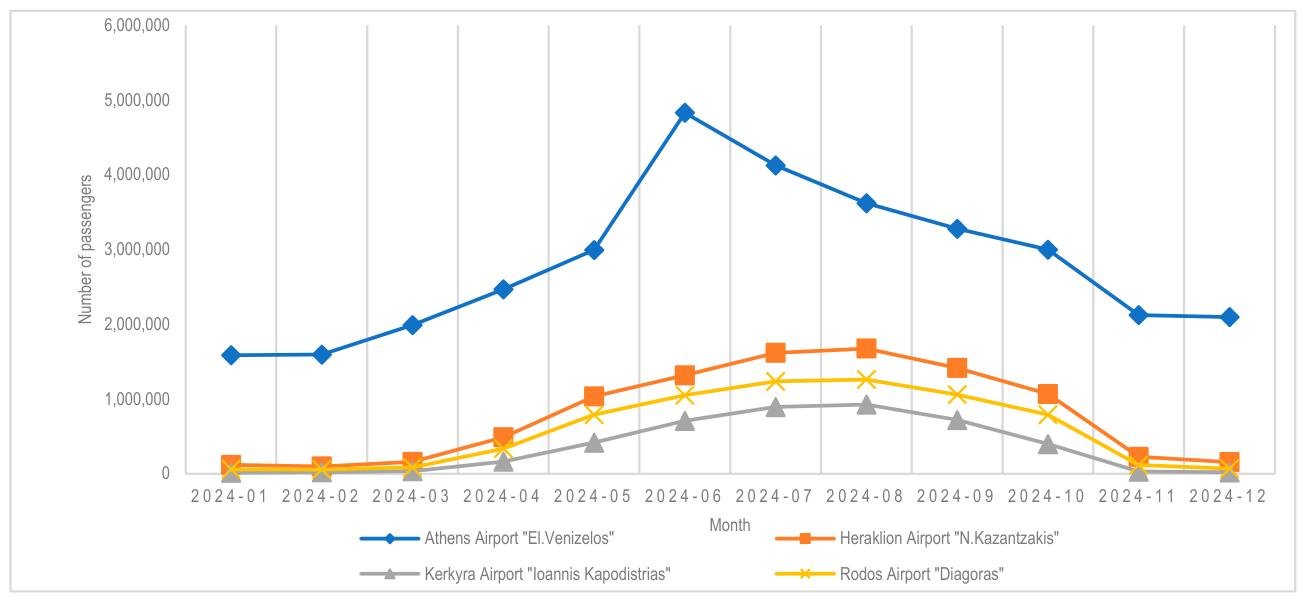
In Greece, passenger traffic is distributed across the capital airport and a comparatively large number of regional and island airports. Athens is the largest airport in the country, while Heraklion, Thessaloniki, Rhodes and Corfu also account for substantial passenger volumes (Figure 7). In terms of the distribution of passenger traffic within the sample, Greece accounted for approximately 31% of total passenger traffic in 2024, followed by Poland with 23%, Romania with 10%, Hungary with 7% and Czechia with 7%. Greece and Poland therefore accounted together for more than half of the passenger traffic recorded in the analysed group, while Greece, Poland and Romania represented approximately two thirds of the total. The remaining countries each accounted for less than 5% (Figure 8). The monthly distribution of passenger traffic shows pronounced seasonal variation, particularly at the main tourism-oriented airports.
Figure 7.
Passenger traffic trends between 2010 and 2024 in the Greek main airports. Source: Authors’ own elaboration based on [14,16].
Figure 8.
Country shares of passenger traffic in 2024. Source: Authors’ own calculations and elaboration based on [14,16].
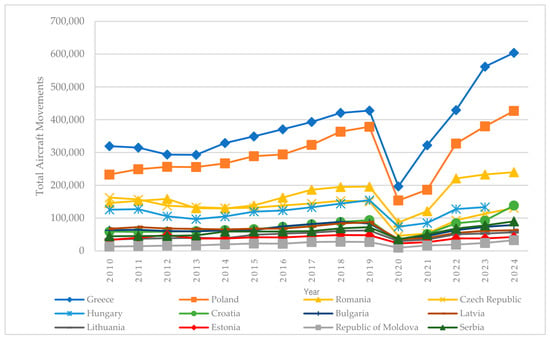
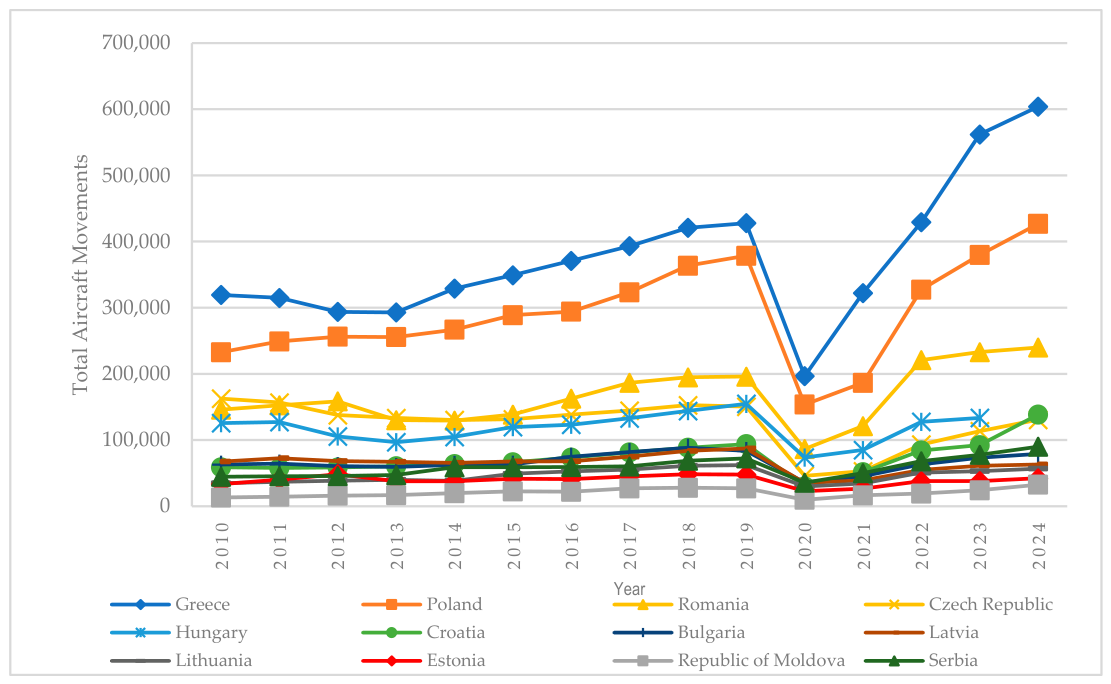
Aircraft movements followed broadly similar long-term patterns to passenger traffic (Figure 9). The highest levels were recorded in Greece, Poland, Romania and Hungary, while smaller aviation markets such as Estonia and Moldova recorded substantially lower absolute numbers of aircraft movements. A marked reduction occurred during 2020–2021, followed by a recovery after 2021.
Figure 9.
Total aircraft movements in the analysed countries between 2010 and 2024. Source: Authors’ own elaboration based on [14,16].
3.3. Relationship Between GDP and Air Passenger Transport
The relationship between economic development and air passenger transport was examined by comparing the evolution of GDP and passenger traffic across the analysed countries. Table 1 presents the percentage change in GDP and passenger traffic between 2010 and 2024.
The percentage changes reported in Table 1 are calculated using the formula described in Section 2.3.
The results show substantial differences between the evolution of GDP and passenger traffic across countries. Poland recorded an increase of approximately 89.5% in GDP and 187.9% in passenger traffic over the study period. Romania recorded increases of 130.9% in GDP and 167.3% in passenger traffic, respectively, while Serbia recorded GDP growth of 113.0% and passenger traffic growth of 220.9%. In these cases, passenger traffic increased more rapidly than GDP.
The largest increase in passenger traffic was recorded in Moldova, where passenger traffic increased by 342.1% between 2010 and 2024, compared with GDP growth of 181.7%. Lithuania recorded passenger traffic growth of 189.1% alongside GDP growth of 127.2%, while Bulgaria recorded passenger traffic growth of 151.1% and GDP growth of 121.4%.
Greece presents a markedly different trajectory. GDP decreased by 13.4% between 2010 and 2024, while passenger traffic increased by 107.1%. Croatia also recorded passenger traffic growth exceeding GDP growth, with increases of 79.0% and 53.1%, respectively. By contrast, Latvia recorded GDP growth of 81.6% and passenger traffic growth of 52.6%, while Czechia recorded GDP growth of 65.0% and passenger traffic growth of 44.2%.
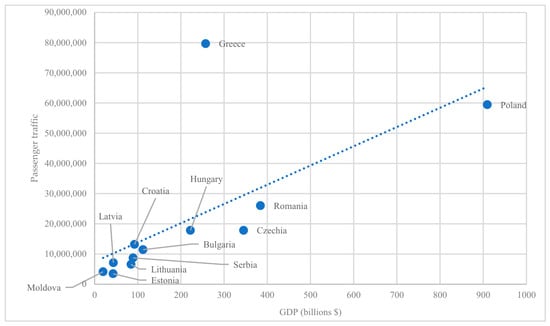
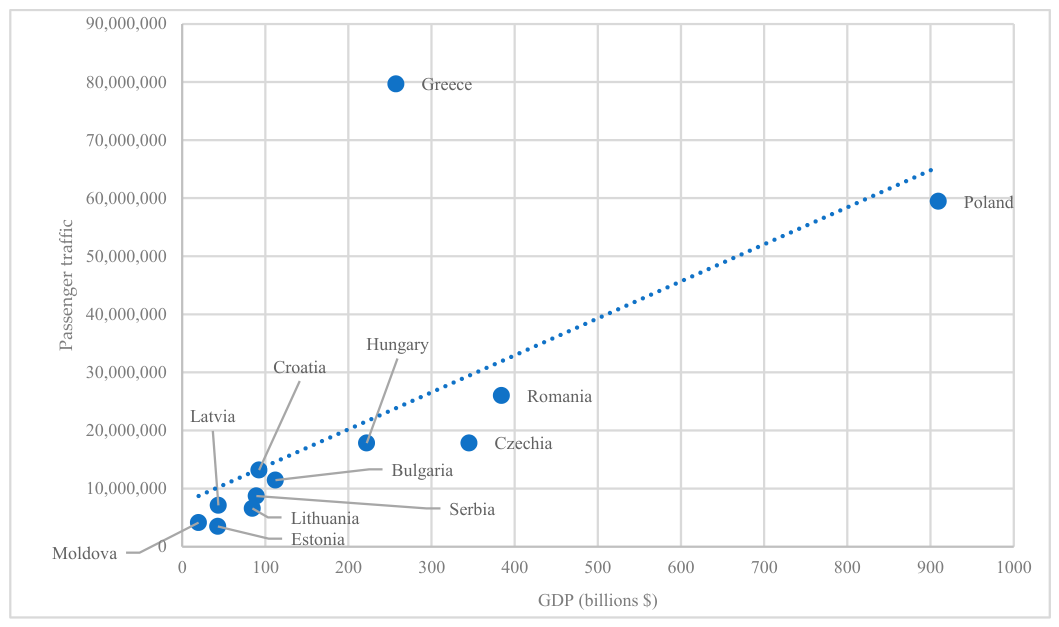
To further examine the relationship between economic development and air passenger transport, a Pearson correlation analysis was conducted using the 2024 observations for the twelve selected countries (Figure 10). The Pearson correlation coefficient between total GDP and passenger traffic was positive and moderate (r = 0.66, n = 12). The corresponding coefficient of determination was R2 = 0.44, indicating that approximately 44% of the cross-country variation in passenger traffic was captured by the linear association with GDP in the 2024 comparison. The correlation was statistically significant at the 5% level (p = 0.018, 95% CI [0.15, 0.90]).
Figure 10.
Correlation between GDP and passenger traffic, 2024. Source: Authors’ own calculations and elaboration based on [14,15,16].
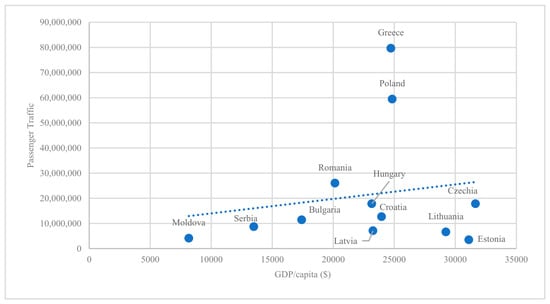
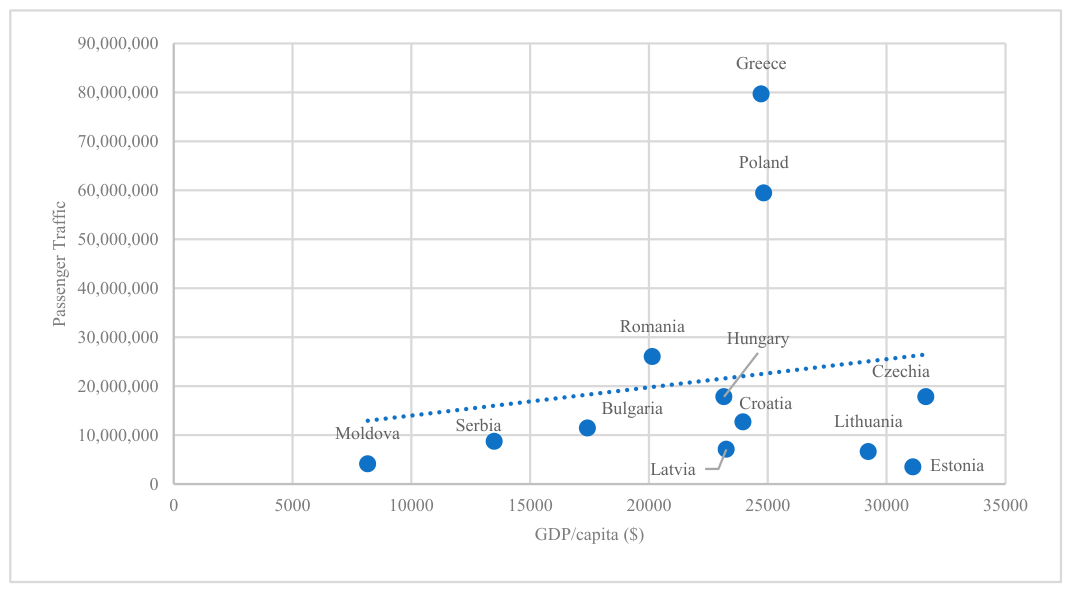
A substantially weaker relationship was observed between GDP per capita and passenger traffic (Figure 11). The Pearson correlation coefficient was r = 0.17 (n = 12), with the corresponding R2 of approximately 0.03. The relationship was not statistically significant (p = 0.602, 95% CI [−0.45, 0.68]).
Figure 11.
Correlation between GDP per capita and passenger traffic, 2024. Source: Authors’ own calculations and elaboration based on [14,15,16].
Taken together, the longitudinal comparison and the two cross-sectional correlations show that the relationship between economic indicators and passenger traffic differs according to the indicator and analytical perspective. The 2010–2024 comparison shows substantial differences between GDP growth and passenger traffic growth across countries, while the 2024 cross-sectional analysis shows a moderate positive association between total GDP and passenger traffic and a substantially weaker association when GDP is expressed per capita. The relatively wide confidence intervals, particularly for the GDP per capita relationship, reflect the uncertainty associated with the small cross-sectional sample. The scatter plots also indicate that Greece and in the GDP per capita relationship Greece and Poland, deviate from the fitted linear relationship. These observations further support a cautious interpretation of the reported correlations, which describe cross-country associations rather than causal relationships.
3.4. Country-Level Patterns in Air Passenger Transport Development
The comparative analysis presented above shows that differences in economic development alone do not fully account for the variation in passenger air transport observed across the analysed countries. The following country-level analysis therefore examines additional structural characteristics of national air passenger transport systems, including airport-network configuration, passenger mobility intensity, tourism activity, migration-related mobility, connectivity and selected market and infrastructure characteristics.
Airport connectivity provides an additional dimension for comparing national air passenger transport systems. The connectivity data used in this study were obtained from ACI Europe and correspond to the indicators reported in its Airport Traffic Reports. These indicators were incorporated into the present analysis as reported by the source and were not independently calculated by the authors. Where available, the ACI Europe indicators distinguish between direct, indirect, total and hub connectivity. These indicators provide a common basis for comparing the extent and structure of airport connectivity across the analysed countries. The 2024 values show substantial differences in national connectivity, with Greece and Poland recording the highest levels, followed by Croatia, Romania and Czechia. The Baltic countries and Moldova recorded considerably lower absolute connectivity values.
The passenger-to-population indicator provides an additional measure of national air mobility intensity. In 2024, Greece recorded the highest value, at 7.66 passengers per resident, followed by Latvia at 3.80 and Croatia at 3.28. Estonia and Lithuania recorded 2.57 and 2.19 passengers per resident, respectively, while Serbia recorded the lowest value among the countries for which the indicator was calculated, at 1.32. Moldova increased from 1.12 in 2023 to 1.71 in 2024.
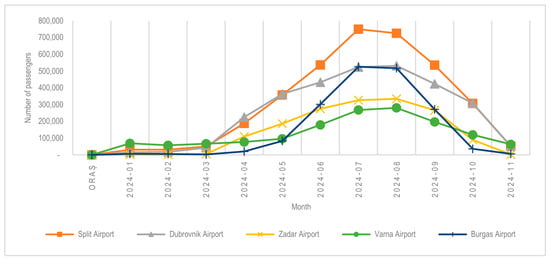
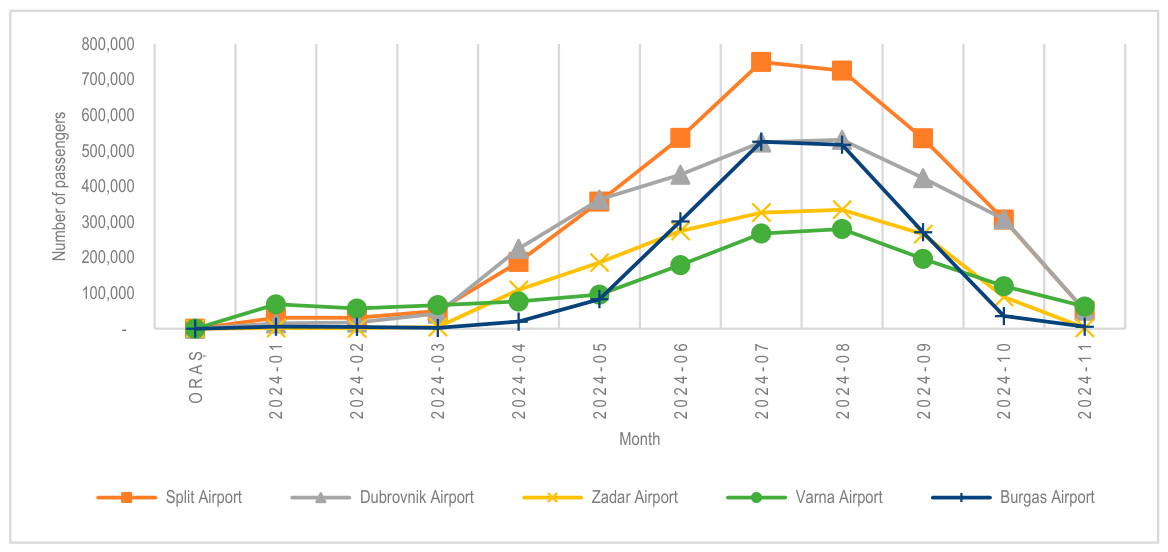
Bulgaria recorded approximately 11.4 million passengers in 2024, representing an increase of 151.1% compared with 2010. Passenger traffic is distributed between Sofia and the coastal airports of Varna and Burgas, with the latter displaying pronounced seasonal variation and substantially higher passenger traffic during the summer months (Figure 12). Sofia Airport handled approximately 7.9 million passengers in 2024, while Varna and Burgas represented important components of the national airport system.
Figure 12.
Monthly air passenger traffic at selected Bulgarian and Croatian airports in 2024. Source: Authors’ own elaboration based on [14,16].
Croatia recorded approximately 13.2 million passengers in 2024, with passenger traffic increasing by 79.0% between 2010 and 2024. Traffic is distributed across several airports, with Zagreb representing the main national gateway and Split, Dubrovnik and Zadar serving important regional markets. Split, Dubrovnik and Zadar show pronounced seasonal patterns, with passenger traffic concentrated during the summer period (Figure 12). Zagreb Airport handled approximately 4.3 million passengers in 2024. Airport infrastructure has also undergone significant development. In 2012, the ZAIC consortium, including Groupe ADP, was awarded a 30-year concession for Zagreb Airport, including the financing, design and construction of a new passenger terminal [20]. Split Airport also underwent terminal modernisation and expansion, increasing its passenger-handling capacity.
Czechia recorded approximately 17.8 million passengers in 2024, representing an increase of 44.2% compared with 2010. Passenger traffic is strongly concentrated at Prague Airport, which handled approximately 16.4 million passengers in 2024. Regional airports accounted for a comparatively smaller share of national passenger traffic. Total airport connectivity reached 4234 in 2024, while Prague Airport accounted for 4000 of the national connectivity value.
Estonia recorded approximately 3.5 million passengers in 2024, with passenger traffic increasing by 152.1% between 2010 and 2024. Tallinn Airport represents the principal national gateway. The passenger-to-population ratio reached 2.57 passengers per resident in 2024, while total airport connectivity was 1719.
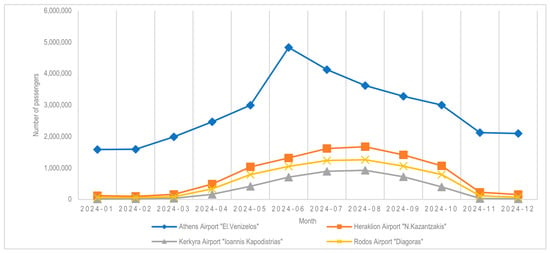
Greece recorded approximately 79.7 million passengers in 2024 (Figure 6), the highest passenger traffic among the analysed countries, representing an increase of 107.1% compared with 2010. Traffic is distributed across an extensive airport network that includes Athens and major regional and island airports such as Heraklion, Thessaloniki, Rhodes and Corfu. Greece recorded the highest passenger-to-population ratio in the sample, at 7.66 passengers per resident, and the highest level of nights spent at tourist accommodation establishments (Figure 3 and Figure 4). The monthly passenger traffic profiles of major tourist airports show pronounced seasonal variation (Figure 13). Total airport connectivity reached 18,645 in 2024, while Athens accounted for 8289.
Figure 13.
Monthly Air Passenger Traffic in Greek Airports in 2024. Source: Authors’ own elaboration based on [14,16].
Hungary recorded approximately 17.8 million passengers in 2024, representing an increase of 115.1% compared with 2010. Almost all national passenger traffic was concentrated at Budapest Ferenc Liszt International Airport, which handled approximately 17.6 million passengers. Budapest therefore represents the dominant national aviation gateway. Total airport connectivity reached 3435 in 2024, of which 3370 was associated with Budapest Airport.
Latvia recorded approximately 7.1 million passengers in 2024, representing an increase of 52.6% compared with 2010. Passenger traffic was highly concentrated at Riga International Airport, which handled approximately 7.1 million passengers. Latvia recorded the second-highest passenger-to-population ratio in the sample, at 3.80 passengers per resident. Total airport connectivity reached 1737 in 2024, corresponding entirely to Riga Airport.
Lithuania recorded approximately 6.6 million passengers in 2024, representing an increase of 189.1% compared with 2010. Its airport system includes Vilnius, Kaunas and Palanga, providing a distributed national airport structure. Vilnius Airport handled approximately 4.8 million passengers in 2024, while total national airport connectivity reached 1469. The passenger-to-population ratio reached approximately 2.19 passengers per resident. Total connectivity was lower than in Latvia despite Lithuania’s more extensive airport network. The available indicators also point to a significant role of external mobility, with diaspora-related characteristics representing an additional feature of the Lithuanian air transport market (Figure 5). Following the end of the analysed period, Vilnius Airport inaugurated a new departures terminal in 2025, involving an investment of EUR 50.2 million. The project increased the total passenger terminal area by one-third and doubled passenger flow capacity from 1200 to 2400 passengers per hour [21].
Moldova recorded approximately 4.1 million passengers in 2024, representing an increase of 342.1% compared with 2010, the largest increase among the analysed countries. Passenger traffic increased from approximately 2.25 million in 2022 to 4.14 million in 2024 and was concentrated at Chișinău International Airport, the country’s principal international gateway. The passenger-to-population ratio increased from 1.12 in 2023 to 1.71 in 2024. Moldova also recorded a 3.62-percentage-point increase in the diaspora share over the analysed period.
Poland recorded approximately 59.5 million passengers in 2024, the second-highest passenger traffic among the analysed countries, representing an increase of 187.9% compared with 2010. Passenger traffic is distributed across a relatively extensive national airport network, with Warsaw Chopin Airport representing the principal airport and substantial passenger volumes also recorded at regional airports. Poland is also planning the Central Communication Port (CPK), a major multimodal infrastructure project intended to integrate air, rail and road networks into a massive strategic transport node [22].
Romania recorded approximately 26.0 million passengers in 2024 (Figure 6), representing an increase of 167.3% compared with 2010. Passenger traffic is distributed between Bucharest and a network of regional airports including Cluj-Napoca, Iași, Timișoara and Sibiu. Bucharest Henri Coandă Airport handled approximately 15.9 million passengers, while regional airports contributed substantially to the national passenger market. Low-cost carriers also have a significant presence: at Bucharest Henri Coandă International Airport, 111 of 163 destinations were reported as operated by LCCs, while at Cluj Airport LCCs accounted for 77% of routes. Romania recorded total airport connectivity of 4429 in 2024, with 2980 associated with Bucharest. The country also recorded the highest diaspora share relative to population among the analysed countries.
Serbia recorded approximately 8.7 million passengers in 2024, representing an increase of 220.9% compared with 2010. Most national passenger traffic was concentrated at Belgrade Airport, which handled approximately 8.36 million passengers, while Niš and Morava accounted for the remaining traffic. Total airport connectivity reached 2395 in 2024, of which 2331 was associated with Belgrade Airport. Belgrade Airport has undergone substantial infrastructure and operational development following the concession to Vinci Airports [23]. Air Serbia also provides an important component of the national and regional route network.
Overall, the country-level evidence shows substantial heterogeneity in air passenger transport development across the analysed countries. Differences are observed not only in passenger traffic levels and long-term growth, but also in passenger mobility intensity, airport-network configuration, connectivity, tourism seasonality, external mobility and the degree of concentration at capital and regional airports. These patterns provide the basis for the comparative interpretation presented in Section 4.
The comparative evidence is synthesized in Table 2. The table brings together the main characteristics observed for each country across the economic, tourism, migration-related and connectivity indicators. Based on this comparative evidence, an indicative comparative pattern is identified for each country. These patterns are exploratory and are not intended to represent formal statistical classifications.
Table 2.
Comparative synthesis of the main characteristics of air transport development in the analysed countries.
The synthesis indicates that economic growth alone does not fully account for the observed differences in passenger air transport development. The analysed countries display different combinations of economic scale, tourism intensity, migration-related characteristics, airport infrastructure and connectivity. The identified patterns overlap in several cases rather than forming mutually exclusive categories.
4. Discussion
4.1. Economic Development and Air Passenger Transport
The findings indicate that economic development is associated with air passenger transport performance, but does not provide a sufficient explanation for the differences observed across the analysed countries. The moderate positive correlation between GDP and passenger traffic in 2024 (r = 0.66, n = 12) indicates that larger economies tend to have larger air passenger markets. However, the relatively wide confidence interval (95% CI [0.15, 0.90]) and the small number of observations also call for caution in interpreting the strength of this relationship. The magnitude of the relationship suggests that economic scale alone does not account for the substantial variation in passenger traffic across national markets, ranging in 2024 from approximately 4.1 million passengers in Moldova to 79.7 million in Greece. This finding is broadly consistent with previous research identifying economic activity as an important component of air transport demand, while also highlighting the role of market structure, connectivity and other contextual factors [4,5,7].
The relationship is considerably weaker when economic performance is expressed in per capita terms. The correlation between GDP per capita and passenger traffic is very weak (r = 0.17, n = 12), with a 95% confidence interval ranging from −0.45 to 0.68 and no statistically significant association (p = 0.602). This further indicates that higher average income does not translate directly into proportionally higher national passenger traffic. The finding suggests that differences in air passenger transport development cannot be interpreted simply as differences in purchasing power. Countries with relatively high GDP per capita may exhibit moderate passenger traffic, while countries with lower GDP per capita may record comparatively high passenger volumes.
The comparison between the 2010–2024 growth trajectories further supports this interpretation. In several countries, passenger traffic increased considerably faster than GDP. Moldova recorded a 342.1% increase in passenger traffic compared with 181.7% GDP growth, while Serbia recorded increases of 220.9% and 113.0%, respectively. Lithuania and Romania also experienced substantially faster growth in passenger traffic than in GDP, with increases of 189.1% versus 127.2% and 167.3% versus 130.9%, respectively. Greece provides the clearest contrasting case: GDP declined by 13.4% over the period, whereas passenger traffic increased by 107.1%. These differences indicate that the expansion of national air passenger markets cannot be interpreted solely through aggregate economic growth.
These findings complement rather than contradict the conventional positive relationship between economic activity and aviation demand. GDP remains relevant as an indicator of the potential economic scale of an air transport market, but its relationship with passenger traffic is conditioned by the structural characteristics of individual markets. Economic development therefore provides an important background condition for air transport, while other factors help shape how this economic capacity is translated into passenger mobility.
4.2. Tourism and Migration-Related Mobility
Tourism provides an important contextual dimension for understanding differences in passenger air transport that are not fully captured by economic indicators. The comparative findings indicate that countries with high tourism intensity tend to exhibit substantial passenger traffic, although the relationship varies according to the geographical distribution, seasonality and structure of tourism activity. Previous research has also highlighted the relationship between international air connectivity and tourism demand [24], while the importance of seasonality in Central European air transport markets has been documented in previous research [9].
Greece represents the clearest tourism-associated pattern in the sample. The combination of high tourism intensity, the highest passenger-to-population ratio and an extensive airport network, including several airports serving tourism-oriented destinations, is consistent with a strong tourism-related component of air passenger demand. The pronounced seasonal variation observed at several Greek airports further indicates that tourism affects not only the overall volume of passenger traffic but also its temporal distribution.
Croatia presents a related but structurally different pattern. Passenger traffic is concentrated to a considerable extent at airports serving coastal tourism destinations, while the monthly profiles of Split, Dubrovnik and Zadar show pronounced seasonal peaks. This suggests that the relevance of tourism to aviation depends not only on the scale of tourism activity but also on its geographical concentration and seasonality. From an operational perspective, such seasonality creates a different demand profile from that of more diversified year-round aviation markets.
Poland provides a useful contrast. Although it records very high tourism activity, its passenger market is also associated with large economic scale, a substantial domestic market and an extensive airport network. Tourism therefore represents one component of a more diversified demand structure rather than a single dominant characteristic. This comparison reinforces the importance of considering tourism together with economic scale and airport-network characteristics rather than treating it as an independent explanation of passenger traffic.
Migration-related mobility provides another contextual dimension for understanding differences that are not adequately explained by GDP or GDP per capita. Romania and Moldova are particularly relevant in this respect because both combine comparatively modest GDP per capita with substantial passenger traffic and relatively high diaspora-related indicators.
In Romania, the relatively high level of passenger traffic occurs alongside a substantial diaspora-related indicator, an extensive network of regional airports and a strong presence of low-cost carriers. These characteristics provide a plausible structural context for sustained international passenger mobility. However, the available data do not identify the purpose of individual journeys and therefore do not allow the share of diaspora-related or labour-migration-related travel within total passenger traffic to be quantified. The observed relationship should consequently be interpreted as an association between the migration-related context and passenger transport performance rather than as evidence of a direct causal effect.
Moldova provides an even more distinctive case. Passenger traffic increased substantially over the study period despite the country’s relatively small economic scale, while the national aviation system is highly concentrated at Chișinău International Airport. The combination of rapid passenger traffic growth and a relatively high diaspora-related indicator is consistent with the interpretation that international mobility represents an important component of the broader air transport context. At the same time, the concentration of passenger traffic at a single principal gateway makes the national trajectory particularly sensitive to changes in international connectivity.
The Romanian and Moldovan cases therefore illustrate an important distinction between aviation demand associated with economic prosperity and aviation demand associated with broader international mobility. International travel may respond to family, employment, education or other cross-border connections and does not necessarily reflect high average purchasing power. This provides a plausible contextual explanation for why passenger traffic may be relatively high in countries with lower GDP per capita, while recognising that the present country-level data do not allow individual travel motives to be identified.
4.3. Connectivity, Airport Infrastructure
The findings also highlight the role of airport connectivity and network structure. The connectivity indicators used in this study were obtained from ACI Europe and provide a standardised external measure of the extent of national air connections. Their inclusion is useful because passenger traffic alone does not indicate how a country’s aviation system is structured or how effectively it is connected to other markets.
Connectivity can interact with economic and structural conditions in different ways. In smaller aviation markets, a well-connected principal airport may provide access to international destinations that cannot be supported by domestic demand alone. Latvia and Serbia illustrate this type of context, where passenger traffic is strongly concentrated at the principal national airport and connectivity represents an important characteristic of the national aviation system. Lithuania presents a somewhat different configuration, with passenger traffic distributed across several airports and recent airport infrastructure development contributing to the evolution of the national network.
The relationship between connectivity and passenger traffic should nevertheless not be interpreted as unidirectional. Greater connectivity can facilitate passenger mobility, but passenger demand, tourism attractiveness, airline strategies and airport infrastructure can also support the development of connectivity. The present comparative design does not allow these directions of influence to be separated. Connectivity is therefore best interpreted as part of the structural environment within which national passenger air transport develops rather than as an independently estimated causal determinant.
The broader multimodal transport context may also be relevant when interpreting differences between economic development and passenger air transport. In countries with well-developed rail and road alternatives, particularly for shorter-distance journeys, part of the potential demand for air travel may be served by other transport modes. Previous research has shown that the development of high-speed rail can affect air transport demand, particularly on shorter-distance markets where the two modes may compete [25]. This consideration is relevant when interpreting the Czech case, where relatively high GDP per capita is accompanied by moderate passenger traffic. However, alternative transport modes were not directly measured in the present analysis, and their potential role is therefore considered contextual rather than empirically estimated.
Infrastructure development also interacts with connectivity and passenger demand. Airport terminal investments, modernisation and regional airport development can increase capacity and improve accessibility, thereby creating conditions for traffic growth. However, the contribution of such investments depends on broader market conditions, including airline services and network accessibility [6,17]. Evidence from Central European regional airport systems highlights differences in airport performance and development according to local and regional conditions [26]. The examples of Zagreb, Split, Bucharest, Cluj-Napoca and Vilnius illustrate different forms of infrastructure development within national aviation systems. These cases support the interpretation that infrastructure functions primarily as an enabling condition within a broader demand and network environment rather than as an independent explanation of passenger traffic.
4.4. Integrated Interpretation of National Development Patterns
Taken together, the findings suggest that the observed differences are better understood through combinations of economic and structural characteristics than through individual indicators.
The tourism-associated pattern is most evident where international tourism represents an important component of passenger demand and where airport activity is closely connected to tourist destinations and seasonal flows. The migration-associated pattern is more visible where substantial characteristics related to diaspora coexist with relatively modest GDP per capita. The economy-associated pattern is more evident in larger national markets where passenger traffic develops alongside economic scale and diversified domestic and international demand. Connectivity-associated characteristics are more apparent in smaller or highly concentrated aviation systems where the role of the principal airport and its international network is particularly important.
These patterns should not be interpreted as separate or mutually exclusive models. The same country may simultaneously exhibit strong tourism, migration-related mobility, connectivity and economic characteristics. Romania, for example, combines economic scale, regional airports, LCC presence, connectivity and a substantial diaspora-related context. Similarly, Greece combines tourism intensity, extensive airport infrastructure and connectivity, while Poland combines economic scale, tourism activity, domestic demand and an extensive airport network.
The findings therefore provide a direct answer to the research question: differences in national air passenger transport development cannot be attributed to economic performance alone. Rather, they reflect different combinations of economic scale, tourism intensity, migration-related mobility, connectivity and airport infrastructure. These combinations help explain why countries with broadly comparable economic characteristics may exhibit substantially different passenger transport trajectories.
The contribution of the present study lies less in identifying a new individual determinant than in bringing these dimensions together within a common comparative framework and using country-level benchmarking to examine how their combinations are reflected in different national trajectories.
4.5. Implications for Air Transport Planning
The findings have implications for transport planning and airport development. A uniform relationship between GDP growth and passenger traffic should not be assumed when planning national or regional aviation capacity. Countries with strong tourism intensity may require particular attention to seasonal capacity, airport congestion and the distribution of traffic between major and regional airports. Countries with substantial migration-related mobility may require connectivity strategies that reflect sustained international travel between relevant origin–destination markets.
For smaller aviation markets, connectivity of the principal airport may be particularly important for maintaining access to European and international networks. At the same time, infrastructure investment should be aligned with demonstrated or realistically projected demand rather than treated as sufficient in itself to generate passenger traffic.
The results also indicate the importance of considering regional airports within national aviation strategies. Regional airport development can distribute accessibility beyond capital cities and may be particularly relevant in countries where passenger demand is geographically dispersed or where LCC operations have expanded the range of direct international connections.
From a broader planning perspective, the findings suggest that airport capacity, connectivity, airline network development and alternative transport modes should be considered together. Planning based exclusively on GDP growth may underestimate demand in markets characterised by tourism or international mobility, while investment based solely on projected capacity may overestimate the traffic that infrastructure can generate without corresponding demand and network support.
4.6. Limitations and Future Research
Several limitations should be considered when interpreting the findings. First, the analysis is based primarily on country-level secondary data. Aggregation at the national level may conceal substantial differences between individual airports, regions and passenger markets.
Second, the correlation analysis is cross-sectional and exploratory, based on 12 country-level observations for 2024; it therefore does not establish causal relationships. The correlation results should be interpreted as evidence of association rather than as estimates of the effects of GDP or GDP per capita on passenger traffic.
Third, the migration-related indicator is used as a proxy for the broader migration and diaspora context and does not identify the actual purpose of individual passenger journeys. Similarly, tourism indicators describe tourism activity but do not allow tourist and non-tourist passengers to be separated. Consequently, the observed associations involving these indicators should not be interpreted as direct estimates of tourism- or migration-generated air travel.
Fourth, airport connectivity is incorporated using the indicators reported by ACI Europe rather than calculated independently in this study. Differences in the temporal availability of structural indicators also limit the possibility of applying all indicators consistently across the entire 2010–2024 period.
Finally, potentially relevant factors such as airline pricing, route-level competition, bilateral air service agreements, regulatory changes, detailed airline strategies and modal competition are not explicitly modelled. These factors may contribute to differences between national aviation markets and represent important areas for further investigation.
In addition, the proposed development patterns are exploratory and interpretative rather than statistically validated classifications. They are intended to organise recurring characteristics observed in the comparative analysis and should not be interpreted as exclusive country categories.
Future research could extend the comparative framework through panel-data or multivariate models using the available country-year observations, subject to the completeness and comparability of the underlying data. Airport-level analysis could distinguish tourism, business and migration-related markets more precisely and examine the role of LCCs, route frequency, fares, airport governance, airline strategies and intermodal competition. Further research could also investigate the post-pandemic evolution of connectivity and the relationship between airport infrastructure investment and realised passenger demand.
5. Conclusions
This study examined the relationship between economic development and passenger air transport across twelve countries from Central, Eastern and South-Eastern Europe over the period 2010–2024, while considering tourism, migration-related mobility, airport connectivity and infrastructure as complementary structural dimensions. The findings indicate that economic development is associated with air passenger transport, but does not provide a sufficient explanation for the differences in passenger traffic observed across the analysed countries. The research question can therefore be answered by concluding that national air passenger transport development is better understood through the interaction of economic scale with a broader set of structural and mobility-related characteristics.
The empirical results show a moderate positive association between total GDP and passenger traffic in 2024 (r = 0.66), whereas the relationship between GDP per capita and passenger traffic is very weak (r = 0.17). The comparison of 2010–2024 trajectories further demonstrates that passenger traffic has not evolved proportionally to GDP across the analysed countries. These findings indicate that economic scale is relevant to the size of national aviation markets, but that average income and economic growth alone cannot account for the diversity of observed passenger transport trajectories.
The comparative analysis identifies tourism intensity, migration-related mobility, airport connectivity and infrastructure characteristics as important contextual dimensions for interpreting these differences. Their relevance varies across national markets and the resulting development patterns are not mutually exclusive. Rather than representing formally estimated types, the identified patterns reflect different combinations of economic, mobility and aviation-system characteristics observed through the comparative benchmarking analysis.
The main contribution of the study is therefore the integration of these dimensions into a common comparative framework. By combining economic indicators with tourism, migration-related, connectivity and airport-system characteristics, the study provides a broader perspective on why countries with different or even similar economic conditions may display substantially different air passenger transport trajectories. The framework is intended as an exploratory benchmarking approach rather than as a causal model or a formal classification system.
From a practical perspective, the findings suggest that air transport and airport development strategies should not rely exclusively on GDP-based projections. Planning should also consider the specific mobility structure of national markets, including tourism intensity, international mobility, connectivity, airport-network configuration and infrastructure capacity. The role of rail and other surface transport alternatives should also be recognised as part of the wider multimodal context, although these modes were not directly measured in the present study.
The study is subject to several limitations, particularly the country-level aggregation of the data, the relatively small cross-sectional sample and the exploratory nature of the correlation analysis. These limitations prevent causal conclusions regarding the individual effects of the analysed factors. Future research could extend the framework through panel-data and multivariate approaches and through airport-level analysis incorporating airline strategies, fares, route-level connectivity, LCC penetration, infrastructure utilisation and intermodal competition.
Author Contributions
Conceptualization, S.-E.Z. and A.-P.P.; methodology, S.-E.Z. and A.-P.P.; formal analysis, S.-E.Z. and T.-C.B.; investigation, T.-C.B. and A.-P.P.; data curation, A.-P.P.; writing—original draft preparation, S.-E.Z. and T.-C.B.; writing—review and editing, A.-P.P.; visualization, T.-C.B.; supervision, S.-E.Z.; project administration, S.-E.Z. All authors have read and agreed to the published version of the manuscript.
Funding
This research received no external funding. The APC will be covered by the authors’ affiliated institution upon acceptance.
Institutional Review Board Statement
Not applicable.
Informed Consent Statement
Not applicable.
Data Availability Statement
The data used in this study were obtained from publicly available sources, including Eurostat, the World Bank, ACI Europe, IATA and ATAG. The respective data sources are cited in the manuscript.
Acknowledgments
During the preparation of this manuscript, the authors used ChatGPT (OpenAI https://chatgpt.com/) and Google Gemini (free web version) for language editing, text refinement and language checking. The authors reviewed and edited the output and take full responsibility for the content of this publication.
Conflicts of Interest
The authors declare no conflicts of interest.
References
- Jankiewicz, J.; Huderek-Glapska, S. The air transport market in Central and Eastern Europe after a decade of liberalisation—Different paths of growth. J. Transp. Geogr. 2016, 50, 45–56. [Google Scholar] [CrossRef] [Scilit]
- Air Transport Action Group (ATAG). Aviation Benefits Beyond Borders 2024; ATAG: Geneva, Switzerland, 2024. [Google Scholar]
- Danesi, A.; Walawender, K. Analysis of air passenger demand trends and GDP elasticity in selected EU countries. Transp. Logist. Int. J. 2018, 18, 101–111. [Google Scholar]
- Zhang, F.; Graham, D.J. Air transport and economic growth: A review of the impact mechanism and causal relationships. Transp. Rev. 2020, 40, 506–528. [Google Scholar] [CrossRef] [Scilit]
- Kaya, G.; Aydın, U. The nexus between air transport and economic growth geographically: Evidence based on heterogeneous panel data models. J. Air Transp. Manag. 2024, 115, 102528. [Google Scholar] [CrossRef] [Scilit]
- Zaharia, S.E.; Pietreanu, C.V.; Pavel, A.P.; Boc, R.E. Major trends in the development of airports from Central and Eastern Europe and Baltic countries. In Proceedings of the 6th BASIQ International Conference on New Trends in Sustainable Business and Consumption; Pamfilie, R., Dinu, V., Tăchiciu, L., Pleșea, D., Vasiliu, C., Eds.; ASE: Bucharest, Romania, 2020; pp. 753–760. [Google Scholar]
- Button, K.; Taylor, S. International air transportation and economic development. J. Air Transp. Manag. 2000, 6, 209–222. [Google Scholar] [CrossRef] [Scilit]
- International Air Transport Association (IATA). World Air Transport Statistics Report 2024. Available online: https://www.iata.org/en/services/data/market-data/world-air-transport-statistics/ (accessed on 20 January 2026).
- Seidenglanz, D.; Havlíková, D. Anytime? Anywhere? The seasonality of flight offers in Central Europe. Morav. Geogr. Rep. 2016, 24, 53–63. [Google Scholar] [CrossRef] [Scilit]
- Borodako, K.; Rudnicki, M. Transport accessibility in business travel: A case study of Central and East European cities. Int. J. Tour. Res. 2014, 16, 137–145. [Google Scholar] [CrossRef] [Scilit]
- Matuz-Vitus, R.-I.; Máthé, C. The evolution of air transport connectivity: A case study of Cluj-Napoca International Airport. Transp. Res. Procedia 2026, 86, 231–240. [Google Scholar] [CrossRef] [Scilit]
- Kazda, A.; Novák Sedláčková, A.; Böhm, P.; Materna, M. Thinking beyond models: The propensity to fly of four Central European countries. J. Transp. Geogr. 2024, 122, 104040. [Google Scholar] [CrossRef] [Scilit]
- Adler, N.; Liebert, V.; Yazhemsky, E. Benchmarking airports from a managerial perspective. Omega 2013, 41, 442–458. [Google Scholar] [CrossRef] [Scilit]
- Airports Council International Europe. Airport Traffic Reports, 2010–2024; ACI Europe: Brussels, Belgium, 2010–2024. [Google Scholar]
- World Bank. World Development Indicators. Available online: https://www.worldbank.org (accessed on 13 December 2025).
- Eurostat. Eurostat Database. Available online: https://ec.europa.eu/eurostat/data/database (accessed on 13 December 2025).
- Zaharia, S.E. Airport connectivity, an essential element for economic performance. In Proceedings of the International Conference on Air Transport (INAIR 2014), Prague, Czech Republic, 13–14 November 2014; pp. 95–110. [Google Scholar]
- Zaharia, S.E. Benchmarking of airports from Central and Eastern Europe. In Proceedings of the International Conference on Air Transport (INAIR 2015), Amsterdam, The Netherlands, 12–13 November 2015. [Google Scholar]
- Zaharia, S.E. Major trends in the relation airport–airliners in Central and Eastern Europe. In Proceedings of the International Conference on Air Transport (INAIR 2016), Vienna, Austria, 10–11 November 2016. [Google Scholar]
- Groupe ADP. Zagreb International Airport. Available online: https://www.parisaeroport.fr/en/group/strategy/airport-network/croatia (accessed on 20 January 2026).
- Deveikis, J. Vilnius Airport Begins Construction of New €50m Terminal. Available online: https://www.lrt.lt/en/news-in-english/19/1878830/vilnius-airport-begins-construction-of-new-eur50m-terminal (accessed on 20 January 2026).
- Central Communication Port (CPK). Available online: https://www.cpk.pl/en/ (accessed on 20 January 2026).
- Vinci Airports. Belgrade International Airport. Available online: https://vinci-airports.com/en/our-airports/serbia/belgrade-airport/ (accessed on 20 January 2026).
- Kuok, R.U.K.; Koo, T.T.R.; Lim, C. Interaction effects of air services on tourism demand. Ann. Tour. Res. 2023, 101, 103582. [Google Scholar] [CrossRef] [Scilit]
- Nurhidayat, A.Y.; Widyastuti, H.; Sutikno; Upahita, D.P. Research on passengers’ preferences and impact of high-speed rail on air transport demand. Sustainability 2023, 15, 3060. [Google Scholar] [CrossRef] [Scilit]
- Novák, A.; Novák Sedláčková, A.; Kováčiková, K.; Böhm, P. Navigating regional airport system economics: Insights from Central Europe and Croatia. Systems 2024, 12, 175. [Google Scholar] [CrossRef] [Scilit]

Disclaimer/Publisher’s Note: The statements, opinions and data contained in all publications are solely those of the individual author(s) and contributor(s) and not of MDPI and/or the editor(s). MDPI and/or the editor(s) disclaim responsibility for any injury to people or property resulting from any ideas, methods, instructions or products referred to in the content. |
© 2026 by the authors. Licensee MDPI, Basel, Switzerland. This article is an open access article distributed under the terms and conditions of the Creative Commons Attribution (CC BY) license.