


Abstract
Autonomous micromobility vehicles (AMVs) need local planning that balances task progress, safety, and pedestrian interaction quality in pedestrian-rich shared spaces. Evaluating such planners is difficult because studies vary scenarios, seeds, metrics, outputs, and aggregation rules, while single-score leaderboards hide which behaviors produce a ranking. This paper proposes a repeatable, auditable, multi-objective benchmark protocol for AMV local planning. Before comparison, it fixes the scenario set, repeated seeds, measured metrics, stored outputs, planner-interface records, and aggregation procedure. We demonstrate it with a frozen robot_sf_ll7 campaign: 47 shared-space scenarios, three evaluation seeds, and 141 scenario-seed episodes per planner in one differential-drive AMV configuration. The stress test surfaces a descriptive safety–performance separation: a Proximal Policy Optimization (PPO)-family profile reaches higher observed mean task success than a classical reciprocal-avoidance baseline, while that baseline keeps lower collision exposure. Absolute success stays low for both, with most scenarios unsolved by either. Because this learned policy was trained on a superset of the evaluation scenarios, its higher success reflects behavior on the benchmark set, not held-out generalization—an overlap the protocol records per planner rather than hiding in one score. The finding is bounded to these configured pipelines, not a universal planner-family ranking. The contribution is an auditable comparison framework tracing results from the scenario matrix and fixed seeds to episode records, aggregate reports, and manifests.
1. Introduction
Autonomous micromobility vehicles (AMVs) are small, low-speed autonomous platforms that operate close to pedestrians. Examples include sidewalk delivery robots and scooter-like autonomous vehicles. They promise useful urban transport and delivery services, but they also create safety and acceptance questions in shared spaces [1,2,3]. In this paper, “AMV-specific” refers to this sidewalk and shared-space regime: narrow clearances, low-speed maneuvering, local pedestrian interactions, and behavior that must be predictable and comfortable as well as collision-free [4,5,6,7].
The local planner is a central bottleneck in this setting. It selects short-horizon motion commands while the AMV reacts to pedestrians, obstacles, and a local goal. In a doorway, crossing flow, blind corner, or bottleneck, the planner must decide whether to slow down, yield, pass, or continue. These decisions determine task completion, collision exposure, near-miss behavior, and interaction quality. A single success score is therefore not enough: one planner can reach the goal while passing too close to pedestrians, while another can avoid collisions but make little progress.
This differs from many generic mobile-robot navigation settings because the AMV often moves on the same narrow sidewalk or plaza space as pedestrians. It cannot rely on a protected lane or a large clearance buffer. A small geometric or timing error can therefore make a pedestrian step aside, block a walkway, or create a collision risk for someone who did not choose to interact with the vehicle [4,7].
This paper contributes a reproducible AMV local-planning evaluation protocol and uses it to report planner trade-offs with scenario-level provenance. Rather than compress a run to a single rank, the protocol keeps results easy to inspect while exposing the separate strengths and weaknesses a single score hides. This in turn supports later use of simulation evidence in safety- or approval-oriented workflows. Before comparing planners, it fixes six elements: which scenarios are run, which seeds are repeated, which metrics are measured, how episode outputs are stored, which planner-interface records are kept, and how records are aggregated.
This framing leads to three practical evaluation questions. First, can a benchmark report preserve the multi-objective nature of local planning instead of reducing behavior to a leaderboard score? Second, can it make stochastic simulation evidence traceable enough that readers can inspect how seeds, scenarios, and aggregation rules shaped the reported numbers? Third, can it combine many AMV-relevant interaction motifs, such as bottlenecks, doorways, blind corners, and crossing flows, without losing scenario identities needed for audit and reproduction?
Simulation-first evaluation is useful for AMV local planning because real-world trials are costly, slow, and weak at covering rare safety-critical interactions. Scenario-based simulation is already central in autonomous-systems safety, although scenario selection and evidence quality remain open problems [8,9]. Social-navigation surveys and guidelines identify a parallel problem: evaluation practice remains fragmented across scenarios, metrics, and reporting conventions [10,11]. Existing benchmark ecosystems provide valuable scenarios, metrics, and execution tools, but they do not always define the same evaluation protocol. As a result, AMV planner numbers are hard to compare when studies vary seeds, scenario definitions, metric payloads, or public artifacts. For AMVs, such a protocol must preserve both vehicle-progress metrics and pedestrian-facing interaction proxies, since a planner that is efficient in free space can still be unsuitable in a shared sidewalk bottleneck.
The gap addressed here is therefore not the absence of social-navigation benchmarks. It is the absence of a publication-facing AMV evidence protocol that treats traceability as a first-order requirement. We restrict the evidence to simulation-based shared-space scenarios, one differential-drive AMV execution configuration, and two audited planner pipelines. The results show how a fixed protocol can separate task completion, collision exposure, seed variability, and scenario provenance while preserving the evidence path from scenario definitions to manuscript tables.
The paper answers these questions with three contributions. First, it defines a reproducible benchmark protocol for AMV local planning, including scenario, seed, planner-interface, metric, schema, and aggregation rules. Second, it states the validity boundary—the explicit set of interpretations that the simulation-only, differential-drive evidence does and does not support. Third, it demonstrates the protocol on a frozen robot_sf_ll7 campaign by comparing a classical reciprocal-avoidance pipeline (orca) with a Proximal Policy Optimization (PPO)-family learned-policy pipeline (ppo). The demonstration exposes a bounded trade-off: ppo shows higher observed mean task success than orca, while orca maintains lower collision exposure. The point is not a universal planner ranking, but the protocol’s ability to keep such differences multi-metric, seed-aware, and tied to preserved scenario and episode records. The novelty is thus the predeclared, publication-facing evidence protocol and its release-to-result audit path; no new planner, simulator, scenario family, or metric is claimed. Practically, the protocol gives an AMV evaluator preflight configuration validation, fixed scenario and seed identities, episode-level provenance, planner–adapter disclosure, fixed aggregation rules, and a versioned release bundle that third parties can repeat or extend. Accordingly, the demonstration is deliberately scoped to one classical and one learned pipeline, three repeated seeds, and a single differential-drive configuration. The planner interface is extensible by design, but planner-agnostic benchmarking is a design capability to be validated, not a property demonstrated by two configured pipelines. Planner-set width, seed budget, and cross-kinematics coverage are protocol parameters that third parties can scale from the released bundle, not claims advanced here.
The remainder of the paper is organized as follows. Section 2 relates the protocol to the social-navigation and benchmark literature. Section 3 defines the benchmark protocol and frozen campaign. Section 4 reports the campaign results. Section 5 discusses interpretation limits and future extensions.
2. Related Work
This section places AMV local planning within social-navigation research and identifies the gaps that motivate this benchmark. We first review local-planning method families, then social-navigation evaluation principles, scenario-based validation and reproducibility practice, and finally the benchmark-platform landscape and the specific gaps this protocol addresses.
2.1. Local Planning in Pedestrian-Rich AMV Contexts
Local navigation methods in shared spaces are commonly grouped into classical model-based methods, interaction-aware reactive methods, and learning-based policies. Classical approaches remain attractive because they are interpretable and efficient. Canonical examples include the Dynamic Window Approach (DWA) for reactive collision avoidance and Timed Elastic Band (TEB) planning for kinodynamically constrained local trajectory optimization [12,13,14]. These methods can be parameter-heavy and require extensive tuning when geometry and crowd behavior change. Interaction-aware methods, such as social-force and reciprocal-avoidance formulations, model short-horizon inter-agent effects more directly. They still depend on assumptions about mutual responses and behavioral regularity [15,16,17].
Learning-based planners, including reinforcement learning (RL) and imitation learning variants, can adapt to complex interactions. They also raise persistent concerns about generalization, transfer robustness, and reproducibility of reported gains [18,19]. Recent uncertainty-aware approaches, such as constrained RL with conformal-inference-style uncertainty integration, show that safety-oriented policy shaping remains an active frontier [20]. For autonomous micromobility, these trade-offs are more acute because the platforms operate near pedestrians, where comfort and predictability are first-order requirements [2,5,6,7,21].
Alyassi et al. [22] organize learning-based social-navigation work into five families: end-to-end, human-position-based, human-attention-based, human-prediction-based, and safety-aware navigation. This taxonomy is useful because it separates planner logic from planner input assumptions. In robot_sf_ll7, PPO-style profiles represent end-to-end learning. Implementation-specific predictive planners represent prediction-aware planning, and guarded-PPO-style configurations partially represent safety-aware behavior. Human-position-based planners use explicit pedestrian positions as part of the decision input, while attention-based planners learn which nearby agents or scene elements should receive more decision weight. The current frozen campaign does not include mature rows for those two families. Their public implementation availability, observation–interface fit, and local benchmark maturity therefore remain follow-up audit questions rather than the current paper’s coverage claims.
2.2. Evaluation Principles for Social Navigation
Recent surveys and guideline-oriented work argue that social navigation evaluation should be explicitly multi-objective and context-sensitive, rather than framed as a single optimization target [10,11]. In this view, safety, comfort, legibility, and contextual appropriateness are coupled criteria that require both objective metrics and carefully designed scenario protocols. Complementary protocol work further emphasizes repeatable scenario definitions and comparable evaluation procedures across settings [23].
This principle-oriented framing is directly relevant for AMVs because acceptable behavior in shared pedestrian space depends on interaction quality, not just goal completion. Consequently, evaluation frameworks that ignore comfort and legibility (how readable the robot’s intended motion is to nearby people) can overstate deployment readiness.
Beyond aggregate social-navigation benchmarks, recent shared-sidewalk behavioral analysis shows strong sensitivity of pedestrian comfort and surrogate-safety indicators to micromobility speed and lateral clearance choices [7]. These findings reinforce why AMV benchmark reports should keep explicit clearance/speed interaction interpretation rather than reducing conclusions to success/collision alone.
2.3. Scenario-Based Validation and Reproducibility
Beyond social-navigation evaluation, the broader autonomous-systems literature has already identified scenario-based simulation as the practical backbone for scalable safety validation [8,9]. However, this same literature highlights unresolved challenges in representative scenario selection, corner-case coverage, and evidence interpretation under stochastic variability. These concerns transfer directly to social local planner benchmarking, where conclusions from single-run or weakly specified experiments can be misleading.
Our benchmark design is motivated by this convergence: social-navigation evaluation principles are combined with scenario-level reproducibility and descriptive uncertainty reporting so planner comparisons remain interpretable for AMV pre-deployment evaluation questions.
2.4. Benchmark Platforms and Remaining Gaps
The social-navigation evaluation principles above identify what is missing from the existing benchmark-platform landscape, which we survey here. Benchmarking infrastructure has progressed substantially, but no reviewed platform provides the exact publication-facing AMV evidence protocol targeted here. The Arena–Rosnav lineage has moved from Robot Operating System (ROS)-based learning–planner integration toward broader ROS 2, generative-environment, and photorealistic social-navigation benchmarking support through Arena 4.0 and Arena 5.0 [24,25,26,27,28]. This makes Arena an important adjacent ecosystem, but its public framing is broader than AMV-specific local-planning evidence: a general social-navigation suite does not by itself specify which micromobility kinematics, sidewalk-scale interactions, artifact records, and reporting boundaries should be held fixed for an AMV comparison. SocNavBench adds scenario realism and social-navigation metrics grounded in trajectory-driven interactions [29], but it does not target AMV-specific kinematic diversity or archived publication outputs. Kinematic diversity matters here because a planner that is acceptable for a holonomic or generic differential-drive robot may behave differently on scooter-like or other constrained AMV platforms.
DynaBARN varies obstacle motion profiles and compares classical and learning-based baselines under controlled difficulty settings [30]. Its main focus is robustness under difficulty scaling. LocalPlannerBench adds a planner-agnostic workflow and extensible post-processing hooks [31]. It is intentionally general and does not define an AMV-specific scenario set.
The comparison below uses four dimensions that matter for AMV evaluation: kinematics coverage, metrics breadth, reproducibility artifacts, and scenario realism. Table 1 uses this framing to treat the suites as complementary benchmark references rather than substitutes for one another.
Table 1.
Compact comparison of adjacent benchmark families against the autonomous micromobility vehicle (AMV) protocol needs used in this paper. The entries summarize the role each family plays in the argument; they are not performance rankings.
The distinction this paper claims relative to these systems is intentionally narrow, and the final row of Table 1 states it in the same dimensions: the novelty is the predeclared, publication-facing evidence protocol and its release-to-result audit path, not a new planner, simulator, scenario family, or metric. Existing suites provide valuable simulator infrastructure, scenario sets, metrics, and planner comparison workflows. This paper instead contributes a publication-facing AMV evidence protocol: it freezes the scenario matrix, seed policy, metric and output schemas, aggregation rules, and the declared role of each planner row (main comparator, diagnostic reference, or exploratory profile) before interpreting planner behavior. It also requires an explicit planner–adapter record and preserves a release-to-manuscript audit path from scenario and seed identifiers through episode records, aggregate reports, figures, and manifests. The manuscript therefore focuses on the auditable reporting path specialized to shared-space AMV evaluation, rather than claiming broader scenario realism, stronger planner coverage, or higher simulator fidelity than adjacent systems.
Alyassi et al. [22] provide both a learning-based taxonomy and a comparative evaluation over challenging interaction scenarios. We use that taxonomy to label planner families, then separate that literature mapping from this paper’s own protocol contribution. The protocol sets scenario, kinematics, output, and reporting rules at the benchmark-infrastructure level so that later like-for-like comparisons across vehicle motion models remain interpretable.
The mapping to Alyassi scenario classes is partial. Doorway, corridor, and intersection families map directly. Static and open-space-random classes are proxy-level matches. Open-space data-driven scenarios have no direct counterpart in the frozen Francis/classic matrix (classic interaction archetypes paired with singleton motifs inspired by the Francis et al. [11] social-navigation evaluation principles). We therefore use the Alyassi taxonomy only as a literature alignment check: it helps describe which scenario families are covered, but it is not used as a basis for cross-suite performance-equivalence claims.
For AMVs, the four comparison dimensions become operational. Scenario realism means shared-space micromobility interaction validity. Kinematics is a recorded protocol slot rather than a coverage claim: the protocol fixes which vehicle motion model is held constant, and this campaign exercises one differential-drive configuration, so cross-kinematics breadth is deferred to future work rather than asserted here. Reproducibility artifacts mean that scenario definitions, run settings, episode records, aggregate reports, and manuscript outputs remain aligned. Metrics breadth means that success and collision evidence are interpreted together with pedestrian-facing interaction proxies.
Two broader field-level pressures remain important but are not solved by this paper. First, like-for-like comparison across holonomic, differential-drive, and bicycle-like AMV motion models is still a cross-kinematics requirement for future work [22,25,29,30]. Second, social-navigation guidance supports multi-metric evaluation, but no single social-conformity metric standard is broadly adopted across major suites [10,11,22,29]. We treat both points as design constraints, not as claims solved by the current campaign.
The contribution in this paper targets two narrower gaps. The first is publication-bundle traceability: reported benchmark numbers become difficult to audit when scenario definitions, run settings, reporting payloads, and public artifacts are not aligned [22,29,31,32,33,34]. The protocol instead lets any reported aggregate be traced back through scenario and seed identifiers to the underlying episode records and manifest using only the released artifacts, without rerunning the campaign. The second is deployment-facing interpretation: field guidance emphasizes social acceptability dimensions, while benchmark narratives are often read through aggregate task-success and collision summaries alone [5,6,11,22]. These two gaps motivate a benchmark protocol that sets the evaluation rules before comparing planners and preserves the evidence needed to interpret multi-objective trade-offs.
3. Materials and Methods
The Materials and Methods section defines the evaluation protocol and the frozen campaign used to demonstrate it. The protocol is specified for reuse; the campaign is the fixed experiment instance reported in this paper.
3.1. Protocol Definition
The basic evaluation unit is an episode: one execution of one planner in one scenario under one random seed. Each episode produces a JSON record with scenario identity, planner identity, seed, run metadata, and metric values. Before planner comparison, the protocol fixes the full benchmark specification, defined below and summarized in Table 2, so each reported number is traceable to a scenario, seed, episode record, and aggregation rule.
Table 2.
Reader-oriented definition of the benchmark protocol and its frozen campaign value.
For compact notation, we write the benchmark specification as
where is the scenario matrix, is the seed policy, is the planner-row specification (each row’s planner, adapter, observation/action interface, and kinematic execution configuration), is the metric set, is the output schema, and is the aggregation protocol. The surrounding implementation also includes validation checks and release packaging as process gates around this specification. Table 2 translates these protocol elements into the fixed choices used in the frozen campaign.
The episode schema is intentionally inspectable. Each record exposes identity fields (scenario_id, planner_key, seed), robot configuration (robot_config.type), and outcome and metric values (outcome.collision_event, metrics.success, metrics.near_misses, metrics.time_to_goal_norm), together with run and configuration metadata that links the record back to the frozen manifest. Aggregate tables are therefore summaries of preserved episode records rather than standalone spreadsheet values. Figure 1 shows how this audit path is preserved from fixed inputs to publication evidence.
Figure 1.
Benchmark pipeline from fixed protocol inputs to auditable publication evidence. The dashed provenance thread shows how scenario, planner, and seed identifiers remain linked from episode execution through aggregate tables and figures.
3.2. Scenario Matrix and Planner Rows
The protocol uses scenario-based simulation for pedestrian-rich local planning because simulation improves coverage of rare and safety-critical interactions that are difficult to collect in field trials [8,9]. The frozen campaign is executed in robot_sf_ll7, which provides the scenario loader, planner harness, episode logging, metric computation, and publication-bundle export. Its implementation lineage builds on the robot-sf crowded-navigation framework of Caruso et al., PySocialForce, and the social-force pedestrian and group-interaction modeling tradition [15,35,36,37]. Results are therefore implementation-specific stress-test evidence, not direct deployment evidence.
The frozen matrix contains 47 scenarios in two groups. Classic interaction archetypes sweep bottleneck, crossing, doorway, group-crossing, and T-intersection motifs across density tiers where defined, with additional cross-trap, urban-crossing, and real-world-inspired bottleneck variants recorded explicitly in the matrix. Francis motifs are singleton templates inspired by social-navigation evaluation principles [11]; each appears once with its configured pedestrian-density or scripted-agent setting. Roughly half of the matrix configures scripted interaction agents rather than a sampled background crowd density (Table A1), so the shared-space regime here spans both crowded and scripted single-interaction motifs. Table 3 gives the main-text count summary, Table A1 reports the full appendix inventory, and Figure 2 shows nine readable examples.
Table 3.
Scenario coverage summary for the frozen matrix. The complete per-scenario inventory, including density tiers and interaction-agent settings, is reported in Table A1.
Figure 2.
Source Scalable Vector Graphics (SVG) overview of nine representative scenarios: (A) classic bidirectional crossing (medium), (B) classic bottleneck (medium), (C) classic doorway (medium), (D) classic group crossing (medium), (E) classic T-intersection (medium), (F) Francis blind corner, (G) Francis intersection wait, (H) Francis parallel traffic, and (I) Francis crowd navigation. Panels show static geometry and nominal interaction setup before runtime execution. POI denotes point-of-interest annotations in the source scenario maps. The overview is interpretive, not a performance result.
The planner rows are assigned roles before interpretation. The main comparison uses orca, an Optimal Reciprocal Collision Avoidance (ORCA)-style reciprocal-avoidance baseline [17], and ppo, a PPO-family learned policy [18]. The goal row is a diagnostic reference. Other rows remain exploratory because their adapter maturity or local provenance is weaker in the frozen release, so they are summarized only in Appendix B.2. Pairing one classical and one learned-policy row as the main comparison aligns with benchmark approaches that compare classical and learning-based navigation under common evaluation pipelines [24,25,29,30].
Because planner families receive different input representations, the main comparison is between planner pipelines rather than isolated algorithms. This is an explicit protocol choice: the benchmark must record not only the planner name but also the adapter: the declared software bridge between the common harness and a planner’s own observation/action interface. The adapter converts harness state into planner inputs and planner outputs back into executable velocity commands. Without that interface record, two benchmark rows could differ because of observation access or action constraints rather than planner logic alone.
Model-based and adapter-driven planners consume structured robot, pedestrian, and obstacle state fields from the harness. The ppo row uses an occupancy-grid local observation—a fixed-size grid around the robot whose cells encode nearby obstacle and pedestrian occupancy—with explicit goal context, illustrated in Figure 3, and emits unicycle-style differential-drive commands. The available provenance does not show that ppo was tested on scenario families held out from its training, so ppo is interpreted as benchmark-set policy behavior under the frozen interface. The campaign uses one differential-drive execution configuration; holonomic and bicycle-model support remains a stack capability for later evaluation.
Figure 3.
ppo observation-grid frame for classic_t_intersection_medium (policy=ppo, seed=111). The figure illustrates the planner-facing local observation window and goal context; it is an input-representation example, not a separate performance result.
The frozen configuration records each row’s planner role, execution mode, adapter status, and algorithm-configuration path before aggregation. The orca row is a baseline-ready reciprocal-avoidance comparator executed through this recorded bridge. The ppo row is a native differential-drive learned policy run with deterministic inference. Its model identifier is registry-resolved in the benchmark configuration; lower-level implementation keys stay in the archived configuration rather than serving as reader-facing evidence. Its local source configuration explicitly notes that the policy was trained on the evaluation superset, so the manuscript treats the row as benchmark-set behavior rather than out-of-distribution generalization evidence. Throughout the paper, uppercase PPO names the algorithm family, while the typewriter row key ppo names this configured implementation row.
In the frozen campaign, these interface differences are material rather than nominal. Table 4 summarizes the recorded execution provenance of the two main rows from the released per-row metadata: the orca pipeline emits world-frame velocity vectors that the adapter projects into differential-drive commands, and this projection alters of its commands, whereas the ppo pipeline emits feasible differential-drive commands natively. Reported differences between the rows are therefore configured-pipeline effects; the campaign cannot attribute them to planner logic in isolation from observation access and command feasibility handling.
Table 4.
Recorded execution provenance of the two main comparison rows. The projection share is the fraction of planner commands altered by the differential-drive feasibility projection, read from the released per-row kinematics_feasibility metadata; the observation-input and command-path descriptions come from the archived planner configurations for those rows. Appendix B.2 reports command path and projection share for all seven rows.
3.3. Metrics and Aggregation
Following social-navigation evaluation guidance, the protocol reports task completion, safety events, and interaction-quality proxies together [10,11,23]. This prevents a planner with higher success but unacceptable collision exposure from being treated as a simple winner. Table 5 gives the main interpretation rule for each metric before the Results tables show them.
Table 5.
Main metric interpretation guide. Direction, caveats, and basis are included, so the Results tables are not read as a single-score leaderboard. In the basis column. “impl.-defined” marks thresholds and normalization constants fixed by this implementation rather than taken from a published standard.
For each planner, success and collision rate are episode means over the selected scenario-seed set. Near-miss exposure is the mean count of threshold-defined close interactions per episode, using and excluding collision events. Normalized time-to-goal is scaled by the episode horizon and retained for failed episodes rather than reported only for successful runs, and comfort/motion proxies aggregate force-threshold exceedance, comfort exposure, and jerk-derived motion terms. If a future AMV benchmark has calibrated social-acceptance or legibility metrics, the same protocol can include them as additional component metrics rather than forcing them into a single ranking. Appendix B.1 records the frozen thresholds and parameter sources.
Aggregation starts from episode JSONL outputs. For each planner and metric, we report central tendency, per-seed values, and descriptive bootstrap diagnostics over seed means. In the frozen campaign, every main comparison row sees the same 47 scenarios under seeds 111, 112, and 113, giving 141 episodes per planner. The bootstrap bands summarize variability inside this three-seed campaign; they are descriptive diagnostics rather than precision estimates or high-power inferential tests. A broader seed budget is therefore treated as future precision improvement, while the current campaign supports protocol demonstration and bounded planner interpretation [38,39,40].
The archived bundle also carries a composite social-navigation index whose weights are heuristic and uncalibrated; it is documented in Appendix B.3 as an engineering diagnostic only and is not used in any comparison or ranking in this paper. Exploratory ped_impact_* outputs are likewise kept out of primary comparative claims.
3.4. Frozen Campaign and Evidence Boundary
We use the term frozen campaign for the fixed experiment package used to instantiate the protocol: the scenario matrix, seeds, planner configurations, metric definitions, aggregation rules, and output artifacts are fixed before interpretation so that later manuscript claims can be audited against stable records. The workflow is repeatable from recorded configuration rather than replayed from fixed trajectory logs. The publication bundle contains configuration inputs, raw episode JSONL, aggregate reports, manifests, release metadata, and public release references [41]. Manuscript figures are derived from these archived reports rather than stored as separate public release artifacts in the benchmark release bundle. Table 6 records the run-level identifiers and seed policy that bound the reported campaign.
Table 6.
Run-level summary for the frozen campaign. All fields are recorded in the versioned publication bundle and linked to the public release.
Table 7 consolidates the interpretation boundaries for the frozen campaign in one place.
Table 7.
Validity boundary for interpreting the frozen campaign. The table consolidates the main interpretation limits so they are not scattered across the narrative.
The main comparison supports the Results in this paper. Exploratory planner rows are reported only as transparency evidence. Claims derived from the protocol are classified as either literature-backed general principles or implementation-specific evidence tied to this benchmark stack, so local results are not overgeneralized as field consensus.
4. Results
The Results section reports three outputs from the frozen campaign: the main safety–performance trade-off, seed-level variation, and scenario-level traceability (for reader support, compact appendix guides summarize planner semantics (Appendix B.2), metric definitions (Appendix B.3), and visual-interpretation rules (Appendix B.4) without expanding the main-text evaluation outputs). The numbers are read from the publication bundle and use a challenge matrix that intentionally concentrates constrained geometry, dense interaction, and conflict situations. Low absolute success rates therefore describe behavior on this stress layer, not routine low-risk sidewalk operation. This failure-exposing design is useful for a protocol demonstration because it forces safety, progress, and interaction proxies to separate before any later calibration against an easier, routine-operation matrix is added.
4.1. Main Safety–Performance Trade-Off
The main comparison uses the audited rows from the publication bundle. In this campaign, the benchmark uses the classic_interactions_francis2023 scenario matrix with the eval seed set. This produces 141 episodes per planner.
Table 8 reports the main comparison: relative to orca, ppo has higher success ( percentage points) alongside a higher collision rate ( percentage points; the two deltas coincide by chance on this matrix). These are configured-pipeline differences, not held-out planner-family properties, and should be read with the ppo provenance caveat in Table 7 and Table 8. Because the ppo policy was trained on a superset of the evaluation scenarios, this campaign does not estimate generalization and cannot separate memorization from policy fitting; the row demonstrates in-distribution behavior under the recorded interface, and no wording in this paper should be read as learned-policy generality. The ppo row also has fewer near-miss events per episode and a lower normalized time-to-goal, so the trade-off is not reducible to success and collision alone. Only 16 of the 47 scenarios see any success from either main row; in the remaining 31, both rows fail every episode, so the low headline success rates reflect a deliberately severe matrix rather than routine operation. In episode terms, the means correspond to 26 successful orca and 35 successful ppo episodes of 141, with the difference distributed across several of these 16 scenarios rather than carried by one (Table A2).
Table 8.
Main comparison from the frozen publication bundle. Delta columns are relative to orca; positive collision is worse. Near-miss values are threshold-defined events per episode, not episode-level rates. † The ppo policy was trained on the evaluation scenario superset; its success is configured benchmark-set behavior, not held-out generalization, and the success delta is reported only to show that the protocol records this provenance limit alongside the number rather than to rank planner families.
This success floor is real and is therefore classified rather than hidden. Table 9 groups the 47 scenarios by task-success resolution and reports, from the same frozen scenario table, where secondary metrics still separate the main rows where success cannot. Within the 31 both-zero scenarios, the recorded collision means differ between the rows in six scenarios and the near-miss means in 16; at least one of the two differs in 19. Normalized time-to-goal separates none of the 31 because every episode there remains unfinished. The matrix therefore retains partial multi-metric resolution but poor task-success resolution on the stress layer. These counts are descriptive existing-artifact observations; they do not make the matrix optimally calibrated, and calibration against an easier routine-operation matrix remains for future work (Section 5).
Table 9.
Task-success resolution classes of the 47 frozen scenarios for the two main rows, with the secondary-metric separation retained inside the both-zero class. Counts are read directly from the released scenario table; “differ” means the recorded per-scenario means are unequal.
The released per-episode records also show how the failed episodes end. Recomputing the termination_reason field from the archived episode logs (payload/runs/*/episodes.jsonl) shows that, within the 31 both-zero scenarios (93 episodes per row), 92 of the 93 orca failures end by reaching the episode horizon (max_steps) and one ends in a collision, while 82 of the 93 ppo failures end at the horizon and 11 end in a collision. Across all 141 episodes per row, the same breakdown gives orca 110 horizon terminations and five collisions, and ppo gives 92 and 14. The success floor is therefore dominated by episodes that remain unfinished at the horizon rather than by unsafe terminations. The archived records do not distinguish whether an unfinished episode reflects stagnation, detouring, or an insufficient horizon, and this breakdown attributes the outcome to no specific planner mechanism.
The planner rows in Table 8 have different roles. goal is an implementation-specific deterministic goal-seeking diagnostic profile and a low-information reference row. orca is the ORCA-style reciprocal collision-avoidance row backed by model-based literature [17]. The ppo row implements a PPO-family learned policy under the shared run specification [18]; following the convention fixed in Section 3, uppercase PPO names the algorithm family and ppo names this configured row.
Behaviorally, orca is the cleaner safety comparator in this frozen configuration: it gives up task completion but keeps collision exposure lowest. The ppo row is more progress-oriented inside the same stress-test matrix: it completes more tasks and reaches goals faster on average but accepts substantially higher collision exposure. Its lower near-miss count must therefore be read with the collision evidence: ppo shows both fewer near misses and more collisions than orca in this campaign. This pattern is consistent with some close encounters resolving as collisions rather than near misses, though it does not prove that mechanism.
The publication bundle adds descriptive seed-level context. Across the three paired seeds in Table 10, ppo shows higher success than orca in each seed, while orca shows lower collision exposure in each seed. Descriptive seed-bootstrap bands over the three seed means are retained in the release bundle as diagnostic visual aids only. They should not be read as robust confidence intervals or as evidence of planner-family superiority. Table 10 reports the seed-level values behind this summary.
Table 10.
Per-seed values for the two main comparison rows. Collision is computed from the episode-level outcome.collision_event field, and near-miss values are events per episode.
Table 8 keeps the main comparison focused on core decision metrics. The paired ppo minus orca deltas are summarized in the prose above rather than repeated in a separate table. Extended diagnostics remain in the public release bundle cited in Section 3.4.
4.2. Runtime Scene Context Panels
The runtime panels show how benchmark scenarios look under the same run settings used for the reported tables. They make interaction geometry and agent layout visible before interpreting success, collision, and near-miss patterns.
Figure 4 illustrates the constrained geometry present in many scenarios, where the route leads through narrow passages, crossing flows, or occluded interactions. The figure provides context for the low aggregate success without establishing the causes of individual failures. Together, the static-intent and perception-view figures introduced in Section 3 (Figure 2 and Figure 3) and the runtime grid here (Figure 4) connect the scenario design to the observed planner behavior.
Figure 4.
Runtime frames for the same nine scenarios and (A–I) panel layout as Figure 2, under policy=goal, seed=111, chosen so the panels show raw scenario geometry without planner-specific avoidance behavior. The embedded legend decodes robot, pedestrian, goal, obstacle, and action-cue marks.
Exploratory planner rows from the same frozen bundle are retained for transparency in Table A4 (Appendix B.2), but they are excluded from the main comparison: orca and ppo are the adapter-audited rows, whereas the exploratory adapters clear configuration preflight without clearing the adapter-level audit defined in Appendix B.2, so their metrics are integration-tracking evidence rather than planner-capability comparisons. The frozen evidence cannot attribute their failures to algorithmic limits as opposed to adapter tuning or observation mismatches: the recorded projection shares range from for socnav_sampling to for social_force, and a zero projection share does not by itself certify a mature observation contract. The per-row execution provenance is disclosed in Appendix B.2.
4.3. Planner-Role and Trade-Off Visualization
The full planner view places the Table 8 trade-off in the context of every planner row, showing how weaker or adapter-sensitive planners remain visible as transparency evidence rather than being hidden behind a single score.
Figure 5 makes this separation visible. Success increases upward and collision rate rightward, so the preferred region is upper left; the main comparison rows (orca, ppo) occupy it and carry descriptive seed-bootstrap bands as visual diagnostics. The seed-level values, not the bootstrap-band geometry, are what show orca’s collision rate below ppo’s in each of the three paired seeds (Table 10). Experimental planners cluster toward higher collision rates and lower or zero success, consistent with their exploratory designation. The goal row sits near the origin on success, confirming its role as a low-information diagnostic reference only.
Figure 5.
Configured -pipeline trade-off in the frozen campaign (seeds 111–113, 141 episodes per planner). For collision rate, lower is better; for success rate, is higher is better, so the preferred region is the upper left. Error bars show descriptive seed-bootstrap bands for the main comparison rows; they are visual diagnostics for the three-seed campaign, not inferential confidence claims. Experimental-planner point labels abbreviate socnav_sampling and prediction_planner.
4.4. Seed Variability
We first report seed variability from the same frozen episode-level data used for Table 8. This check tests whether the evaluation design matters, not only planner behavior. It uses the eval seed set () with 47 repeats per seed (141 episodes per planner total). The descriptive bootstrap bands are computed from 400 resamples over per-seed means and used only as diagnostic context.
A single seed can misrepresent the aggregate by a substantial margin. For orca, per-seed success spans – (spread ) while the three-seed mean is . For ppo, the per-seed range is – (spread ) against a mean of . Single-seed collision rates are far more stable (per-seed spread for both rows), so the seed sensitivity is concentrated in success rather than collision. This shows that repeated seeds materially affect success-rate interpretation. The three-seed design is a minimal repeated-seed demonstration rather than a high-power uncertainty study.
A separately archived ten-seed campaign provides a directional consistency check on this reading. It is a different campaign, not a rerun of Table 8: it uses a 48-scenario matrix, a later code commit, and 480 episodes per row, while holding the horizon and differential-drive execution configuration fixed. Under those settings, the configured ppo pipeline again shows higher mean success than orca ( versus ) and orca again shows lower collision exposure ( versus ). The same directional ordering therefore appears under a different scenario matrix and a different code revision. This is a directional consistency check only: because seed count, scenario matrix, and code revision differ at the same time, it does not isolate the effect of the seed budget, does not estimate uncertainty for the frozen campaign, and does not replace a same-protocol ten-seed replication of Table 8. The campaign is preserved with its own manifest and per-row reports, including the disclosure that one unrelated exploratory row failed to close on missing local assets while both main rows were completed (Campaign issue1454-s10-fixed-h100 (2026-05-22), archived at docs/context/evidence/issue_1454_stage_a_fixed_h100_2026-05-22/ in the public robot_sf_ll7 repository). This check is additive, and its absolute values are not comparable term-by-term with Table 8; the frozen three-seed campaign remains the canonical released artifact for every number in the main tables.
4.5. Scenario Diversity and Provenance
The scenario matrix contains 22 classic-archetype scenario definitions and 25 Francis-motif scenario definitions. Across the three evaluation seeds, this yields 66 classic episodes and 75 Francis episodes per planner. This split is a benchmark-design feature rather than a validated deployment taxonomy: the matrix combines many interaction motifs so the campaign is not reduced to one narrow scene pattern.
For reproducibility, every aggregate number in Table 8 remains traceable to scenario identifiers, seed identifiers, episode records, and the publication manifest. Readers can inspect which scenarios contribute to any aggregate without treating the scenario-family labels as scientific endpoints. The primary interpretation remains the aggregate multi-objective trade-off between success and collision exposure.
4.6. Quality and Uncertainty Tracking
The released bundle also includes sensitivity diagnostics for the archived composite index documented in Appendix B.3. Those diagnostics stay out of the main comparison: the index is an uncalibrated engineering aid, and scientific calibration remains for future work.
The current result maturity separates into three levels:
- High maturity: run provenance, scenario and episode counts, aggregate means, and descriptive diagnostics from the frozen publication bundle.
- Medium maturity (interpretive): the current trade-off reading for orca versus ppo versus the goal reference row on the stress-test matrix.
- Low maturity (extension-oriented): broader comparative claims across planner families and kinematic classes are outside the frozen evidence base of this manuscript.
Overall, the Results show that the benchmark separates task completion, collision exposure, seed variation, and scenario provenance in one auditable evaluation; Section 5 interprets the resulting configured-pipeline trade-off, which is a benchmark-set finding rather than a general ranking of planner families.
5. Discussion
The discussion interprets the planner trade-off and the benchmark contribution, states the validity limits, and outlines future extensions.
5.1. Interpretation of Current Evidence
The main empirical pattern in Section 4 matters because AMV evaluation cannot be reduced to goal completion. A delivery robot or scooter-like platform must be judged by the route it takes to the goal as well as by whether it arrives. For pedestrian spaces, the relevant question is whether progress, collision exposure, and close-interaction behavior remain acceptable together. Acceptability itself is not measured in this campaign: the reported quantities are simulation-based interaction proxies, and calibrated social-acceptability measurement—comfort, legibility, and acceptance with human participants—remains for future work.
The low absolute success rates have a useful but bounded interpretation: the matrix is a deliberately severe stress test, not an estimate of routine sidewalk performance. Task-success resolution is therefore concentrated in the 16 scenarios where a main row succeeds at least once (Section 4), while the multi-objective separation—collision exposure, near-miss counts, and normalized time-to-goal—is measured across all 47, including the 31 where neither main row reaches the goal; within those 31, the preserved records still separate the main rows on collision or near-miss means in 19 scenarios (Table 9). Zero-success scenarios are retained rather than pruned, so the matrix keeps exposing failure modes as stronger planners are added under the same run specification; calibrating this difficulty against an easier nominal layer is future work, and the present matrix is not claimed to be optimally calibrated.
5.2. What the Evidence Supports
The current campaign supports three claims:
- Operational demonstration: the workflow from scenario matrix to validated outputs executes end-to-end.
- Main trade-off: the configured ppo and orca pipelines separate on success versus collision exposure, as reported in Table 8.
- Scenario provenance: the diverse scenario matrix remains inspectable through preserved scenario identifiers, seeds, and episode records.
These results support the paper’s central contribution: a repeatable AMV local planner benchmark protocol that reports progress, safety, uncertainty, and provenance as separate evidence streams. The scenario-family labels are construction and provenance labels, not a validated deployment taxonomy, so they are preserved for audit rather than used as a headline finding.
5.3. Limitations and Threats to Validity
The current evidence should be read within four scope boundaries. First, the simulation stack covers map-based local interaction rather than the full sensor-noise and pedestrian-compliance problem of field deployment. Because the present contribution is an evaluation protocol rather than a deployment study, simulation-only evidence is admissible as a demonstration that the protocol separates safety, progress, and interaction proxies. A later field campaign can reuse the same scenario definitions, metric definitions, threshold profile, and reporting rules, with repeated trials taking the role of the seed policy, to add real-world external validity. Second, the campaign uses one differential-drive AMV execution configuration, so cross-kinematics comparison is out of scope. Third, the matrix is stress-test oriented, so routine-operation claims are out of scope. Fourth, the primary comparison is the audited orca/ppo pair; other planner rows, the appendix composite index, and implementation-level ped_impact_* outputs remain release artifacts for transparency and future metric development. The planner interface is extensible by design, but two configured pipelines do not demonstrate planner-agnostic benchmarking; broad planner-family coverage is a validation target for future campaigns, not a property of this one.
5.4. Future Work
Substantive evidence gains should come from broader baseline coverage and targeted follow-up evidence under the same run specification. The highest-value extension is a paired nominal/stress protocol: an easier matrix should show that baseline planners solve routine shared-space cases, while the current stress matrix continues to expose failure modes. A later cross-kinematics campaign should hold scenario families, seed schedule, and compatibility reporting fixed across holonomic, differential-drive, and bicycle modes.
6. Conclusions
This paper specifies an AMV-specific benchmark protocol for local planning in shared pedestrian spaces and demonstrates it on a frozen simulation campaign of 141 episodes per planner across 47 classic-interaction and Francis-motif scenarios, with orca and ppo as the audited main rows. The contribution is the predeclared, publication-facing evidence protocol—fixed scenarios, seeds, metrics, output schema, adapter records, and aggregation rules—with an audit path from the released bundle to every manuscript number; no new planner, simulator, scenario family, or metric is claimed.
The campaign yields bounded diagnostic findings rather than planner-family rankings. The configured pipelines separate on multiple objectives at once: orca keeps the lowest collision exposure of the reported rows (), ppo reaches higher observed benchmark-set success (), and neither dominates both axes. Because the ppo policy was trained on the evaluation superset and executes through a different interface path than orca, these are configured-pipeline observations, not held-out generalization evidence. The seed check shows per-seed success spanning about 15 percentage points (ppo: –), so repeated seeds are part of the evidence design, not a reporting convention.
Because the rules are fixed before interpretation, third parties can reproduce and extend these findings from the released publication bundle distributed with release 0.0.2 of robot_sf_ll7 [41] (https://github.com/ll7/robot_sf_ll7/releases/tag/0.0.2 (accessed on 24 July 2026); see Data Availability). Broader planner coverage and a paired nominal/stress-test matrix are the natural next extensions (Section 5).
Author Contributions
Conceptualization, L.L. and L.M.; methodology, L.L. and L.M.; software, validation, formal analysis, investigation, data curation, visualization, and original draft writing, L.L.; review and editing, L.L. and L.M.; supervision, L.M. All authors have read and agreed to the published version of the manuscript.
Funding
This research received no external funding.
Institutional Review Board Statement
Not applicable.
Informed Consent Statement
Not applicable.
Data Availability Statement
The raw episode JSONL files, aggregate CSV/JSON reports, manifests, and the resolved campaign configuration record (preflight/validate_config.json, which fixes the scenario matrix, seed policy, horizon, and planner set) needed to inspect and independently recompute every result reported here are contained in the publication bundle paper_experiment_matrix_7planners_v1_release_v0_0_2_20260414_134316_publication_bundle.tar.gz, distributed as an asset of robot_sf_ll7 release 0.0.2 at https://github.com/ll7/robot_sf_ll7/releases/tag/0.0.2 (accessed on 24 July 2026). Re-executing the campaign additionally requires the benchmark source and the campaign configuration file at the commit recorded in the bundle manifest (f7ebdcae), available in the public repository. The Zenodo deposit at https://doi.org/10.5281/zenodo.19563812 archives a source snapshot of that repository taken at the release tag; it does not contain the campaign data files, which are distributed as the release asset named above. Manuscript figures are derived from these archived benchmark reports using the figure/table rendering scripts published in the public robot_sf_ll7 examples (examples/plotting/paper_figures/). The submitted source package contains the LaTeX source, rendered figure assets, and figure paths needed to reproduce the submitted PDF. All raw inputs required to regenerate the benchmark-derived figures independently—raw episode records, aggregate reports, and manifests—are contained in the publication bundle cited above, and the figure/table rendering scripts are provided in the public robot_sf_ll7 examples, so the release-to-figure path is publicly reproducible.
Acknowledgments
During manuscript preparation, the authors used AI tools, including OpenAI Codex/ChatGPT (GPT-5.5), Google Gemini (Gemini 3.1 Pro), and Perplexity (https://www.perplexity.ai/, hosted service, last used March 2026), for drafting assistance, outline/planning support, and one conceptual figure ideation. AI tools were not used to generate benchmark data, execute experiments, or make final scientific decisions. All claims, citations, and interpretations were reviewed and validated by the human authors against primary sources and archived benchmark artifacts. The authors retain full responsibility for the manuscript content and conclusions.
Conflicts of Interest
The authors declare no conflicts of interest.
Abbreviations
| AMV | Autonomous Micromobility Vehicle |
| ORCA | Optimal Reciprocal Collision Avoidance |
| POI | Point of interest |
| PPO | Proximal Policy Optimization |
| RL | Reinforcement learning |
| ROS | Robot Operating System |
| SNQI | Social Navigation Quality Index |
| SVG | Scalable Vector Graphics |
| TTG | Time-to-goal |
Appendix A. Scenario Matrix Inventory and Visual Artifact Note
Table A1 reports the detailed scenario inventory for the frozen AMV matrix. The table is kept in the appendix because the main text uses the scenario matrix as a diversity and provenance argument, while the row-level archetype and density details mainly support auditability.
Table A1.
Coverage of the frozen AMV scenario matrix by archetype, interaction class, and density specification. Classic interaction archetypes are swept across categorical low/medium/high density tiers where defined, while Francis scenarios are singleton motifs. A density specification of zero denotes no background pedestrian-density sampling; such motifs (notably several Francis templates) still instantiate scripted agents that drive the interaction, rather than empty rooms.
Table A2.
Per-scenario task success for the two main rows, restricted to the 16 scenarios where at least one main row reaches the goal at least once (the other 31 of 47 are zero-success for both rows). Values are success means over seeds 111–113; this audit table shows the headline success difference is distributed across scenarios rather than carried by one and is derived from the public release episode records.
Detailed scenario visual bundles, including full thumbnail atlases, are maintained as reproducibility artifacts in the benchmark release bundle rather than embedded as appendix figures. The manuscript keeps one source SVG geometry overview (Figure 2) and one runtime context figure (Figure 4). Quantitative claims are tied to metric tables and run-manifest-backed evidence, and planner, metric, and visual-encoding guidance is consolidated in Appendix B.
Appendix B. Appendix Reference Guides
Appendix B.1. Operational Parameter Guide
Table A3 collects the low-level run parameters referenced in the Methods. These values are part of the frozen campaign provenance rather than a separate scientific claim.
Table A3.
Operational parameters exposed by the frozen campaign bundle. Values are taken from episode records, threshold-profile metadata, and planner configuration references.
Appendix B.2. Planner Guide
To connect the manuscript tables to the broader social-navigation literature, we use the Alyassi et al. [22] family labels as a lightweight taxonomy overlay. In that overlay, ppo is the current end-to-end learning anchor; prediction_planner is an implementation-specific prediction-aware representative; guarded-PPO-style profiles are partial safety-aware representatives; and sacadrl (a socially aware collision-avoidance deep-RL profile) / socnav_sampling are treated as partial or experimental proxies for broader human-state-aware planner families. Attention-based families (for example CrowdNav-style planners) are not yet first-class benchmark entries in the frozen stack and therefore remain roadmap items rather than claimed current support.
goal (implementation-specific diagnostic reference). This row is not a social-navigation method family claim. In the current robot_sf_ll7 benchmark setup, it functions as a low-information goal-seeking diagnostic profile that exposes whether scenario progress can be achieved with minimal interaction reasoning. Its value in the manuscript is as a floor reference, not as a deployment-ready AMV planner.
social_force (literature-backed interaction-aware baseline). This family models local motion through force-like interaction terms between agents and nearby geometry [15]. In this paper, it serves as a classical interaction-aware baseline that is easy to interpret but still sensitive to hand-tuned response structure and behavioral assumptions. In the current frozen stress-test bundle, the local robot_sf_ll7 implementation is retained as exploratory evidence rather than as a strong manuscript comparator.
orca (literature-backed reciprocal-avoidance baseline). ORCA-style planners approximate short-horizon reciprocal collision avoidance by solving local velocity constraints under assumptions about mutual responsiveness [17]. Within this benchmark, the method serves as a reciprocal-avoidance reference: on this stress-test matrix it keeps the lowest collision exposure of the reported rows while completing relatively few tasks, making the safety-versus-progress trade-off explicit in dense interactions.
ppo (literature-backed learning-based family anchor). PPO is used here as the representative reinforcement learning family anchor [18]. The manuscript uses the frozen ppo profile to show how a learning-based policy can be evaluated under the same artifact and metric protocol as classical baselines. In the current canonical campaign, this ppo profile is retained as the learned main-comparison row under the shared benchmark protocol.
prediction_planner, socnav_sampling, and sacadrl (implementation-specific experimental profiles). These rows are retained for transparency and iteration tracking. They are informative for benchmark development because they expose how different local-decision structures behave under the same matrix and seed policy, but they are not used for primary manuscript claims in the current paper cycle.
All exploratory rows in this publication bundle report ok preflight status. Configuration preflight and adapter audit are separate validation levels: configuration preflight, reported in the Preflight column of Table A4, confirms that the referenced files resolve, that the configuration schema validates, and that the planner starts. The adapter audit showing that the two main rows additionally passed verifies the observation contract (the planner receives its intended state representation) and the action contract (its commands are interpreted and constrained as declared) under the recorded interface. Kinematics-feasibility metadata is recorded for all rows and is a disclosure rather than the discriminator between the two levels. The main narrative is reserved for the audited comparison rows plus the diagnostic reference row; exploratory rows are retained for transparency and iteration tracking. In this publication bundle, socnav_bench is excluded because its integration is not stable enough for manuscript tables.
Table A4.
Exploratory planner summary from the same frozen campaign bundle. Rows are retained for transparency and iteration tracking, but they are not part of the main comparison in this paper. social_force remains a literature-backed family anchor with weak local implementation performance on this stress-test matrix, while the other rows are implementation-specific profiles with lower local maturity in this release.
Table A5 discloses the recorded execution provenance for all seven rows from the released per-row kinematics_feasibility metadata. The projected-commands share is the fraction of planner commands altered by the differential-drive feasibility projection. A zero share means the row emitted feasible commands in its declared command space; it does not by itself certify a mature observation or model contract. Because these interface effects are large for some rows, exploratory metrics must be read as integration diagnostics: the frozen evidence cannot attribute weak exploratory performance to algorithmic limits as opposed to adapter tuning or observation mismatches.
Table A5.
Recorded execution provenance for all planner rows in the frozen campaign. “Native” rows emit commands directly in the differential-drive command space; “adapter” rows are converted from their own command space by the recorded bridge.
Implementation-level ped_impact_* outputs are tracked for follow-up analysis but are excluded from the main comparison tables in this paper.
Appendix B.3. Metric Guide
Success. Binary task-completion indicator. Higher is better. This is a necessary but insufficient performance metric because a planner can be safe but ineffective or successful while still creating undesirable interaction exposure.
Collision rate. Fraction of episodes with collision events. Lower is better. It is interpreted as a hard safety failure signal, but it still depends on the planner-facing observation interface and scenario geometry.
Near-miss events per episode. Mean number of threshold-defined close-passing events per episode, with collisions excluded by the threshold profile. Lower is better. In this manuscript, near-miss is treated as an interaction-risk proxy rather than as a direct human comfort measurement.
TTG norm. Normalized time-to-goal. Lower is better when success is already taken into account. Because normalization can compress large absolute differences, this value should always be read together with success and not as a standalone efficiency verdict.
Comfort and motion proxies. Force-exceedance, comfort exposure, and jerk-derived terms are used to capture whether progress is achieved through unstable or intrusive local motion. Lower is better. These are implementation-specific proxies, not direct human-subject comfort measurements.
SNQI (Social Navigation Quality Index). The frozen publication bundle also carries an implementation-level composite synthesis index archived here for traceability. It is not used for the main comparison or standalone manuscript claims. The score is computed per episode as
where is the success indicator, normalized time-to-goal, collisions, near misses, comfort exposure, force exceedance, and a jerk-derived term; hats denote normalized terms. Normalization follows a baseline-distribution strategy: median and statistics from baseline episodes define scaling anchors, and normalized values are clamped to , giving bounded comparability across metrics and reduced sensitivity to extreme outliers. The publication bundle records immutable artifact identifiers, snqi_weights_camera_ready_v3 and snqi_baseline_camera_ready_v3, for the weight and baseline signatures. This fixed version-3 setting is an uncalibrated interaction-quality diagnostic, not a calibrated safety index: its component weights are not tuned to enforce safety dominance, so collision evidence is reported separately as a primary component metric in the main comparison rather than read off of SNQI. Success is the sole positive term. Higher SNQI is better after aggregation, but only when interpreted together with component metrics. Broader weight calibration—including a safety-dominant weighting in which collisions carry the largest penalty—and cross-benchmark transferability remain for future work.
ped_impact_* metrics. These implementation-level pedestrian-impact outputs are exploratory signals for pedestrian interaction exposure. They are useful for future interpretation work, but they are intentionally excluded from the main comparison tables until their reporting scope is stabilized.
Appendix B.4. Visual Interpretation Guide
Source SVG overview (Figure 2). This figure shows static scenario intent before runtime execution. Black regions represent obstacles and walls; yellow/orange blocks indicate robot spawn/goal zones; blue lines show nominal robot routes; green blocks indicate pedestrian spawn/goal zones; red lines indicate nominal pedestrian routes; layered blue-violet markers indicate pedestrian start-plus-point-of-interest (POI) and goal-plus-POI states in the Francis-style maps; and gray crowd zones indicate where dense pedestrian interaction is deliberately concentrated. These POI markers are routing anchors embedded in the SVG definitions rather than runtime measurements. The figure explains scenario setup, not measured performance.
Runtime context grid (Figure 4). This figure shows selected frames from benchmark videos rendered under the frozen scenario specification. Robot state/path is shown in blue, pedestrians in red, and goal or goal-zone waypoint in green, and black map regions indicate obstacle geometry. The short line ticks are renderer-visible action cues. These panels help the reader connect scenario setup to concrete interaction context, but they are not direct quantitative evidence.
ppo observation-grid view (Figure 3). This figure illustrates one planner-facing perception snapshot for the ppo profile. Yellow indicates obstacle occupancy, red indicates pedestrian occupancy, blue marks the robot, green marks goal context, and black map regions encode static obstacle geometry. The point of this panel is to clarify what the planner can observe locally, not to prove ppo performance from a single frame.
Interpretation rule across all manuscript visuals. Figures in this paper are used as context and interpretability aids. Comparative conclusions must remain tied to the archived run manifests, tables, and metric payloads rather than to visual impressions from any single frame or schematic. The source-SVG scenario overview and the runtime grid share a neutral near-black obstacle rendering; the planner-facing occupancy grid is a different visualization (occupancy channels), so its palette differs by design. Each figure carries its own self-contained legend and should be read against it.
References
- Şengül, B.; Mostofi, H. Impacts of E-Micromobility on the Sustainability of Urban Transportation—A Systematic Review. Appl. Sci. 2021, 11, 5851. [Google Scholar] [CrossRef] [Scilit]
- Christensen, H.; Paz, D.; Zhang, H.; Meyer, D.; Xiang, H.; Han, Y.; Liu, Y.; Liang, A.; Zhong, Z.; Tang, S. Autonomous Vehicles for Micro-Mobility. Auton. Intell. Syst. 2021, 1, 11. [Google Scholar] [CrossRef] [Scilit]
- Coretti Sanchez, N.; Martinez, I.; Alonso Pastor, L.; Larson, K. On the Simulation of Shared Autonomous Micro-Mobility. Commun. Transp. Res. 2022, 2, 100065. [Google Scholar] [CrossRef] [Scilit]
- Weinberg, D.; Dwyer, H.; Fox, S.E.; Martelaro, N. Sharing the Sidewalk: Observing Delivery Robot Interactions with Pedestrians during a Pilot in Pittsburgh, PA. Multimodal Technol. Interact. 2023, 7, 53. [Google Scholar] [CrossRef] [Scilit]
- Neggers, M.M.E.; Cuijpers, R.H.; Ruijten, P.A.M.; IJsselsteijn, W.A. The Effect of Robot Speed on Comfortable Passing Distances. Front. Robot. AI 2022, 9, 915972. [Google Scholar] [CrossRef] [Scilit] [PubMed]
- Rezwana, S.; Lownes, N. Interactions and Behaviors of Pedestrians with Autonomous Vehicles: A Synthesis. Future Transp. 2024, 4, 722–745. [Google Scholar] [CrossRef] [Scilit]
- Arshi, A.N.; Dias, C.; Alhajyaseen, W.K.; Hussain, Q.; Samson, C.; Hussain, Z. Can Pedestrians Safely Navigate Shared Sidewalks with E-Scooters and Bicycles? A Behavioral Analysis Using Surrogate Safety Measures. Transp. Res. Part F Traffic Psychol. Behav. 2026, 116, 103407. [Google Scholar] [CrossRef] [Scilit]
- Riedmaier, S.; Ponn, T.; Ludwig, D.; Schick, B.; Diermeyer, F. Survey on Scenario-Based Safety Assessment of Automated Vehicles. IEEE Access 2020, 8, 87456–87477. [Google Scholar] [CrossRef] [Scilit]
- Zhong, Z.; Tang, Y.; Zhou, Y.; Neves, V.d.O.; Liu, Y.; Ray, B. A Survey on Scenario-Based Testing for Automated Driving Systems in High-Fidelity Simulation. arXiv 2021, arXiv:2112.00964. [Google Scholar]
- Mavrogiannis, C.; Baldini, F.; Wang, A.; Zhao, D.; Trautman, P.; Steinfeld, A.; Oh, J. Core Challenges of Social Robot Navigation: A Survey. arXiv 2021, arXiv:2103.05668. [Google Scholar]
- Francis, A.; Pérez-D’Arpino, C.; Li, C.; Xia, F.; Alahi, A.; Alami, R.; Bera, A.; Biswas, A.; Biswas, J.; Chandra, R.; et al. Principles and Guidelines for Evaluating Social Robot Navigation Algorithms. arXiv 2023, arXiv:2306.16740. [Google Scholar]
- Fox, D.; Burgard, W.; Thrun, S. The Dynamic Window Approach to Collision Avoidance. IEEE Robot. Autom. Mag. 1997, 4, 23–33. [Google Scholar] [CrossRef] [Scilit]
- Rösmann, C.; Hoffmann, F.; Bertram, T. Integrated Online Trajectory Planning and Optimization in Distinctive Topologies. Robot. Auton. Syst. 2017, 88, 142–153. [Google Scholar] [CrossRef] [Scilit]
- Rösmann, C.; Feiten, W.; Wosch, T.; Hoffmann, F.; Bertram, T. Efficient Trajectory Optimization Using a Sparse Model. In Proceedings of the 2013 European Conference on Mobile Robots, Barcelona, Spain, 25–27 September 2013; pp. 138–143. [Google Scholar] [CrossRef] [Scilit]
- Helbing, D.; Molnár, P. Social Force Model for Pedestrian Dynamics. Phys. Rev. E 1995, 51, 4282–4286. [Google Scholar] [CrossRef] [Scilit] [PubMed]
- van den Berg, J.; Lin, M.; Manocha, D. Reciprocal Velocity Obstacles for Real-Time Multi-Agent Navigation. In Proceedings of the 2008 IEEE International Conference on Robotics and Automation, Pasadena, CA, USA, 19–23 May 2008; pp. 1928–1935. [Google Scholar] [CrossRef] [Scilit]
- van den Berg, J.; Guy, S.J.; Lin, M.; Manocha, D. Reciprocal N-Body Collision Avoidance. In Robotics Research; Siciliano, B., Khatib, O., Groen, F., Pradalier, C., Siegwart, R., Hirzinger, G., Eds.; Springer: Berlin/Heidelberg, Germany, 2011; Volume 70, pp. 3–19. [Google Scholar] [CrossRef] [Scilit]
- Schulman, J.; Wolski, F.; Dhariwal, P.; Radford, A.; Klimov, O. Proximal Policy Optimization Algorithms. arXiv 2017, arXiv:1707.06347. [Google Scholar]
- Osa, T.; Pajarinen, J.; Neumann, G.; Bagnell, J.A.; Abbeel, P.; Peters, J. An Algorithmic Perspective on Imitation Learning. Found. Trends® Robot. 2018, 7, 1–179. [Google Scholar] [CrossRef] [Scilit]
- Yao, J.; Zhang, X.; Xia, Y.; Wang, Z.; Roy-Chowdhury, A.K.; Li, J. SoNIC: Safe Social Navigation with Adaptive Conformal Inference and Constrained Reinforcement Learning. arXiv 2025, arXiv:2407.17460. [Google Scholar]
- Soloperto, R.; Wenzelburger, P.; Meister, D.; Scheuble, D.; Breidohr, V.S.; Allgöwer, F. A Control Framework for Autonomous E-Scooters. IFAC-PapersOnLine 2021, 54, 252–258. [Google Scholar] [CrossRef] [Scilit]
- Alyassi, R.; Cadena, C.; Riener, R.; Paez-Granados, D. Social Robot Navigation: A Review and Benchmarking of Learning-Based Methods. Front. Robot. AI 2025, 12, 1658643. [Google Scholar] [CrossRef] [Scilit] [PubMed]
- Pirk, S.; Lee, E.; Xiao, X.; Takayama, L.; Francis, A.; Toshev, A. A Protocol for Validating Social Navigation Policies. arXiv 2022, arXiv:2204.05443. [Google Scholar]
- Kästner, L.; Buiyan, T.; Jiao, L.; Le, T.A.; Zhao, X.; Shen, Z.; Lambrecht, J. Arena-Rosnav: Towards Deployment of Deep-Reinforcement-Learning-Based Obstacle Avoidance into Conventional Autonomous Navigation Systems. In Proceedings of the 2021 IEEE/RSJ International Conference on Intelligent Robots and Systems (IROS), Prague, Czech Republic, 27 September–1 October 2021; pp. 6456–6463. [Google Scholar] [CrossRef] [Scilit]
- Kästner, L.; Carstens, R.; Zeng, H.; Kmiecik, J.; Bhuiyan, T.; Khorsandhi, N.; Shcherbyna, V.; Lambrecht, J. Arena-Rosnav 2.0: A Development and Benchmarking Platform for Robot Navigation in Highly Dynamic Environments. In Proceedings of the 2023 IEEE/RSJ International Conference on Intelligent Robots and Systems (IROS), Detroit, MI, USA, 1–5 October 2023; pp. 11257–11264. [Google Scholar] [CrossRef] [Scilit]
- Shcherbyna1, V.; Kästner, L.; Diaz, D.; Nguyen, H.G.; Schreff, M.H.K.; Lenz, T.; Kreutz, J.; Martban, A.; Zeng, H.; Soh, H. Arena 4.0: A Comprehensive ROS2 Development and Benchmarking Platform for Human-centric Navigation Using Generative-Model-based Environment Generation. arXiv 2024, arXiv:2409.12471. [Google Scholar]
- Shcherbyna, V.; Kastner, L.; Do, D.A.; Tung, H.; Nguyen, H.G.; Schreff, M.H.K.; Seeger, T.; Wiese, E.; Martban, A.; Zeng, H.; et al. Demonstrating Arena 5.0: A Photorealistic ROS2 Simulation Framework for Developing and Benchmarking Social Navigation. 2025. Available online: https://5.arena-rosnav.org/ (accessed on 19 May 2026).
- Arena-Rosnav. Arena-Rosnav. GitHub, Arena Rosnav. 2026. Available online: https://github.com/Arena-Rosnav/arena-rosnav (accessed on 16 February 2026).
- Biswas, A.; Wang, A.; Silvera, G.; Steinfeld, A.; Admoni, H. SocNavBench: A Grounded Simulation Testing Framework for Evaluating Social Navigation. ACM Trans. Hum.-Robot Interact. 2022, 11, 26. [Google Scholar] [CrossRef] [Scilit]
- Nair, A.; Jiang, F.; Hou, K.; Xu, Z.; Li, S.; Xiao, X.; Stone, P. DynaBARN: Benchmarking Metric Ground Navigation in Dynamic Environments. In Proceedings of the 2022 IEEE International Symposium on Safety, Security, and Rescue Robotics (SSRR), Sevilla, Spain, 8–10 November 2022; pp. 347–352. [Google Scholar] [CrossRef] [Scilit]
- Spahn, M.; Salmi, C.; Alonso-Mora, J. Local Planner Bench: Benchmarking for Local Motion Planning. arXiv 2022, arXiv:2210.06033. [Google Scholar]
- aninair1905. DynaBARN. 2022. Available online: https://github.com/aninair1905/DynaBARN/commit/791d977935f47b3ae5fc265a7d64e806337d7141 (accessed on 12 May 2026).
- CMU-TBD. SocNavBench. 2022. Available online: https://github.com/CMU-TBD/SocNavBench/commit/2724ea85ff22ca61a88ee95285dfc3fa056656c6 (accessed on 12 May 2026).
- Arena-Rosnav. Arena-Rosnav. 2023. Available online: https://github.com/Arena-Rosnav/arena-rosnav/releases/tag/v0.2.2 (accessed on 12 May 2026).
- Caruso, M.; Regolin, E.; Camerota Verdù, F.J.; Russo, S.A.; Bortolussi, L.; Seriani, S. Robot Navigation in Crowded Environments: A Reinforcement Learning Approach. Machines 2023, 11, 268. [Google Scholar] [CrossRef] [Scilit]
- Gao, Y. PySocialForce. 2023. Available online: https://github.com/yuxiang-gao/PySocialForce (accessed on 27 February 2023).
- Moussaïd, M.; Perozo, N.; Garnier, S.; Helbing, D.; Theraulaz, G. The Walking Behaviour of Pedestrian Social Groups and Its Impact on Crowd Dynamics. PLoS ONE 2010, 5, e10047. [Google Scholar] [CrossRef] [Scilit] [PubMed]
- Colas, C.; Sigaud, O.; Oudeyer, P.Y. How Many Random Seeds? Statistical Power Analysis in Deep Reinforcement Learning Experiments. arXiv 2018, arXiv:1806.08295. [Google Scholar]
- Colas, C.; Sigaud, O.; Oudeyer, P.Y. A Hitchhiker’s Guide to Statistical Comparisons of Reinforcement Learning Algorithms. arXiv 2022, arXiv:1904.06979. [Google Scholar]
- Agarwal, R.; Schwarzer, M.; Castro, P.S.; Courville, A.; Bellemare, M.G. Deep Reinforcement Learning at the Edge of the Statistical Precipice. arXiv 2022, arXiv:2108.13264. [Google Scholar]
- Luttkus, L. robot_sf_ll7: Social Navigation Benchmark Platform, Release 0.0.2. Version 0.0.2. Scoped 7-Planner Benchmark Release. 2026. Available online: https://zenodo.org/records/19563812 (accessed on 24 July 2026).


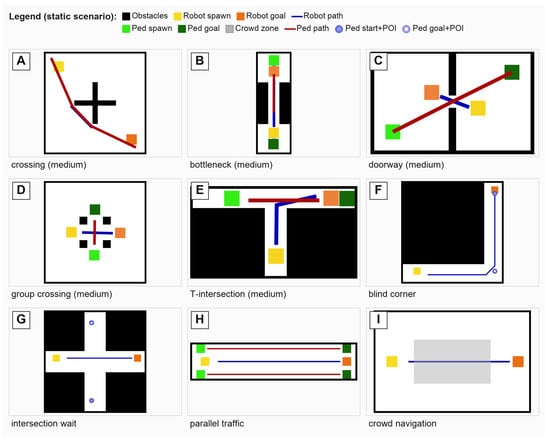
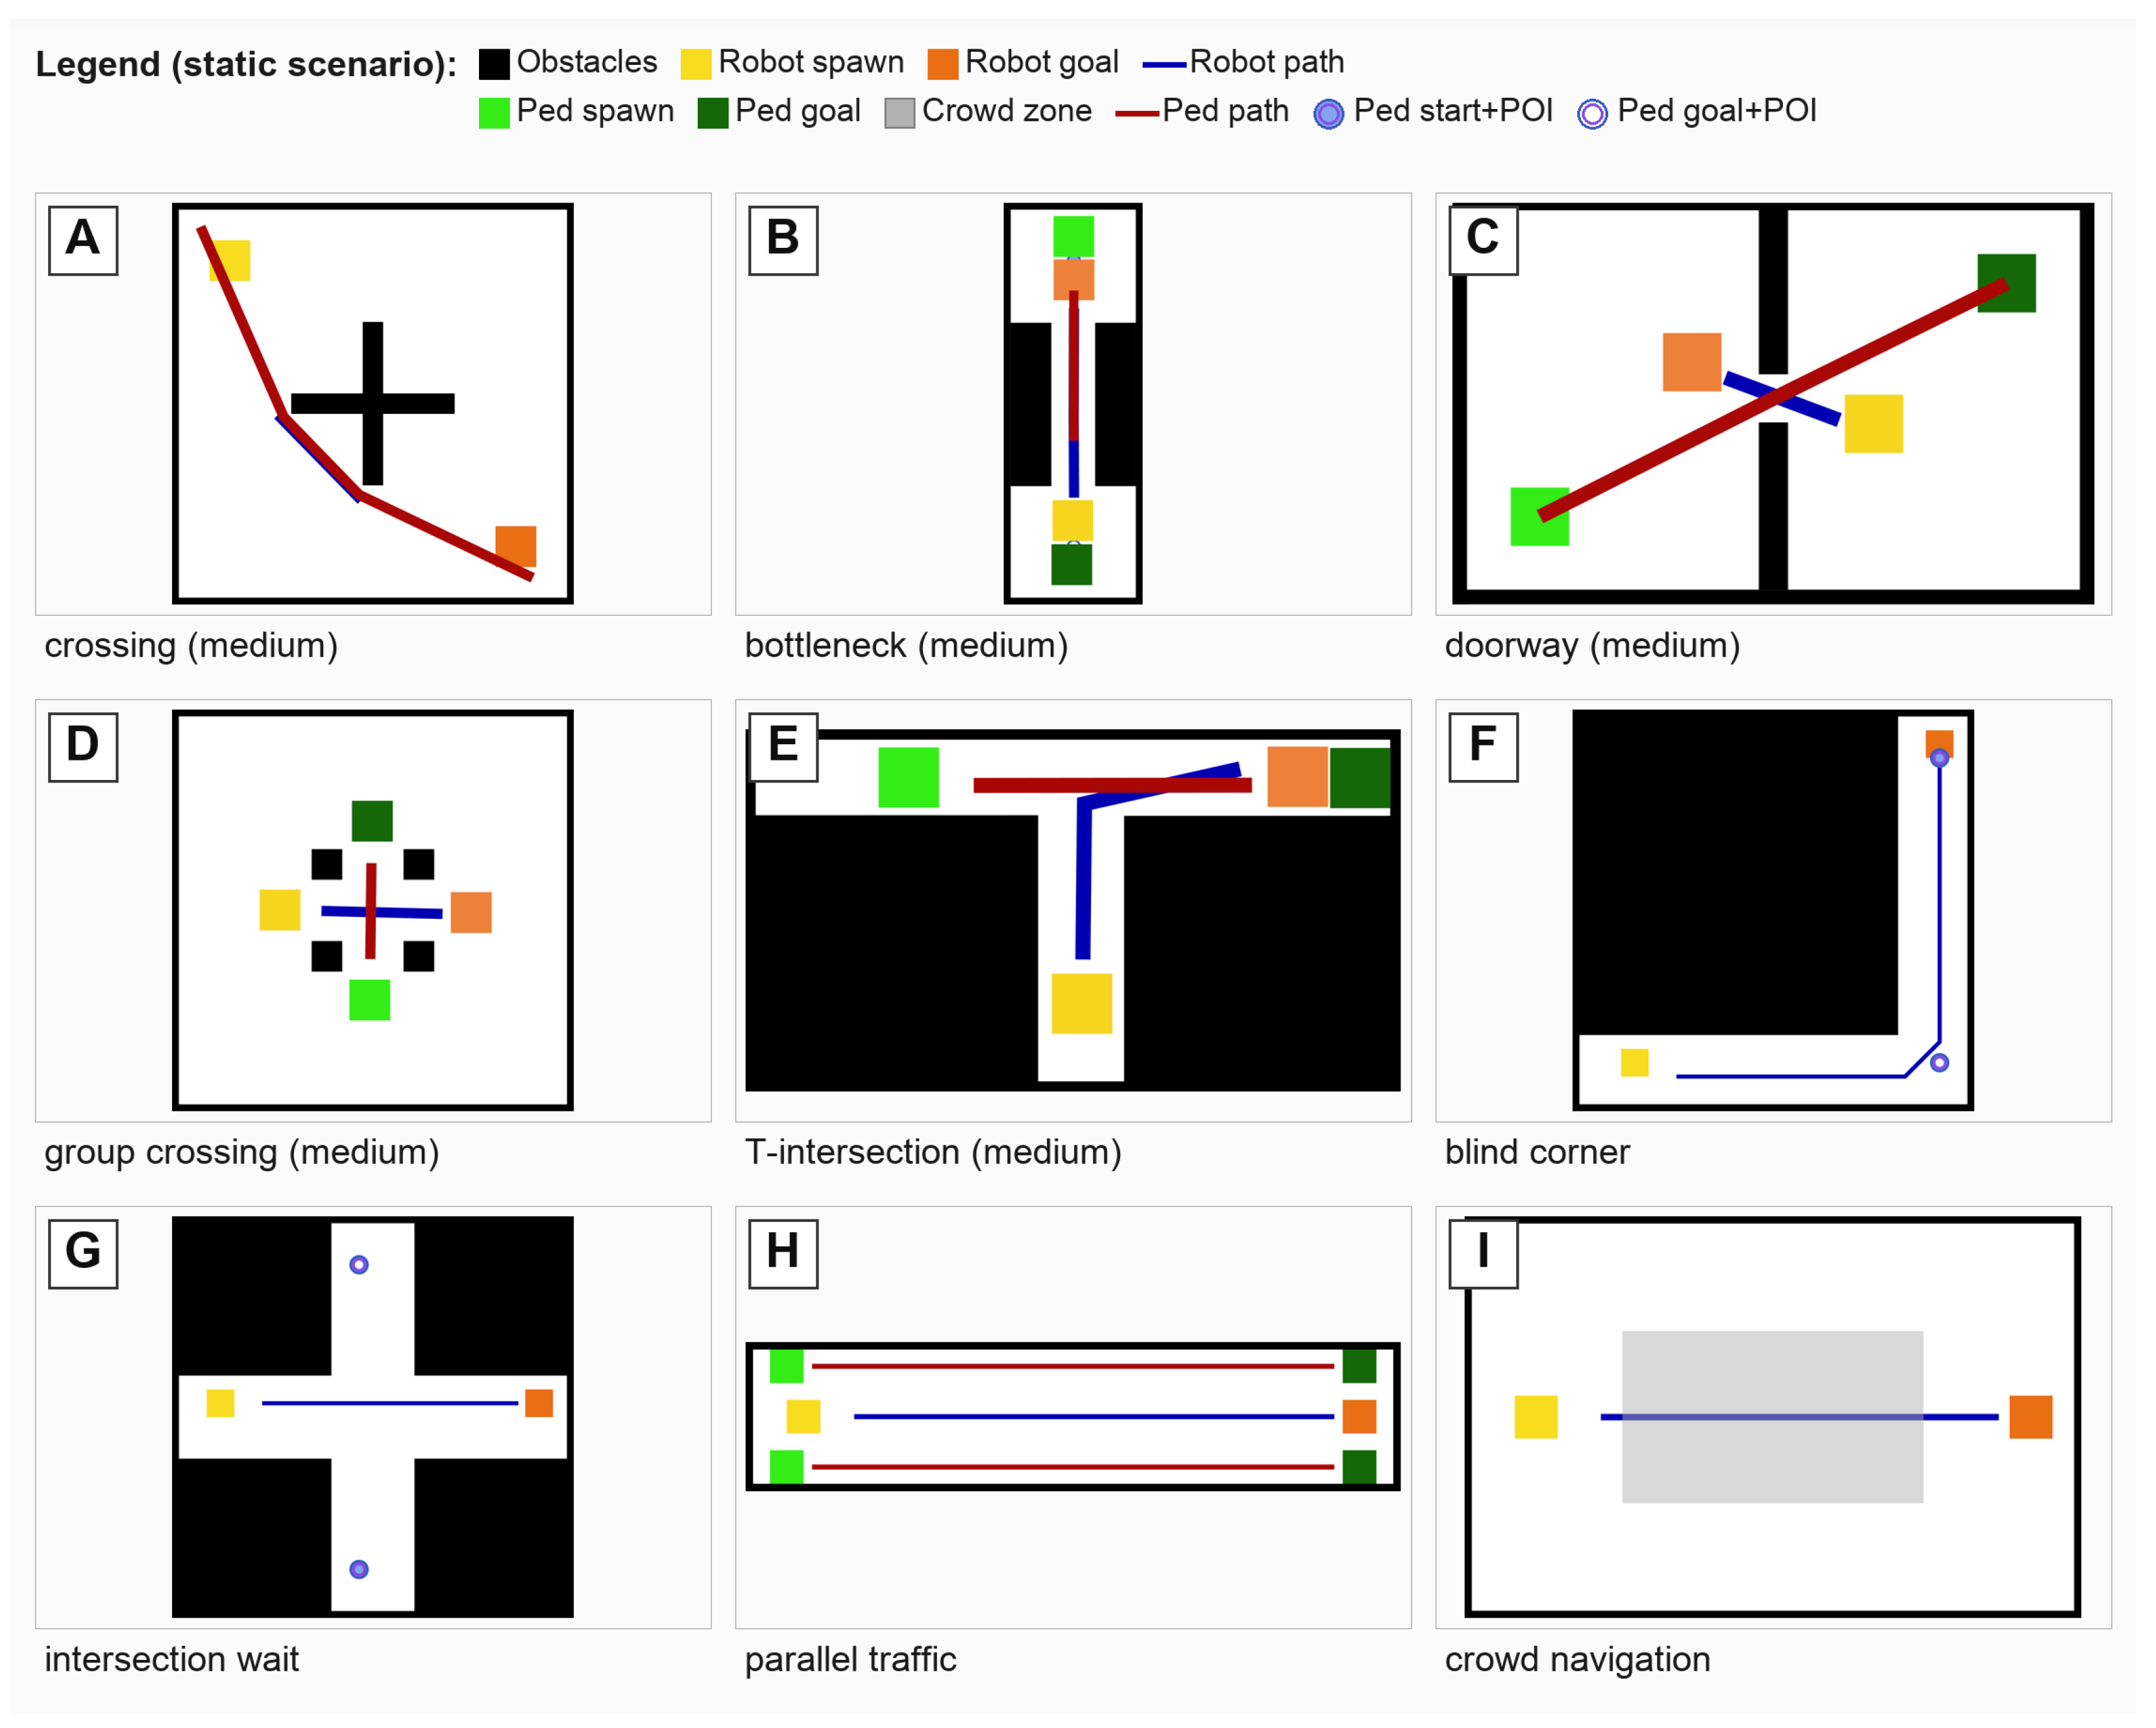
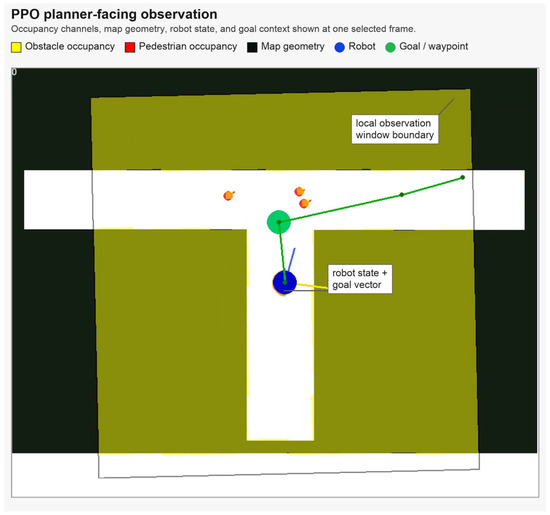
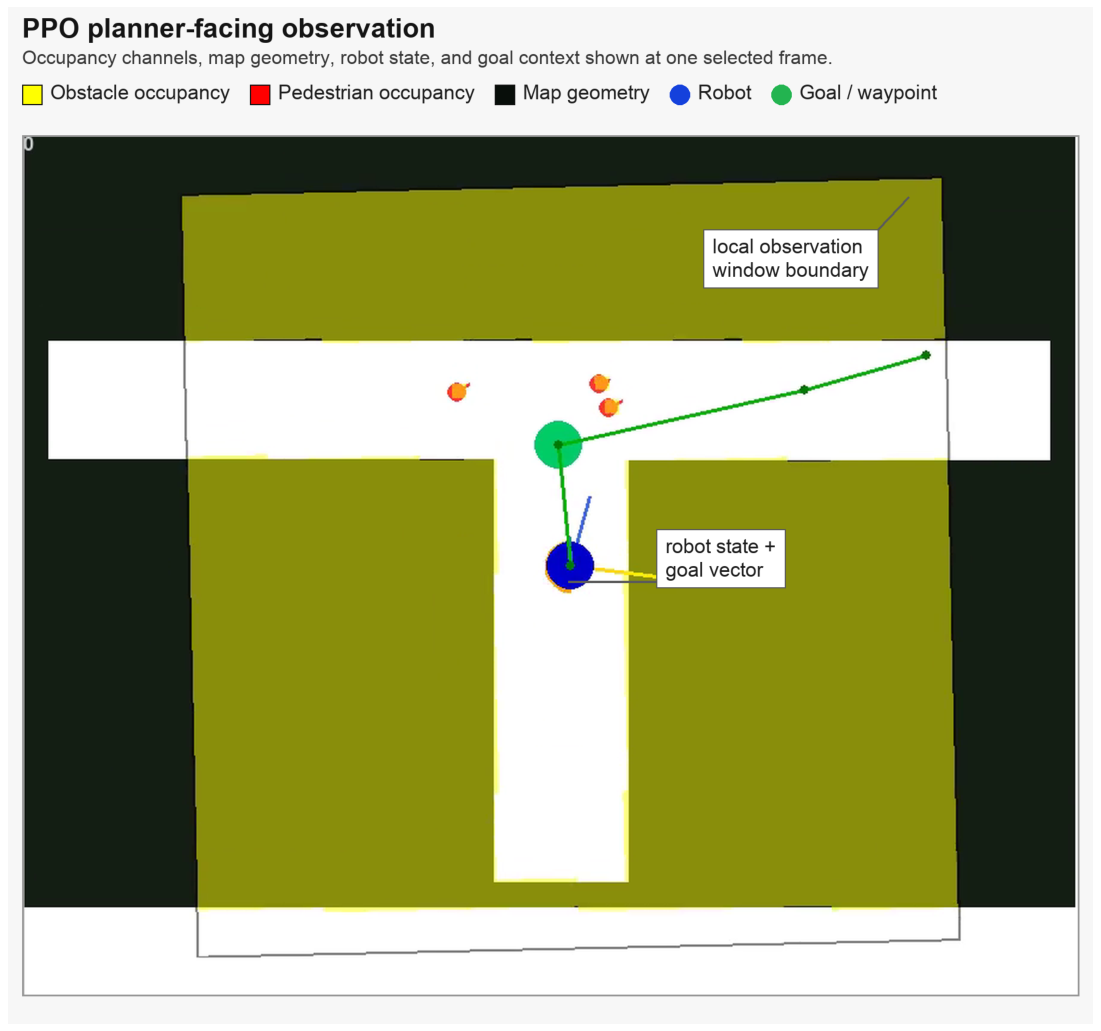
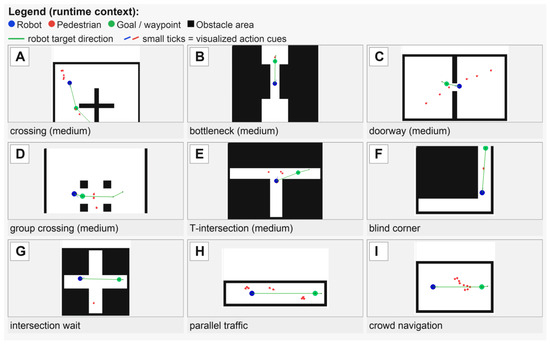
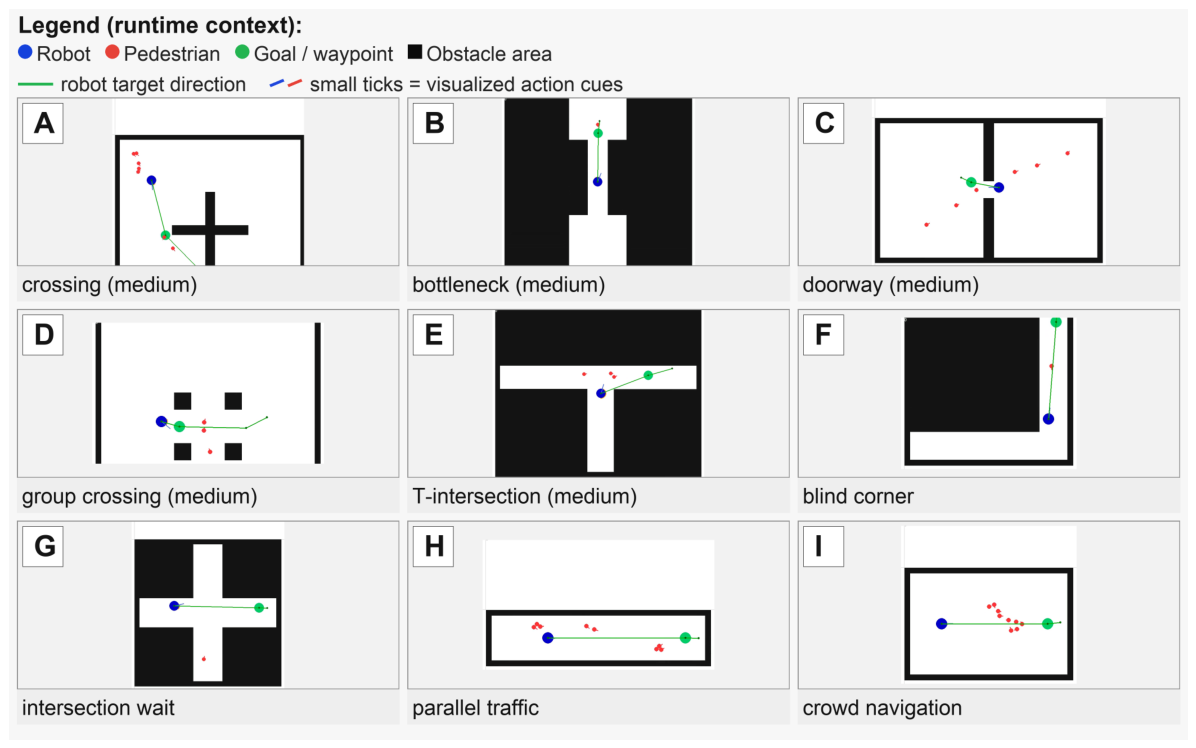
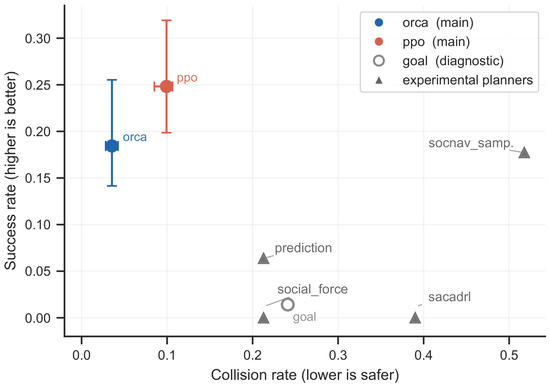
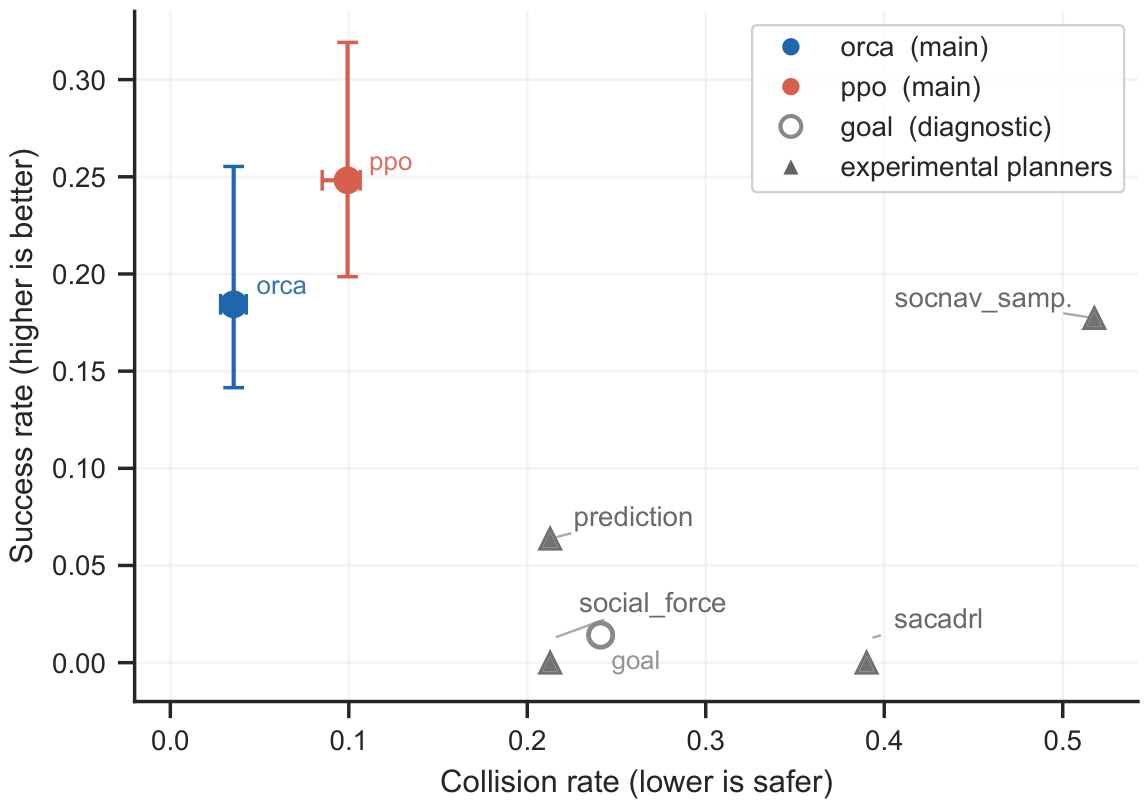

Disclaimer/Publisher’s Note: The statements, opinions and data contained in all publications are solely those of the individual author(s) and contributor(s) and not of MDPI and/or the editor(s). MDPI and/or the editor(s) disclaim responsibility for any injury to people or property resulting from any ideas, methods, instructions or products referred to in the content. |
© 2026 by the authors. Licensee MDPI, Basel, Switzerland. This article is an open access article distributed under the terms and conditions of the Creative Commons Attribution (CC BY) license.