


Abstract
Background: Breast imaging ends in a management decision, from routine return to biopsy, yet most models are evaluated by accuracy alone and say nothing about when they may be wrong. We present a trust-aware multimodal model that reads paired mammography and ultrasound, recommends one of three BI-RADS-derived management actions, and returns to the radiologist the cases it cannot call. Methods: Two foundation encoders are adapted with low-rank adapters and combined by a mask-aware fusion head. A trustworthiness layer adds calibration, conformal prediction sets, selective deferral, and an atypicality flag. We evaluated our method on the Breast Cancer Multimodal Imaging Dataset (BCMID), comprising 332 cases from 323 patients at a single centre. The reference standard is a three-class management grouping we derive from the reporting radiologist’s BI-RADS assessment, so performance is in concordance with that derived label rather than with pathology, observed patient management or longitudinal clinical outcome. Results: Macro AUROC was 0.759 and balanced accuracy was 0.556. Isotonic calibration reduced calibration error from 0.088 to 0.052, and prediction sets reached an empirical coverage of 0.934 at a mean set size of 2.32. Deferring the least confident 30% by a retrospective ranking of the pooled cohort raised balanced accuracy to 0.631. Two of 63 positive-management cases were under-triaged and 15 routed to additional imaging, with a recall of 0.730; freezing the encoders left macro AUROC at 0.756 but raised the under-triage count to twelve. Conclusions: Error rate and error direction are separable properties, and neither accuracy nor macro AUROC records the direction. The system therefore pairs each recommendation with calibrated probabilities, a conformal set of plausible actions and an explicit defer option, so uncertain cases return to the radiologist. These results establish an internally validated operating profile for radiologist-facing support; clinical safety, deployment readiness and benefit to patients still require external and prospective evaluation.
1. Introduction
Medical artificial intelligence has advanced quickly in accuracy, yet adoption at the point of care is limited by trust, not accuracy. Most models return only a prediction, with no calibrated sense of how likely it is to be right, no principled measure of uncertainty, and no signal of when a case should be handed back to a clinician. Modern neural networks can be substantially miscalibrated, although how badly depends on the architecture and the training recipe [1,2]; post hoc methods can reduce the mismatch [3]. A model that is accurate on average but silent about its own reliability is therefore difficult to deploy responsibly, and consensus guidance now treats trustworthiness, not accuracy alone, as the central requirement for clinical AI [4].
Trustworthy AI names a set of properties a model should expose rather than a single accuracy figure. The FUTURE-AI consensus sets fairness, universality, traceability, usability, robustness, and explainability as guiding principles [4], and a growing statistical toolbox makes several of them operational. Conformal prediction converts any predictor into a set-valued output, returning a set of plausible labels rather than one, with a finite-sample, distribution-free coverage guarantee under exchangeability [5,6]. Several variants trade set size for stronger conditional or per-class coverage, or for control of a chosen risk [7,8,9,10,11], and Mondrian conformal prediction has been used to flag uncertain radiologic cases for review [12]. Selective prediction lets a model defer selected inputs to an expert [13,14,15]. Calibration makes the probabilities reported to the reader interpretable, while selective deferral can rank on a separate uncertainty score; in our implementation, that score is the raw ensemble margin.
Together, these components turn a black-box predictor into one that exposes its uncertainty and failure modes and knows when to defer, which is what radiologist-facing evaluations ask for: local validation, clear role definition, reproducibility, robust evidentiary standards, and user trust [16,17]. Assurance then becomes a recurring, local process rather than a one-time external check [18], and a large real-world screening deployment reported higher cancer detection in a workflow that routed selected high-risk examinations to additional radiologist review [19]. What is still rare is a single system that carries these ingredients through end-to-end, with a defined and auditable per-case behaviour and an architecture that still forms a prediction when one modality is absent.
- Breast imaging management as a case study. We study these questions in a decision where trust matters acutely. Among women, breast cancer is diagnosed more often than any other cancer worldwide [20], and recent United States statistics document a substantial burden of the disease [21]. Detection rests mainly on mammography, with ultrasound used as supplemental imaging, particularly in women with dense breasts [22]. A standard mammogram comprises up to four views, the craniocaudal and mediolateral-oblique projections of each breast, so a finding can be confirmed across projections, and the ultrasound is captured as a short sweep of frames over the lesion. From the paired read, the radiologist records a Breast Imaging Reporting and Data System (BI-RADS) assessment category and, with it, a management recommendation: routine return, short-interval or additional imaging, or biopsy [23,24]. It is this recommendation, not the description, that sets the next step in care, and its costly error is under-triage, returning a case whose reference calls for biopsy or definitive management to routine surveillance [23,25]. That class and the indeterminate one are also the rarest, so accuracy alone is not the obstacle at this point of care. Breast imaging management is thus a natural, high-stakes case study for trustworthy AI. Figure 1 frames the task: a recommendation that arrives with a calibrated probability, a prediction set of plausible actions at a stated coverage level, and a choice to act or defer.
- Breast imaging AI and multimodal fusion. A substantial body of mammography deep-learning work is single-modality [26], and the large public benchmarks are themselves modality-specific [27,28]. Because a radiologist reads mammography and ultrasound together, a growing line of work fuses the two for malignancy prediction [29,30,31,32,33]. Recent paired same-patient studies are sizeable and clinically framed. A dual-centre fusion network built on 1283 women improved radiologists’ diagnostic performance on its external test set, especially when the ultrasound and mammography BI-RADS reads disagreed, and reduced their unnecessary biopsy recommendations [32]. A multimodal screening model on 790 patients improves specificity over single-modality baselines [33]. A related system, TDF-Net, handles incomplete multimodal ultrasound by recovering the missing modality and weighting the modality evidence [34]. These systems target the benign versus malignant diagnosis rather than the three-way management recommendation, and they do not report calibration or conformal coverage for the recommendation itself.
- Foundation models and adaptation. Foundation models now provide rich breast imaging features: mammography-specific models [35,36], the universal ultrasound model USFM [37], and the medical image encoder MedSigLIP [38]. Low-rank adaptation fine-tunes such encoders at low parameter cost [39], and in a chest-radiography evaluation, low-rank tuning outperformed full-parameter fine-tuning on 13 of 18 transfer tasks while updating a small fraction of the parameters [40]. To our knowledge, these encoders have not been combined into a trust-aware multimodal system for the management decision.
- Report circularity and shortcut risks. Two data risks specific to this setting also shape the design. First, a report that states the radiologist’s own assessment makes report-based prediction circular. Second, ultrasound images can contain sonographer callipers and text overlays [41], visible annotations that are potential shortcut features. Saliency alone does not rule this out [42,43], so we include a controlled occlusion audit to test it directly.
- This work. These threads have rarely been brought together for the decision that matters. The management recommendation is seldom the prediction target, same-patient paired datasets are scarce, and trust mechanisms are rarely combined with mask-aware multimodal fusion. We bring them together in a trust-aware multimodal system for the BI-RADS management recommendation. Two foundation encoders, one for mammography and one for ultrasound, are adapted end-to-end with low-rank adapters [39] and combined by a mask-aware fusion head that can be scored with either modality masked. A trustworthiness layer then wraps the prediction with calibrated probabilities, conformal sets, a deferral rule, and an atypicality flag. We evaluate at the safety-critical error rather than by accuracy alone, and that choice turns out to carry the paper. Changing whether the encoders are adapted moves macro AUROC by 0.003 but changes the number of positive-management cases sent to routine return from 12 to 2. The two models are separated by significance tests pointing in opposite directions: the frozen one is significantly more accurate at the operating point; the adapted one is significantly better on that error, on the same cohort. Overall error rate, discrimination and error direction are distinct properties; macro area under the receiver operating characteristic curve (AUROC), the ranking metric the field leads with, measures discrimination and does not record the direction of the thresholded errors at the operating point.
Figure 1.
Overview of the proposed trust-aware multimodal system for BI-RADS-derived management.
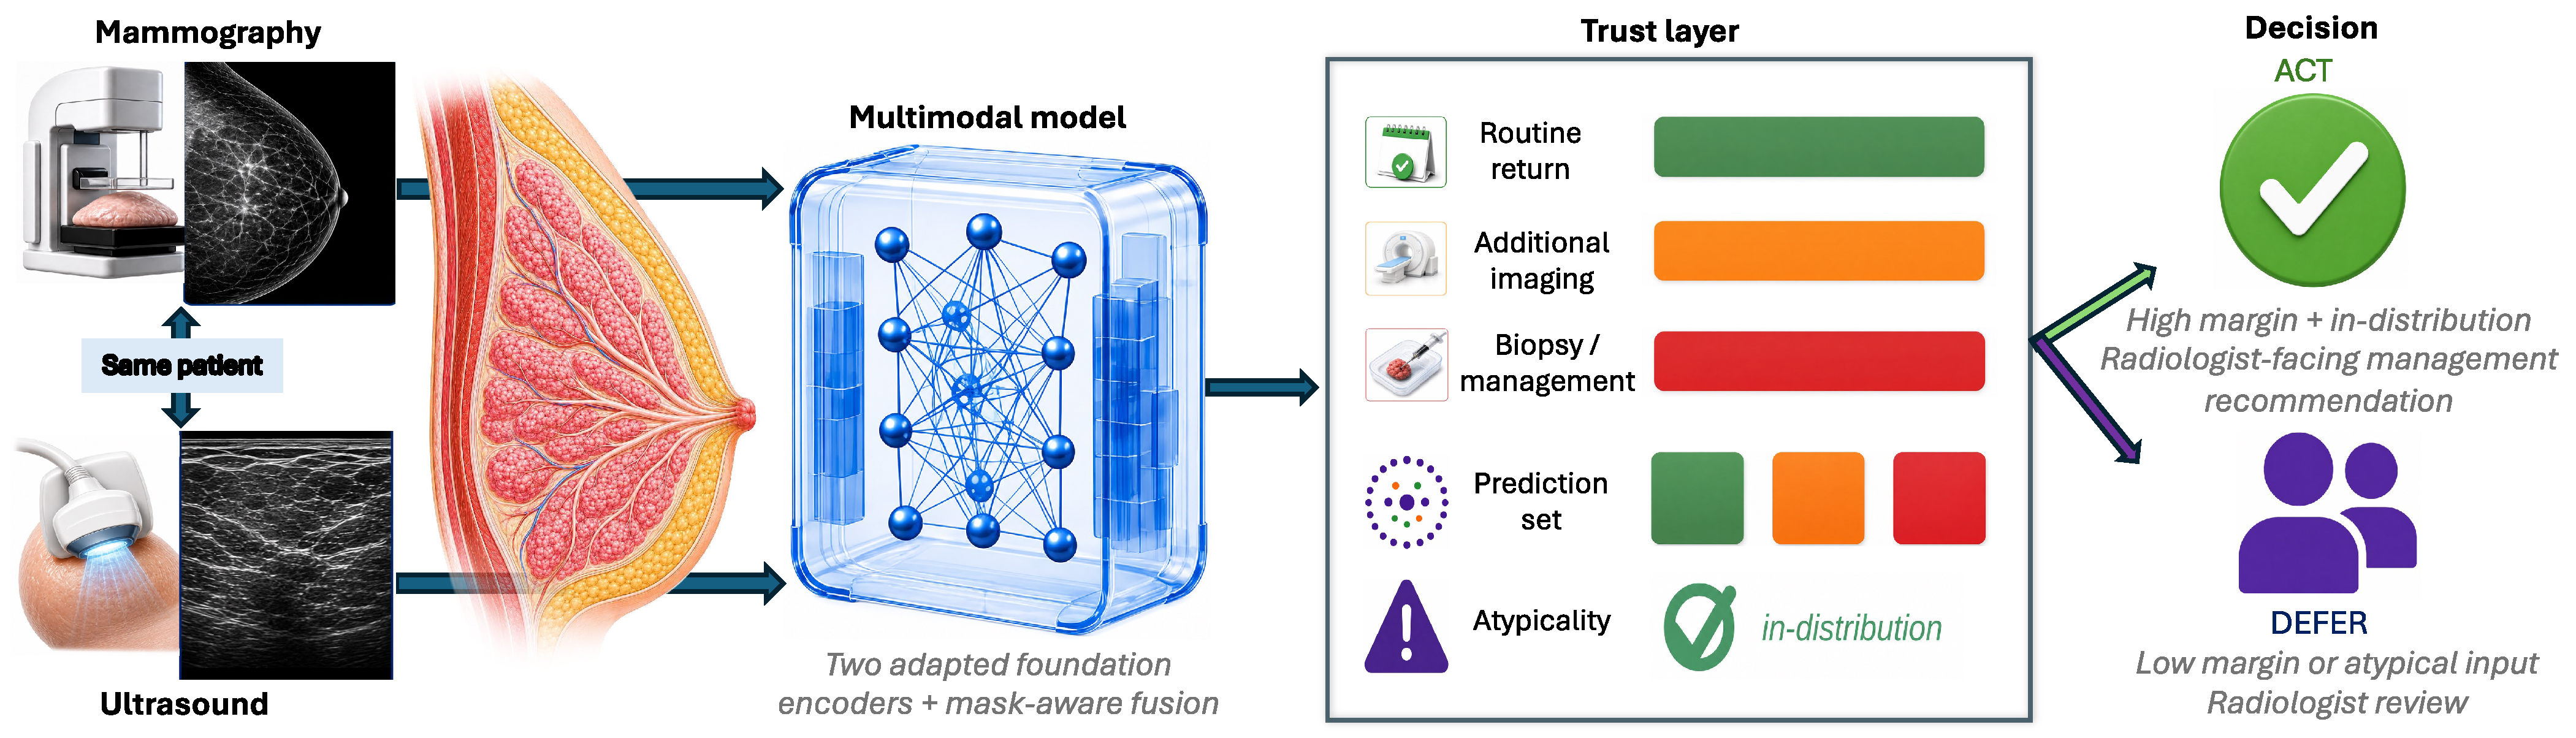
Two features of this decision shape what a model for it must provide. The first is that its costs are asymmetric and the rare classes carry them. An under-triaged case may have a recommended workup delayed; a benign case sent for further imaging costs an examination. A model trained and selected on overall accuracy tends to optimise the common class and absorb its losses in the rare one, which is the reverse of the clinical priority.
The second is that the reading itself is uncertain, and the model inherits that uncertainty. Scarring and architectural distortion after surgery can mimic malignancy on a mammogram [44]. Dense tissue lowers mammographic sensitivity, motivating supplemental ultrasound in selected settings [22]. And ultrasound is operator-dependent: its acquisition and annotation vary with the sonographer, and the callipers and text written onto the image are part of what the model sees [41]. What a reader needs alongside the recommendation is therefore some indication of which of these situations a case falls into, and of how far the recommendation can be relied upon.
The property that matters at this point of care is therefore not how often the model is right but where it is likely to be wrong, and in which direction. That property is invisible to aggregate discrimination metrics when reported alone; it becomes visible when error direction, calibration, coverage and deferral are measured together at a single operating point. The argument does not depend on a high absolute level of discrimination; the discrimination observed in this cohort is modest, and its uncertainty is reported explicitly.
2. Materials and Methods
2.1. Study Design
The model is developed and evaluated within a single retrospective cohort, and we report it as a development and internal validation study following TRIPOD+AI [45]. We set the design out here because it governs how the results should be read.
The unit of analysis is the case, one paired mammography and ultrasound examination. The unit of grouping for every split is the patient. The reference standard is a three-class management grouping we derive from the reporting radiologist’s BI-RADS assessment, so the estimand throughout is in concordance with that derived label rather than diagnostic accuracy against pathology, observed patient management or clinical outcome.
The primary outcome is the number of under-triaged positive-management cases, that is, positive cases routed to routine return. Discrimination, calibration, conformal coverage and set size, concordance with the BI-RADS-derived reference class, and behaviour under deferral are secondary outcomes. All are reported at one operating point, so that they can be read against one another rather than each at its own best setting.
The cohort is a fixed public release rather than a recruited series, so no a priori sample-size calculation was performed; every eligible case in the release is included, and the resulting size bounds the precision of every estimate reported here. Three comparisons are designated as confirmatory (Section 2.5) and the remainder are exploratory. Model selection, decision thresholds, calibration maps, and conformal quantiles are fitted on inner-validation folds only.
2.2. Cohort and Task
The Breast Cancer Multimodal Imaging Dataset (BCMID) [46], collected at one hospital in Alexandria, Egypt, releases 332 case records, each in its own folder named by case identifier and holding a paired mammography and ultrasound examination. These records resolve to 323 distinct patients, nine of whom carry two case records each. The case is the unit of analysis and the patient the unit of grouping, and we hold that distinction throughout.
The report-derived treatment-status audit identified many post-treatment follow-up examinations, a setting in which surgical scarring and architectural distortion can make mammographic appearance harder to interpret than in screening [44]. Figure 2A summarises the composition, an imbalanced split with a rare positive class, and Figure 2B the patient-grouped, patient-disjoint nested cross-validation used throughout.
Figure 2.
Cohort composition and validation design. (A) The cohort partitioned by management, treatment, and acquisition polarity. (B) The patient-grouped, patient-disjoint nested cross-validation used throughout, in which each inner split fits the decision thresholds and the calibration and conformal maps.
Each case carries one paired mammography and ultrasound study and one management class (Section 2.3); we do not merge or recompute labels across cases. Mammography follows up to four canonical views (craniocaudal and mediolateral oblique per breast). The cohort holds 951 mammography images and 1050 ultrasound frames, with per-case counts varying widely. The model masks any absent view and aggregates the available ultrasound frames, so a case with fewer images is still scored without imputation. Laterality is recorded per study, and an era is taken from the year suffix in the case identifier; both are used in the subgroup audits. Polarity, predominantly the inverted Fuji convention, is recorded to drive the preprocessing correction. Treatment status is unavailable for twelve cases: eleven have no radiology report, and one report did not parse. The report itself is never a predictive input, since it states the assessment the label is derived from (Section 2.7).
To our knowledge, BCMID is the only public collection that pairs mammography and ultrasound for every case and carries a BI-RADS label mappable to the three-way management decision. Other public datasets fall short in one of two ways. They are either single-modality, as with the mammography collections CBIS-DDSM [47], INbreast [48] and EMBED [49], and the ultrasound collection BUSI [50], or only partly paired, as with KAU-BCMD, which adds ultrasound for a subset of its mammography cases [51]. The larger same-patient paired cohorts that do exist sit inside individual institutions and are labelled for benign-versus-malignant diagnosis rather than for a management class [32,33].
- Dataset challenges. Two properties of the source data could bias an unguarded model and are handled explicitly. First, the mammography frames follow two display-polarity conventions, a dominant inverted Fuji convention and a minority standard one. Leaving the inversion uncorrected would be a trivial spurious feature (Figure 3a). Second, the sonographer marks noted above are neither removed at training time nor assumed harmless; we test their influence directly with the controlled occlusion audit in Section 3.7. More broadly, the cohort is left unmodified as a deliberately difficult test of robustness. Most of these breasts are post-surgical, two display-polarity conventions are present, the sonographer marks are retained, and the number of views and frames varies from case to case. We treat that heterogeneity as the operating condition the method must handle rather than curating it away.Figure 3. Mammography polarity conventions on de-identified BCMID examples. Left pair (a,b): the dominant inverted Fuji convention; right pair (c,d): the minority standard one. Within each pair the raw frame is left and the normalised frame right (amber inset enlarged), giving a consistent display polarity before training.
Mammography preprocessing follows standard steps (acquisition-border removal, polarity correction, CLAHE contrast normalisation, and resizing). Ultrasound frames are padded and resized, and otherwise left as acquired. No lesion mask, report text, or BI-RADS category enters any preprocessing step, and sonographer annotations are audited rather than removed (Section 3.7).
2.3. From BI-RADS Category to Management Class
The reference target is a management class derived from the reporting radiologist’s BI-RADS assessment [23,24]. The dataset supplies no management class, so the three-way grouping into management classes is our own. We model these classes rather than the seven BI-RADS categories because the management action is what determines the next step in care, and because the per-category counts are too small and too unevenly distributed for a reliable seven-way model at this cohort size. Negative covers categories 1 and 2 (routine return). Indeterminate covers categories 0 and 3 (additional imaging or short-interval follow-up). We group these two because both call for non-routine management rather than immediate routine return or biopsy, and we keep each case’s original BI-RADS category so the grouping stays auditable. Positive covers categories 4 to 6 (biopsy or definitive management). Category 6 is a known malignancy already under management rather than a new biopsy recommendation, so the positive-management under-triage results are also audited by the original category. Neither grouping is beyond dispute. Categories 0 and 3 differ in kind, an incomplete workup against a completed workup with a low-risk finding. We group them because both remove a case from routine return without committing it to biopsy, which is the only distinction the three management classes are built to carry. Category 6 raises the opposite objection, that those cases are already-diagnosed malignancies and could make the positive class easier than the clinical decision it is meant to stand for, which would flatter the under-triage result specifically. Both choices are therefore tested rather than assumed. Section 3.8 reports the routing under the nearest alternative boundary, and repeats the under-triage analysis on the 39 positive cases that represent a new biopsy decision with the 24 category 6 cases removed; the under-triage result holds there, so it is not an artefact of the already-diagnosed cases. Routine return therefore denotes routine surveillance imaging rather than a screening interval. As the target comes from the radiologist’s assessment, the task is in concordance with that reference rather than a pathology diagnosis.
2.4. Architecture
The predictive model is multimodal, with two imaging encoders and a mask-aware fusion head (Figure 4). Training such encoders from scratch is not viable at this cohort size, so we start from foundation models and adapt them with low-rank adapters. The baseline ladder in Section 3 reports what each of these two steps contributes.
Figure 4.
Multimodal model (a) and per-case trustworthiness layer (b). Paired mammography and ultrasound feed two LoRA-adapted foundation encoders and a mask-aware fusion head. The trustworthiness layer then wraps the raw prediction with calibration, a conformal set of plausible actions, a defer-or-act decision and an atypical-input flag, ending in a per-case evidence card. Act means the case stays in the standard radiologist workflow.
- Mammography and ultrasound encoders. The mammography encoder is a breast-specific foundation model with an EfficientNet-B5 backbone [35], chosen because such models are pretrained on large mammography collections and transfer well to small downstream cohorts [35,36]. The up to four standard views for a case are encoded and pooled to a single embedding .
The ultrasound encoder is the MedSigLIP-448 medical image encoder, released as part of the MedGemma effort [38], a vision transformer in the sigmoid contrastive family [52]. The two modalities deliberately use different encoder families, each matched to what is mature for that modality. Mammography has a dedicated foundation model pretrained on large mammography collections, so we adopt it as the mammography backbone, adapted end-to-end with low-rank adapters. For ultrasound we prefer a broad medical encoder over an ultrasound-specific model such as USFM [37], for its wide pretraining and for a preprocessing interface that is fixed and reproducible. Each of the up to sixteen ultrasound frames for a case is encoded and reduced to a per-frame embedding by taking the first vision token of the sequence, our choice of pooling rather than a property of the released encoder. The frame embeddings are then mean-pooled into a single ultrasound embedding . Mean pooling is a deliberate, conservative choice. Frame weighting would have to be learned from this cohort, so we keep the pooling fixed rather than add parameters a cohort of this size cannot support. Because each view and frame is encoded independently and averaged, the model accepts any number of views or frames with no architectural change, and the masked average keeps batching zero-padding out of the pooled embedding. Within each pretrained encoder only the low-rank adapter parameters are trained and the backbone stays fixed, which retains the original representation while still allowing task-specific adjustment; the modality projections, the fusion module and the classification head are trained jointly with the adapters. Throughout, “adapted end-to-end” means gradients reach both encoders and the fusion head through these adapters, not full backbone fine-tuning.
- Low-rank adaptation. Fully fine-tuning either backbone would risk overfitting at this sample size, so each adapted weight matrix is replaced by the frozen weight plus a small trainable low-rank update [39,40],where only the rank 16 factors A and B are trained, with a fixed scaling , so . The same rank is used in every run. This is the single change that unfreezes the representation relative to the frozen-encoder baseline, and it keeps the trainable-parameter count low relative to the available training data.
- Mask-aware fusion. Each embedding is first mapped into a common space, and the two are then merged by a mask-aware average. Writing for the availability bit of modality m and for its projection,and a linear classification head maps f to the three management logits (Figure 5). The averaging form drops an absent modality from both the numerator and the denominator, so the head can still form a fused vector from a single modality.Figure 5. Mask-aware fusion. Present-modality projections are averaged, and a masked modality drops out, so the head still receives a same-scale fused vector.
2.5. Training and Evaluation
The two encoders and the fusion head are trained together with a class-balanced focal objective [53,54],
Here, is the model’s probability for class c. The weights come from the effective-number class-balancing scheme (), with the class counts taken from each fold’s inner-training split alone, a close proxy for inverse-prevalence weighting that stops the rare positive class from being overwhelmed by the negative majority. The focusing parameter down-weights easy examples. Training batches are additionally drawn with a class-balanced sampler. Both modalities are present for every case, and we do not use modality dropout. A masked-modality input at test time therefore falls outside the training distribution.
Evaluation uses five-fold patient-grouped, patient-disjoint cross-validation, with a fixed inner-validation split in each fold for early stopping and for fitting the calibration and conformal maps. The procedure is repeated for three random initialisations, giving fifteen trained models (Figure 2B). Training uses AdamW (learning rate , weight decay 0.01) with cosine annealing and early stopping on the inner-validation macro AUROC. We report the spread across these runs rather than a single number because it characterises model stability across random initialisation. The primary operating rule throughout is the three-initialisation ensemble argmax, and all headline classification and under-triage results use it. We report the raw argmax rather than the better-scoring alternatives because the deferral ranking and the under-triage count are both defined on it, and those calibrations reach their agreement by transforming the score distribution that the ranking depends on. Per-class threshold optimisation on the inner-validation fold is reported as one of the calibration-strategy comparisons. Its per-class multiplicative weights are fit per fold on the inner-validation split, never on pooled validation that would overlap the test cohort.
Throughout, we lean on trust-relevant metrics rather than overall accuracy. Macro AUROC captures how well the three classes are ranked, where 1.0 is perfect and 0.5 is chance. Balanced accuracy averages the per-class recall, so the rare positive class is not swamped by the negative majority; on three classes, its chance level is one third. The expected calibration error measures whether a stated probability matches how often the prediction agrees with the reference class. Conformal coverage is how often the prediction set contains that reference class.
- Evaluation protocol and integrity. The protocol is built so that a patient cannot appear on both sides of a split. Writing for the patient who contributed case c, every split is grouped on rather than on c. For each outer fold k, with training and test cases and ,so the nine patients who contributed two cases have both of their cases in the same fold. Two guards enforce this every time a split is built. The first evaluates Equation (4) on patient identifiers at the outer and the inner level and raises an error on any overlap. The second checks that the five outer test sets partition the 332 cases, so each case is tested exactly once. Each fold is trained from a freshly initialised model, so no fold begins from weights that have already seen its own test cases. Every fitted quantity, meaning the decision thresholds, the isotonic map, and the conformal threshold, is fit on that fold’s inner-validation split and applied only to its held-out test, never on a pooled set that would overlap it. The nearest-neighbour explanation retrieves only from the training cases of the same fold, so a case cannot retrieve another case of the same patient. The 30% deferral point is obtained by ranking the held-out cohort, so we report it as a retrospective analysis rather than a deployed threshold.
Differences in AUROC are read from the cluster-bootstrap intervals, and paired predictions use McNemar’s test. Confidence intervals come from a cluster bootstrap that resamples patients rather than cases (ten thousand resamples), so that a patient’s two cases are drawn together, and agreement with the reference is a linearly weighted Cohen’s kappa. Only the three confirmatory comparisons carry a Holm correction: the incremental value of ultrasound (paired against mammography-only), the ensemble gain measured against the best single initialisation, and the selective-deferral gain. Their effects and p-values come from the same patient-cluster bootstrap, via its normal approximation. The subgroup, decision-curve, boundary, uncertainty, and additional under-triage comparisons are exploratory. We designate these three as the confirmatory set, correct them jointly with the Holm procedure, and report each as it comes out, including the one that fails.
2.6. Trustworthiness Layer
The trustworthiness layer leaves the trained model unchanged. For each outer fold, the calibrator and the conformal threshold are fitted on that fold’s inner-validation predictions and applied once to its untouched test cases. The margin threshold for the fold-wise deferral analysis is set the same way, and the atypicality centroid and its 95th-percentile distance threshold are computed from the fold’s training embeddings. Out-of-fold test predictions are pooled only afterwards for evaluation, and the 30% pooled deferral sweep is explicitly retrospective. It uses those outputs and the cached embeddings (Figure 4b). Its starting point is the model’s raw per-case class probabilities, averaged over the three initialisations so that no single run dominates. On these it layers four individually established components, reported as complementary components: calibration, conformal prediction sets, selective deferral, and an atypicality flag.
Per-class isotonic regression (a monotonic recalibration) is applied to these ensemble probabilities, and the three per-class outputs are renormalised to sum to one. The calibrated probabilities are what the system reports. They are not, however, what the deferral rule ranks on, and the two are kept deliberately separate for a reason given with the result in Section 3.3. We summarise calibration with the expected calibration error
computed over 15 equal-width probability bins, the average gap between confidence and accuracy across equal-width probability bins on the held-out test predictions. We also report the multiclass Brier score, which does not depend on binning. Conformal prediction builds prediction sets with the least-ambiguous set-valued classifier (LAC) score. We chose it over the adaptive prediction set score, which over-covered: on this three-class problem it produced near-complete sets (coverage 1.0 at a mean set size of 2.99) and was therefore uninformative. Using a nonconformity score and a threshold equal to the th smallest nonconformity score, the prediction set is
which targets marginal coverage of under exchangeability of the calibration and test scores. We do not take that exchangeability as exact, because the same inner split is reused for early stopping and for fitting the calibration and conformal thresholds. We therefore report the empirical marginal coverage achieved under our protocol rather than a formal finite-sample guarantee and cite cross-validation-based predictive inference [55] only as related methodological context. We use conformal prediction because, under standard exchangeability conditions, it provides a finite-sample coverage framework that approximate Bayesian and Monte Carlo dropout uncertainty do not. The class-conditional Mondrian variant applies the threshold within each class stratum to balance per-class coverage. Because these thresholds come from small class strata, we report it as an empirical class-coverage audit. We also report the conformal set’s retention of the positive-management label directly, as a clinically relevant property, rather than running a separate conformal risk control procedure. Selective prediction ranks cases by the margin between the two largest raw ensemble probabilities and defers the least confident fraction to the radiologist. Ranking on the calibrated probabilities instead gains nothing, for the reason we give with the result (Section 3.3); the two scores serve different purposes, and we do not force one to do both jobs. The atypicality flag comes last. It marks cases whose fused embedding falls far from the training distribution, measured as the Euclidean distance to the centroid of the training embeddings. A held-out case is flagged when this distance exceeds the 95th percentile of the training-set distances. Table 1 summarises the cumulative effect of the calibration, conformal, and deferral stages.
Table 1.
The base prediction and the trustworthiness layer, stage by stage; each row adds a property the previous one lacks.
2.7. Report Exclusion
- Why the report is not a predictive input. The purpose of the model is to recommend a management action from the imaging itself, so the reference label must come from a source the model cannot read. The label is derived from the reporting radiologist’s BI-RADS assessment, which the report states directly: radiology reports can be mined for structured information [56]: a BI-RADS category can be inferred from the findings alone [57], and the written score extracted directly [58]. A model that reads the report would therefore recover the label rather than predict it from the image, a direct form of target leakage [59]. The report is excluded from the model’s inputs entirely, and every prediction is made from the paired mammography and ultrasound alone.
2.8. Interpretability
The primary explanation is case-based retrieval, following the case- and prototype-based tradition [60,61]. For each test case, we return its five nearest neighbours in the fused embedding space, with their management classes. The neighbours are drawn only from the training cases of the same outer fold, so a case can retrieve neither itself nor the other case of the same patient. This presents comparable prior cases in the learned embedding space; it does not identify the examples that caused the prediction. Visual saliency is a secondary check. A last-layer class-activation map would be degenerate here, because the ultrasound encoder pools only the first transformer token. We therefore attribute with Integrated Gradients [62] on the ultrasound input, smoothed over noisy copies of that input. The sonographer-annotation shortcut is tested separately, with the controlled occlusion audit of Section 3.7.
3. Results
What follows establishes an operating profile rather than a single score: how well the three actions are separated, how far the reported probabilities can be trusted, how often the system knows to stand back, and where its errors fall.
The primary outcome is the safety-critical error: of the 63 positive-management cases, two are routed to routine return. Every other figure in this section is reported at the operating point that produces that count, the raw argmax of the three-initialisation ensemble. Where a result carries a cost, the cost is given beside it. The evidence builds in one direction, each result resting on the last. The model discriminates modestly, and the baseline ladder shows where that discrimination comes from. It also shows what macro AUROC does not record: two models whose macro AUROC differs by 0.003 are far apart on the error the task is built around. The probabilities are then calibrated, and the prediction sets cover the reference class. The model defers its least certain cases, and the errors it sets aside first are the ones that matter for safety. Each modality alone is weaker than the pair. Subgroup variation, concordance with the reference class, and illustrative case-level explanations are then examined.
3.1. Discriminative Performance, and What It Does Not Record
We hold the fusion head, classifier, loss, and patient-grouped splits fixed and vary the encoder family (Figure 6C). Replacing a generic ImageNet convolutional encoder with a domain-pretrained foundation encoder held frozen raises macro AUROC from 0.655 to 0.756. Adapting those same encoders end-to-end with low-rank adapters raises it to 0.759. The change of encoder family therefore accounts for almost all of the discrimination, and the adapters add very little to it. That macro figure averages three unequal classes, and the ordering matters for this task: one against rest; the model reaches 0.871 on the positive-management class, 0.755 on routine return, and 0.650 on the indeterminate class. It discriminates best on the class whose error is costly and worst on the class that groups an incomplete workup with a low-risk follow-up.
Figure 6.
Baseline ladder across the encoder families. (A) Positive under-triage, from 63 at the majority floor to two. (B) Positive-management recall. (C) Macro AUROC. (D) Under-triage against macro AUROC.
The adapters do change the model, but not in a way that macro AUROC records. On the error the task is built around, the assignment of a positive-management case to routine return, the three models are far apart: the convolutional baseline under-triages 27 of the 63 positive-management cases, the frozen foundation encoder 12, and the adapted model 2, and recall on that class follows the same order (Figure 6A,B). A difference of 0.003 in macro AUROC thus accompanies a 12-versus-2 gap in the safety-critical error count, and plotting the two quantities against each other separates the models that discrimination alone leaves on top of one another (Figure 6D). Validation guidance has long made this point. A metric chosen for convenience rather than for the clinical question can rank models in an order the clinic would not endorse, and calibration and net-benefit analyses exist precisely because ranking quality alone does not settle whether a model is fit to act on [63,64,65]. This is why the rest of this section is organised around the trustworthiness layer rather than around accuracy.
Ensembling the three initialisations buys something different from a confirmatory discrimination gain. Pooled over the cohort, the individual runs reach 0.709, 0.716 and 0.768, and the ensemble reaches 0.759. That is above the mean initialisation (by 0.028, CI 0.012 to 0.043) and within the spread of the best single run, so we treat the ensemble as insurance rather than as a source of discrimination. The spread across initialisations is 0.059 wide, the best one cannot be picked without the test data, and the ensemble lands near the top of the spread without having to choose. It also fixes one operating point for the trustworthiness layer to be built on.
The two models reach a similar macro AUROC but make errors of a different kind, and the direction is what separates them. The frozen encoder distributes its errors on both sides of the decision boundary. The adapted model concentrates them on one side, escalating routine-return cases to additional imaging, and that is what lowers its overall accuracy, 0.455 against 0.651. It leaves two positive-management cases in routine surveillance rather than twelve. Overall accuracy is the wrong scoreboard for that trade. On this cohort the trivial rule of answering routine return every time scores 0.654, and it returns all 63 positive-management cases to surveillance. A higher accuracy here need not mean a better decision. Neither model matches that rule on accuracy: the frozen encoder falls just below it at 0.651, the adapted model well below at 0.455. Accuracy on a cohort this unbalanced rewards whatever leans hardest on the majority class, and the trivial rule leans on it completely. Error rate and error direction are separate properties of a classifier: accuracy counts how often it is wrong at the operating point and macro AUROC measures how well its scores rank the classes, and neither records which way an error falls. In a management task whose costly error is under-triage [23,25], it is the second that determines whether the model is usable; the class-balanced objective limits the majority-class domination behind it, and the direction of the remaining errors is evaluated explicitly at the operating point.
The trustworthiness layer is then built stage by stage on these ensemble scores (Table 1). Per-class isotonic calibration cuts the expected calibration error from 0.088 to 0.052 and the Brier score from 0.604 to 0.391 (Figure 7A,B). Before calibration the adapted model carries the largest top-label calibration error of the three: 0.088, against 0.083 and 0.063. Calibration is therefore a necessary part of the layer rather than an optional refinement [65]. The reported probabilities depend on it. The conformal sets and the deferral ranking, by contrast, are built on the raw ensemble scores. The sets avoid stacking a fitted probability map onto the conformal score, and the ranking needs the gradations that the isotonic map compresses away (Section 3.3).
Figure 7.
Calibration and empirical conformal coverage. (A) Per-class reliability after isotonic calibration. (B) Top-label calibration error, before and after. (C) Per-class conformal coverage for the marginal and Mondrian sets against the 0.90 target. (D) Prediction-set size composition.
3.2. Empirical Prediction-Set Coverage
A prediction set is useful only if it contains the reference class at the intended rate. The prediction sets are built on the raw ensemble scores; because the inner-validation split also served early stopping, coverage is reported as an empirical property of this protocol rather than as a finite-sample guarantee. They reach an empirical marginal coverage of 0.934 against a 0.90 target at a mean set size of 2.32 of the three actions, close to the target in each class (Figure 7C).
What the set conveys is how strongly a case supports a single recommendation and where a reader is still needed. The distribution is 48 single-label sets (14.5%), 130 two-label sets (39.2%) and 154 sets holding all three actions (46.4%) (Figure 7D). Where the set collapses to a single action, that action agrees with the BI-RADS-derived reference class 89.6% of the time, and for the 17 whose set is {biopsy} alone, it agrees 94.1% of the time. Where the set holds all three, the model’s own top choice agrees with the reference class 34.4% of the time, close to chance on a three-class problem. The set size therefore marks out, without reference to the label, where the model separates the three actions and where it does not, and it does so at a coverage that is measured rather than assumed. A single actionable recommendation is therefore the minority outcome: about one case in seven receives a set that collapses to one action, and close to half receive a set holding all three. At a coverage target of 90%, sets this wide are what the observed score separation supports. Narrowing them at the same coverage would take better-separated scores or a weaker target; a larger calibration cohort would mainly tighten the coverage estimate. The wide sets are not noise in the design but its output. The two uncertainty signals overlap substantially but incompletely: no single-label set is ever deferred, and 66 of the 100 deferred cases carry all three labels. For a deferred case, the set then makes the residual uncertainty visible to the reader. Read that way, the prediction sets are an uncertainty signal rather than a routing device, which is the role a deferral-based system needs them to play. The point prediction supplies the recommended class, the raw-margin rule decides deferral, and the set size says how broadly the three actions remain plausible.
Per class, the marginal set covers 0.945, 0.885, and 0.937 for routine return, the indeterminate class, and positive management. The class-conditional Mondrian variant covers the same three classes at a mean set size of 2.34, at 0.959, 0.865 and 0.937 in that order, so it neither tightens the sets nor lifts the indeterminate class to the 0.90 target (Figure 7C). The two indeterminate figures come from different methods: 0.885 is the marginal coverage, 0.865 the Mondrian one. We report it as a per-class coverage audit rather than as an operating mode.
3.3. Selective Prediction and Deferral
Uncertainty is only useful if the system acts on it. Selective prediction turns the per-case uncertainty into a deferral decision, and we rank cases by the margin of the raw ensemble scores. The calibrated margin is the weaker signal here. Isotonic regression compresses the probabilities towards zero and one. That improves calibration but flattens the ordering a deferral rule depends on, so deferring on the calibrated margin gives no gain up to a third of the cohort (Figure 8A). We therefore calibrate the probabilities we report and rank on the scores we do not.
Figure 8.
Selective prediction and decision-curve analysis. (A) Accuracy and balanced accuracy against deferral fraction; the dashed curve ranks on the calibrated margin. (B) Positive-management precision-recall. (C) Selective risk, with under-triage as the risk. (D) Decision curve against the treat-all and treat-none defaults.
Deferring the least confident 30% of cases to the radiologist, ranked retrospectively over the pooled cohort, raises balanced accuracy on the retained cases from 0.556 to 0.631, and 50% raises it to 0.690. More to the point of the task, deferral removes the safety-critical errors before it removes the others. Among the retained cases, the under-triage count falls from 2 of 63 to 1 of 50 at 30% deferral, and recall on the positive-management class rises with the budget. Neither baseline behaves this way at the same budgets. Both baselines shed positive-management cases about as fast as they shed the errors on them, which is what an under-triage-oriented deferral rule should avoid. Reading the deferral curve with under-triage rather than accuracy as the risk, the area under it is 0.026 for the adapted model against 0.160 for the frozen encoder and 0.443 for the convolutional one (Figure 8C). The adapted model has lower under-triage at its operating point and across the evaluated deferral budgets, and it is its uncertainty ranking that makes that true.
The 30% figure above comes from ranking the held-out cohort, which a clinic cannot do in advance. We therefore repeated the analysis with the threshold fixed in advance, on data the test cases never touch. Within each fold, the margin threshold is set at the 30th percentile of that fold’s inner-validation margins, the same split already used for early stopping and calibration, and is then applied unchanged to that fold’s test cases. The five thresholds it produces are 0.051, 0.168, 0.090, 0.065 and 0.130, and they are reported here so the rule can be checked rather than taken on trust. They differ because the inner-validation margin distributions do. Fold 2’s cutoff of 0.168 is the 30th percentile of a distribution that sat higher than the rest. Whether that reflects ordinary sampling variation or the fitting itself, early stopping included, splits this small cannot say. The timing is what the protocol fixes: the cutoff is set before any held-out case is scored, and the share it then defers runs from 24.2% to 35.8% across folds. The deferral rate is no longer imposed but emerges at 30.7% (102 of 332 cases). On the retained cases, the balanced accuracy and under-triage figures move as they did under the retrospective sweep (Table 2). The fold-wise inner-validation-fixed rule therefore performs slightly better than the retrospective sweep, and it is the form a deployment would fix in advance, although this remains internal validation within one retrospective cohort. That ordering is not a contradiction. Neither rule is an oracle for balanced accuracy, since both rank on the margin rather than on correctness, so neither bounds the other. The retrospective sweep imposes one cut on the pooled cohort while the inner-validation-fixed rule applies a threshold within each fold, and the two therefore set aside different cases. Two limits should be read with it. Independent here means a held-out fold of the same cohort, not a second site. The procedure can therefore be applied without touching a fold’s test labels. Whether one threshold transfers across folds or institutions is a separate question. And the 30th percentile is itself a choice; the full risk-coverage curve lets any budget be read off, and a deployment would fix that budget from its own tolerance for deferred workload. A separate atypicality flag marks the cases whose fused embedding lies farthest from the training distribution, surfacing them for review rather than acting automatically. How much each modality carries on its own is the next question.
Table 2.
Two ways of setting the deferral threshold: by ranking the held-out cohort, and by fixing the threshold beforehand on each fold’s inner-validation split. In the second, the rate is an outcome, not a setting.
3.4. Modality Contribution
For a paired-input model, the next question is how much each modality carries on its own. We train the same architecture on mammography alone and on ultrasound alone, under the identical patient-grouped splits, giving macro AUROC 0.682 and 0.731 against the paired model’s 0.759. The 0.731 here is the ultrasound-only model, not the pooled figure that shares it in Table 1. Neither single-modality model matches the paired system, and mammography alone is the weaker of the two. This ordering fits the cohort, which is predominantly post-treatment: 242 of the 332 cases follow lumpectomy or mastectomy. Surgical scarring and architectural distortion degrade the mammographic signal in such breasts [44], and here ultrasound alone scores higher than mammography alone. We read that as a property of this cohort, not a ranking of the two modalities. That the joint model exceeds either modality is the expected direction for paired breast imaging, where fusing mammography and ultrasound has improved lesion assessment over either alone, especially when the two disagree [32,33]. In the intended workflow, both modalities are present for every case.
3.5. Under-Triage and Decision-Curve Analysis
The task is asymmetric: the costly error is routing a positive-management case to routine return, so we report the model at that error directly, using the same ensemble-argmax rule as the headline metrics. Of the 63 positive-management cases, the model routes two to routine return (Figure 9). It routes 46 to positive management and the remaining 15 to additional imaging, so 61 of the 63 leave the model with either a positive-management recommendation or a further examination. Recall on the positive-management class is 0.730 (46 of 63; 95% CI 0.617 to 0.838, cluster bootstrap over patients). On this rare class, the average precision is 0.746 against a prevalence of 0.190, and the sensitivity available at high specificity is reported in Table S6.
Figure 9.
Safety-critical under-triage: the two positive-management cases routed to routine return. Each panel shows the raw ensemble probability over the three classes, the quantity the operating rule uses, with conformal-set members outlined and the reference class starred.
The two under-triaged cases are the ones to look at, and the trustworthiness layer treats them differently. In the first, a BI-RADS 5 lesion, the model splits its probability almost evenly between routine return and biopsy (0.429 against 0.384). Its conformal set is {routine return, biopsy}, so the biopsy label is retained, and its margin of 0.046, computed on the unrounded probabilities, places it in the lowest-confidence third of the cohort, so it is deferred at a 30% budget. Both mechanisms flag it. The second, a BI-RADS 4 lesion, is assigned routine return with a probability of 0.559 and a margin of 0.328. Its conformal set is {routine return} alone, and it is not deferred within the evaluated deferral budgets. Neither mechanism flags it, and we report it as the failure it is. The two mechanisms are complementary rather than redundant. Across the whole cohort, the conformal set retains the positive-management label for 59 of the 63 positive cases, and confidence-based deferral discards the under-triage errors ahead of the rest (Section 3.3). A case that is both confidently and narrowly wrong, however, will pass through both.
Beyond this single operating point, a decision curve [64] shows that acting on the model’s positive class carries a net benefit at least as large as the treat-all and treat-none references across the threshold region where a biopsy decision is set. Above a threshold of 0.05, it is larger than both (Figure 8D). The curve is defined against the derived positive-management reference label and measures concordance utility at each threshold, that is, utility against the derived label. The margin over treat-all widens with the threshold, from 0.000 at 0.05 to 0.111 at 0.20. That is the expected shape. Where a false positive-management decision costs almost nothing relative to a miss, treat-all is already close to optimal, and a model has little room to improve on it. The model earns its benefit where the threshold is high enough for that false positive to carry a real cost. Because the reference is the label derived from the reporting radiologist’s assessment, this measures the utility of concordance with that derived label. The selective-prediction mode above turns the residual uncertainty into radiologist workload.
3.6. Robustness and Agreement with the Reference
- Performance across the treatment spectrum. Because treatment status can affect image appearance, we stratify the out-of-fold predictions into treatment-naive, post-lumpectomy, and post-mastectomy breasts (Figure 10D; treatment status was inferred from report text and used only for exploratory subgroup analysis). Discrimination falls as surgical alteration increases: macro AUROC is 0.792 in the treatment-naive cases, 0.738 after lumpectomy, and 0.626 after mastectomy. That is the expected direction, since scarring and architectural distortion make the post-surgical breast harder to read [44].
Figure 10.
Agreement, routing, and subgroup behaviour. (A) Confusion matrix at the ensemble argmax. (B) Routing of positive-management cases by BI-RADS category. (C) Share routed to routine return by BI-RADS category. (D) Macro AUROC and conformal coverage by treatment stratum.
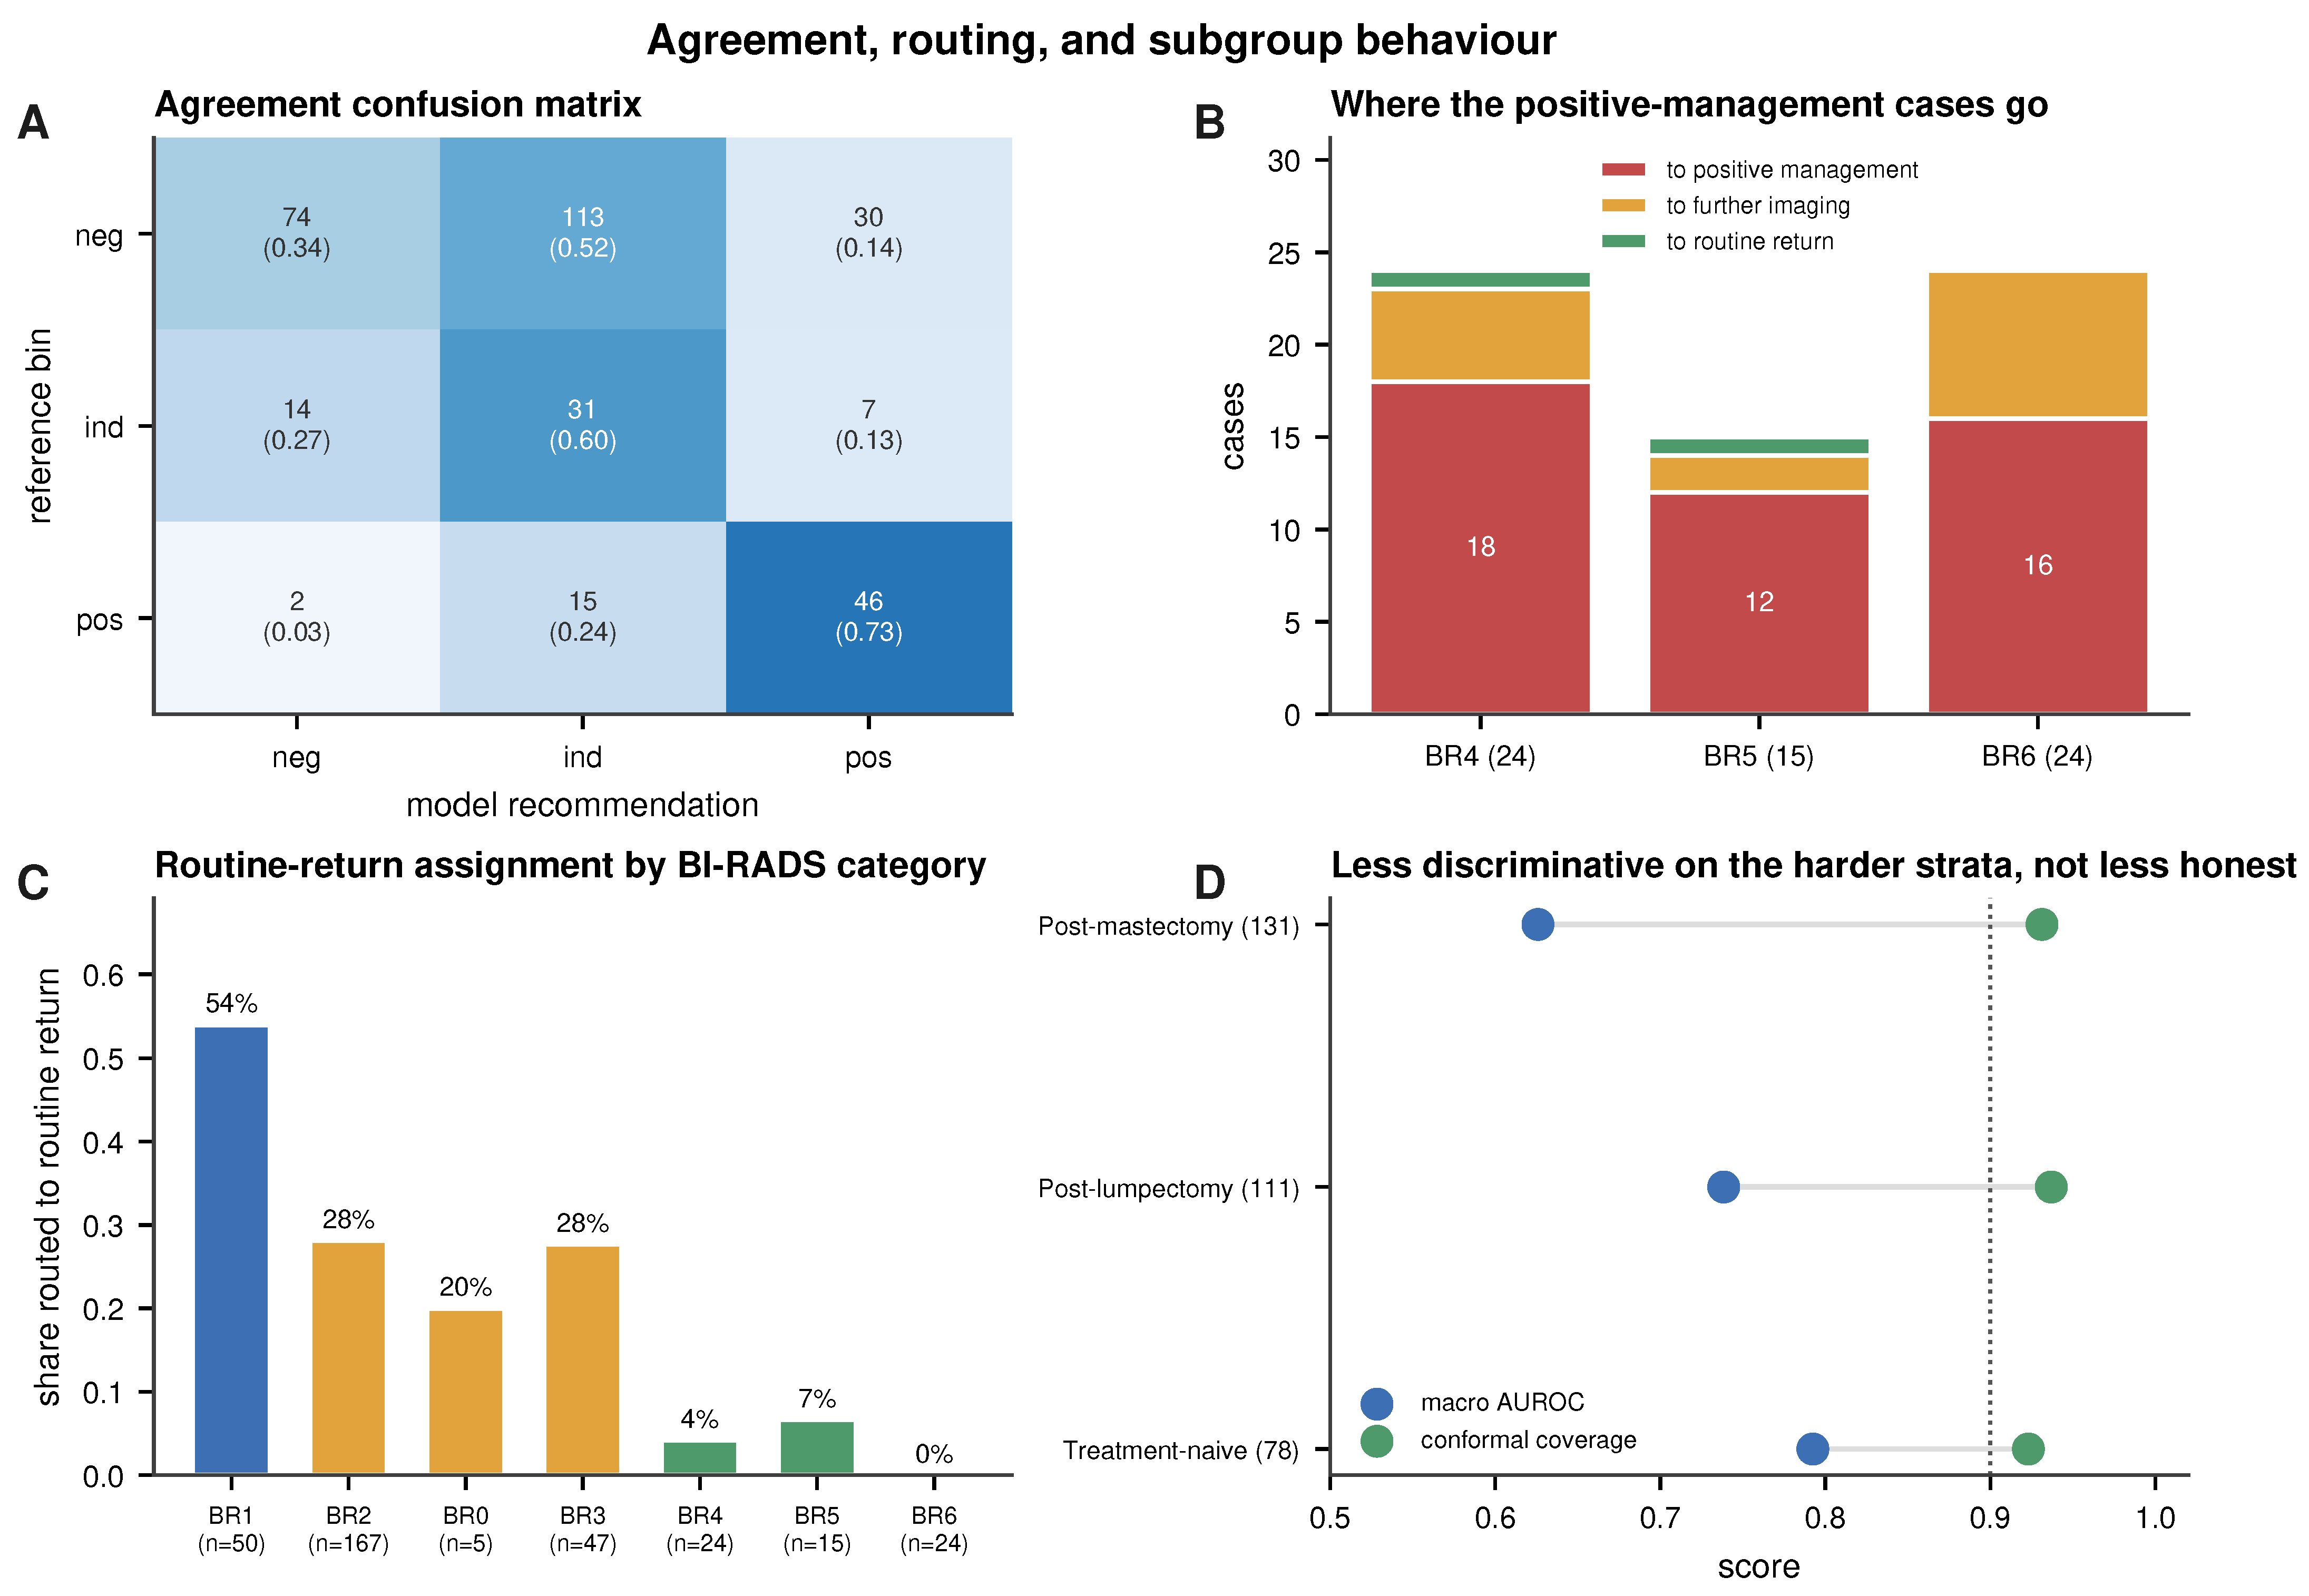
Conformal coverage does not follow it down. It holds at 0.923, 0.937 and 0.931 across the same three strata, against a 0.90 target, and the model defers a larger share of the altered breasts than of the unaltered ones. Where discrimination falls, the system says so. That is the behaviour a deferral-based design is built for, and a discrimination-only evaluation would not have shown it. The strata hold 78, 111 and 131 cases; the remaining 12 have no recoverable treatment status, eleven with no report and one whose report did not parse. Of the 63 positive cases, the three strata hold 37, 9 and 6, so 11 fall outside the audit for the same reason. We therefore treat all the subgroup estimates, coverage included, as exploratory: a coverage estimate is only as precise as its stratum is large, and the missingness is differential.
- Agreement with the reference class. Because the reference is the BI-RADS-derived class, this measures concordance with that reference rather than agreement between two independent readers. The linearly weighted Cohen’s kappa is 0.299, and the quadratically weighted kappa is 0.380. This figure belongs to the raw argmax, which is the operating rule the whole paper reports, and it is not the highest agreement these scores can reach: recalibrating them lifts the linearly weighted kappa to 0.434 under isotonic regression or 0.440 under threshold optimisation. We keep the raw rule because the deferral ranking and the under-triage count are defined on it, and 0.299 should therefore be read as the agreement that accompanies that under-triage profile rather than as a ceiling. The under-triage counts are what make the raw rule a choice rather than a concession: it under-triages 2 of the 63 positive-management cases at a positive recall of 0.730, against 27 at 0.556 under isotonic regression and 10 at 0.619 under threshold optimisation. The agreement is not uniform across the three actions, and its shape is the point. Concordance is highest on the positive-management class, lower on additional imaging (0.596), and lowest on routine return (0.341), because the routine-return cases that the model calls wrongly are called into additional imaging rather than into biopsy or the reverse (Figure 10A). A single kappa averages that structure away. Concordance with the derived reference class is highest precisely where a disagreement would be dangerous, the positive-management class, and lowest where a disagreement costs an additional examination, the routine-return class. Table 3 gives sensitivity and specificity for the three classes.Table 3. Sensitivity and specificity by reference class at the ensemble argmax.
- The cost of that profile. Seen from the other side, the same behaviour is over-triage. Of the 217 cases whose reference label is routine return, the model keeps 74 there, sends 113 to additional imaging, and 30 towards positive management, so 143 of 217, or 65.9%, are escalated. Read as clinical workload, the larger share of that is a recall for further imaging rather than an intervention: 113 additional examinations against 30 cases entering a biopsy discussion. The precisions are 0.554 for the positive-management recommendation, 46 of 83, and 0.195 for additional imaging, 31 of 159. This is the price of the operating point, and it is a price we chose rather than one we discovered. At this operating point, the low under-triage count is accompanied by substantial escalation: 143 of the 217 routine-return cases, predominantly to additional imaging. On a cohort holding 217 routine cases against 63 positive ones, that trade falls heavily on precision. The point is not that this balance is the right one for every setting, but that it is visible and adjustable. The risk-coverage curve in Figure 8 lets a site read off the deferred workload it would accept for the under-triage it wants, and the decision-curve analysis in Section 3.5 shows the threshold region over which acting on the positive class carries net benefit. Reporting both sides at one operating point is what makes that choice available to a reader; reporting the favourable side alone would not.
- Confirmatory comparisons. Deferring the least confident 30% under the retrospective ranking raises balanced accuracy significantly by 0.075 with a cluster-bootstrap 95% interval of 0.035 to 0.118 that excludes zero (Holm-adjusted ). The paired model’s gain over mammography alone, in macro AUROC, likewise survives the Holm correction across the three confirmatory comparisons (adjusted ), while the ensemble shows no statistically detectable gain over the best single initialisation (, adjusted ). The ensemble is used as insurance against a poor initialisation rather than as a source of discrimination (Section 3).
- Exploratory operating-point comparisons. The baseline ladder was tested on the same folds. Against both baselines, the proposed model makes significantly fewer under-triage errors, by an exact paired test ( against the frozen encoder and against the convolutional one). That is the reduction the discrimination metric does not register. Against the convolutional model the adapted model’s macro AUROC gain of 0.104 is significant (cluster bootstrap, 95% CI 0.056 to 0.153). Against the frozen foundation encoder no statistically detectable difference in macro AUROC was found; the point estimates differ by 0.003, and this should not be interpreted as demonstrated equivalence. It is what makes the next comparison informative. The two models have very similar macro AUROC point estimates while their thresholded error profiles differ, so what remains between them is where their errors fall. Two tests then run in opposite directions, and both are worth stating. On the accuracy of the argmax decision the frozen model is significantly better (McNemar, ). On the number of positive-management cases sent to routine return, 2 against 12, the adapted model is significantly better (exact paired test, ). A model can be significantly more accurate and show significantly higher under-triage at the same operating point, as demonstrated here. These comparisons describe the thresholded error profile, not clinical safety or global superiority of either configuration. Table 4 sets them beside the confirmatory three.Table 4. Statistical comparisons and interval estimates reported in the main text.
3.7. Attribution, Retrieval and the Annotation Audit
- Attribution and the annotation audit. The primary explanation is case-based: for each test case the five nearest neighbours in the fused embedding are returned with their management classes, so a clinician can see the comparable prior cases alongside a recommendation. Retrieval is constrained to exclude the querying case’s own patient, so a patient with two cases cannot retrieve itself. Saliency is less conclusive: Integrated Gradients on the ultrasound are diffuse rather than lesion-localised, and a controlled occlusion audit did not detect annotation-specific sensitivity beyond matched random occlusion. With nine cases the audit is exploratory and cannot establish absence. What it shows is that occluding the annotated region did not change the score more than occluding an equal area elsewhere, which is not the pattern a calliper-driven shortcut would give. We report it as a pilot audit rather than as evidence that the shortcut is absent, and the larger purpose-designed audit that would settle the question is set out among the limitations. Figure 11 shows four example evidence cards, the object a radiologist would see at read time. Each card is one case.Figure 11. Four evidence cards on de-identified BCMID cases: a confident biopsy recommendation (a), a confident routine return (b), a correct additional-imaging call (c), and an under-triaged positive-management case (d), which is the BI-RADS 4 case of Figure 9. All four cards show the calibrated probabilities.
3.8. Boundary Sensitivity and Error Analysis
The three management classes merge seven BI-RADS categories, so the routing should be robust to where those boundaries are drawn. We resolve the predictions against the original BI-RADS category, under the same ensemble-argmax rule used for the under-triage audit. The share sent to routine return drops from 54% at BI-RADS 1 to none at 6. One step runs the other way, because a single case moves a small denominator (Figure 10C). One category 4 case and one category 5 case are routed to routine return, and none of the 24 category 6 cases is (Figure 10B). Most routing disagreement therefore sits in the lower categories, while the two under-triage cases remain visible in categories 4 and 5.
Re-binning category 3 into the negative class leaves the positive-management decision untouched: recall on the positive-management class, the under-triage count, and the positive-versus-rest AUROC are all unchanged. Balanced accuracy rises from 0.556 to 0.620. Re-binning leaves only the five BI-RADS 0 cases in the indeterminate class. Four of them are called correctly, so a five-case recall now carries a third of the average. The under-triage result is invariant to this boundary, which is the property that matters for a management task.
Restricting the audit to the 39 cases that call for a new biopsy decision, BI-RADS 4 and 5, recall is 0.769, and the two under-triaged cases are both in this group, so the count is unchanged while the rate rises from 2 of 63 to 2 of 39. Recall is defined here exactly as in the headline: positive cases the model routes to the positive-management class, over positive cases. The headline 0.730 is 46 of 63 over the whole positive class; 0.769 is 30 of 39 over this subset. Of those 46 correct calls, 30 fall in this subset and 16 in category 6. The recall definition is unchanged; the analysis population, numerator and denominator differ. The 24 category 6 cases are already-diagnosed malignancies under management rather than new recommendations, so their inclusion is worth testing separately. Excluding them leaves the under-triage count at two and raises recall from 0.730 to 0.769, so the under-triage result holds while the recall estimate does not stay the same. An estimate resting on 39 decisions is imprecise, which is why we report it beside the full-class figure rather than in place of it.
4. Discussion
Trustworthiness has become the organising question for medical AI, and the reason is practical rather than philosophical. A model that is right on average still has to be used case by case, by a clinician who cannot see which cases it is right about. What a reader needs from a model is therefore not only a prediction but a statement of how far that prediction can be relied on, and a defined behaviour when it cannot.
Breast imaging is a fair place to test that, because the decision is already structured. BI-RADS turns a reading into an action, the actions carry very different costs, and the two modalities a radiologist uses are complementary rather than interchangeable. It is also a setting where accuracy is a poor guide: the common action dominates the cohort, and a model can score well while making exactly the error the pathway exists to prevent.
This is a proof-of-concept study, and the concept it tests is a design rather than a score. Two models here have almost the same macro AUROC and differ sixfold in the under-triage count, and no discrimination metric records that difference.
What the trust layer adds is that the model’s own uncertainty becomes part of the output. A calibrated probability says how strongly a case supports its recommendation, a conformal set says which other actions remain plausible, a deferral rule says when the case should go back to the radiologist, and an atypicality flag says when the input is unlike what the model was trained on. Measured together at one operating point, these four turn a single number into a profile a reader can interrogate. In a clinical setting, that is the difference between a tool that answers everything and one that also knows when to stand back. The rule sets aside the model’s lowest-margin cases for a second read, and the retained ones carry a stated confidence rather than an implied one.
A claim should be matched to the evidence behind it. The claim here is about that operating profile on one retrospective cohort, not about clinical benefit, and the sections that follow set out what the profile shows and where it stops.
The system is designed as a radiologist-facing triage and workflow-support tool for BI-RADS-derived management concordance. For each case, it returns a management class, a calibrated probability, a conformal prediction set, and an atypicality flag for inputs far from the training distribution, together with a confidence ranking from which uncertain cases can be deferred to the reading radiologist. Because the target is a grouping we derive from the radiologist’s BI-RADS assessment, and not pathology or longitudinal clinical outcome, the output should be interpreted as concordance with that reference management class rather than as a diagnostic statement about the breast.
In this post-treatment setting, three findings matter most for decision support. The first is the safety-critical error, which we measure rather than assume. Two of the 63 positive-management cases are routed to routine return, and both are audited individually in Figure 9. The conformal set keeps the positive-management label for one of them, and the deferral rule returns that same case. The other is caught by neither. Across the positive class, the set drops the positive-management label for four of 63 cases.
The second is the cost of that profile. A model reluctant to call routine return will under-triage rarely and over-call the middle class often, and the confusion matrix shows exactly that (Figure 10). The two are the same fact seen from opposite sides, and we report both at the same operating point.
The third is what happens on the harder strata. Macro AUROC falls from 0.792 when the breast is untreated to 0.738 after lumpectomy and 0.626 after mastectomy. Conformal coverage does not follow it down: it holds at 0.923, 0.937, and 0.931. With nine positive cases after lumpectomy and six after mastectomy, these estimates are imprecise, and we claim no stability from them. The coverage result is the narrower one and the more useful. Where the model loses discrimination, empirical coverage holds near target and both post-surgical strata defer more than the treatment-naive one, rather than the model staying confidently wrong.
A single three-class accuracy figure treats the three errors as one quantity, and clinically they are not. Read by class, the model withholds a positive-management recommendation in 232 of the 269 cases whose reference label is not positive management, a specificity of 0.862, while its specificity for the intermediate class is 0.543 (Table 3). Those two numbers describe different clinical situations. This profile concentrates false escalation more often in additional imaging than in biopsy; whether that trade-off is acceptable depends on the workload and risk tolerance of the intended clinical setting. Balanced accuracy, being an average across classes, reports neither. The same logic governs the deferral rule. We adopt it not because it raises accuracy but because, at the evaluated budgets, its uncertainty ranking removes the under-triage errors first. We report that behaviour directly rather than as an accuracy optimisation.
The finding this cohort supports is a structural one: discrimination and error direction are different properties of a classifier. In this cohort, models separated by 0.003 in macro AUROC differ sixfold in the primary under-triage count, and no discrimination metric reports the second. The distinction itself does not depend on cohort size; the magnitude and precision of the observed difference do. What the cohort governs is the precision of the individual estimates, which is why the under-triage comparison is carried out by a paired test rather than by a difference in means, and why the subgroup results are reported as exploratory.
The baseline ladder separates two things that are usually reported as one. Domain pretraining carries the discrimination: a conventional encoder reaches 0.655, and freezing the pretrained encoders already reaches 0.756. Adapting them gives 0.759, which is not a discrimination gain, and we do not present it as one. What adaptation changes is the direction of the errors. Under-triage falls from 27 to 12 to two across the same three rungs. On accuracy, the frozen model is better (McNemar, ); on under-triage, the adapted model is better (exact paired test, ). Scored on discrimination alone, the two upper rungs show no statistically detectable difference, which is not demonstrated equivalence. This is why we report the under-triage count beside every discrimination figure.
We keep the ensemble, though not because it beat the comparator in the confirmatory analysis. Pooled over the cohort the three initialisations span 0.059 in macro AUROC, and the ensemble lands above their mean but not above the best, which is what the confirmatory comparison was against. What the ensemble does provide is insurance: the best initialisation cannot be identified without the test data. It also fixes the single operating point that the calibrator, the conformal quantile, and the deferral ranking are all built on.
The modality contrast is reported in Section 3.4. Trained in isolation under the same splits and recipe, neither modality reaches the joint model (0.682 for mammography and 0.731 for ultrasound, against 0.759 for the pair), so neither alone suffices. The ordering follows the composition of this cohort rather than any intrinsic ranking of the two modalities: most of these breasts are post-surgical, which degrades the mammographic signal while leaving ultrasound comparatively informative. The number of views and frames also varies from case to case, and the masked pooling absorbs that without imputation, so a sparse study is scored on what it has. Because training uses complete pairs only, a case arriving with a single modality falls outside the training distribution. Bringing such inputs into scope, for example through modality dropout during training, is the natural extension.
For the visual explanation we deliberately avoid a class-activation heatmap. Post hoc saliency is not inherently faithful. A plausible-looking map can be produced even for a randomised model [42,43], and the ultrasound encoder’s single-token pooling makes such a map degenerate in any case. A faithful spatial attribution would need a different pooling design or a localisation-oriented backbone, which we leave to future work. We therefore report Integrated Gradients as a diffuse secondary signal and rely on case-based retrieval, an embedding-neighbour explanation, as the primary one. This is why we treat retrieval as supporting evidence rather than as proof of lesion-localised reasoning.
Taken together, the result is a full operating profile for a paired mammography and ultrasound management model: calibrated probabilities, empirically covered prediction sets, and selective deferral that returns the least certain cases to the radiologist. Two specific risks are addressed: the report, excluded to prevent label leakage, and the ultrasound-annotation shortcut, probed by a pilot occlusion audit. The mask-aware architecture accepts a single-modality input; behaviour on such inputs is a question for a cohort that contains them. The precision of the reported discrimination is bounded by the cohort size and by a reference derived from one reader’s assessment; the operating profile is what the design contributes beside it. For every case, the system states how far its recommendation separates the three actions, and whether it should be deferred rather than acted on.
We report the split-conformal coverage (0.934 pooled; 0.935 ± 0.050 across the five folds, mean ± SD) as a within-distribution property [5,6]. Because the inner split is reused for early stopping and calibration, this coverage is empirical, and it would have to be established again under the distribution shift a new site brings [18].
4.1. Limitations
The discrimination reported here reflects a small single-centre cohort read against one radiologist’s assessment rather than a ceiling on the task. It positions the system as a triage aid and second reader rather than a replacement for the first, and it is the reason the paper is built around what the model does when it is uncertain rather than around how often it is right.
Which of the two models to report is a judgement, not a measurement. The frozen configuration is the more accurate; we report the adapted one because it under-triages far less often, two cases against twelve. Both are given at the same operating point (Figure 6), so a reader whose costs differ can weigh them differently.
The cohort is the binding constraint. It comes from one Egyptian centre with a single dominant acquisition convention, so the behaviour reported here is characterised for that setting. Extending it across scanners, polarity conventions and readers calls for an independent same-subject paired cohort. Such data are scarce: to our knowledge, no other public collection pairs both modalities under a management label, and the private paired cohorts are labelled for binary malignancy rather than for a management class [32,33]. Assembling one is the step we regard as most valuable, and it is a question of data access rather than of method. The trustworthiness layer is fitted from a trained model’s outputs, so carrying it to a new cohort means local validation and refitting of the calibrator and the conformal quantile, as well as adapting the encoders if the imaging distribution differs materially. The reference is an author-derived management class mapped from the reporting radiologist’s BI-RADS assessment rather than a second reader or a pathology endpoint, so the task is concordance rather than diagnosis. No pathology result and no longitudinal clinical outcome enter the label at any point, so a case in which the underlying BI-RADS assessment was mistaken is scored as correct whenever the model reproduces that mistake. Establishing whether the assessment itself was correct needs a cohort carrying pathology or follow-up. That is the natural companion to an external validation rather than a substitute for one. The archive carries no per-case age, density or ethnicity annotation, so performance across demographic groups is untested. The descriptive subgroup analyses we can run are limited to era, laterality and treatment status. Per-fold estimates move with a handful of events, which is why we report their spread rather than averaging it away.
Interpretability is the component with the most room to develop, and part of the reason is architectural. The ultrasound encoder returns token embeddings rather than a pooled spatial feature map, and its tower is reduced to a single token before fusion, so a class-activation map on top of it would reflect that pooling as much as the model. We therefore use Integrated Gradients on the input, and its attributions are diffuse; the model also responds to occlusion anywhere in the image rather than to the lesion alone. We therefore rely on case-based retrieval as the primary explanation, and treat the occlusion audit as a pilot. A localisation-oriented backbone and a purpose-designed shortcut audit would bring this component to the footing of the rest.
Three steps follow naturally from this work. A second centre with paired imaging and management labels would extend the calibration and coverage results across scanners and readers. A label carrying pathology or follow-up would let the safety-critical error be counted against outcome as well as against a recommendation. And a prospective reading study would show how a radiologist uses a deferral signal at the point of care. The first two are questions of data access; the third is the one that would establish clinical value.
4.2. Reporting and Trustworthiness Compliance
The study is reported following the CLAIM [66] and TRIPOD+AI [45] statements as a development and internal validation study, with its design guided by the PROBAST+AI risk-of-bias domains [67]. Because we make no early deployment claim, we treat DECIDE-AI [68] only as a forward-looking target. A study-level mapping to the six FUTURE-AI principles [4], with the CLAIM and TRIPOD+AI reporting summaries, is provided in the Supplementary Materials.
5. Conclusions
We built a trust-aware system for the BI-RADS management decision on paired mammography and ultrasound. The target throughout is a three-class grouping derived from the reporting radiologist’s BI-RADS assessment, so what the system is measured against is in concordance with that derived label rather than diagnostic accuracy against pathology, observed patient management or clinical outcome. For every case, it reports a calibrated probability and an empirically covered prediction set, and returns to the radiologist the cases it cannot call. Adapting the encoders end-to-end leaves discrimination close to where the frozen encoders left it while changing both the number and the direction of the thresholded errors: the under-triage count falls from 12 to 2, at the escalation cost reported in Section 3.6. That gap is the point of the paper: the two properties come apart, and discrimination metrics register only one of them. It defers its least-confident cases and carries an atypicality flag for inputs far from the training distribution. Statistical performance alone does not establish clinical value; a claim made for a medical AI system has to be matched to the kind of evidence behind it. What this study contributes is the analytic end of that range: an operating profile in which calibration, coverage, deferral and the direction of the errors are measured together at one point so that the error against that reference is visible rather than averaged away. Claims of workflow benefit or improved outcomes call for evidence of a different kind, and external validation on an independent paired cohort is the step towards it. The trustworthiness layer is built for that step since it is fitted from the outputs of an already trained model rather than forming part of the training itself.
Supplementary Materials
The following supporting information can be downloaded at https://www.mdpi.com/article/10.3390/biomedinformatics6050074/s1. Table S1: Per-fold and per-initialisation macro AUROC and balanced accuracy. Mean averages the five folds; Pooled scores each initialisation once over the cohort, which is the quantity the ensemble is compared against. The Mean column averages the three initialisations; Table S2: An uncalibrated baseline and three calibration strategies, the latter each fitted per fold on the inner-validation split; the layer uses isotonic regression. Each row is scored on the probabilities that strategy produces, so the AUROC column describes the transformed scores; Table S3: Subgroup coverage of the marginal conformal set (target 0.90). Treatment rows exclude the 12 cases without recoverable status—eleven of them with positive-management—and are descriptive; Table S4: Concordance between the model recommendation and the BI-RADS-derived reference class, as a linearly weighted Cohen’s kappa (95% CI from ten thousand patient-level cluster-bootstrap resamples). The primary row is the ensemble-argmax rule; the rest give agreement under alternative calibrations; Table S5: Conformal prediction sets at a target marginal error of 0.10, computed on the raw scores. The Mondrian variant is a per-class coverage audit; Table S6: Under-triage profile restricted to genuine new-biopsy decisions (BI-RADS 4 and 5), excluding the 24 already-diagnosed BI-RADS 6 cases. AUROC and AP are positive-versus-rest; Sens@90/95 is sensitivity at 90% and 95% specificity; Table S7: Boundary sensitivity to the negative/indeterminate cut, re-binning BI-RADS 3 into the negative class. The positive-management decision and the under-triage count are invariant to the choice; Table S8: Per-class one-versus-rest metrics on the out-of-fold predictions. AP is average precision, and PPV and NPV are the positive and negative predictive values; Table S9: Performance across the treatment spectrum, with status recovered from the report. The twelve cases without recoverable status are omitted, and eleven of them are positive-management, so the strata hold 52 of the 63 positives. Deferral rates are those of the pooled 30% rule; Table S10: Management routing by original BI-RADS category. The two cases in the BI-RADS 4 and 5 rows are the under-triage cases audited in Figure 9; Table S11: Breast imaging dataset landscape for paired multimodal BI-RADS assessment. Sizes are as reported by each source; units differ by dataset; Table S12: CLAIM 2024 compliance summary. Addressed items point to the relevant section; not applicable items give the reason; Table S13: TRIPOD+AI compliance summary; Table S14: Mapping to the six FUTURE-AI principles for trustworthy and deployable clinical artificial intelligence [4]; Figure S1: Controlled occlusion audit for sonographer annotation shortcuts. (a) A representative frame with callipers on the lesion. (b) Mean change in positive-management probability when the annotation, or a matched random region of equal area, is occluded (error bars ±1 standard error, n = 9).
Author Contributions
Conceptualisation, methodology, software, formal analysis, investigation, and writing of the original draft, M.N.; supervision, review, and editing, R.H. All authors have read and agreed to the published version of the manuscript.
Funding
This research received no external funding.
Institutional Review Board Statement
This is a secondary analysis of the publicly released, de-identified BCMID dataset (CC BY 4.0). No new human-subjects data were collected, so institutional review board approval was not required.
Informed Consent Statement
Not applicable.
Data Availability Statement
The BCMID dataset is available on Zenodo (version 3, https://doi.org/10.5281/zenodo.19402690, accessed on 5 April 2026). The code used for preprocessing, model training, and evaluation is available from the corresponding author upon reasonable request.
Acknowledgments
This work uses Mammo-FM developed by the authors of Mammo-FM, Boston University.
Conflicts of Interest
The authors declare no conflicts of interest.
Abbreviations
The following abbreviations are used: BI-RADS, Breast Imaging Reporting and Data System; AUROC, area under the receiver operating characteristic curve; ECE, expected calibration error; LAC, least-ambiguous set-valued classifier; LoRA, low-rank adaptation; CLAHE, contrast-limited adaptive histogram equalisation; MG, mammography; US, ultrasound; OOD, out of distribution; CI, confidence interval; FM, foundation model; CLAIM, Checklist for Artificial Intelligence in Medical Imaging.
References
- Guo, C.; Pleiss, G.; Sun, Y.; Weinberger, K.Q. On calibration of modern neural networks. In Proceedings of the International Conference on Machine Learning (ICML), Sydney, Australia, 6–11 August 2017. [Google Scholar]
- Minderer, M.; Djolonga, J.; Romijnders, R.; Hubis, F.; Zhai, X.; Houlsby, N.; Tran, D.; Lucic, M. Revisiting the calibration of modern neural networks. In Proceedings of the Advances in Neural Information Processing Systems (NeurIPS), Virtual, 6–14 December 2021. [Google Scholar]
- Pakdaman Naeini, M.; Cooper, G.F.; Hauskrecht, M. Obtaining well calibrated probabilities using Bayesian binning. In Proceedings of the AAAI Conference on Artificial Intelligence, Austin, TX, USA, 25–30 January 2015. [Google Scholar] [CrossRef] [Scilit]
- Lekadir, K.; Frangi, A.F.; Porras, A.R.; Glocker, B.; Cintas, C.; Langlotz, C.P.; Weicken, E.; Asselbergs, F.W.; Prior, F.; Collins, G.S.; et al. FUTURE-AI: International consensus guideline for trustworthy and deployable artificial intelligence in healthcare. BMJ 2025, 388, e081554. [Google Scholar] [CrossRef] [Scilit] [PubMed]
- Vovk, V.; Gammerman, A.; Shafer, G. Algorithmic Learning in a Random World, 2nd ed.; Springer: Cham, Switzerland, 2022. [Google Scholar] [CrossRef] [Scilit]
- Angelopoulos, A.N.; Bates, S. Conformal prediction: A gentle introduction. Found. Trends Mach. Learn. 2023, 16, 494–591. [Google Scholar] [CrossRef] [Scilit]
- Sadinle, M.; Lei, J.; Wasserman, L. Least ambiguous set-valued classifiers with bounded error levels. J. Am. Stat. Assoc. 2019, 114, 223–234. [Google Scholar] [CrossRef] [Scilit]
- Romano, Y.; Sesia, M.; Candès, E. Classification with valid and adaptive coverage. In Proceedings of the Advances in Neural Information Processing Systems (NeurIPS), Virtual, 6–12 December 2020. [Google Scholar]
- Ding, T.; Angelopoulos, A.N.; Bates, S.; Jordan, M.I.; Tibshirani, R.J. Class-conditional conformal prediction with many classes. In Proceedings of the Advances in Neural Information Processing Systems 36 (NeurIPS), New Orleans, LA, USA, 10–16 December 2023. [Google Scholar] [CrossRef] [Scilit]
- Bates, S.; Angelopoulos, A.N.; Lei, L.; Malik, J.; Jordan, M.I. Distribution-free, risk-controlling prediction sets. J. ACM 2021, 68, 1–34. [Google Scholar] [CrossRef] [Scilit]
- Angelopoulos, A.N.; Bates, S.; Fisch, A.; Lei, L.; Schuster, T. Conformal risk control. In Proceedings of the International Conference on Learning Representations (ICLR), Vienna, Austria, 7–11 May 2024. [Google Scholar]
- Gamble, C.; Faghani, S.; Erickson, B.J. Applying conformal prediction to a deep learning model for intracranial hemorrhage detection to improve trustworthiness. Radiol. Artif. Intell. 2025, 7, e240032. [Google Scholar] [CrossRef] [Scilit] [PubMed]
- Geifman, Y.; El-Yaniv, R. Selective classification for deep neural networks. In Proceedings of the Advances in Neural Information Processing Systems (NeurIPS), Long Beach, CA, USA, 4–9 December 2017. [Google Scholar]
- Mozannar, H.; Sontag, D. Consistent estimators for learning to defer to an expert. In Proceedings of the International Conference on Machine Learning (ICML), Virtual, 12–18 July 2020. [Google Scholar]
- Pugnana, A.; Massidda, R.; Giannini, F.; Barbiero, P.; Espinosa Zarlenga, M.; Pellungrini, R.; Dominici, G.; Giannotti, F.; Bacciu, D. Deferring concept bottleneck models: Learning to defer interventions to inaccurate experts. In Proceedings of the Advances in Neural Information Processing Systems 38 (NeurIPS), San Diego, CA, USA, 2–7 December 2025; pp. 75753–75808. [Google Scholar] [CrossRef] [Scilit]
- Goh, S.S.N.; Ng, Q.X.; Chan, F.J.H.; Goh, R.S.J.; Jagmohan, P.; Ali, S.H.; Koh, G.C.H. Radiologists’ perspectives on AI integration in mammographic breast cancer screening: A mixed methods study. Cancers 2025, 17, 3491. [Google Scholar] [CrossRef] [Scilit] [PubMed]
- Goh, S.; Goh, R.S.J.; Chong, B.; Ng, Q.X.; Koh, G.C.H.; Ngiam, K.Y.; Hartman, M. Challenges in implementing artificial intelligence in breast cancer screening programs: Systematic review and framework for safe adoption. J. Med. Internet Res. 2025, 27, e62941. [Google Scholar] [CrossRef] [Scilit] [PubMed]
- Youssef, A.; Pencina, M.; Thakur, A.; Zhu, T.; Clifton, D.; Shah, N.H. External validation of AI models in health should be replaced with recurring local validation. Nat. Med. 2023, 29, 2686–2687. [Google Scholar] [CrossRef] [Scilit] [PubMed]
- Louis, L.D.; Wakelin, E.A.; McCabe, M.P.; Ng, A.Y.; Kim, J.G.; Lee, C.I.; Buist, D.S.M.; Sorensen, A.G.; Haslam, B. Equitable impact of an AI-driven breast cancer screening workflow in real-world US-wide deployment. Nat. Health 2026, 1, 58–66. [Google Scholar] [CrossRef] [Scilit]
- Bray, F.; Laversanne, M.; Sung, H.; Ferlay, J.; Siegel, R.L.; Soerjomataram, I.; Jemal, A. Global cancer statistics 2022: GLOBOCAN estimates of incidence and mortality worldwide for 36 cancers in 185 countries. CA Cancer J. Clin. 2024, 74, 229–263. [Google Scholar] [CrossRef] [Scilit] [PubMed]
- Siegel, R.L.; Kratzer, T.B.; Wagle, N.S.; Sung, H.; Jemal, A. Cancer statistics, 2026. CA Cancer J. Clin. 2026, 76, e70043. [Google Scholar] [CrossRef] [Scilit] [PubMed]
- Gordon, P.B.; Warren, L.J.; Seely, J.M. Cancers detected on supplemental breast ultrasound in women with dense breasts: Update from a Canadian centre. Can. Assoc. Radiol. J. 2025, 76, 497–507. [Google Scholar] [CrossRef] [Scilit] [PubMed]
- Newell, M.S.; Destounis, S.V.; Leung, J.W.T.; DeMartini, W.B.; Lee, C.H.; Eby, P.R. ACR BI-RADS v2025 Manual; American College of Radiology: Reston, VA, USA, 2025; Available online: https://www.acr.org/Clinical-Resources/Clinical-Tools-and-Reference/Reporting-and-Data-Systems/BI-RADS (accessed on 25 June 2026).
- Spak, D.A.; Plaxco, J.S.; Santiago, L.; Dryden, M.J.; Dogan, B.E. BI-RADS fifth edition: A summary of changes. Diagn. Interv. Imaging 2017, 98, 179–190. [Google Scholar] [CrossRef] [Scilit] [PubMed]
- Garrett, H.V.; Brodsky, J.E.; Ahmad, T.; Doherty, C.M.; Lee, M.V.; McFarland, E.; Bennett, D.L. False-negative review from the mammography audit: Refining breast imaging practice. Radiographics 2025, 45, e240128. [Google Scholar] [CrossRef] [Scilit] [PubMed]
- Amin, A.; U, D.A.; Koteshwara, P.; P C, S.; Mathew, S. A systematic literature review on mammography: Deep learning techniques for breast cancer detection with global and Asian perspectives. BMC Cancer 2025, 25, 1627. [Google Scholar] [CrossRef] [Scilit] [PubMed]
- Nguyen, H.T.; Nguyen, H.Q.; Pham, H.H.; Lam, K.; Le, L.T.; Dao, M.; Vu, V. VinDr-Mammo: A large-scale benchmark dataset for computer-aided diagnosis in full-field digital mammography. Sci. Data 2023, 10, 277. [Google Scholar] [CrossRef] [Scilit] [PubMed]
- Gómez-Flores, W.; Gregorio-Calas, M.J.; Coelho de Albuquerque Pereira, W. BUS-BRA: A breast ultrasound dataset for assessing computer-aided diagnosis systems. Med. Phys. 2024, 51, 3110–3123. [Google Scholar] [CrossRef] [Scilit] [PubMed]
- Atrey, K.; Singh, B.K.; Bodhey, N.K. Integration of ultrasound and mammogram for multimodal classification of breast cancer using hybrid residual neural network and machine learning. Image Vis. Comput. 2024, 145, 104987. [Google Scholar] [CrossRef] [Scilit]
- Yan, Y.; Xu, Y.; Fang, G.; He, X.; Qian, Y.; Zhu, W. Multimodal deep learning for breast tumor classification: Integrating mammography and ultrasound for enhanced diagnostic accuracy. J. Appl. Clin. Med. Phys. 2026, 27, e70464. [Google Scholar] [CrossRef] [Scilit] [PubMed]
- Yang, Y.; Zhong, Y.; Li, J.; Feng, J.; Gong, C.; Yu, Y.; Hu, Y.; Gu, R.; Wang, H.; Liu, F.; et al. Deep learning combining mammography and ultrasound images to predict the malignancy of BI-RADS US 4A lesions in women with dense breasts: A diagnostic study. Int. J. Surg. 2024, 110, 2604–2613. [Google Scholar] [CrossRef] [Scilit] [PubMed]
- Xu, Z.; Zhong, S.; Gao, Y.; Huo, J.; Xu, W.; Huang, W.; Huang, X.; Zhang, C.; Zhou, J.; Dan, Q.; et al. Optimizing breast lesions diagnosis and decision-making with a deep learning fusion model integrating ultrasound and mammography: A dual-center retrospective study. Breast Cancer Res. 2025, 27, 80. [Google Scholar] [CrossRef] [Scilit] [PubMed]
- Chen, J.; Pan, T.; Zhu, Z.; Liu, L.; Zhao, N.; Feng, X.; Zhang, W.; Wu, Y.; Cai, C.; Luo, X.; et al. A deep learning-based multimodal medical imaging model for breast cancer screening. Sci. Rep. 2025, 15, 14696. [Google Scholar] [CrossRef] [Scilit] [PubMed]
- Yan, P.; Gong, W.; Li, M.; Zhang, J.; Li, X.; Jiang, Y.; Luo, H.; Zhou, H. TDF-Net: Trusted dynamic feature fusion network for breast cancer diagnosis using incomplete multimodal ultrasound. Inf. Fusion 2024, 112, 102592. [Google Scholar] [CrossRef] [Scilit]
- Ghosh, S.; Joshi, V.P.; Syed, R.; Budhraja, P.; Kassem, A.; Morrison, K.C.; Tang, A.; Wong, H.C.A.; Varshney, A.; Basak, P.; et al. Mammo-FM: Breast-specific foundational model for integrated mammographic diagnosis, prognosis, and reporting. arXiv 2025, arXiv:2512.00198. [Google Scholar] [CrossRef] [Scilit]
- Ghosh, S.; Poynton, C.B.; Visweswaran, S.; Batmanghelich, K. Mammo-CLIP: A vision language foundation model to enhance data efficiency and robustness in mammography. In Proceedings of the Medical Image Computing and Computer Assisted Intervention (MICCAI), Marrakesh, Morocco, 6–10 October 2024; pp. 632–642. [Google Scholar] [CrossRef] [Scilit]
- Jiao, J.; Zhou, J.; Li, X.; Xia, M.; Huang, Y.; Huang, L.; Wang, N.; Zhang, X.; Zhou, S.; Wang, Y.; et al. USFM: A universal ultrasound foundation model generalized to tasks and organs towards label efficient image analysis. Med. Image Anal. 2024, 96, 103202. [Google Scholar] [CrossRef] [Scilit] [PubMed]
- Sellergren, A.; Kazemzadeh, S.; Jaroensri, T.; Kiraly, A.; Traverse, M.; Kohlberger, T.; Xu, S.; Jamil, F.; Hughes, C.; Lau, C.; et al. MedGemma technical report. arXiv 2025, arXiv:2507.05201. [Google Scholar] [CrossRef] [Scilit]
- Hu, E.J.; Shen, Y.; Wallis, P.; Allen-Zhu, Z.; Li, Y.; Wang, S.; Wang, L.; Chen, W. LoRA: Low-rank adaptation of large language models. In Proceedings of the International Conference on Learning Representations (ICLR), Virtual, 25–29 April 2022. [Google Scholar]
- Lian, C.; Zhou, H.Y.; Yu, Y.; Wang, L. Less could be better: Parameter-efficient fine-tuning advances medical vision foundation models. arXiv 2024, arXiv:2401.12215. [Google Scholar] [CrossRef] [Scilit]
- Bunnell, A.; Hung, K.; Shepherd, J.A.; Sadowski, P. BUSClean: Open-source software for breast ultrasound image pre-processing and knowledge extraction for medical AI. PLoS ONE 2024, 19, e0315434. [Google Scholar] [CrossRef] [Scilit] [PubMed]
- Adebayo, J.; Gilmer, J.; Muelly, M.; Goodfellow, I.; Hardt, M.; Kim, B. Sanity checks for saliency maps. In Proceedings of the Advances in Neural Information Processing Systems (NeurIPS), Montréal, QC, Canada, 3–8 December 2018. [Google Scholar]
- Rudin, C. Stop explaining black box machine learning models for high stakes decisions and use interpretable models instead. Nat. Mach. Intell. 2019, 1, 206–215. [Google Scholar] [CrossRef] [Scilit] [PubMed]
- Retson, T.; Kocher, P.; Anaam, D.; Fazeli, S.; Eghtedari, M.; Ojeda-Fournier, H. Do not miss architectural distortion. Radiographics 2024, 44, e240024. [Google Scholar] [CrossRef] [Scilit] [PubMed]
- Collins, G.S.; Moons, K.G.M.; Dhiman, P.; Riley, R.D.; Beam, A.L.; Van Calster, B.; Ghassemi, M.; Liu, X.; Reitsma, J.B.; van Smeden, M.; et al. TRIPOD+AI statement: Updated guidance for reporting clinical prediction models that use regression or machine learning methods. BMJ 2024, 385, e078378. [Google Scholar] [CrossRef] [Scilit] [PubMed]
- Seddik Tawfik, N.; Elshenawy, M.; Nasr, O.; Elgendy, A.; Seif Eldin, D.; Fayed, S.; Ye, X.; Kadry, R.; Ghatwary, N. BCMID: Breast Cancer Multimodal Imaging Dataset (Updated), Version v3 [Dataset]; Zenodo: Geneva, Switzerland, 2026. [Google Scholar] [CrossRef]
- Lee, R.S.; Gimenez, F.; Hoogi, A.; Miyake, K.K.; Gorovoy, M.; Rubin, D.L. A curated mammography data set for use in computer-aided detection and diagnosis research. Sci. Data 2017, 4, 170177. [Google Scholar] [CrossRef] [Scilit] [PubMed]
- Moreira, I.C.; Amaral, I.; Domingues, I.; Cardoso, A.; Cardoso, M.J.; Cardoso, J.S. INbreast: Toward a full-field digital mammographic database. Acad. Radiol. 2012, 19, 236–248. [Google Scholar] [CrossRef] [Scilit] [PubMed]
- Jeong, J.J.; Vey, B.L.; Bhimireddy, A.; Kim, T.; Santos, T.; Correa, R.; Dutt, R.; Mosunjac, M.; Oprea-Ilies, G.; Smith, G.; et al. The EMory BrEast imaging Dataset (EMBED): A racially diverse, granular dataset of 3.4 million screening and diagnostic mammographic images. Radiol. Artif. Intell. 2023, 5, e220047. [Google Scholar] [CrossRef] [Scilit] [PubMed]
- Al-Dhabyani, W.; Gomaa, M.; Khaled, H.; Fahmy, A. Dataset of breast ultrasound images. Data Brief. 2020, 28, 104863. [Google Scholar] [CrossRef] [Scilit] [PubMed]
- Alsolami, A.S.; Shalash, W.; Alsaggaf, W.; Ashoor, S.; Refaat, H.; Elmogy, M. King Abdulaziz University Breast Cancer Mammogram Dataset (KAU-BCMD). Data 2021, 6, 111. [Google Scholar] [CrossRef] [Scilit]
- Zhai, X.; Mustafa, B.; Kolesnikov, A.; Beyer, L. Sigmoid loss for language image pre-training. In Proceedings of the IEEE/CVF International Conference on Computer Vision (ICCV), Paris, France, 2–6 October 2023; pp. 11941–11952. [Google Scholar] [CrossRef] [Scilit]
- Lin, T.Y.; Goyal, P.; Girshick, R.; He, K.; Dollár, P. Focal loss for dense object detection. In Proceedings of the IEEE International Conference on Computer Vision (ICCV), Venice, Italy, 22–29 October 2017; pp. 2999–3007. [Google Scholar] [CrossRef] [Scilit]
- Cui, Y.; Jia, M.; Lin, T.Y.; Song, Y.; Belongie, S. Class-balanced loss based on effective number of samples. In Proceedings of the IEEE/CVF Conference on Computer Vision and Pattern Recognition (CVPR), Long Beach, CA, USA, 15–20 June 2019; pp. 9260–9269. [Google Scholar] [CrossRef] [Scilit]
- Barber, R.F.; Candès, E.J.; Ramdas, A.; Tibshirani, R.J. Predictive inference with the jackknife+. Ann. Stat. 2021, 49, 486–507. [Google Scholar] [CrossRef] [Scilit]
- Reichenpfader, D.; Müller, H.; Denecke, K. A scoping review of large language model based approaches for information extraction from radiology reports. npj Digit. Med. 2024, 7, 222. [Google Scholar] [CrossRef] [Scilit] [PubMed]
- Cozzi, A.; Pinker, K.; Hidber, A.; Zhang, T.; Bonomo, L.; Lo Gullo, R.; Christianson, B.; Curti, M.; Rizzo, S.; Del Grande, F.; et al. BI-RADS category assignments by GPT-3.5, GPT-4, and Google Bard: A multilanguage study. Radiology 2024, 311, e232133. [Google Scholar] [CrossRef] [Scilit] [PubMed]
- Dennstädt, F.; Lerch, L.; Schmerder, M.; Cihoric, N.; Cereghetti, G.M.; Gaio, R.; Bonel, H.; Filchenko, I.; Hastings, J.; Dammann, F.; et al. A comparative performance analysis of regular expressions and a large language model-based approach to extract the BI-RADS score from radiological reports. JAMIA Open 2025, 8, ooaf128. [Google Scholar] [CrossRef] [Scilit] [PubMed]
- Kapoor, S.; Narayanan, A. Leakage and the reproducibility crisis in machine-learning-based science. Patterns 2023, 4, 100804. [Google Scholar] [CrossRef] [Scilit] [PubMed]
- Barnett, A.J.; Schwartz, F.R.; Tao, C.; Chen, C.; Ren, Y.; Lo, J.Y.; Rudin, C. A case-based interpretable deep learning model for classification of mass lesions in digital mammography. Nat. Mach. Intell. 2021, 3, 1061–1070. [Google Scholar] [CrossRef] [Scilit]
- Chen, C.; Li, O.; Tao, C.; Barnett, A.J.; Su, J.; Rudin, C. This looks like that: Deep learning for interpretable image recognition. In Proceedings of the Advances in Neural Information Processing Systems (NeurIPS), Vancouver, BC, Canada, 8–14 December 2019. [Google Scholar]
- Sundararajan, M.; Taly, A.; Yan, Q. Axiomatic attribution for deep networks. In Proceedings of the International Conference on Machine Learning (ICML), Sydney, Australia, 6–11 August 2017. [Google Scholar]
- Maier-Hein, L.; Reinke, A.; Godau, P.; Tizabi, M.D.; Buettner, F.; Christodoulou, E.; Glocker, B.; Isensee, F.; Kleesiek, J.; Kozubek, M.; et al. Metrics reloaded: Recommendations for image analysis validation. Nat. Methods 2024, 21, 195–212. [Google Scholar] [CrossRef] [Scilit] [PubMed]
- Vickers, A.J.; Elkin, E.B. Decision curve analysis: A novel method for evaluating prediction models. Med. Decis. Mak. 2006, 26, 565–574. [Google Scholar] [CrossRef] [Scilit] [PubMed]
- Van Calster, B.; McLernon, D.J.; van Smeden, M.; Wynants, L.; Steyerberg, E.W. Calibration: The Achilles heel of predictive analytics. BMC Med. 2019, 17, 230. [Google Scholar] [CrossRef] [Scilit] [PubMed]
- Tejani, A.S.; Klontzas, M.E.; Gatti, A.A.; Mongan, J.T.; Moy, L.; Park, S.H.; Kahn, C.E., Jr. CLAIM 2024 Update Panel. Checklist for Artificial Intelligence in Medical Imaging (CLAIM): 2024 update. Radiol. Artif. Intell. 2024, 6, e240300. [Google Scholar] [CrossRef] [Scilit] [PubMed]
- Moons, K.G.M.; Damen, J.A.A.; Kaul, T.; Hooft, L.; Andaur Navarro, C.; Dhiman, P.; Beam, A.L.; Van Calster, B.; Celi, L.A.; Denaxas, S.; et al. PROBAST+AI: An updated quality, risk of bias, and applicability assessment tool for prediction models using regression or artificial intelligence methods. BMJ 2025, 388, e082505. [Google Scholar] [CrossRef] [Scilit] [PubMed]
- Vasey, B.; Nagendran, M.; Campbell, B.; Clifton, D.A.; Collins, G.S.; Denaxas, S.; Denniston, A.K.; Faes, L.; Geerts, B.; Ibrahim, M.; et al. Reporting guideline for the early-stage clinical evaluation of decision support systems driven by artificial intelligence: DECIDE-AI. Nat. Med. 2022, 28, 924–933. [Google Scholar] [CrossRef] [PubMed]
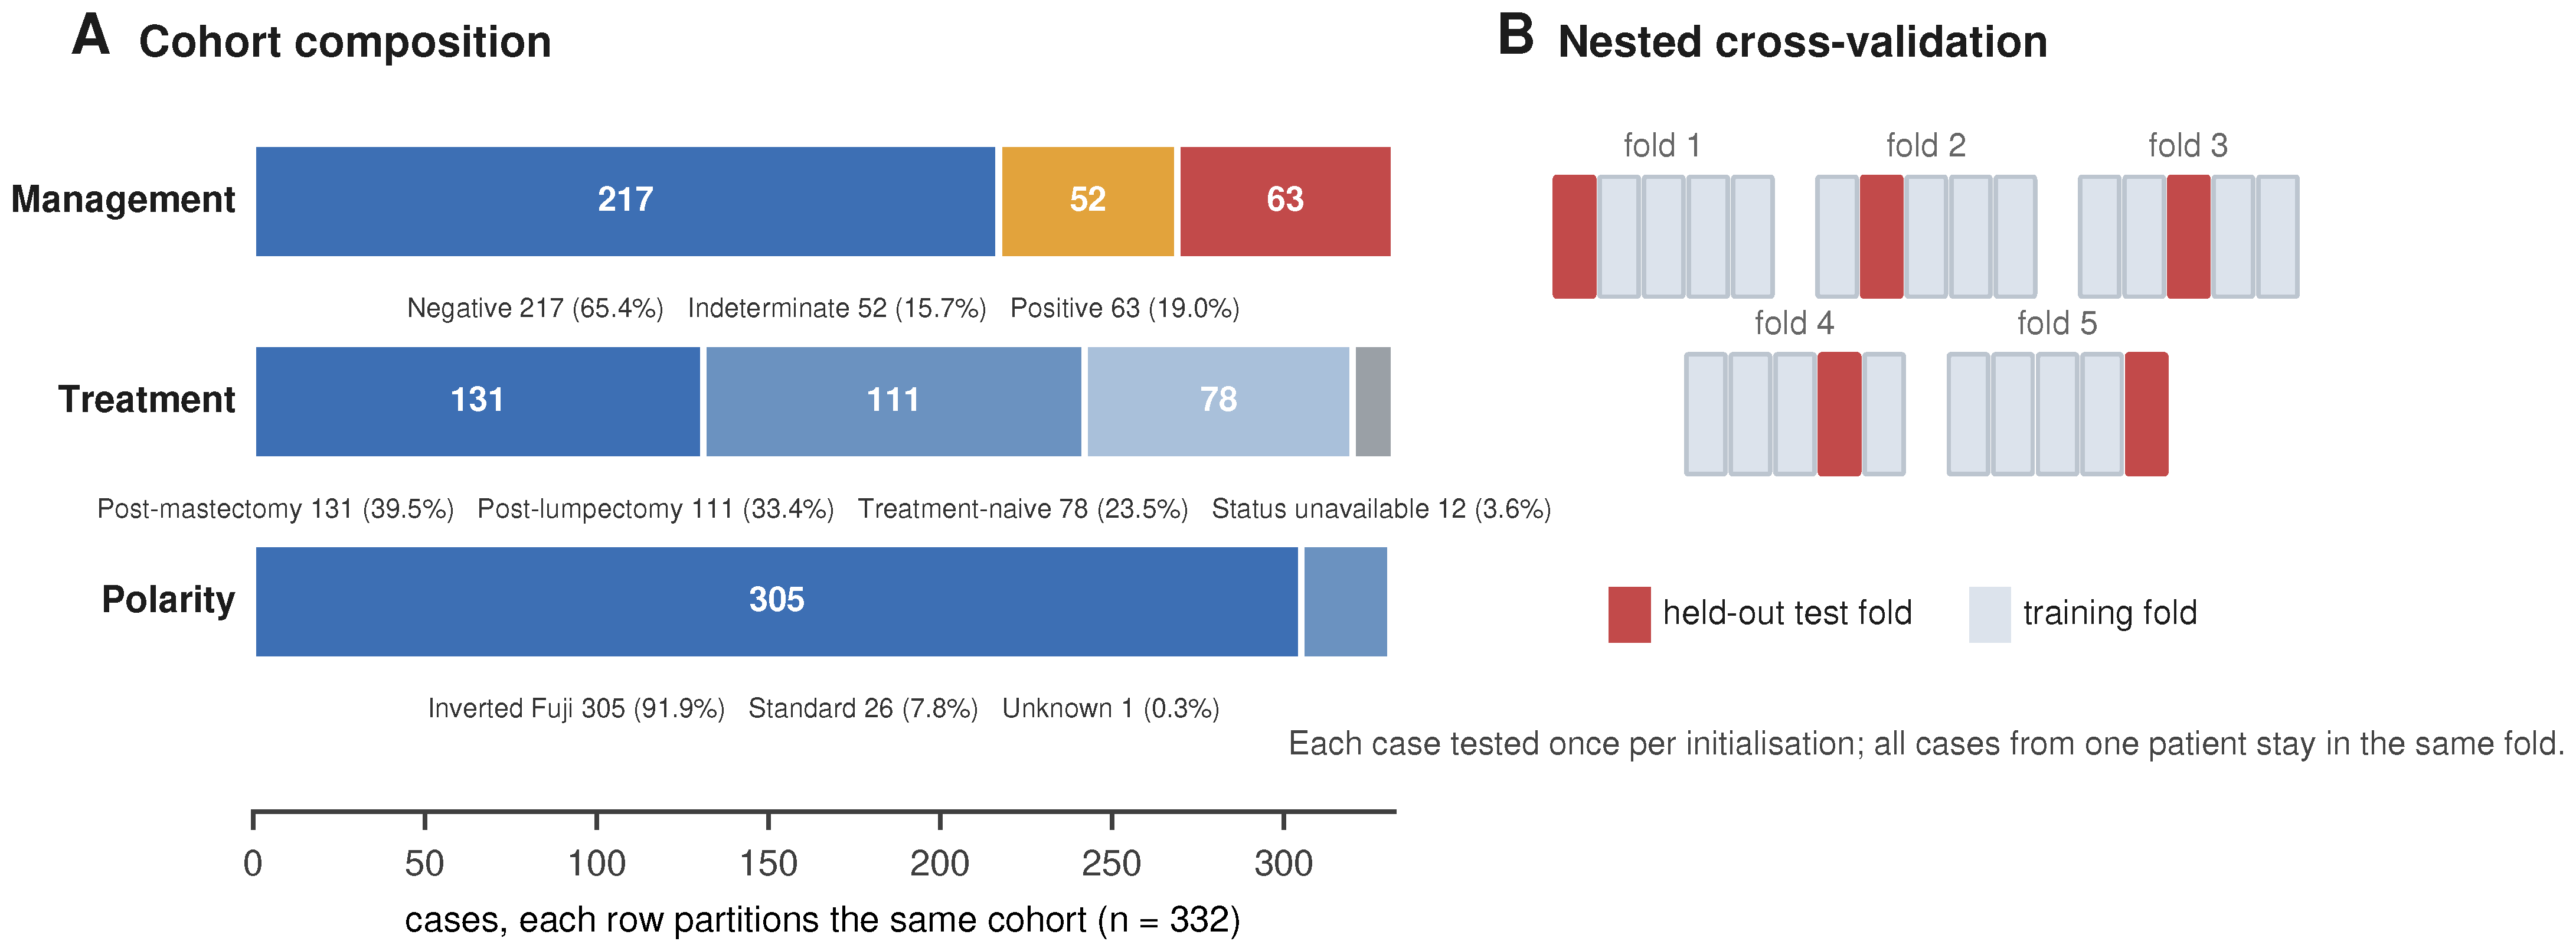
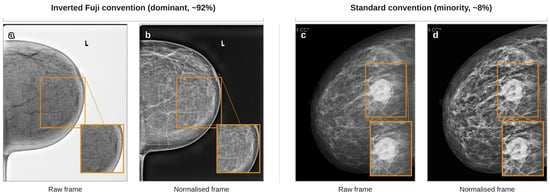
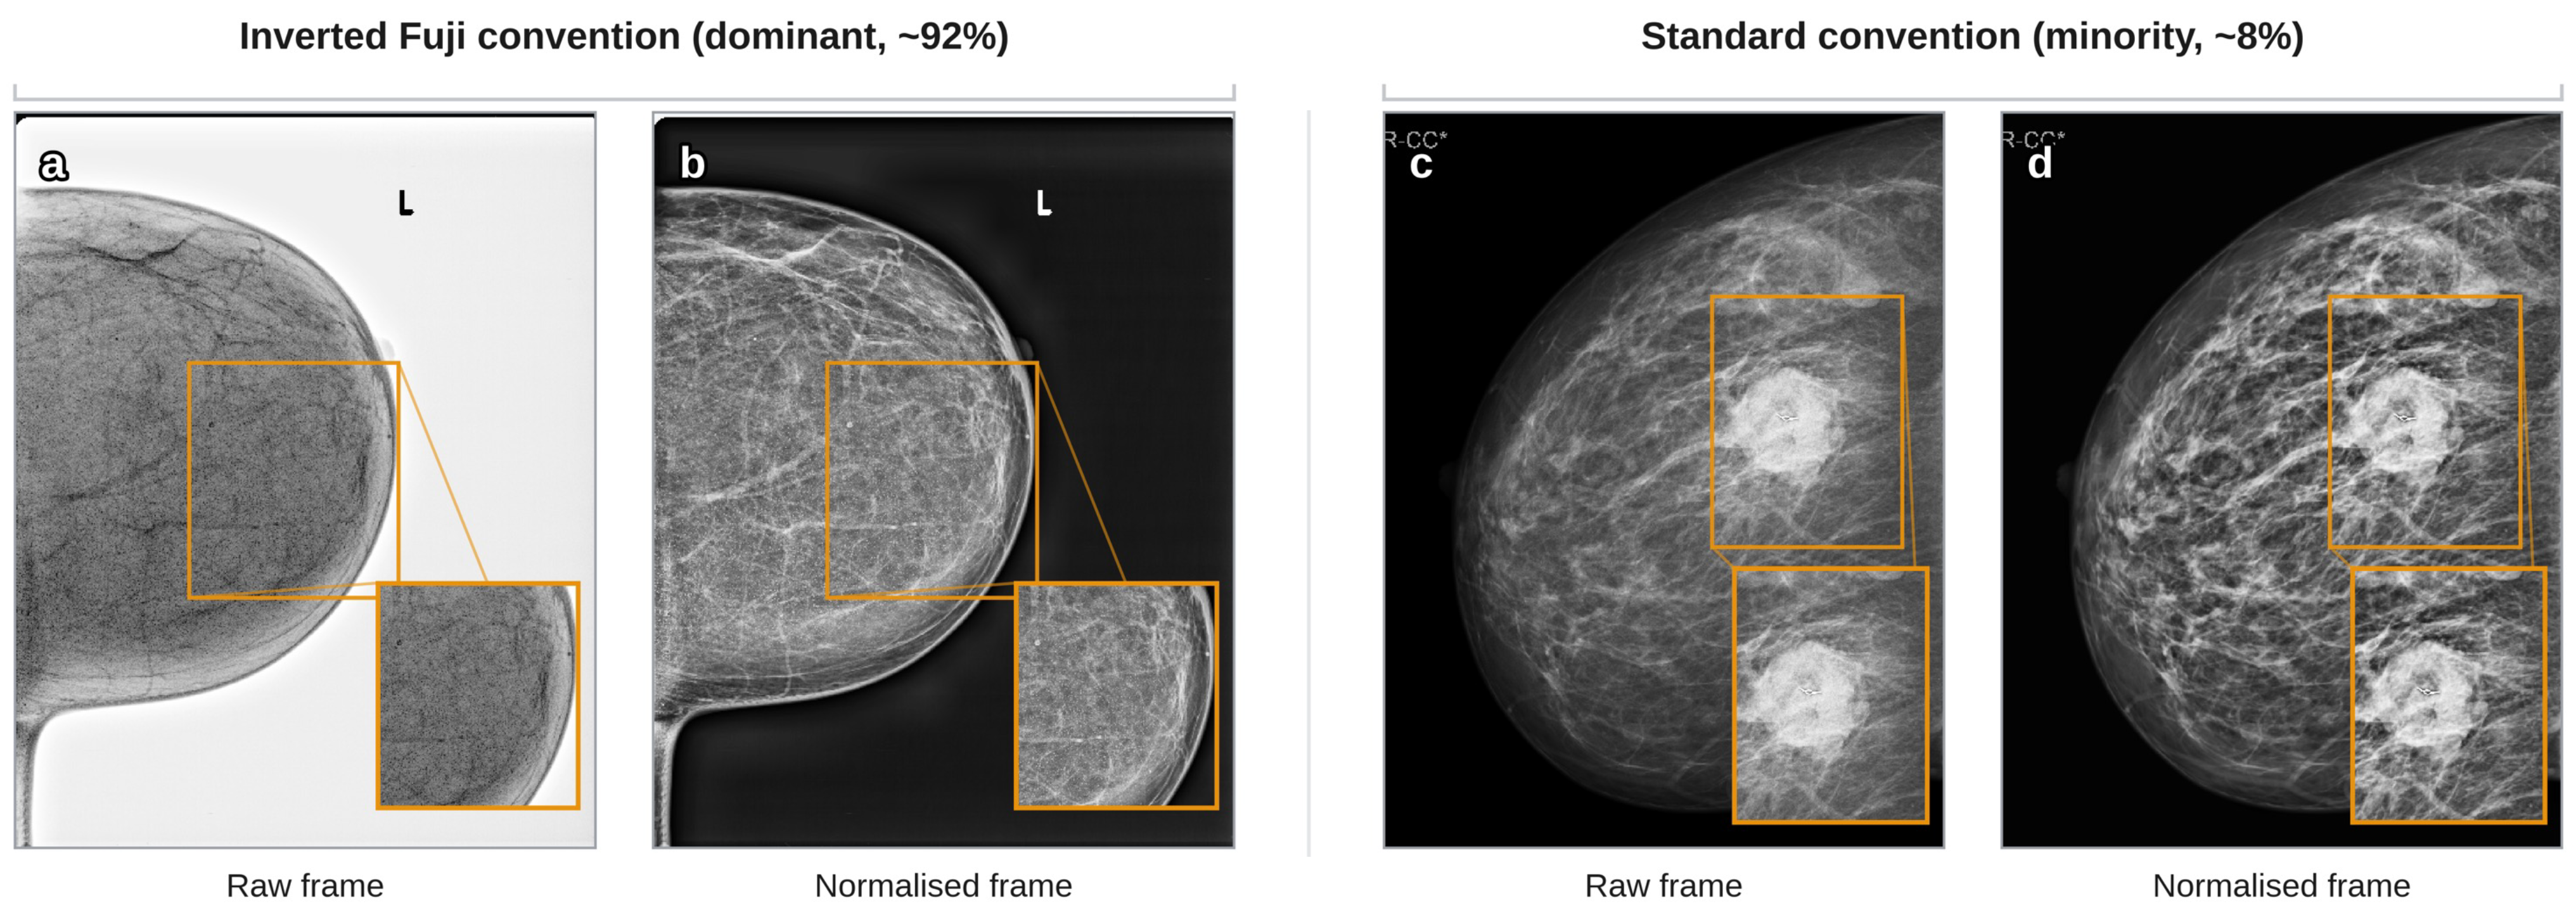
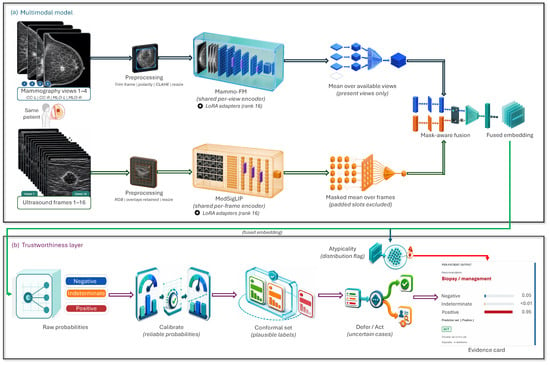
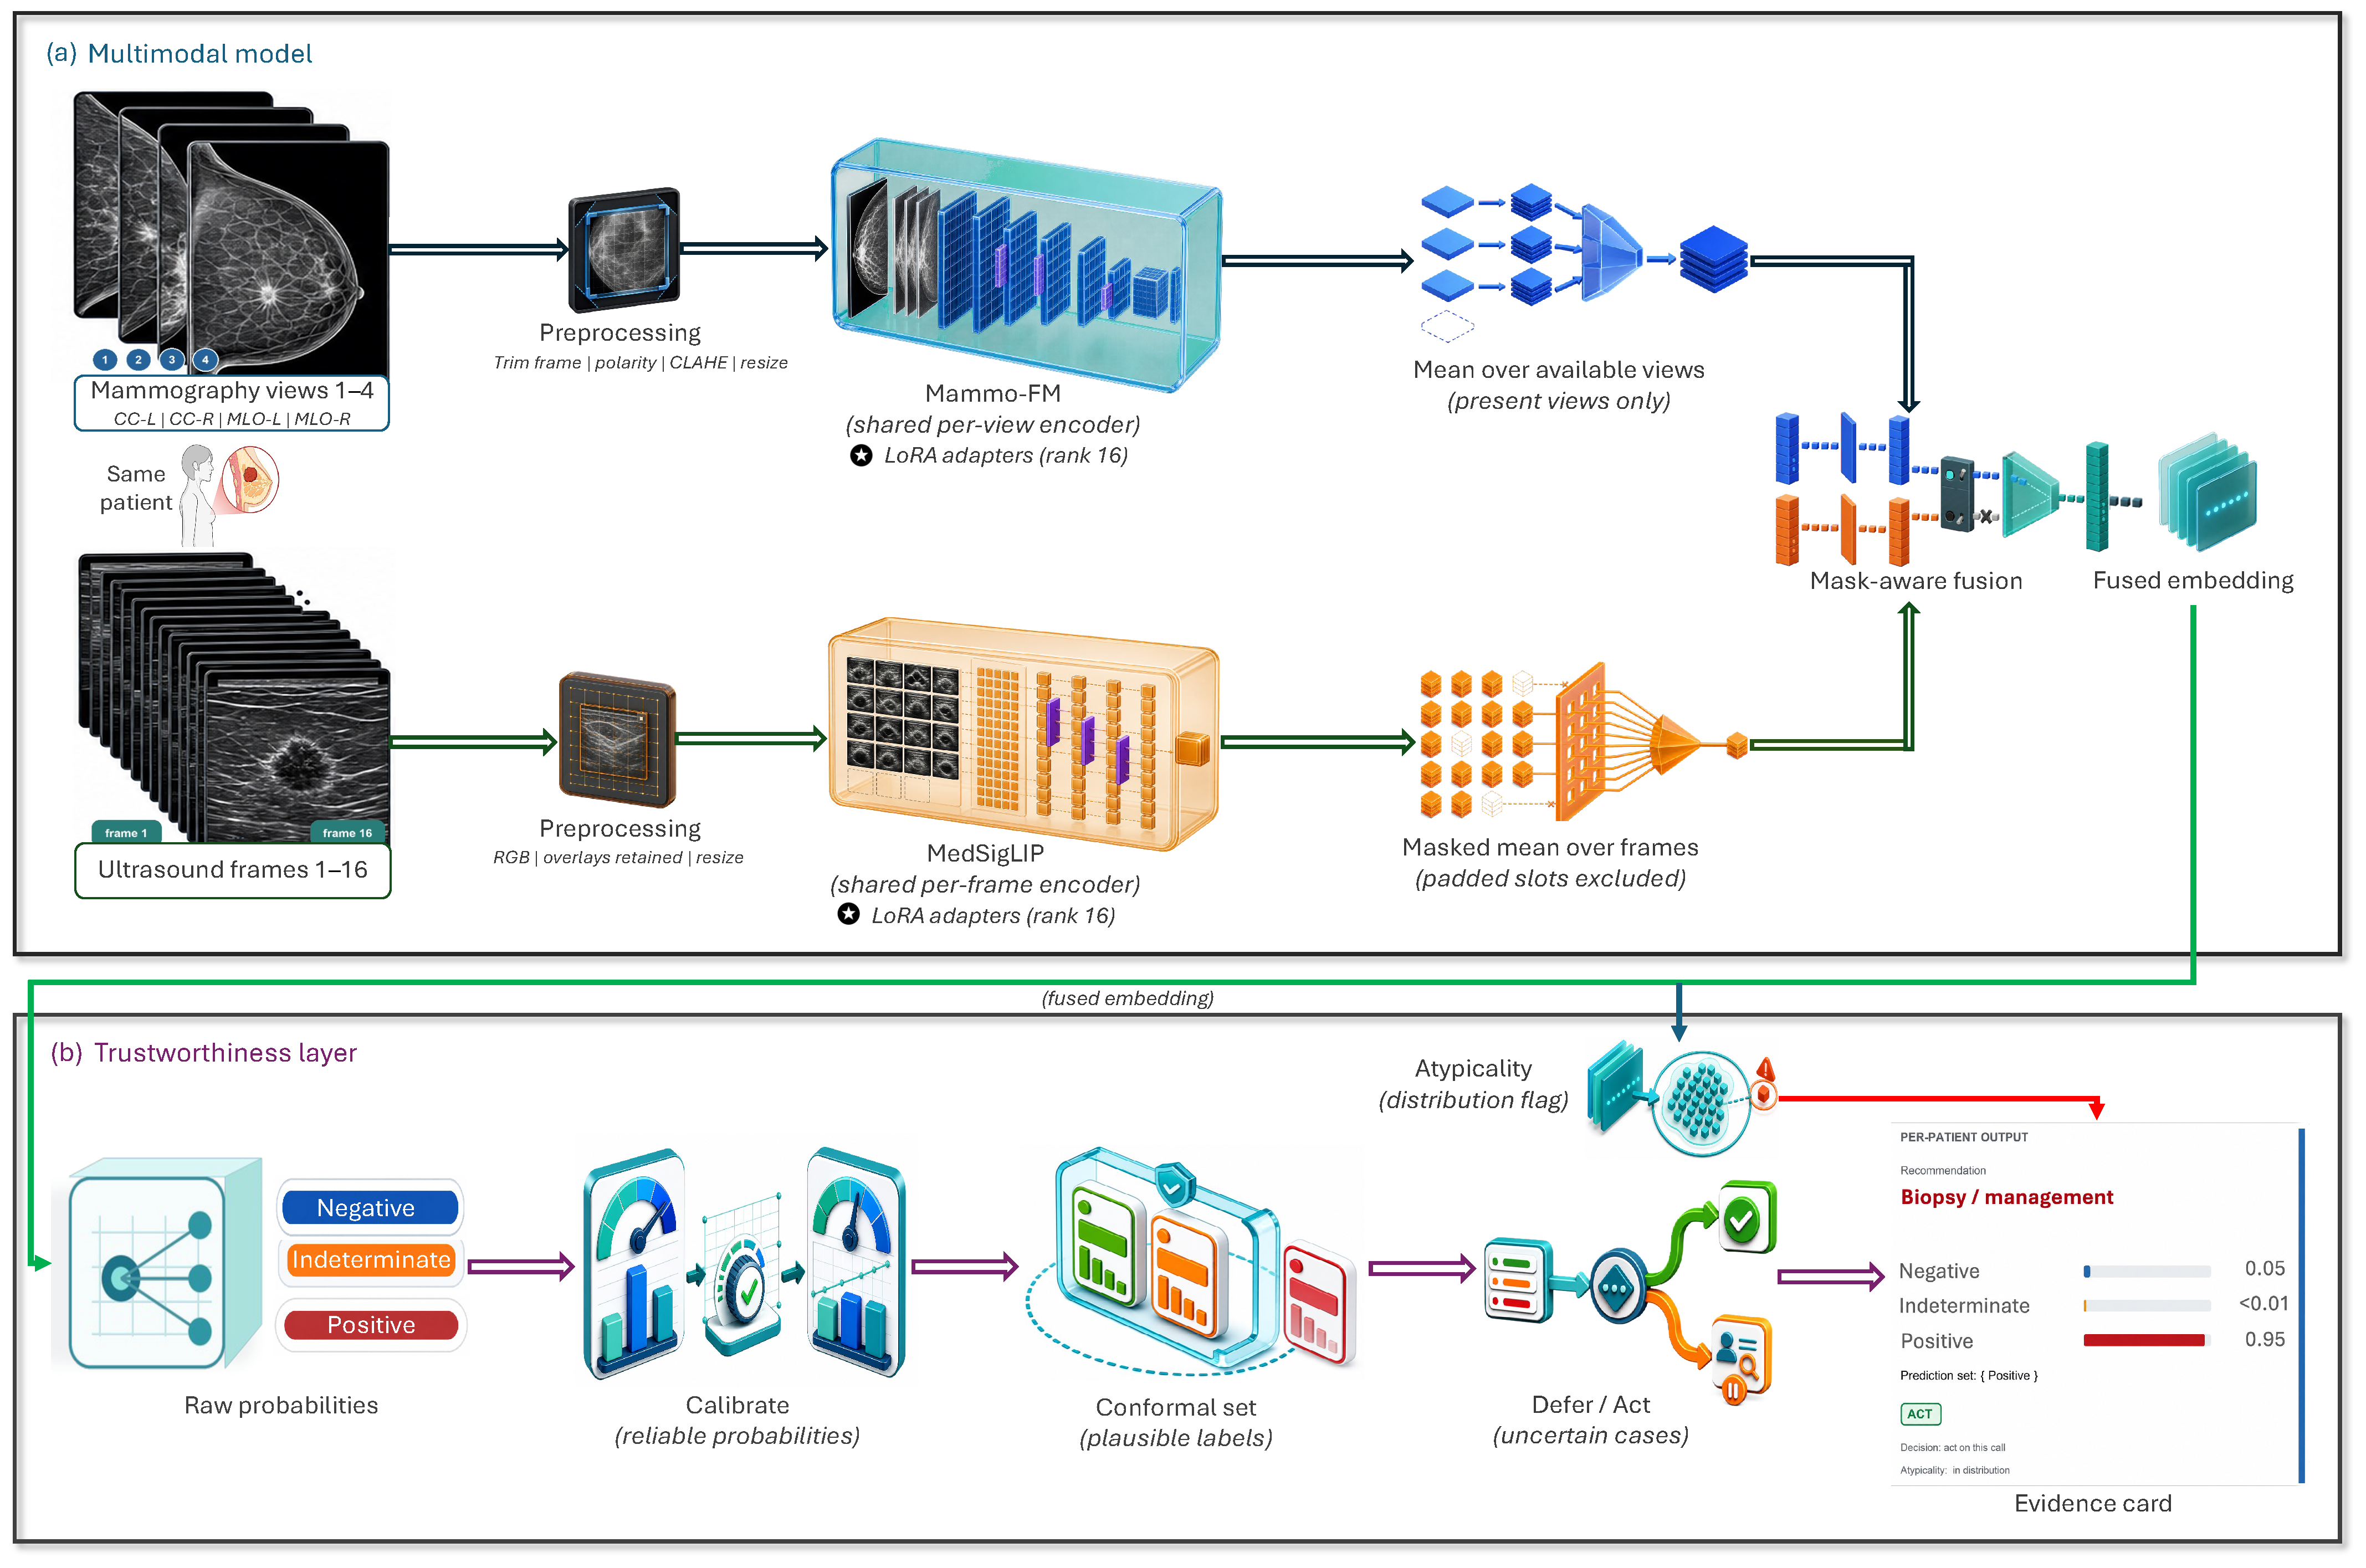
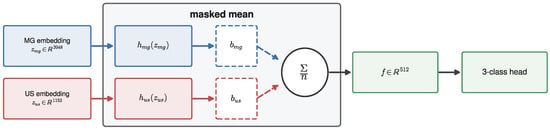
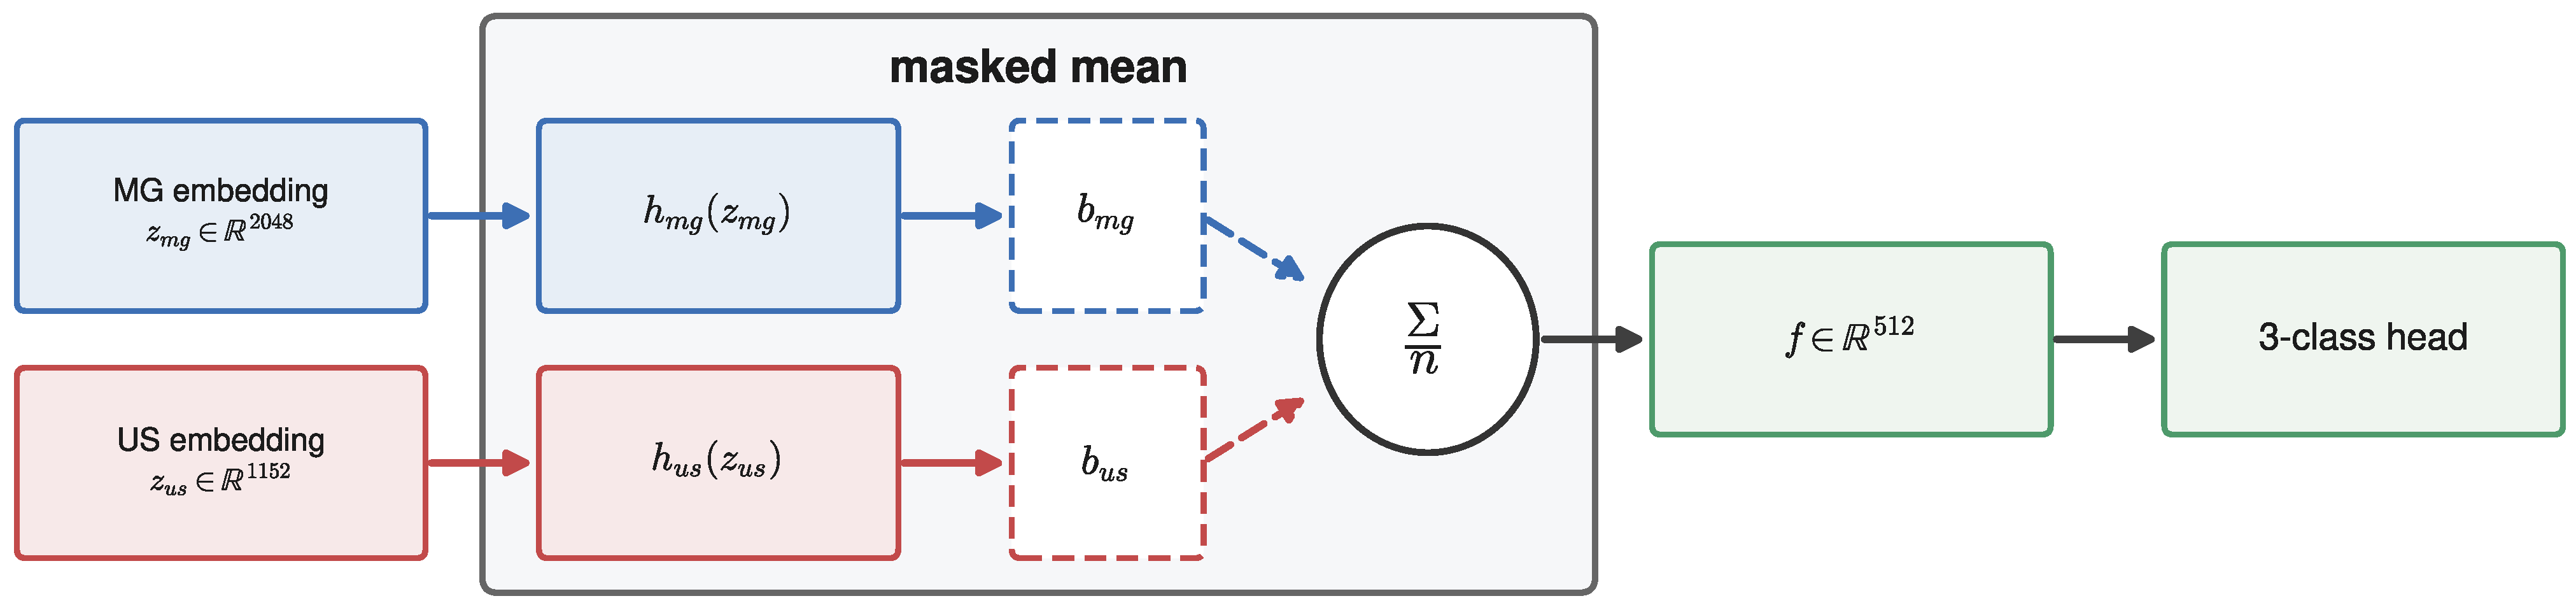
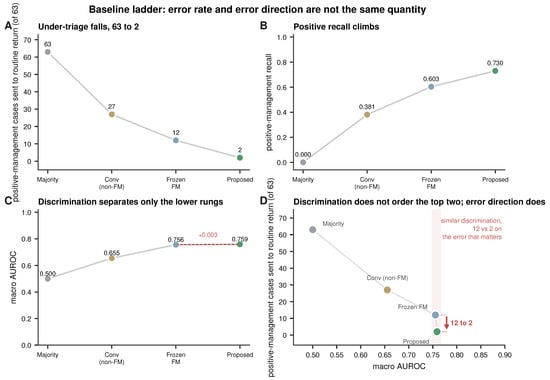
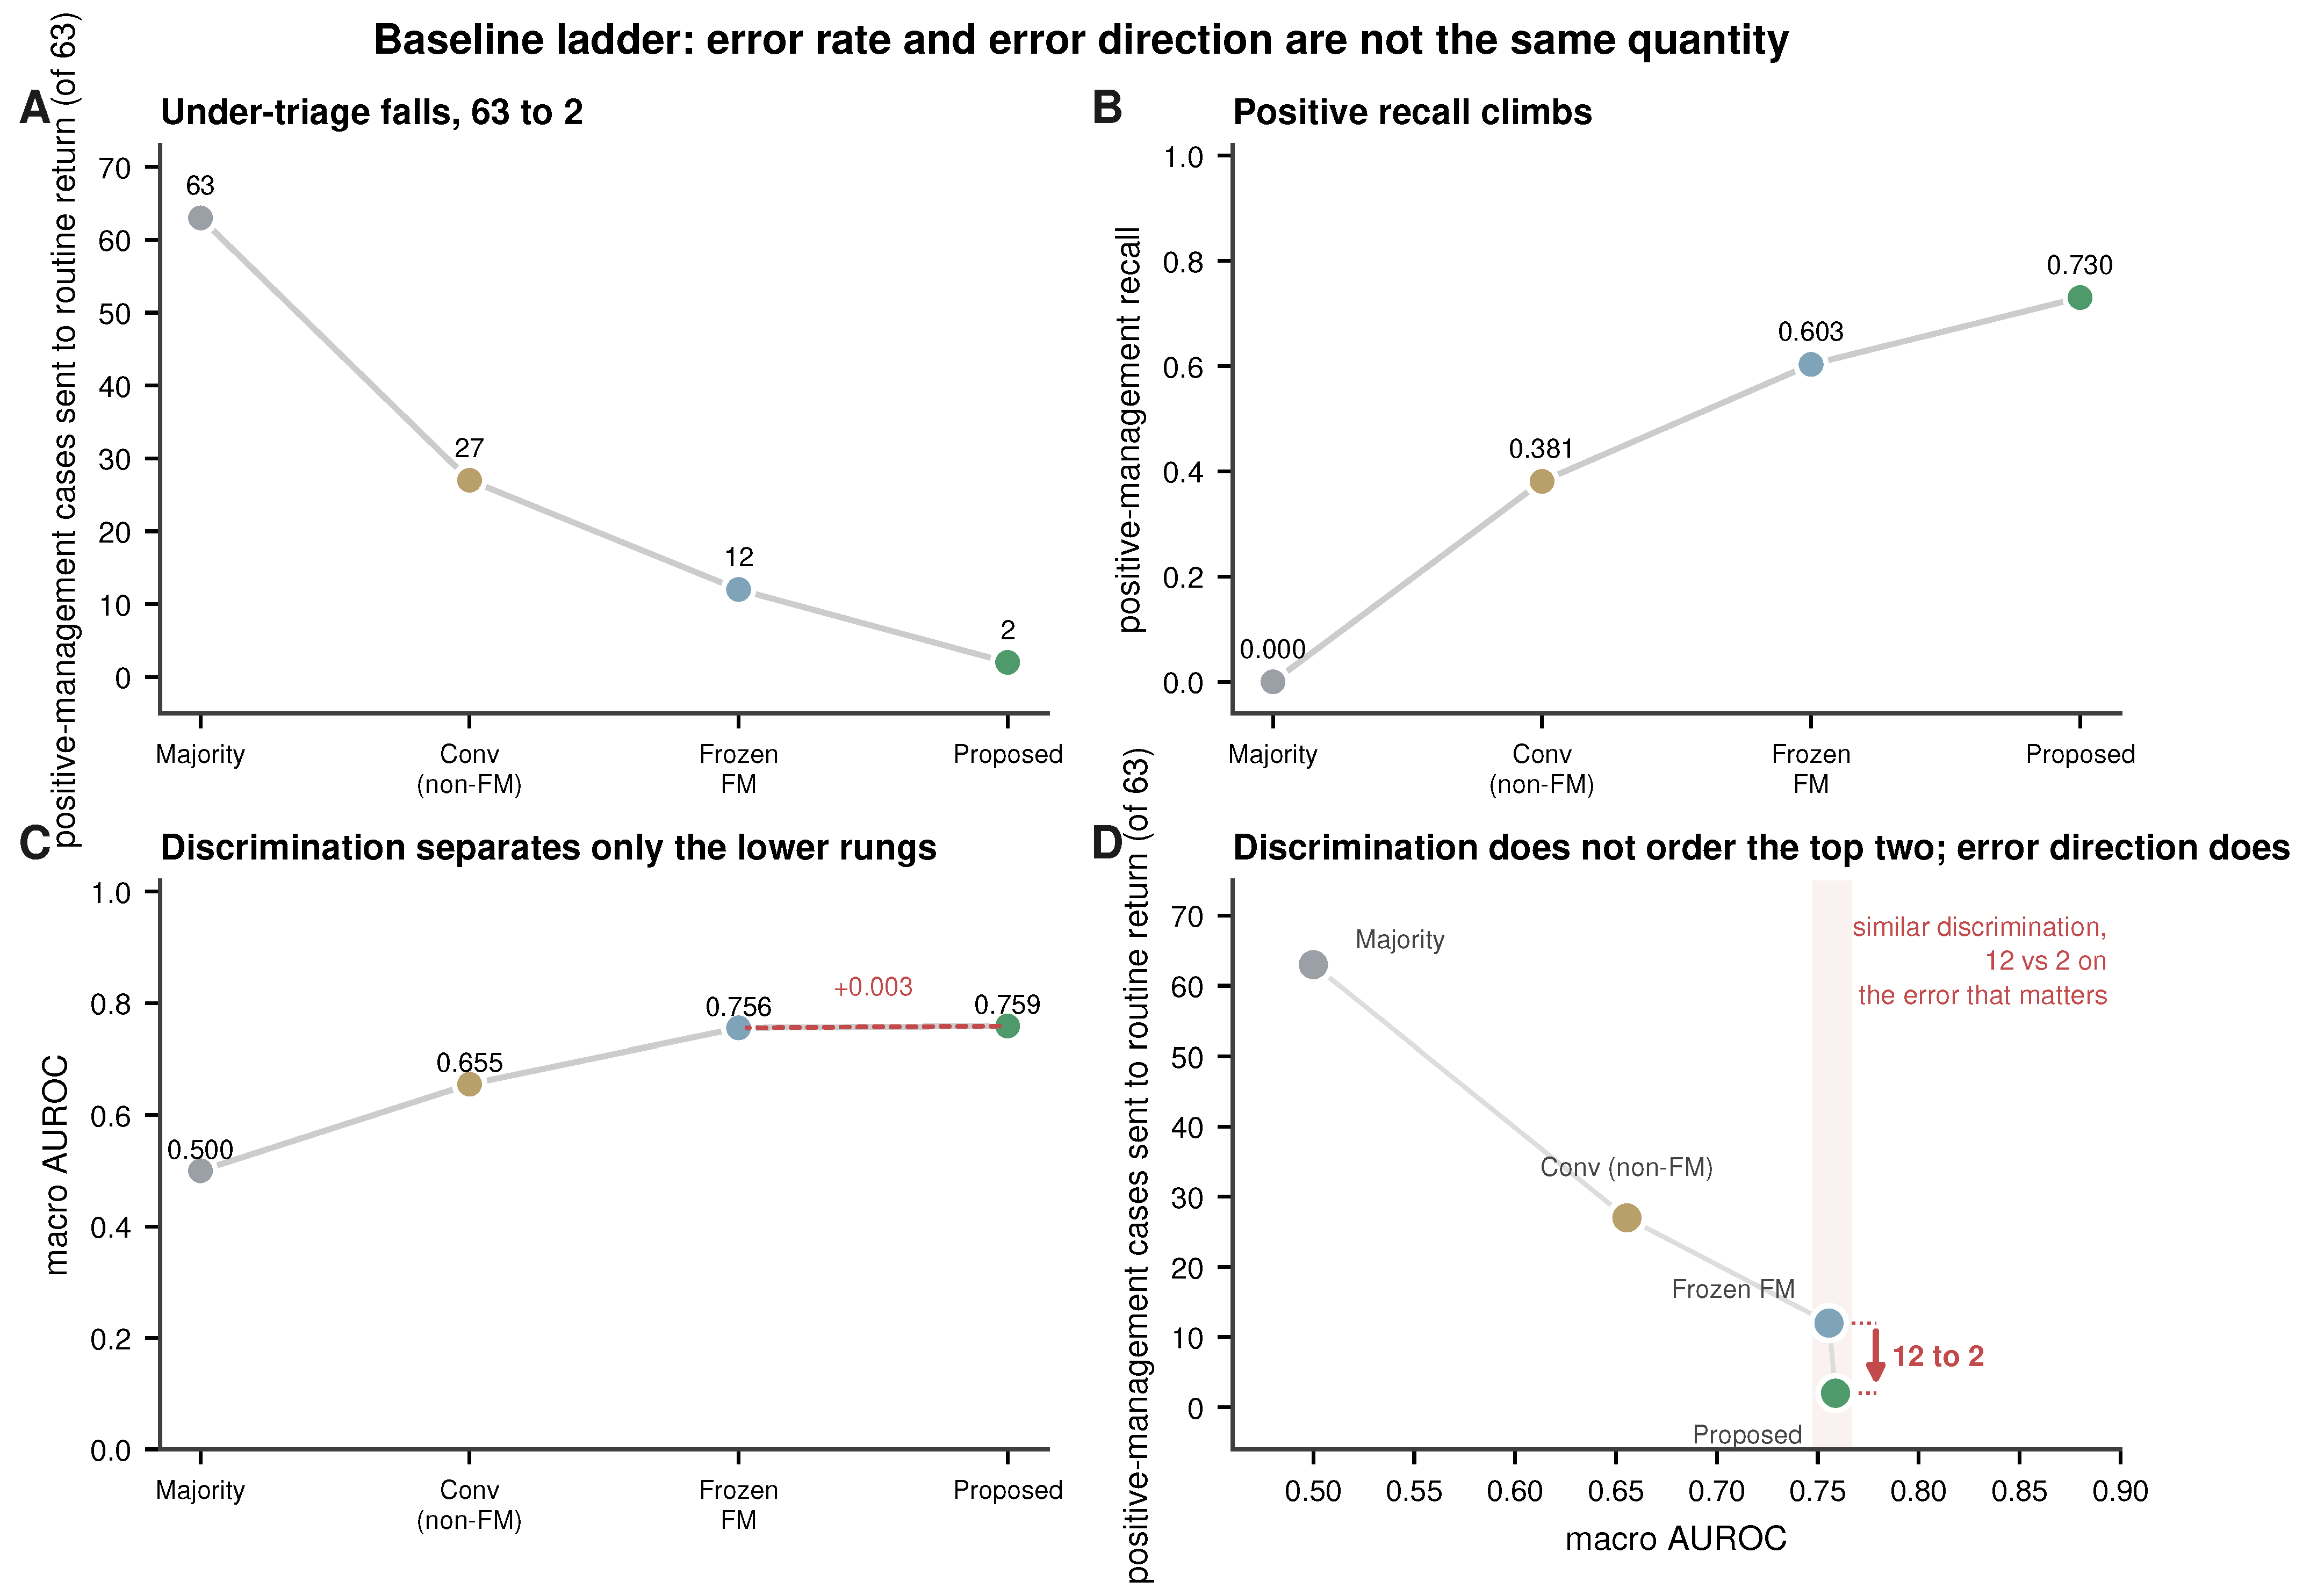
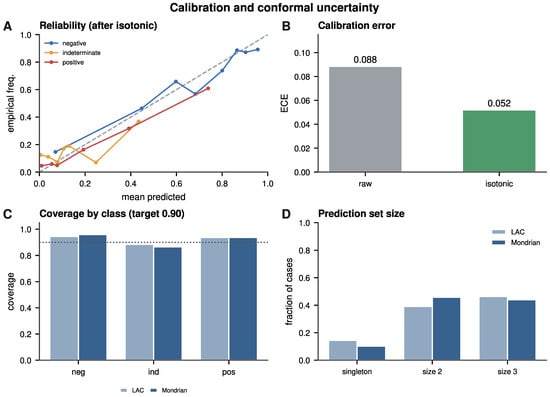
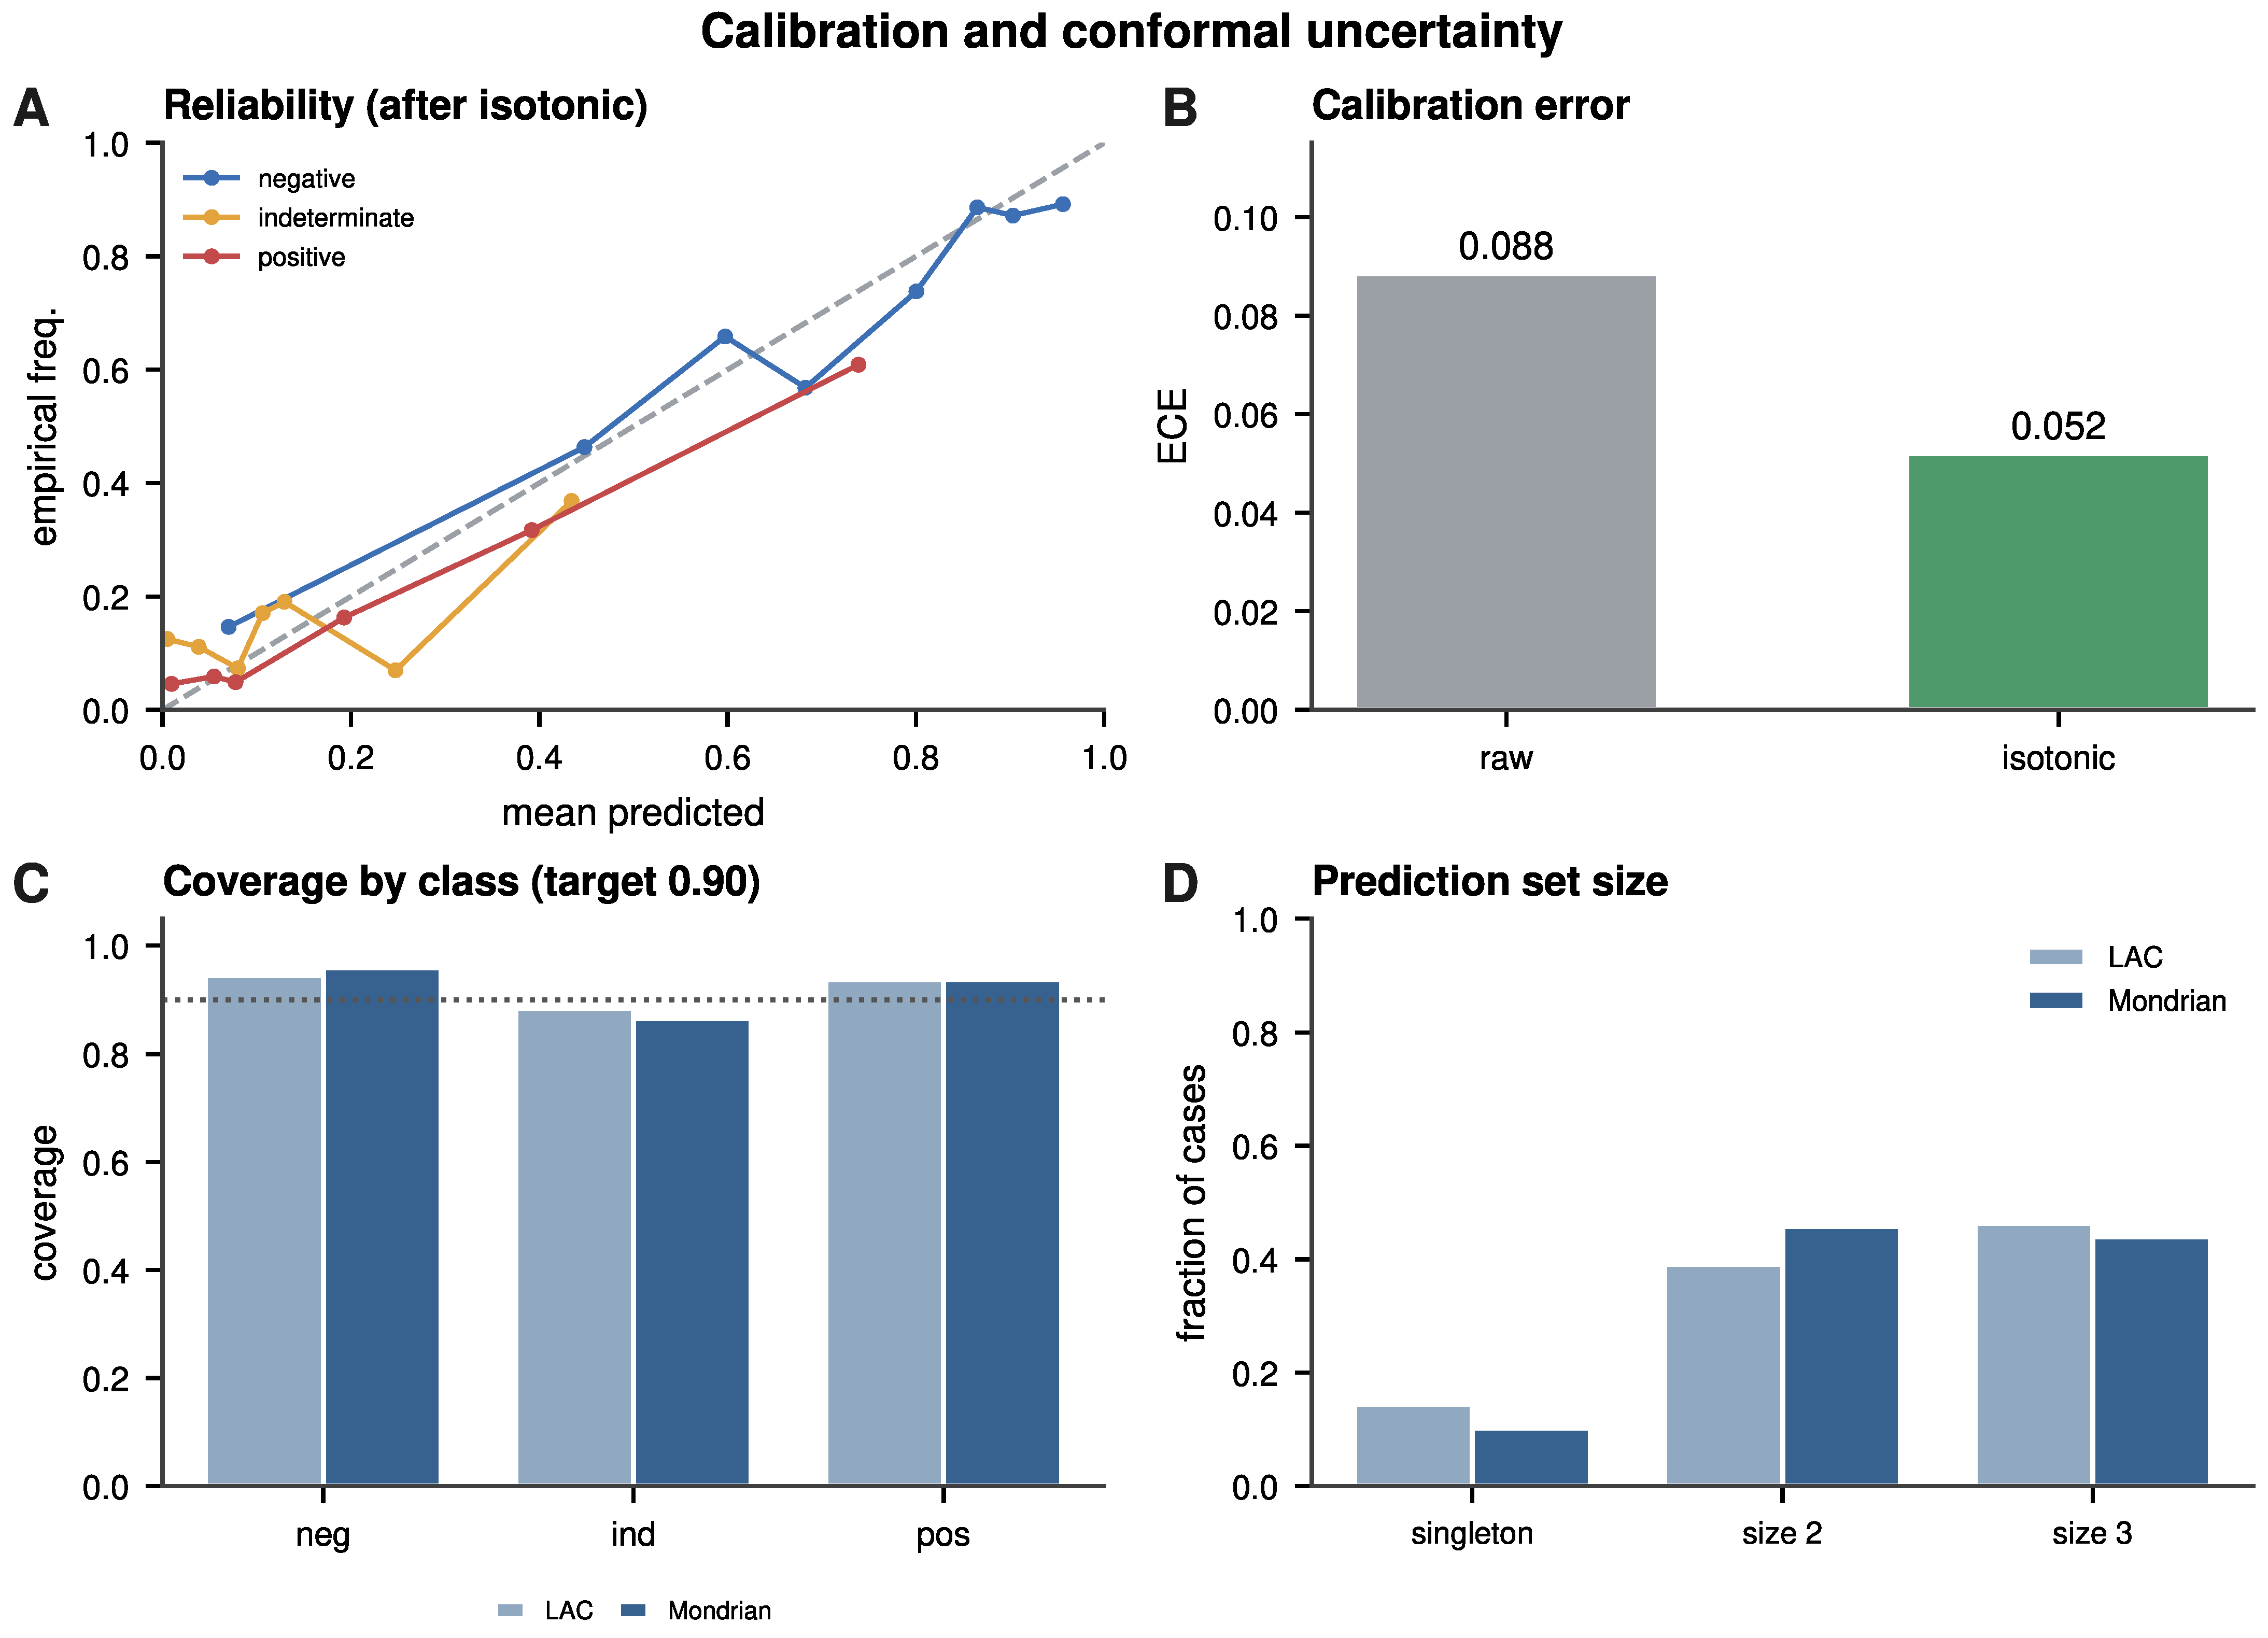
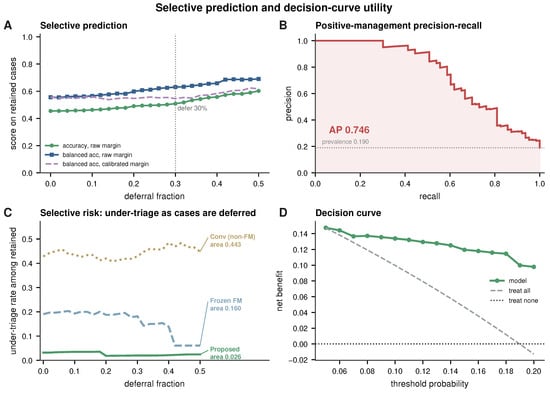
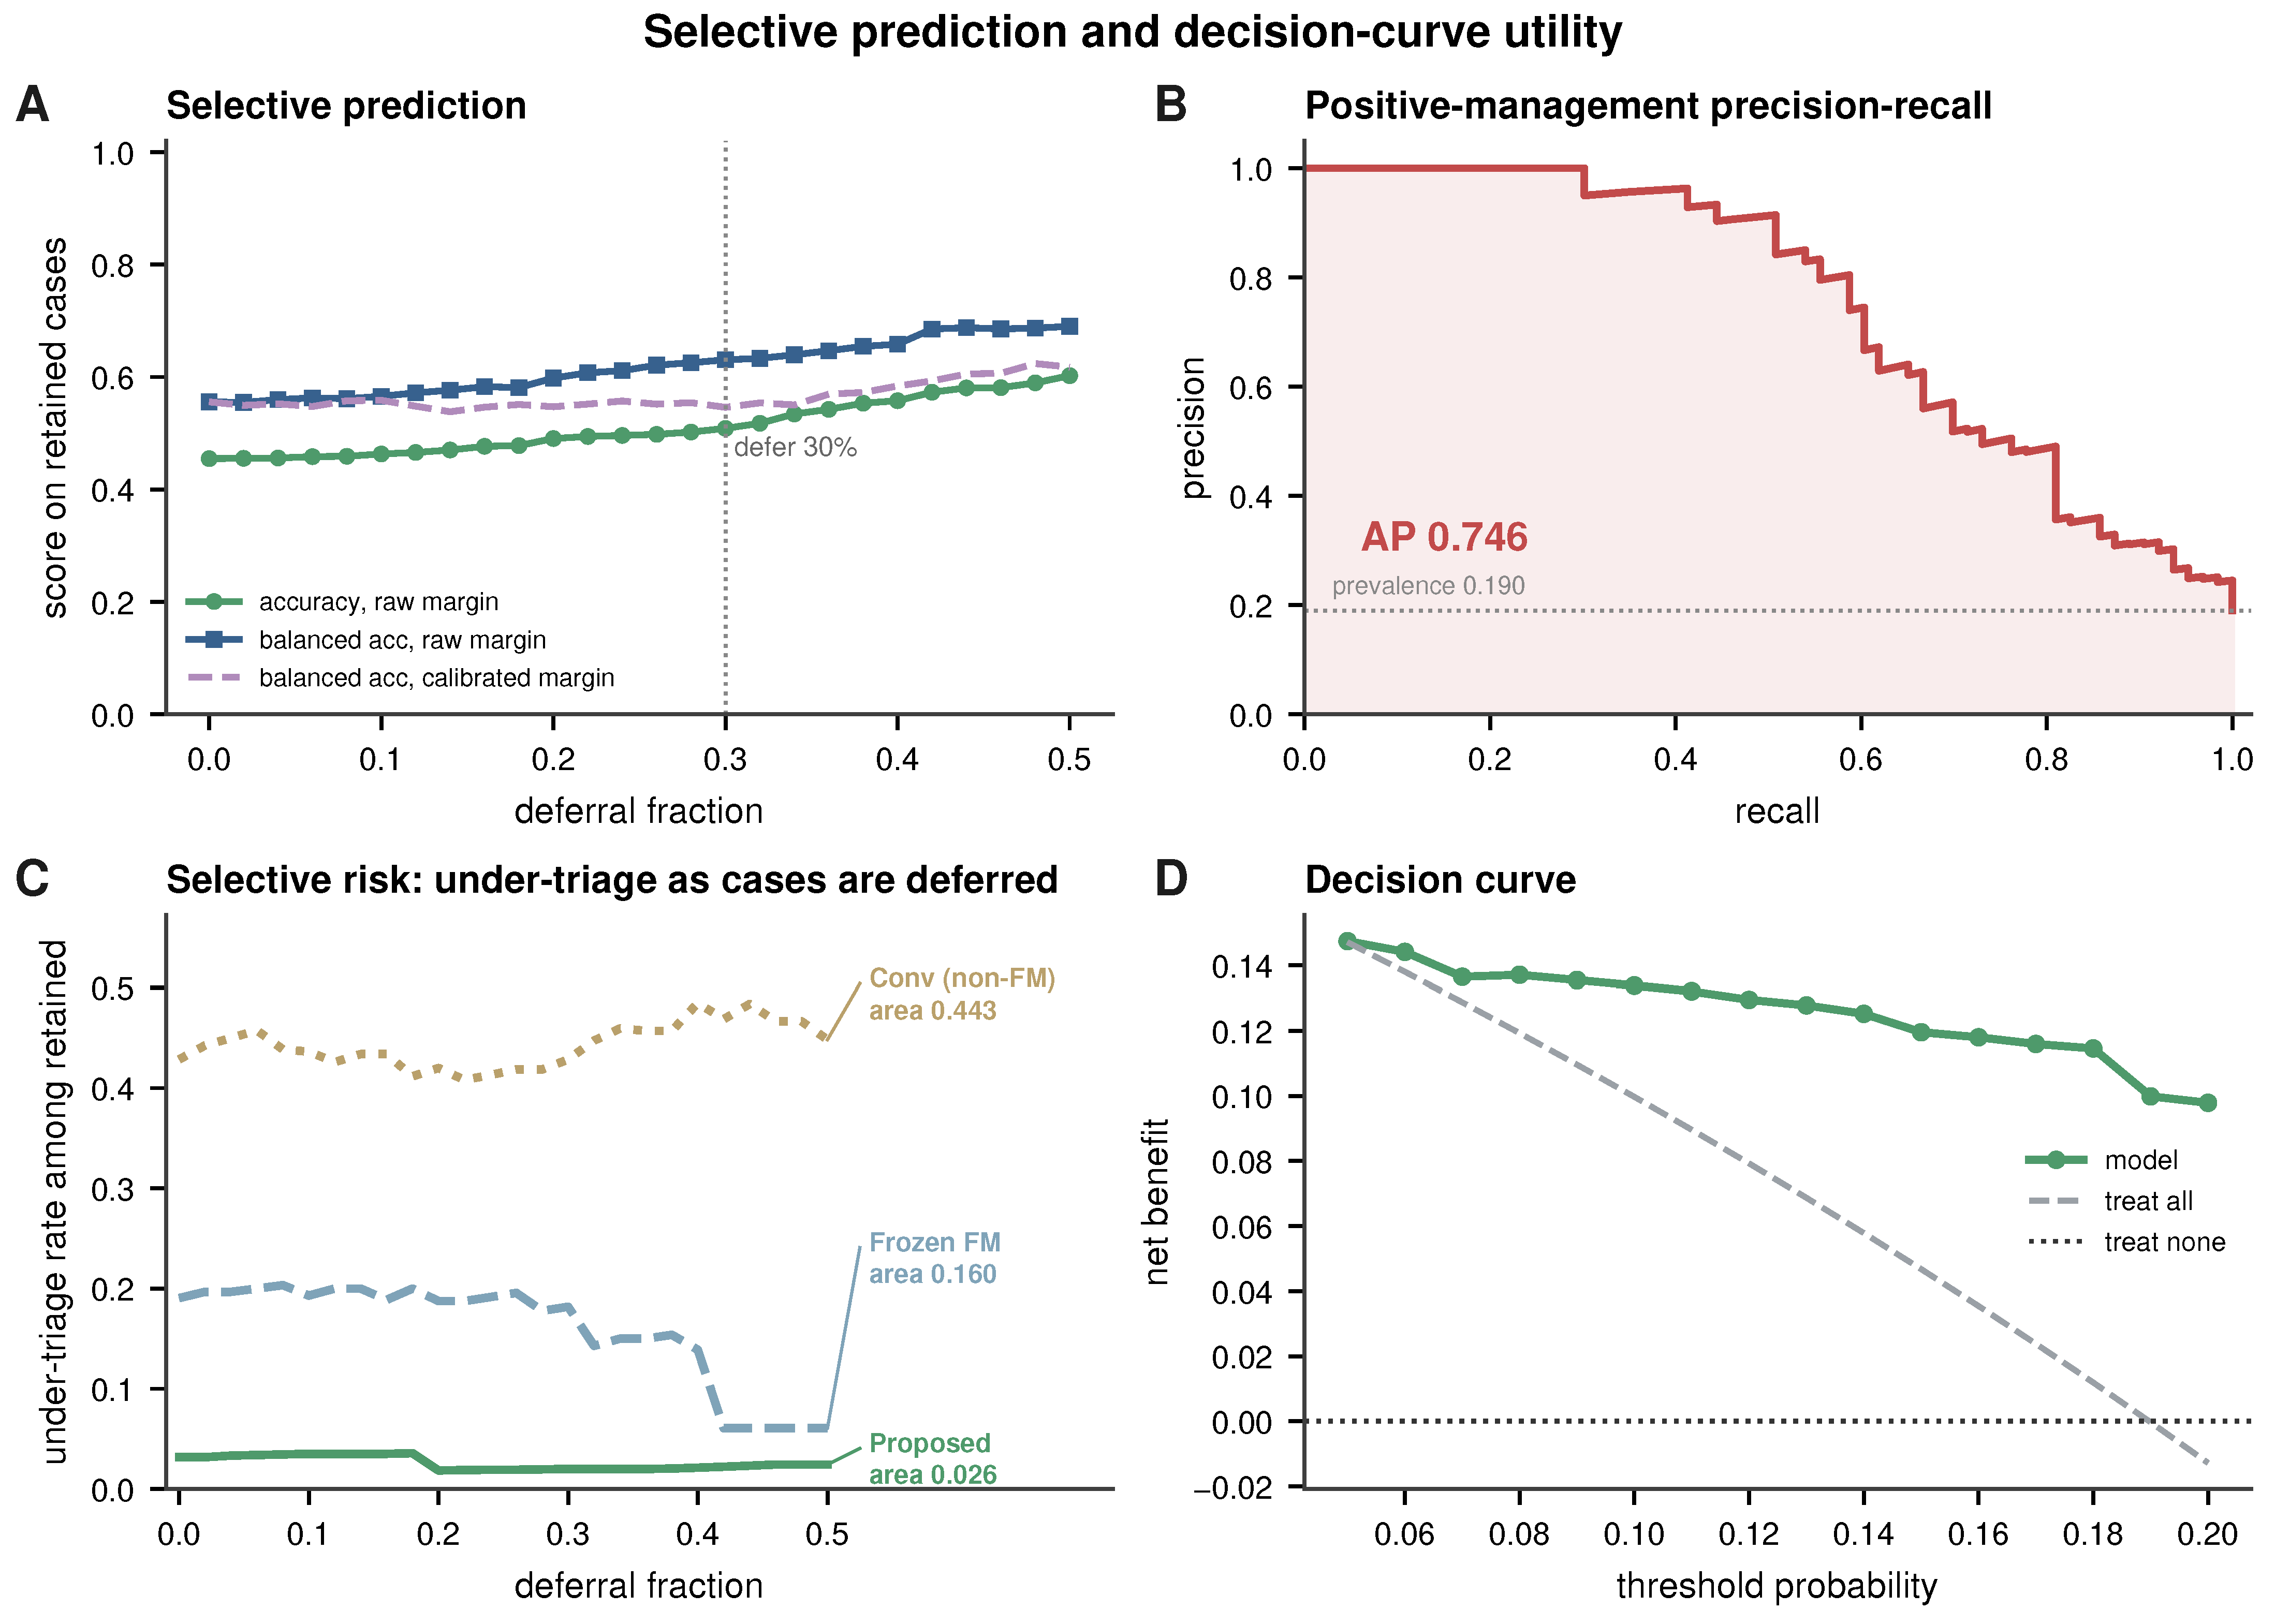
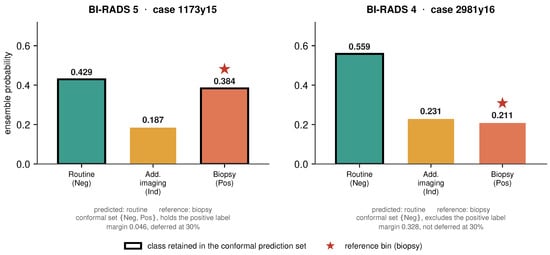
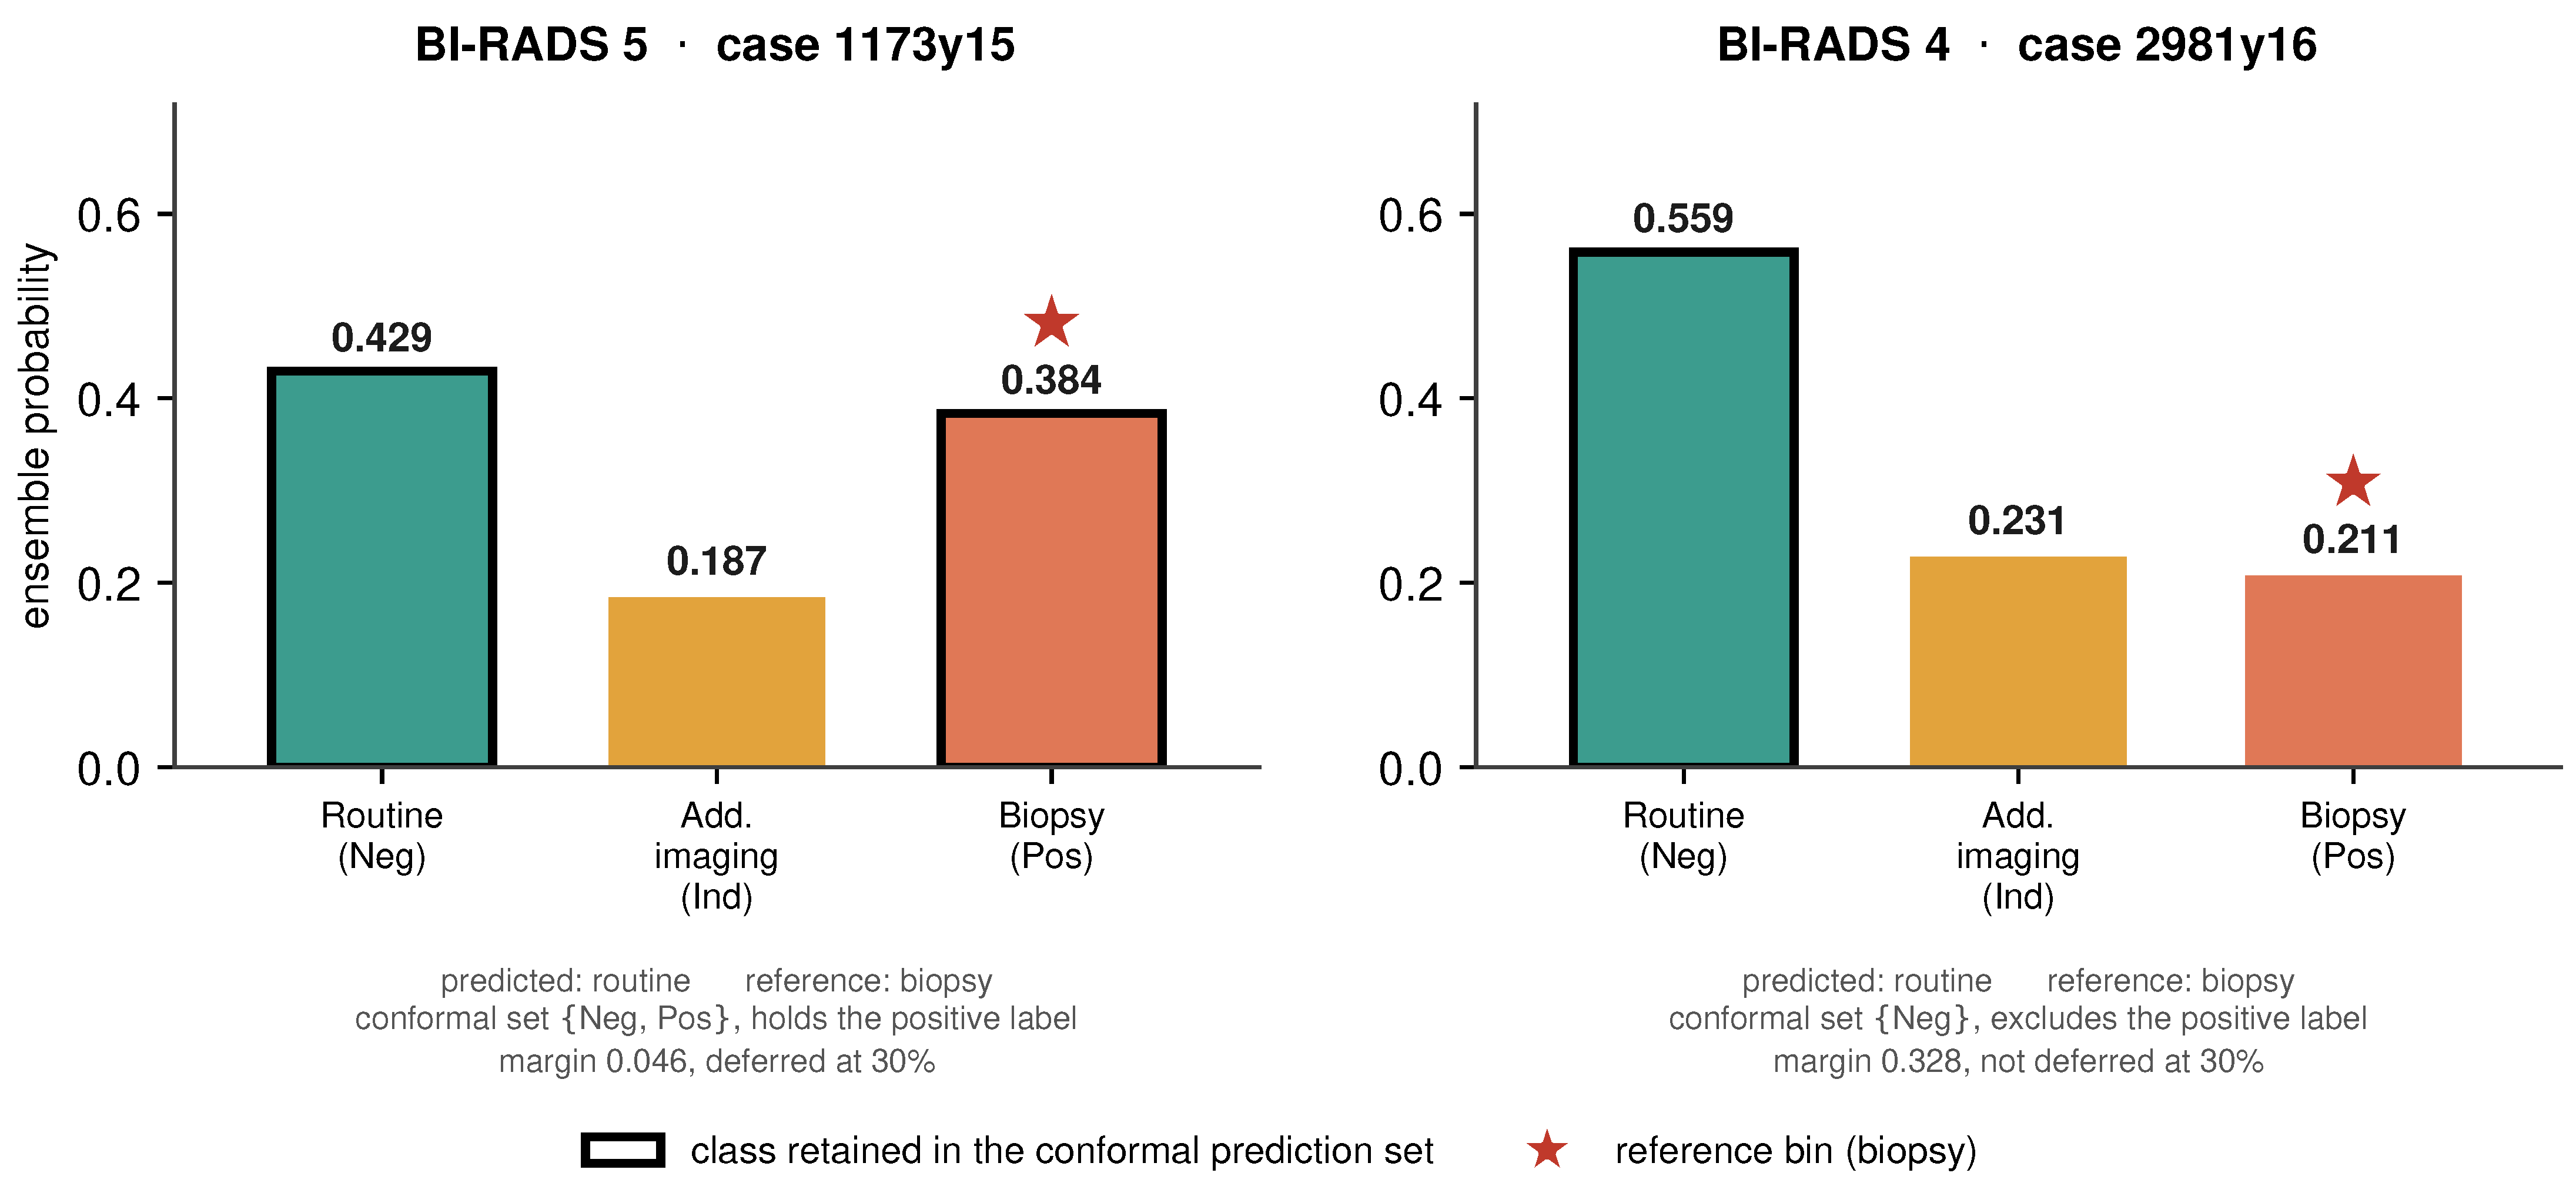
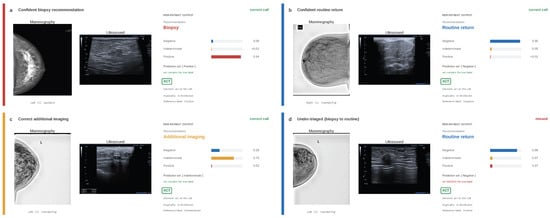
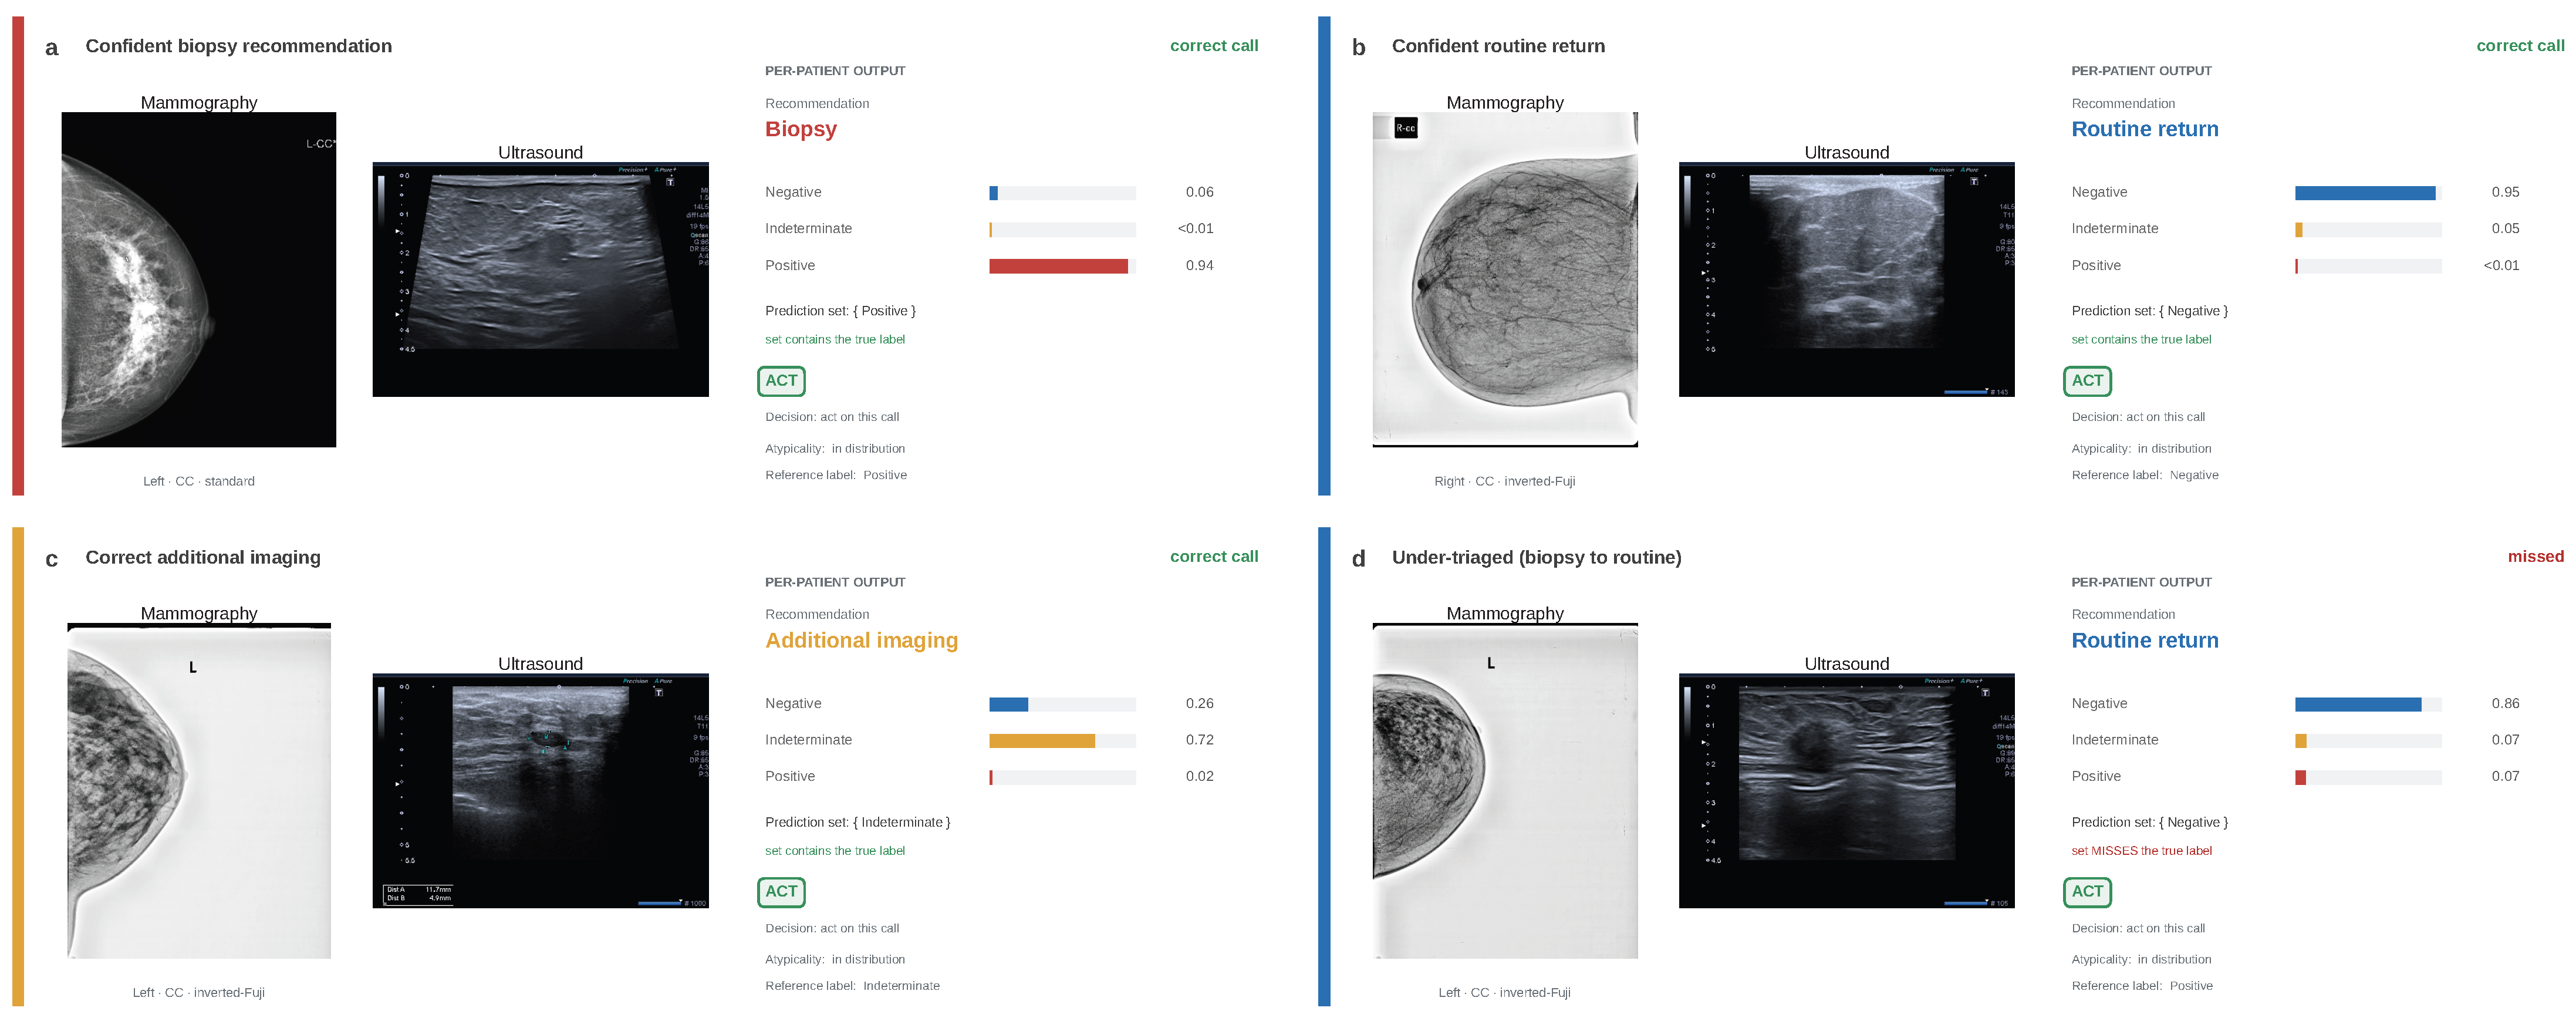

Disclaimer/Publisher’s Note: The statements, opinions and data contained in all publications are solely those of the individual author(s) and contributor(s) and not of MDPI and/or the editor(s). MDPI and/or the editor(s) disclaim responsibility for any injury to people or property resulting from any ideas, methods, instructions or products referred to in the content. |
© 2026 by the authors. Licensee MDPI, Basel, Switzerland. This article is an open access article distributed under the terms and conditions of the Creative Commons Attribution (CC BY) license.