


Abstract
Background: The growing volume of DNA sequence data demands efficient metagenomic identification. It provides the possibility of constructing tools with sustainability performance to monitor environmental conditions, including risks related to organisms and pathogens. Methods: A convolutional neural network (CNN) leveraging contrastive learning is used to select representative sequences, which improve computational efficiency. Results: We present Exquisitor, which is a CNN-based tool. Benchmarking against classical methods shows higher classification quality and competitive execution time within this setting. Conclusion: This paper highlights the potential of CNNs for improving the performance of metagenomic identification including taxonomic classification.
1. Introduction
The use of information about genetic material found in the environment, combined with sequence databases, enables metagenomic identification—the identification of organisms present in a given sample. With the development of next-generation sequencing methods [1], sequencing costs have decreased significantly, and the number of DNA sequences being analysed has increased [2]. Traditional tools like BLAST often require unacceptable time and computational resources due to explosive database growth [3]. Consequently, new methods are needed to enable efficient analysis using available resources.
This paper proposes a fast, high-quality metagenomic identification method using an artificial neural network (ANN) to select representative genetic sequences. Instead of classifying every environmental sequence, our approach focuses on identifying a representative subset for identification, thereby reducing computational complexity while maintaining accuracy.
Historically, the Needleman–Wunsch algorithm [4] first enabled genetic sequence comparison. Later, Lipman and Wilbur [5] introduced a more efficient approach based on k-tuples (a k-mer generalisation). This was further advanced by the BLAST algorithm [6], which leveraged k-mers for efficient similarity searches in large databases.
Over the past 15 years, metagenomic identification has gained popularity alongside sequence database growth. Tools like MetaPhiAn [7] and mOTUs2 [8] leverage marker genes to compare species composition or identify markers unique to specific microbial strains.
Other techniques include Centrifuge [9], which uses the Burrows–Wheeler transform [10] and Ferragina–Manzini Index [11] for efficient sequence retrieval, and Kraken [12], which combines k-mers with indexed databases. Modern machine learning approaches include BERTax [13], treating DNA as a language via transformer models [14] for database-free classification, and CGRclust [15], which utilises chaos game representation with convolutional neural networks.
Metagenomic identification currently relies on three main approaches: alignment, k-mers and marker genes. Alignment-based tools offer the highest accuracy but are computationally expensive. Algorithms based on k-mers provide high speed but lower quality by ignoring structural information. Marker gene solutions deliver good results but are limited to organisms with known reference markers.
Recent studies in genomics use machine learning, especially artificial neural networks (ANNs), to represent sequences and support classification and annotation, using large context lengths [16,17]. ANNs often outperform classical heuristics, offering faster and more accurate results. The use of an ANN with contrastive learning for sequence clustering remains limited in the literature. This paper leverages ANN and contrastive learning capabilities to accelerate metagenomic identification while maintaining traditional quality levels, significantly streamlining the classification process.
The rest of the paper is organised as follows: Section 2 defines the problem, the proposed approach, and the Exquisitor tool. Section 3 describes the experimental setup, datasets, performance metrics, and results. Finally, Section 4 summarises the findings, discusses limitations, and suggests future research directions.
2. Methods
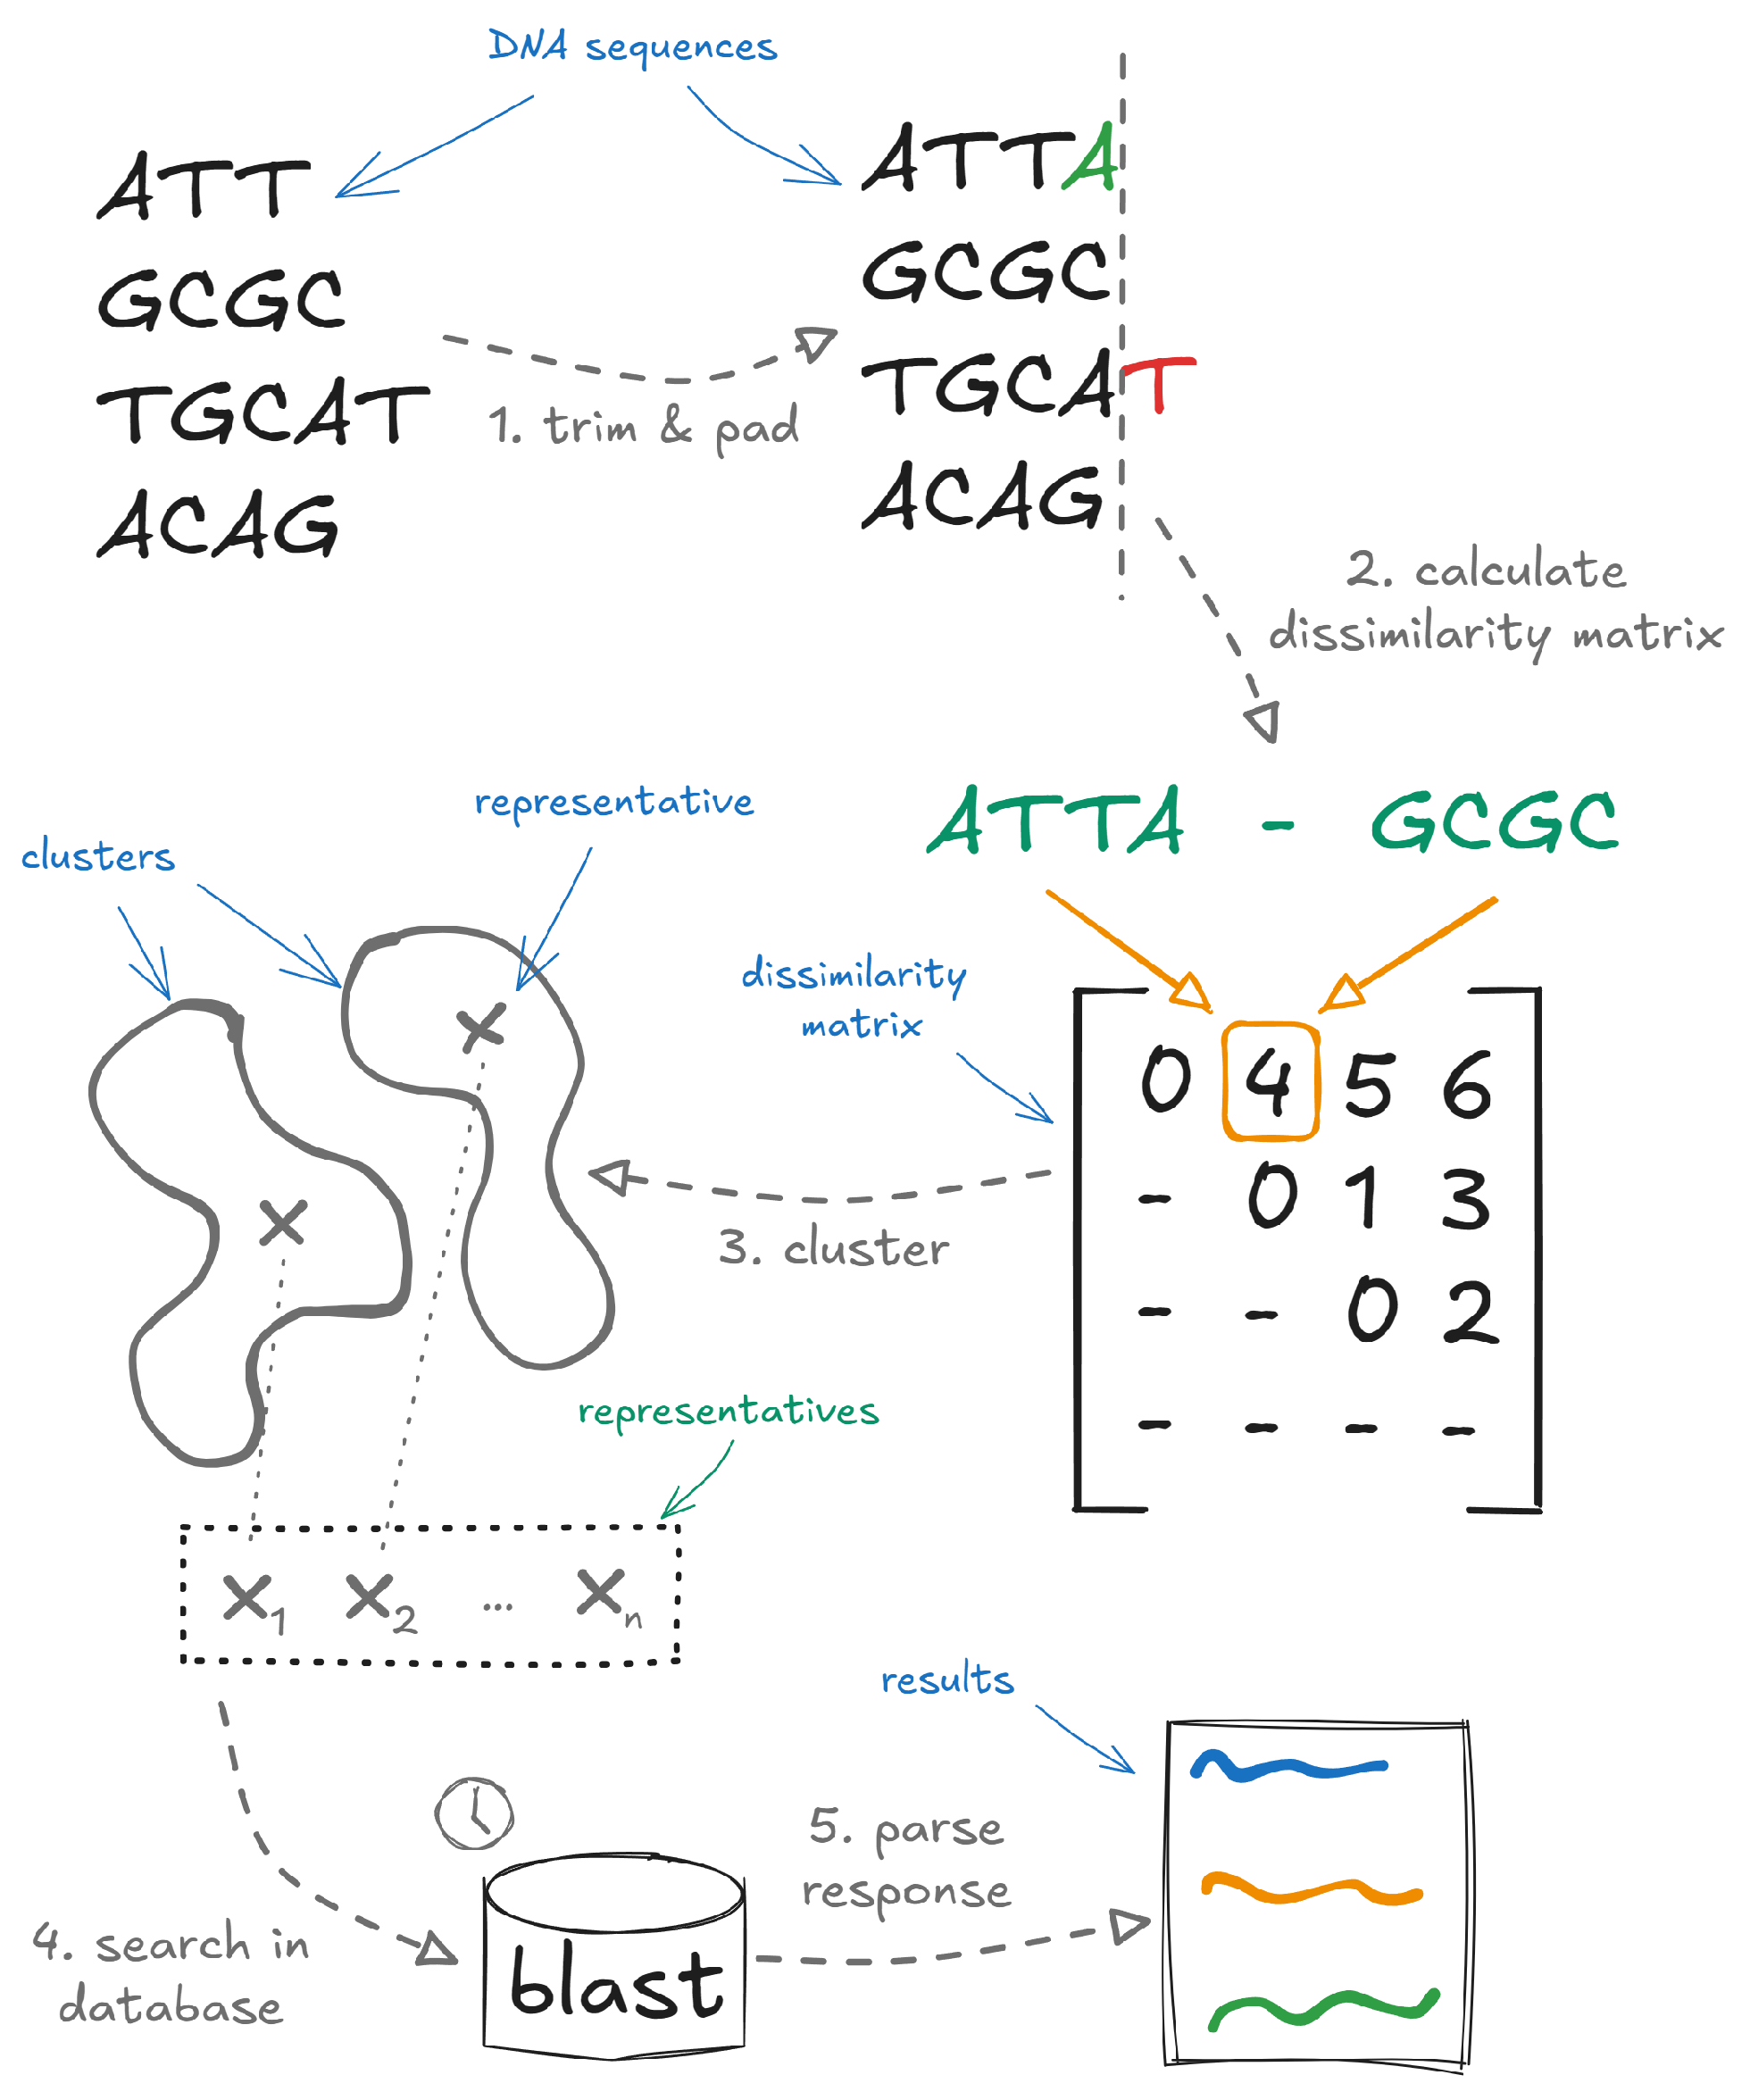
The core component of the proposed tool, Exquisitor, is a processing pipeline designed with flexibility in mind, allowing the integration of various DNA sequence clustering methods. The pipeline consists of a series of steps executed sequentially to perform metagenomic identification. A schematic representation of the pipeline is shown in Figure 1, where input and output data are represented by circles, and a rectangle represents the processing step. The pipeline is composed of the following five steps:
- Preparation of DNA SequencesThis step verifies DNA sequence correctness and aligns them to a required length for subsequent processing. Shorter sequences than the target are padded with A; longer sequences are truncated symmetrically from both ends. Ambiguous nucleotides are replaced with A.
- Dissimilarity CalculationDissimilarity between sequences is calculated using two classical methods or one custom approach, producing a dissimilarity matrix for clustering.
- Sequence ClusteringSequences are grouped into clusters, each with one representative and several members. This reduces the data volume for later stages by focusing on the most informative representatives.
- Database SearchRepresentative sequences are queried against a reference database to identify similar sequences and infer their taxonomic origin.
- PostprocessingThis final step assigns the BLASTn result of each cluster representative to all members of that cluster, treating the entire cluster as a single taxon.
Figure 1.
Overview of the pipeline: preparation of DNA sequences, dissimilarity calculation, sequence clustering, database search and postprocessing.
2.1. Exquisitor: Method Description
The proposed method uses an artificial neural network to reduce the dimensionality of input DNA sequences to a feature vector in the form of . The neural network employs contrastive learning, enabling representations to be learned while preserving dissimilarity between sequences. The dissimilarity between sequence representations will be calculated using cosine dissimilarity, which is expressed by the formula in Equation (1).
where
Artificial Neural Network
- Architecture
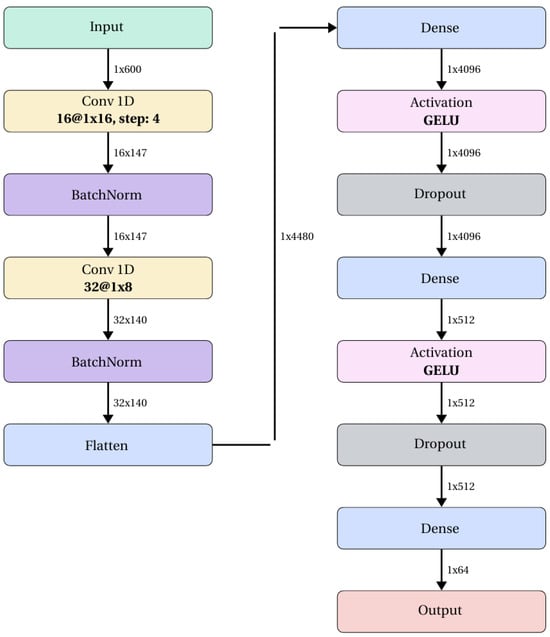
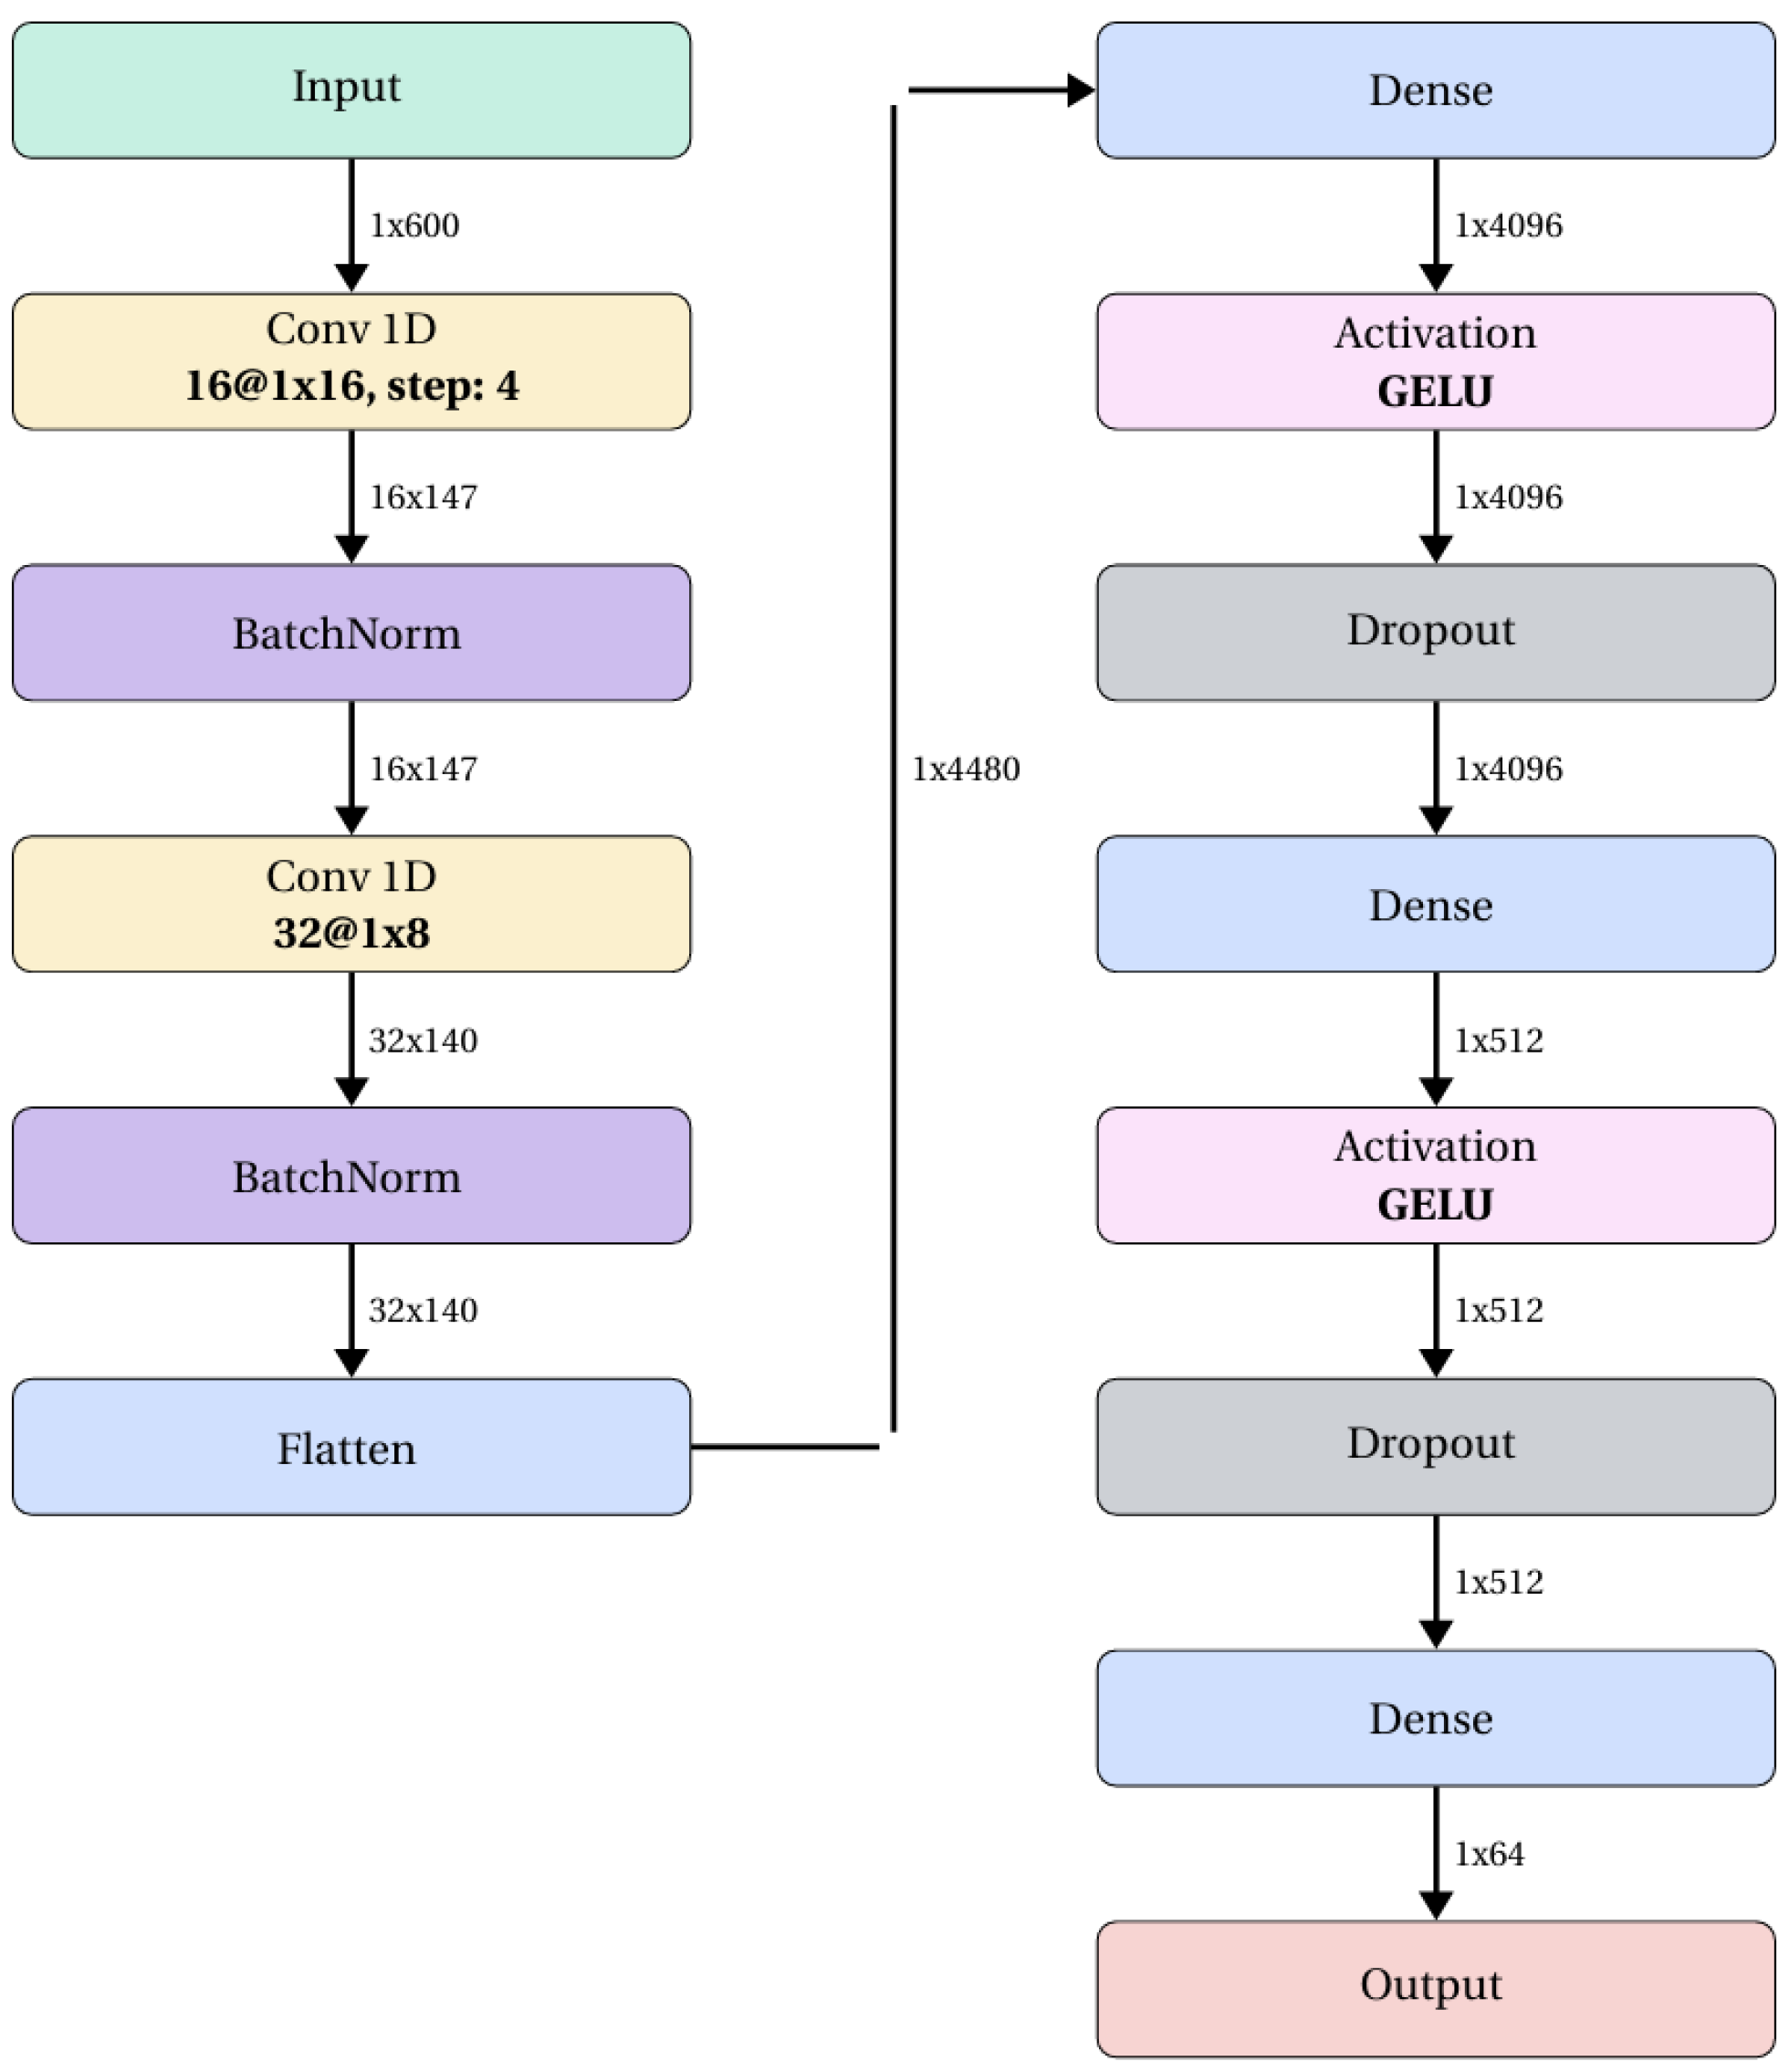
The ANN model consists of two parts. The first part comprises two convolutional blocks with batch normalisation and is responsible for feature extraction from the sequence. The second part utilises fully connected layers with dropout and the GELU activation function and is connected to the first part of the model via a flattening layer. The model output is the output of the final linear layer, which is a feature vector of dimension .
Schematically, the architecture is presented in Figure 2.
Figure 2.
Diagram of ANN architecture. Two parts were depicted: the convolutional blocks (on the left) are responsible for feature extraction, and fully connected layers with dropout are utilised to generate the results.
- Design Rationale
Convolutional neural networks (CNNs) were chosen over recurrent neural networks (RNNs) for faster training and inference. Contrastive learning allows the model to measure sequence similarity, which supports clustering.
- Input
The model input consists of DNA sequences of a length of 150, which are one-hot encoded over the four nucleotides (A, C, G, T) into a matrix and subsequently flattened into a vector. The sequence length of 150 is a method parameter and can be adjusted depending on the application.
- Training Examples
The training and validation examples consist of an anchor, a positive sequence similar to the anchor, and a negative sequence dissimilar to the anchor.
- Dataset
The training and validation datasets were created based on the first sample of genetic sequences from the CAMI II Toy Human Microbiome Project dataset [18]. The sample contains simulated metagenomic data from the human skin microbiome. Examples were obtained by randomly selecting anchors from the dataset and modifying these anchors to create positive and negative sequences. The modification involved a point mutation of a given nucleotide to another one. In the case of positive sequences, the change is affected between 0% and 20% of the anchor length, whereas for negative sequences, the change ranged from 20% to 80% of the anchor length.
- Loss Function
The loss function used is defined as shown below:
where the folllowing apply:
- —similarity margin between the positive sequence and the anchor;
- —similarity margin between the negative sequence and the anchor (the positivemargin controls the minimum similarity between similar sequences, whereas the negative margin controls the maximum similarity between dissimilar sequences);
- —cosine similarity of the positive sequence to the anchor;
- —cosine similarity of the negative sequence to the anchor.
The proposed loss function is similar to the triplet neural network framework [19], but it is adapted to use cosine dissimilarity.
- Learning
The model was trained on a dataset of training examples and validation examples. The optimiser used was AdamW, and the training was performed for 100 epochs. Both weight decay and the exponential learning rate schedule were employed to mitigate the risk of overfitting. The convergence criterion was defined as the absence of further improvement in the validation loss.
- Quality
As a measure of model quality, the contrastive loss of the model was computed on the validation set.
- Parameters
Experiments were conducted to determine the optimal training parameters for the artificial neural network model. The tested parameters included the learning rate coefficient , weight decay w, the coefficient used in the exponential learning rate decay, the dropout rate, and the effectiveness of using three perceptron layers. The parameter search was performed using grid search.
As a result of these experiments, the best parameters were selected:
a dropout rate of , a batch size of 256, and a confirmed positive impact of using three perceptron layers.
Additionally, the loss function was used with the following parameters:
- Results of Learning
As a result of training the neural network, the model achieved a validation set loss of .
2.2. Exquisitor: Implementation Details
The solution consists of two components. The first is a library that contains components enabling the creation of pipelines for genetic material analysis in the form of metagenomic identification. The second component is a console application, which uses the library’s components to create and configure processing pipelines. A web application was also created, allowing users to submit analysis tasks through a web browser.
The console application was implemented using the clap library. In the library, the k-medoid algorithm was provided by the kmedoids library [20], and the neural network was built using the burn library with the wgpu execution environment. Web application was implemented using the axum library with tokio async environment.
Additionally, the following tools were used in the paper:
- cargo as the package manager and build system in Rust;
- rustup for the automatic management of Rust versions;
- clippy for static code analysis in Rust;
- rustfmt for the automatic formatting of Rust source code;
- cargo test for conducting unit tests;
- git as the version control system, enabling change tracking and code history management.
- Tool Versions and Computational Environment
Representative sequences were queried with BLASTn (version 2.16.0) against the most recent database (as of December 2024) using 4 threads. The main parameters were left at their default values. The experiments were conducted on a machine with the following configuration:
- CPU: Intel Core i7-6850k (4 vCPUs);
- 40 GB RAM;
- GPU: NVIDIA GeForce GTX 1080TI;
- OS: Ubuntu 24.04.
3. Results
This section presents the results of the experiments conducted to evaluate the proposed solution (Exquisitor), which aims to improve performance while maintaining the quality of metagenomic identification. This paper compared the new approach with two classical methods using the same dataset. The evaluation focused on execution time and identification quality to assess the effectiveness of the proposed approach.
3.1. Datasets
3.1.1. Dataset Description
Experiments utilised the textitCAMI II Toy Human Microbiome Project dataset [18], which is a dataset that was created for the bioinformatics benchmark. The dataset was used also in ANN training. For testing, disjoint subsets were created with sizes for , exclusively using sequences not seen during the training phase to ensure unbiased evaluation.
3.1.2. Dataset Preparation
The subsets were created by randomly sampling, without replacement, the indices of genetic sequences from the reference dataset that were to be included in each subset. Indices of sequences used in the ANN training and validation sets were excluded from the sampling. The sizes of the subsets were as follows: training set—1,000,000 sequences, validation set—10,000 sequences, and test set—8192 sequences.
3.2. Clustering Algorithm
In the experiments, we used an external k-medoids clustering algorithm [20]. The number of clusters k is supplied as a method parameter. The medoids identified by this algorithm were used as cluster representatives and used in subsequent steps.
3.3. Baseline Algorithms
Two classical approaches were implemented and used to compare their results with the results of the proposed neural network.
3.3.1. Modified Needleman–Wunsch Algorithm
The first classical approach is the Needleman–Wunsch algorithm. This algorithm allows for the global alignment of genetic sequences. It uses a similarity matrix between sequences, which is constructed according to the rules given in Equation (3). A modification of the approach presented in Equation (4) is applied in this paper.
where the following apply:
- A, B—compared sequences;
- n, m—lengths of sequences A and B;
- D—similarity matrix of size ;
- —penalty for a gap;
- —similarity between the i-th element in sequence A and the j-th element in sequence B.
In the solution, the following parameter values were adopted:
3.3.2. k-mer Embeddings
The second approach use k-mers as embeddings, which allows for the representation of DNA sequences as numerical vectors. Embedding is created by constructing a vector of size , where each k-mer corresponds to a specific position in the vector. The number of occurrences of each k-mer in the sequence is then recorded at its corresponding position. These vectors will then be compared using Euclidean distance.
3.4. Experiments
3.4.1. Execution Time of Metagenomic Identification with Exquisitor
- Objective
Measuring the execution time of metagenomic identification using different genetic sequence clustering methods.
- Assumptions
- Sequences clustering is deterministic with a fixed seed.
- Metagenomic identification is the only task running on the machine.
- The number of clusters was set to , where n is the number of input sequences.
- Results
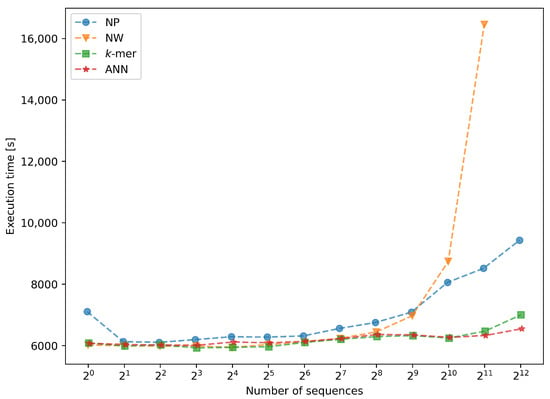
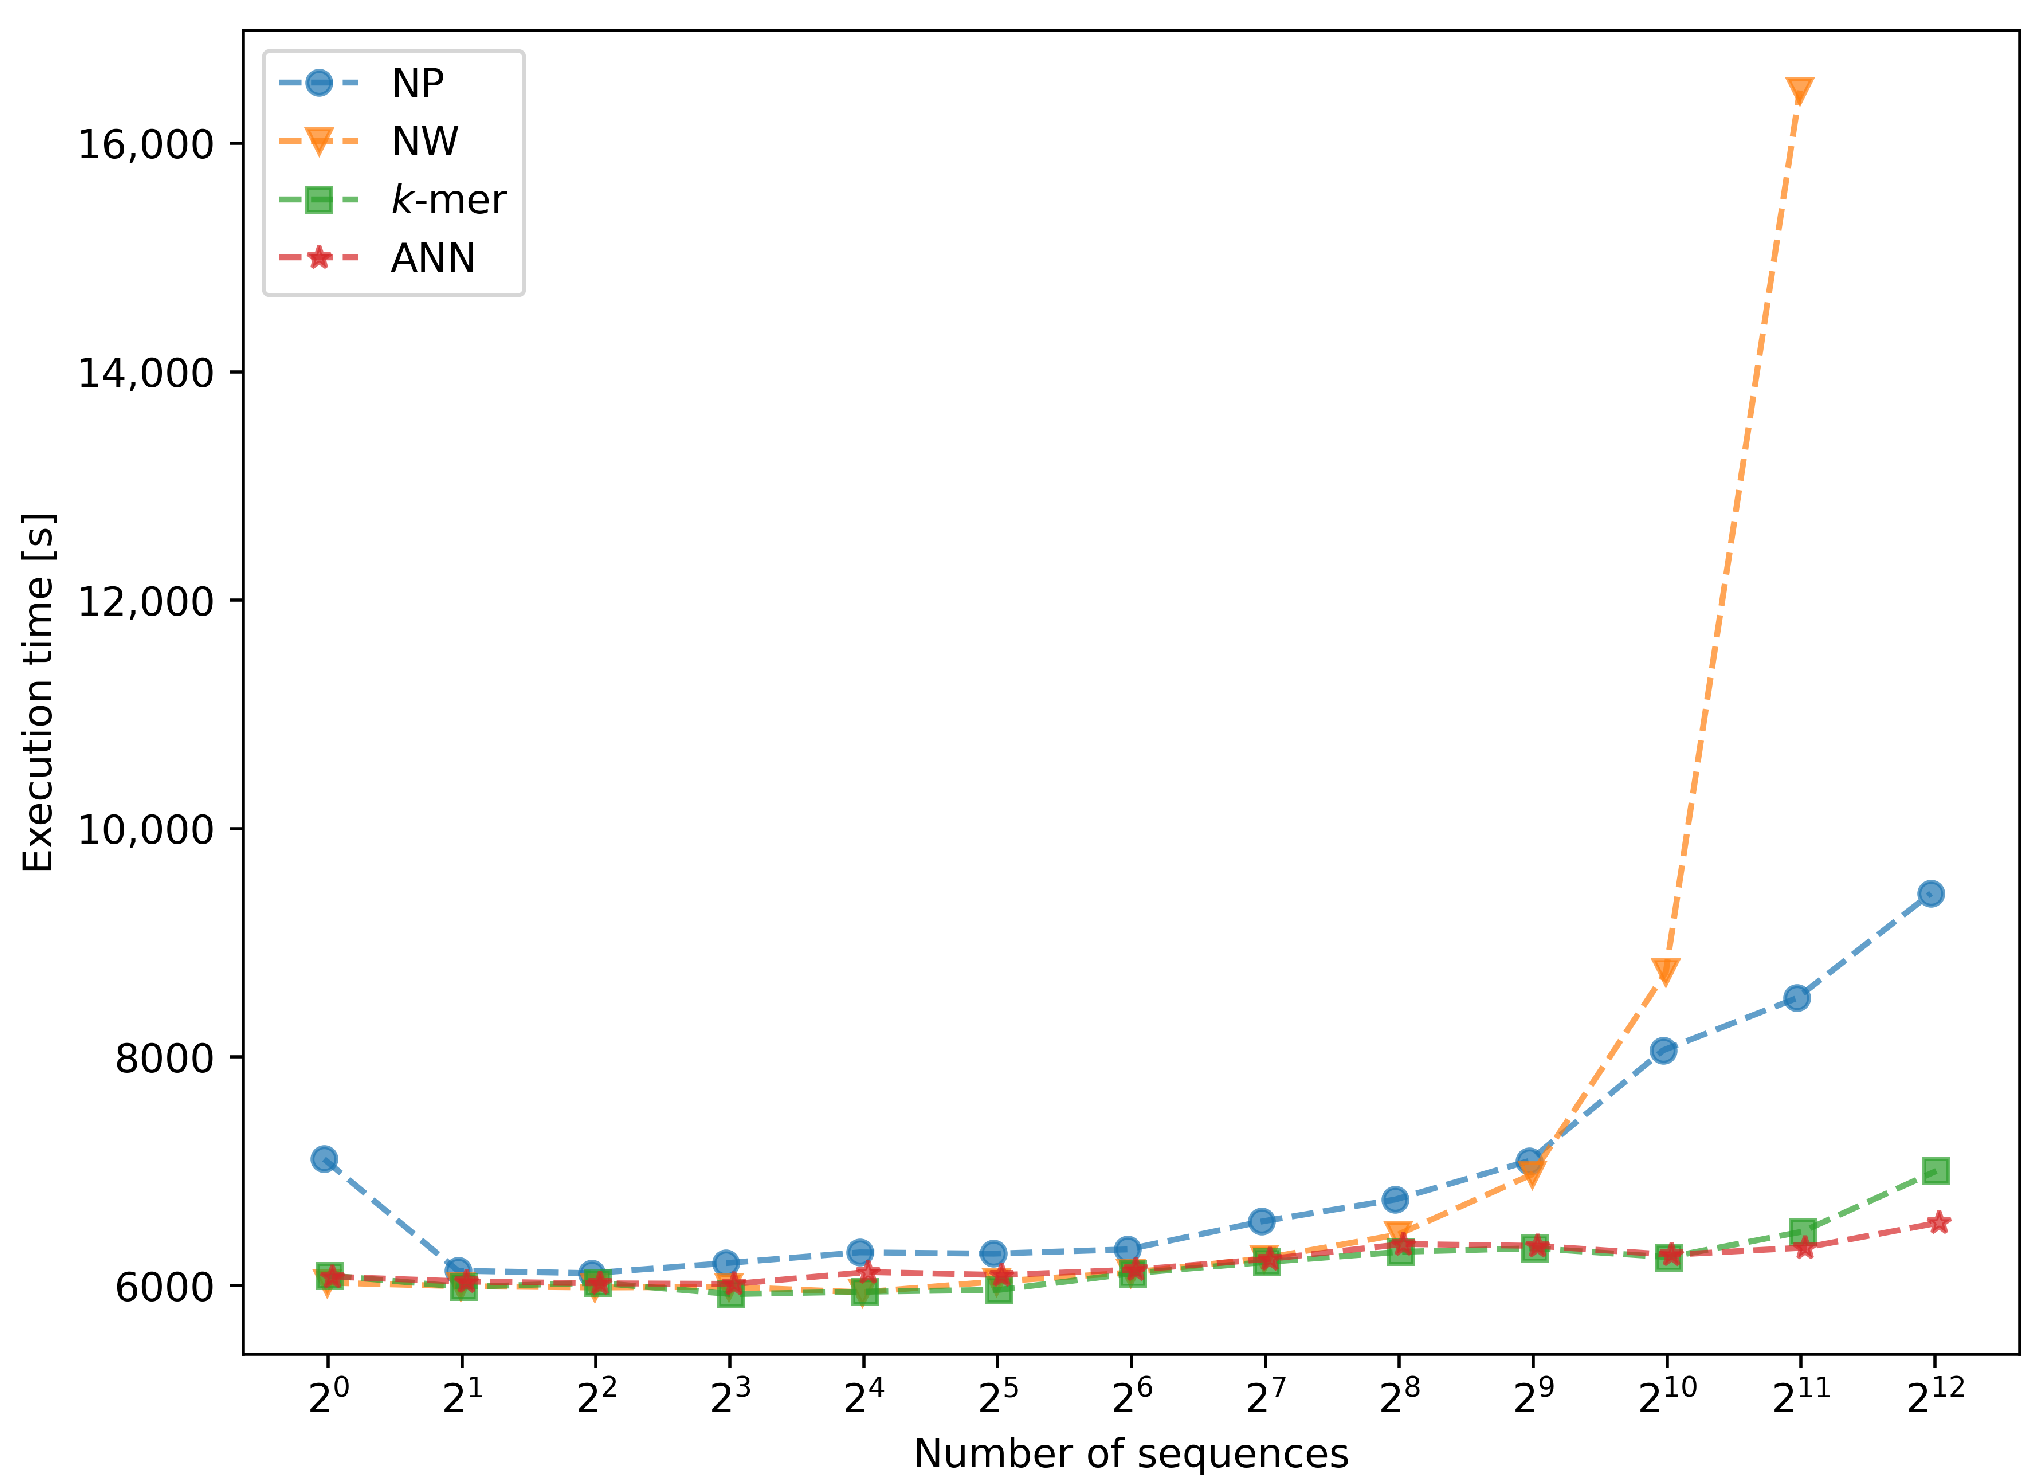
Experimental execution times were recorded for all methods, although the modified Needleman–Wunsch (NW) approach failed to complete for 4096 sequences due to time constraints. Figure 3 illustrates execution time as a function of input sequence count for the modified Needleman–Wunsch algorithm (NW), k-mer embeddings (k-mer), artificial neural networks (ANNs), and a no-pipeline baseline (NP). Detailed timing data are presented in Table 1.
Figure 3.
The comparison of the metagenomic identification execution time by the presented solution (NP) and benchmark methods: modified Needleman–Wunsch algorithm (NW), k-mer embeddings (k-mer), and a method using an artificial neural network (ANN).
Table 1.
Metagenomic identification execution time comparison of presented solution (NP) and benchmark methods (NW, k-mer, ANN).
- Conclusions
The modified Needleman–Wunsch (NW) approach exhibited the slowest execution time increase due to its computationally intensive sequence comparisons. Despite reducing the number of classified sequences, its total runtime exceeded the no-pipeline baseline. In contrast, k-mer embeddings and ANNs showed comparable, significantly faster execution times by using sequence representations for dissimilarity matrix construction. For 4096 sequences, the ANN benefited from GPU-accelerated embedding computations, further optimising performance compared to traditional metagenomic identification.
3.4.2. Quality of Metagenomic Identification with Exquisitor
- Objective
Examining the quality of metagenomic identification using the implemented methods in comparison to the metagenomic identification of all sequences.
- Assumptions
- Sequences clustering is deterministic with a fixed seed.
- BLASTn is deterministic and always returns the same results for a given sequence and specified parameters.
- In the case where it is not possible to compute the quality for a given metagenomic identification run, a quality value of 0 is assumed. This value is not considered when calculating the weighted average quality.
- The number of clusters was set to , where n is the number of input sequences.
- Exquisitor Performance Measures
The quality of metagenomic identification was measured using a modified Jaccard index, expressed by Equation (5), as standard classification metrics relying on false positives/negatives are not well defined when BLAST results serve as the reference. The measure was used to compare the quality of metagenomic identification performed using the implemented methods against metagenomic identification without using a processing pipeline, i.e., using raw BLAST results.
where the following apply:
- R—set of reference results;
- E—set of obtained results;
- —number of results in reference set assigned to the organism r;
- —set of unique organisms, for which results were assigned in the set X.
Organisms appearing only in the obtained results are not considered in the calculation of the quality.
The weighted average quality, defined by Equation (6), was used to compare the quality of multiple metagenomic identification runs.
where the following apply:
- C— set of metagenomic identification runs;
- —quality of metagenomic identification c;
- —number of input sequences for metagenomic identification c;
- n—number of input sequences
- Results
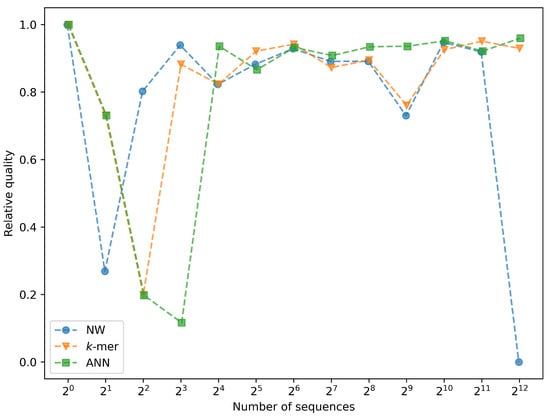
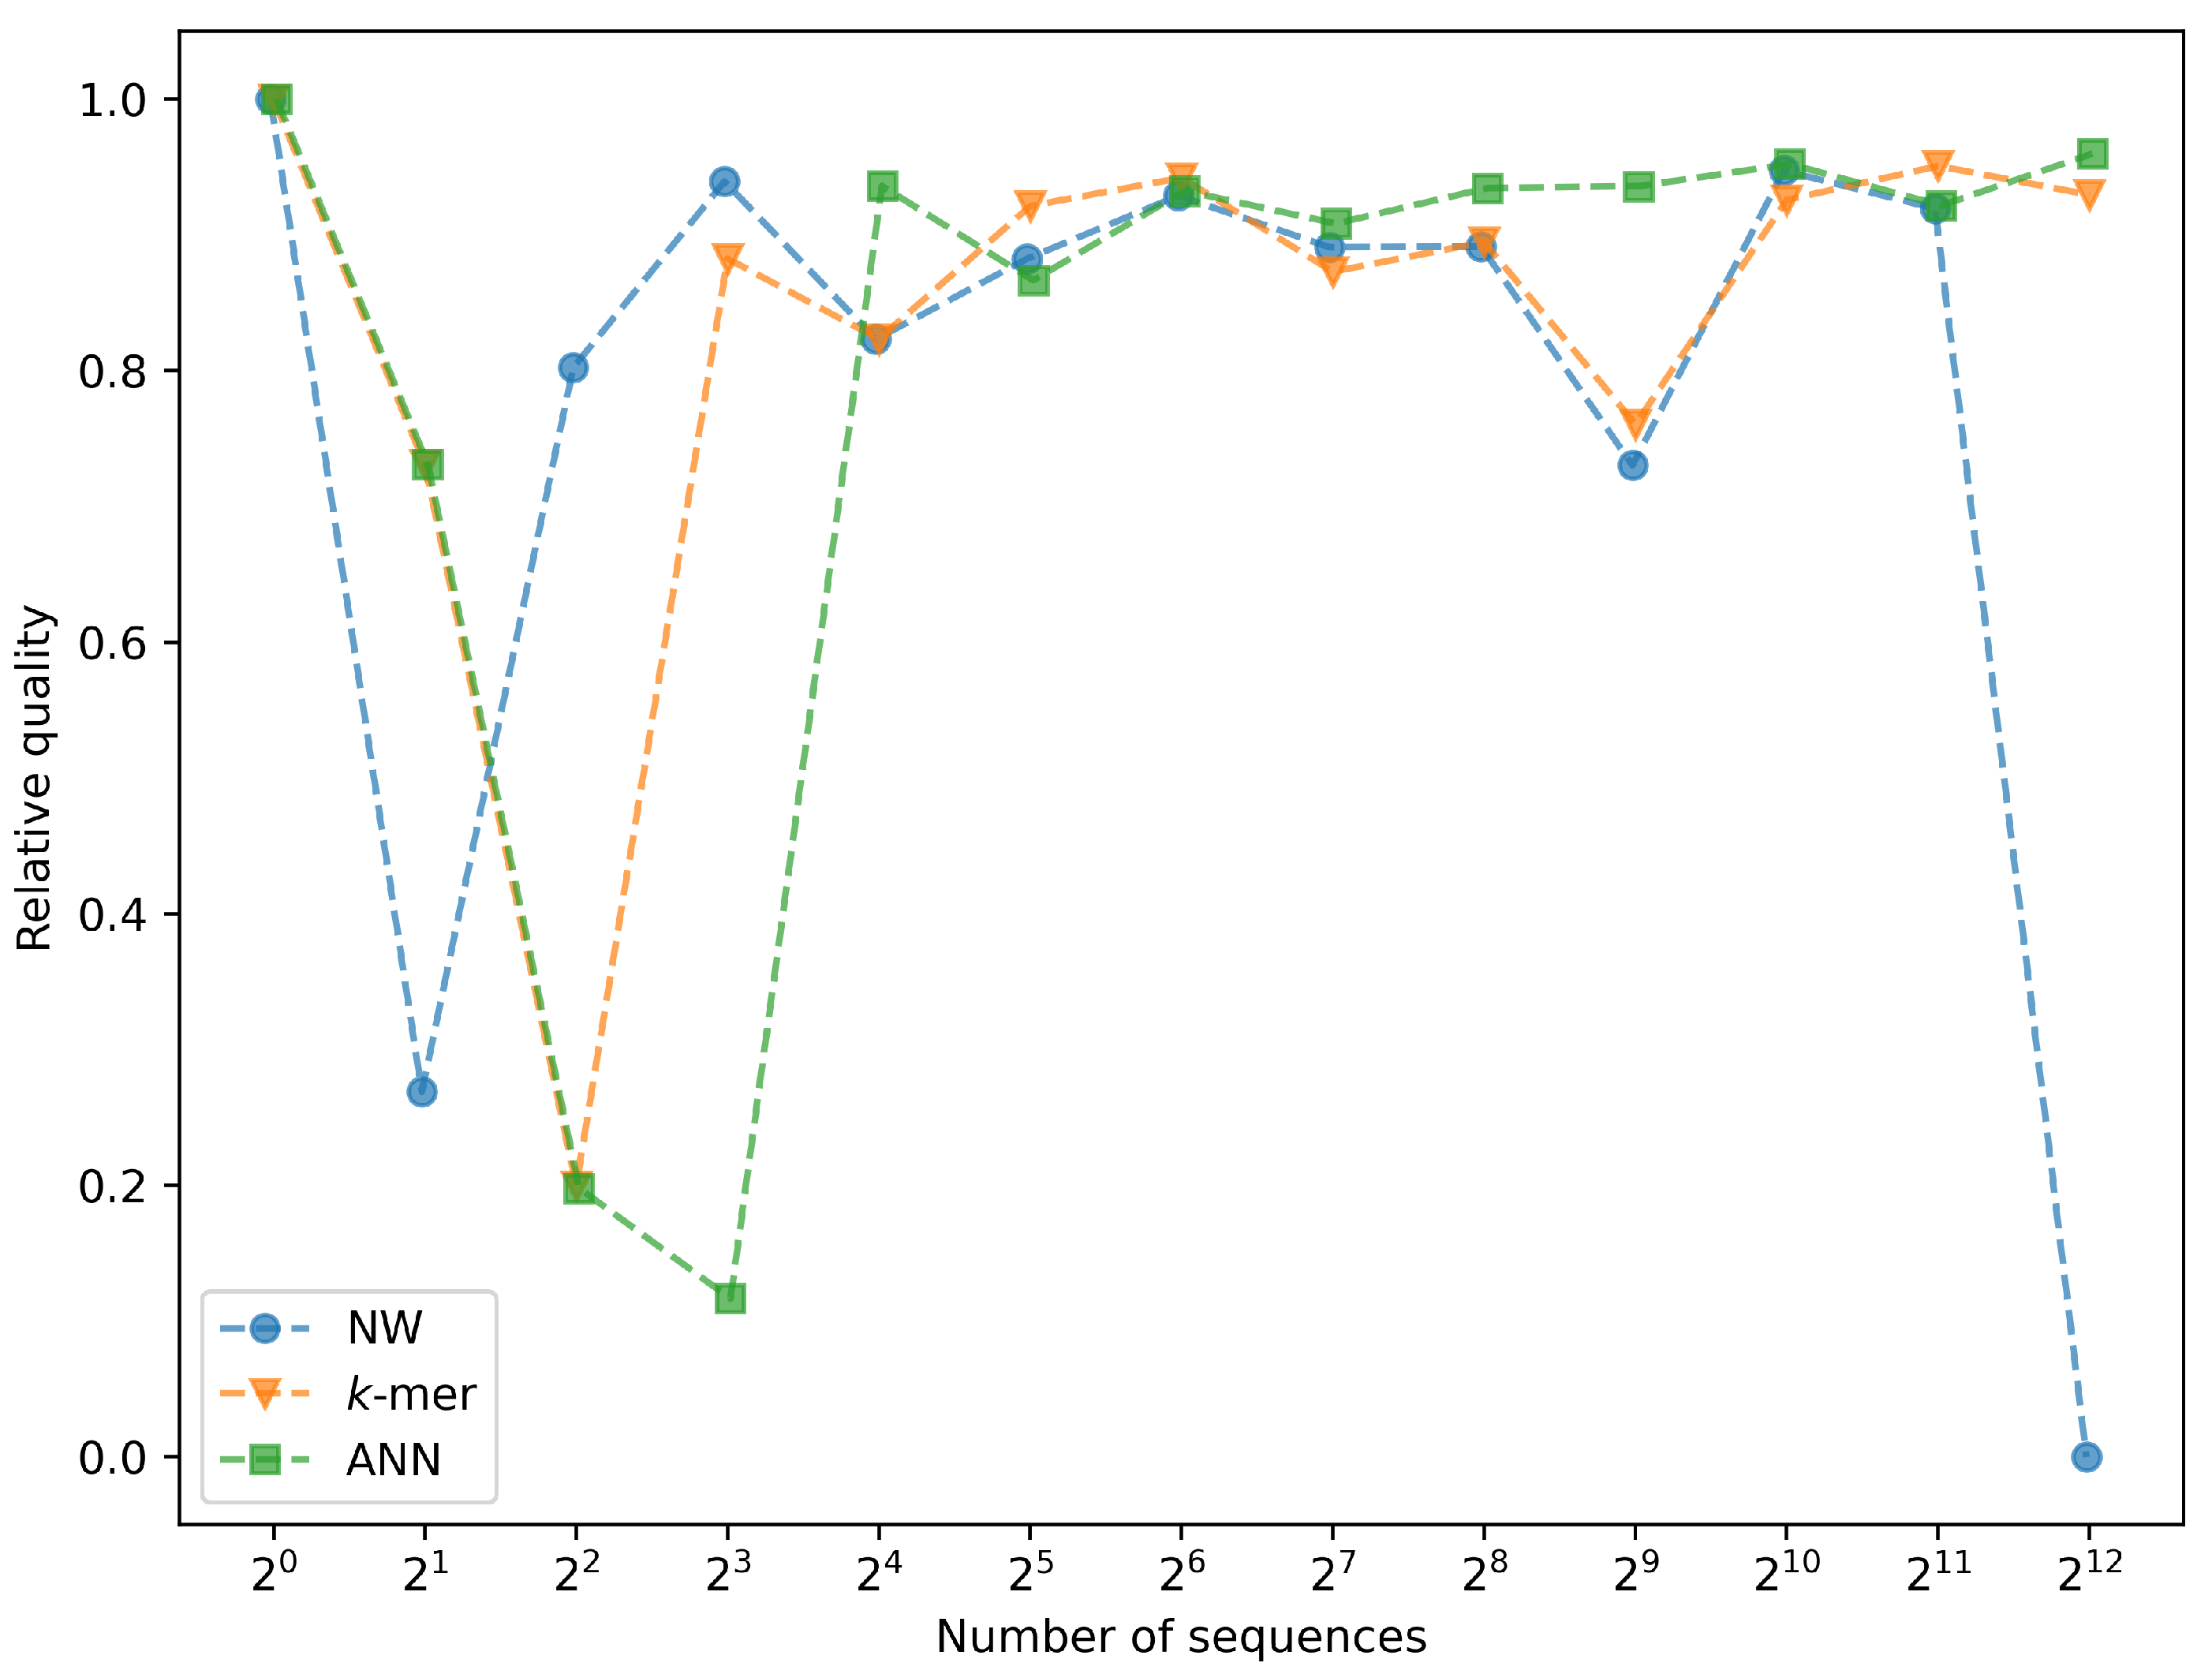
Classification quality was calculated using Equation (5) relative to full metagenomic identification. Figure 4 and Table 2 present these results as a function of the input sequence count. The weighted average quality (Equation (6)) was for the modified Needleman–Wunsch algorithm, for the k-mer embedding method, and for the artificial neural network approach.
Figure 4.
Comparison of the metagenomic identification quality returned by the presented method with the benchmark methods.
Table 2.
Comparison of the metagenomic identification quality returned by the presented method with the benchmark methods.
- Conclusions
All implemented methods achieved high classification quality, exceeding when the number of groups significantly exceeded input sequences. The artificial neural network (ANN) approach yielded the highest weighted average quality, slightly outperforming both k-mer embedding and the modified Needleman–Wunsch algorithm. This superior performance stems from the model’s ability to consider the full sequence structure, enabling more precise dissimilarity determination.
3.4.3. Performance on an Unseen Dataset
- Objective
Assessing the quality of clustering on unseen data from a different sample.
- Preparation
We obtained an additional sample from a different body site (CAMI II Toy Human Microbiome Project, Sample 4, airways). Processing steps were applied both to the training samples and to this new sample:
- Sequences in each sample were mapped to taxonomic identifiers (tax_id).
- From each sample, a subset of 10,000 sequences was randomly selected, ensuring that the dominant taxon did not exceed 50% of the subset.
- Sequence embeddings were generated using the ANN model.
- For each sample, clustering was performed with the k-medoids algorithm, where k was chosen according to the number of true taxa in the subset.
- Clusters corresponding to taxa were treated as the ground truth.
The clustering performance was evaluated by computing Adjusted Mutual Information (AMI), Normalised Mutual Information (NMI), and the Fowlkes–Mallows Index (FMI) between the obtained clusters and the ground truth.
- Results
The evaluation metrics (AMI, NMI, FMI) for clustering performance are summarised in Table 3.
Table 3.
Comparison of clustering quality on seen and unseen data.
- Conclusions
Although the clustering performance on the unseen data is not optimal, it remains comparable to the results obtained for the training data. It suggests that the model’s generalisation capabilities are present but constrained and that the outcomes are not merely random.
3.4.4. Generalisation and k Parameter
- Objective
Evaluating whether the method generalises correctly to unseen data, and assessing the influence of the k parameter on the generalisation quality.
- Preparation
On the sample from the previous experiment, the full pipeline was run with different values of the k parameter. The resulting assignments were compared against the known taxonomic labels.
- Results
Accuracy, precision, recall and F1 scores for the different values of the k parameter are presented in Table 4.
Table 4.
Comparison of methods results.
- Conclusions
Generalisation quality is comparable to the results obtained for the training data. The ANN method approach does generalise, outperforming the NW method, but its capability remains limited and fails to match the performance of the k-mer method. Both the k-mer method and the ANN method with only 15 clusters are able to achieve accuracy above 55%, indicating that a small number of clusters can still describe a substantial portion of the sample. Increasing the number of clusters yields only a modest improvement in the results, but in the long term, it increases the computational time.
4. Discussion
4.1. Interpretation of Results
Experimental results partially confirmed initial expectations, as all methods achieved satisfactory identification quality. The ANN-based approach performed best, yielding the highest weighted average classification quality with execution time comparable to k-mer embeddings. However, small input samples led to lower quality, which was likely due to poor representative selection; thus, the method is recommended for larger datasets. For the tested data, the efficiency threshold was 128 sequences, where quality remained high and reduced processing time by 5%. The ANN not only improved classification quality over the methods but also remained competitive with classical approaches.
Our pipeline speeds up BLAST-based metagenomic identification by querying a single representative per cluster. Within the evaluated setting—one main dataset and at most 4096 sequences—these results support the approach for metagenomic identification, but the presented method is not limited to metagenomic identification; generally, it replaces BLAST in tasks when clusters of sequences are analysed.
4.2. Limitations
4.2.1. Experiments Duration
The full metagenomic identification of DNA sequences for each method and each experimental subset took approximately 5 days, which led to the limitation of the number of experiments to a single run and subset size to 4096 sequences.
4.2.2. Single Dataset
Using a single human skin microbiome sample likely constrained the sequence space and influenced results, as both the ANN and experiments shared the same source. Furthermore, the lack of duplicate checking might have caused data leakage, potentially biasing the evaluation.
4.2.3. Single Dissimilarity Matrix
Using a single dissimilarity matrix for all sequences limits the number of input sequences, as the matrix build time scales quadratically with the number of sequences.
4.2.4. Baseline Methods Limitations
We used simplified baseline methods, which do not account for different gap penalties as implemented in algorithms such as Gotoh [21], nor do they distinguish between different nucleotide substitutions, such as transitions and transversions.
4.2.5. Model Limitations
The model’s generalisation is restricted to human skin microbiome data; other sample types require further study. While the ANN benefits from GPU acceleration, CPU-only execution significantly increases runtime. Additionally, the approach is optimised for sequences of similar length, showing limited adaptability to variation. Finally, using CNNs instead of RNNs or transformers may limit flexibility, though it ensures faster training and inference.
4.3. Possible Improvements
4.3.1. Architecture of Artificial Neural Network
The current ANN architecture lacks flexibility, requiring sequences of similar lengths. Replacing the initial convolutional layers with recurrent neural networks (RNNs) or transformers would enable the processing of varying sequence lengths. In such a modification, these architectures would generate initial embeddings, which linear layers would then process to preserve dissimilarity properties.
4.3.2. Batching Sequences
Creating a single dissimilarity matrix for large samples is suboptimal due to its performance impact. Pre-clustering sequences into batches addresses this, maintaining short execution times at the cost of a potential quality reduction.
5. Conclusions
5.1. Summary of Findings
The experiments demonstrated that the proposed method based on artificial neural networks outperforms traditional approaches in terms of quality while maintaining execution times comparable to those of the classical k-mer method. It highlights the potential for neural networks to improve identification efficiency subject to the dataset and scale limitations discusses above.
5.2. Future Research Directions
Future research could focus on utilising artificial neural networks as an independent tool for metagenomic identification. Another promising direction is the application of artificial neural networks for dimensionality reduction of genetic sequences, which may improve efficiency and performance in various analyses. Beyond metagenomic identification, the learned sequence representations and clustering approach could be explored in future work for related tasks such as genome assembly, cell-subtype identification, and phylogenetic-tree construction. Planned development efforts are focused on providing interfaces for the Exquisitor tool, enabling its integration with existing popular metagenomic pipelines.
Author Contributions
Conceptualisation, P.G. and R.N.; methodology, P.G.; software, P.G.; validation, P.G.; resources, R.N.; data curation, P.G.; writing, P.G. and R.N.; supervision, R.N.; funding acquisition, R.N. All authors have read and agreed to the published version of the manuscript.
Funding
This work is supported by the Statutory Research Grant of Institute of Computer Science, Warsaw University of Technology.
Data Availability Statement
Project webpage with data https://github.com/pfgryz/exquisitor, accessed on 1 September 2026.
Acknowledgments
During the preparation of this manuscript/study, the author(s) used Grammarly (version 1.2.291) and Gemini (version 2.5 Flash) for spelling error correction. The authors have reviewed and edited the output and take full responsibility for the content of this publication. All authors have read and agreed to the published version of the manuscript.
Conflicts of Interest
The authors declare no conflicts of interest.
References
- Reinartz, J.; Bruyns, E.; Lin, J.Z.; Burcham, T.; Brenner, S.; Bowen, B.; Kramer, M.; Woychik, R. Massively parallel signature sequencing (MPSS) as a tool for in-depth quantitative gene expression profiling in all organisms. Brief. Funct. Genom. 2002, 1, 95–104. [Google Scholar] [CrossRef] [Scilit] [PubMed]
- Muir, P.; Li, S.; Lou, S.; Wang, D.; Spakowicz, D.J.; Salichos, L.; Zhang, J.; Weinstock, G.M.; Isaacs, F.; Rozowsky, J.; et al. The real cost of sequencing: Scaling computation to keep pace with data generation. Genome Biol. 2016, 17, 53. [Google Scholar] [CrossRef] [Scilit] [PubMed]
- Kodama, Y.; Shumway, M.; Rasko, L. The sequence read archive: Explosive growth of sequencing data. Nucleic Acids Res. 2011, 40, D54–D56. [Google Scholar] [CrossRef] [Scilit] [PubMed]
- Needleman, S.B.; Wunsch, C.D. A general method applicable to the search for similarities in the amino acid sequence of two proteins. J. Mol. Biol. 1970, 48, 443–453. [Google Scholar] [CrossRef] [Scilit] [PubMed]
- Wilbur, W.J.; Lipman, D.J. Rapid similarity searches of nucleic acid and protein data banks. Proc. Natl. Acad. Sci. USA 1983, 80, 726–730. [Google Scholar] [CrossRef] [Scilit] [PubMed]
- Altschul, S.; Gish, W.; Miller, W.; Myers, E.; Lipman, D. Basic local alignment search tool. Mol. Biol. 1990, 215, 403–410. [Google Scholar] [CrossRef] [Scilit]
- Segata, N.; Waldron, L.; Ballarini, A.; Narasimhan, V.; Jousson, O.; Huttenhower, C. Metagenomic microbial community profiling using unique clade-specific marker genes. Nat. Methods 2012, 9, 811–814. [Google Scholar] [CrossRef] [Scilit] [PubMed]
- Milanese, A.; Mende, D.R.; Paoli, L.; Salazar, G.; Ruscheweyh, H.J.; Cuenca, M.; Hingamp, P.; Alves, R.; Costea, P.I.; Coelho, L.P.; et al. Microbial abundance, activity and population genomic profiling with mOTUs2. Nat. Commun. 2019, 10, 1014. [Google Scholar] [CrossRef] [Scilit] [PubMed]
- Kim, D.; Song, L.; Breitwieser, F.P.; Salzberg, S.L. Centrifuge: Rapid and sensitive classification of metagenomic sequences. Genome Res. 2016, 26, 1721–1729. [Google Scholar] [CrossRef] [Scilit] [PubMed]
- Burrows, M.; Wheeler, D.J. A Block-sorting Lossless Data Compression Algorithm. In DEC SRC Research Report 124; Digital Equipment Corporation: Maynard, MA, USA, 1994. [Google Scholar]
- Ferragina, P.; Manzini, G. Opportunistic data structures with applications. In Proceedings of the 41st Annual Symposium on Foundations of Computer Science, Redondo Beach, CA, USA, 12–14 November 2000; pp. 390–398. [Google Scholar]
- Wood, D.E.; Salzberg, S.L. Kraken: Ultrafast metagenomic sequence classification using exact alignments. Genome Biol. 2014, 15, R46. [Google Scholar] [CrossRef] [Scilit] [PubMed]
- Mock, F.; Kretschmer, F.; Kriese, A.; Böcker, S.; Marz, M. Taxonomic classification of DNA sequences beyond sequence similarity using deep neural networks. Proc. Natl. Acad. Sci. USA 2022, 119, e2122636119. [Google Scholar] [CrossRef] [Scilit] [PubMed]
- Vaswani, A.; Shazeer, N.; Parmar, N.; Uszkoreit, J.; Jones, L.; Gomez, A.N.; Kaiser, L.; Polosukhin, I. Attention is All you Need. In Proceedings of the Advances in Neural Information Processing Systems; Guyon, I., Luxburg, U.V., Bengio, S., Wallach, H., Fergus, R., Vishwanathan, S., Garnett, R., Eds.; Curran Associates, Inc.: Red Hook, NY, USA, 2017; Volume 30. [Google Scholar]
- Alipour, F.; Hill, K.; Kari, L. CGRclust: Chaos Game Representation for twin contrastive clustering of unlabelled DNA sequences. BMC Genom. 2024, 25, 1214. [Google Scholar] [CrossRef] [Scilit] [PubMed]
- Nguyen, E.; Poli, M.; Faizi, M.; Thomas, A.; Birch-Sykes, C.; Wornow, M.; Patel, A.; Rabideau, C.; Massaroli, S.; Bengio, Y.; et al. HyenaDNA: Long-Range Genomic Sequence Modeling at Single Nucleotide Resolution. arXiv 2023, arXiv:2306.15794. [Google Scholar] [CrossRef] [Scilit]
- Yang, C.; Liu, Y.; Ling, L.; Liu, Y.; Li, F.; Chen, C.; Wang, L.; Yu, F.; Qiao, L.; Zeng, X.; et al. Explicit dynamic cross-strand interactions for DNA sequence language modelling. Nat. Mach. Intell. 2026, 8, 880–900. [Google Scholar] [CrossRef] [Scilit]
- Fritz, A.; Hofmann, P.; Majda, S.; Dahms, E.; Dröge, J.; Fiedler, J.; Lesker, T.R.; Belmann, P.; DeMaere, M.Z.; Darling, A.E.; et al. CAMISIM: Simulating metagenomes and microbial communities. Microbiome 2019, 7, 17. [Google Scholar] [CrossRef] [Scilit] [PubMed]
- Hoffer, E.; Ailon, N. Deep metric learning using Triplet network. arXiv 2018, arXiv:1412.6622. [Google Scholar] [CrossRef] [Scilit]
- Schubert, E.; Lenssen, L. Fast k-medoids Clustering in Rust and Python. J. Open Source Softw. 2022, 7, 4183. [Google Scholar] [CrossRef] [Scilit]
- Gotoh, O. An improved algorithm for matching biological sequences. J. Mol. Biol. 1982, 162, 705–708. [Google Scholar] [CrossRef] [Scilit] [PubMed]

Disclaimer/Publisher’s Note: The statements, opinions and data contained in all publications are solely those of the individual author(s) and contributor(s) and not of MDPI and/or the editor(s). MDPI and/or the editor(s) disclaim responsibility for any injury to people or property resulting from any ideas, methods, instructions or products referred to in the content. |
© 2026 by the authors. Licensee MDPI, Basel, Switzerland. This article is an open access article distributed under the terms and conditions of the Creative Commons Attribution (CC BY) license.