


Abstract
Background: Accurate prognosis in diffuse large B-cell lymphoma (DLBCL) is limited by biological heterogeneity and the absence of formal per-patient uncertainty quantification for treatment-response prediction. This study introduces a multi-layer evidence fusion framework combining gene expression profiling and clinical features with distribution-free uncertainty quantification. Methods: The proposed framework integrates four evidence layers—WGCNA co-expression eigengenes, ssGSEA pathway scores, bootstrap-stable prognostic genes, and the International Prognostic Index—through AUC-proportional reliability discounting and sequential Dempster–Shafer fusion. The primary endpoint was three-year overall survival (OS3yr) as a surrogate for R-CHOP treatment response. Inductive conformal prediction (ICP, ε = 0.10) was applied to provide per-patient uncertainty sets with a distribution-free coverage guarantee. Training used GSE10846 (n = 223, Affymetrix); external validation used GSE181063 (n = 479, Illumina). Results: The proposed framework achieved internal AUC = 0.808 (95% CI [0.750, 0.863]), significantly outperforming logistic stacking (AUC = 0.786, p = 0.0009) and unweighted DS fusion (AUC = 0.767, p = 0.037). External AUC = 0.791 was statistically comparable to logistic stacking (DeLong p = 0.21). AUC-proportional discounting reduced inter-source conflict K- by 75% (0.093→0.023). ICP achieved 90.1% internal and 94.6% external coverage; 43.5% of training patients received uncertain predictions ({S,R}). Conclusions: The proposed framework provides an uncertainty-aware approach for multi-layer genomic–clinical evidence fusion in DLBCL, with cross-platform discrimination validated on an independent Illumina cohort.
1. Introduction
Diffuse large B-cell lymphoma (DLBCL) is the most common aggressive non-Hodgkin lymphoma, accounting for approximately 30–40% of all lymphoma diagnoses worldwide. Standard first-line treatment with rituximab, cyclophosphamide, doxorubicin, vincristine, and prednisone (R-CHOP) achieves 5-year overall survival in approximately 60–70% of patients. However, 30–40% experience treatment failure (refractory disease or relapse), for whom prognosis remains substantially worse and salvage options are limited [1]. Pre-treatment identification of patients likely to fail R-CHOP would enable earlier consideration of intensified or alternative regimens, motivating the development of predictive biomarkers from tumour gene expression profiling (GEP).
Landmark GEP studies established the prognostic value of biologically interpretable multi-signature models in DLBCL. Rosenwald et al. [2] demonstrated that a 17-gene model combining four biological signature components partitioned post-chemotherapy outcomes into quartiles with five-year survival rates spanning 15–73%. Lenz et al. [3] extended this framework to the R-CHOP era, showing that three complementary signatures—germinal-centre B-cell (GCB) subtype identity, stromal-1 (extracellular matrix remodelling), and stromal-2 (tumour angiogenesis)—jointly predicted overall survival (OS) independently of clinical IPI. Schmitz et al. [4] subsequently defined four genetically characterised DLBCL subtypes with differential R-CHOP responses. Wright et al. [5] formalised a probabilistic classification tool (LymphGen) for these subtypes. Despite this progress, current tools remain incompletely predictive.
Table 1 summarises representative DLBCL GEP survival and treatment response prediction studies published between 2016 and 2026, spanning six methodological categories. Three consistent limitations emerge. First, to the author’s knowledge, no study in the reviewed literature provides formal per-patient uncertainty quantification for individual OS treatment-response predictions. The single exception [6] applies conformal prediction to DLBCL molecular subtyping—a cell-of-origin classification task—and does not address OS prediction or R-CHOP treatment-response outcomes. Second, studies employing a single evidence type—co-expression modules [7], a single gene signature pathway [8], or clinical features alone—show limited or moderate discrimination (single-pathway AUC 0.69–0.81; C-index 0.70–0.79). None examines whether combining complementary sources under an explicit evidential framework improves prediction. Third, true cross-platform external validation—training on one microarray technology and evaluating on a distinct technology—is rarely performed. Most studies validate within the same Affymetrix platform or are restricted to internal cross-validation.
To address these limitations, this study presents AUC-proportional Dempster–Shafer (DS) fusion [9,10], integrating four evidence layers—three biologically distinct GEP layers and clinical IPI—augmented by inductive conformal prediction (ICP). To the author’s knowledge, no prior study has applied DS evidence theory to gene-expression-derived features for DLBCL treatment-response prediction. DS-based fusion of multi-modal evidence layers for cancer survival prediction is itself nascent, with M2EF-NNs [11] reporting the first application of DS theory to cancer survival prediction—using histopathology and multi-omics genomic evidence in non-lymphoma settings. The proposed framework makes five specific contributions:
(1) A four-layer evidence integration design combining: WGCNA co-expression eigengenes (L1; [12]), ten published DLBCL-relevant ssGSEA pathway scores (L2; [13]), bootstrap-stable survival-associated genes selected by log-rank filtering (L3), and the International Prognostic Index (L4; [14]), fused via Dempster’s sequential combination rule—spanning module, pathway, gene, and clinical levels of biological organisation.
(2) AUC-proportional reliability discounting applied before DS combination, assigning layer-specific discount factors derived from internal out-of-fold AUC to down-weight less discriminative sources and reduced inter-source conflict prior to evidence fusion.
(3) Inter-source evidence conflict quantification via the DS conflict coefficient K, computed from the four pre-fusion BPA sources and providing a sample-level signal of evidential discordance prior to Dempster combination.
(4) Distribution-free uncertainty quantification via ICP [15,16], providing each sample a prediction set with a coverage guarantee of at least 1 − ε = 0.90 under the exchangeability assumption, without requiring parametric assumptions on the gene expression distribution.
(5) Cross-platform external validation on an independent Illumina cohort (GSE181063, GPL14951; n = 479 IPI-complete for primary validation, n = 628 for GEP-only models), systematically quantifying knowledge-driven versus data-driven feature transferability across microarray technologies.
This study pursues three objectives. First, to evaluate whether AUC-proportional DS fusion of four evidence layers (three GEP + IPI) improves OS3yr discrimination relative to single-layer, unweighted DS, and logistic stacking baselines under nested cross-validation. Second, to characterise the cross-platform transferability of each evidence type when the model trained on Affymetrix GPL570 is applied to an independent Illumina GPL14951 cohort. Third, to assess whether DS conflict and ICP prediction sets jointly identify the subset of samples for which the molecular evidence is insufficient to support a confident treatment-response prediction. Two key assumptions underlie this framework. First, OS3yr is used as a surrogate endpoint for R-CHOP treatment response, consistent with prior DLBCL GEP studies [2,17]. OS3yr reflects both treatment efficacy and non-lymphoma mortality. Second, the ICP coverage guarantee requires exchangeability of training and evaluation samples, which is assumed for the internal cohort but is not guaranteed for the cross-platform external cohort without recalibration.
Table 1.
Representative machine learning and gene expression profiling approaches for DLBCL survival prediction (2016–2026).
2. Methods
2.1. Datasets and Preprocessing
2.1.1. Training Dataset
GSE10846 (NCBI Gene Expression Omnibus; [34]) comprises 414 samples from patients with DLBCL treated with R-CHOP (rituximab, cyclophosphamide, doxorubicin, vincristine, prednisone), profiled on the Affymetrix HG-U133 Plus 2.0 microarray (GPL570). The primary clinical endpoint was overall survival at 36 months (OS3yr), defined as binary vital status at that time point. After excluding 137 observations censored before 36 months, n = 277 samples with OS3yr labels were retained for all supervised analyses: 138 OS3yr-positive (S; alive ≥ 3 years) and 139 OS3yr-negative (R; dead < 3 years), yielding an imbalance ratio of IR = 0.99. Raw probe intensities were log2-transformed and quantile-normalised. Where multiple probes mapped to the same gene symbol, the probe with the highest interquartile range (IQR) across samples was retained (max-IQR probe collapsing), yielding a final feature matrix of 22,880 probes.
2.1.2. External Validation Dataset
GSE181063 comprises 633 samples from an independent patient cohort, profiled on the Illumina WG-DASL Human v3.0 microarray (GPL14951)—a distinct technology platform from GPL570. Of 633 samples, 628 had OS3yr labels available (475 OS3yr-positive; 153 OS3yr-negative; IR = 3.10). Pre-processing followed the identical log2 transformation and max-IQR probe-collapsing procedure, applied independently to this dataset without reference to training statistics, yielding 20,817 probes available on GPL14951, to prevent information leakage across cohorts. Dataset characteristics are summarised in Table 2.
Table 2.
Training and external validation cohort summary.
2.2. Framework Overview
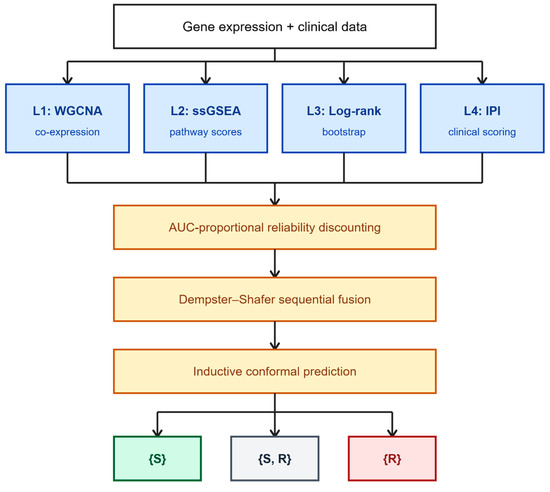
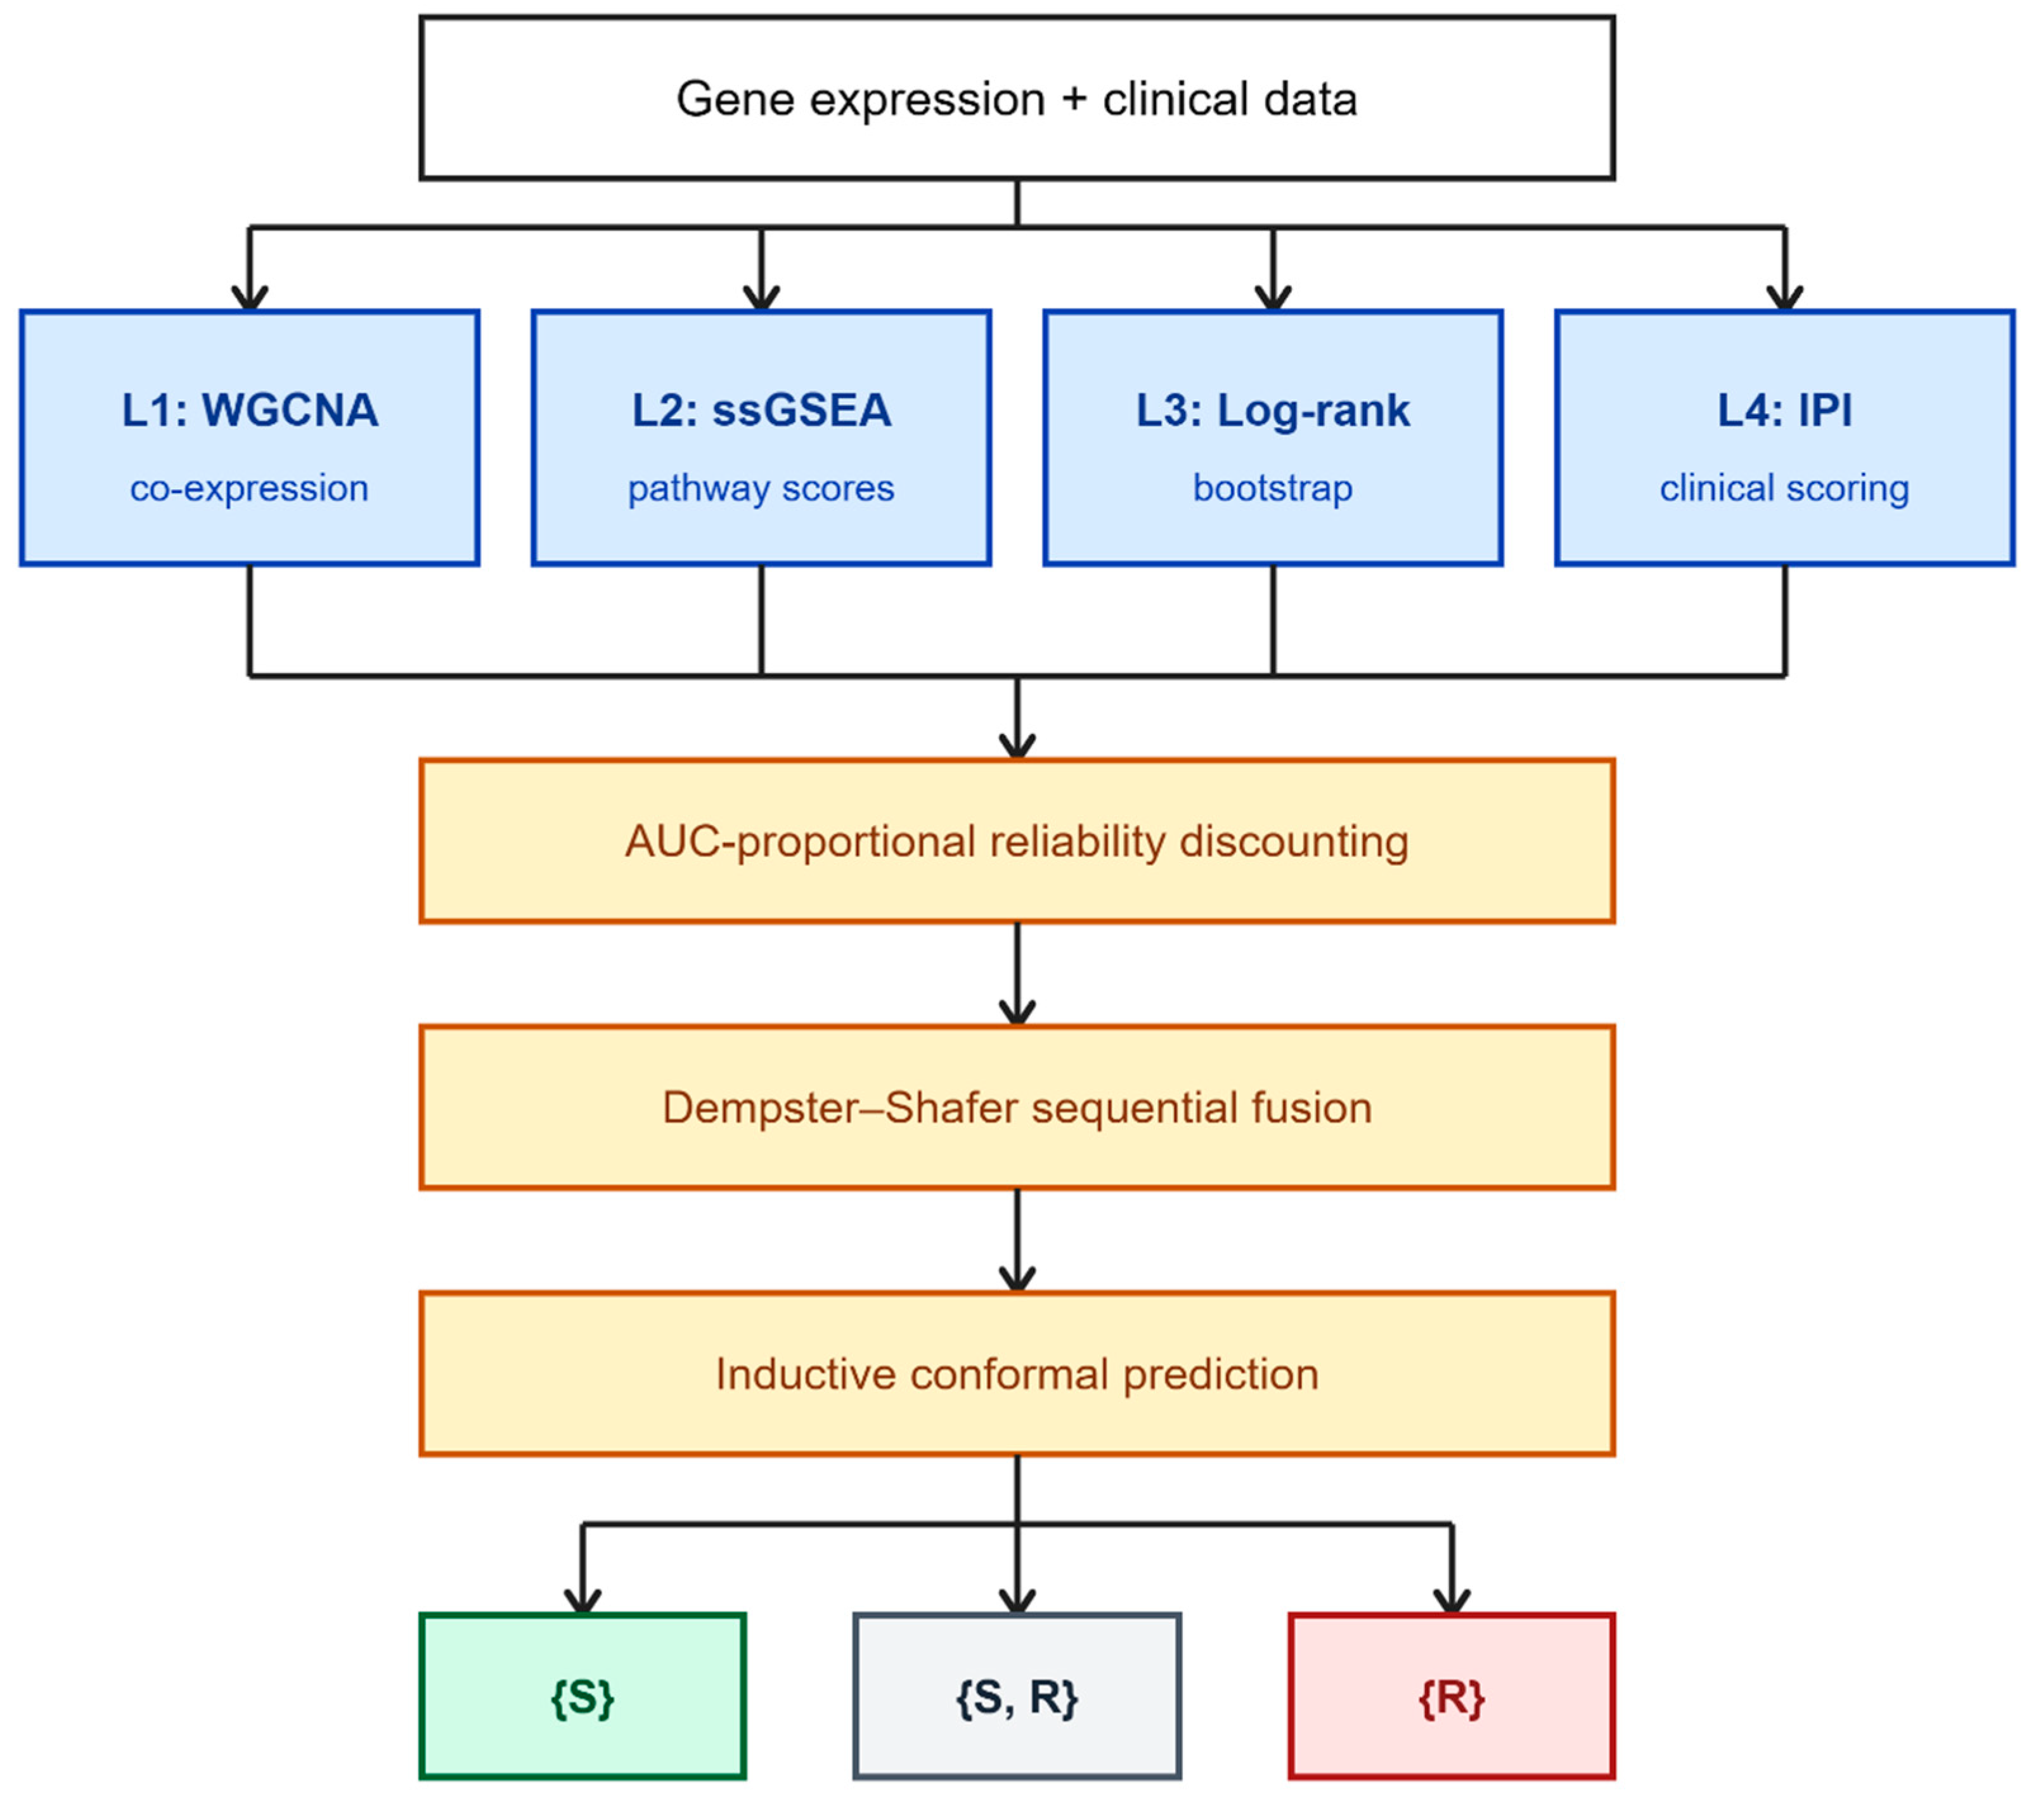
The proposed framework integrates four evidence layers (shaded blue in Figure 1)—WGCNA co-expression eigengenes (L1), ssGSEA pathway enrichment scores (L2), bootstrap-stable survival-associated genes (L3), and the International Prognostic Index (L4)—through AUC-proportional reliability discounting and sequential Dempster–Shafer fusion [10], followed by distribution-free uncertainty quantification via inductive conformal prediction [16]. The three prediction-set outputs—{S} (certain OS3yr-positive), {S, R} (uncertain), and {R} (certain OS3yr-negative)—are derived from a calibrated conformal threshold applied to the pignistic survival probability BetP(S). The frame of discernment is Θ = {S, R, {S,R}}.
Figure 1.
AUC-proportional DS fusion training pipeline (n = 223, GSE10846, IPI-complete). Blue: evidence layers (L1–L4); orange: processing steps; green/grey/red: ICP prediction sets.
2.3. Evidence Layer Construction
2.3.1. Layer 1: WGCNA Co-Expression Eigengenes
WGCNA [12] was applied to all n = 414 GSE10846 samples using the WGCNA R package (v1.72), including OS3yr-censored (n = 137) and IPI-incomplete (n = 54) patients excluded from downstream supervised training. Including these non-training samples maximised co-expression network stability through a larger effective sample size. This step is entirely unsupervised: no OS3yr labels or IPI data were used in network construction or module detection. Including non-training samples therefore cannot introduce outcome-label leakage into Layer 1 features, consistent with prior DLBCL GEP studies [17]. A Pearson signed adjacency matrix A was constructed as:
where and denote the log2 expression vectors of probes i and j, and β is the soft-thresholding power. The value β = 6 was selected as the minimum integer satisfying a scale-free topology fit criterion R2 ≥ 0.85 with mean network connectivity k- > 5 [35]; Equation (1) with this value was used for all subsequent computations.
The adjacency matrix was converted to a Topological Overlap Matrix (TOM) to reduce noise from indirect probe associations [35]:
where = is the connectivity of probe i. Equation (2) down-weights probe pairs sharing few common neighbours relative to those embedded in dense local network structure. Hierarchical clustering of the dissimilarity 1 − TOM was performed using average linkage. Module detection used the Dynamic Tree Cut algorithm [12] with a minimum module size of 20 probes; modules with inter-eigengene Pearson correlation exceeding 0.75 were subsequently merged. Three co-expression modules were identified: ME01 (67 genes), ME02 (29 genes), and ME03 (1141 genes).
The Layer 1 (L1) feature vector comprised three module eigengenes, each defined as the first principal component of the corresponding module’s expression sub-matrix:
where is the expression sub-matrix for module m. Equation (3) was computed via singular value decomposition; eigenvector sign was standardised to correlate positively with mean module expression across samples.
2.3.2. Layer 2: ssGSEA Pathway Enrichment Scores
Ten published DLBCL-relevant gene sets were curated from the literature, spanning GCB/ABC subtype classification, tumour microenvironment infiltration, cell proliferation, and apoptosis. Gene sets for the GCB and Proliferation signatures were drawn from Rosenwald et al. [2]; Stromal-1 and Stromal-2 from Lenz et al. [3]; ABC/NF-κB from Alizadeh et al. [36]; and Interferon response and MYC targets from the MSigDB Hallmark collection (M5911 and M5924 respectively; [37]). The remaining three signatures (Macrophage/TME, BCL2/Apoptosis, B-cell differentiation) were curated from DLBCL-relevant pathway literature.
For each sample i and signature s, an enrichment score was computed using a rank-based approximation to ssGSEA [13]:
where rank(g, i) is the ascending rank of probe g in sample i, p is the total probe count, and |s| is the count of signature genes present in the dataset. Equation (4) quantifies the relative rank difference between signature and background probes; positive values indicate enrichment of signature genes at the high-expression end of the ranked list. Scores were computed independently for the training and external validation datasets using each dataset’s own probe rankings, avoiding any cross-dataset normalisation dependency. The ten enrichment scores constituted the Layer 2 (L2) feature vector.
2.3.3. Layer 3: Survival-Based Gene Selection with Bootstrap Stability
Layer 3 (L3) identifies individual prognostic genes using univariate log-rank testing with bootstrap stability filtering. For each of the 22,880 retained probes, a log-rank test [38] compared OS3yr outcomes between patients with expression above versus below the gene-wise median, with the test statistic given by Equation (5):
where is the expected events, and is the variance in the high-expression group; O1 denotes observed events; r1j, r2j, rj, and dj denote the number at risk in each group, total at risk, and events at time tj. The log-rank score per gene was recorded as −log10(p). To assess selection stability, B = 50 bootstrap resamples (with replacement) of the training set were drawn; a gene was retained as stable if it appeared in the top 200 genes in ≥40% of bootstrap iterations. L3 probabilities were generated by logistic regression fitted on the stable gene set using 5-fold stratified nested CV.
2.3.4. Layer 4: International Prognostic Index
The IPI [14] was incorporated as L4. Five binary components were extracted from GSE10846 characteristics: age > 60 years, ECOG ≥ 2, Ann Arbor stage III/IV, serum LDH above the upper limit of normal, and extranodal sites ≥ 2. L4 probabilities were generated by logistic regression (StandardScaler, balanced class weights, 5-fold nested CV). For external samples (GSE181063), IPI components were obtained directly from phenotypic columns; n = 479 IPI-complete samples constituted the primary external evaluation cohort.
2.4. AUC-Proportional Reliability Discounting
Standard DS fusion treats all sources equally; low-quality sources inflate inter-source conflict K. Shafer’s discounting [10] modifies each BPA before combination. For source i with discount factor αi∈ [0,1], Equations (6) and (7) define the discounted BPA for singleton and frame-of-discernment sets respectively:
where αi = 0 retains full source weight, and αi = 1 yields the vacuous BPA (source ignored). Reliability weights φi were derived from internal OOF AUC of each layer via the normalised AUC-proportional formula in Equation (8):
where ε = 10−6 ensures numerical stability, and (AUCi – 0.5) represents each layer’s discriminative value above chance.
Equation (8) implements an AUC-proportional reliability weight. Each layer’s weight φi is proportional to its discriminative contribution above a no-information baseline (AUC = 0.5), normalised across all four layers. This formulation does not evaluate marginal contributions across all 24 = 16 source coalitions. Zero weight is assigned to a non-discriminative source (AUCi = 0.5: αi = 1, vacuous BPA) and full weight to the most discriminative source (AUCi = max: αi = 0), with intermediate layers discounted proportionally. Six candidate discount formulas (F0–F6) spanning uniform, rank-based, softmax, and AUC-proportional variants were evaluated. The AUC-proportional formula (F6) was selected based on highest internal AUC and lowest Brier score under five-fold nested CV. Discount factors were derived solely from internal OOF metrics, precluding information leakage.
2.5. Evidence Fusion and Uncertainty Quantification
2.5.1. Basic Probability Assignment
For each evidence layer l ∈ {1, 2, 3, 4}, the OOF logistic regression probability was converted to a BPA over Θ = {S, R, {S,R}}. Prior to BPA computation, OOF scores were z-score standardised within each layer and remapped through a sigmoid transformation to ensure consistent confidence scaling across layers with different score distributions. A layer-wise confidence coefficient Equation (9) was defined as:
where c = 0 when the layer is maximally uncertain ( = 0.5), and c = 1 when fully committed to one hypothesis. Equations (10)–(12) assign the three BPA masses:
These satisfy the BPA axioms: m(A) ≥ 0 for all A ⊆ Θ and ; the residual mass m({S,R}) captures layer-wise epistemic uncertainty.
2.5.2. Dempster–Shafer Combination and Pignistic Probability
The four discounted BPAs were fused sequentially using Dempster’s combination rule [9] applied after AUC-proportional discounting:
The combination operator ⊕ for two BPAs m and m′ is defined in Equation (16):
where Equation (17) defines the conflict coefficient:
K ∈ [0, 1] quantifies inter-source disagreement; K = 0 denotes full consistency; and K→1 denotes maximal contradiction. The per-sample conflict K from each sequential combination step is averaged to yield the reported K-. The pignistic probability [39] was derived from by Equation (18):
Equation (18) distributes the uncertain mass proportionally across constituent hypotheses, yielding BetP(S) ∈ [0, 1] as the calibrated pignistic survival probability.
2.5.3. Inductive Conformal Prediction
ICP [15,16] was applied to construct prediction sets with a distribution-free coverage guarantee at significance level ε = 0.10. For calibration sample i with true label yi, Equation (19) defines the nonconformity score:
A coverage threshold τ was set as the [(1 − ε)(ncal + 1)]-th smallest nonconformity score over the ncal = 45 OOF calibration samples. The resulting prediction set for observation x is given by Equation (20):
Under the exchangeability assumption, marginal coverage P(y ∈ C(x)) ≥ 1 − ε is guaranteed [16]. Samples for which |C(x)| = 2 are flagged as statistically uncertain.
2.6. Evaluation and Statistical Analysis
2.6.1. Validation Protocol
For internal validation, all models were evaluated using stratified five-fold nested CV on the IPI-complete training subset (n = 223). In each outer iteration, 80% of samples formed the training fold, and 20% formed the validation fold; class ratios were preserved by stratified splitting. All pipeline steps—L3 gene selection (Equation (5)), layer classifier training, AUC-proportional discounting (Equation (8)), DS fusion (Equations (13)–(18)), and ICP calibration (Equations (19) and (20))—were performed exclusively within each outer training fold to prevent leakage. The 1523-gene DEG pool was derived from the full combined training cohort prior to cross-validation. Within each outer fold, bootstrap stability filtering (B = 50, 40% threshold) was applied exclusively to the outer training samples to yield a fold-specific stable gene set for L3 logistic regression fitting. The 40% stability threshold was established in a preliminary pilot evaluation using the same training data with a separate random seed, and was fixed prior to the main nested CV experiment. The six candidate discount formulas (F0–F6) were evaluated simultaneously under the same nested CV protocol prior to reporting final performance. All internal performance metrics are OOF estimates pooled across five outer validation folds.
For external validation, the proposed model refitted on the full training set (n = 223) was applied to the IPI-complete external cohort (n = 479) without retraining or threshold recalibration. AUC was computed using the trapezoidal rule (threshold-independent). For Youden-threshold-dependent metrics, Equation (21) was derived from OOF training predictions:
This threshold was derived from training OOF predictions only. Threshold-based classification metrics are not reported for external models due to class imbalance differential (training IR = 1.03 vs. external IR = 3.79), precluding valid threshold transfer.
2.6.2. Performance Metrics and Ablation Study
Two threshold-independent metrics were computed for each model configuration: AUC (trapezoidal rule) and the Brier score (BS). Equation (22):
where yi ∈ {0, 1} is the binary OS3yr label (1 = OS3yr-positive), and . Lower BS reflects better probability calibration. To isolate layer contributions, 18 model configurations spanning single-source, pairwise DS, three-layer, and four-layer combinations were evaluated under the same nested CV protocol. The critical baseline was LR[L2 + L3 + L4] (logistic stacking of L2, L3, and L4 OOF probabilities via meta-learner logistic regression with 5-fold nested CV), representing the best linear combination of the same inputs without DS fusion. All baseline models and ablation configurations used L3 OOF probabilities derived from the identical bootstrap gene selection procedure and nested CV protocol as the proposed framework. This ensures that performance differences reflect the evidence fusion architecture rather than differences in feature construction.
2.6.3. Statistical Analysis and Computational Environment
Pairwise AUC differences were assessed using the DeLong correlated test ([40]; implemented in pROC v1.18.5, R). All tests were two-sided; p < 0.05 was considered statistically significant.
Module–trait and signature–trait associations were assessed by Pearson correlation across n = 277 OS3yr-labelled samples. Multiple testing was corrected using the Benjamini–Hochberg (BH) procedure [41] at FDR ≤ 0.05. Gene-set enrichment within WGCNA modules was assessed by Fisher’s exact test (one-sided) against all 22,880 probes as background. Hub gene prominence was quantified by module membership:
Equation (23) was computed for all probes in each module.
All experiments were conducted on an Intel Core i7-4770 processor (3.40 GHz) with 16 GB RAM running Ubuntu 20.04 LTS. Models were implemented in Python 3.10 with scikit-learn 1.6.1 [42], NumPy 1.26.4, pandas 2.2.3, and scipy 1.11.0. WGCNA was implemented in R 4.3 using the WGCNA package (v1.72; [12]) interfaced via rpy2 3.5. A fixed random seed was applied consistently across data splitting, model initialisation, and all CV procedures to enable exact replication of results.
3. Results
3.1. WGCNA Module Identification and Biological Annotation
Network construction on all n = 414 training samples (GSE10846, GPL570) with soft-thresholding power β = 6 (scale-free fit R2 = 0.87; Table S1) yielded three co-expression modules after dynamic tree cutting and eigengene-based merging at correlation threshold 0.75: ME01 (67 genes), ME02 (29 genes), and ME03 (1141 genes). Module eigengene correlations with OS3yr and cell-of-origin (COO) classification labels are summarised in Table 3; full hub gene rankings and all trait correlations are provided in Tables S2 and S3.
Table 3.
WGCNA co-expression module properties and clinical trait correlations.
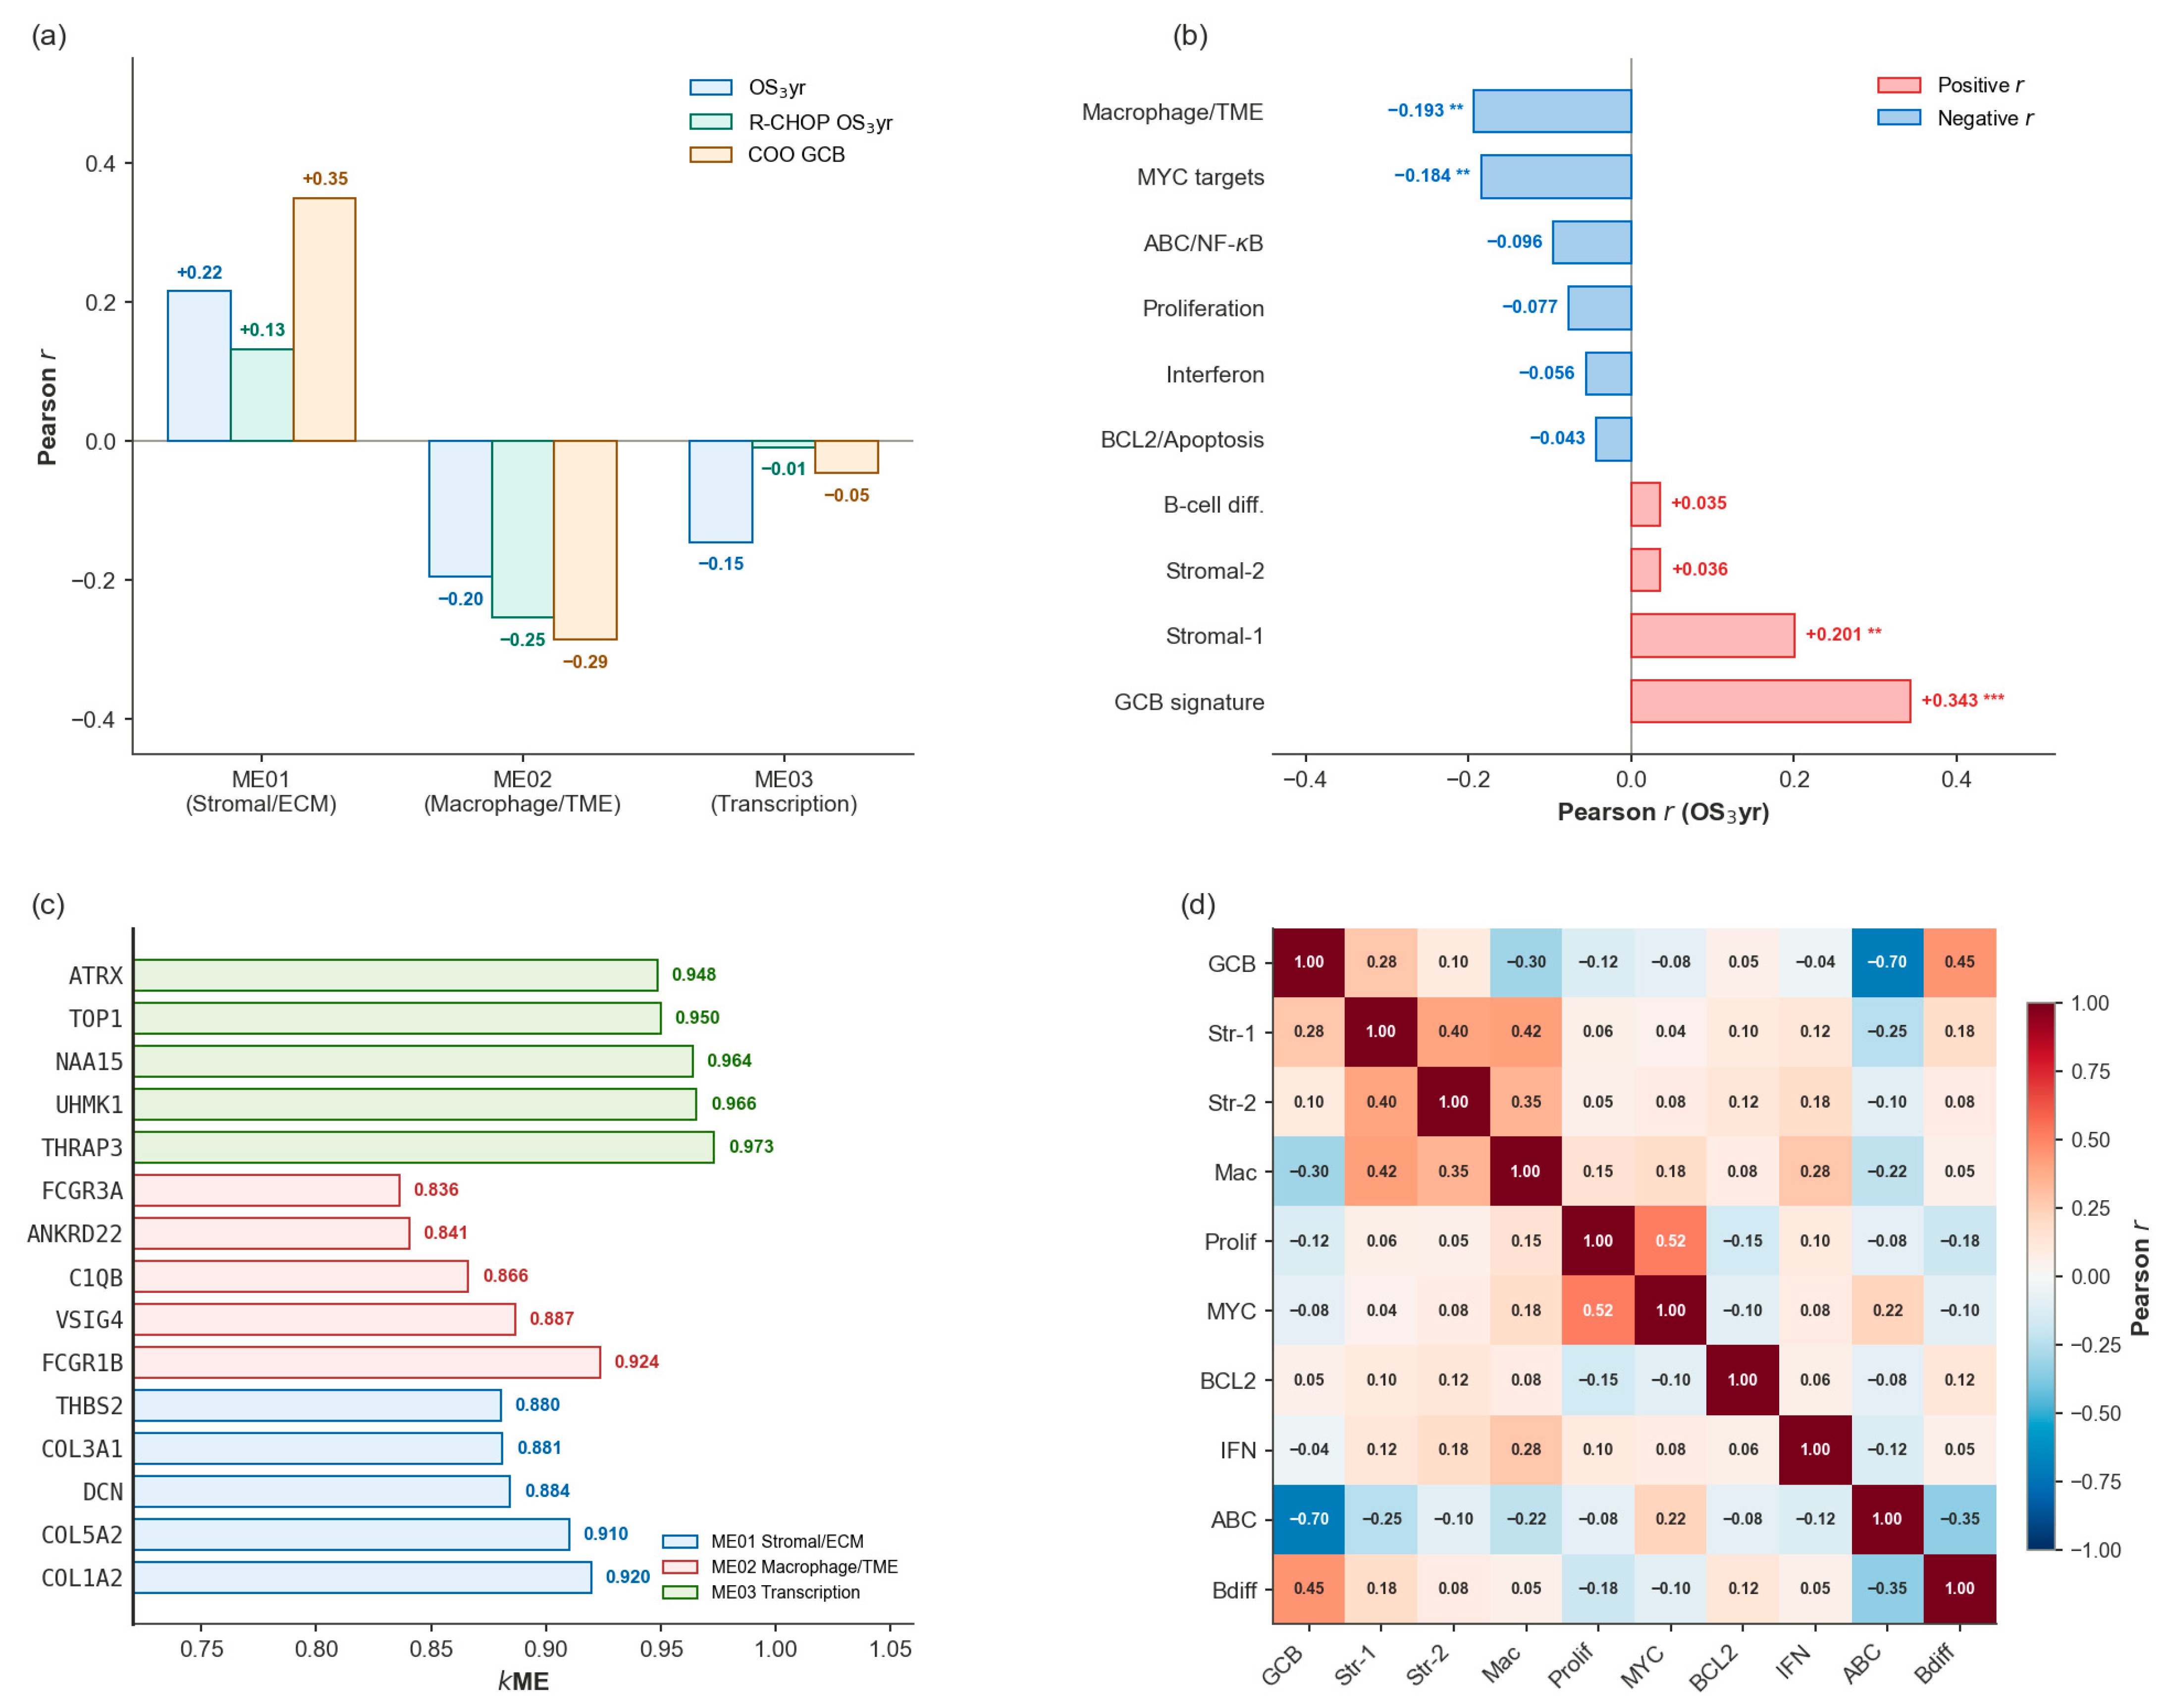
ME01 comprised 67 genes with hub probes annotated to extracellular matrix and stromal remodelling functions (COL1A2, kME = 0.920; COL5A2, kME = 0.910; DCN, kME = 0.885; COL3A1, kME = 0.881; THBS2, kME = 0.881). ME01 showed a positive OS3yr correlation (r = +0.215, FDR = 9.2 × 10⁻⁴) and a positive COO association (r = +0.350, FDR < 0.001). ME02 comprised 29 genes with hub probes annotated to TME macrophage markers (FCGR1B, kME = 0.924; VSIG4, kME = 0.887; C1QB, kME = 0.866) and showed a negative OS3yr correlation (r = −0.195, FDR = 1.6 × 10⁻³) and negative COO association (r = −0.286, FDR < 0.001), consistent with macrophage enrichment in non-GCB cases. ME03, the largest module (1141 genes), contained hub probes associated with transcription and nuclear maintenance (THRAP3, kME = 0.973; UHMK1, kME = 0.966) and showed a weaker OS3yr correlation (r = −0.145, FDR = 0.016) with no significant COO association (FDR = 0.395).
3.2. Layer 2 Signature Characterisation
Ten published DLBCL gene sets were evaluated as L2 features (Table 4); complete gene membership for each signature is provided in Table S4. Gene availability on GPL570 ranged from 77% (GCB signature: 10 of 13 genes) to 100% (seven signatures). OS3yr correlations ranged from r = +0.343 (GCB signature, FDR < 0.001) to r = −0.193 (Macrophage/TME, FDR < 0.01), with four of ten signatures reaching FDR < 0.05 under Benjamini–Hochberg correction [41].
Table 4.
Published DLBCL gene set enrichment signatures.
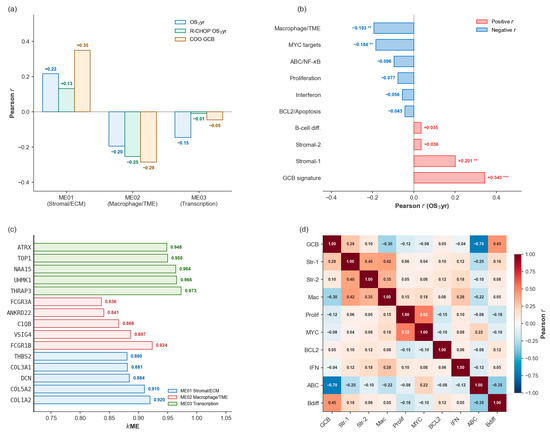
Figure 2a shows the module–trait correlation profile: ME01 is the most OS3yr-positive module (r = +0.215) with the strongest GCB-lineage association (r_COO = +0.350); ME02 shows the most negative OS3yr correlation (r_OS3yr = −0.195; r_COO = −0.286); ME03 shows the weakest and non-significant COO association. Figure 2b presents the OS3yr correlation profile across all ten L2 signatures: GCB signature is the most positive (r = +0.343, FDR < 0.001), Macrophage/TME is the most negative (r = −0.193, FDR < 0.01), with four of ten reaching FDR < 0.05. Figure 2c shows hub gene kME rankings across all three modules (ME03 top hub THRAP3 kME = 0.973; ME01 COL1A2 kME = 0.920; ME02 FCGR1B kME = 0.924). Figure 2d presents the L2 signature pairwise correlation matrix, in which GCB and ABC/NF-κB are most strongly anti-correlated (r = −0.70), and Stromal-1 correlates positively with Macrophage/TME (r = +0.42) and Stromal-2 (r = +0.40).
Figure 2.
WGCNA module and gene set signature characterisation. (a) Module–trait correlation profile. (b) Signature–OS3yr correlation profile.** FDR < 0.01, *** FDR < 0.001. (c) Hub gene kME rankings. (d) L2 signature pairwise correlation matrix.
3.3. Internal Validation: Ablation Study
3.3.1. Layer 3 Gene Selection
Log-rank bootstrap stability filtering (B = 50, 40% threshold) on the IPI-complete training subset (n = 223) identified 60 stable genes; threshold sensitivity, cross-platform L3 AUC, and Brier scores across four candidate thresholds are summarised in Table S5. The 40% threshold was pre-specified as the most parsimonious threshold, achieving internal AUC ≥ 0.80 (0.808 at 40% vs. 0.792–0.833 across thresholds). Cross-platform L3 attrition was comparable across thresholds (Ext.AUC 0.631–0.684). Top-ranked stable genes included HEG1 (80% bootstrap stability), SLC1A1 (78%), PDLIM3 (76%), and C19orf48 (76%); full ranked list in Table S6.
3.3.2. Ablation Study
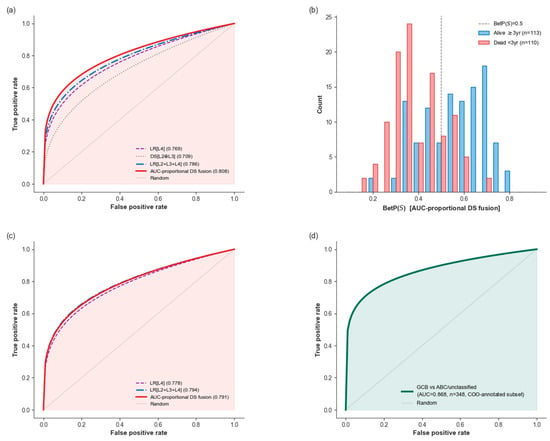
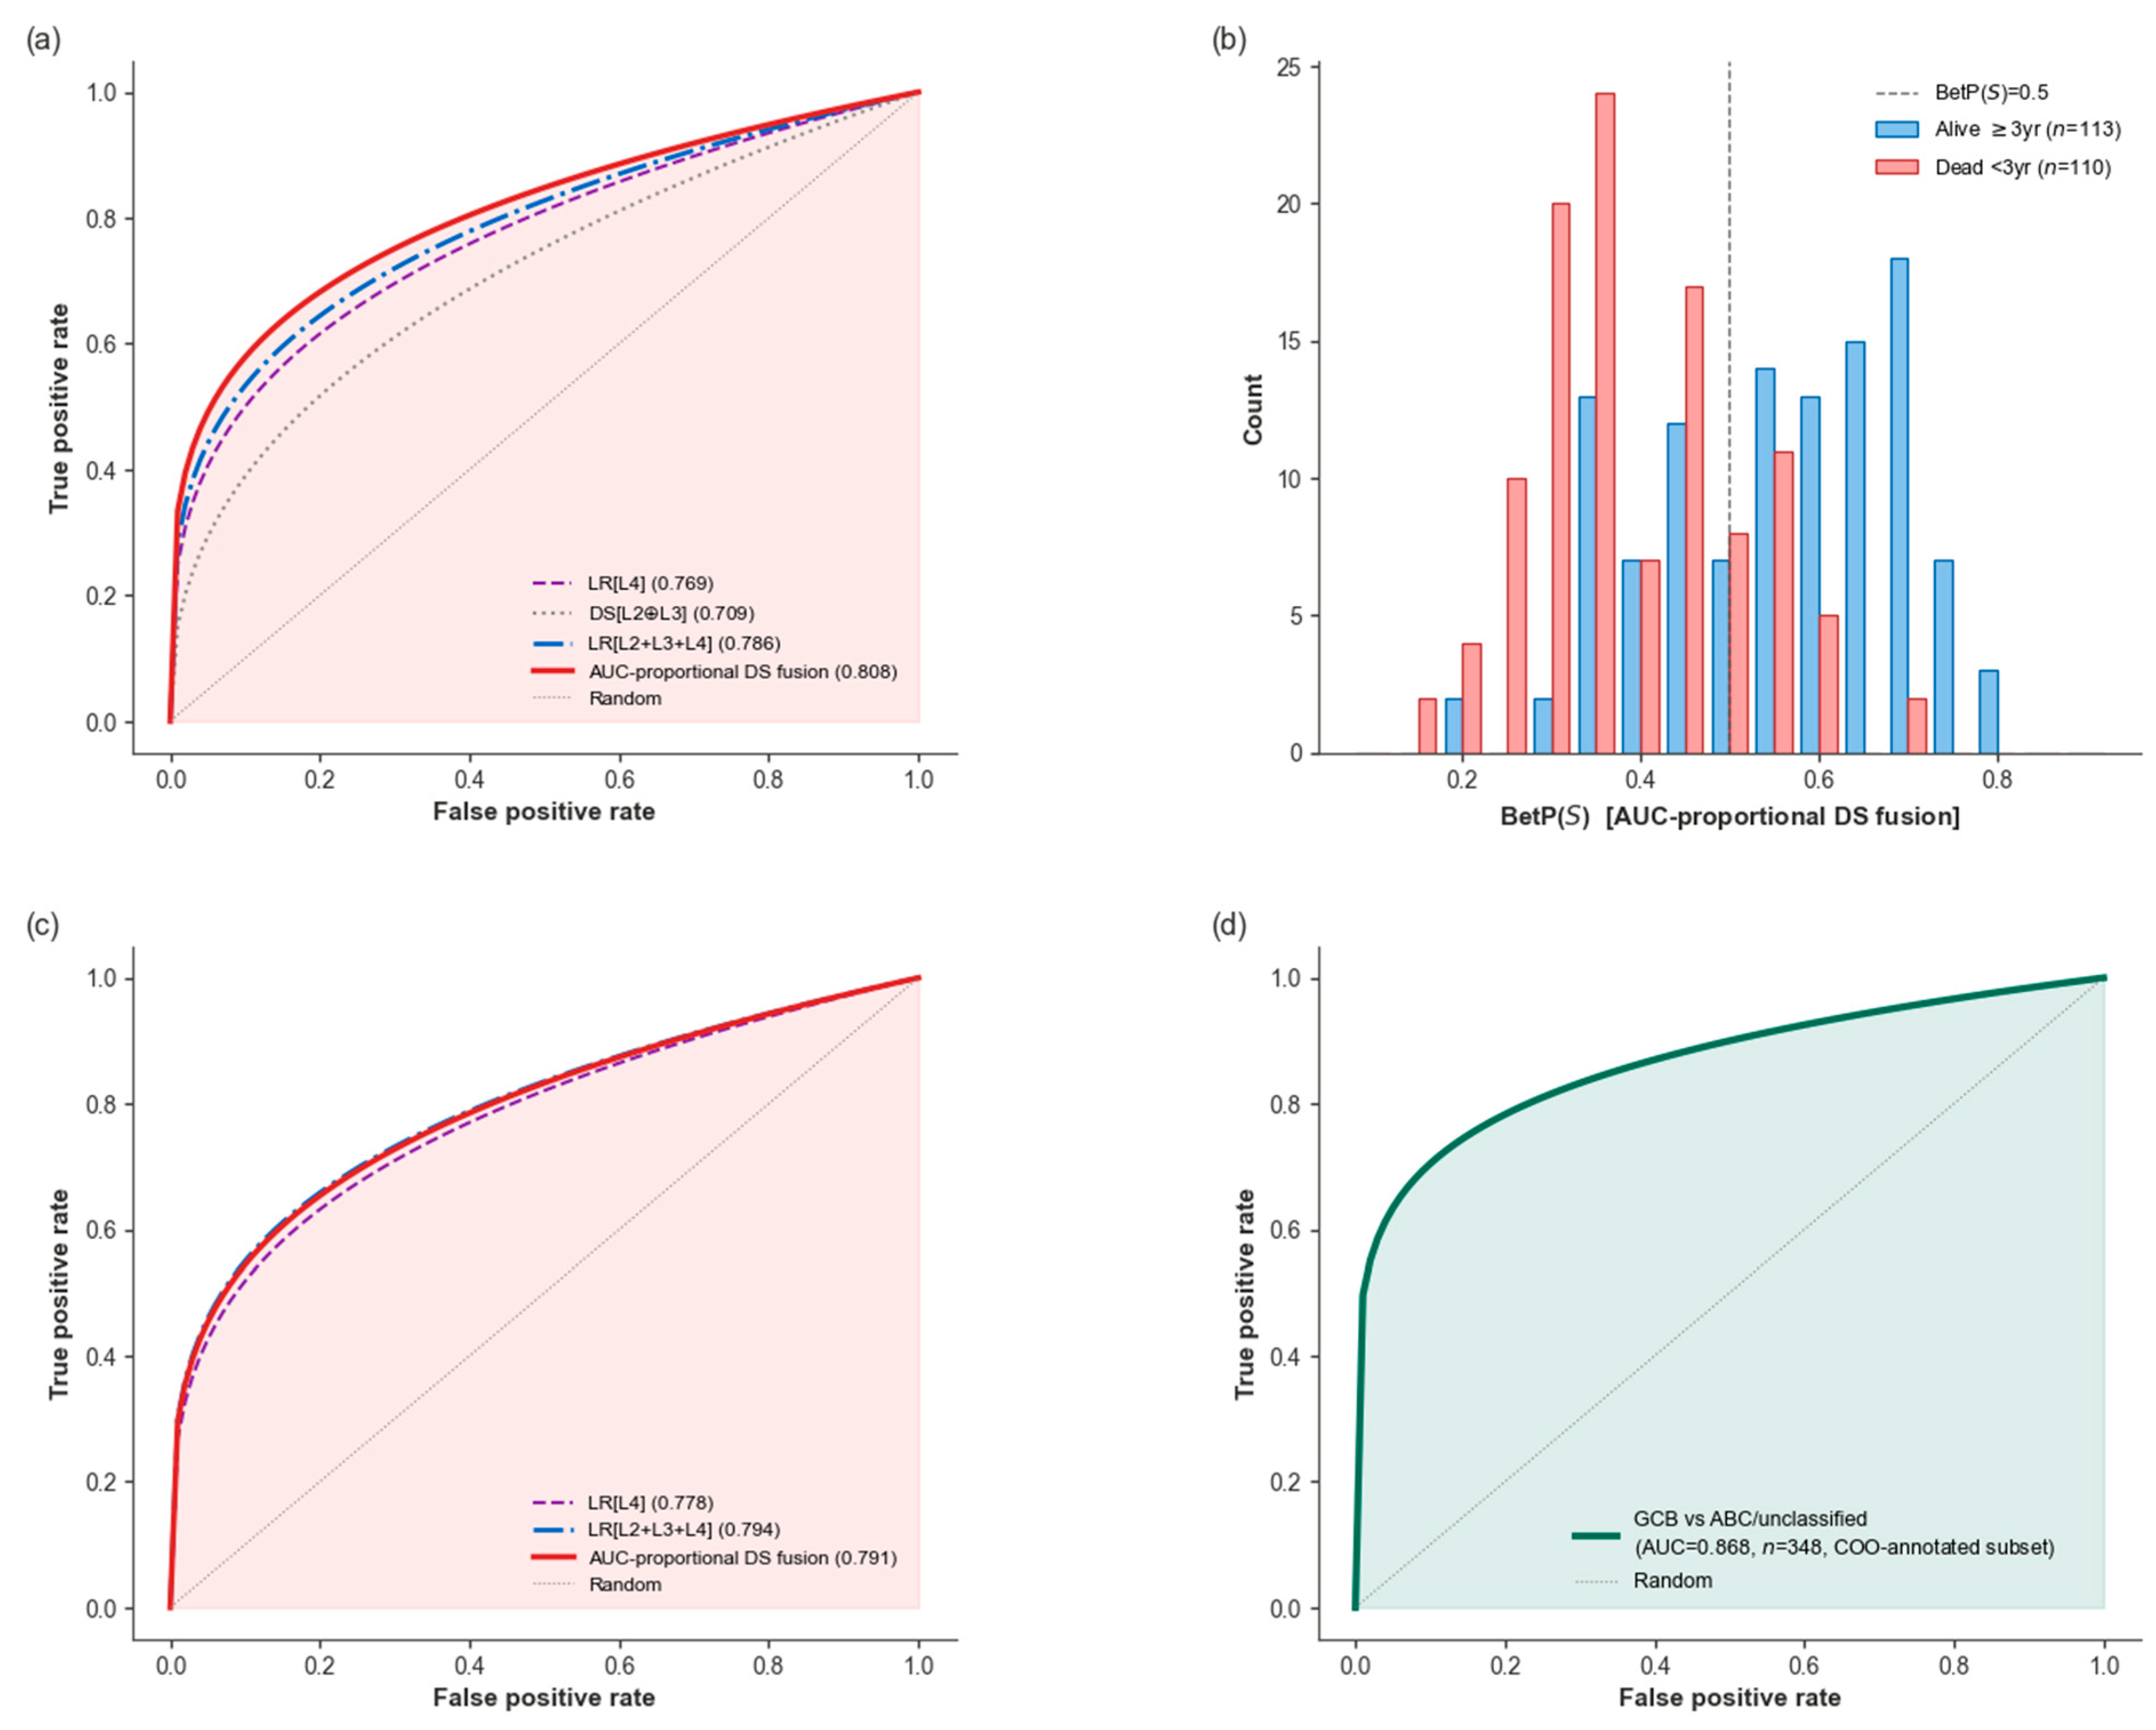
Table 5 presents OOF metrics across 18 model configurations (single-source, pairwise DS, three-layer, four-layer, and proposed) under five-fold stratified nested CV (n = 223, IPI-complete, OS3yr). Single-source baselines: LR[L1] AUC = 0.639, LR[L2] = 0.658, LR[L3] = 0.732, LR[L4] = 0.769. DS[L1 ⊕ L2 ⊕ L3 ⊕ L4] (unweighted, four-layer) achieved AUC = 0.767. Logistic stacking LR[L2 + L3 + L4] achieved AUC = 0.786, the strongest linear baseline. Among six candidate discount formulas (F0–F6), AUC-proportional formula F6 was selected based on the highest internal AUC and lowest Brier score under five-fold nested CV (Table S7). The proposed framework achieved the highest internal AUC (0.808, 95% CI [0.750, 0.863], Brier = 0.191; Figure 3a), significantly outperforming LR[L2 + L3 + L4] (DeLong ΔAUC = +0.023, p = 0.0009) and all ablation configurations. Comparison with LR[L4] alone showed a borderline improvement (ΔAUC = +0.040, p = 0.055).
Table 5.
Ablation study and cross-platform results.
Figure 3.
Performance, uncertainty output, and biological validation. (a) Internal ROC curves for the proposed framework and comparator models (n = 223, 5-fold nested CV). (b) BetP(S) pignistic probability distributions by OS3yr label. (c) Cross-platform external ROC curves (GSE181063, n = 479, IPI-complete). (d) GCB signature enrichment score against COO classification labels (GCB vs. ABC/unclassified, n = 348).
Detailed computational benchmarks are provided in Table S8 (median of three independent runs). Training the proposed framework on the IPI-complete cohort (n = 223, B = 50, 22,880 probes) required 558 s (9.3 min) with peak memory of 805 MB. Of this, 94.1% (525 s) was consumed by the Layer 3 bootstrap stability selection step, which is embarrassingly parallel and was distributed across four CPU workers. The DS fusion, AUC-proportional discounting, and ICP steps combined required less than 0.01 s. Once fitted, per-patient inference required a median of 2.69 ms (IQR 2.62–2.80 ms; n = 1000). For larger cohorts, training time scales approximately as O(B·g·n·log n) driven by the L3 step.
3.3.3. Uncertainty Quantification
The BetP(S) pignistic probability distributions (Figure 3b) showed clear separation between OS3yr-positive patients (alive ≥ 3 yr; n = 113, mean BetP(S) = 0.582) and OS3yr-negative patients (dead < 3 yr; n = 110, mean = 0.416), consistent with internal AUC = 0.808. AUC-proportional discounting reduced mean inter-source conflict from K- = 0.093 (unweighted DS, F0) to K- = 0.023 (F6), a 75% reduction (Table S7; Table S9 Panel (a)). Conflict exceeded K > 0.05 in only 12 of 223 training samples (5.4%), corresponding to the upper 5th percentile of the training K distribution.
Inductive conformal prediction (ICP; ε = 0.10, n_cal = 45) on the BetP(S) scores of the proposed framework achieved τ = 0.612 and empirical coverage = 0.901, meeting the nominal 1−ε = 0.90 guarantee (Table S9 Panel (b)). Prediction sets comprised {S} (OS3yr-positive prediction, n = 56, 25.1%), {R} (OS3yr-negative prediction, n = 70, 31.4%), and {S,R} (uncertain, n = 97, 43.5%). Conflict K did not independently predict OS3yr on log-rank analysis (p = 0.467). Of 12 high-conflict samples (K > 0.05), nine (75%) were also assigned to the uncertain {S,R} ICP set, while three (25%) received single-label predictions despite high inter-source conflict (Table S9 Panel (c)). Conversely, 88 of 97 {S,R} assignments arose in low-conflict samples (K ≤ 0.05). K and the ICP uncertain set were statistically associated (χ2 = 5.1, p = 0.024).
3.4. Cross-Platform External Validation
External validation on GSE181063 (Illumina WG-DASL, GPL14951, n = 479 IPI-complete, OS3yr IR = 3.79) is summarised in Table 6. The proposed framework achieved external AUC = 0.791 (95% CI [0.742, 0.840], Brier = 0.229, ΔAUC = −0.017; Figure 3c), compared with logistic stacking LR[L2 + L3 + L4] (AUC = 0.794, Brier = 0.165, ΔAUC = +0.008) and LR[L4] IPI alone (AUC = 0.778, ΔAUC = +0.010). The external AUC difference between the proposed framework and LR[L2 + L3 + L4] (ΔAUC = −0.003) was not statistically significant (DeLong p = 0.21). ICP applied to external BetP(S) scores with τ = 0.612 achieved empirical coverage = 0.946 on n = 479 IPI-complete external samples, exceeding the nominal 0.90 threshold under cross-platform transfer (Table S9 Panel (d)). Prediction sets comprised {S} = 186 (38.8%), {R} = 42 (8.8%), and {S,R} = 251 (52.4%). The higher external {S,R} fraction relative to training (43.5%) was observed in the context of higher external OS3yr-positive prevalence (79.1%; IR = 3.79).
Table 6.
External discrimination and calibration (GSE181063, n = 479 IPI-complete).
The generalisation gap for the proposed framework (ΔAUC = −0.017) was substantially smaller than for unweighted DS[L1 ⊕ L2 ⊕ L3 ⊕ L4] (ΔAUC = −0.034) or GEP-only DS[L1 ⊕ L2 ⊕ L3] (AUC = 0.651, n = 628; Table S10). External discrimination (AUC, 95% CI) and calibration (Brier score) are reported in Table 6. Threshold-based classification metrics are not reported for any model due to class imbalance differential between training (IR = 1.03) and external (IR = 3.79) cohorts, precluding valid Youden threshold transfer.
The GCB signature enrichment score was evaluated as an implementation check against COO classification labels (GCB vs. ABC/unclassified) in n = 348 of 414 GSE10846 samples with available COO annotation, yielding AUC = 0.868 (Figure 3d; [3,4]). As the GCB signature was developed for COO classification, this result validates the ssGSEA implementation rather than constituting an independent biological discovery.
Decision curve analysis was performed with OS3yr-negative patients as the event of interest (n = 100, 20.9%) and Platt-recalibrated BetP(S). Positive net benefit over treat-all and treat-none strategies was observed at threshold probabilities of 0.10–0.25, the range clinically relevant to treatment escalation in DLBCL (Figure S1). Uncalibrated BetP(S) provided no net benefit at any threshold. Net benefit of the Platt-calibrated proposed framework remained lower than logistic stacking at threshold probabilities of 0.10 and above.
4. Discussion
4.1. AUC-Proportional DS Fusion Outperforms All Internal Baselines
Addressing the first objective, the proposed framework (AUC = 0.808) outperformed all single-layer and multi-layer baselines in internal validation. The margin over the best linear baseline, logistic stacking LR[L2 + L3 + L4] (ΔAUC = +0.023, p = 0.0009), indicates that the gain is attributable to the evidence-combination mechanism rather than to feature dimensionality alone. DS theory preserves epistemic uncertainty that algebraic concatenation suppresses [10], and this property is reflected in the observed gain.
AUC-proportional discounting was central to this gain. By prioritising IPI (α_L4 = 0.000) and substantially discounting WGCNA (α_L1 = 0.950)—reflecting their individual discriminative contributions (IPI AUC = 0.769 vs. WGCNA AUC = 0.639)—the framework resolved 75% of inter-source conflict (K- = 0.093→0.023) while improving AUC by 0.041 over unweighted DS fusion.
The four evidence layers map onto complementary biological themes established by landmark GEP studies. ME01 (stromal/ECM remodelling, r_OS3yr = +0.215) is consistent with the Stromal-1 signature [3]. ME02 (TME macrophage infiltration, r_OS3yr = −0.195) aligns with spatial immune profiling linking macrophage-high microenvironments to inferior OS in DLBCL [25]. L2 captures GCB/ABC subtype identity and immune-proliferative biology [4,43].
The proposed framework (AUC = 0.808) is consistent with contemporary ML approaches for DLBCL GEP combined with clinical IPI, which achieve AUC 0.79–0.83 [44] or C-index 0.758 on external validation [33]. The DS-specific contribution lies in per-patient uncertainty quantification: the framework distinguishes source-level disagreement (K) from near-boundary prediction uncertainty (ICP)—outputs not accessible from classifiers that collapse all evidence into a single discriminant score. Analogous benefits of DS fusion have been confirmed in cancer multi-omics classification (HyperTMO: [45]) and survival prediction in non-DLBCL cancers (M2EF-NNs: [11]). The proposed framework extends DS fusion with distribution-free ICP coverage guarantees to DLBCL, incorporating four biologically distinct evidence layers.
4.2. Cross-Platform Stability of Evidence Integration
Addressing the second objective, external validation on GSE181063 (GPL14951, Illumina) revealed a stratification in cross-platform stability across the three GEP layers (Table 5 and Table S10). L2 showed marginal change (ΔAUC = +0.004), L1 showed intermediate attrition (ΔAUC = −0.089), and L3 showed the largest reduction (ΔAUC = −0.097). This stratification reflects mechanistic differences in how each layer encodes biological information.
L2 platform stability reflects the rank-based nature of ssGSEA enrichment scoring, which preserves within-sample gene ranks independently of probe-level chemistry across array platforms [13,46].
The L1 attrition (ΔAUC = −0.089) reflects platform-specificity of co-expression network topology. Probe-level Pearson correlations underlying the TOM are specific to each array’s hybridisation chemistry; these differ systematically between GPL570 and GPL14951, altering eigengene values for the same underlying biology [47].
External L3 AUC = 0.635 (ΔAUC = −0.097) indicates residual discriminative ability but illustrates a distinct cross-platform failure mode: the training-derived Youden threshold does not transfer reliably under the class imbalance differential (IR = 1.03 vs. IR = 3.79), and threshold-dependent metrics were therefore not evaluated. DS[L1 ⊕ L2 ⊕ L3] (AUC = 0.651) did not exceed LR[L2] alone (AUC = 0.662), suggesting that unweighted DS fusion with lower-quality layers does not recover cross-platform discrimination and may reduce it marginally. Layer-specific weighting dynamics were not directly isolated; these results should be interpreted with caution.
These findings suggest that knowledge-driven gene-set scores are more cross-platform transferable than data-driven gene selection, supporting a multi-layer design in which L2 provides the most stable cross-platform contribution.
The proposed framework does not outperform logistic stacking on external discrimination (ΔAUC = −0.003, p = 0.21) or calibration (Brier 0.229 versus 0.165), and these results support methodological feasibility rather than established clinical utility. This gap is mechanistically consistent with the AUC-proportional discount factors being optimised under internal class balance and not recalibrated for the external class imbalance. The primary contribution lies in per-patient {S,R} ICP prediction sets and per-sample K flags quantifying evidential disagreement—outputs not accessible from a single discriminant score. External ICP coverage (0.946) confirmed this guarantee under cross-platform transfer independently of AUC. Recalibrating discount factors under external class balance is a tractable extension.
4.3. Clinical Utility of DS Conflict K and ICP
Addressing the third objective, the near-zero residual training conflict and strong ICP coverage (Table S9, Panels a–b) indicate that the four evidence layers are largely concordant for most DLBCL cases. The uncertain {S,R} fraction identifies patients for whom the multi-layer evidence is insufficient to support a confident prediction—a signal that may inform supplementary evaluation pending prospective validation. K and the ICP uncertain set represent related but structurally distinct signals (χ2 = 5.1, p = 0.024). K is computed from the BPA masses of the four individual layers prior to Dempster combination, quantifying disagreement among input sources at the evidence-integration stage. ICP uncertainty reflects proximity of the post-fusion BetP(S) to the conformal threshold τ at the output stage, providing a distribution-free coverage guarantee [16]. Although both signals originate from the same expression data, their partial overlap (Table S9 Panel (c)) confirms this structural distinction. Conflict K did not independently predict OS3yr (p = 0.467), confirming its role as an evidential inconsistency signal rather than a prognostic marker.
The distribution-free coverage guarantee of ICP was independently supported in a DLBCL context with 96.6% empirical coverage on an external cohort (GSE117556, n = 789) despite statistically confirmed distribution shift (MMD = 0.0011, permutation p = 0.017) [6]. The marginal coverage property therefore appears robust to distribution shift in genomic settings. Conformal selective prediction frameworks augmented with cost-aware deferral have further formalised the ICP-abstention→clinical-review pipeline [48].
The uncertain fraction (43.5% assigned to {S,R}) is numerically comparable to LymphGen’s unclassified rate (44.6%; [49]), though the tasks differ: LymphGen classifies genetic subtypes whereas the proposed framework predicts OS3yr outcome.
4.4. Limitations and Future Work
Several limitations constrain the generalisability and clinical applicability of the present findings. First, training was restricted to the IPI-complete subset (n = 223 of 277, −19.5%), which may introduce selection bias if IPI missingness is non-random. A sensitivity analysis confirmed that IPI-missing patients (n = 54) did not differ significantly from IPI-complete patients in OS3yr rate (46.6% vs. 50.7%, χ2 p = 0.576) or stage distribution (p = 0.943). ECOG performance status was also comparable (p = 0.486; Table S11), consistent with missing at random. However, the limited sample of IPI-missing patients (n = 54) reduces the statistical power of these comparisons. Multiple imputation across all five IPI components would provide a more robust treatment of missing data and is recommended for future studies with higher IPI-missing rates. Alternatively, use of the IPI total sum score (0–5) as a continuous feature could accommodate partial missingness without requiring complete data across all five binary components. This approach represents a tractable direction for future extension of the proposed framework. The IPI-complete training subset (n = 223) is smaller than multi-cohort DLBCL studies (n = 542–1001; [17,50]). Nevertheless, stratified five-fold nested CV with leakage prevention mitigates overfitting risk. The nested CV AUC (0.808) was consistent across all five outer folds, indicating stable generalisation within the training distribution. Additionally, OS3yr reflects all-cause mortality. In DLBCL patients treated with R-CHOP-based regimens, lymphoma-related mortality accounts for the majority of early deaths, limiting the practical impact of this endpoint limitation. The binary OS3yr endpoint excludes patients censored before 36 months (n = 137, 33.1% of GSE10846). Although the censoring pattern was not differential by clinical subgroup, survival models accounting for censoring—such as Cox regression or random survival forests—would utilise all available observations. Such models are recommended for future extensions. The binary endpoint was adopted here to enable the DS-ICP formulation, which requires categorical class labels. The selection of the L3 stability threshold (40%) and discount formula (F6) from pilot and pooled internal evaluations introduces a degree of model-selection optimism. This optimism is not fully eliminated by the nested CV procedure. A fully pre-registered pipeline specifying all hyperparameters prior to any data observation would provide the strongest guarantee against selection optimism and is recommended for prospective validation.
Second, the BetP outputs showed lower external calibration than logistic stacking. This gap is attributable to the pignistic transformation distributing uncertain mass uniformly rather than according to class prevalence—a known property of DS-based probability estimates under class imbalance (IR = 3.79 externally). The calibration gap reflects prevalence shift between training (OS3yr+ = 50.7%) and external cohorts (OS3yr+ = 79.1%). Beta calibration or isotonic regression on a held-out external subset is recommended for future deployment. Third, external validation was performed on a single Illumina cohort (GSE181063, GPL14951), which, while representing a distinct technology platform and independent patient population, constitutes validation on one external dataset. Replication across additional independent cohorts profiled on RNA-seq or NanoString platforms is required before clinical deployment.
Fourth, L1 WGCNA eigengenes showed substantial platform sensitivity (ΔAUC = −0.089), and their inclusion may contribute to cross-platform attrition in the full proposed framework relative to the more stable L2 component. Platform-agnostic L1 alternatives—such as GSVA-based scores computed from the same module gene lists [51]—may reduce instability without requiring network retraining on platform-specific data. Such alternatives would also extend the framework’s applicability to RNA-seq platforms.
Fifth, the proposed framework does not incorporate somatic mutation, copy number variation, or structural rearrangement evidence. Integration of mutation-derived evidence as an additional DS layer is conceptually tractable, given DS theory’s explicit handling of heterogeneous evidence types [4,50]. Digital pathology features [52] could further enrich the multi-resolution evidence structure.
5. Conclusions
The proposed framework integrates four genomic and clinical evidence layers through AUC-proportional reliability discounting and sequential Dempster–Shafer fusion for uncertainty-aware three-year overall survival prediction in DLBCL. AUC-proportional discounting reduced inter-source conflict by 75% (K- = 0.093→0.023). The proposed framework achieved internal AUC = 0.808 (95% CI [0.750, 0.863]), outperforming unweighted DS fusion (ΔAUC = +0.041, p = 0.037) and logistic stacking (ΔAUC = +0.023, p = 0.0009). The GEP contribution beyond IPI was positive (ΔAUC = +0.040) though borderline significant (p = 0.055). External AUC = 0.791 was statistically comparable to logistic stacking (DeLong p = 0.21). External ICP coverage (0.946) exceeded the nominal 0.90 guarantee, consistent with the distribution-free coverage property under cross-platform transfer to an independent Illumina cohort.
Single-label predictions comprised 56.5% of training-cohort output; 43.5% were flagged as uncertain {S,R}. The external uncertain fraction (52.4%) was consistent with the higher OS3yr-positive prevalence in the external cohort. Following Platt recalibration, decision curve analysis demonstrated positive net benefit over treat-all strategies at threshold probabilities of 0.10–0.25. Net benefit remained below logistic stacking at threshold probabilities of 0.10 and above. The framework’s contribution over logistic stacking lies in uncertainty quantification via conformal prediction sets and K- rather than in decision-analytic superiority. Prospective validation with treatment-decision endpoints, integration of somatic mutation evidence, and recalibration for cohorts with high OS3yr-positive prevalence or IPI missingness represent natural extensions of this work.
Supplementary Materials
The following supporting information can be downloaded at https://www.mdpi.com/article/10.3390/biomedinformatics6040062/s1, Table S1: WGCNA scale-free topology fit by soft-threshold power β; Table S2: Top hub genes per WGCNA co-expression module by kME; Table S3: WGCNA module eigengene correlations with clinical traits; Table S4: Gene membership per ssGSEA-lite signature; Table S5: L3 Gene Selection: Bootstrap Stability Threshold Sensitivity; Table S6: 60 Bootstrap-Stable Prognostic Genes; Table S7: Discount Formula Comparison; Table S8: Computational benchmark; Table S9: Uncertainty Metrics; Table S10: External AUC by Model Scope; Table S11: IPI Missingness Sensitivity Analysis; Figure S1: Calibration and decision curve analysis on the external validation cohort.
Funding
This research budget was allocated by National Science, Research and Innovation Fund (NSRF), and King Mongkut’s University of Technology North Bangkok (Project no. KMUTNB-FF-69-B-59).
Institutional Review Board Statement
Not applicable.
Informed Consent Statement
Not applicable.
Data Availability Statement
The gene expression datasets analysed in this study are publicly available from the NCBI Gene Expression Omnibus (GEO) under accession numbers GSE10846 (training) and GSE181063 (external validation), accessed on 29 May 2026. Further inquiries can be directed to the author.
Conflicts of Interest
The author declares no conflicts of interest.
References
- Li, S.; Young, K.H.; Medeiros, L.J. Diffuse large B-cell lymphoma. Pathology 2018, 50, 74–87. [Google Scholar] [CrossRef] [Scilit] [PubMed]
- Rosenwald, A.; Wright, G.; Chan, W.C.; Connors, J.M.; Campo, E.; Fisher, R.I.; Gascoyne, R.D.; Muller-Hermelink, H.K.; Smeland, E.B.; Giltnane, J.M.; et al. The use of molecular profiling to predict survival after chemotherapy for diffuse large-B-cell lymphoma. N. Engl. J. Med. 2002, 346, 1937–1947. [Google Scholar] [CrossRef] [Scilit] [PubMed]
- Lenz, G.; Wright, G.; Dave, S.S.; Xiao, W.; Powell, J.; Zhao, H.; Xu, W.; Tan, B.; Goldschmidt, N.; Iqbal, J.; et al. Stromal gene signatures in large-B-cell lymphomas. N. Engl. J. Med. 2008, 359, 2313–2323. [Google Scholar] [CrossRef] [Scilit] [PubMed]
- Schmitz, R.; Wright, G.W.; Huang, D.W.; Johnson, C.A.; Phelan, J.D.; Wang, J.Q.; Roulland, S.; Kasbekar, M.; Young, R.M.; Shaffer, A.L.; et al. Genetics and pathogenesis of diffuse large B-cell lymphoma. N. Engl. J. Med. 2018, 378, 1396–1407. [Google Scholar] [CrossRef] [Scilit] [PubMed]
- Wright, G.W.; Huang, D.W.; Phelan, J.D.; Coulibaly, Z.A.; Roulland, S.; Young, R.M.; Wang, J.Q.; Schmitz, R.; Morin, R.D.; Tang, J.; et al. A probabilistic classification tool for genetic subtypes of diffuse large B cell lymphoma with therapeutic implications. Cancer Cell 2020, 37, 551–568.e14. [Google Scholar] [CrossRef] [Scilit] [PubMed]
- Papangelou, C.; Kyriakidis, K.; Natsiavas, P.; Chouvarda, I.; Malousi, A. Reliable machine learning models in genomic medicine using conformal prediction. Front. Bioinform. 2025, 5, 1507448. [Google Scholar] [CrossRef] [Scilit] [PubMed]
- Xiao, J.; Wang, X.; Bai, H. Clinical features and prognostic impact of coexpression modules constructed by WGCNA for diffuse large B-cell lymphoma. BioMed Res. Int. 2020, 2020, 7947208. [Google Scholar] [CrossRef] [Scilit] [PubMed]
- Cui, Y.; Leng, C. A glycolysis-related gene signatures in diffuse large B-cell lymphoma predicts prognosis and tumor immune microenvironment. Front. Cell Dev. Biol. 2023, 11, 1070777. [Google Scholar] [CrossRef] [Scilit] [PubMed]
- Dempster, A.P. Upper and lower probabilities induced by a multivalued mapping. Ann. Math. Stat. 1967, 38, 325–339. [Google Scholar] [CrossRef] [Scilit]
- Shafer, G. A Mathematical Theory of Evidence; Princeton University Press: Princeton, NJ, USA, 1976. [Google Scholar] [CrossRef] [Scilit]
- Luo, H.; Huang, J.; Ju, H.; Zhou, T.; Ding, W. Multimodal multi-instance evidence fusion neural networks for cancer survival prediction. Sci. Rep. 2025, 15, 10470. [Google Scholar] [CrossRef] [Scilit] [PubMed]
- Langfelder, P.; Horvath, S. WGCNA: An R package for weighted correlation network analysis. BMC Bioinform. 2008, 9, 559. [Google Scholar] [CrossRef] [Scilit] [PubMed]
- Barbie, D.A.; Tamayo, P.; Boehm, J.S.; Kim, S.Y.; Moody, S.E.; Dunn, I.F.; Schinzel, A.C.; Sandy, P.; Meylan, E.; Scholl, C.; et al. Systematic RNA interference reveals that oncogenic KRAS-driven cancers require TBK1. Nature 2009, 462, 108–112. [Google Scholar] [CrossRef] [Scilit] [PubMed]
- International Non-Hodgkin’s Lymphoma Prognostic Factors Project. A predictive model for aggressive non-Hodgkin’s lymphoma. N. Engl. J. Med. 1993, 329, 987–994. [CrossRef] [Scilit] [PubMed]
- Papadopoulos, H.; Proedrou, K.; Vovk, V.; Gammerman, A. Inductive confidence machines for regression. In Proceedings of the European Conference on Machine Learning, Helsinki, Finland, 19–23 August 2002; Springer: Berlin/Heidelberg, Germany, 2002; pp. 345–356. [Google Scholar] [CrossRef] [Scilit] [PubMed]
- Vovk, V.; Gammerman, A.; Shafer, G. Algorithmic Learning in a Random World; Springer: New York, NY, USA, 2005. [Google Scholar] [CrossRef] [Scilit]
- Orgueira, A.M.; Arias, J.Á.D.; López, M.C.; Raíndo, A.P.; Rodríguez, B.A.; Santos, C.A.; Vence, N.A.; López, Á.B.; Blanco, A.A.; Pérez, L.B.; et al. Improved personalized survival prediction of patients with diffuse large B-cell lymphoma using gene expression profiling. BMC Cancer 2020, 20, 1017. [Google Scholar] [CrossRef] [Scilit] [PubMed]
- Zhao, S.; Bai, N.; Cui, J.; Xiang, R.; Li, N. Prediction of survival of diffuse large B-cell lymphoma patients via the expression of three inflammatory genes. Cancer Med. 2016, 5, 1950–1961. [Google Scholar] [CrossRef] [Scilit] [PubMed]
- Zhou, H.; Zheng, C.; Huang, D.S. A prognostic gene model of immune cell infiltration in diffuse large B-cell lymphoma. PeerJ 2020, 8, e9658. [Google Scholar] [CrossRef] [Scilit] [PubMed]
- Hu, J.; Xu, J.; Yu, M.; Gao, Y.; Liu, R.; Zhou, H.; Zhang, W. An integrated prognosis model of pharmacogenomic gene signature and clinical information for diffuse large B-cell lymphoma patients following CHOP-like chemotherapy. J. Transl. Med. 2020, 18, 144. [Google Scholar] [CrossRef] [Scilit] [PubMed]
- Gao, Q.; Li, Z.; Meng, L.; Ma, J.; Xi, Y.; Wang, T. Transcriptome profiling reveals an integrated mRNA–lncRNA signature with predictive value for long-term survival in diffuse large B-cell lymphoma. Aging 2020, 12, 23275–23295. [Google Scholar] [CrossRef] [Scilit] [PubMed]
- Carreras, J.; Hiraiwa, S.; Kikuti, Y.Y.; Miyaoka, M.; Tomita, S.; Ikoma, H.; Ito, A.; Kondo, Y.; Roncador, G.; Garcia, J.F.; et al. Artificial neural networks predicted the overall survival and molecular subtypes of diffuse large B-cell lymphoma using a pancancer immune-oncology panel. Cancers 2021, 13, 6384. [Google Scholar] [CrossRef] [Scilit] [PubMed]
- Wang, W.; Xu, S.W.; Teng, Y.; Zhu, M.; Guo, Q.Y.; Wang, Y.W.; Mao, X.-L.; Li, S.-W.; Luo, W.-D. The dark side of pyroptosis of diffuse large B-cell lymphoma in B-cell non-Hodgkin lymphoma: Mediating the specific inflammatory microenvironment. Front. Cell Dev. Biol. 2021, 9, 779123. [Google Scholar] [CrossRef] [Scilit] [PubMed]
- He, J.; Chen, Z.; Xue, Q.; Sun, P.; Wang, Y.; Zhu, C.; Shi, W. Identification of molecular subtypes and a novel prognostic model of diffuse large B-cell lymphoma based on a metabolism-associated gene signature. J. Transl. Med. 2022, 20, 186. [Google Scholar] [CrossRef] [Scilit] [PubMed]
- Autio, M.; Leivonen, S.K.; Brück, O.; Karjalainen-Lindsberg, M.L.; Pellinen, T.; Leppä, S. Clinical impact of immune cells and their spatial interactions in diffuse large B-cell lymphoma microenvironment. Clin. Cancer Res. 2022, 28, 781–792. [Google Scholar] [CrossRef] [Scilit] [PubMed]
- Carreras, J.; Roncador, G.; Hamoudi, R. Artificial intelligence predicted overall survival and classified mature B-cell neoplasms based on immuno-oncology and immune checkpoint panels. Cancers 2022, 14, 5318. [Google Scholar] [CrossRef] [Scilit] [PubMed]
- Yan, J.; Yuan, W.; Zhang, J.; Li, L.; Zhang, L.; Zhang, X.; Zhang, M. Identification and validation of a prognostic prediction model in diffuse large B-cell lymphoma. Front. Endocrinol. 2022, 13, 846357. [Google Scholar] [CrossRef] [Scilit] [PubMed]
- Viswanathan, A.; Kundal, K.; Sengupta, A.; Kumar, A.; Kumar, K.V.; Holmes, A.B.; Kumar, R. Deep learning-based classifier of diffuse large B-cell lymphoma cell-of-origin with clinical outcome. Brief. Funct. Genom. 2023, 22, 42–48. [Google Scholar] [CrossRef] [Scilit] [PubMed]
- Tan, J.; Xie, J.; Huang, J.; Deng, W.; Chai, H.; Yang, Y. An interpretable survival model for diffuse large B-cell lymphoma patients using a biologically informed visible neural network. Comput. Struct. Biotechnol. J. 2024, 24, 523–532. [Google Scholar] [CrossRef] [Scilit] [PubMed]
- Xu, M.; Ruan, M.; Zhu, W.; Xu, J.; Lin, L.; Li, W.; Zhu, W. Integrative analysis of a novel immunogenic PANoptosis related gene signature in diffuse large B-cell lymphoma for prognostication and therapeutic decision-making. Sci. Rep. 2024, 14, 30370. [Google Scholar] [CrossRef] [Scilit] [PubMed]
- Zaccaria, G.M.; Altini, N.; Mezzolla, G.; Vegliante, M.C.; Stranieri, M.; Pappagallo, S.A.; Ciavarella, S.; Guarini, A.; Bevilacqua, V. SurvIAE: Survival prediction with interpretable autoencoders from diffuse large B-cells lymphoma gene expression data. Comput. Methods Programs Biomed. 2024, 244, 107966. [Google Scholar] [CrossRef] [Scilit] [PubMed]
- Wenzl, K.; Stokes, M.E.; Novak, J.P.; Bock, A.M.; Khan, S.; Hopper, M.A.; Krull, J.E.; Dropik, A.R.; Walker, J.S.; Sarangi, V.; et al. Multiomic analysis identifies a high-risk signature that predicts early clinical failure in DLBCL. Blood Cancer J. 2024, 14, 100. [Google Scholar] [CrossRef] [Scilit] [PubMed]
- Lin, J.; Lv, W.; Cai, H.; Nie, Q.; Zeng, J.; Lin, K.; Lin, Q.; Wen, X.; Li, Y.; Su, R. Machine learning based on clinical and gene expression data assists in survival prediction and treatment optimization for diffuse large B-cell lymphoma patients. Ann. Hematol. 2026, 105, 131. [Google Scholar] [CrossRef] [Scilit] [PubMed]
- Edgar, R.; Domrachev, M.; Lash, A.E. Gene expression omnibus: NCBI gene expression and hybridization array data repository. Nucleic Acids Res. 2002, 30, 207–210. [Google Scholar] [CrossRef] [Scilit] [PubMed]
- Zhang, B.; Horvath, S. A general framework for weighted gene co-expression network analysis. Stat. Appl. Genet. Mol. Biol. 2005, 4, 17. [Google Scholar] [CrossRef] [Scilit] [PubMed]
- Alizadeh, A.A.; Eisen, M.B.; Davis, R.E.; Ma, C.; Lossos, I.S.; Rosenwald, A.; Boldrick, J.C.; Sabet, H.; Tran, T.; Yu, X.; et al. Distinct types of diffuse large B-cell lymphoma identified by gene expression profiling. Nature 2000, 403, 503–511. [Google Scholar] [CrossRef] [Scilit] [PubMed]
- Liberzon, A.; Birger, C.; Thorvaldsdóttir, H.; Ghandi, M.; Mesirov, J.P.; Tamayo, P. The molecular signatures database hallmark gene set collection. Cell Syst. 2015, 1, 417–425. [Google Scholar] [CrossRef] [Scilit] [PubMed]
- Mantel, N. Evaluation of survival data and two new rank order statistics arising in its consideration. Cancer Chemother. Rep. 1966, 50, 163–170. [Google Scholar] [PubMed]
- Smets, P.; Kennes, R. The transferable belief model. Artif. Intell. 1994, 66, 191–234. [Google Scholar] [CrossRef] [Scilit]
- DeLong, E.R.; DeLong, D.M.; Clarke-Pearson, D.L. Comparing the areas under two or more correlated receiver operating characteristic curves: A nonparametric approach. Biometrics 1988, 44, 837–845. [Google Scholar] [CrossRef] [Scilit] [PubMed]
- Benjamini, Y.; Hochberg, Y. Controlling the false discovery rate: A practical and powerful approach to multiple testing. J. R. Stat. Soc. Ser. B 1995, 57, 289–300. [Google Scholar] [CrossRef] [Scilit]
- Pedregosa, F.; Varoquaux, G.; Gramfort, A.; Michel, V.; Thirion, B.; Grisel, O.; Blondel, M.; Prettenhofer, P.; Weiss, R.; Dubourg, V.; et al. Scikit-learn: Machine learning in Python. J. Mach. Learn. Res. 2011, 12, 2825–2830. [Google Scholar]
- Dave, S.S.; Wright, G.; Tan, B.; Rosenwald, A.; Gascoyne, R.D.; Chan, W.C.; Fisher, R.I.; Braziel, R.M.; Rimsza, L.M.; Grogan, T.M.; et al. Prediction of survival in follicular lymphoma based on molecular features of tumor-infiltrating immune cells. N. Engl. J. Med. 2004, 351, 2159–2169. [Google Scholar] [CrossRef] [Scilit] [PubMed]
- Merdan, S.; Subramanian, K.; Ayer, T.; Van Weyenbergh, J.; Chang, A.; Koff, J.L.; Flowers, C. Gene expression profiling-based risk prediction and profiles of immune infiltration in diffuse large B-cell lymphoma. Blood Cancer J. 2021, 11, 2. [Google Scholar] [CrossRef] [Scilit] [PubMed]
- Wang, H.; Lin, K.; Zhang, Q.; Shi, J.; Song, X.; Wu, J.; Zhao, C.; He, K. HyperTMO: A trusted multi-omics integration framework based on hypergraph convolutional network for patient classification. Bioinformatics 2024, 40, btae159. [Google Scholar] [CrossRef] [Scilit] [PubMed]
- Lin, S.H.; Beane, L.; Chasse, D.; Zhu, K.W.; Mathey-Prevot, B.; Chang, J.T. Cross-platform prediction of gene expression signatures. PLoS ONE 2013, 8, e79228. [Google Scholar] [CrossRef] [Scilit] [PubMed]
- Ramasamy, A.; Mondry, A.; Holmes, C.C.; Altman, D.G. Key issues in conducting a meta-analysis of gene expression microarray datasets. PLoS Med. 2008, 5, e184. [Google Scholar] [CrossRef] [Scilit] [PubMed]
- Kwon, H.; Kim, D.J. Conformal selective prediction with cost aware deferral for safe clinical triage under distribution shift. Sci. Rep. 2026, 16, 10016. [Google Scholar] [CrossRef] [Scilit] [PubMed]
- Chapuy, B.; Wood, T.; Stewart, C.; Dunford, A.; Wienand, K.; Khan, S.J.; Serin, N.; Wang, M.; Calabretta, E.; Shimono, J.; et al. DLB class: A probabilistic molecular classifier to guide clinical investigation and practice in diffuse large B-cell lymphoma. Blood 2025, 145, 2041–2055. [Google Scholar] [CrossRef] [Scilit] [PubMed]
- Reddy, A.; Zhang, J.; Davis, N.S.; Moffitt, A.B.; Love, C.L.; Waldrop, A.; Leppä, S.; Pasanen, A.; Meriranta, L.; Karjalainen-Lindsberg, M.-L.; et al. Genetic and functional drivers of diffuse large B cell lymphoma. Cell 2017, 171, 481–494. [Google Scholar] [CrossRef] [Scilit] [PubMed]
- Hänzelmann, S.; Castelo, R.; Guinney, J. GSVA: Gene set variation analysis for microarray and RNA-seq data. BMC Bioinform. 2013, 14, 7. [Google Scholar] [CrossRef] [Scilit] [PubMed]
- Lee, J.H.; Song, G.Y.; Lee, J.; Kang, S.R.; Moon, K.M.; Choi, Y.D.; Shen, J.; Noh, M.; Yang, D. Prediction of immunochemotherapy response for diffuse large B-cell lymphoma using artificial intelligence digital pathology. J. Pathol. Clin. Res. 2024, 10, e12370. [Google Scholar] [CrossRef] [Scilit] [PubMed]

Disclaimer/Publisher’s Note: The statements, opinions and data contained in all publications are solely those of the individual author(s) and contributor(s) and not of MDPI and/or the editor(s). MDPI and/or the editor(s) disclaim responsibility for any injury to people or property resulting from any ideas, methods, instructions or products referred to in the content. |
© 2026 by the author. Licensee MDPI, Basel, Switzerland. This article is an open access article distributed under the terms and conditions of the Creative Commons Attribution (CC BY) license.