


Abstract
Digital health observatories require predictive frameworks that transform administrative health data into reliable territorial risk indicators. We developed a biomedical informatics framework for machine-learning-based epidemiological risk stratification in the Colombian Orinoquía, with explicit attention to data-leakage prevention, validated population denominators, and unit-of-analysis discipline. From 354,088 morbidity records (2018–2023; Arauca, Casanare, Meta, Vichada) we derived 20,212 independent strata (municipality × year × diagnostic group × sex × age category × health component) and computed morbidity rates using official population projections from the Colombian National Administrative Department of Statistics (DANE), correcting a denominator instability present in the original extract. After excluding leakage-generating variables, Gradient Boosting, Random Forest, and a one-hot Logistic Regression baseline were evaluated through temporal validation, group-aware cross-validation, leave-one-department-out validation, and a geographic ablation experiment. Under leakage-controlled, stratum-level conditions, Gradient Boosting achieved an area under the receiver operating characteristic curve (AUC-ROC) of 0.913 [95% confidence interval (CI): 0.903–0.923] (Brier: 0.106). SHapley Additive exPlanations (SHAP) analysis identified diagnostic group and age category as the dominant predictors, supported by broadly stable performance without geographic identifiers (AUC 0.871) and consistent cross-department transferability (0.807–0.889); a residual municipality-level clustering effect is reported transparently. Validated denominators reversed the apparent territorial gradient, with the most remote department exhibiting the lowest documented morbidity, consistent with under-registration.
1. Introduction
Population aging and emerging health threats constitute critical challenges in global public health, driven by transformations in demographic structure and changes in social, economic, and environmental conditions [1,2]. Digital health observatories have emerged as platforms for territorial intelligence, integrating epidemiological information, social indicators, and contextual factors to support evidence-based decision-making [3,4]. However, most current implementations remain limited to descriptive analysis, leaving a methodological gap in predictive capacity.
Biomedical informatics integrates computational methods, data management, and machine learning to support clinical and public-health decision-making [5,6]. Ensemble methods such as Random Forest and Gradient Boosting have demonstrated strong performance in biomedical prediction tasks [7,8]. A critical but underreported threat in health prediction models is data leakage—the inadvertent inclusion of information mathematically linked to the prediction target [9,10,11]. In administrative health datasets, event counts and population denominators are frequently used as predictors while simultaneously constituting the mathematical components of rate-based outcomes, creating circular predictions with artificially inflated metrics (AUC > 0.99) [12]. Recent empirical work has shown that such leakage systematically inflates reported performance across many studies and scientific fields [13,14,15,16], and reporting guidelines such as TRIPOD + AI now explicitly require documentation of leakage-prevention strategies [17].
Beyond leakage, two further methodological considerations are essential for honest surveillance. First, the unit of analysis must be respected: when an outcome is defined at an aggregated level, individual records sharing that outcome are not independent, and analyzing them as such induces pseudo-replication and optimistic estimates [18,19]. Second, validation must extend beyond random train–test splits. Temporal validation—training on historical data and testing on future periods—provides a more realistic assessment of operational deployment [20], while geographic validation through leave-one-region-out evaluation tests transferability across territories with heterogeneous healthcare infrastructure [5,18]. Equally, morbidity rates must rest on validated population denominators, since rates computed over very small denominators are inherently unstable and can dominate percentile-based outcomes [19].
In the Colombian Orinoquía—characterized by fragmented health information systems, limited computational infrastructure, and extreme territorial heterogeneity—these considerations are particularly important. The region comprises four departments (Arauca, Casanare, Meta, Vichada) with populations ranging from approximately 100,000 to over one million inhabitants [21], and markedly different healthcare-access profiles that directly affect data quality [22]. Applied machine learning on regional surveillance data has been demonstrated in Colombia, for example for sub-national dengue burden estimation using SIVIGILA records [23], underscoring both the opportunity and the data-quality challenges of this setting.
This study presents a biomedical informatics framework for territorial risk stratification that explicitly incorporates leakage prevention, stratum-level inference, validated DANE denominators, temporal and geographic validation, calibration assessment, and SHAP-based interpretability, developed within the Observatory of Mental Health, Family, and Social Coexistence of the Orinoquía, funded by Minciencias.
Principal contributions: (1) a leakage-controlled, stratum-level framework in which documented (service-utilization) morbidity risk is predicted from structural and categorical features after correcting a denominator instability, achieving strong and realistic discrimination (Gradient Boosting AUC-ROC 0.913); (2) SHAP and ablation analyses suggest that diagnostic group and age explain a substantial share of risk classification, while residual geographic dependence remains, with performance largely preserved when geographic identifiers are removed; (3) transparent quantification of residual municipality-level clustering through group-aware cross-validation; and (4) a replicable methodological template for honest, interpretable machine learning in biomedical-informatics surveillance, including the correction of a denominator-induced rate instability.
2. Materials and Methods
2.1. Data Sources and Integration
The study integrated two official Colombian data sources. Morbidity event records for 2018–2023 in the four Orinoquía departments (Arauca, Casanare, Meta, Vichada) were obtained from the Integrated Social Protection Information System (SISPRO) and the Single Affiliates Registry (RUAF) (354,088 records, 12 variables, no missing values). Population denominators were obtained from the official municipal population projections of the National Administrative Department of Statistics (DANE) by area, sex, and single year of age (Proyecciones de Población y Estudios Demográficos, PPED, 2018–2042; post-census 2018), restricted to the total area and the study departments. Each event corresponds to a health-service registration in the Individual Health Service Delivery Records (RIPS) of SISPRO, so the numerator reflects documented health-service attentions rather than unique incident cases; the resulting indicator is therefore a documented-morbidity (service-utilization) rate. Linking these events to an independent, authoritative population source—rather than to denominators embedded in the morbidity extract—was a deliberate decision to ensure that rate computation rests on validated demographic estimates. This denominator correction was undertaken to restore an epidemiologically valid rate construction—independently of, and prior to, any model evaluation—and not to improve predictive performance. Table 1 presents the variable dictionary with leakage classification.
Table 1.
Variable dictionary with data-leakage classification (denominator corrected to DANE). ML, machine learning.
2.2. Unit of Analysis and Stratum-Level Construction
Because the outcome is defined at an aggregated level, individual records do not constitute independent analytical units: 354,088 records collapse to 20,212 unique strata (municipality × year × diagnostic group × sex × age category × health component), an expansion factor of 17.5. All analyses were therefore conducted at the stratum level, with one row per stratum. For each stratum the numerator was the total number of morbidity events, and the denominator was the corresponding demographic population from DANE for the cell municipality × year × sex × age category. Age was mapped to six categories using cut-points recovered to exactly reproduce the original category distribution: Early childhood (0–5), Childhood (6–11), Adolescence (12–17), Early adulthood (18–40), Middle adulthood (41–65), and Older adult (66+). The morbidity rate of each stratum was computed as events divided by population (per 100,000).
2.3. Data Leakage Prevention and Target Definition
The binary high-risk target was defined as strata in the upper quartile (75th percentile) of the morbidity-rate distribution, with the threshold computed on the training period only (2018–2021). Variables mathematically linked to the rate were excluded to prevent circular prediction; the leakage-controlled feature set comprised six categorical variables (department, municipality, diagnostic group, sex, age category, health component) and one temporal variable (year). A leakage audit confirmed that including rate-component variables yielded AUC-ROC > 0.999 across all algorithms (Logistic Regression = 1.000), a clear indicator of mathematical circularity. The 75th-percentile cut-point was adopted as an operational surveillance criterion, isolating the upper quartile of territorial-demographic burden for alert prioritization—a proportion consistent with the limited capacity of departmental health authorities in the Orinoquía to act on simultaneous high-risk signals. Targeting the upper tail of a burden distribution is, moreover, a standard principle of public-health surveillance, in which hotspot prioritization concentrates limited resources on the areas of greatest relative need; the quartile boundary operationalizes this principle at an alert volume compatible with departmental capacity. We emphasize that this is a pragmatic operational criterion for alert prioritization, not a clinically derived or nationally codified epidemiological standard. Robustness was confirmed by a sensitivity analysis across the 50th–90th percentiles (Section 3.4).
2.4. Preprocessing and Feature Encoding
Tree-based models (Random Forest, Gradient Boosting) used label encoding, which is appropriate for categorical splits. The Logistic Regression baseline used one-hot encoding fitted within the modeling pipeline, avoiding artificial ordinal relationships on nominal variables such as municipality and diagnostic group. Feature engineering was intentionally minimal to preserve interpretability and avoid implicit leakage. Although municipality hierarchically contains department, both were retained to capture fine-grained and broader structural patterns; this nested administrative structure is not mathematical leakage. Because the feature set mixes low-cardinality variables (e.g., sex, department) with a high-cardinality one (municipality, 59 levels), and because impurity-based trees are known to favor high-cardinality predictors and can thereby distort split selection and importance rankings [24], we do not rely on impurity (Gini) importance for interpretation: feature attribution is based on SHAP (Section 3.7), and the influence of municipality on predictive performance—not merely on importance ranking—is tested directly by the geographic ablation and quantified by group-aware (GroupKFold) validation (Section 3.6 and Section 3.7).
2.5. Machine Learning Algorithms and Hyperparameter Optimization
Three algorithms spanning the accuracy–interpretability spectrum were trained: Random Forest, Gradient Boosting, and Logistic Regression. The Logistic Regression pipeline used one-hot encoding with balanced class weights, and its decision threshold was selected on the validation period (2022; F1-optimal)—not on the test period—rather than fixed at 0.5, providing a fair linear comparator. Tree-based hyperparameters were tuned by randomized search with cross-validation on the training set; all experiments used random_state = 42 for reproducibility (Table 2).
Table 2.
Selected hyperparameters and stratified 5-fold CV AUC (stratum level).
2.6. Validation Strategy
Four complementary strategies were applied at the stratum level: (1) temporal validation (train 2018–2021; validation 2022; test 2023); (2) five-fold cross-validation using both StratifiedKFold and GroupKFold grouped by municipality, to quantify geographic clustering; (3) leave-one-department-out geographic validation; and (4) a geographic ablation in which the principal model was retrained under three feature configurations—full, without municipality, and without any geographic identifier—to assess the extent to which performance depends on geographic identifiers versus non-geographic clinical-epidemiological stratum descriptors.
2.7. Performance Metrics, Calibration, and Interpretability
Discrimination and probabilistic performance (AUC-ROC, average precision, Brier score) were reported with 95% bootstrap confidence intervals (1000 iterations). Threshold-dependent metrics are reported at the prespecified threshold and interpreted descriptively. Calibration was assessed via reliability curves and Brier scores [25]. SHAP values [26] were computed for the best model, complemented by Random Forest Gini importances. The platform was implemented in Python v3.10 (Python Software Foundation, Wilmington, DE, USA) with scikit-learn v1.3.0, pandas v2.0.3, NumPy v1.24.3, SHAP v0.42.1, and a Streamlit v1.28.0 interface integrating two levels: a City Model (territorial risk classification) and an exploratory Territorial Stratum Risk Simulator that maps a demographic–territorial profile to the risk of its corresponding stratum (territorial-contextual profiling at the stratum level, not an individually validated prediction).
2.8. Risk-of-Bias Self-Assessment
To make the assessment of methodological quality explicit, the study design and analysis were appraised against the Prediction model Risk Of Bias Assessment Tool (PROBAST) [27] and its recent update for regression- and artificial-intelligence-based prediction models, PROBAST + AI [28], across the four PROBAST domains—participants, predictors, outcome, and analysis. The corresponding domain-level judgments are reported in the Discussion (Section 4).
3. Results
3.1. Territorial Distribution of Morbidity
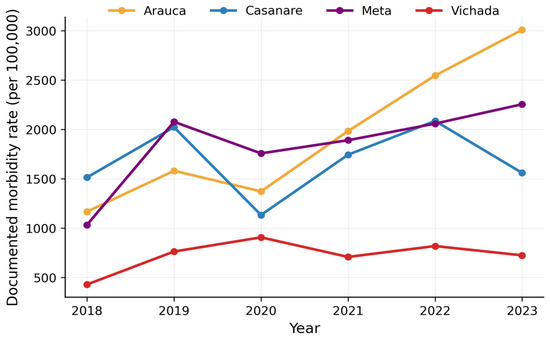
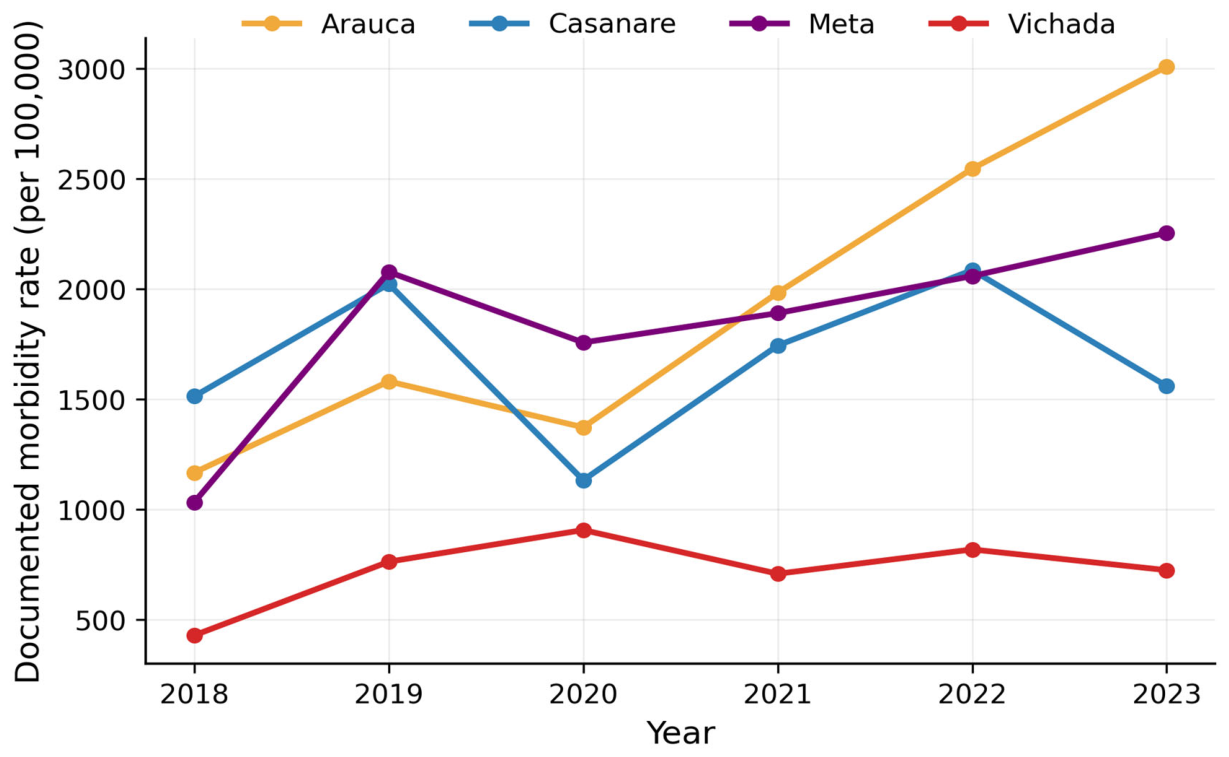
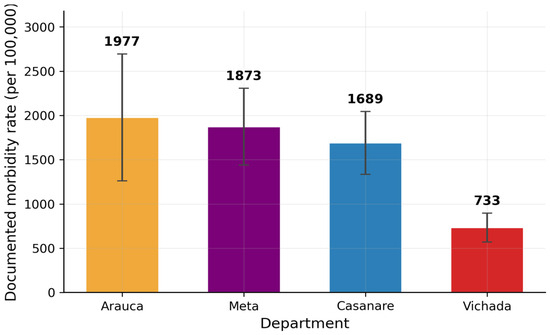
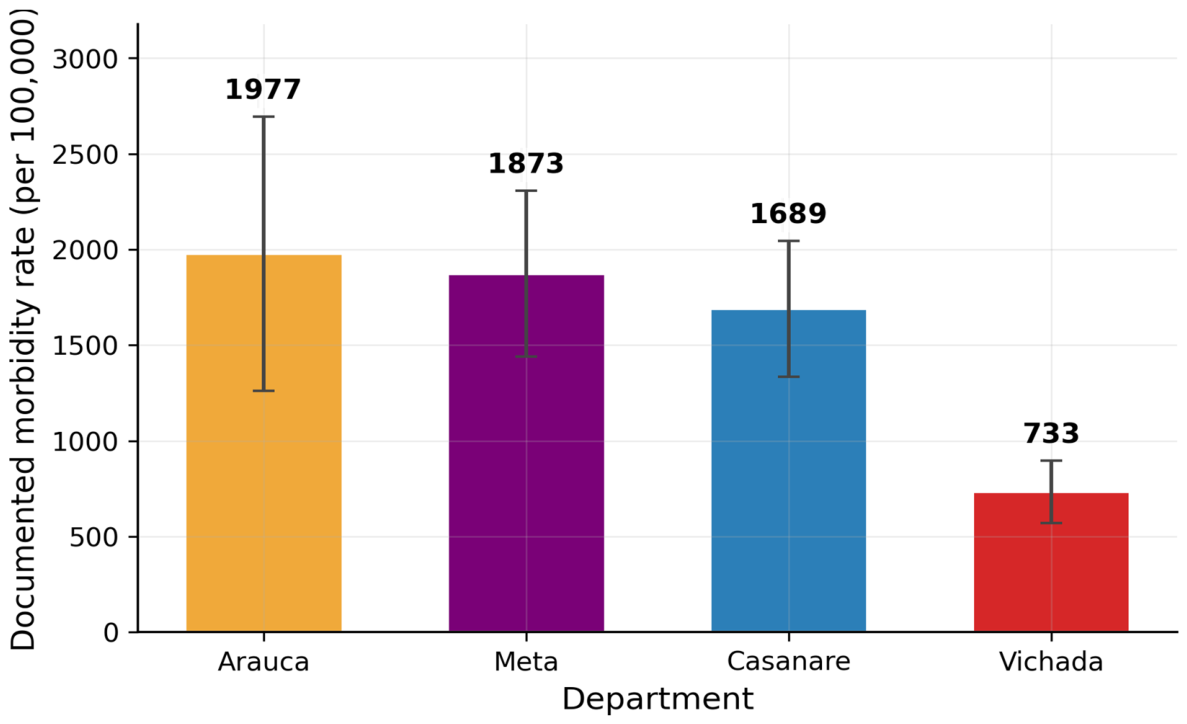
Using validated DANE denominators, documented morbidity rates by department differed markedly from a naïve average of record-level rates. Under correct, population-weighted aggregation the most remote and least-served department (Vichada) exhibits the lowest documented morbidity—not the highest—consistent with reduced healthcare access, diagnostic capacity, and administrative registration, whereas better-served departments document higher rates (Figure 1 and Figure 2). This corrects the original territorial narrative, which was an artifact of small-denominator instability.
Figure 1.
Temporal trend of documented morbidity rates by department (2018–2023), using DANE total-population denominators.
Figure 2.
Territorial distribution of documented morbidity rates by department (DANE-based). Vichada is lowest, consistent with under-registration in remote, underserved areas.
3.2. Demographic Patterns
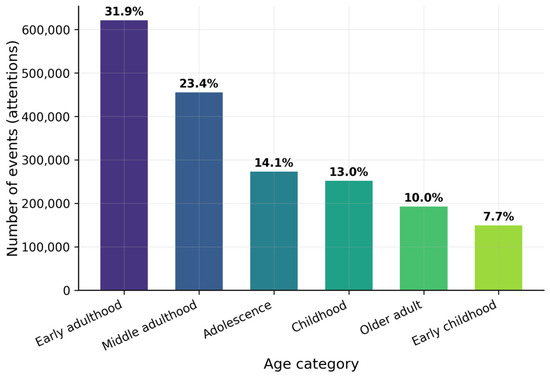
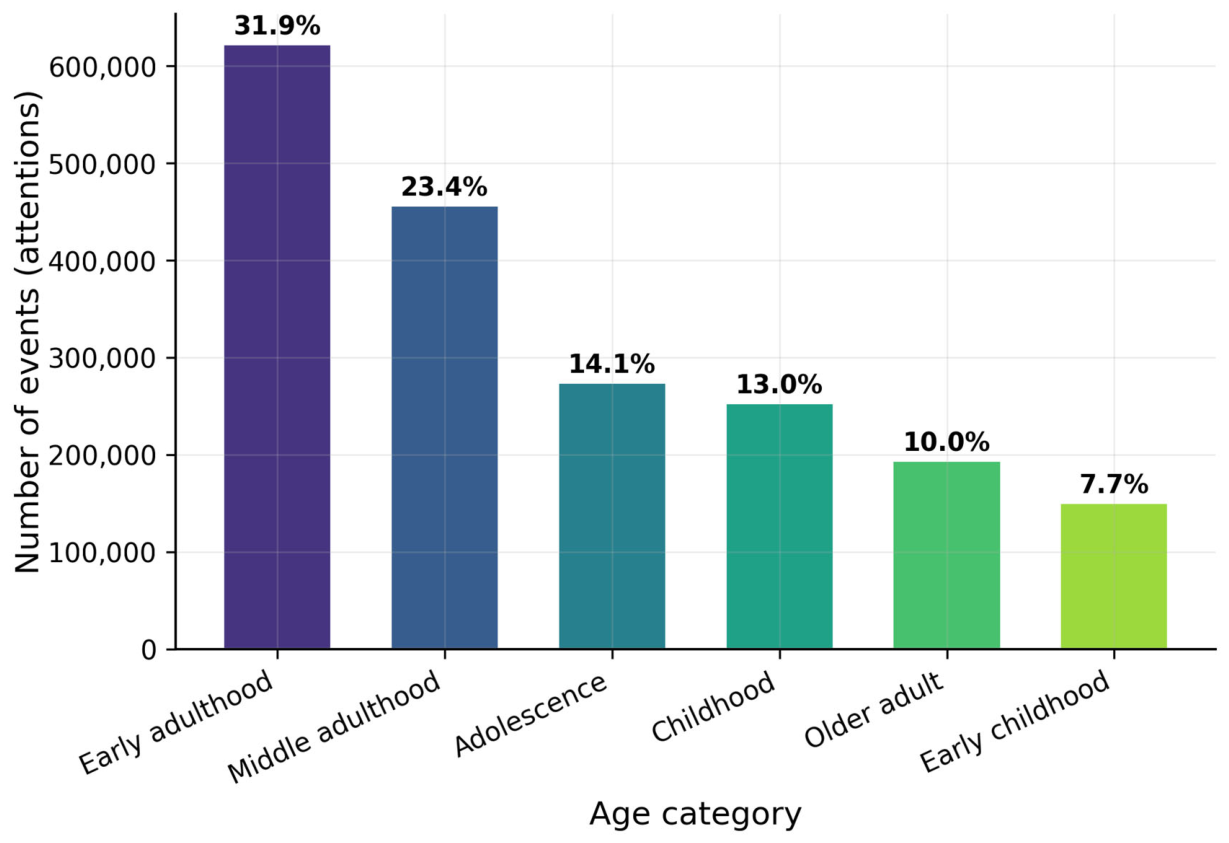
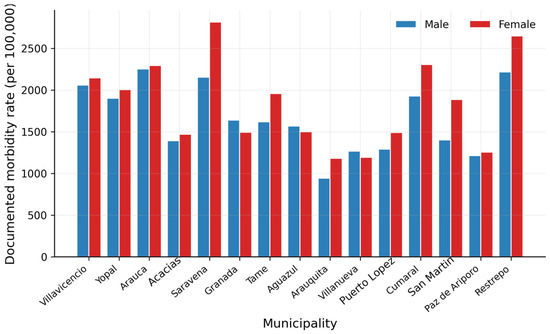
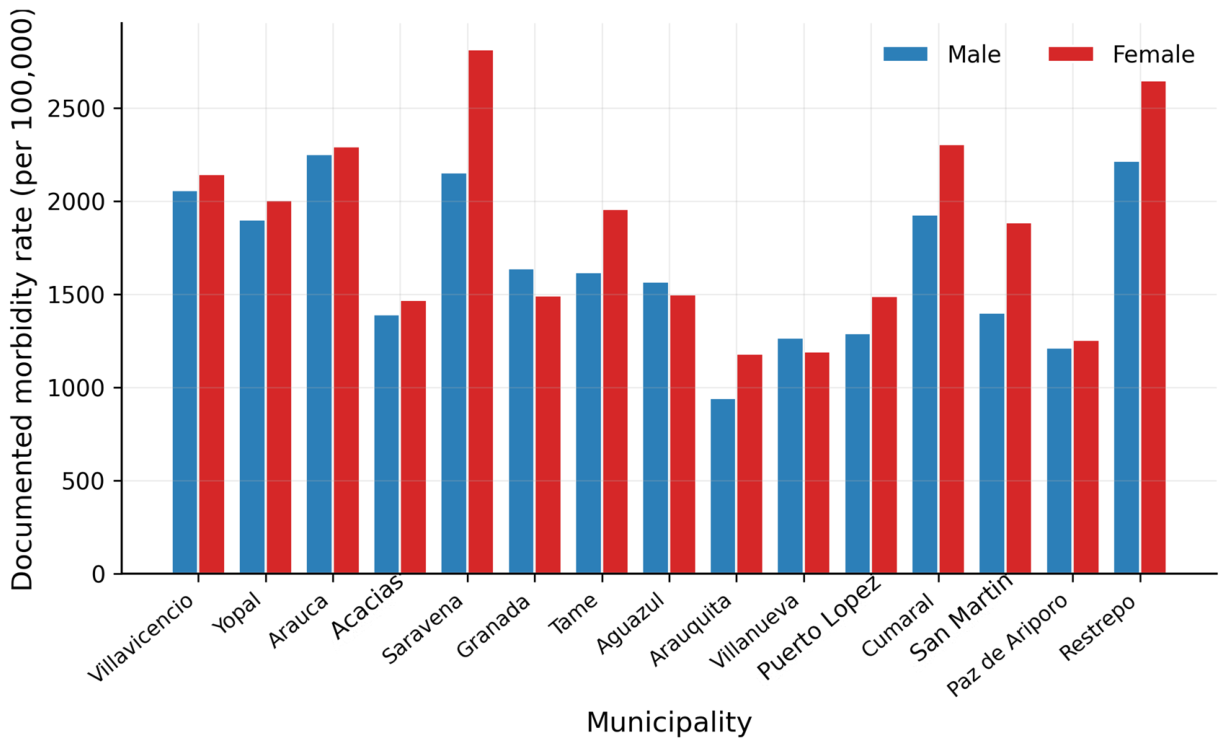
Events concentrate in the working-age population. Early adulthood and middle adulthood comprise the largest shares, and among the 13 diagnostic groups, neurotic and stress-related disorders, mood disorders, and childhood/adolescence disorders account for the highest volumes (Figure 3 and Figure 4).
Figure 3.
Distribution of events by age category.
Figure 4.
Documented morbidity rates by municipality and sex (top 15 municipalities by total events).
3.3. Unit of Analysis: Record-Level Versus Stratum-Level
To respond to the reviewers’ request to determine whether performance was driven by row duplication, Table 3 decomposes the two changes introduced in this revision—the corrected DANE denominator and the collapse to the correct analytical unit—by holding each constant in turn. Two findings emerge. First, the improvement relative to the original submission is driven by the corrected denominator (record-level Gradient Boosting AUC-ROC 0.815 → 0.932). Second, collapsing to independent strata, holding the corrected target constant, modestly reduces discrimination (record → stratum: Gradient Boosting 0.932 → 0.913; Random Forest 0.911 → 0.893; Logistic Regression 0.859 → 0.838). This ~0.02 reduction is the expected consequence of removing pseudo-replication, confirming that row expansion modestly inflates record-level metrics. Crucially, at the correct stratum unit performance remains high (Gradient Boosting AUC-ROC 0.913), which is consistent with the presence of predictive signal beyond row duplication. Although Table 3 decomposes the two modifications sequentially, the revised analysis should be interpreted as a single, fully corrected analytical pipeline rather than as an attempt to attribute all improvements to any individual modification.
Table 3.
Effect decomposition (temporal validation, test 2023). (a)→(b) isolates the denominator correction; (b)→(c) isolates the unit-of-analysis collapse. The GB and RF rows provide a clean isolation; the LR row in (a) used label encoding whereas (b) and (c) use one-hot encoding. GB, Gradient Boosting; RF, Random Forest; LR, Logistic Regression.
3.4. Predictive Performance—Temporal Validation
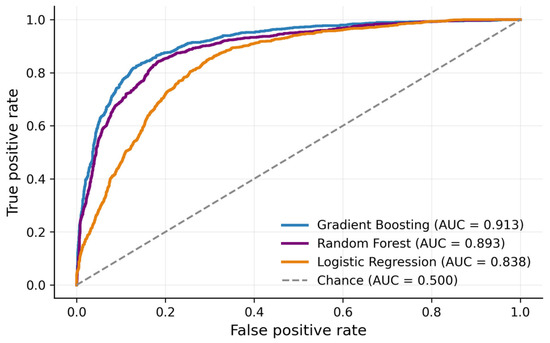
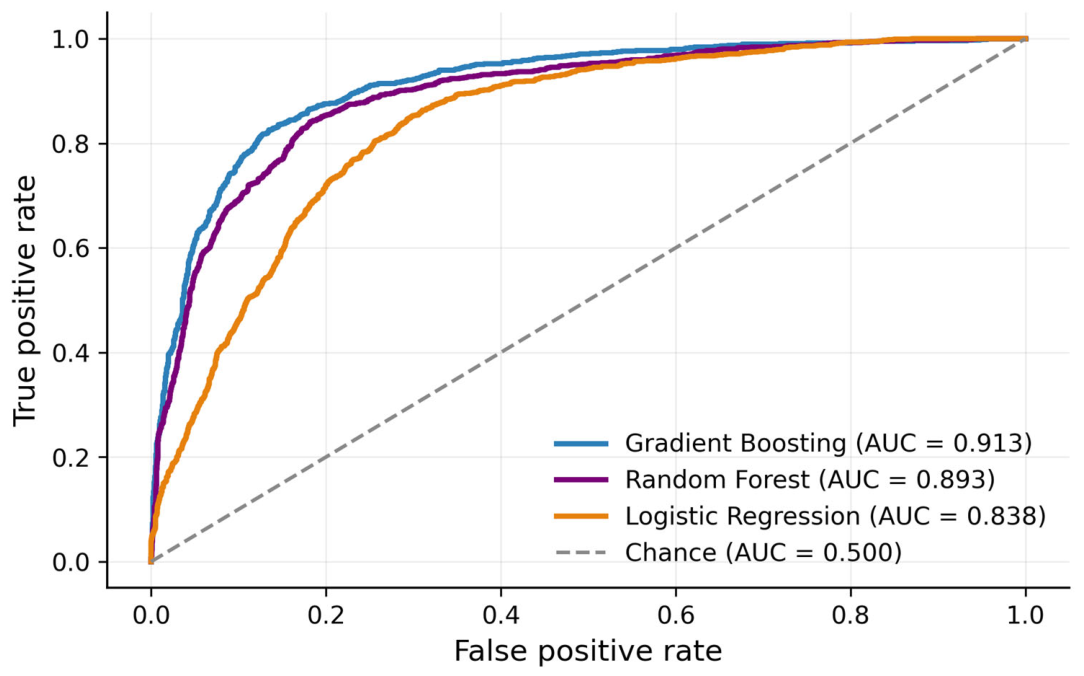
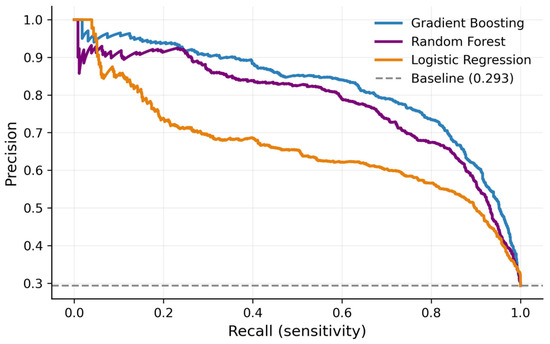
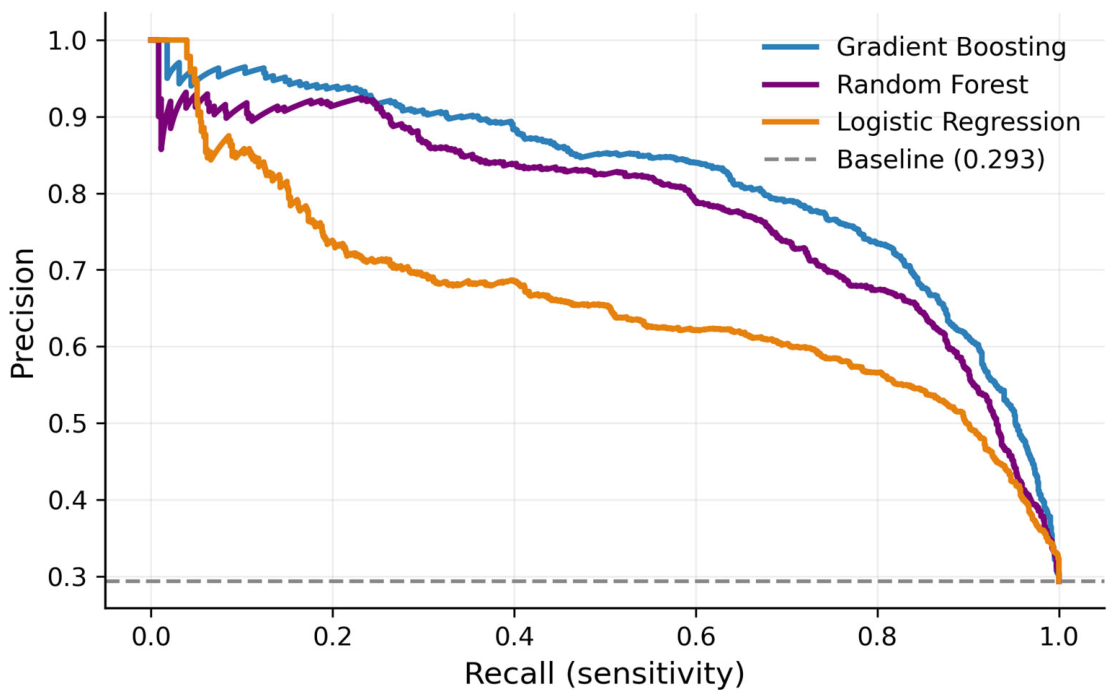
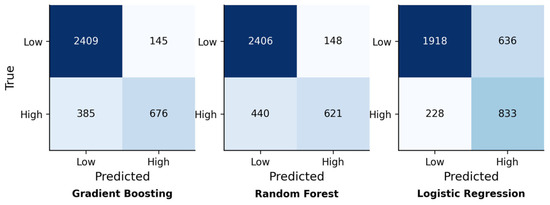
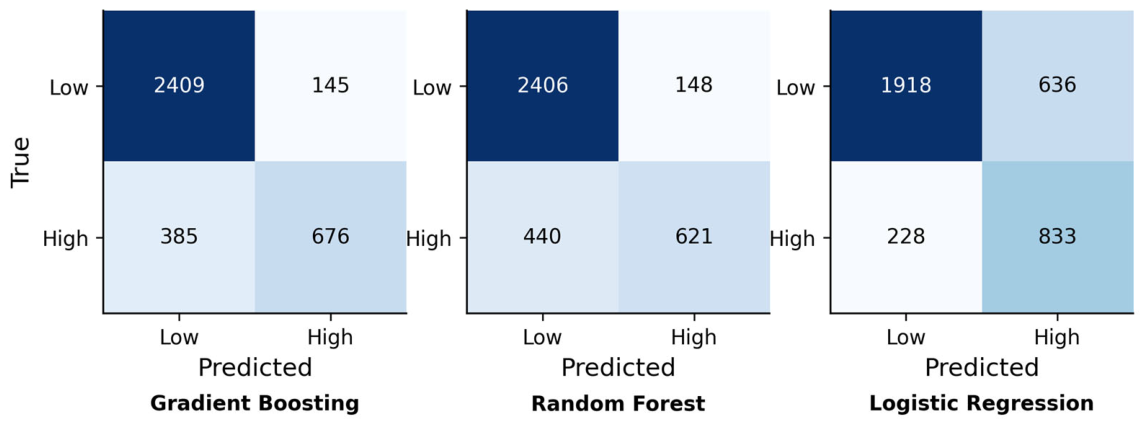
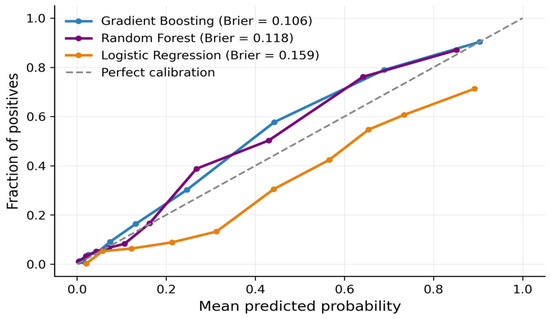
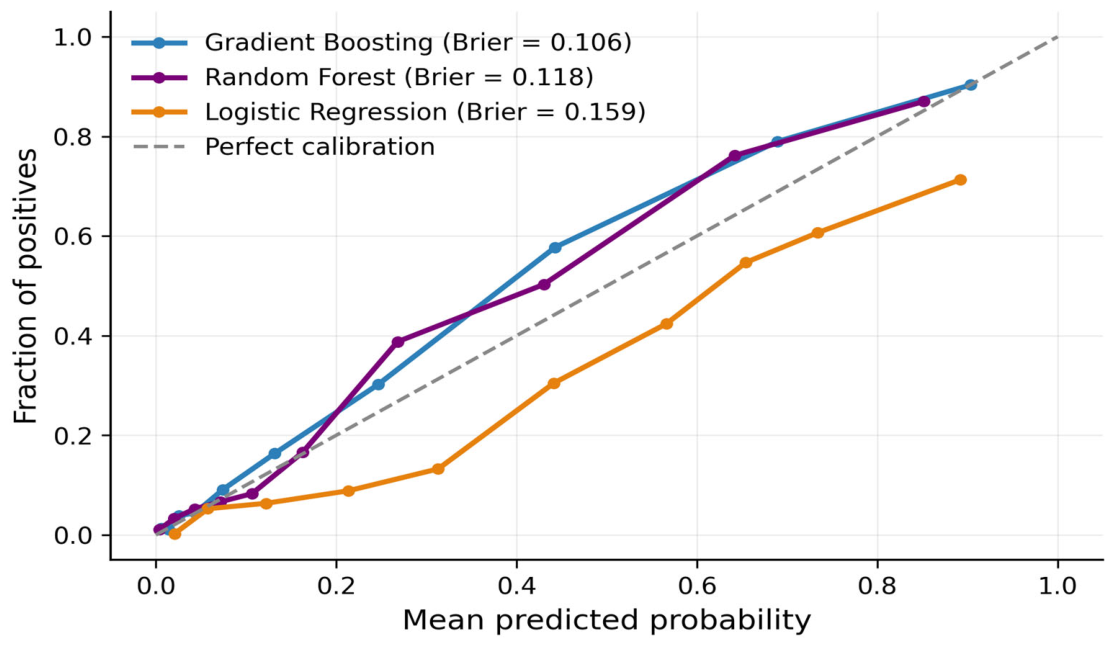
Table 4 reports stratum-level temporal validation with 95% bootstrap confidence intervals. With one-hot encoding, balanced class weights, and threshold optimization, Logistic Regression attained a sensitivity of 0.810 (versus 0.000 under the original label-encoded baseline), constituting a fair linear comparator. ROC, precision–recall, confusion, and calibration results are shown in Figure 5, Figure 6, Figure 7 and Figure 8.
Table 4.
Stratum-level temporal validation with 95% bootstrap CIs (train 2018–2021; test 2023; n_test = 3615 strata).
Figure 5.
ROC curves under leakage-controlled, stratum-level temporal validation (test 2023).
Figure 6.
Precision–recall curves under temporal validation (test 2023).
Figure 7.
Confusion matrices for the three models (stratum level, test 2023). Colour intensity is proportional to the number of strata in each cell: darker blue indicates a higher count and lighter blue a lower count; absolute counts are printed within each cell.
Figure 8.
Calibration curves with Brier scores (test 2023).
3.5. Threshold Sensitivity
Discrimination remained stable across thresholds (Gradient Boosting 0.900–0.931), confirming robustness to the cut-point (Table 5).
Table 5.
Threshold sensitivity (thresholds on training strata 2018–2021).
3.6. Cross-Validation, Geographic Validation, and Ablation
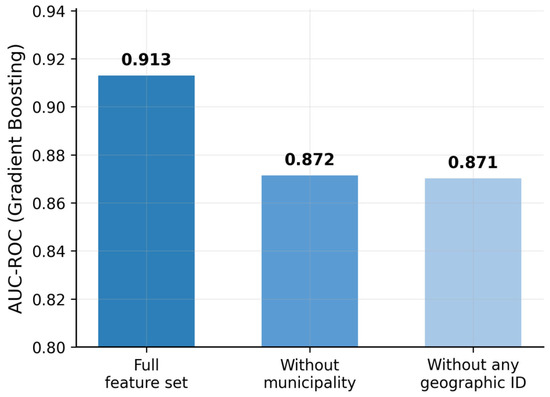
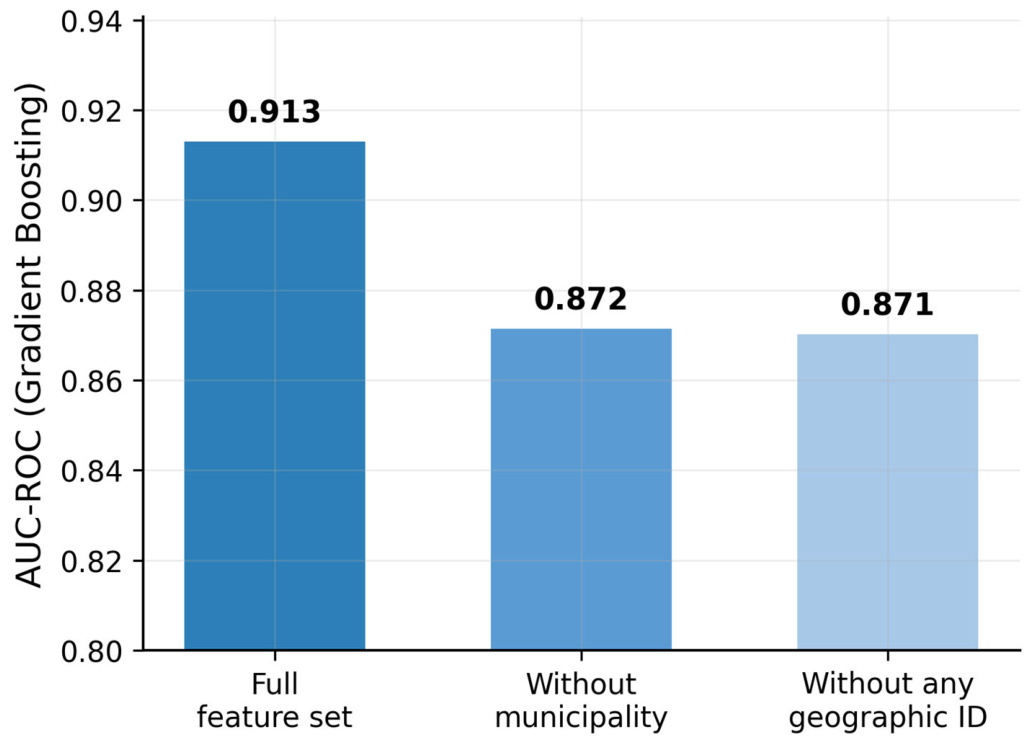
When entire municipalities are held out (GroupKFold), performance declines (Gradient Boosting −0.125), quantifying geographic clustering; it nonetheless remains strong (0.81–0.83), indicating substantial transferable signal beyond municipality-specific patterns (Table 6). Leave-one-department-out validation was strong and homogeneous (0.807–0.889; Table 7). In the geographic ablation, removing all geographic identifiers reduced AUC only marginally (0.913 → 0.871), suggesting that a substantial proportion of predictive performance is explained by transferable clinically and epidemiologically structured stratum descriptors, although residual geographic dependence remains, as quantified by the municipality-level GroupKFold effect (Table 6; Figure 9).
Table 6.
Five-fold cross-validation: StratifiedKFold versus GroupKFold (municipality).
Table 7.
Leave-one-department-out geographic validation (Random Forest, geography-free feature set).
Figure 9.
Geographic ablation (Gradient Boosting): performance barely changes without geographic identifiers.
3.7. Feature Importance and SHAP Interpretability
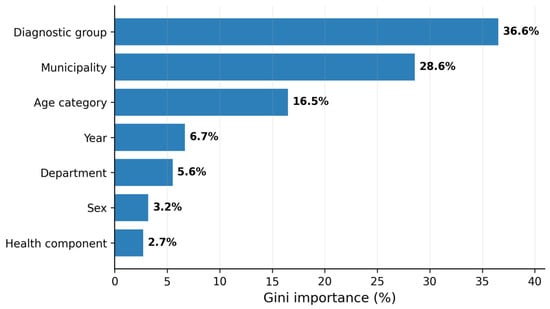
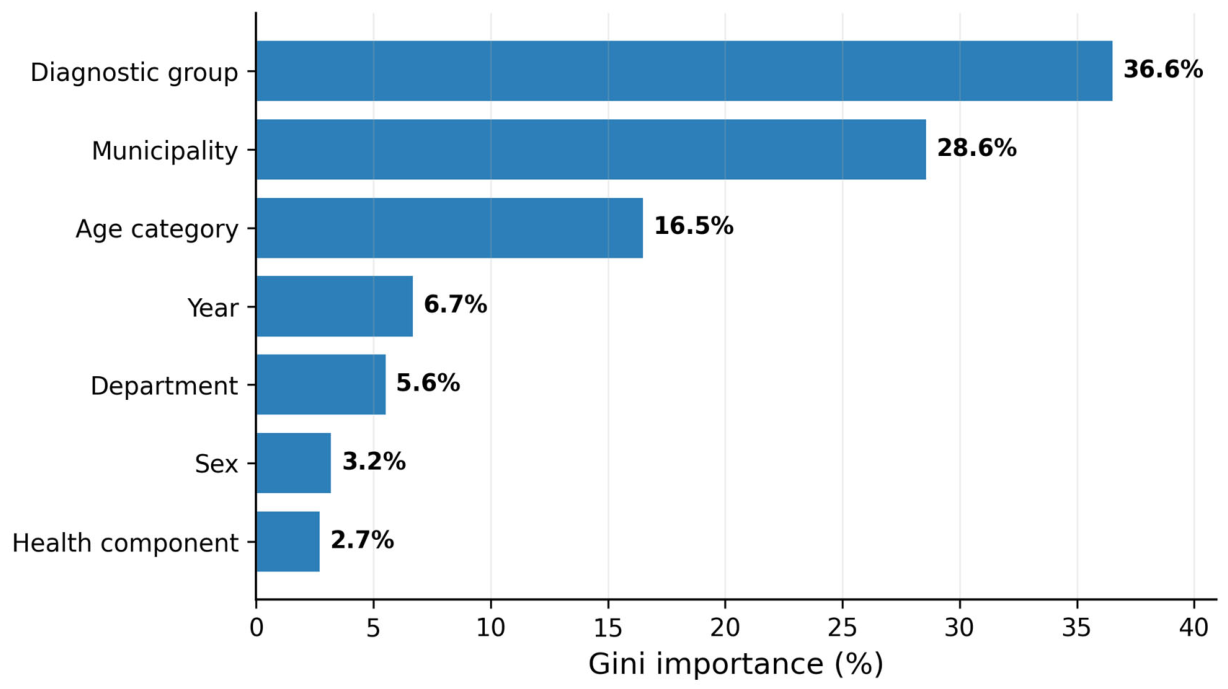
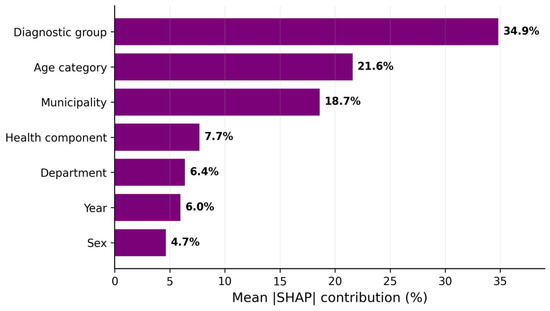
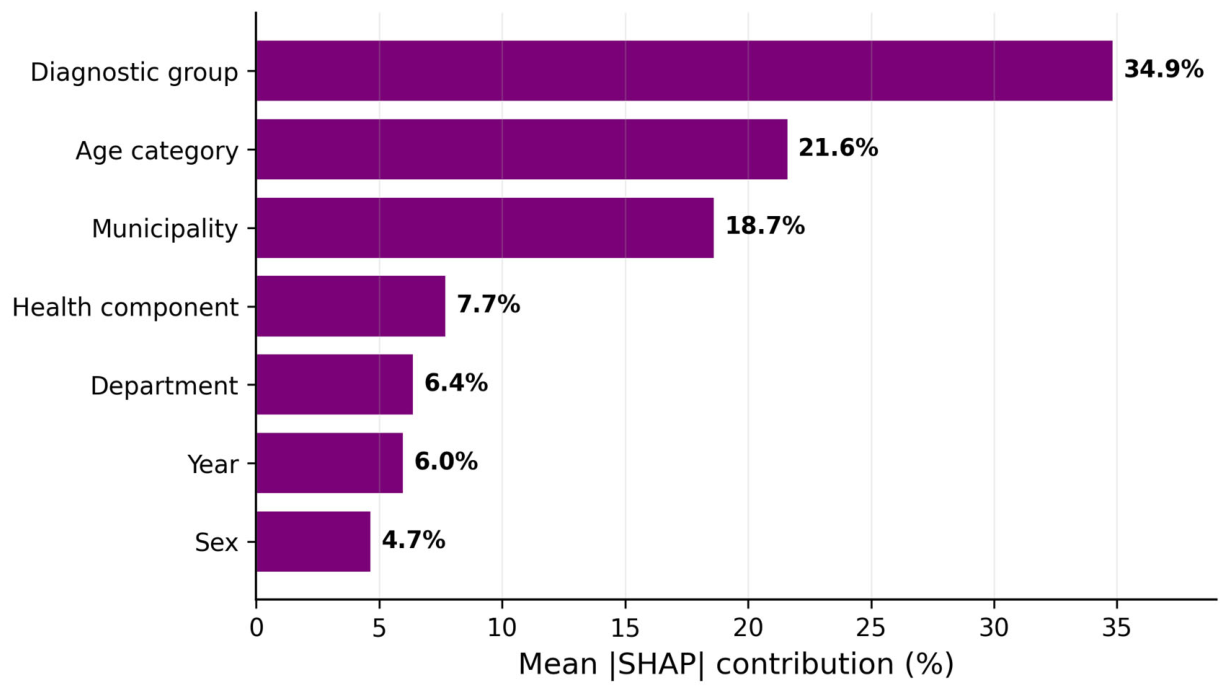
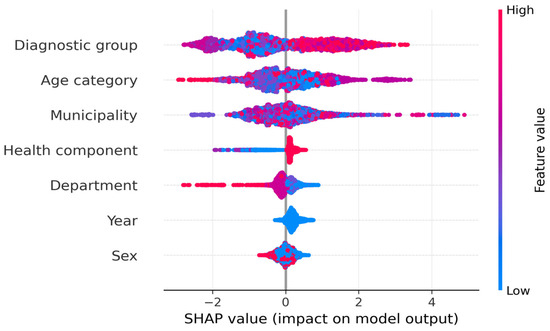
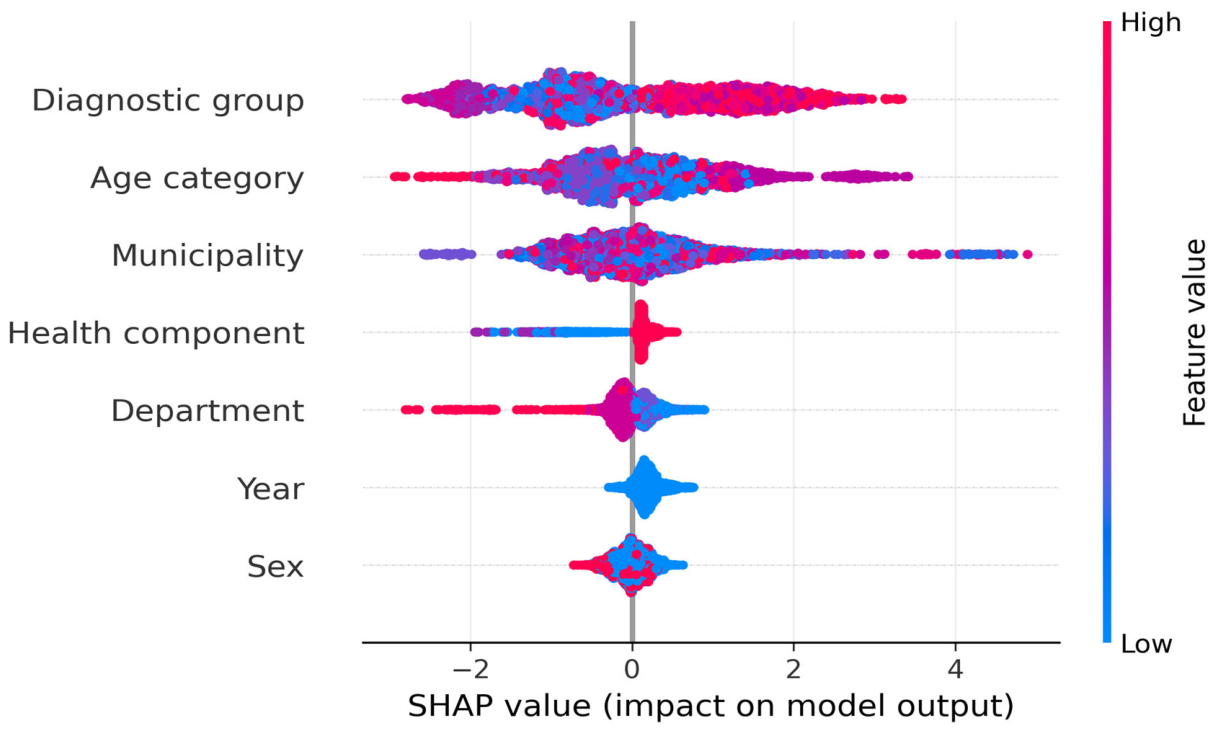
Under the corrected analysis, the dominant predictor was the diagnostic group, not municipality. SHAP analysis on Gradient Boosting ranked diagnostic group (34.9%), age category (21.6%), municipality (18.7%), health component (7.7%), department (6.4%), year (6.0%), and sex (4.7%). Random Forest Gini importances showed the same leading pattern (diagnostic group 36.6%, municipality 28.6%, age category 16.5%); the higher municipality value under Gini reflects the known bias of impurity-based importance toward high-cardinality variables [24], which the SHAP analysis—placing municipality third—does not exhibit. This differs markedly from the original analysis, in which municipality dominated (50.2% SHAP/53.2% Gini), and suggests that, under a validated denominator, a substantial proportion of the predictive signal is carried by clinical-epidemiological structure rather than by geographic labels alone, although a residual geographic contribution remains (Figure 10, Figure 11 and Figure 12).
Figure 10.
Feature importance (Random Forest, Gini)—leakage-controlled, stratum level.
Figure 11.
SHAP feature importance (Gradient Boosting, mean |SHAP|)—stratum level, corrected target.
Figure 12.
SHAP beeswarm (Gradient Boosting)—stratum level.
3.8. Interactive Platform Deployment
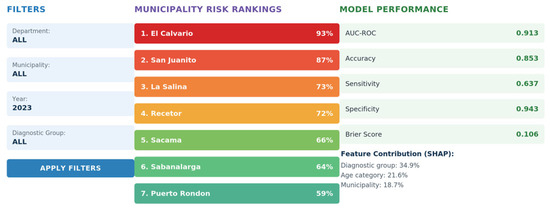
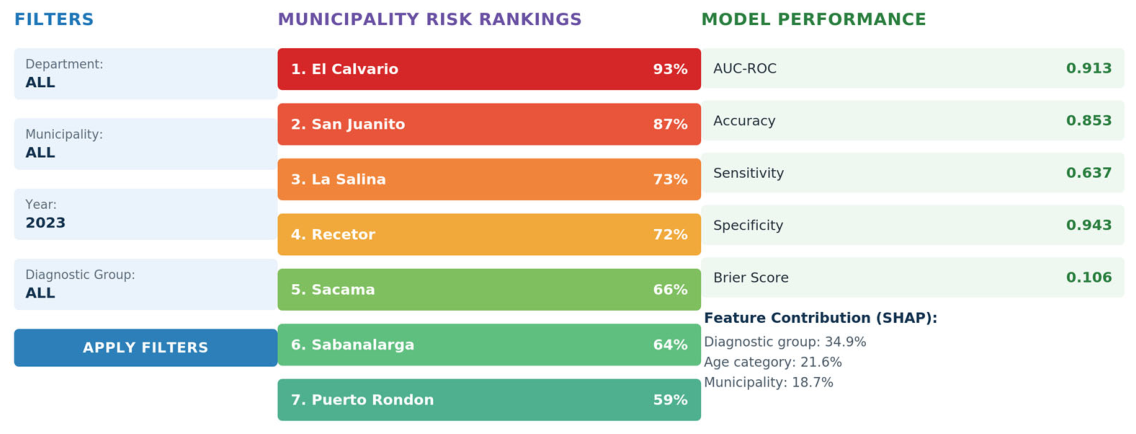
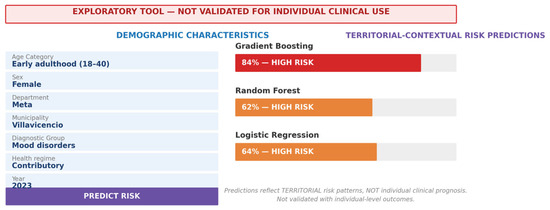
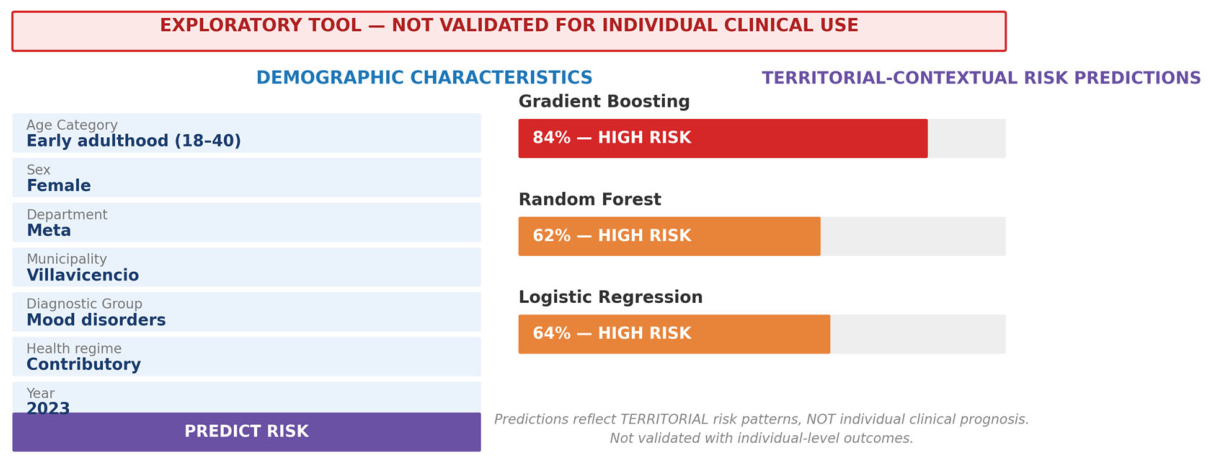
The framework is deployed as an interactive Streamlit application with two levels. The City Model (Figure 13) provides territorial risk classification with filters by department, municipality, year, and diagnostic group, together with a corrected model-performance summary and SHAP-based feature contributions. The Territorial Stratum Risk Simulator (Figure 14) enables exploratory territorial-contextual risk profiling from demographic and clinical characteristics; it has not been validated with individual-level outcome data and its predictions reflect territorial patterns rather than individual clinical prognosis.
Figure 13.
City Model interface (corrected): municipality risk rankings, performance summary, and SHAP feature contributions.
Figure 14.
Territorial Stratum Risk Simulator interface (exploratory): the input fields specify the structural characteristics that define an epidemiological stratum (municipality, diagnostic group, age category, sex), not an individual, and the tool returns the predicted risk tier of that stratum from the three models, with an explicit limitations disclaimer.
We stress that the Territorial Stratum Risk Simulator performs no individual-level inference: for a given combination of demographic and territorial characteristics it returns the risk classification of the corresponding stratum, consistent with the stratum-level unit of analysis used throughout the study. Interpreting such a stratum-level estimate as an individual’s risk would constitute an ecological fallacy—the erroneous transfer of group-level associations to individuals [29]—which is precisely why the tool is confined to territorial-contextual exploration and is explicitly not offered for individual clinical use. It is therefore best understood as a stratum-level lookup presented per profile, not as an individual prediction model.
The Territorial Stratum Risk Simulator is an exploratory, non-clinical tool: it has not been validated against individual-level outcome data and must not be used for individual clinical decision-making.
4. Discussion
This study shows that, once population denominators are validated against official DANE projections and analyses are conducted at the level of independent strata, documented (service-utilization) morbidity risk in the Colombian Orinoquía can be predicted from clinically and epidemiologically structured stratum descriptors with strong predictive performance (Gradient Boosting AUC-ROC 0.913 [0.903–0.923]). This contrasts sharply with the artificially inflated metrics (AUC > 0.999) obtained when mathematically linked variables are included—a result that itself constitutes a methodological contribution by empirically illustrating how data leakage inflates performance in administrative health data [9,12,15].
The correction of the denominator was consequential. The original extract embedded population figures that were inflated and produced unstable, small-area rates dominating the upper quartile of the outcome; rates computed over very small denominators are known to be inherently unstable [19]. Recomputing rates from validated denominators reversed the apparent territorial gradient: the most remote department exhibits the lowest documented morbidity, consistent with under-registration driven by limited healthcare access rather than low underlying need. Interpreting such biased data as an informative artifact—rather than as ground truth—is essential for equitable surveillance [30].
The dominant role of diagnostic group, together with the geographic ablation (AUC 0.913 → 0.871 without any geographic identifier) and the homogeneous leave-one-department-out performance (0.807–0.889), suggests that a substantial proportion of predictive performance is explained by transferable clinical-epidemiological information, although residual geographic dependence remains. This mitigates—though it does not eliminate—the concern that geographic labels might encode administrative reporting patterns. At the same time, GroupKFold by municipality revealed a measurable clustering effect (−0.079 to −0.125 in AUC), reported transparently: performance is strong but not independent of municipal structure [19,21].
These findings carry equity implications that connect directly to the algorithmic-fairness and spatial-epidemiology studies. Because a model trained on administrative data inherits the biases of the system that generated it, convenient proxies can encode structural inequity: a widely cited example is the use of health-care cost as a proxy for need, which systematically under-identified the sickest patients from underserved groups [31]. The analogous risk here is that under-registration in remote territories is read as low burden, so that models trained predominantly on better-served populations may misrepresent risk in underserved areas, contributing to resource misallocation and exacerbating health inequities [8,32,33]. Guarding against this requires treating documented rates as service-utilization artifacts rather than ground truth [30], fairness-aware and geographically stratified validation with territory-specific calibration, and spatial-epidemiological reasoning that borrows strength across areas rather than trusting unstable local estimates [19]. Such safeguards are essential in fragmented health systems. Methodologically, the combination of validated external denominators, stratum-level inference, leakage control, temporal and geographic validation, a properly encoded linear baseline, and interpretability provides a defensible template for honest predictive surveillance using administrative health data.
Appraised against the PROBAST framework [27,28], the study presents a low-to-moderate overall risk of bias. In the participants domain, the analytical sample derives from a complete administrative extract of morbidity registrations for the four Orinoquía departments rather than from a selected subset, limiting selection bias; because these are health-service registrations (RIPS/SISPRO) rather than a census of incident cases, however, applicability is bounded to documented, service-utilization morbidity. In the predictors domain, risk of bias is reduced by defining features a priori and by explicitly excluding all variables mathematically linked to the outcome, an audited leakage-control step. In the outcome domain, the principal source of concern—an unstable, small-denominator rate—was addressed by recomputing rates against validated external DANE denominators, although the dichotomization of the outcome at the 75th percentile remains an operational rather than a clinically derived choice. The analysis domain concentrates the residual risk: group-aware cross-validation reveals a municipality-level clustering effect (AUC difference 0.079–0.125), and the temporal validation remains partly optimistic; both are reported transparently and temper the strength of the generalization claims. Overall applicability to territorial public-health surveillance nonetheless remains high, as the framework aligns with the administrative capacity and data structures of the regional health authorities.
Several limitations must be acknowledged. First, although pseudo-replication was addressed by stratum-level analysis, group-aware cross-validation revealed a residual municipality-level clustering effect (AUC difference 0.079–0.125), and reported metrics should be read accordingly. Second, temporal validation remains partly optimistic because the same municipality-by-demography profile recurs across years; the ablation and leave-one-department-out analyses provide the more conservative evidence of generalization. Third, the numerator reflects documented health-service attentions (RIPS/SISPRO registrations) and therefore measures service utilization and registered morbidity rather than true incidence or prevalence; results are shaped by territorial differences in access and registration. This reinforces the interpretation of the reversed territorial gradient: lower documented rates in remote departments reflect reduced access and registration, not lower underlying need. Fourth, the age-category cut-points, although internally consistent, are operational rather than derived from a single external standard. Fifth, the 75th-percentile threshold is operationally rather than clinically defined, though sensitivity analysis confirmed robustness. Sixth, the framework does not incorporate temporal forecasting and cannot generate zero-shot predictions for territories outside the Orinoquía without retraining.
5. Conclusions
Leakage-controlled machine learning, conducted at the level of independent strata and with morbidity rates computed from validated DANE population denominators, provides a realistic and methodologically defensible approach to territorial risk stratification for public-health surveillance. Under these conditions, Gradient Boosting achieved an AUC-ROC of 0.913 [95% CI: 0.903–0.923] in prospective temporal validation, with a substantial proportion of predictive performance explained by transferable clinical-epidemiological information (notably diagnostic group and age), although residual geographic dependence remains, as shown by the geographic ablation and leave-one-department-out transferability (0.807–0.889). This residual municipality-level dependence, quantified by group-aware cross-validation, is acknowledged and does not overturn the main conclusions.
Beyond the specific application, the study contributes a cautionary, reproducible illustration: correcting a denominator-induced rate instability not only altered the territorial narrative but strengthened the analysis, underscoring that rigorous denominator validation and unit-of-analysis discipline are as critical as leakage control in honest biomedical-informatics surveillance. The framework—encompassing temporal validation, geographic validation, group-aware cross-validation, calibration, bootstrap uncertainty quantification, and SHAP interpretability—offers a transferable methodological example for the broader community.
Author Contributions
Conceptualization, R.F.E. and D.A.V.P.; methodology, R.F.E. and D.A.V.P.; machine learning development, D.A.V.P.; validation, R.F.E. and D.A.V.P.; formal analysis, D.A.V.P.; investigation, R.F.E. and D.A.V.P.; resources, R.F.E.; data curation, D.A.V.P.; writing—original draft, R.F.E. and D.A.V.P.; writing—review and editing, R.F.E. and D.A.V.P.; visualization, D.A.V.P.; supervision, R.F.E.; project administration, R.F.E.; funding acquisition, R.F.E. All authors have read and agreed to the published version of the manuscript.
Funding
This research was funded by the Ministry of Science, Technology and Innovation of Colombia (Minciencias) through the project “Observatory of Mental Health, Family, and Social Coexistence of the Orinoquía”, contract number 655-2022. The funders had no role in the design of the study; in the collection, analyses, or interpretation of data; in the writing of the manuscript; or in the decision to publish the results.
Institutional Review Board Statement
Ethical review was waived as the research used aggregated, anonymized secondary administrative data with no individual identifiers and no direct human-subject interaction, in accordance with Colombian Resolution 8430 of 1993 and Law 1581 of 2012.
Data Availability Statement
Raw source data are publicly accessible through official Colombian government sources: SISPRO (https://www.sispro.gov.co/, accessed on 5 July 2026), DANE (https://www.dane.gov.co, accessed on 5 July 2026), and RUAF. Analytical code, preprocessing scripts (including the DANE denominator merge and stratum-level rate computation), and trained models are available at https://github.com/daverap/territorial-risk-stratification-orinoquia (accessed on 5 July 2026) and will be deposited in Zenodo with a permanent DOI upon publication.
Conflicts of Interest
The authors declare no conflicts of interest.
References
- United Nations. World Population Prospects 2022: Summary of Results; United Nations: New York, NY, USA, 2022. [Google Scholar]
- World Health Organization. Decade of Healthy Ageing 2020–2030; WHO: Geneva, Switzerland, 2020. [Google Scholar]
- World Health Organization. Global Strategy on Digital Health 2020–2025; WHO: Geneva, Switzerland, 2021. [Google Scholar]
- World Health Organization. Mental Health and COVID-19: Early Evidence of the Pandemic’s Impact; WHO: Geneva, Switzerland, 2022. [Google Scholar]
- Shortliffe, E.H.; Cimino, J.J. Biomedical Informatics: Computer Applications in Health Care and Biomedicine, 5th ed.; Springer: New York, NY, USA, 2021. [Google Scholar]
- Hersh, W.R. Information Retrieval: A Biomedical and Health Perspective, 4th ed.; Springer: Cham, Switzerland, 2020. [Google Scholar]
- Beam, A.L.; Kohane, I.S. Big data and machine learning in health care. JAMA 2018, 319, 1317–1318. [Google Scholar] [CrossRef] [Scilit] [PubMed]
- Paulus, J.K.; Kent, D.M. Predictably unequal: Understanding and addressing concerns that algorithmic clinical prediction may increase health disparities. npj Digit. Med. 2020, 3, 99. [Google Scholar] [CrossRef] [Scilit]
- Kaufman, S.; Rosset, S.; Perlich, C.; Stitelman, O. Leakage in data mining: Formulation, detection, and avoidance. ACM Trans. Knowl. Discov. Data 2012, 6, 1–21. [Google Scholar] [CrossRef] [Scilit]
- Nistal-Nuño, B. Data leakage in healthcare machine learning research. J. Biomed. Inform. 2024, 155, 104665. [Google Scholar]
- Davis, S.E.; Matheny, M.E.; Balu, S.; Sendak, M.P. A framework for understanding label leakage in machine learning for health care. J. Am. Med. Inform. Assoc. 2024, 31, 274–280. [Google Scholar] [CrossRef] [Scilit] [PubMed]
- Wynants, L.; Van Calster, B.; Collins, G.S.; Riley, R.D.; Heinze, G.; Schuit, E.; Albu, E.; Arshi, B.; Bellou, V.; Bonten, M.M.J.; et al. Prediction models for diagnosis and prognosis of COVID-19: Systematic review and critical appraisal. BMJ 2020, 369, m1328. [Google Scholar] [CrossRef] [Scilit] [PubMed]
- Rosenblatt, M.; Tejavibulya, L.; Jiang, R.; Noble, S.; Scheinost, D. Data leakage inflates prediction performance in connectome-based machine learning models. Nat. Commun. 2024, 15, 1829. [Google Scholar] [CrossRef] [Scilit] [PubMed]
- Kapoor, S.; Narayanan, A. Leakage and the reproducibility crisis in machine-learning-based science. Patterns 2023, 4, 100804. [Google Scholar] [CrossRef] [Scilit] [PubMed]
- Roberts, D.R.; Bahn, V.; Ciuti, S.; Boyce, M.S.; Elith, J.; Guillera-Arroita, G.; Hauenstein, S.; Lahoz-Monfort, J.J.; Schröder, B.; Thuiller, W.; et al. Cross-validation strategies for data with temporal, spatial, hierarchical, or phylogenetic structure. Ecography 2017, 40, 913–929. [Google Scholar] [CrossRef] [Scilit]
- Austin, P.C.; Steyerberg, E.W. The Integrated Calibration Index (ICI) and related metrics for quantifying the calibration of logistic regression models. Stat. Med. 2019, 38, 4051–4065. [Google Scholar] [CrossRef] [Scilit] [PubMed]
- Collins, G.S.; Moons, K.G.M.; Dhiman, P.; Riley, R.D. TRIPOD+AI statement: Updated guidance for reporting clinical prediction models. BMJ 2024, 385, e078378. [Google Scholar] [CrossRef] [Scilit] [PubMed]
- Austin, P.C.; van Klaveren, D.; Vergouwe, Y.; Nieboer, D.; Lee, D.S.; Steyerberg, E.W. Geographic and temporal validity of prediction models. J. Clin. Epidemiol. 2016, 79, 76–85. [Google Scholar] [CrossRef] [Scilit] [PubMed]
- Gause, E.L.; Schumacher, A.E.; Ellyson, A.M.; Withers, S.D.; Mayer, J.D.; Rowhani-Rahbar, A. An introduction to Bayesian spatial smoothing methods for disease mapping. Am. J. Epidemiol. 2024, 193, 1002–1009. [Google Scholar] [CrossRef] [Scilit] [PubMed]
- Steyerberg, E.W.; Vergouwe, Y. Towards better clinical prediction models: Seven steps for development and an ABCD for validation. Eur. Heart J. 2014, 35, 1925–1931. [Google Scholar] [CrossRef] [Scilit] [PubMed]
- Departamento Administrativo Nacional de Estadística (DANE). Proyecciones de Población y Estudios Demográficos; DANE: Bogotá, Colombia, 2023. [Google Scholar]
- Kruk, M.E.; Gage, A.D.; Arsenault, C.; Jordan, K.; Leslie, H.H.; Roder-DeWan, S.; Adeyi, O.; Baker, P.; Daelmans, B.; Doubova, S.V.; et al. High-quality health systems in the Sustainable Development Goals era. Lancet Glob. Health 2018, 6, e1196–e1252. [Google Scholar] [CrossRef] [Scilit] [PubMed]
- Zhao, N.; Charland, K.; Carabali, M.; Nsoesie, E.O.; Maheu-Giroux, M.; Rees, E.; Yuan, M.; García Balaguera, C.; Jaramillo Ramirez, G.I.; Zinszer, K. Machine learning and dengue forecasting: Comparing random forests and artificial neural networks for predicting dengue burden at national and sub-national scales in Colombia. PLoS Negl. Trop. Dis. 2020, 14, e0008056. [Google Scholar] [CrossRef] [Scilit] [PubMed]
- Strobl, C.; Boulesteix, A.-L.; Zeileis, A.; Hothorn, T. Bias in random forest variable importance measures: Illustrations, sources and a solution. BMC Bioinform. 2007, 8, 25. [Google Scholar] [CrossRef] [Scilit] [PubMed]
- Van Calster, B.; McLernon, D.J.; van Smeden, M.; Wynants, L.; Steyerberg, E.W. Calibration: The Achilles heel of predictive analytics. BMC Med. 2019, 17, 230. [Google Scholar] [CrossRef] [Scilit] [PubMed]
- Lundberg, S.M.; Lee, S.-I. A unified approach to interpreting model predictions. Adv. Neural Inf. Process. Syst. 2017, 30, 4765–4774. [Google Scholar]
- Wolff, R.F.; Moons, K.G.M.; Riley, R.D.; Whiting, P.F.; Westwood, M.; Collins, G.S.; Reitsma, J.B.; Kleijnen, J.; Mallett, S.; PROBAST Group. PROBAST: A tool to assess risk of bias and applicability of prediction model studies. Ann. Intern. Med. 2019, 170, 51–58. [Google Scholar] [CrossRef] [Scilit] [PubMed]
- Moons, K.G.M.; Damen, J.A.A.; Kaul, T.; Hooft, L.; Navarro, C.A.; Dhiman, P.; Beam, A.L.; Van Calster, B.; Celi, L.A.; Denaxas, S.; et al. PROBAST+AI: An updated quality, risk of bias, and applicability assessment tool for prediction models using regression or artificial intelligence methods. BMJ 2025, 388, e082505. [Google Scholar] [CrossRef] [Scilit] [PubMed]
- Greenland, S.; Robins, J. Invited commentary: Ecologic studies—Biases, misconceptions, and counterexamples. Am. J. Epidemiol. 1994, 139, 747–760. [Google Scholar] [CrossRef] [Scilit] [PubMed]
- Ferryman, K.; Mackintosh, M.; Ghassemi, M. Considering biased data as informative artifacts in AI-assisted health care. N. Engl. J. Med. 2023, 389, 833–838. [Google Scholar] [CrossRef] [Scilit] [PubMed]
- Obermeyer, Z.; Powers, B.; Vogeli, C.; Mullainathan, S. Dissecting racial bias in an algorithm used to manage the health of populations. Science 2019, 366, 447–453. [Google Scholar] [CrossRef] [Scilit] [PubMed]
- Rajkomar, A.; Hardt, M.; Howell, M.D.; Corrado, G.; Chin, M.H. Ensuring fairness in machine learning to advance health equity. Ann. Intern. Med. 2018, 169, 866–872. [Google Scholar] [CrossRef] [Scilit] [PubMed]
- Mehrabi, N.; Morstatter, F.; Saxena, N.; Lerman, K.; Galstyan, A. A survey on bias and fairness in machine learning. ACM Comput. Surv. 2021, 54, 1–35. [Google Scholar] [CrossRef] [Scilit]

Disclaimer/Publisher’s Note: The statements, opinions and data contained in all publications are solely those of the individual author(s) and contributor(s) and not of MDPI and/or the editor(s). MDPI and/or the editor(s) disclaim responsibility for any injury to people or property resulting from any ideas, methods, instructions or products referred to in the content. |
© 2026 by the authors. Licensee MDPI, Basel, Switzerland. This article is an open access article distributed under the terms and conditions of the Creative Commons Attribution (CC BY) license.