

Skip to Content
BioMedInformaticsBioMedInformatics
  • Article
  • Open Access

9 July 2025

An Effective Approach for Wearable Sensor-Based Human Activity Recognition in Elderly Monitoring

,
,
and
1
Laboratory of Applied Sciences and Emerging Technologies, National School of Applied Sciences (ENSA), Sidi Mohamed Ben Abdellah University of Fez, Fez 30050, Morocco
2
Laboratory FST, Sidi Mohamed Ben Abdellah University of Fez, Fez 30050, Morocco
*
Author to whom correspondence should be addressed.

Abstract

Technological advancements and AI-based research have significantly influenced our daily lives. Human activity recognition (HAR) is a key area at the intersection of various AI technologies and application domains. In this study, we present our novel time series classification approach for monitoring the physical behaviors of the elderly and patients. This approach, which integrates supervised and unsupervised methods with generative models, has been validated for HAR, showing promising results. Our method was specifically adapted for healthcare and surveillance applications, enhancing the classification of physical behaviors in the elderly. The hybrid approach proved its effectiveness on the HAR70+ dataset, surpassing traditional recurrent convolutional network-based approaches. We further evaluated the surveillance system for the elderly (Surv-Sys-Elderly) model on the HARTH and HAR70+ datasets, achieving an accuracy of 94,3% on the HAR70+ dataset for recognizing elderly behaviors, highlighting its robustness and suitability for both clinical and domestic environments.

1. Introduction

Human activity recognition (HAR) [1] has become increasingly prevalent and impacts various aspects of daily life [2]. Its rapid development has been largely influenced by advances in the performance of technical devices, as well as by the evolution of the models and methods implemented. In the fitness field, these advances are helping to monitor physical activity and prevent chronic diseases by collecting data on the duration and intensity of exercise. Regarding human–machine interaction [3], they enable intuitive control of electronic devices and enrich immersive experiences in augmented and virtual reality. In the healthcare sector [4], they also make it easier to diagnose and monitor patients, particularly for conditions such as Parkinson’s and lung disease. In general, HAR has now become a central element in health and ambient intelligence applications, particularly for monitoring vulnerable populations such as the elderly [5], contributing to the improvement of treatments in physiotherapy and rehabilitation [6]. This technology facilitates the tracking of daily activities, making it possible to detect changes in behavior that may indicate health problems. These changes can serve as early indicators of underlying medical conditions and manifest in various ways, e.g., a decrease in physical activity [7] may signal mobility issues or chronic pain, while an increase in sedentary behavior can be linked to mental health disorders such as depression, raising the risk of chronic diseases. Additionally, modifications in sleep patterns, such as insomnia [8], may indicate physical or mental health issues, and a decrease in social interactions can signal isolation or depression. Variations in daily routines, observed through the monitoring of activities of daily living (ADL), such as forgetting to take medication, may also indicate cognitive problems such as dementia [9]. Additionally, these systems improve quality of life by establishing safe and supportive environments that can detect falls or extended periods of inactivity, while notifying caregivers in emergencies.

1.1. Motivation

The report on the mental health of older people [10], published on 20 October 2023 by the World Health Organization, raises some crucial points. By 2030, one in six people in the world will be aged 60 or over, and by 2050, the population of people aged 60 and over is expected to reach 2.1 billion, while that of people aged 80 and over could triple, reaching 426 million. In view of these demographic changes, it is essential for the scientific community to develop effective automated monitoring systems for the elderly. So the priority remains the development of such powerful systems to improve the quality of life of the elderly. Indeed, several studies and approaches have been developed to meet this need, as shown by a recent study [11], which highlights the importance of assisted living systems for the elderly, as well as the approaches used and the challenges encountered in the field of HAR and the detection of abnormal behavior. We identify several major challenges impeding the development of HAR systems for medical monitoring of elderly individuals and patients with chronic conditions [12]. Current approaches face particular difficulties in simultaneously satisfying three fundamental requirements: (1) high recognition accuracy, (2) model robustness against missing values and sensor noise, and (3) operational efficiency in varied environments. These persistent challenges, compounded by fundamental methodological limitations, significantly impede implementation across varied environments—including clinical settings and smart homes—where stringent operational efficiency remains imperative.

1.2. Contribution

In this context, our work addresses the challenge of accurate human activity recognition by leveraging recurrent autoencoders to effectively extract temporal dependencies and latent relational patterns from time series data. By precisely capturing complex temporal dynamics, this approach significantly enhances activity classification performance. To validate its effectiveness, we implemented and adapted our experimental model [13] for the HAR task, achieving notable improvements in recognition accuracy for both healthy elderly individuals and patients with specific health conditions.
The key contributions of this work include the following:
  • We offer an extensive analysis of the literature on deep learning methods using HAR, giving scholars useful data to comprehend and contrast new developments.
  • We compare our model with other well-known machine learning (ML) and deep learning (DL) models in the field of HAR to demonstrate the model’s promising performance, particularly when it comes to tracking the physical behavior of the elderly.
  • We analyze and evaluate the impact of model training on a HARTH dataset regarding the prediction of physical behaviors in older adults, examining metrics such as accuracy, precision, recall, and F1 score, using the HAR70+ dataset, focusing on elderly individuals aged 70 and above.
  • We enhance sensor-based activity classification robustness through advanced temporal data augmentation techniques, specifically designed to mitigate the impact of missing values and signal noise in wearable data.
The remainder of our scientific article is structured as follows: Section 2 discusses related work, focusing on various approaches and machine learning models applied to HAR using sensors. Section 3 provides a detailed overview of the proposed method, including the process followed at each stage and the structure tailored to all established phases. Section 4 presents the experimental metrics and results, along with a discussion analyzing the obtained experimental findings. Finally, Section 5 concludes our paper with future perspectives aimed at guiding upcoming research.

3. The Proposed Method

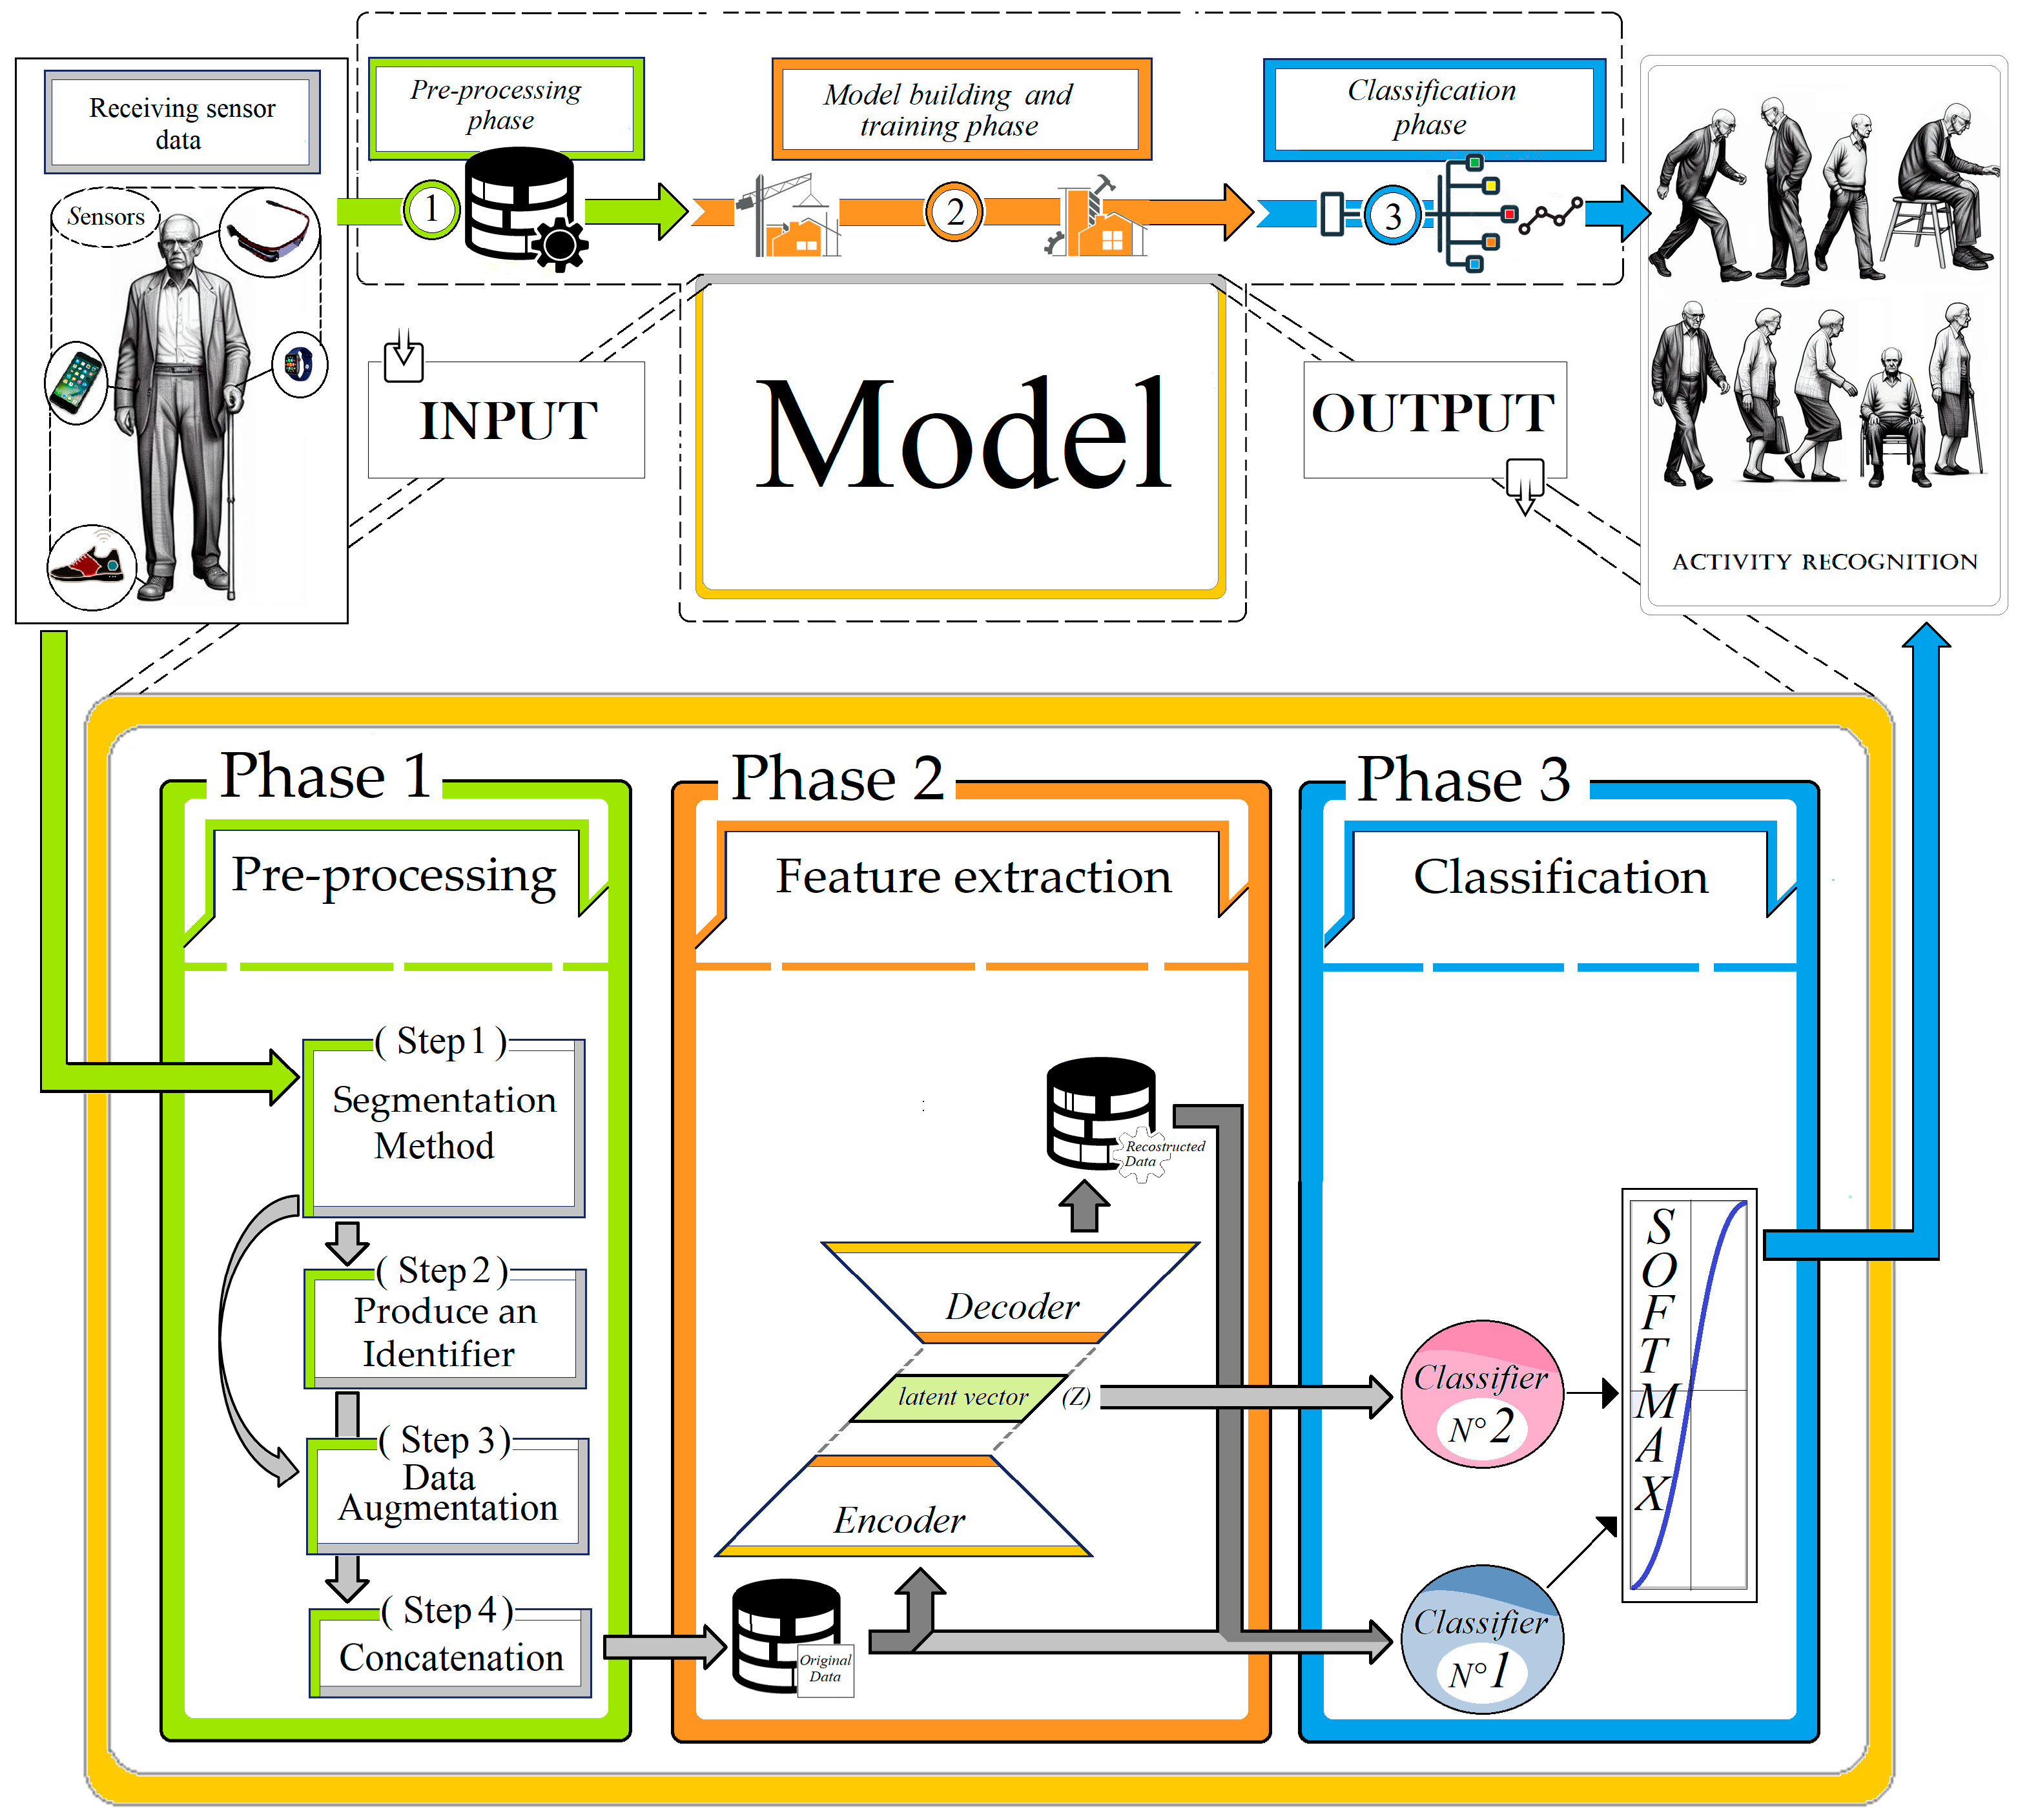
The proposed model (see Figure 1), surveillance system for the elderly, is organized into three blocks in series. The first block concerns the preprocessing phase and incorporates two key components: the generation of personalized identifiers (Id-Ci), which characterize individual biomechanical patterns for each activity class, and temporal data augmentation techniques designed to enhance model robustness. This integrated approach effectively captures inter-individual variability while optimizing input data quality for subsequent analysis.
Figure 1. Overview of our proposed model Surv-Sys-Elderly.
The second block implements a recurrent AE model. Through extensive training, the model effectively extracts the temporal and relational dependencies inherent in the data. This ability to capture complex dynamics significantly enhances the performance of the HAR system. Lastly, the third block is dedicated to HAR using a multi-classifier. This classifier leverages both the raw input data and the features previously extracted by the recurrent AE, including the latent space representation Z and the reconstructed output data. Our methodological framework incorporates an auxiliary value injection mechanism that enables the extraction of semantically meaningful temporal patterns from complex time series data. This approach allows the recurrent neural network autoencoder to (1) hierarchically learn both local and global temporal dependencies, (2) capture nonlinear interactions among multidimensional features, and (3) preserve structural relationships between sequences through its recurrent architecture. Following comprehensive training of the RNN-AE on augmented data, we perform feature and relational dependency extraction by substituting null vectors for the Id-Ci identifiers. This approach enables the simultaneous capture of both (1) the reconstructed patterns from the autoencoder output and (2) the generated latent space representations Z. Ultimately, we leverage these extracted elements to enhance human activity classification in elderly monitoring applications.

3.1. Preprocessing Phase

After collecting sensory data directly or downloading a dataset, and depending on the conceptual and experimental requirements of each approach, the initial phase consists of segmenting and normalizing the data to adapt them to theoretical and practical conditions. Following data acquisition from two AX3 accelerometers (Axivity Ltd., Newcastle upon Tyne, UK), mounted on the lower back (approx imately at the third lumbar vertebra, L3) and the right lower limb (10 cm above the patella, distal thigh region), the analysis began with a preprocessing pipeline. This critical phase included the following steps:

3.1.1. Segmentation Technique

Our preprocessing pipeline begins with axis-specific Min-Max normalization (Equation (1)) of multivariate sensor data, where each dimension (x, y, z) is independently scaled to [0; 1], using dimension-specific minimum (Xmin) and maximum (Xmax) values according to:
X n o r m = X X m i n X m a x X m i n
This per-axis normalization preserves inter-dimensional relationships while ensuring consistent feature scaling across all temporal sequences.
The method employs a structured segmentation approach for multi-sensor data, organized by both activity type and subject. For each activity–subject pair, we extracted overlapping segments of 100 consecutive samples (10% overlap), representing approximately 2 s of data at our 50 Hz sampling rate. This segmentation was applied to the tri-axial signals from 2 accelerometers (lumbar-mounted and foot-mounted), generating unified temporal windows with dimensions (6, 100)—comprising 3 axes × 2 sensors × 100 time steps. These standardized windows facilitated both comparative analysis and generalization of our personalized identifier Id-Ci.

3.1.2. Produce an Identifier

To generate personalized Id-Ci identifiers, our method introduces an advanced multi-sensor data segmentation framework structured by activity and subject. The approach utilizes an inter-segment similarity metric to identify characteristic motion signatures for each individual. The algorithmic process comprises three key post-segmentation steps: (1) systematic computation of Euclidean distances between all segment pairs, (2) selection of the top 30% most similar pairs (minimum distance), and (3) generation of unified identifiers (Id-Ci) through fusion of the most proximate segments. This optimization approach simultaneously enhances intra-class consistency while converging toward an accurate representation of activity patterns.

3.1.3. Data Augmentation

To enhance the robustness of time series data against missing values and temporal variations inherent in sensor measurements, we implement a data augmentation strategy based on the findings of Iwana and Uchida [35]. Our methodology incorporates the following two principal techniques:
Window warping [36]: A data augmentation technique that dynamically modifies the temporal scale by randomly stretching or compressing segments of a time series, while preserving its structural integrity. This extended version introduces nonlinear temporal distortions applied to six-dimensional time series data, ensuring the preservation of cross-channel correlations—particularly relevant in wearable sensor-based human activity recognition. A key feature of this approach lies in the use of a variable window length, which optimally balances several critical requirements. First, it introduces natural variability in the analyzed temporal context, enhancing the generation of diverse augmented patterns while maintaining physical validity. Second, its inherent adaptability improves robustness to variations in activity duration, preventing biases caused by rigid segmentation schemes. From a computational perspective, the chosen range preserves sufficient spectral content for meaningful analysis while maintaining manageable algorithmic complexity. For signals sampled at 50 Hz (typical in human motion analysis), the selected window length corresponds to 1.4–1.8 s—an empirically validated interval that captures key motion patterns while remaining efficient for real-time processing. This range ensures physiological relevance and avoids over-fragmentation. The overall procedure unfolds in three main stages, as illustrated in Algorithm 1 below.
Algorithm 1. Window Warping Augmentation
Require:  X(t) ∈ ℝ6, T: total length
Ensure:  W’ ∈ ℝ L×6: Augmented window
// Stage 1: Multi-Dimensional Window Selection
1: Randomly choose window length LU(70,90)
2: Randomly select t0 ∈ [1, TL + 1]
3: Extract window W = X(t0 : t0 + L − 1, :)
// Stage 2: Temporal Transformation
4: Randomly select scaling factor α ∈ (0.8,1.2)
5: for each channel Wi in W do:
6:      if  α > 1 then Wi ′ ← resample (Wi, ⌊ α L⌋) {Expansion}
7:      else  Wi ′ ← resample (Wi, ⌊ α L⌋) {Compression}
8:      end if
9: end for
// Stage 3: Signal Reconstruction
10: Apply cubic spline smoothing across W
11: Normalize length back to L (if needed) via resampling W
Algorithm 1 outlines the extended window warping technique, which includes:(stage 1) the selection of a variable-length multichannel segment from six-dimensional sensor data, (stage 2) the application of a nonlinear temporal distortion using a scaling factor α, and (stage 3) signal reconstruction through smoothing and resampling to preserve structural and physiological consistency.
Window Slicing: Particularly suited for long sequences, this method extracts meaningful subsequences to enhance model generalization by emulating temporal segmentation. We employ a variable window length between 75 and 95 samples to ensure the capture of significant activity segments while maintaining discriminative temporal patterns. This adaptive approach (1) preserves critical motion characteristics, (2) accommodates duration variability in real-world activities, and (3) optimizes the trade-off between context capture and computational efficiency. To enhance the robustness of time series against inherent inertial data challenges (missing values and temporal misalignments), we implemented two complementary augmentation strategies.
Random Data Dropout: This technique deliberately removes up to 20% of samples in scattered temporal segments, simulating realistic data corruption scenarios, including temporary sensor failures and intermittent transmission artifacts. By training on such artificially degraded signals, models learn to maintain robust performance when encountering missing data in real-world deployments, developing critical inference capabilities from partial observations. The scattered removal pattern ensures the model encounters diverse missing-data configurations during training.
Controlled Gaussian Noise Injection: The noise amplitude is calibrated to 5–20% of the signal’s nominal range. The injection follows an axisymmetric parameterization (X/Y/Z), ensuring adherence to each sensor’s spectral characteristics and realistic motion dynamics. Crucially, this method preserves essential cross-sensor correlations while enhancing robustness. The selected temporal data augmentation methods were chosen based on their optimal trade-off between the physical fidelity (preserving inherent dynamic and spectral features) and the task relevance (enhancing model robustness against realistic variations without introducing harmful distortions). The impact of these data augmentation techniques is analyzed in Section 4.

3.1.4. Concatenation

To finalize this preprocessing phase, we merged the sensory data with their associated class identifier in order to prepare the data without altering the complex characteristics that distinguish each class from the others.

3.2. Feature Extraction Phase

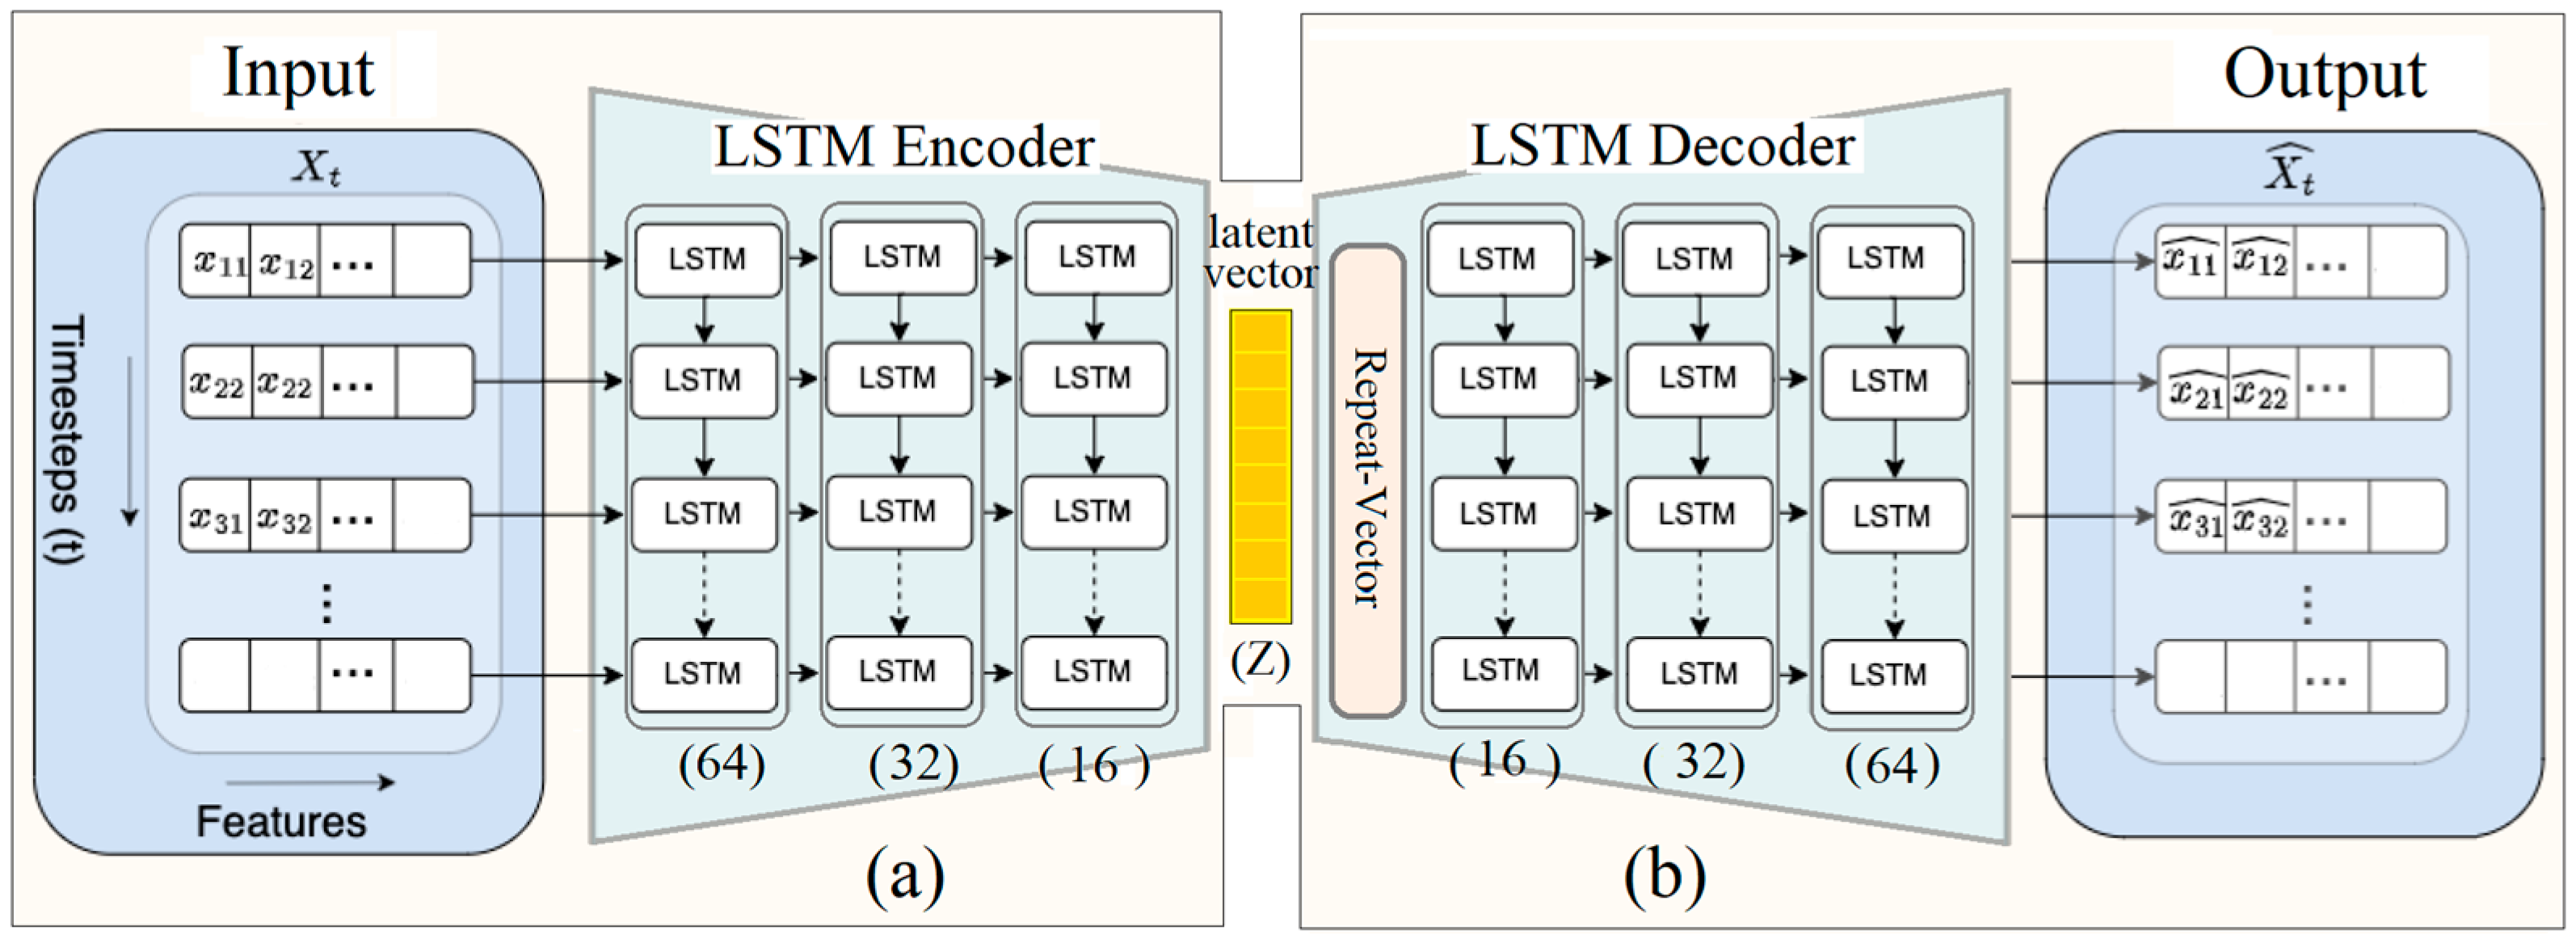
The second phase of our model involves using the autoencoder approach in an innovative way to capture the distinctive and significant features of sequential data. Our innovation lies in the introduction of a new identifying variable to improve HAR. As with any autoencoder architecture, this block consists of two fundamental elements: the LSTM encoder and LSTM decoder each consist of multiple layers that transform the input data into a compact representation (latent vector Z) and then reconstruct the original data from this representation.
Figure 2a shows the complete structure of this LSTM encoder. First layer (LSTM 64 units): this layer processes the input data as a sequence of 100 values and produces an output of 64 units. LSTM layers are particularly suited to sequential data because they can capture long-term dependencies. Second layer (LSTM 32 units): the output of the first layer is then passed to a second LSTM layer consisting of 32 units, which continues to compress the information. Third encoding layer (LSTM 16 units): The output of the second layer is then compressed by a third LSTM layer with 16 units, generating a latent space of 1 vector with 16 values. This latent space (Z) is the compact representation of the input data. This low-dimensional space captures the essential characteristics of the temporal sequences, enabling efficient reconstruction of the original data.
Figure 2. Overview of our LSTM-AE model: (a) Encoder, (b) Decoder.
Figure 2b shows the complete structure of this LSTM decoder. We started the de-coder with the repeat vector layer to maintain the length of the output sequence, establish a link between the encoder and decoder, and prepare the data for efficient reconstruction, enabling the autoencoder to reconstruct the input data accurately and consistently. The second decoding layer, a 64-unit LSTM, begins reconstructing the data using the repeated latent space. Then a third 32-unit LSTM decoding layer continues the reconstruction, followed by a fourth 16-unit LSTM layer that completes the process. Finally, a temporal distribution layer applies a dense operation by time sequence, ensuring that the size and structure of the reconstructed data match that of the input data.
Table 1 summarizes the experimental setup, including the complete technical specifications of the LSTM-AE model architecture and all relevant parameters employed in our study.
Table 1. Experimental setup of our LSTM-AE.
Any supervised learning model must go through an initial learning phase, allowing the model to adjust its hyperparameters to learn how to perform the target task efficiently, whether it be classification, detection, prediction, or other objectives, and thus improve its performance. After training our AE with data, including determining temporal identifiers, we move on to the second phase to test the AE model. The aim of this phase is to extract significant features for categorizing human activities from the original data. We capture the identifiers generated by the AE, but this time without inputting them. In fact, we replace the identifier values at the input with null values. The reconstructed output identifiers reflect the distinctive and relevant features; the recovered features, combined with the other data, are then used in the next step to accurately identify and recognize the human activity in progress.

3.3. Classification Phase

In the final step, we develop our classifier using three distinct classification blocks to recognize the human activities of elderly and ill people.

3.3.1. Classifier 1

Classifier 1 is in the form of a hybrid CNN-RNN architecture, almost identical to the one we successfully tested in the previous work [37]. Table 2 details the architectural configuration and hyperparameters of the CNN-LSTM-GRU hybrid model.
Table 2. Experimental setup of Classifier 1.

3.3.2. Classifier 2

It adopts a simplified method compared with Classifier 1, thanks to the small size of the latent vector equal to 16. Its architecture comprises a single Conv-1d of 64 ‘Relu’-activated kernels, a fully connected layer of 32 units, and a dense layer of 10 neurons.

3.3.3. Decision Maker

The outputs of Classifiers 1 and 2 are used as inputs for our decision maker D, which first performs a summation of the two vectors of dimension 10.
S o f t m a x x i = e x i j e x j     i , j { 1 , , 6 }
Then, a Soft-Max function (2) is applied to identify the activity class corresponding to the highest probability in this distribution.

4. Results and Discussion

4.1. Datasets Used

Datasets that use accelerometers to classify older people’s behaviors for monitoring purposes include HARTH and HAR70+, which contain labeled and well-structured data. Following is a brief overview of the datasets used:

4.1.1. Human Activity Recognition Trondheim Dataset [38]

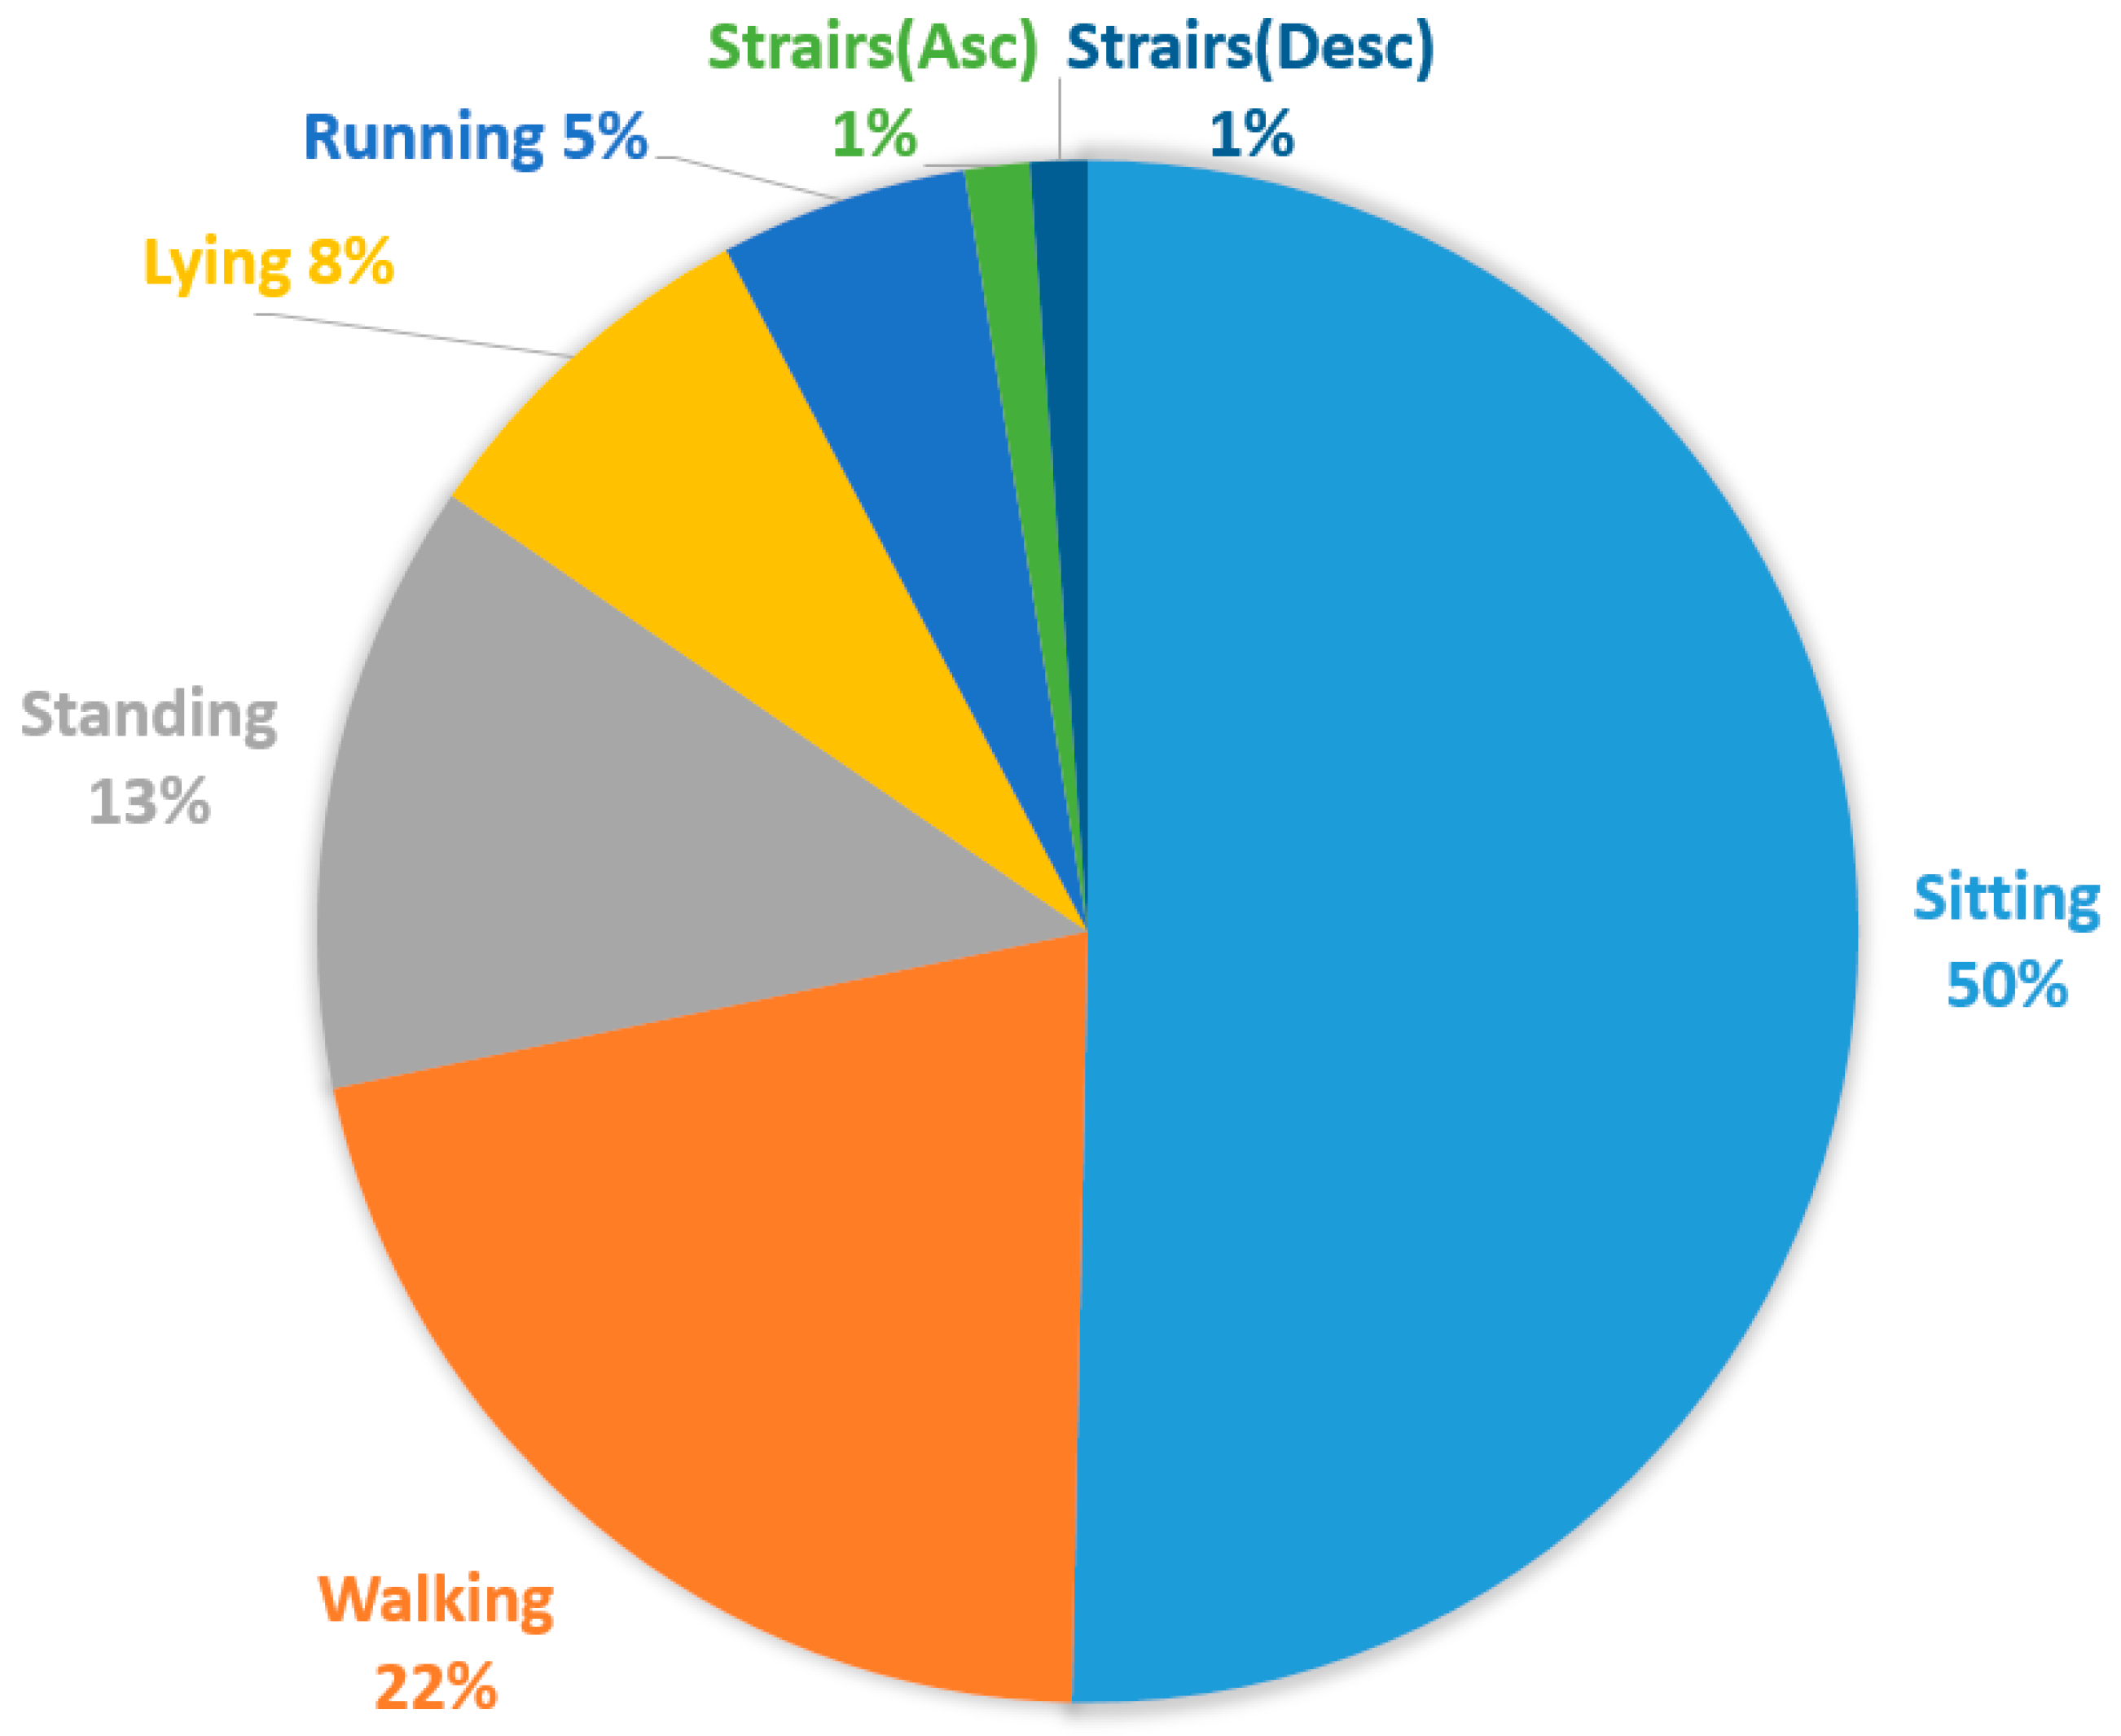
HARTH is a professionally annotated imbalanced dataset from the “Department of Public Health and Nursing, Faculty of Medicine and Health Sciences, NTNU, Trondheim, Norway”. HARTH comprised 22 subjects equipped with two 3D axial accelerometers for approximately 2 h in a free-living environment. The two sensors were positioned at standardized locations: the lower back (approximating the third lumbar vertebra, L3) and the right distal thigh (10 cm superior to the patella). These professional recordings and annotations constitute a promising reference for the scientific community, making it possible to develop and evaluate machine learning approaches and methods for accurate HAR in a free-living situation. Percentage representation of the seven fundamental activities of daily living recorded in the HARTH dataset—walking, running, stair ascending, stair descending, standing, sitting, and lying—is presented quantitatively in Figure 3.
Figure 3. Percentage of different activities in the HARTH dataset.

4.1.2. Human Activity Recognition 70+ Dataset [39]

HAR70+ is a collection annotated by professionals from the same laboratory as HARTH. It includes 18 adult subjects aged between 70 and 95, in good health or frail, wearing two 3D axial accelerometers for approximately 40 min in a semi-structured free-living protocol. The sensors were positioned identically to the configuration used for the HARTH dataset, namely on the right thigh and the lower back, with a sampling frequency of 50 Hz.
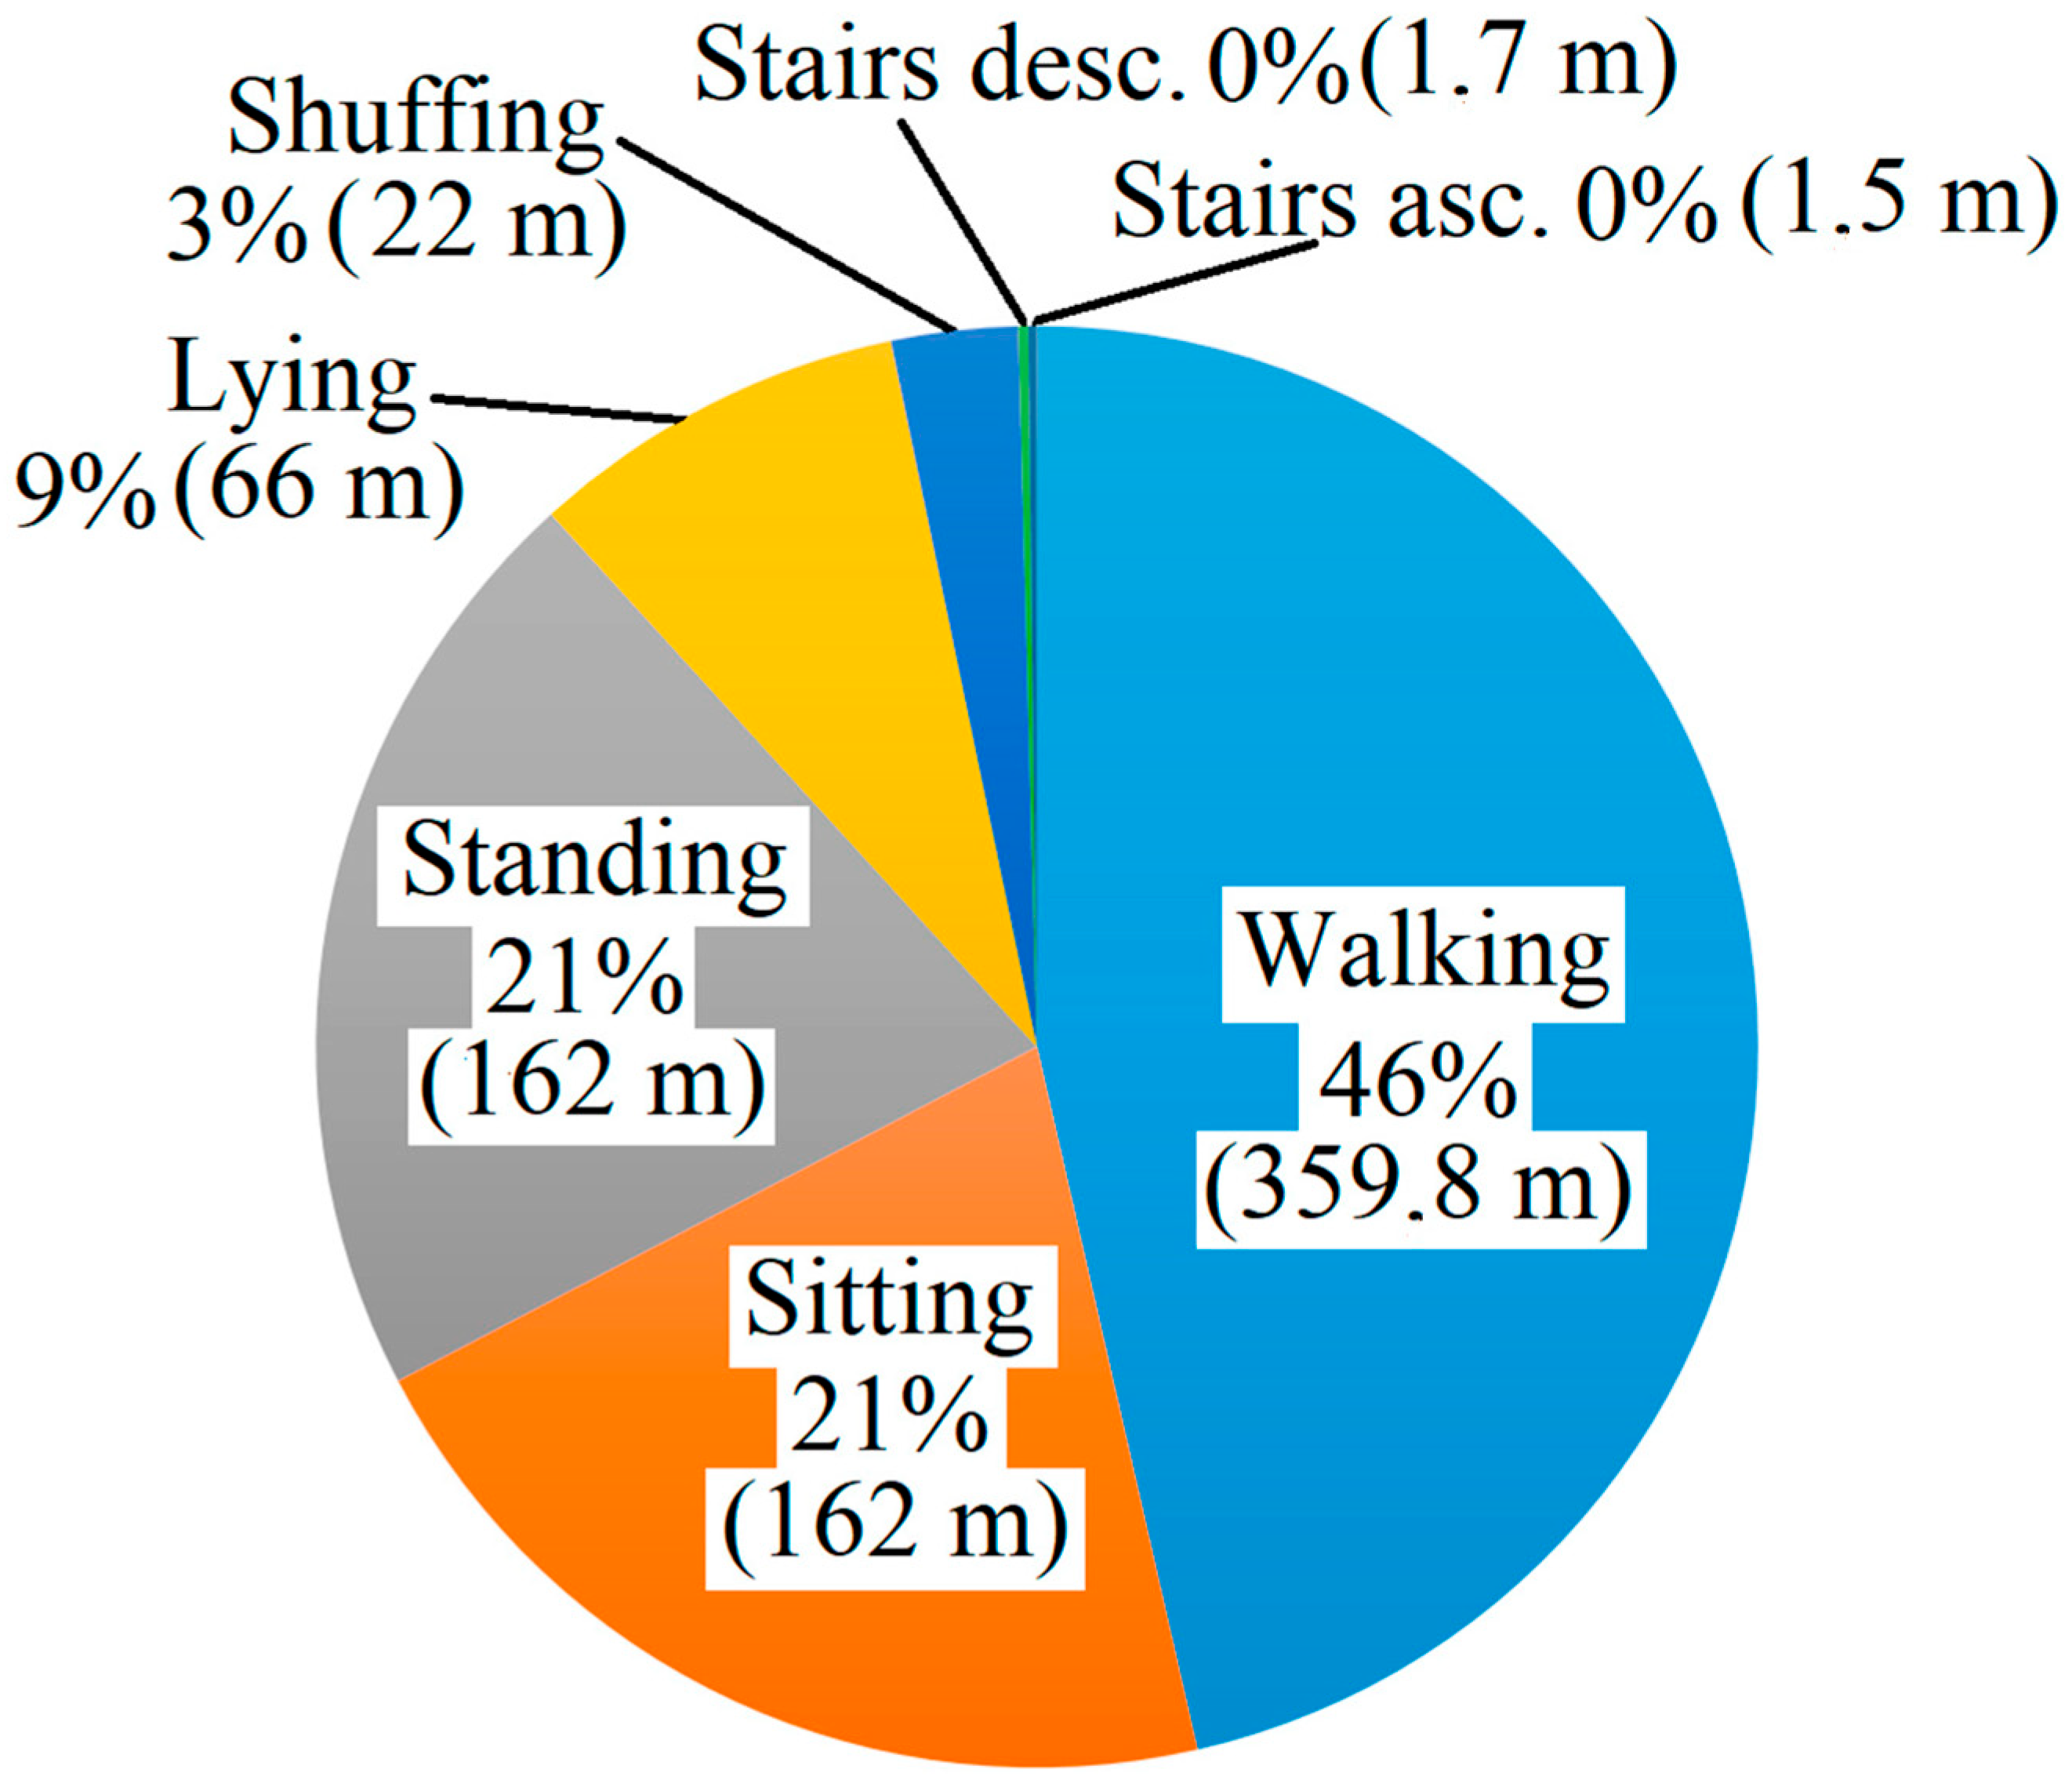
Table 3 outlines the details regarding the participants in this dataset. The percentage representation of the following activities is shown in Figure 4, along with the number of minutes corresponding to each activity recorded for the HAR70+ dataset, focusing on elderly individuals aged 70 and above.
Table 3. Description of HAR70+ dataset.
Figure 4. Percentage of different activities in the HAR70+ dataset.

4.2. Performance Metrics

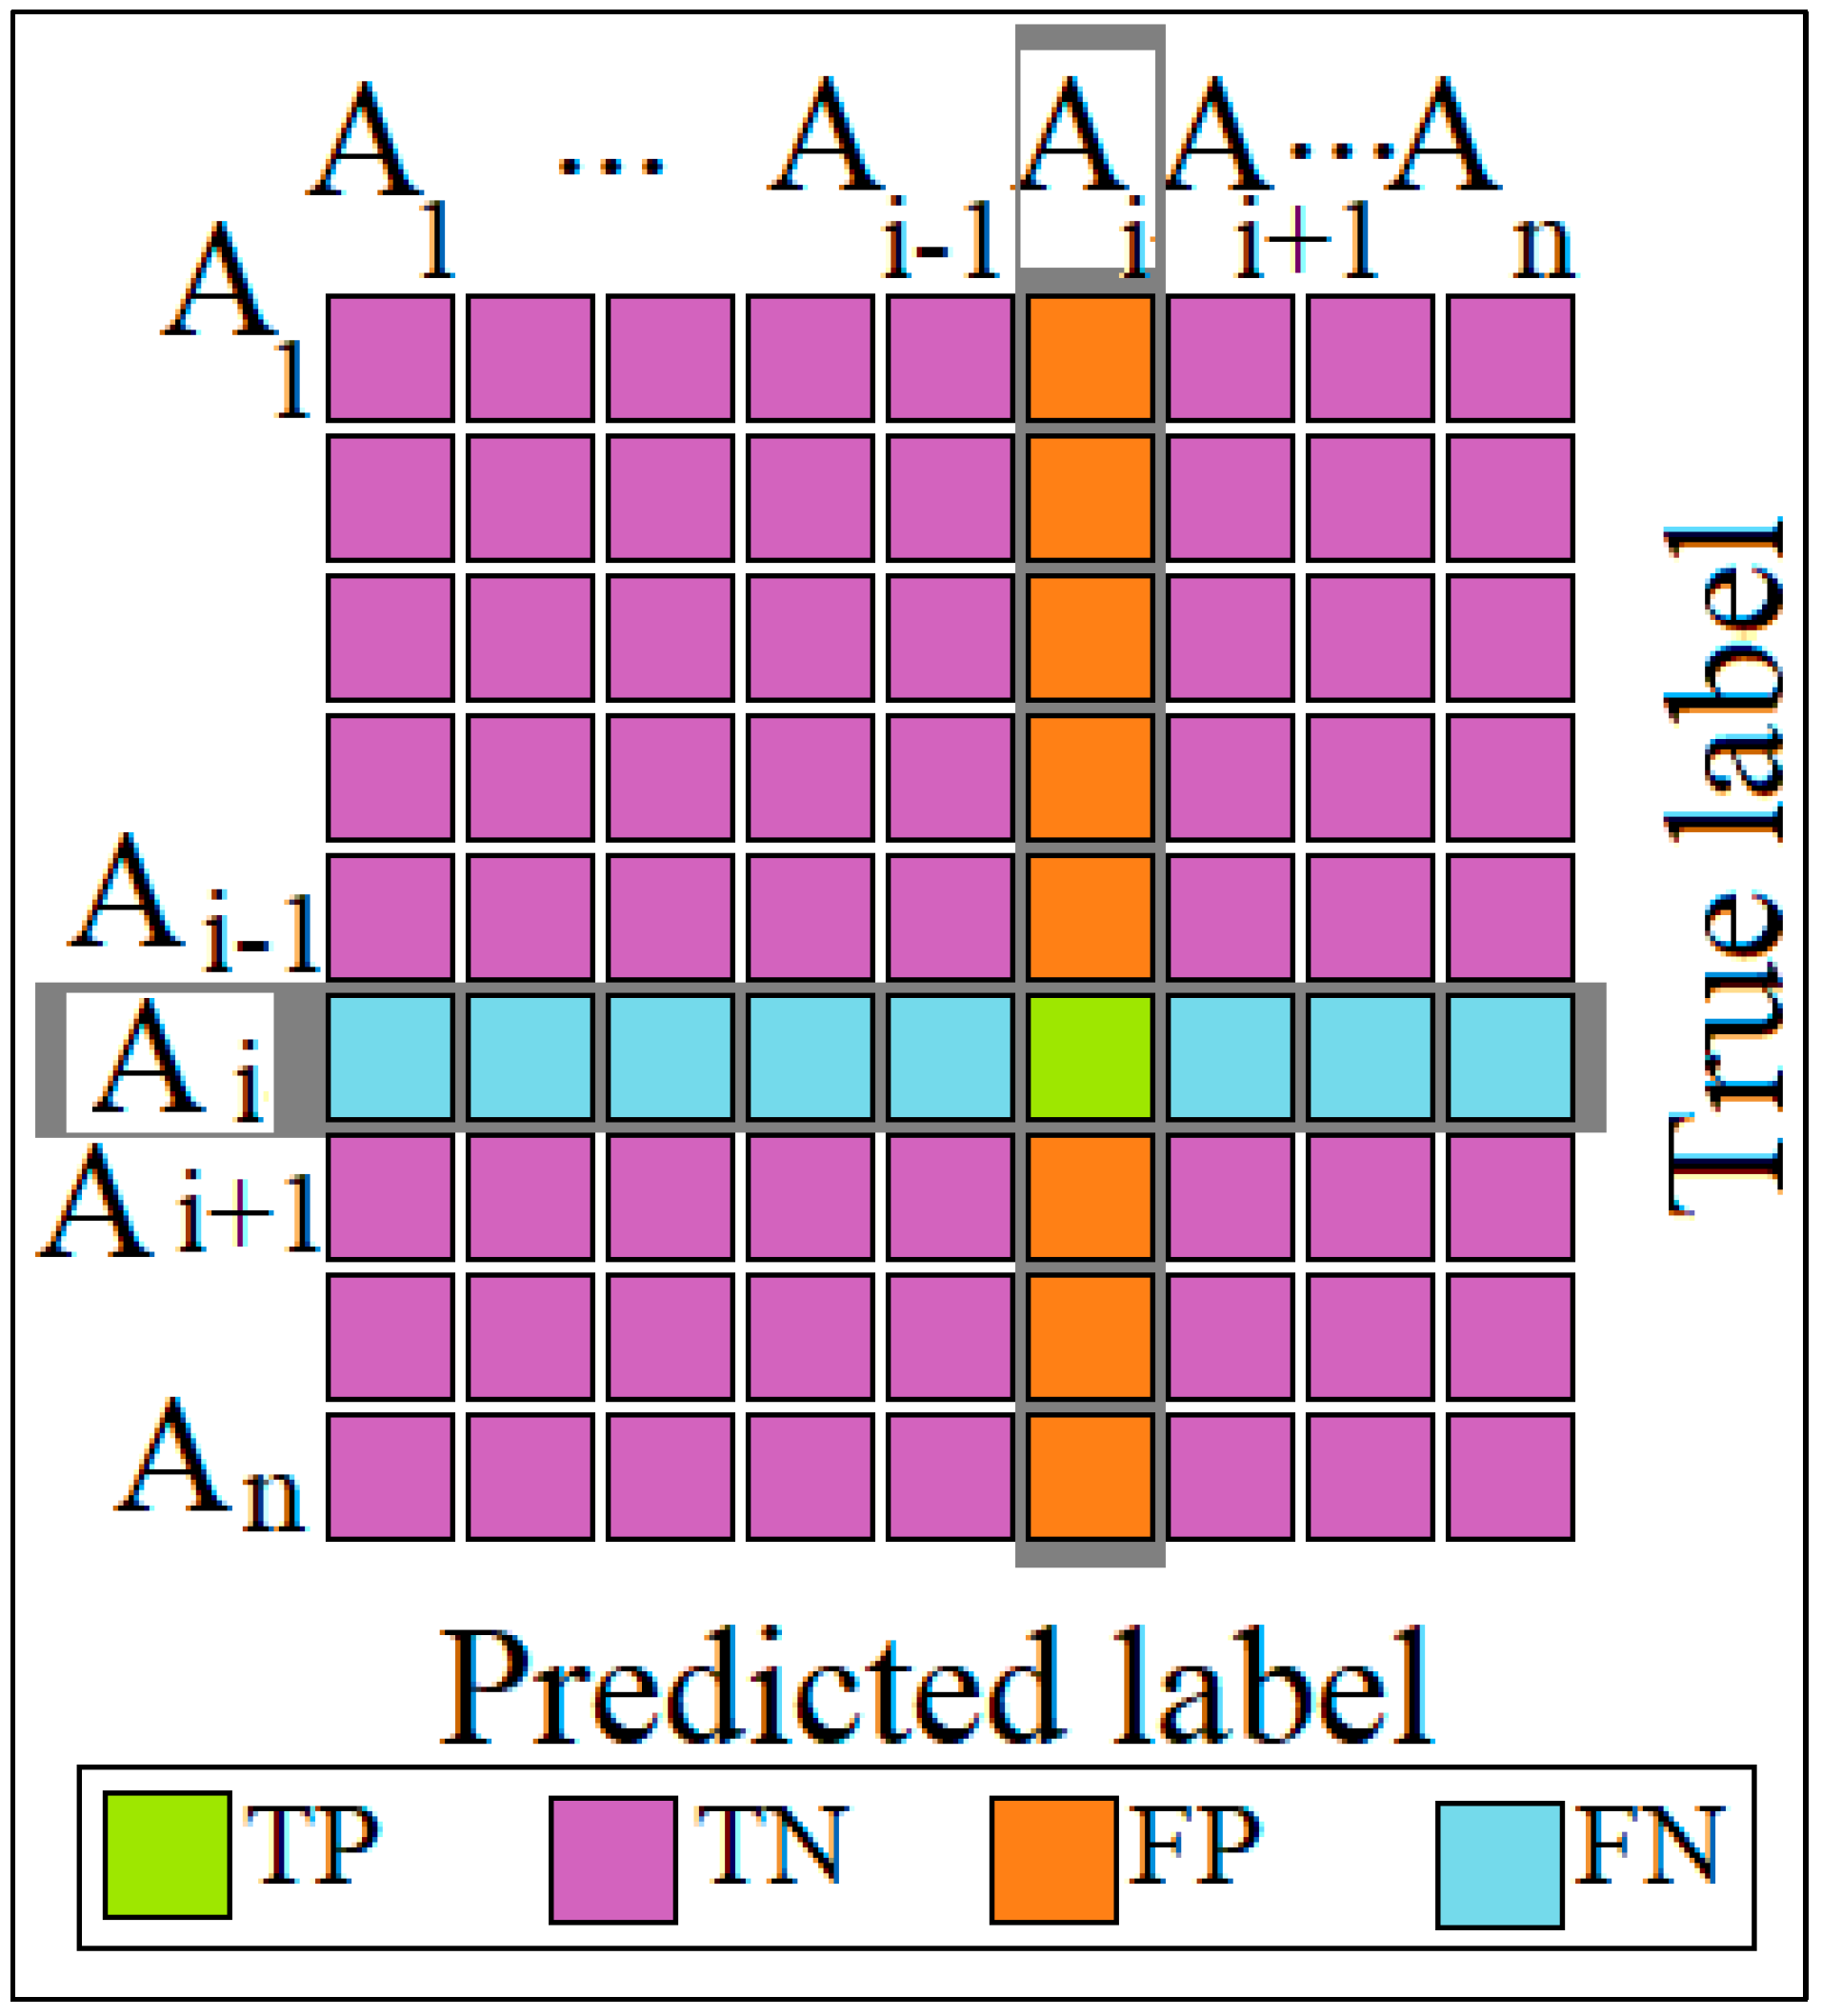
The problem of recognizing activities from multi-class sensory temporal data is based on the use of supervised learning approaches, both in ML and DL. Each piece of datum used to train or test a model must be checked to ensure that it belongs to one of the activity categories, based on its own labeling. To monitor the evolution of learning models during training and testing, we rely on performance measures such as accuracy (3), precision (4), F1-score (5), recall (6), and confusion matrix or CM (Figure 5). All measures used are the most commonly used in the field of HAR, and are calculated using the following four equations:
A c c = i = 1 n T P i   i = 1 n ( T P i + F P i + F N i + T N i )
P r e c e s i o n = i = 1 n P r e c e s i o n i n
F 1 s c o r e = 2 × P r e c e s i o n × R e c a l l P r e c e s i o n + R e c a l l
R e c a l l = i = 1 n P r e c e s i o n i   n
Figure 5. Multi-class confusion matrix representation.
The multi-class CM provides a comprehensive assessment of model performance, identifying specific errors and providing detailed measures for each class. It facilitates optimization and provides a clear visual representation of the results received for further analysis.
For a classification with n activity, the confusion matrix for the ith class (1 ≤ i ≤ n) gives four distinct types of classification result: true positive (TP), true negative (TN), false positive (FP), and false negative (FN), where TP represents the number of samples that actually belong to class Ai and that the model has correctly predicted as belonging to this class. TN represents the number of samples that do not belong to class Ai and that the classifier has correctly predicted as not belonging to this class. FP represents the number of samples that the classifier has wrongly predicted. FN represents the number of samples that actually belong to class Ai but that the model has incorrectly predicted as belonging to another class.

4.3. Experimental Results

The results of the experimental phase on the two HARTH and HAR70+ datasets will be presented in this part, along with a description of each step and the procedures followed to assess and validate our method for categorizing daily physical behavior in geriatric health monitoring. To better test and analyze the performance of our model and other comparative approaches, we limited the activities processed according to two criteria: the quality of the records available in the dataset, improved by retaining only activities representing more than 8% of the data; and the detection of the most frequent daily activities. The experimental details of our implementation and execution of the following different models tested during the experiments:
Platform:Google Colaboratory
Processor model:GPU T4
Frameworks used:Tensorflow Version 2.9.2 and Keras-API
Programming language:Python
Backend:Keras-Sequential with Tensorflow
Phases covered:All
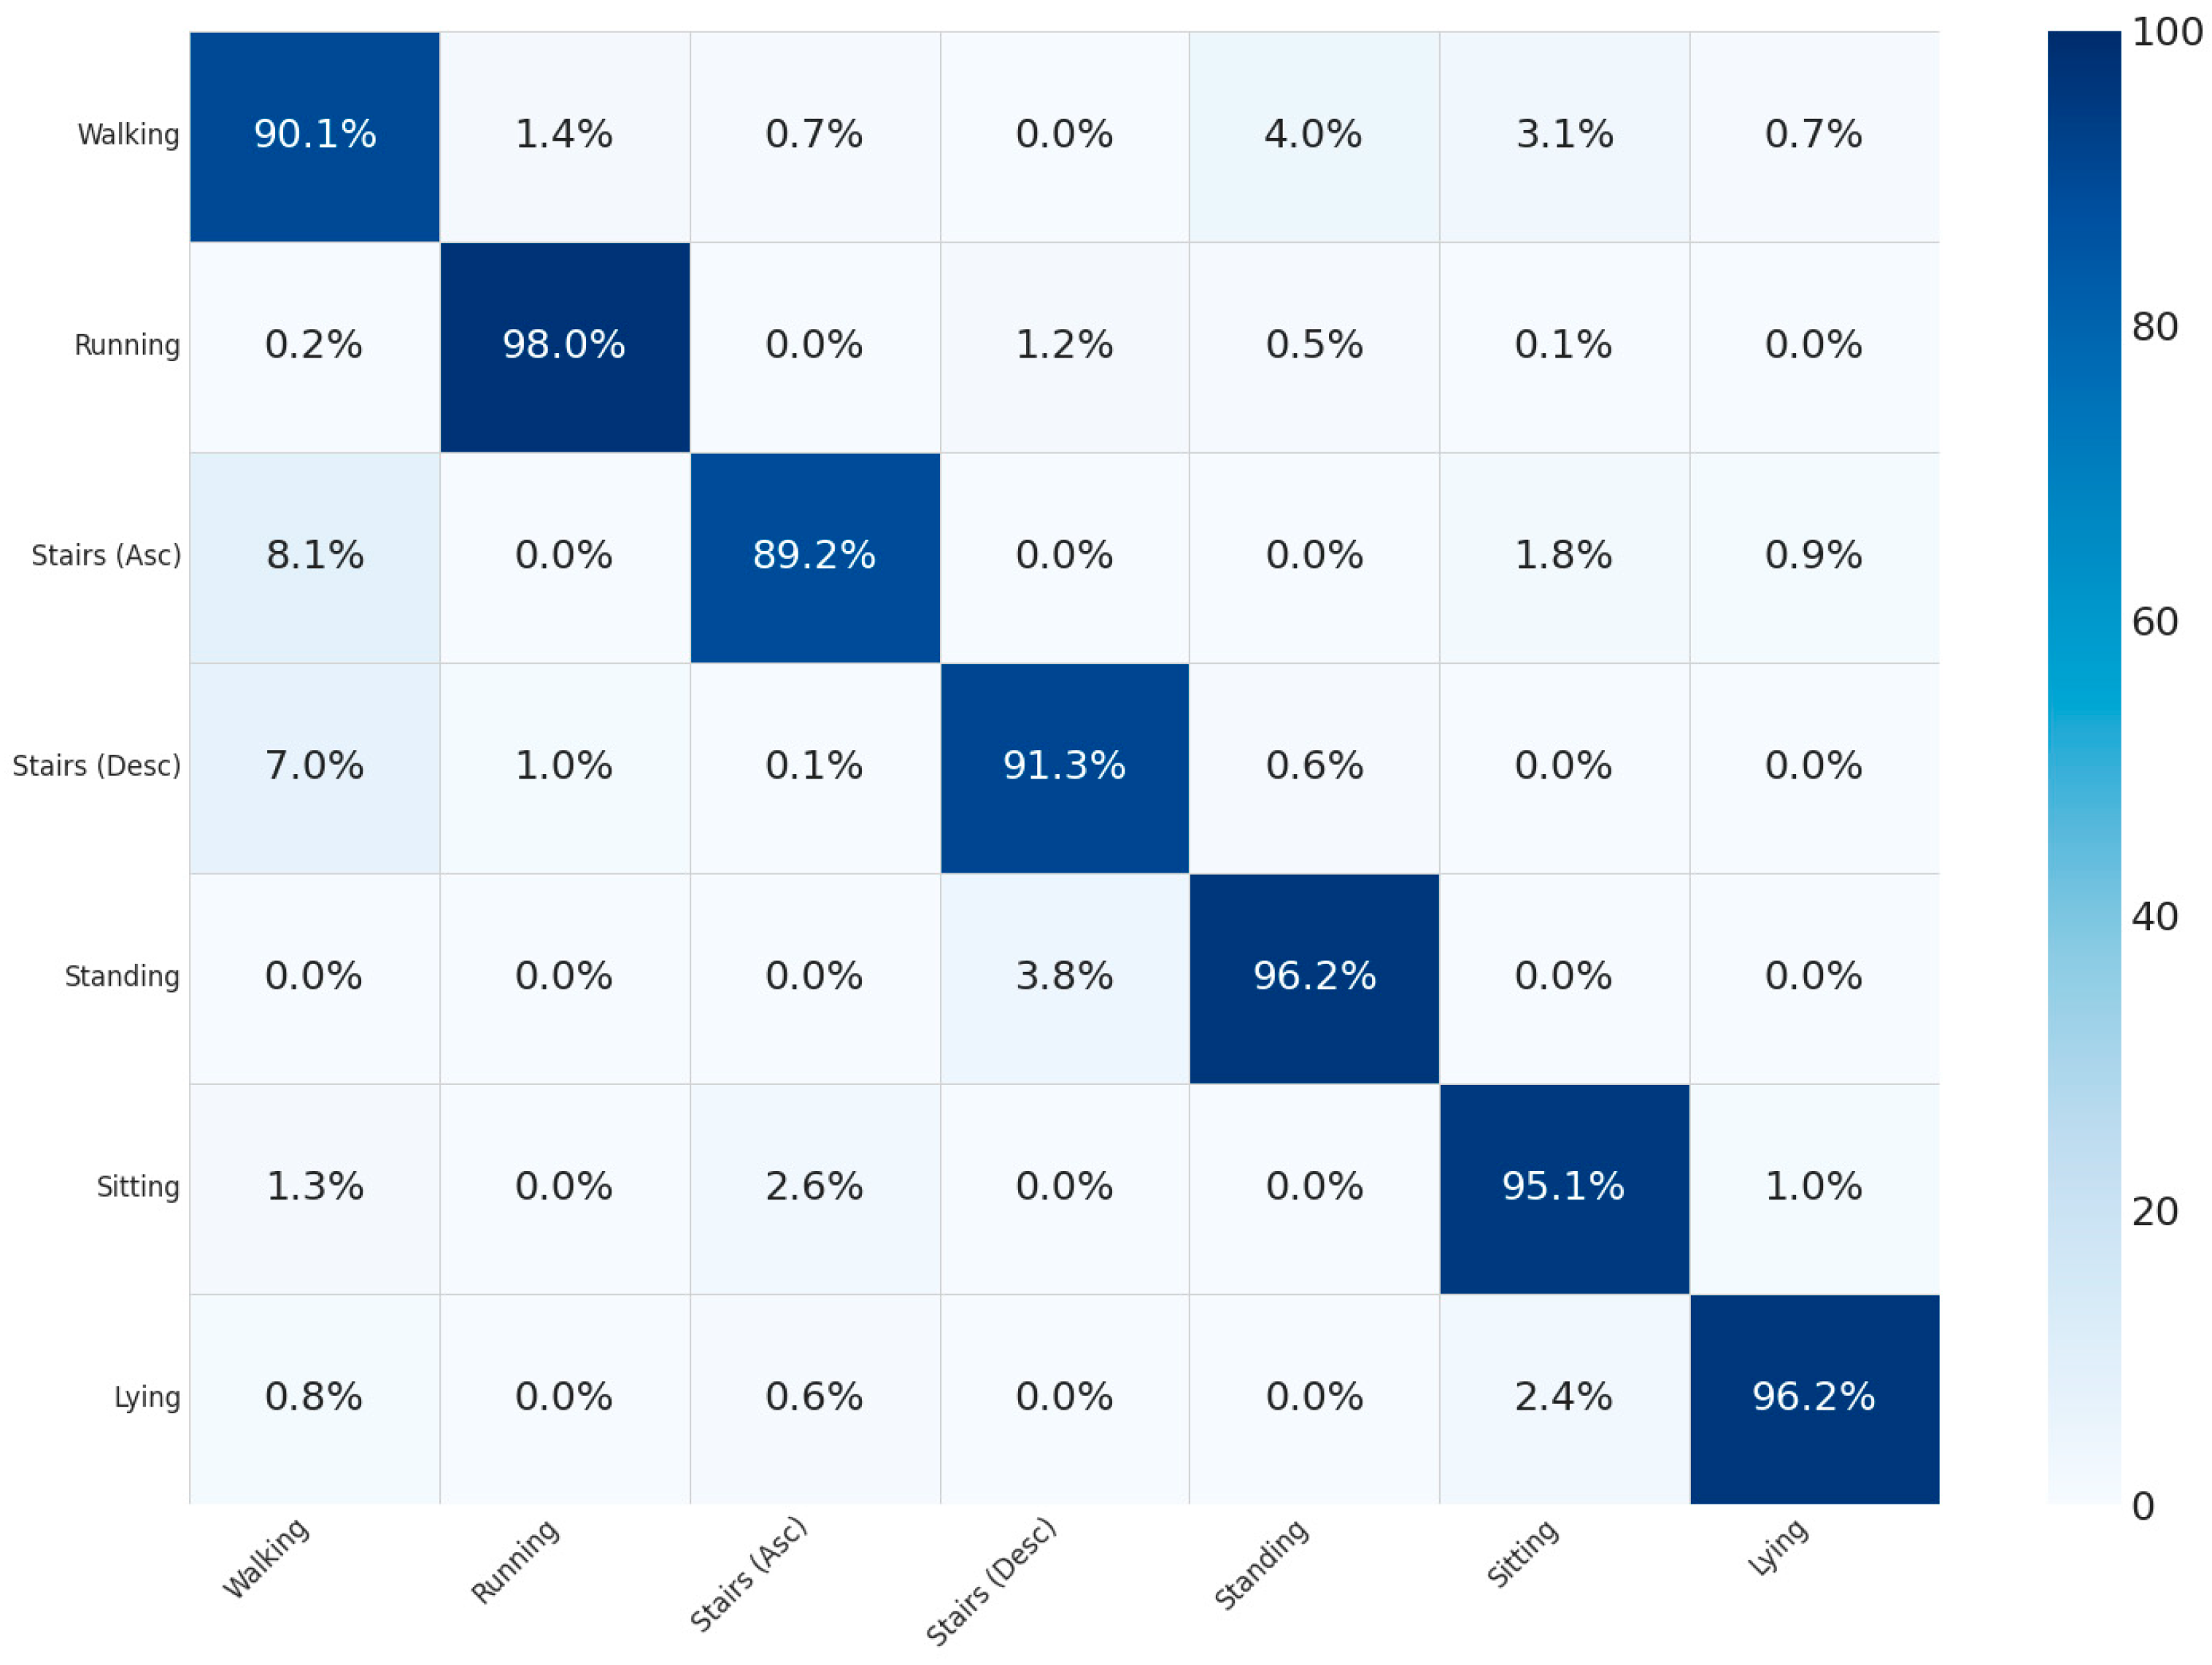
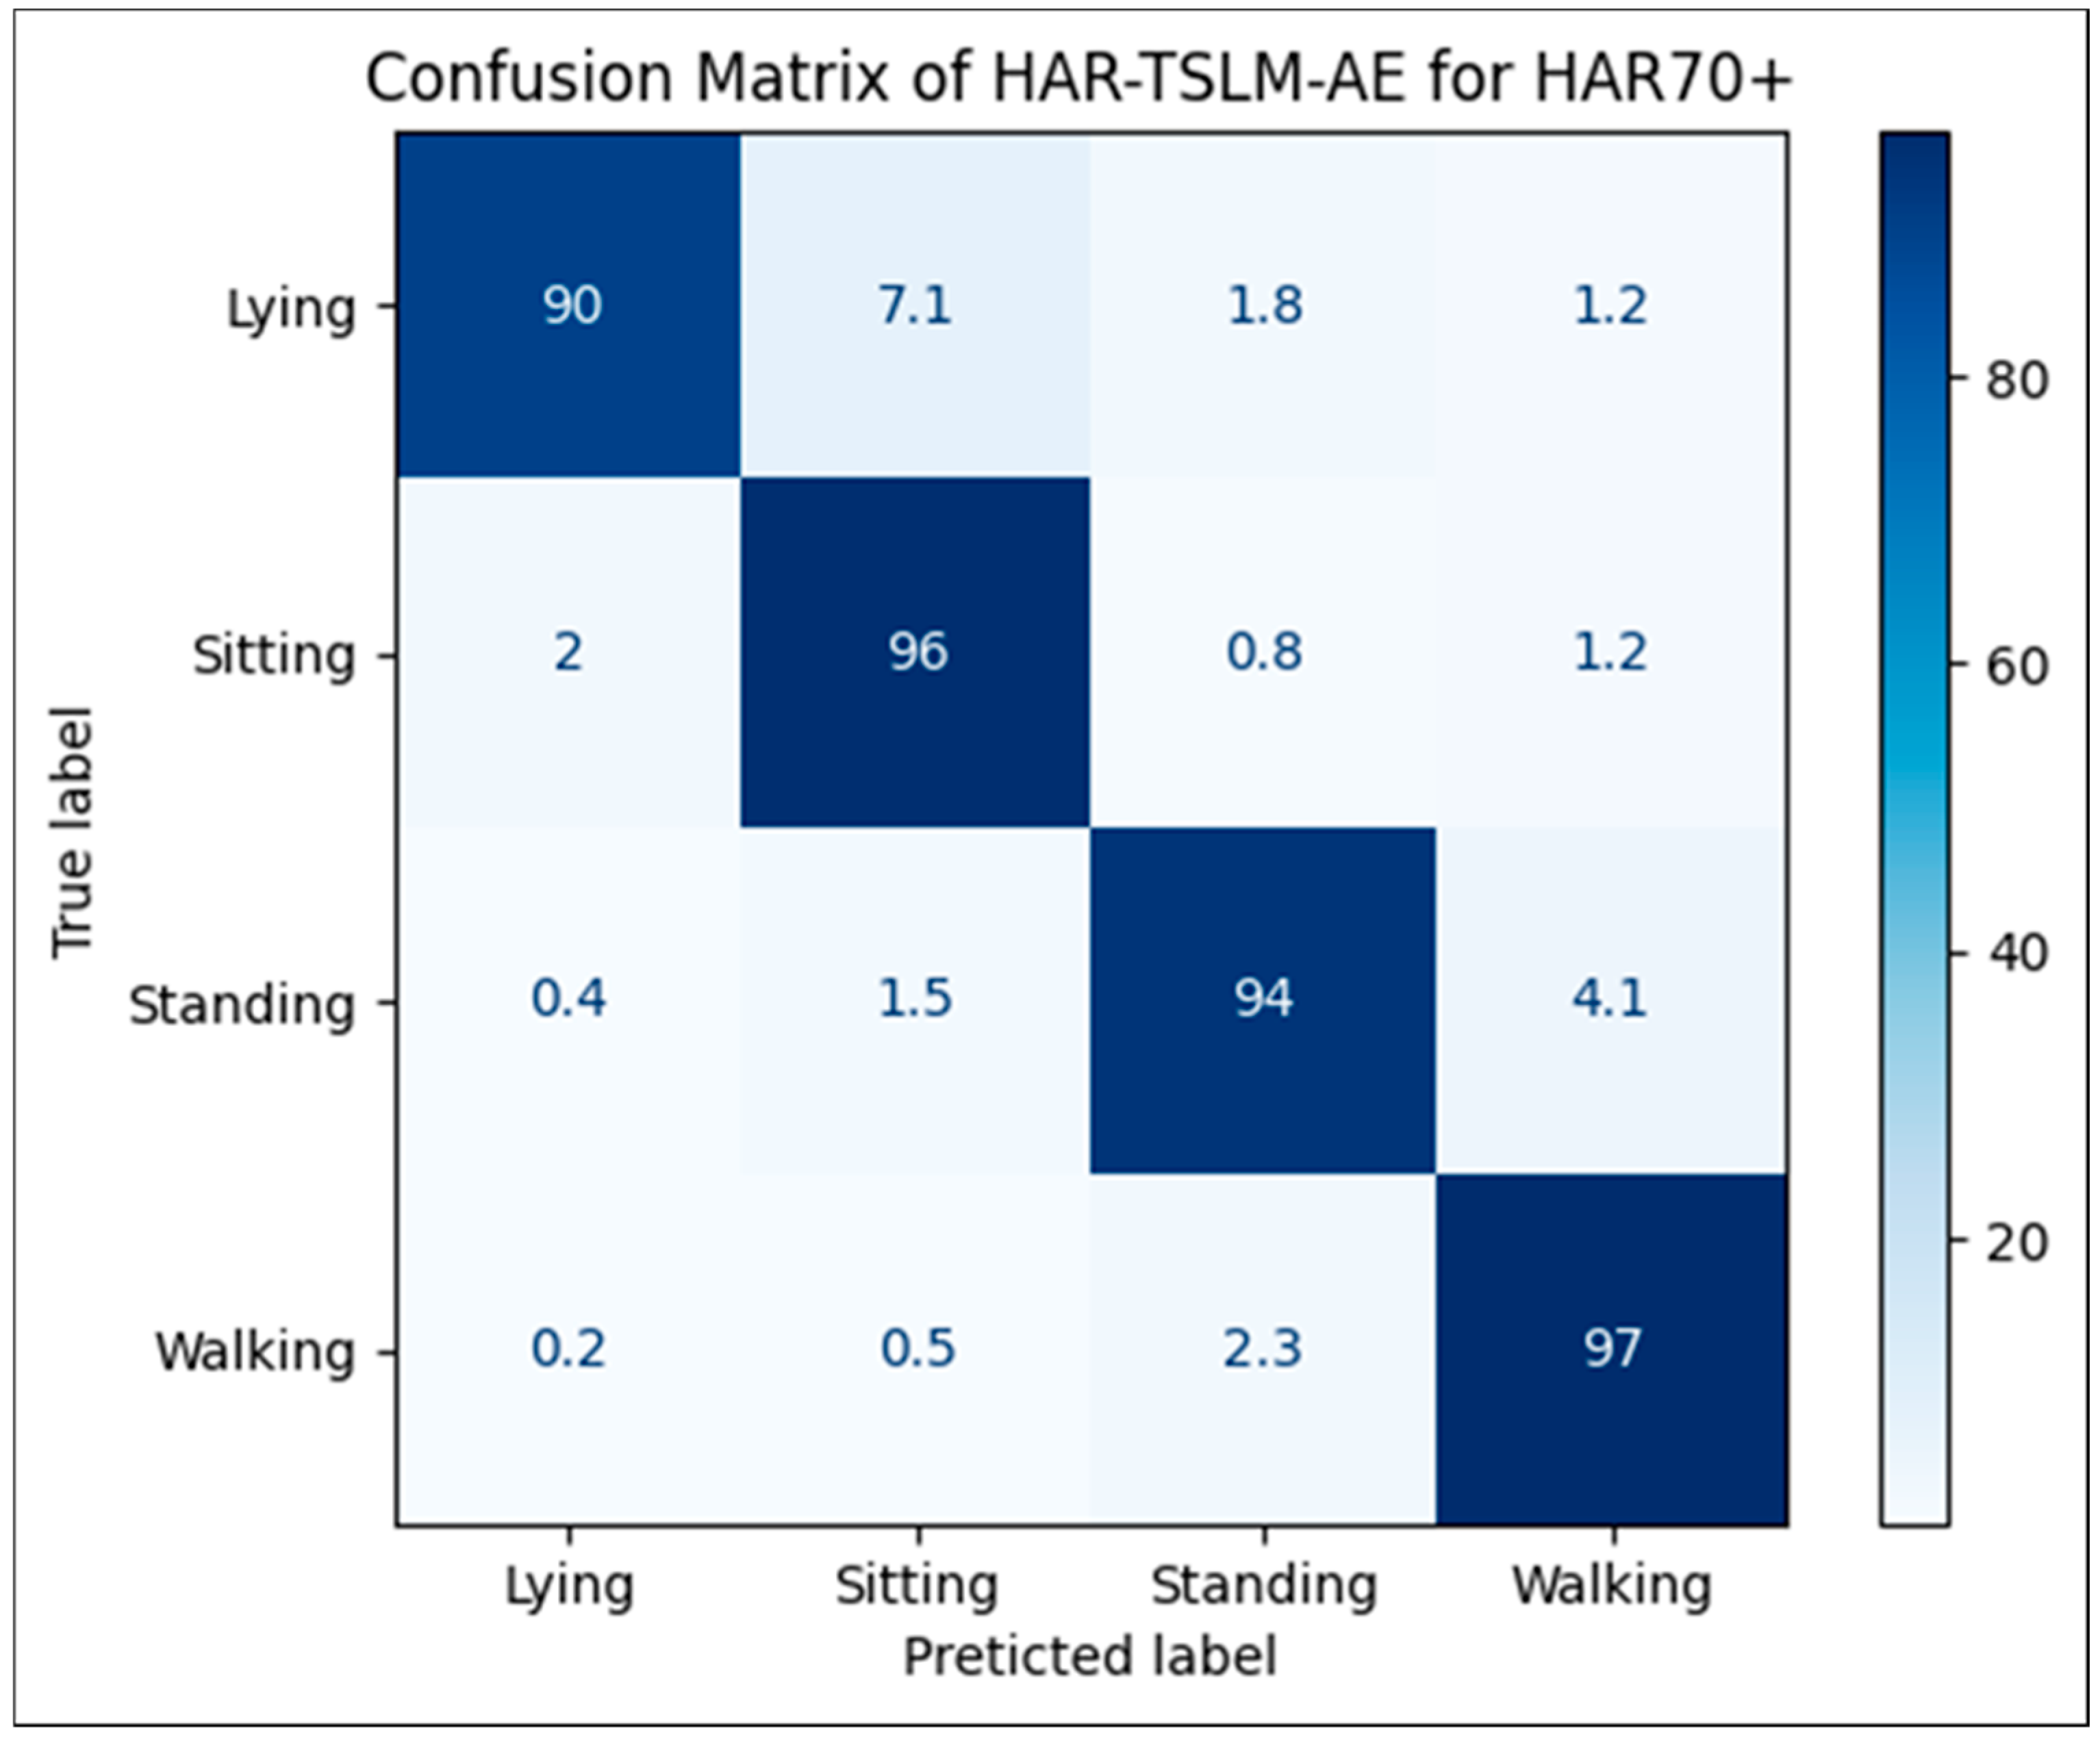
Figure 6 and Figure 7 illustrate the experimental results obtained to evaluate the effectiveness of the implementation of Surv-Sys-Elderly in classifying the behaviors of elderly and sick people in the context of daily surveillance. These figures show the confusion matrices generated when testing our approach on the HARTH and HAR70+ datasets, respectively.
Figure 6. CM of Surv-Sys-Elderly with HARTH test data.
Figure 7. CM of Surv-Sys-Elderly with HAR70+ test data.
In Table 4 and Table 5, we present the performance report of our Surv-Sys-Elderly model for recognizing daily physical behaviors in the context of elderly monitoring. The evaluation is conducted on two distinct datasets: the HARTH dataset, which includes data augmentation (DA), and the HAR70+ dataset, which does not. Performance metrics such as precision, recall, and F1-score are reported to provide a comprehensive assessment of the model’s classification capability across various human activities.
Table 4. The performance of Surv-Sys-Elderly model with HARTH dataset (with DA).
Table 5. The performance of Surv-Sys-Elderly model with HAR70+ dataset.
In Table 4, which uses the augmented HARTH dataset, the model shows high overall performance, particularly for dynamic activities such as running (precision: 97.61%, recall: 98.0%, F1-score: 97.8%) and stair-related activities (stairs asc.: F1-score: 92.34%, stairs desc.: F1-score: 93%). Static activities like standing and sitting also achieve strong F1-scores above 93%, indicating reliable classification. However, walking shows a slightly lower performance (F1-score: 86.8%), potentially due to its overlap with other low-intensity movements. A notable exception is the lying class, which, despite very high precision (97.37%) and recall (96.2%), reports a low F1-score of 69.8%, suggesting an inconsistency or possibly a reporting error, since the F1-score does not match the precision–recall pair.
In Table 5, evaluated on the HAR70+ dataset without augmentation, a slight de-crease in performance is observed. For example, walking and lying show reduced F1-scores (88% and 82%, respectively), and recall for all activities is generally lower than in Table 4. This performance gap highlights the effectiveness of data augmentation in improving the model’s generalization and stability, especially for more ambiguous activities like lying or standing. The lower scores in HAR70+ may also be attributed to demographic and behavioral variations in the elderly participants, which introduce additional complexity. Overall, the comparison confirms that the proposed model performs well across a wide range of activities, with stronger results when trained on augmented and diverse datasets like HARTH. However, further refinement is needed to enhance robustness for static and borderline activities such as lying and walking.
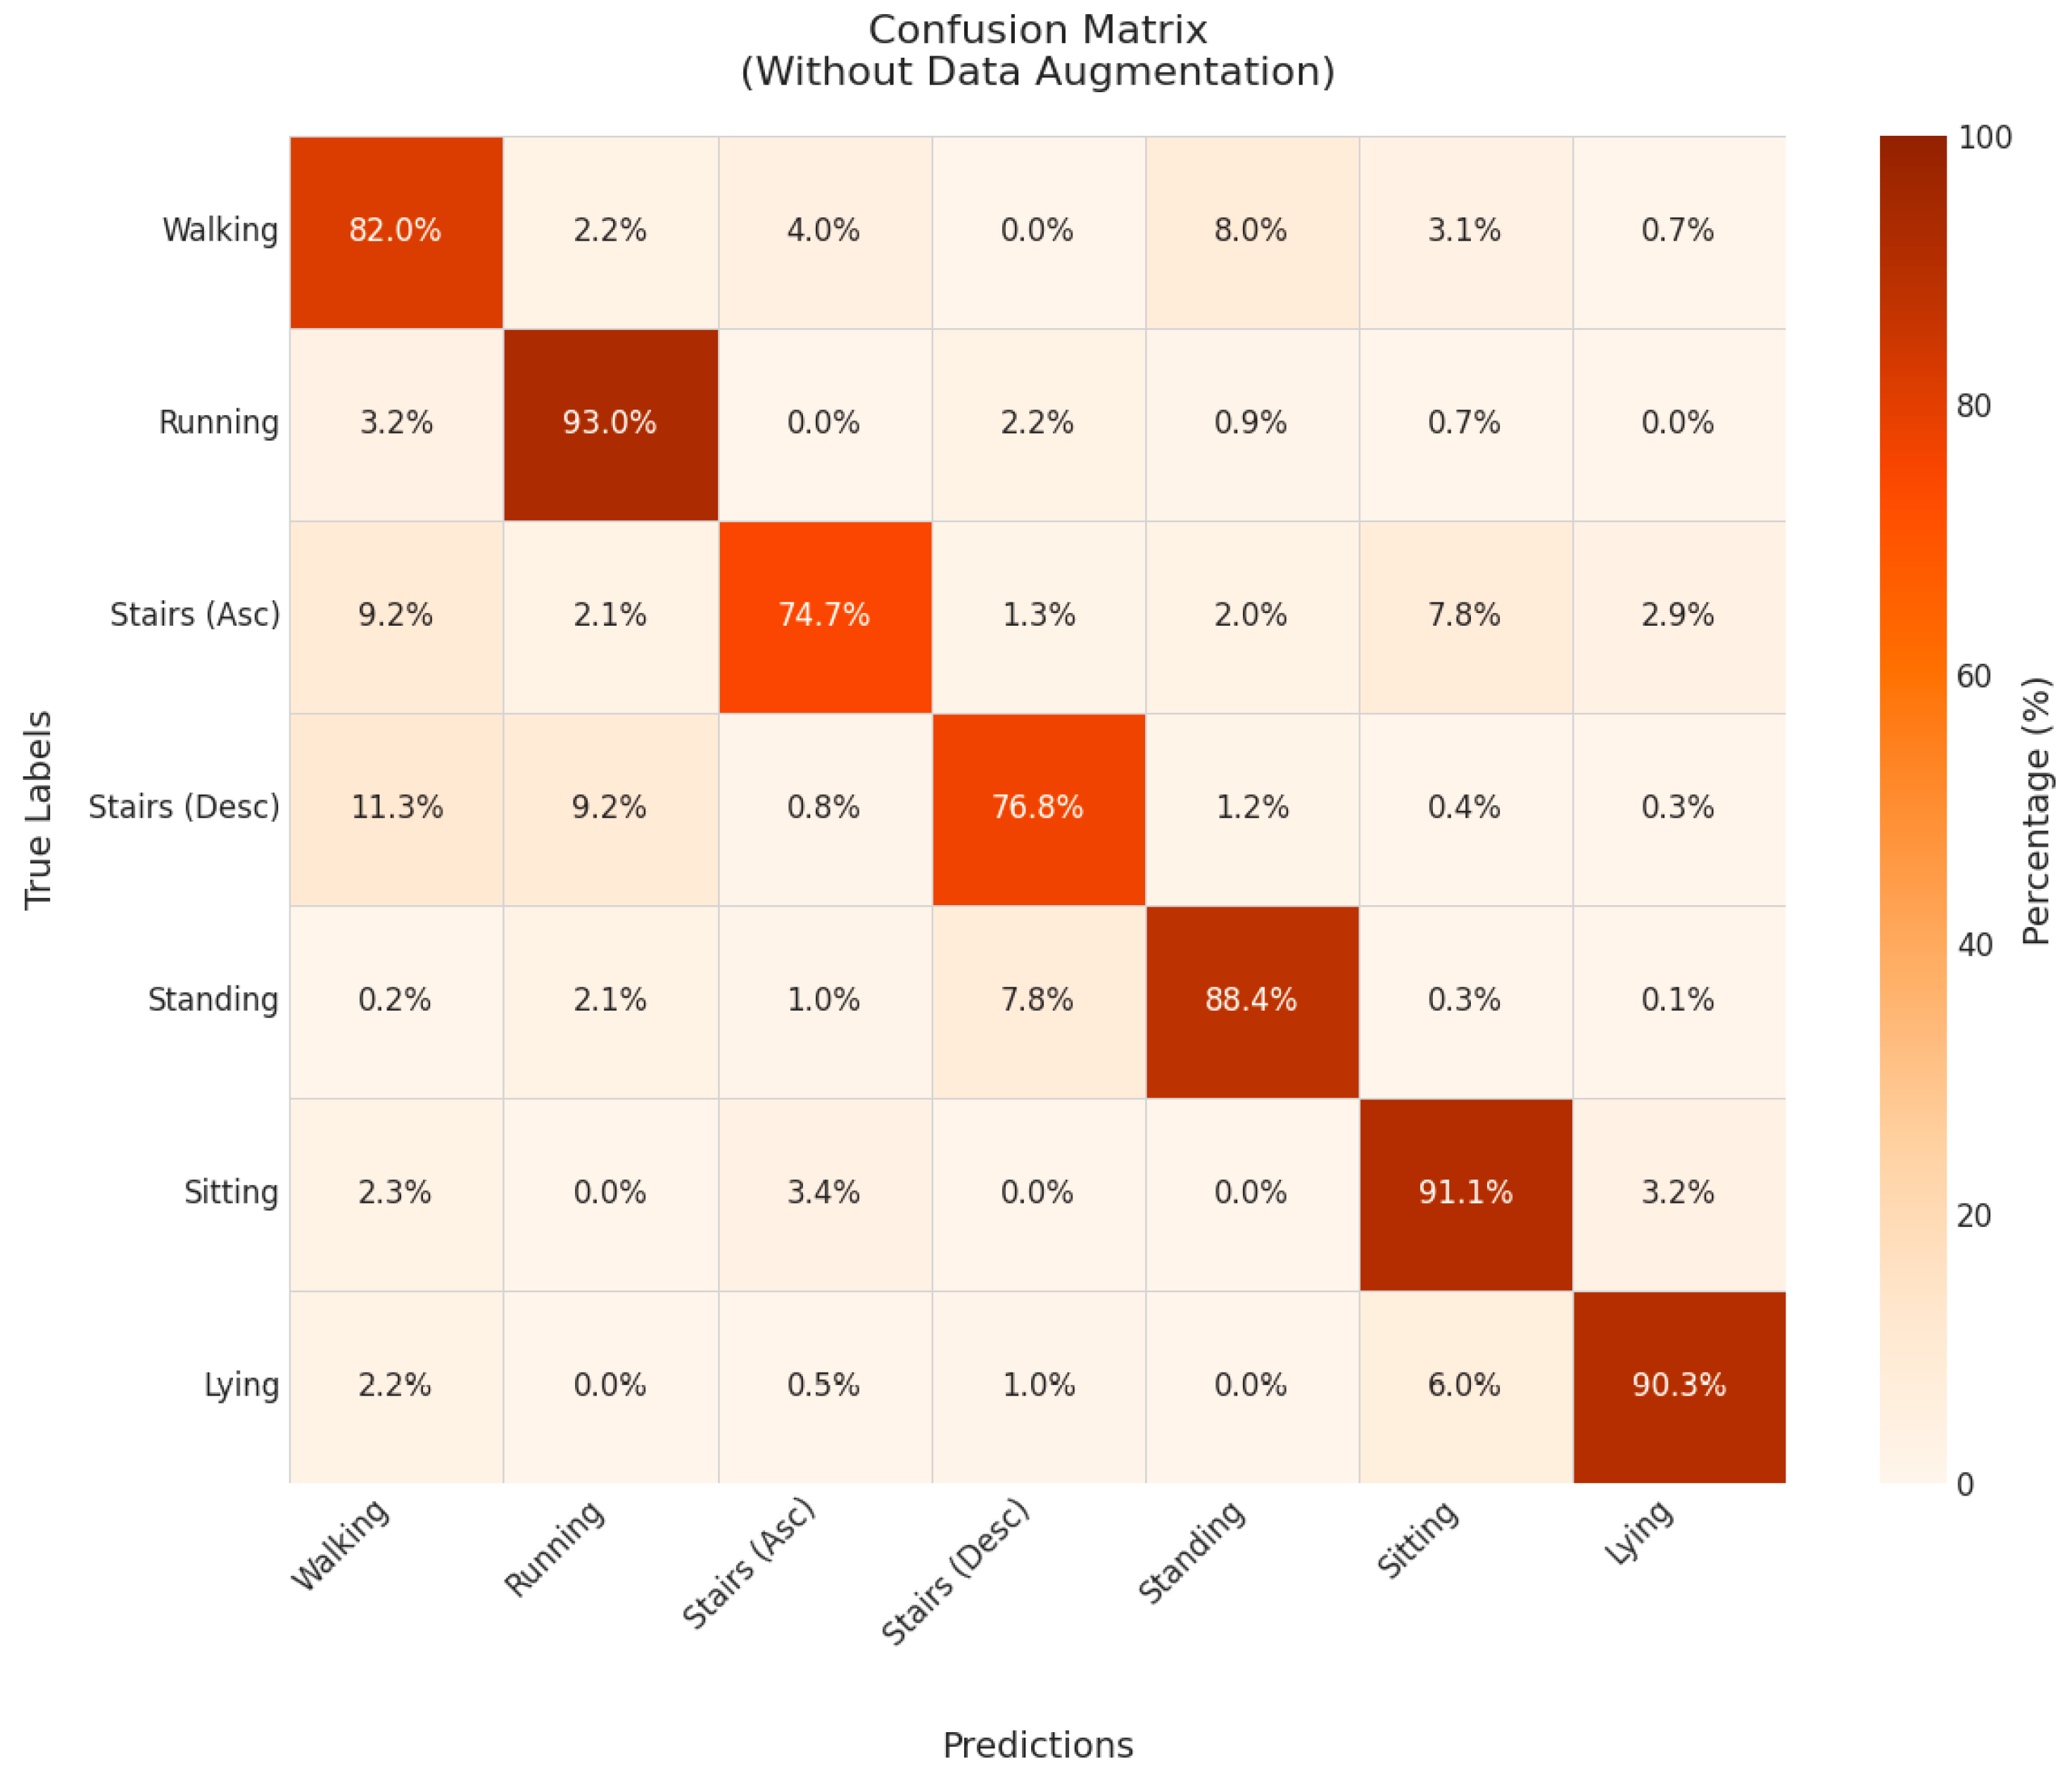
To assess the comparative impact of data augmentation (DA) techniques applied to multidimensional time series, Figure 8 presents the confusion matrix illustrating the results obtained by our model without the application of any augmentation techniques.
Figure 8. CM of Surv-Sys-Elderly on HAR70+ test data without DA techniques.
For a comprehensive comparative analysis of our model’s performance with and without DA techniques, Table 6 provides a detailed evaluation of key metrics:
Table 6. Comparison of classification performance with and without data augmentation.
The quantitative analysis demonstrates that data augmentation techniques yield significant performance improvements across all evaluation metrics, with particularly notable gains for complex activities such as stair ascending (+19.4% relative improvement). Specifically, for dynamic activities, stair-related movements show the highest absolute improvement (+14.5% in precision), and walking classification exhibits a 50% reduction in misclassification with standing postures. For static activities, improvements are consistent though more modest (e.g., +5.9% for lying detection).
These results highlight two key advantages of DA: improved discrimination of complex biomechanical patterns and sustained robustness for static postures. Notably, the underrepresented activities in the imbalanced HARTH dataset (e.g., stair ascending/descending) benefit disproportionately from the combined application of four augmentation techniques, implemented during preprocessing and specifically designed to enrich minority class samples.
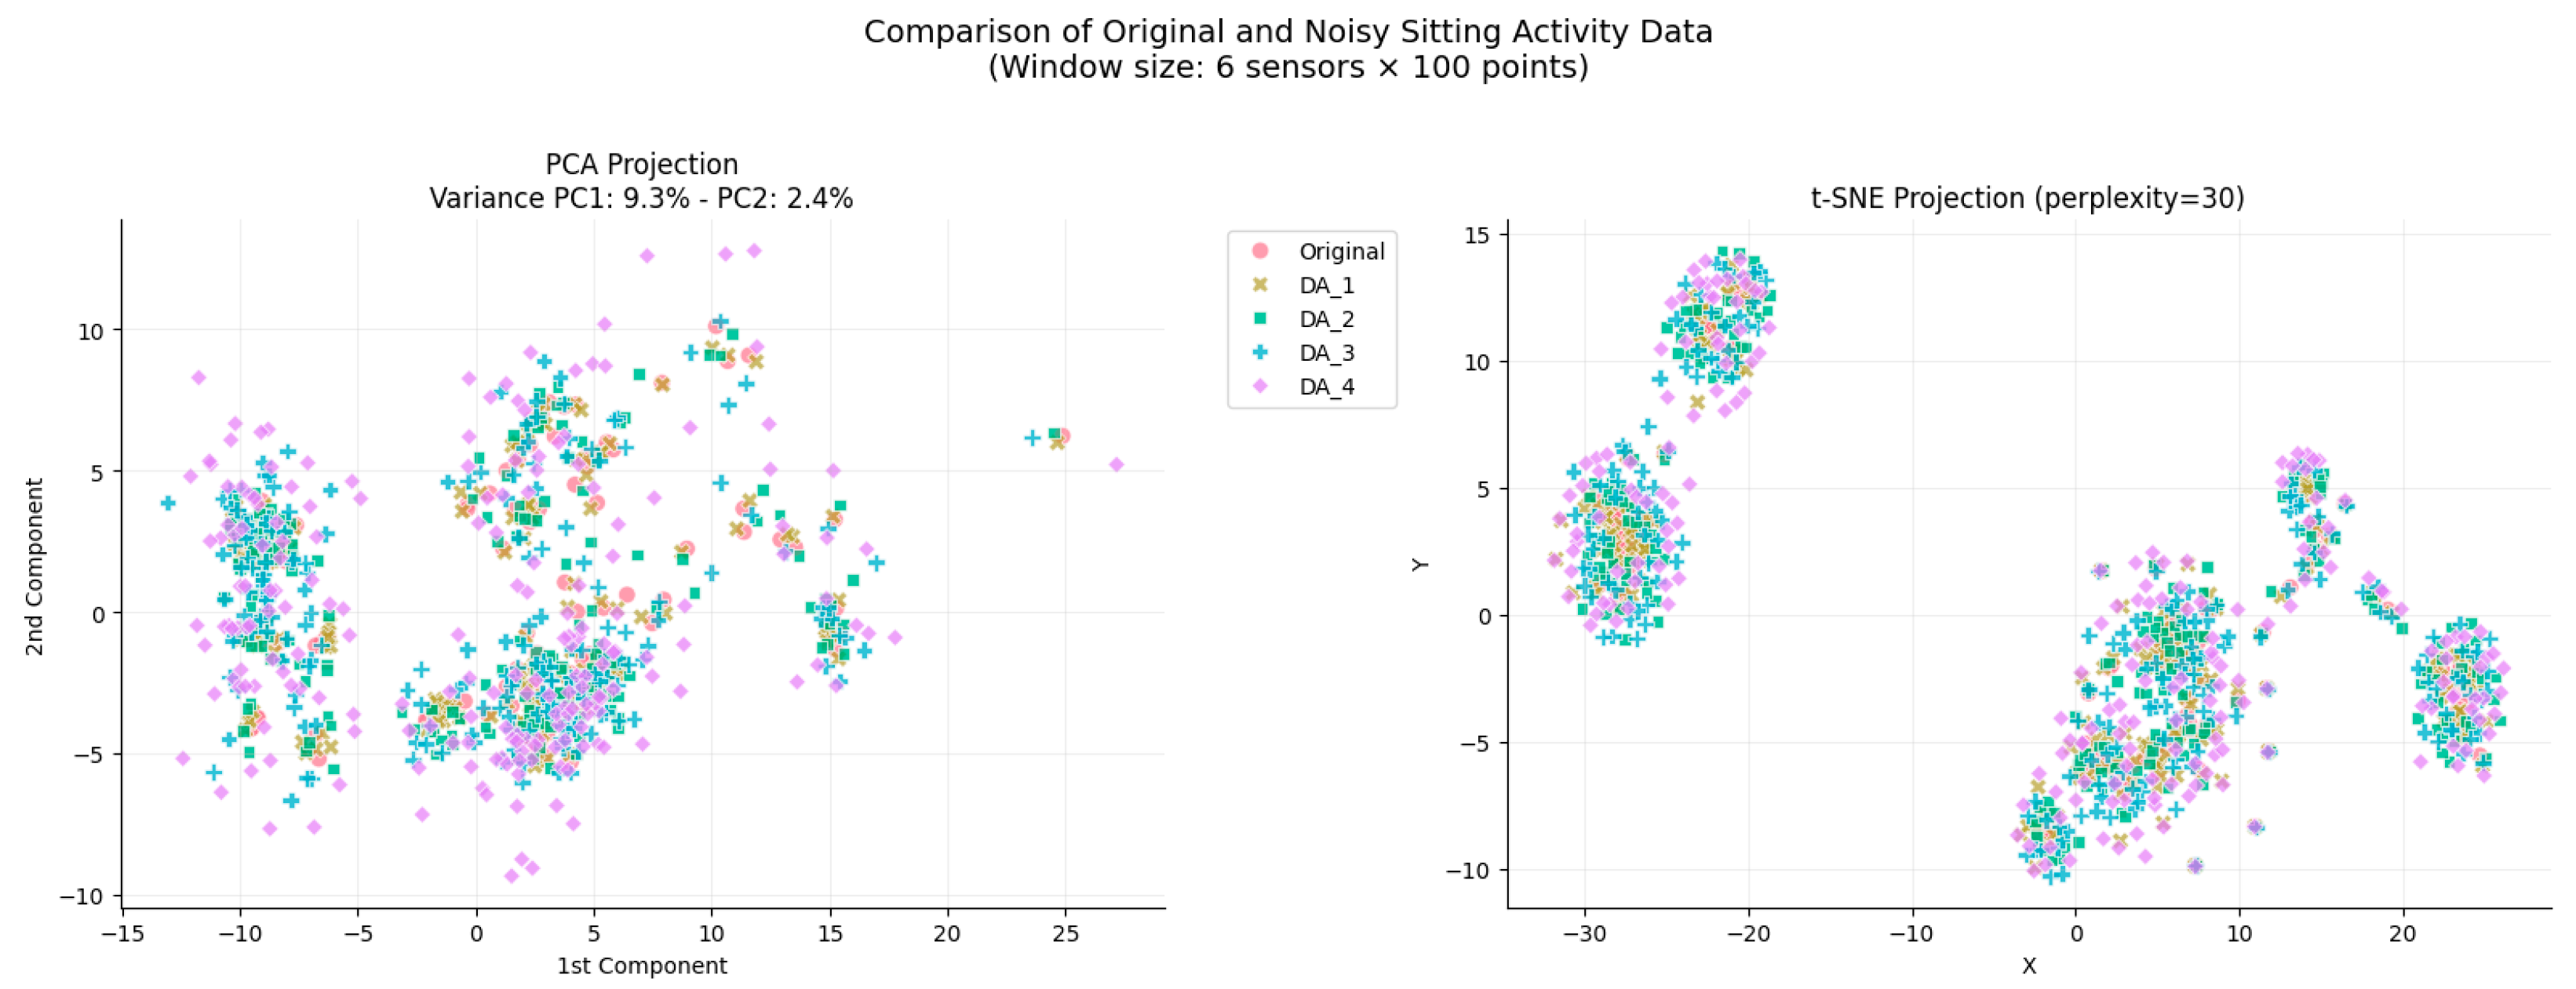
To assess the impact of DA methods, we visualized both original and augmented samples corresponding to the sitting activity using PCA and t-SNE. Although the variance explained by the principal components in PCA is relatively low, the augmented data closely align with the original distribution, indicating a strong preservation of global structure. The t-SNE projection further validates this consistency, revealing comparable local distributions between real and synthetic datasets. These observations suggest that the applied augmentation strategies successfully enhance data diversity while maintaining key discriminative characteristics essential for model performance.
Figure 9 presents the distribution of original and noise-augmented samples for the “sitting” activity using PCA and t-SNE projections. In the PCA space (PC1 = 9.3%, PC2 = 2.4%), although the explained variance remains modest, the augmented datasets (DA_1 to DA_4) exhibit a notable overlap with the original data, suggesting satisfactory preservation of global structural characteristics. The t-SNE visualization (perplexity = 30) further corroborates this finding, with the synthetic samples maintaining strong local consistency and forming clusters that closely mirror the original data. These results indicate that the applied DA techniques introduce useful variability while retaining the discriminative properties essential for downstream learning tasks.
Figure 9. Visualization of original and DA for the “sitting” activity using PCA and t-SNE.
To evaluate the effectiveness and competitiveness of our model, we conducted a comparative analysis against both traditional machine learning methods (SVM and KNN) and advanced deep learning models (LSTM and Deep-Conv-LSTM). Table 7 presents the overall classification accuracy obtained by each model across two benchmark datasets, HARTH and HAR70+. The results clearly show that our model consistently achieves superior performance, reaching 94% accuracy on HARTH and 95% on HAR70+, outperforming all other approaches.
Table 7. Comparison of Classification Accuracy (%) Across Different Models on HARTH and HAR70+ Datasets.
Table 7 also provides a comprehensive comparative analysis demonstrating the superior performance of our model against conventional approaches (SVM [16], KNN [19]) and contemporary deep architectures (Bi-LSTM [30], Deep-Conv-LSTM [34]). Achieving notable accuracy scores of 93.7% on the HARTH dataset and 94.3% on HAR70+, our solution outperforms reference models by a significant margin (3.2 to 8.7 points). This advancement stems from two key innovations: (1) the implementation of personalized identifiers (Id-Ci) encoding individual biomechanical signatures for each activity class and (2) the strategic use of an LSTM-AE autoencoder enabling effective extraction of meaningful temporal patterns and complex dependencies through deep neural architectures. This unique methodological combination provides optimized handling of inter-individual variability while ensuring data quality for subsequent analysis phases.
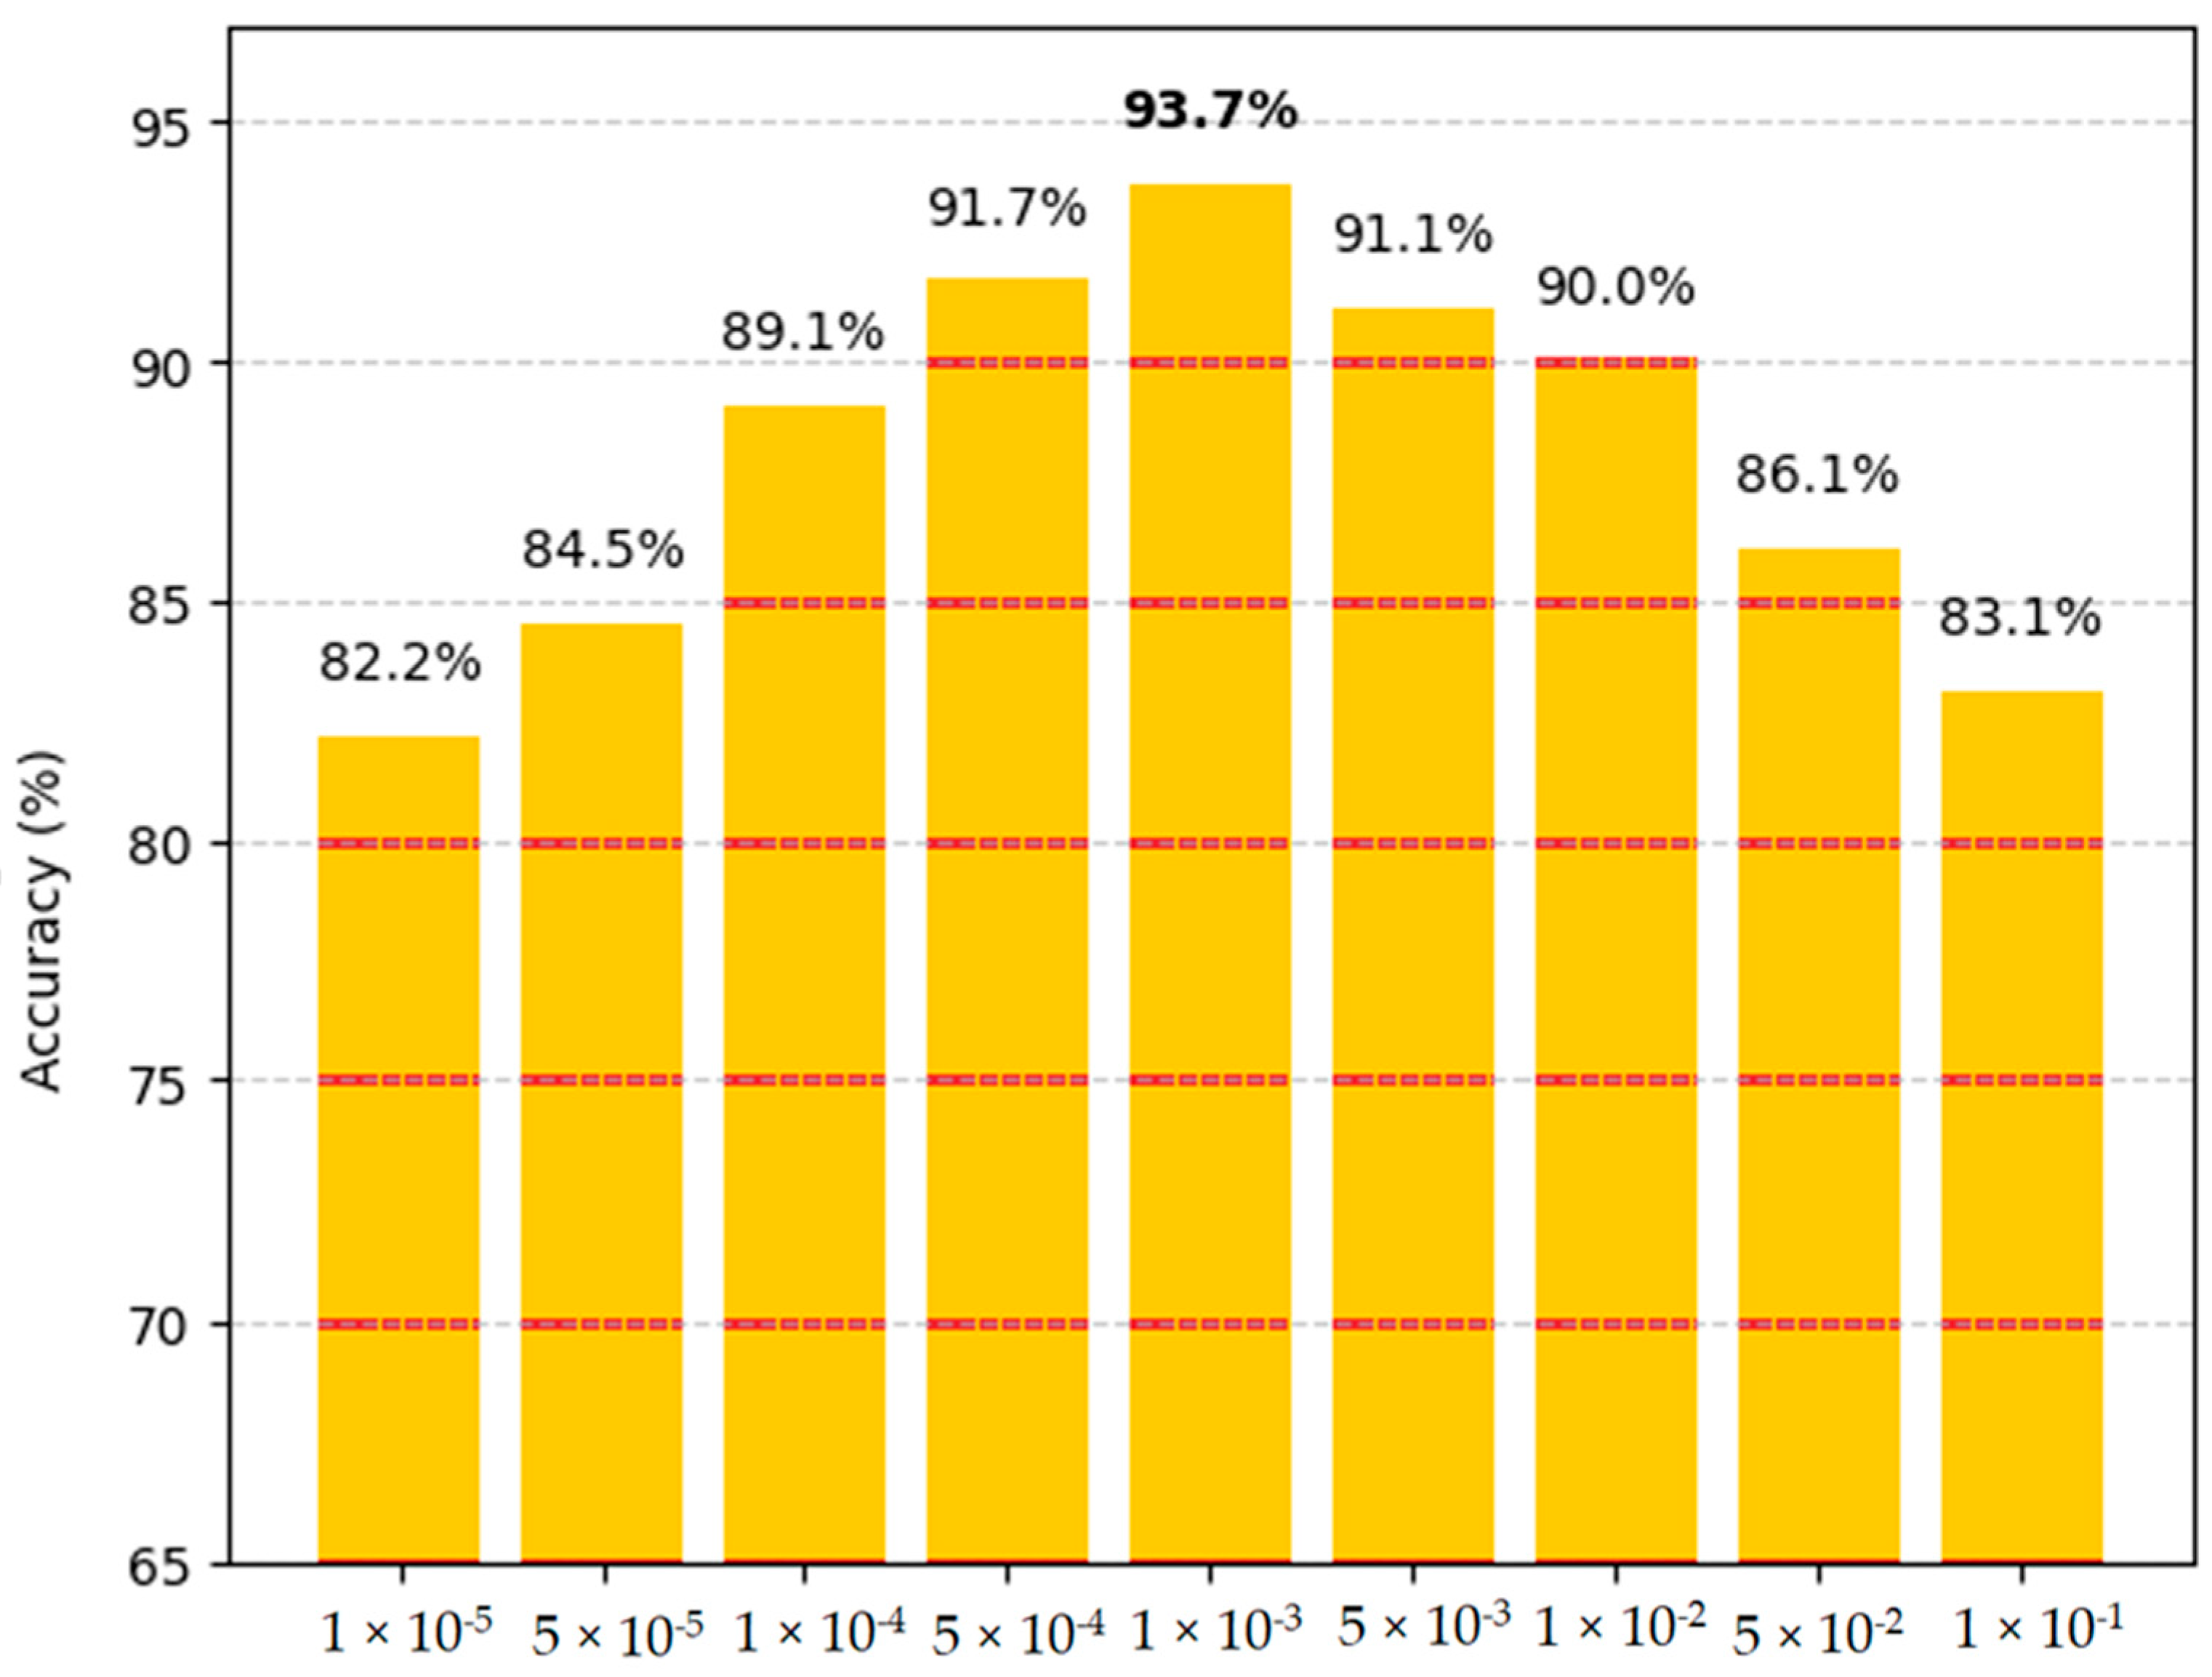
To assess the sensitivity of the model’s performance to the learning rate, a series of experiments were conducted using different learning rate values ranging from 1 × 10⁻¹ to 1 × 10⁻⁵. The goal of this analysis was to determine the optimal value that balances training speed and accuracy. The bar chart below summarizes the model’s accuracy achieved with each learning rate, providing insights into how this hyperparameter influences the learning dynamics and final classification performance.
Figure 10 illustrates the impact of varying learning rates on the model’s classification accuracy. As shown, the model achieves its highest accuracy of 93.7% when trained with a learning rate of 1 × 10⁻³, indicating that this value offers an optimal balance between convergence speed and stability. As the learning rate increases beyond this value, performance declines markedly; for instance, with a learning rate of 1 × 10⁻⁵, the model only achieves 82.2% accuracy, likely due to unstable training and overshooting during optimization. Conversely, reducing the learning rate below the optimal point also leads to a gradual decline in accuracy, reaching 83.1% with 1 × 10⁻¹, which may result from slower convergence and the model becoming trapped in suboptimal minima. Notably, learning rates between 5 × 10⁻³ and 5 × 10⁻¹ yield relatively high and stable accuracies (ranging from 91.7% to 86.1%), but still fall short of the peak observed at 1 × 10⁻². Interestingly, the commonly used learning rate of 1 × 10⁻⁴ achieves a solid 90% accuracy, suggesting that, while it is a safe and effective default, it may not fully exploit the model’s learning capacity in this context. These findings underscore the importance of careful learning rate tuning, as small adjustments can lead to significant variations in performance.
Figure 10. Impact of learning rate tuning on classification accuracy.
This study demonstrates the effectiveness of the Surv-Sys-Elderly model in elderly monitoring, achieving an accuracy exceeding 94%. Its performance outperforms conventional ML and DL models, confirming its suitability for practical healthcare applications. The model adopts a hybrid architecture that combines supervised and unsupervised learning, notably through the integration of an LSTM-based autoencoder, to capture complex temporal and biomechanical features. The use of effective preprocessing techniques, including targeted segmentation, plays a crucial role in improving classification accuracy. Additionally, this study highlights parallels with other successful hybrid approaches in different domains, further supporting the robustness of this methodology. Overall, the proposed multi-phase framework enhances TSC for HAR and establishes a promising foundation for future applications in mobile health and elderly care systems.

5. Conclusions

This study presents Surv-Sys-Elderly, an innovative method tailored and enhanced for sensor-based HAR in the sensitive context of monitoring the elderly. The effectiveness of this approach is evidenced by its superior performance compared with existing state-of-the-art methods, showcasing its capability to effectively analyze sensory data. Experimental results validate the efficacy of Surv-Sys-Elderly against well-established models in the field. By overcoming the challenges of classifying time series and recognizing human activities, our approach has successfully monitored elderly behavior. Given these findings, we recommend further research and development of real-time functionalities to enhance the responsiveness of our approach, particularly in healthcare settings where timely and efficient interventions are critical. One of the main challenges faced during this project was the search for reliable public datasets. While numerous databases are available online, identifying those that meet our specific criteria for quality and relevance can be challenging. Additionally, access to private data is often restricted, necessitating collaboration with institutions. To address these issues, we have decided to create a dataset that encompasses various types of activities in different environments, such as hospitals and homes. The goal of this future project is to provide a comprehensive and diverse database that will aid in the development of effective models, including those discussed in this article. Furthermore, our future research will explore the applicability of this approach in financial markets and other healthcare sectors, including the preventive diagnosis of chronic neurological disorders such as Parkinson’s disease.

Author Contributions

Conceptualization, Y.E. and A.K.; Methodology, Y.E., A.K., and Y.D.; Writing—original draft preparation, Y.E. and M.B.; Writing—review and editing, Y.E. and A.K.; Visualization, Y.E., Y.D., and A.K.; Supervision, Y.D. and A.K. All authors have read and agreed to the published version of the manuscript.

Funding

This research received no external funding.

Institutional Review Board Statement

Not applicable.

Data Availability Statement

No new data were created or analyzed in this study. Data sharing is not applicable to this article.

Conflicts of Interest

The authors declare no conflict of interest.

Abbreviations

ADLActivities of Daily Living
CNNConvolutional Neural Network
DAData Augmentation
DNNDeep Neural Network
DLDeep Learning
GRUGate Recurrent Unit
HARHuman Activity Recognition
KNNK-Nearest Neighbors
LSTMLong Short-Term Memory
MLMachine Learning
RNNRecurrent Neural Network
SVMSupport Vector Machine
TSCTime Series Classification

References

  1. Karim, M.; Khalid, S.; Aleryani, A.; Khan, J.; Ullah, I.; Ali, Z. Human Action Recognition Systems: A Review of the Trends and State-of-the-Art. IEEE Access 2024, 12, 36372–36390. [Google Scholar] [CrossRef] [Scilit]
  2. Zhang, S.; Li, Y.; Zhang, S.; Shahabi, F.; Xia, S.; Deng, Y.; Alshurafa, N. Deep learning in human activity recognition with wearable sensors: A review on advances. Sensors 2022, 22, 1476. [Google Scholar] [CrossRef] [Scilit]
  3. Gammulle, H.; Ahmedt-Aristizabal, D.; Denman, S.; Tychsen-Smith, L.; Petersson, L.; Fookes, C. Continuous human action recognition for human-machine interaction: A review. ACM Comput. Surv. 2023, 55, 1–38. [Google Scholar] [CrossRef] [Scilit]
  4. Bobbò, L.; Vellasco, M.M.B.R. Human activity recognition (HAR) in healthcare. Appl. Sci. 2023, 13, 13009. [Google Scholar] [CrossRef] [Scilit]
  5. Schrader, L.; Vargas Toro, A.; Konietzny, S.; Rüping, S.; Schäpers, B.; Steinböck, M.; Krewer, C.; Müller, F.; Güttler, J.; Bock, T. Advanced Sensing and Human Activity Recognition in Early Intervention and Rehabilitation of Elderly People. Popul. Ageing 2020, 13, 139–165. [Google Scholar] [CrossRef] [Scilit]
  6. Keskinoğlu, C.; Aydin, A. Full Wireless Goniometer Design with Activity Recognition for Upper and Lower Limb. Microprocess. Microsyst. 2024, 109, 105086. [Google Scholar] [CrossRef] [Scilit]
  7. Sullivan, A.N.; Lachman, M.E. Behavior Change with Fitness Technology in Sedentary Adults: A Review of the Evidence for Increasing Physical Activity. Front. Public Health 2017, 4, 289. [Google Scholar] [CrossRef] [Scilit]
  8. Ingle, M.; Sharma, M.; Kumar, K.; Kumar, P.; Bhurane, A.; Elphick, H.; Joshi, D.; Acharya, U.R. A Systematic Review on Automatic Identification of Insomnia. Physiol. Meas. 2024, 45, 03TR01. [Google Scholar] [CrossRef] [Scilit]
  9. Papel, J.F.; Munaka, T. Abnormal Behavior Detection in Activities of Daily Living: An Ontology with a New Perspective on Potential Indicators of Early Stages of Dementia Diagnosis. In Proceedings of the 2023 IEEE 13th International Conference on Consumer Electronics—Berlin (ICCE-Berlin), Berlin, Germany, 3–5 September 2023; pp. 210–215. [Google Scholar]
  10. World Health Organization. Mental Health of Older Adults. Available online: https://www.who.int/news-room/fact-sheets/detail/mental-health-of-older-adults (accessed on 20 December 2023).
  11. Lentzas, A.; Vrakas, D. Non-Intrusive Human Activity Recognition and Abnormal Behavior Detection on Elderly People: A Review. Artif. Intell. Rev. 2020, 53, 1975–2021. [Google Scholar] [CrossRef] [Scilit]
  12. Chen, K.; Zhang, D.; Yao, L.; Guo, B.; Yu, Z.; Liu, Y. Deep Learning for Sensor-Based Human Activity Recognition: Overview, Challenges, and Opportunities. ACM Comput. Surv. 2021, 54, 1–40. [Google Scholar] [CrossRef] [Scilit]
  13. Errafik, Y.; Dhassi, Y.; Kenzi, A. A New Time-Series Classification Approach for Human Activity Recognition with Data Augmentation. Int. J. Adv. Comput. Sci. Appl. 2024, 15, 933–942. [Google Scholar] [CrossRef] [Scilit]
  14. Rashid, H.; Khan, R.; Tyagi, R.K. Machine Learning Modelling Based on Smartphone Sensor Data of Human Activity RecognitioN. I-Manag. J. Comput. Sci. 2023, 10, 4. [Google Scholar] [CrossRef] [Scilit]
  15. Nurhanim, K.; Elamvazuthi, I.; Izhar, L.I.; Ganesan, T. Classification of Human Activity Based on Smartphone Inertial Sensor Using Support Vector Machine. In Proceedings of the 2017 IEEE 3rd International Symposium in Robotics and Manufacturing Automation (ROMA), Kuala Lumpur, Malaysia, 9–21 September 2017. [Google Scholar]
  16. Ankita, J.; Kanhangad, V. Human Activity Classification in Smartphones Using Accelerometer and Gyroscope Sensors. IEEE Sens. J. 2017, 18, 1169–1177. [Google Scholar]
  17. Usman, A. Human Activity Recognition Via Smartphone Embedded Sensor Using Multi-Class. In Proceedings of the 2022 24th International Multitopic Conference (INMIC), Islamabad, Pakistan, 21–22 October 2022. [Google Scholar]
  18. Saeed, M.; Elkaseer, A.; Scholz, S.G. Human Activity Recognition Using K-Nearest Neighbor Machine Learning Algorithm. In Proceedings of the International Conference on Sustainable Design and Manufacturing, Singapore, 15 September 2021. [Google Scholar]
  19. Ignatov, A.; Strijov, V.V. Human Activity Recognition Using Quasi-Periodic Time Series Collected from a Single Tri-Axial Accelerometer. Multimed. Tools Appl. 2016, 75, 7257–7270. [Google Scholar] [CrossRef] [Scilit]
  20. Khrissi, L.; Es-Sabry, M.; Akkad, N.E.; Satori, H.; Aldosary, S.; El-Shafai, W. Sinh-Cosh Optimization-Based Efficient Clustering for Big Data Applications. IEEE Access 2024, 12, 193676–193692. [Google Scholar] [CrossRef] [Scilit]
  21. Gu, F.; Chung, M.H.; Chignell, M.; Valaee, S.; Zhou, B.; Liu, X. A Survey on Deep Learning for Human Activity Recognition. ACM Comput. Surv. 2021, 54, 1–34. [Google Scholar] [CrossRef] [Scilit]
  22. Li, Z.; Liu, F.; Yang, W.; Peng, S.; Zhou, J. A Survey of Convolutional Neural Networks: Analysis, Applications, and Prospects. IEEE Trans. Neural Netw. Learn. Syst. 2021, 33, 6999–7019. [Google Scholar] [CrossRef] [Scilit]
  23. Lee, S.M.; Yoon, S.M.; Cho, H. Human Activity Recognition from Accelerometer Data Using Convolutional Neural Network. In Proceedings of the 2017 IEEE International Conference on Big Data and Smart Computing (BigComp), Jeju, Republic of Korea, 13–16 February 2017; pp. 131–134. [Google Scholar]
  24. Yang, J.; Nguyen, M.N.; San, P.P.; Li, X.L.; Krishnaswamy, S. Deep Convolutional Neural Networks on Multichannel Time Series for Human Activity Recognition. In Proceedings of the Twenty-Fourth International Joint Conference on Artificial Intelligence (IJCAI 2015), Buenos Aires, Argentina, 25–31 July 2015; Volume 15, pp. 3995–4001. [Google Scholar]
  25. Ha, S.; Choi, S. Convolutional Neural Networks for Human Activity Recognition Using Multiple Accelerometer and Gyroscope Sensors. In Proceedings of the 2016 International Joint Conference on Neural Networks (IJCNN), Vancouver, BC, Canada, 24–29 July 2016; pp. 381–388. [Google Scholar]
  26. Zhou, B.; Yang, J.; Li, Q. Smartphone-Based Activity Recognition for Indoor Localization Using a Convolutional Neural Network. Sensors 2019, 19, 621. [Google Scholar] [CrossRef] [Scilit]
  27. Singh, D.; Merdivan, E.; Psychoula, I.; Kropf, J.; Hanke, S.; Geist, M.; Holzinger, A. Human Activity Recognition Using Recurrent Neural Networks. In Proceedings of the Machine Learning and Knowledge Extraction (CD-MAKE 2017), Reggio, Italy, 29 August–1 September 2017; Volume 10410, pp. 1–8. [Google Scholar]
  28. Wilhelm, P.S.; Malekian, R. Human Activity Recognition Using LSTM-RNN Deep Neural Network Architecture. In Proceedings of the 2019 IEEE 2nd Wireless Africa Conference (WAC), Pretoria, South Africa, 18–20 August 2019. [Google Scholar]
  29. Abdulmajid, M.; Pyun, J.-Y. Deep Recurrent Neural Networks for Human Activity Recognition. Sensors 2017, 17, 2556. [Google Scholar] [CrossRef] [Scilit]
  30. Yee, J.; Lee, C.P.; Lim, K.M. Wearable Sensor-Based Human Activity Recognition with Hybrid Deep Learning Model. Informatics 2022, 9, 56. [Google Scholar] [CrossRef] [Scilit]
  31. Ronald, M.; Han, D.S. A CNN-LSTM Approach to Human Activity Recognition. In Proceedings of the 2020 International Conference on Artificial Intelligence in Information and Communication (ICAIIC), Fukuoka, Japan, 19–21 February 2020. [Google Scholar]
  32. Enes, K.; Barshan, B. A New CNN-LSTM Architecture for Activity Recognition Employing Wearable Motion Sensor Data: Enabling Diverse Feature Extraction. Eng. Appl. Artif. Intell. 2023, 124, 106529. [Google Scholar]
  33. Shaik, J.; Syed, H. A DCNN-LSTM Based Human Activity Recognition by Mobile and Wearable Sensor Networks. Alex. Eng. J. 2023, 80, 542–552. [Google Scholar]
  34. Ordóñez, F.J.; Roggen, D. Deep Convolutional and LSTM Recurrent Neural Networks for Multimodal Wearable Activity Recognition. Sensors 2016, 16, 115. [Google Scholar] [CrossRef] [Scilit] [PubMed]
  35. Iwana, B.K.; Uchida, S. An Empirical Survey of Data Augmentation for Time Series Classification with Neural Networks. PLoS ONE 2021, 16, e0254841. [Google Scholar] [CrossRef] [Scilit]
  36. Rashid, K.M.; Louis, J. Window-Warping: A Time Series Data Augmentation of IMU Data for Construction Equipment Activity Identification. In Proceedings of the International Symposium on Automation and Robotics in Construction, Banff, BA, Canada, 21–24 May 2019; Volume 36, pp. 651–657. [Google Scholar]
  37. Errafik, Y.; Kenzi, A.; Dhassi, Y. Proposed Hybrid Model Recurrent Neural Network for Human Activity Recognition. Lect. Notes Netw. Syst. 2023, 668, 73–83. [Google Scholar]
  38. Logacjov, A.; Bach, K.; Kongsvold, A.; Bårdstu, H.B.; Mork, P.J. HARTH: A Human Activity Recognition Dataset for Machine Learning. Sensors 2021, 21, 7853. [Google Scholar] [CrossRef] [Scilit]
  39. Ustad, A.; Logacjov, A.; Trollebø, S.Ø.; Thingstad, P.; Vereijken, B.; Bach, K.; Maroni, N.S. Validation of an Activity Type Recognition Model Classifying Daily Physical Behavior in Older Adults: The HAR70 + Model. Sensors 2023, 23, 2368. [Google Scholar] [CrossRef] [Scilit]
Disclaimer/Publisher’s Note: The statements, opinions and data contained in all publications are solely those of the individual author(s) and contributor(s) and not of MDPI and/or the editor(s). MDPI and/or the editor(s) disclaim responsibility for any injury to people or property resulting from any ideas, methods, instructions or products referred to in the content.

Article Metrics

Citations

Article Access Statistics

Multiple requests from the same IP address are counted as one view.